Compare your deck to Zoom

Compare Your Deck

Zoom Pitch Deck (2014)

SaaS
Stage: Series B
Raised: $30M
Year: 2014
Slides: 11
Outcome: IPO at $16B valuation

Pitch Deck

1 / 11
Zoom pitch deck - Establishing the Problem: Retail Overload and Physical Context
Click to expand

Deck Analysis

This deck presents "Zoom," an interactive mobile shopping product aimed at active, sports-oriented consumers. The slides blend physical retail context, a clear brand identity, and mobile UX mockups with market sizing, revenue partners, and competitive landscape. It is notable for marrying a tangible retail problem (overwhelming product choice in big-box stores) with a simple mobile interaction model and early go-to-market partnerships — a focused narrative that likely helped secure Series B funding and accelerate product-market fit.

Establishing the Problem: Retail Overload and Physical Context

Establishing the Problem: Retail Overload and Physical Context

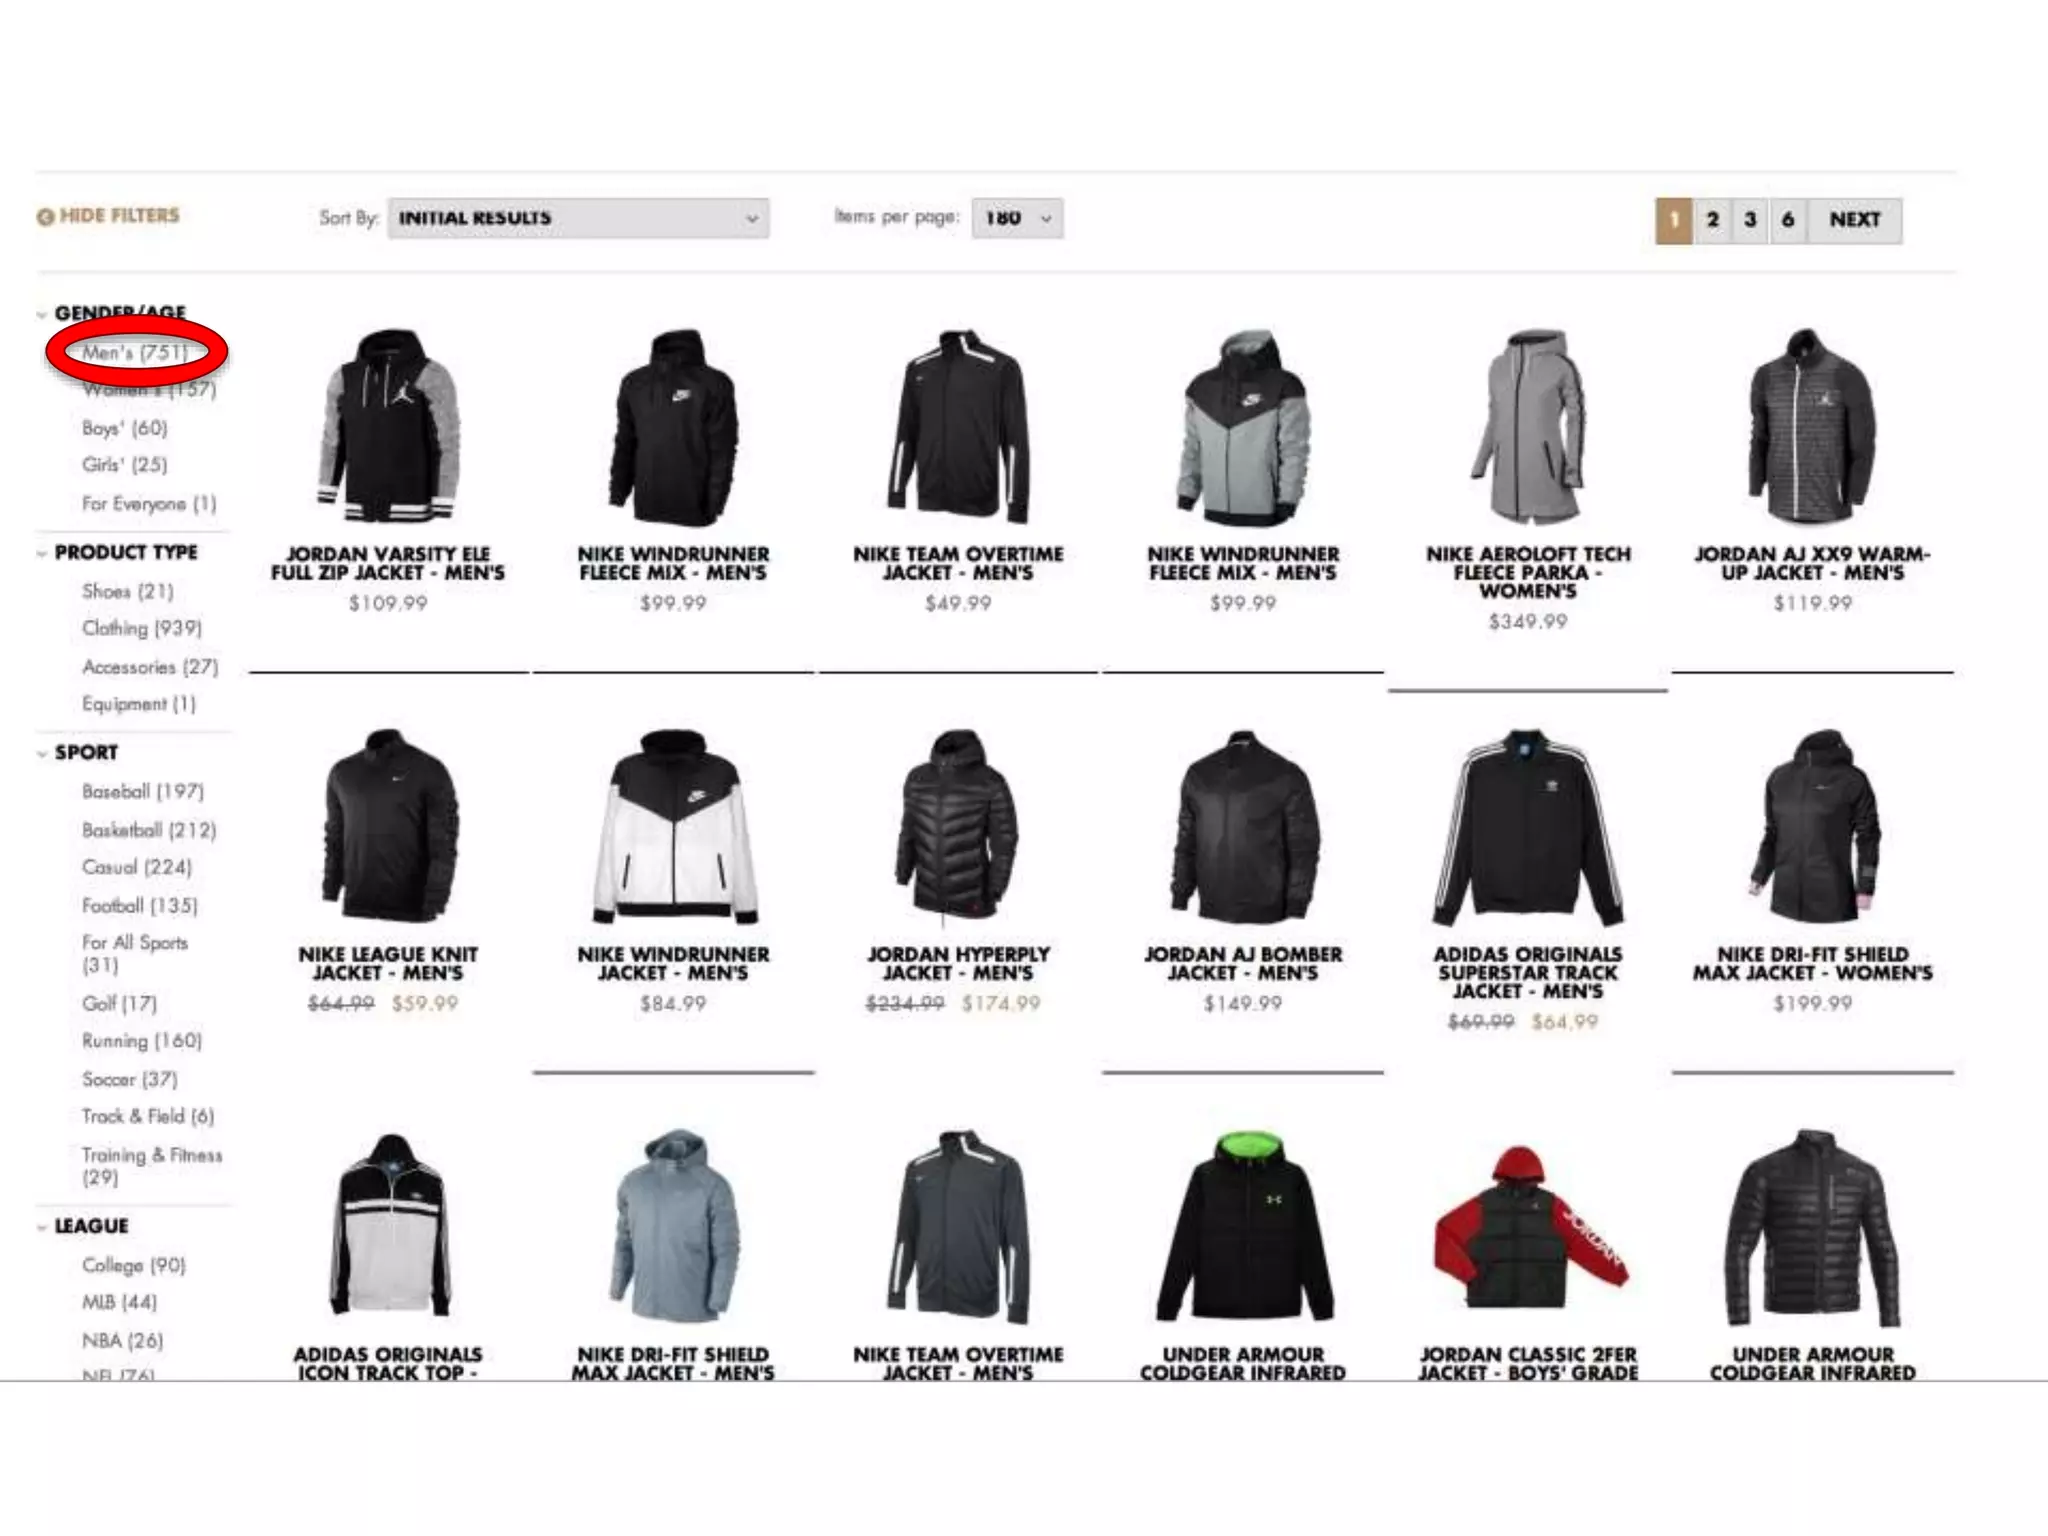
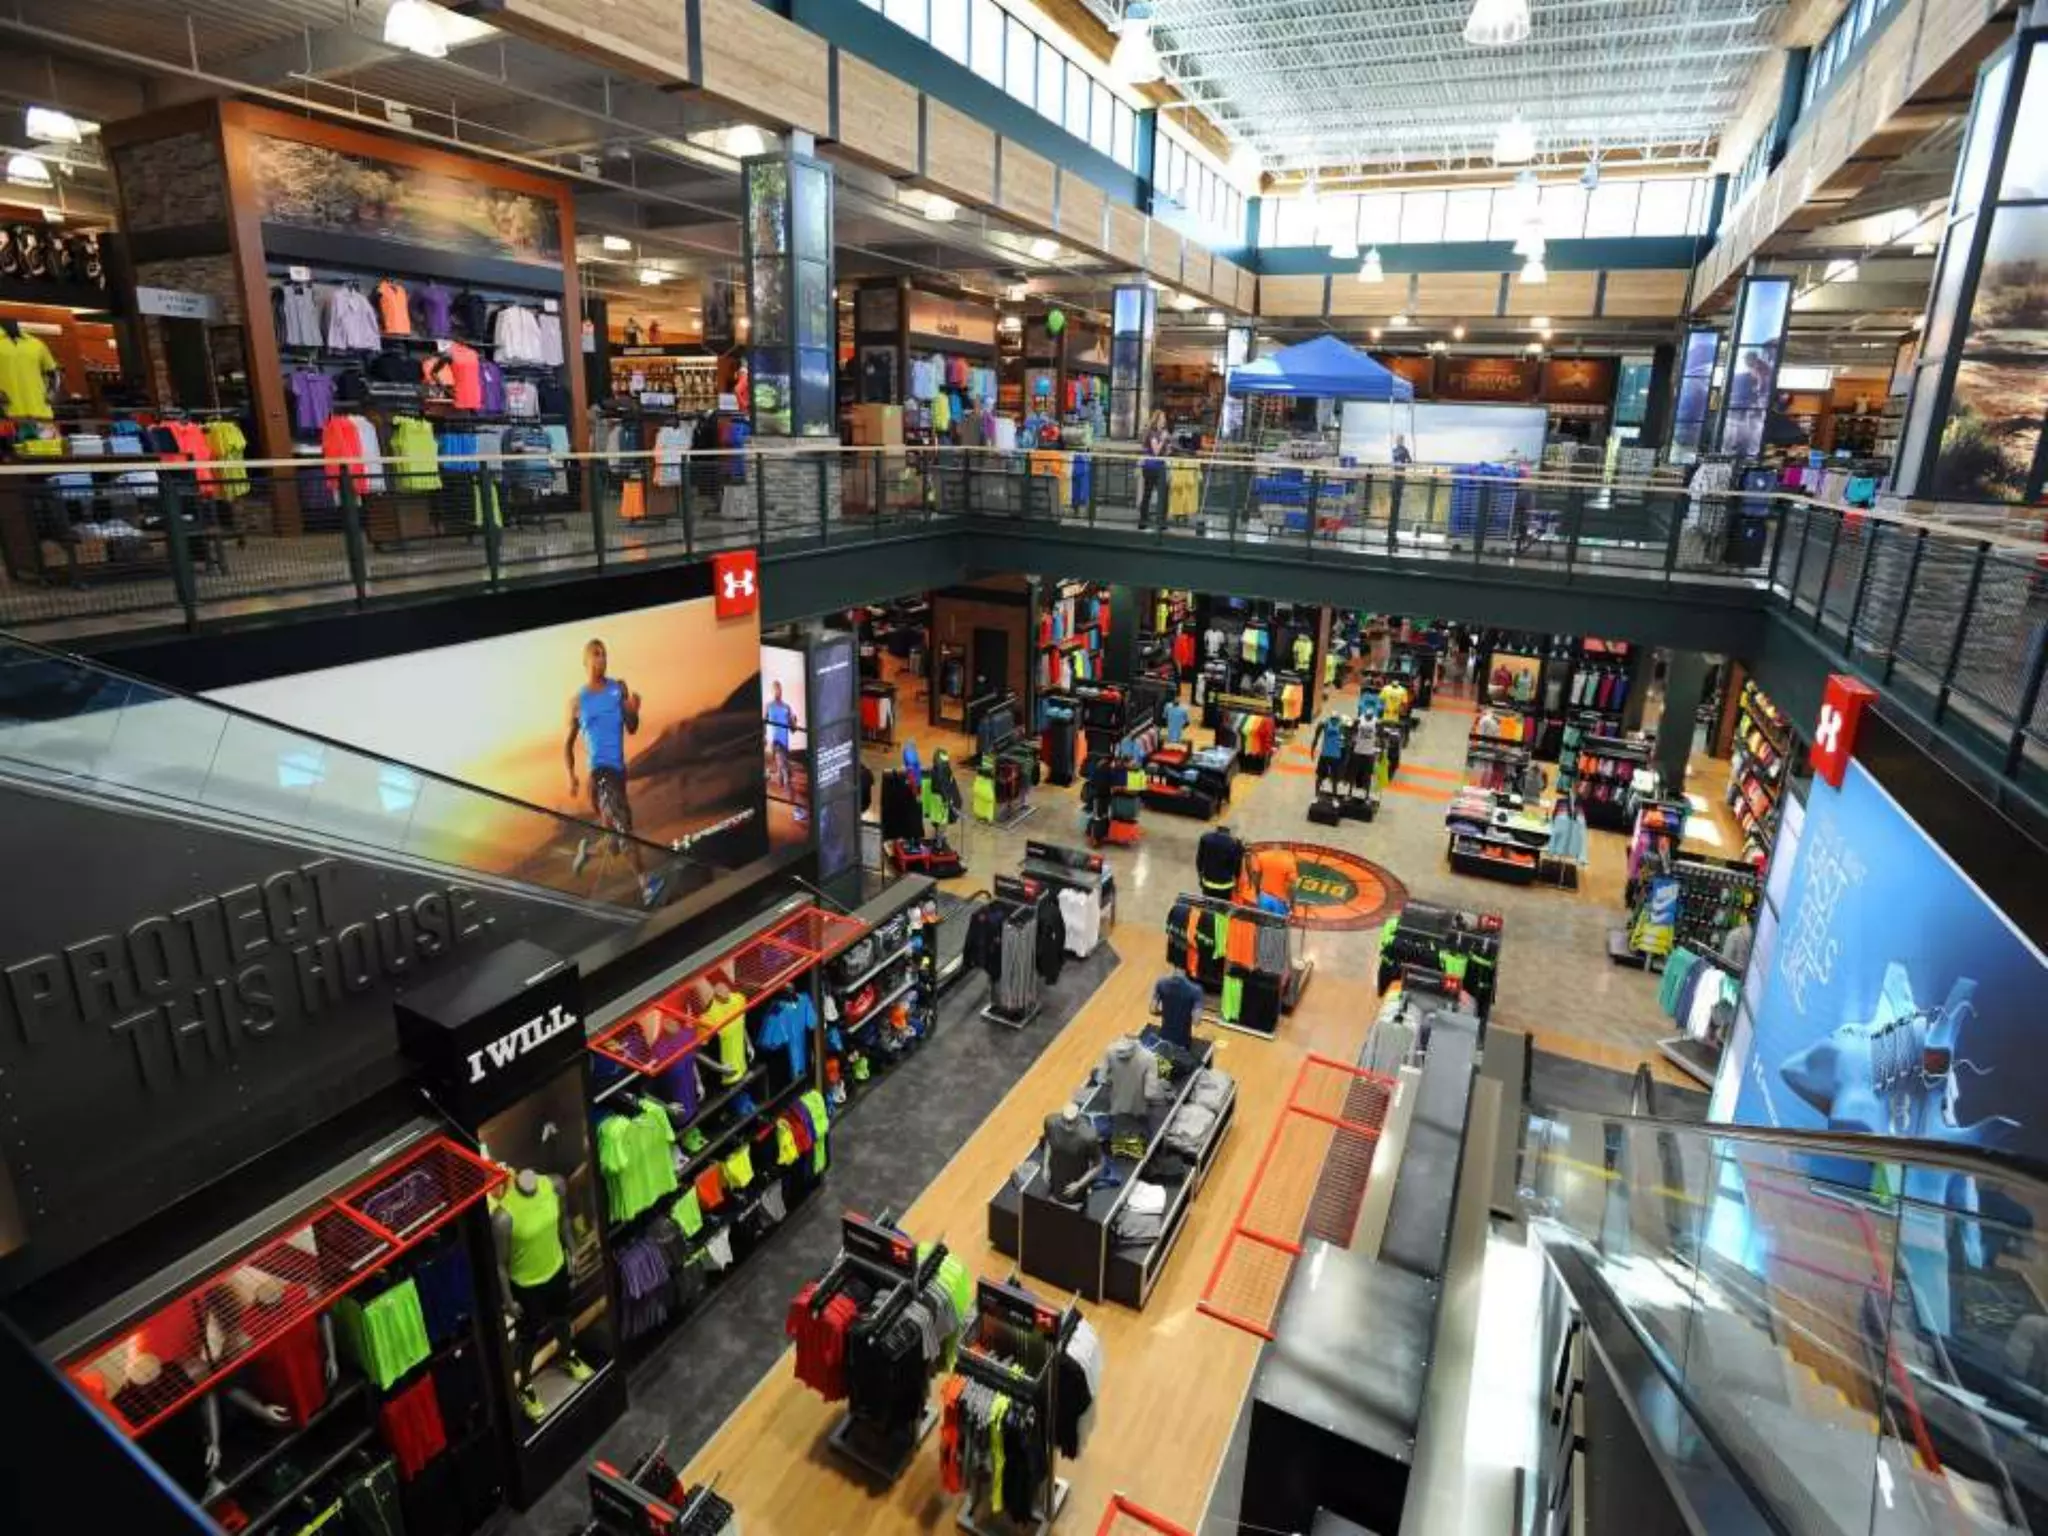
Slide 1 (store interior) visually anchors the deck in a real-world problem: large, multi-brand sporting goods stores are crowded with inventory and options. Using a single panoramic photo of a big-box sporting retail environment communicates at a glance the friction Zoom intends to address — discovery and decision-making in physical retail. This is an effective opening because it requires no text to communicate the pain point; viewers instantly understand the customer's context.

Founders can learn how powerful context-setting images can be. Rather than launching immediately into numbers or product screenshots, the deck shows where the customer is and what they experience. This approach builds empathy and makes subsequent product slides feel like a natural solution rather than a disconnected demo.
Key Takeaway: Lead with a clear, relatable depiction of the customer's environment to make the problem immediately intuitive and emotionally resonant.
Brand Clarity: Simple Logo and Tagline

Brand Clarity: Simple Logo and Tagline

Slide 3 shows the Zoom logo and the tagline ‘Interactive shopping for active people,’ communicating brand and value proposition in one frame. The visual simplicity and the emphasis on the word "active" position the product for a defined demographic (fitness/sports shoppers). This clarity helps investors and partners quickly categorize the company and its focus.

For founders, keeping brand and tagline concise is instructive: a tight brand promise reduces ambiguity. This slide effectively primes the audience for the follow-on product screens and market slides, making the narrative cohesive and anchored to a distinct target user.

Key Takeaway: Use a single-slide brand statement to crystallize your target customer and core promise before diving into features or metrics.
Product Demo: Mobile-first Browsing and Simple Actions

Product Demo: Mobile-first Browsing and Simple Actions

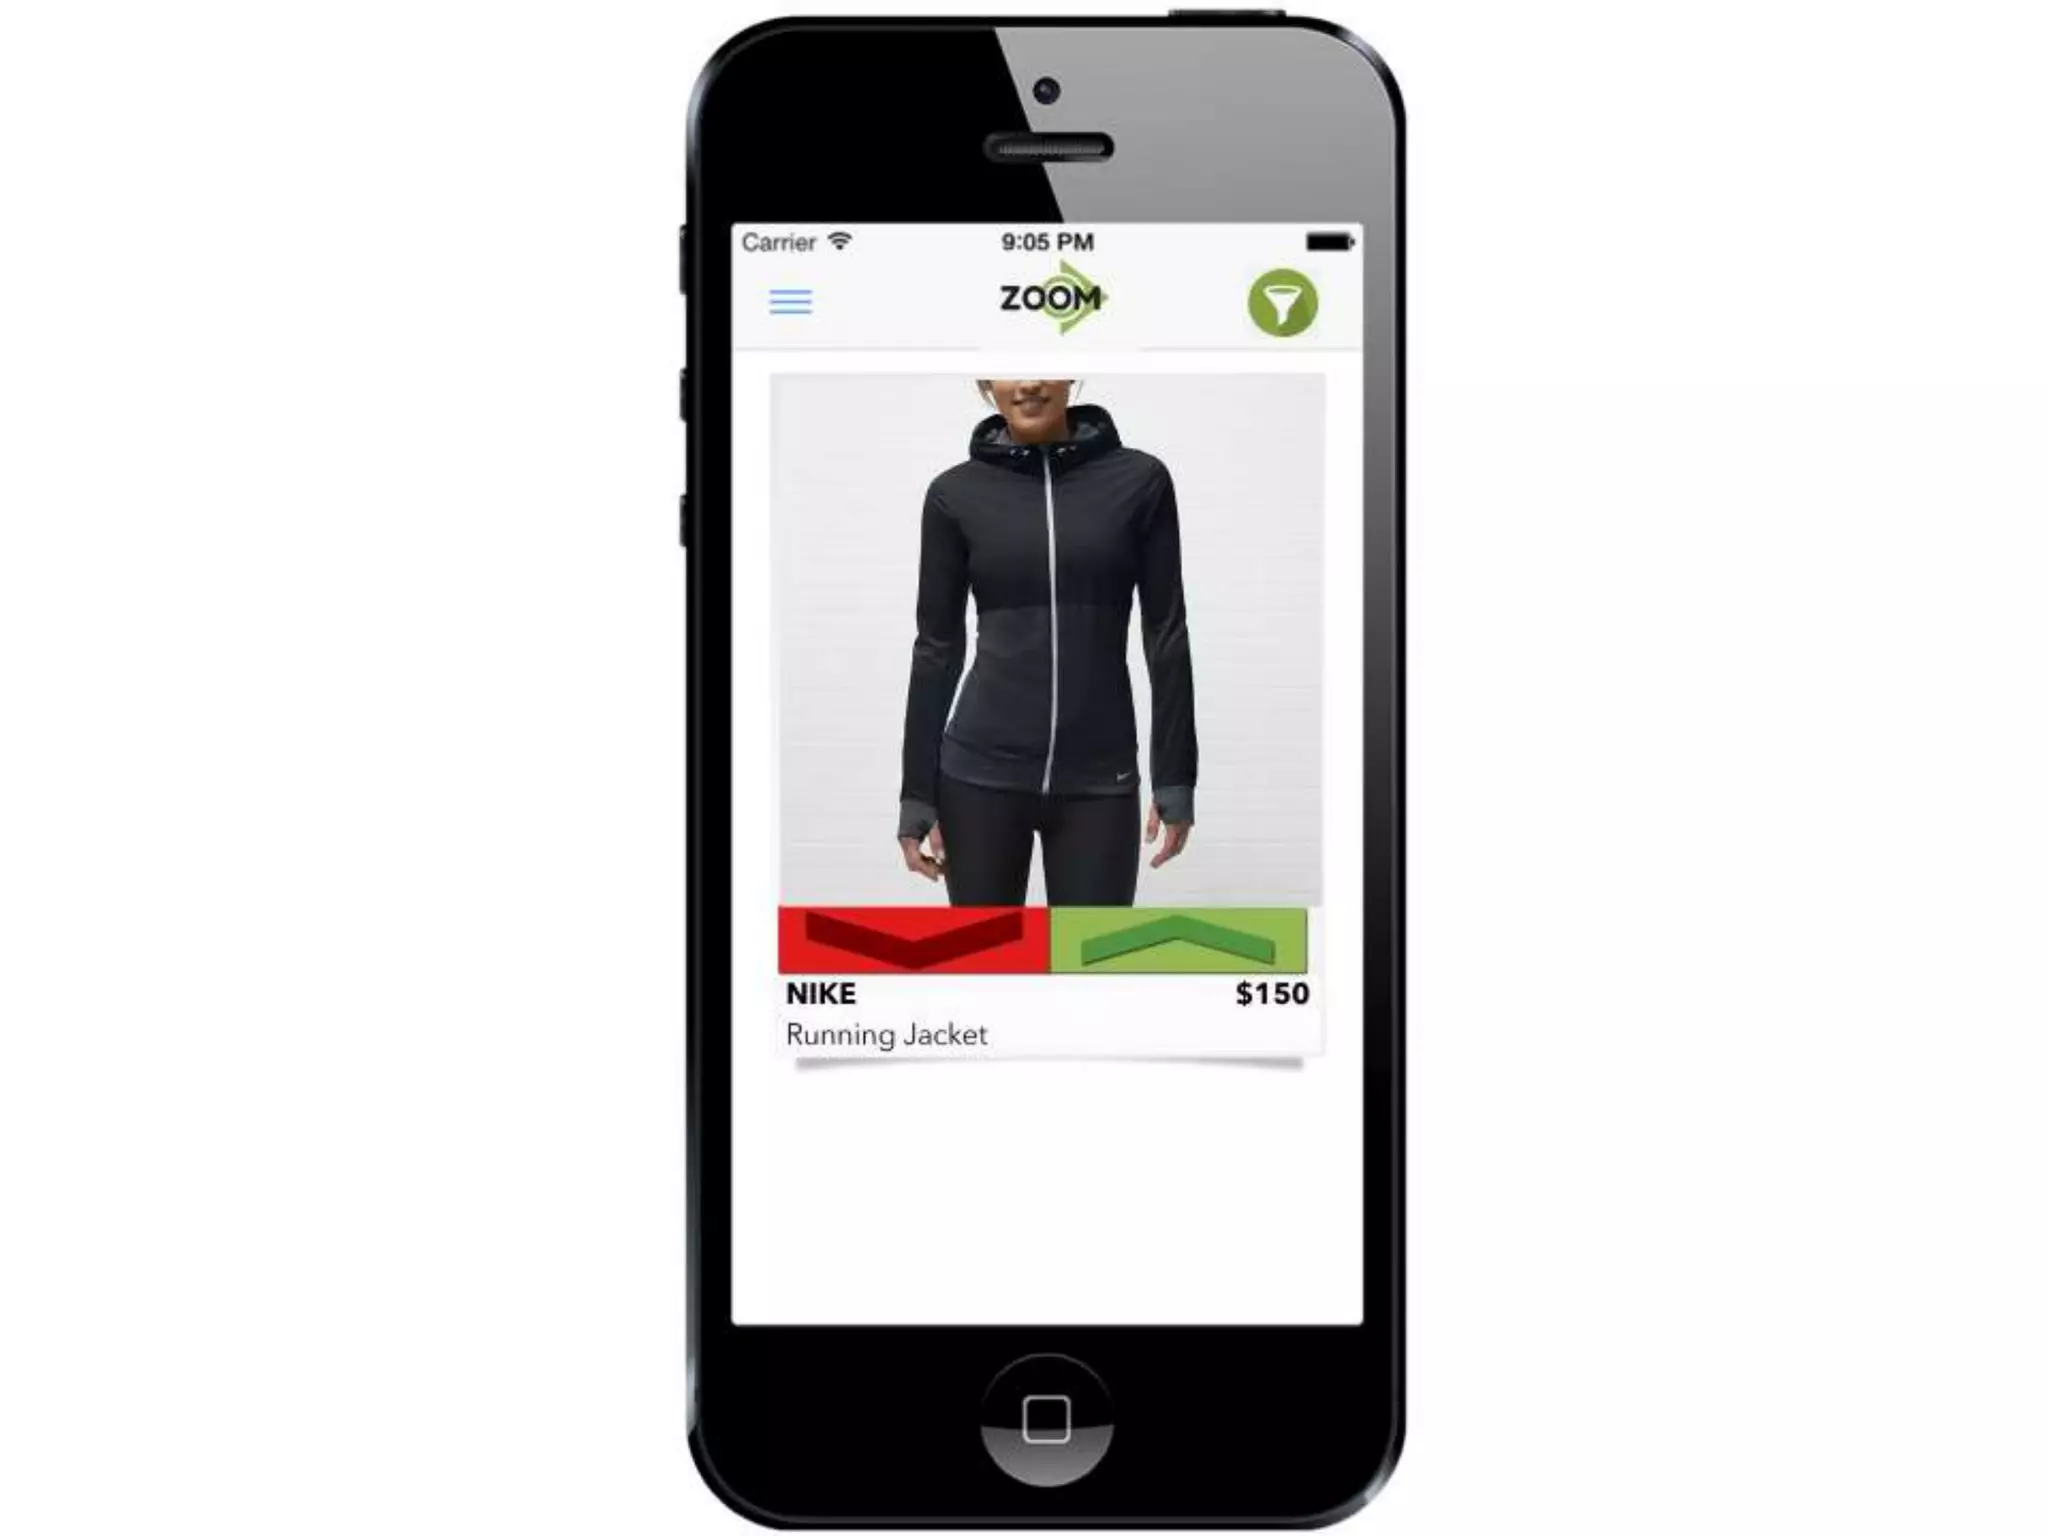
Slide 4 presents a product mockup showing a large product image, brand, price and two bold actions (red/green swipe affordances). The design suggests rapid decision-making (like/dislike) and prioritizes visual product discovery — appropriate for shoppers scanning apparel. The mockup communicates both the interaction model and the emotional experience (fast, confident choices) without a long textual explanation.

This slide is a good example of showing rather than telling. Founders should surface the core micro-interaction that defines product value (in this case, quick visual preference signals) early. It also demonstrates how a single-screen mockup can communicate business intent (curation + conversion) more quickly than a feature list.

Key Takeaway: Highlight the core micro-interaction in a clean mockup to make product value obvious and memorable.
Personalization & Retention: Profiles and Preferences

Personalization & Retention: Profiles and Preferences

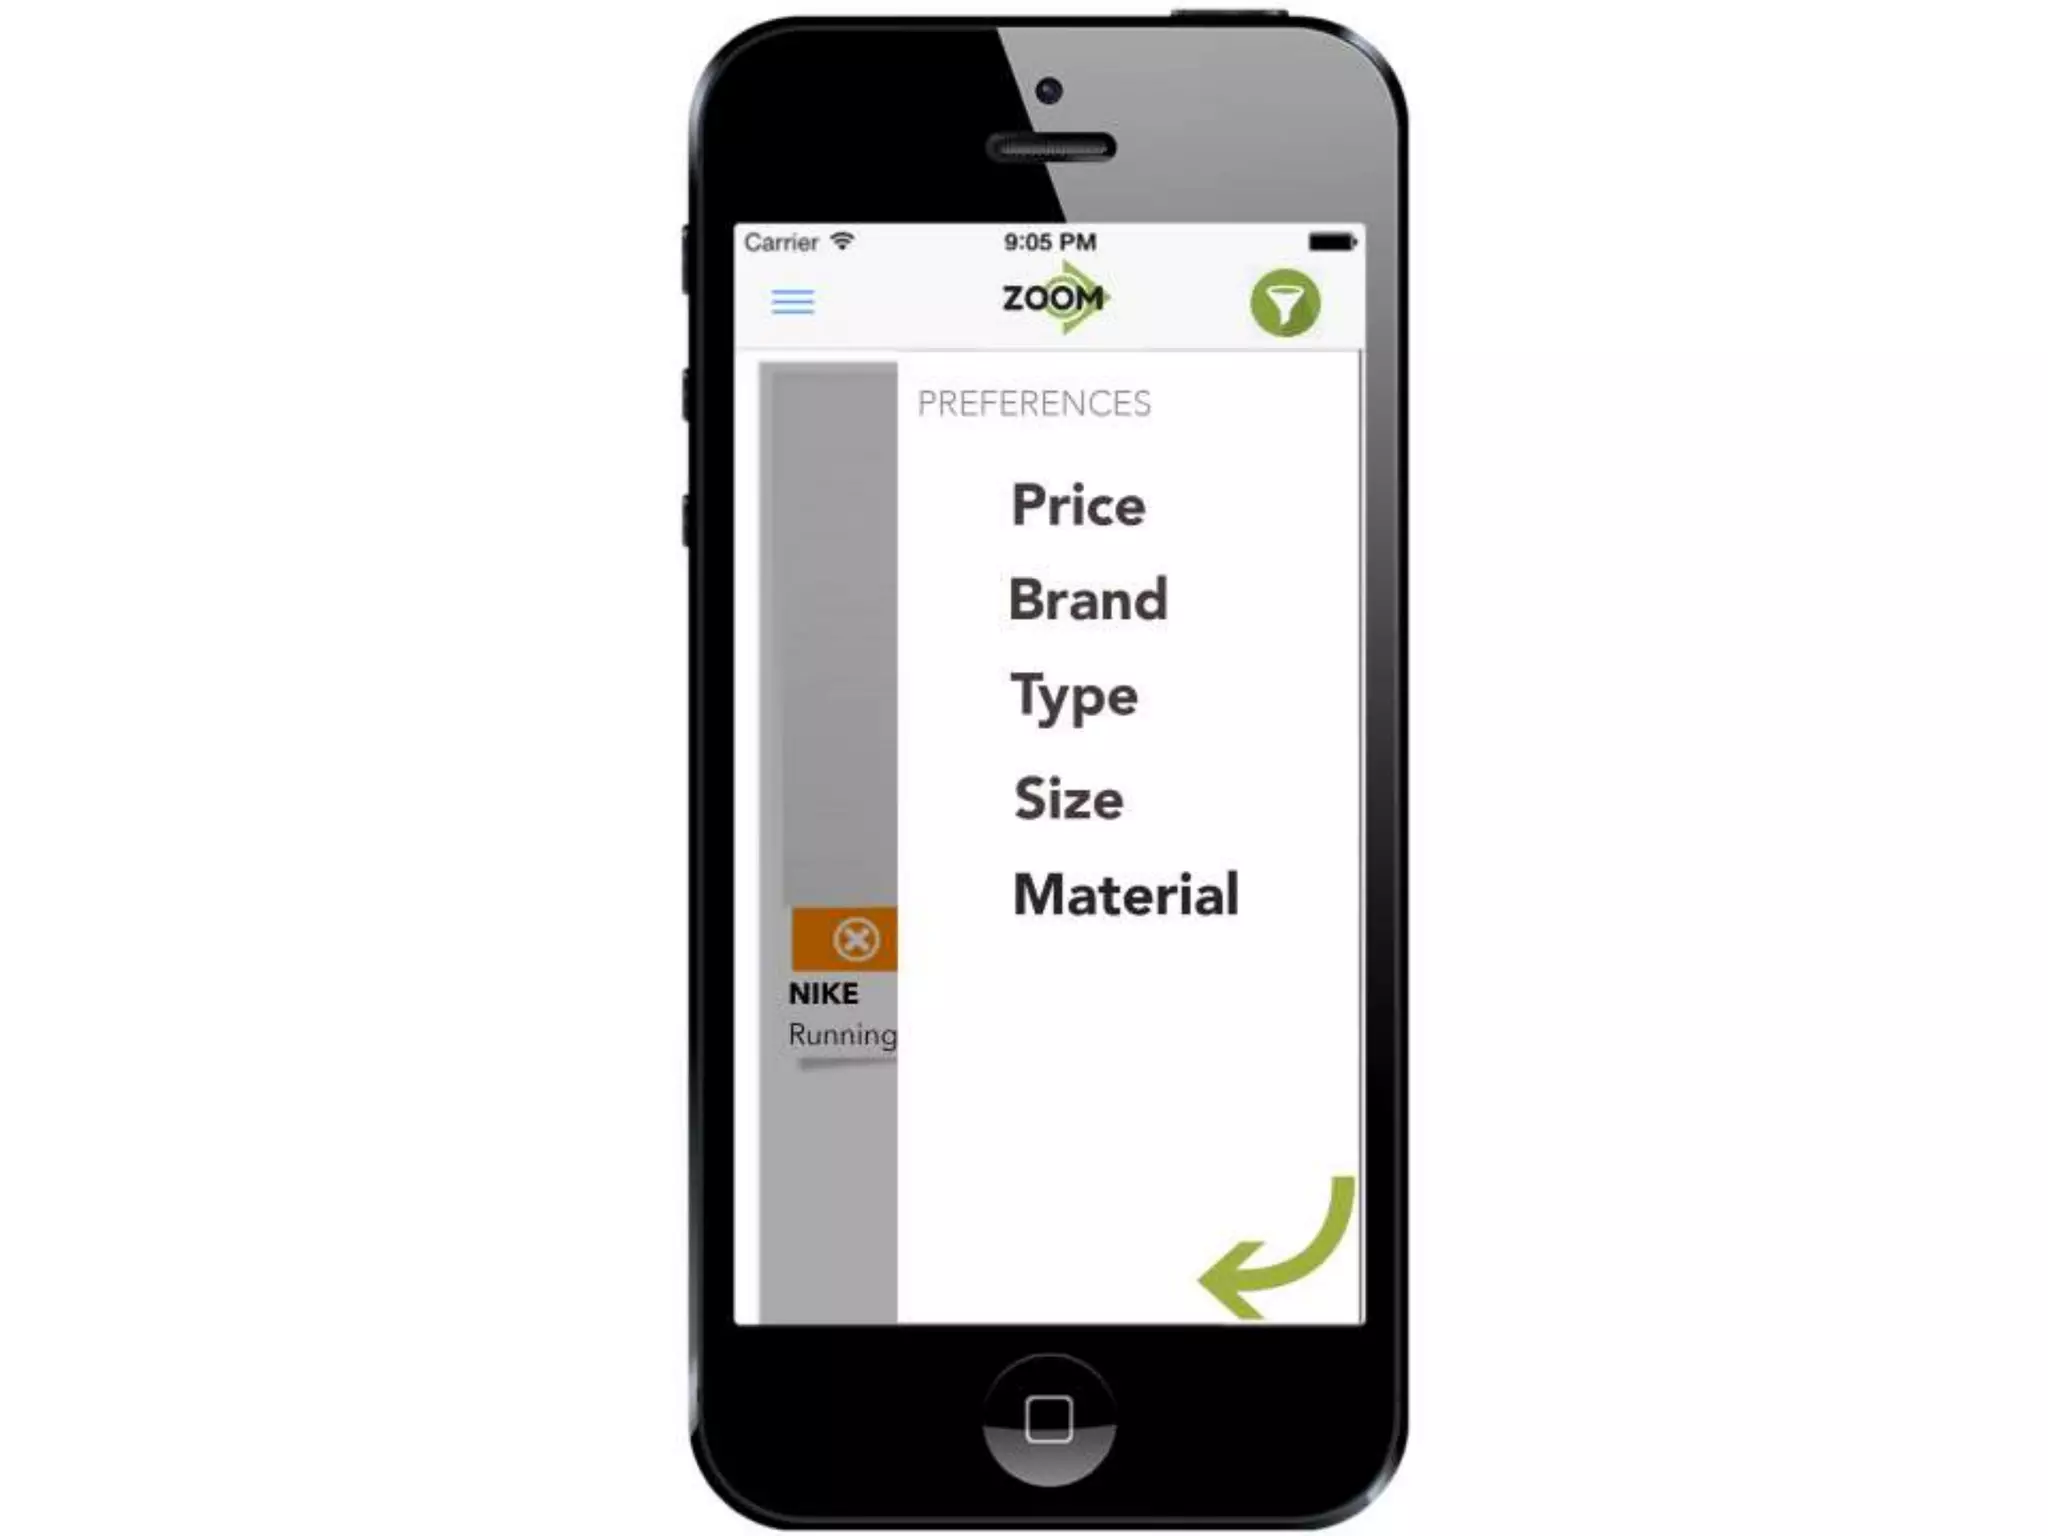
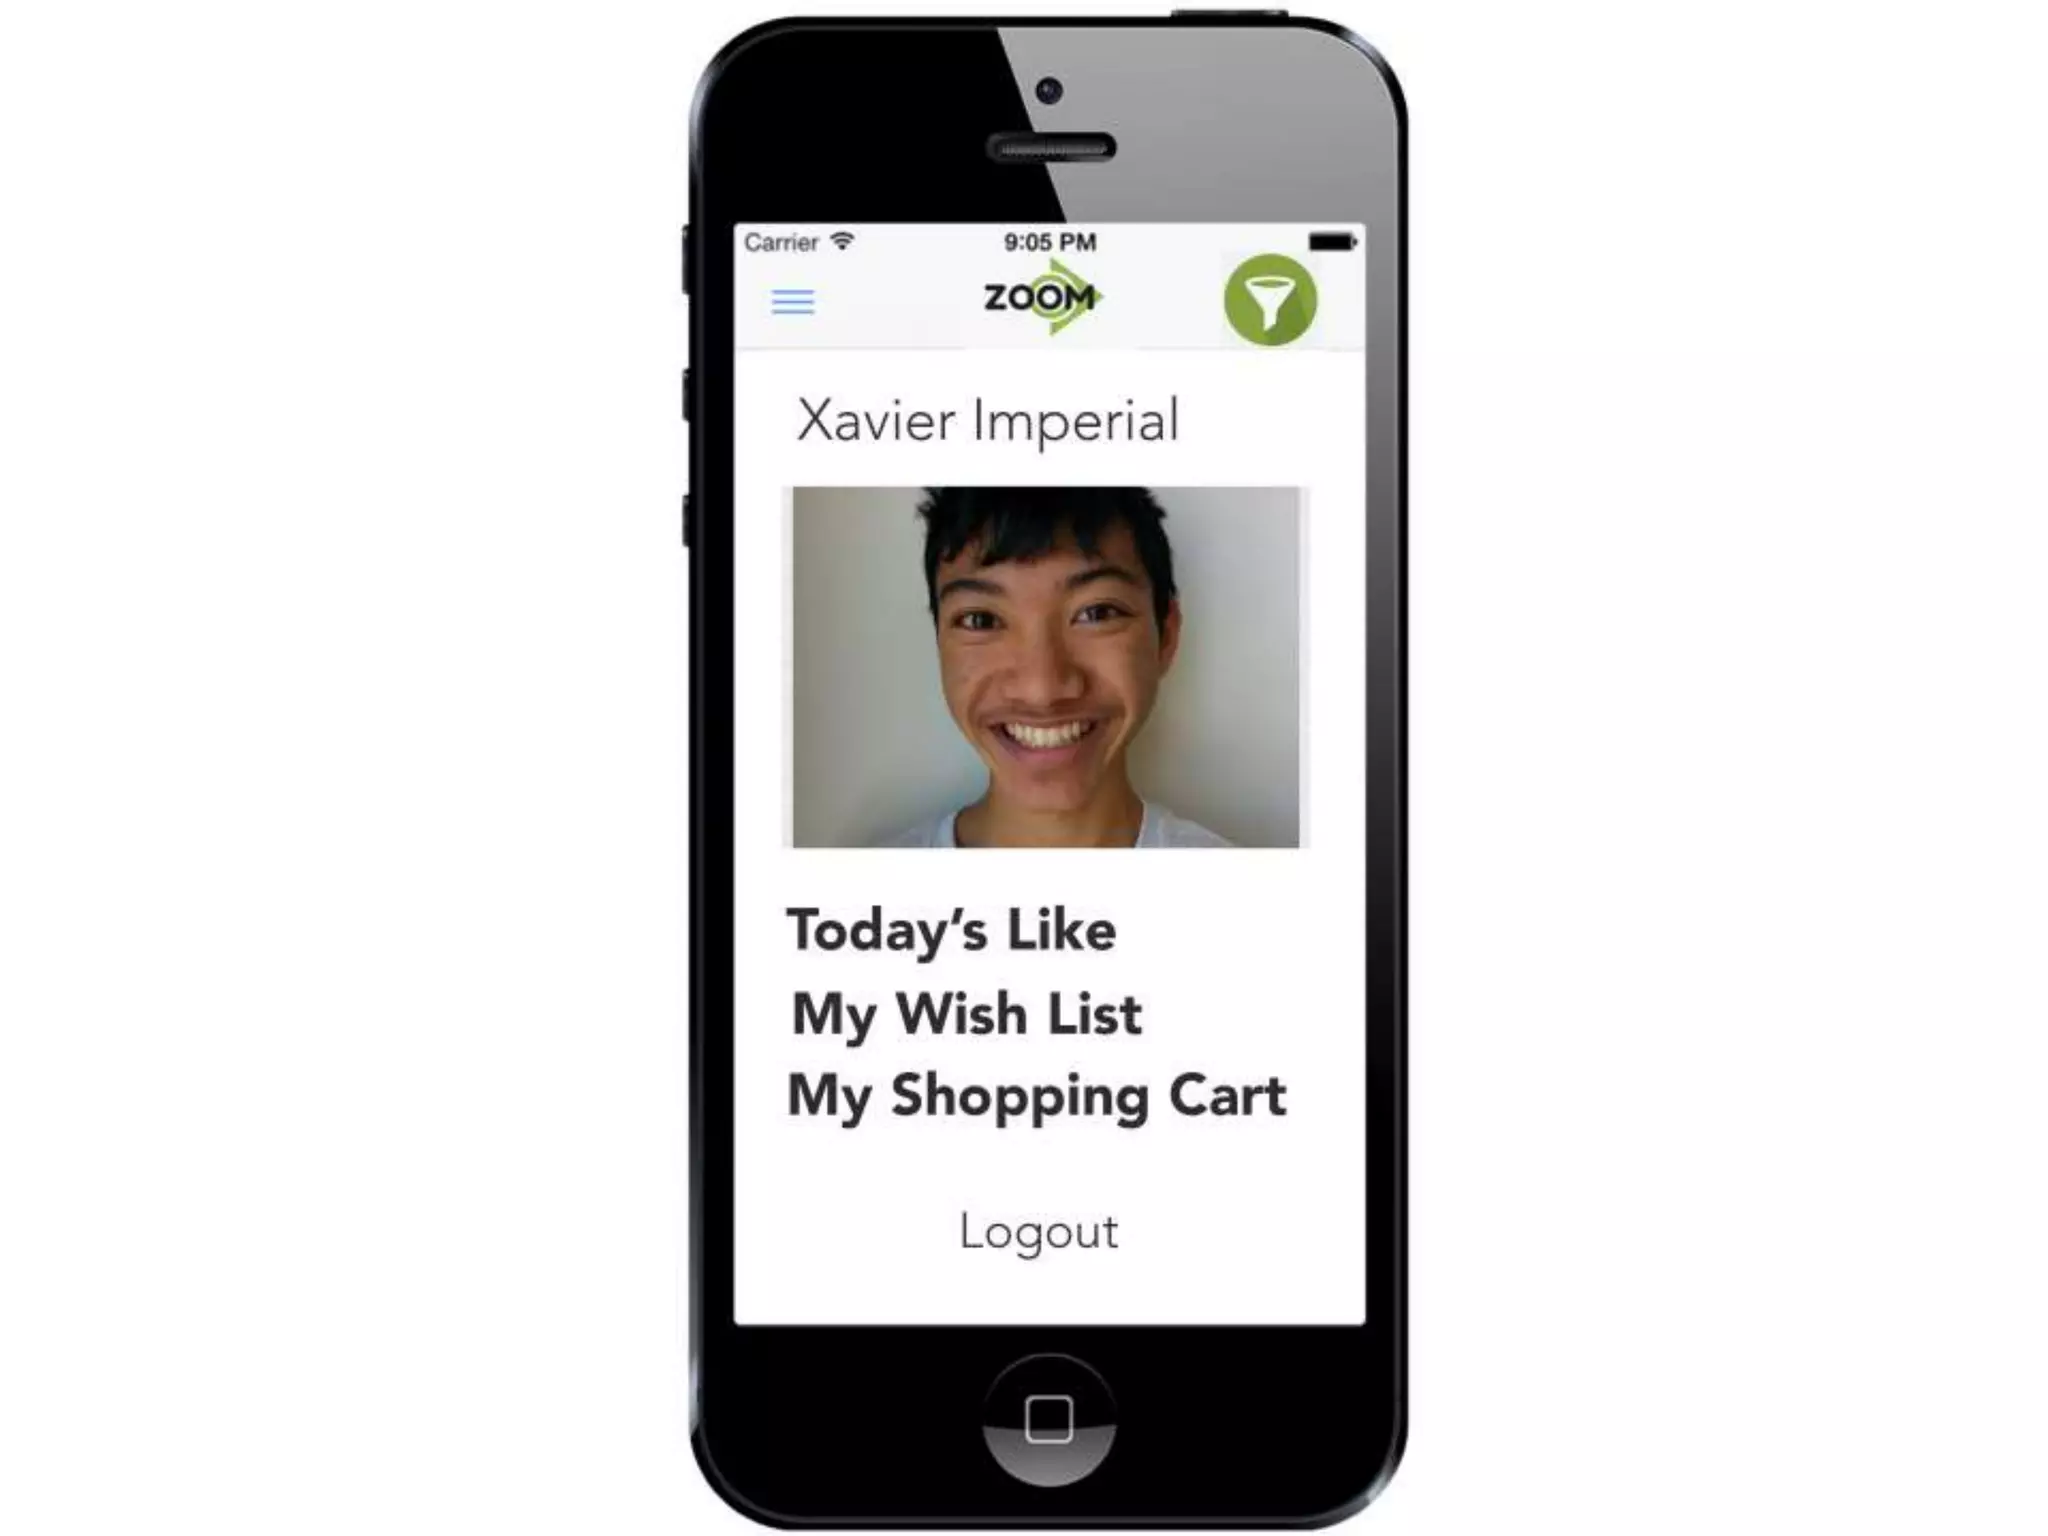
Slides 5 and 6 (profile and preferences screens) show user identity, saved lists, and a filter-driven preferences pane (price, brand, type, size, material). These screens articulate the product's ability to personalize discovery and re-engage users via saved preferences and lists. By including both social/personal elements (profile image, name) and structured preferences, the deck signals a roadmap toward retention and data-driven recommendations.

Founders can take away how to present personalization as both a UX benefit and a business lever. These screens imply data capture (preferences + behavior) that could power improved matching and higher lifetime value. In investor conversations, pairing UX mockups with the implied data flow helps justify assumptions about retention and monetization.

Key Takeaway: Show how identity and structured preferences power personalization — this ties UX to retention and future data-driven monetization.
Go-to-Market & Monetization: Brand Partnerships

Go-to-Market & Monetization: Brand Partnerships

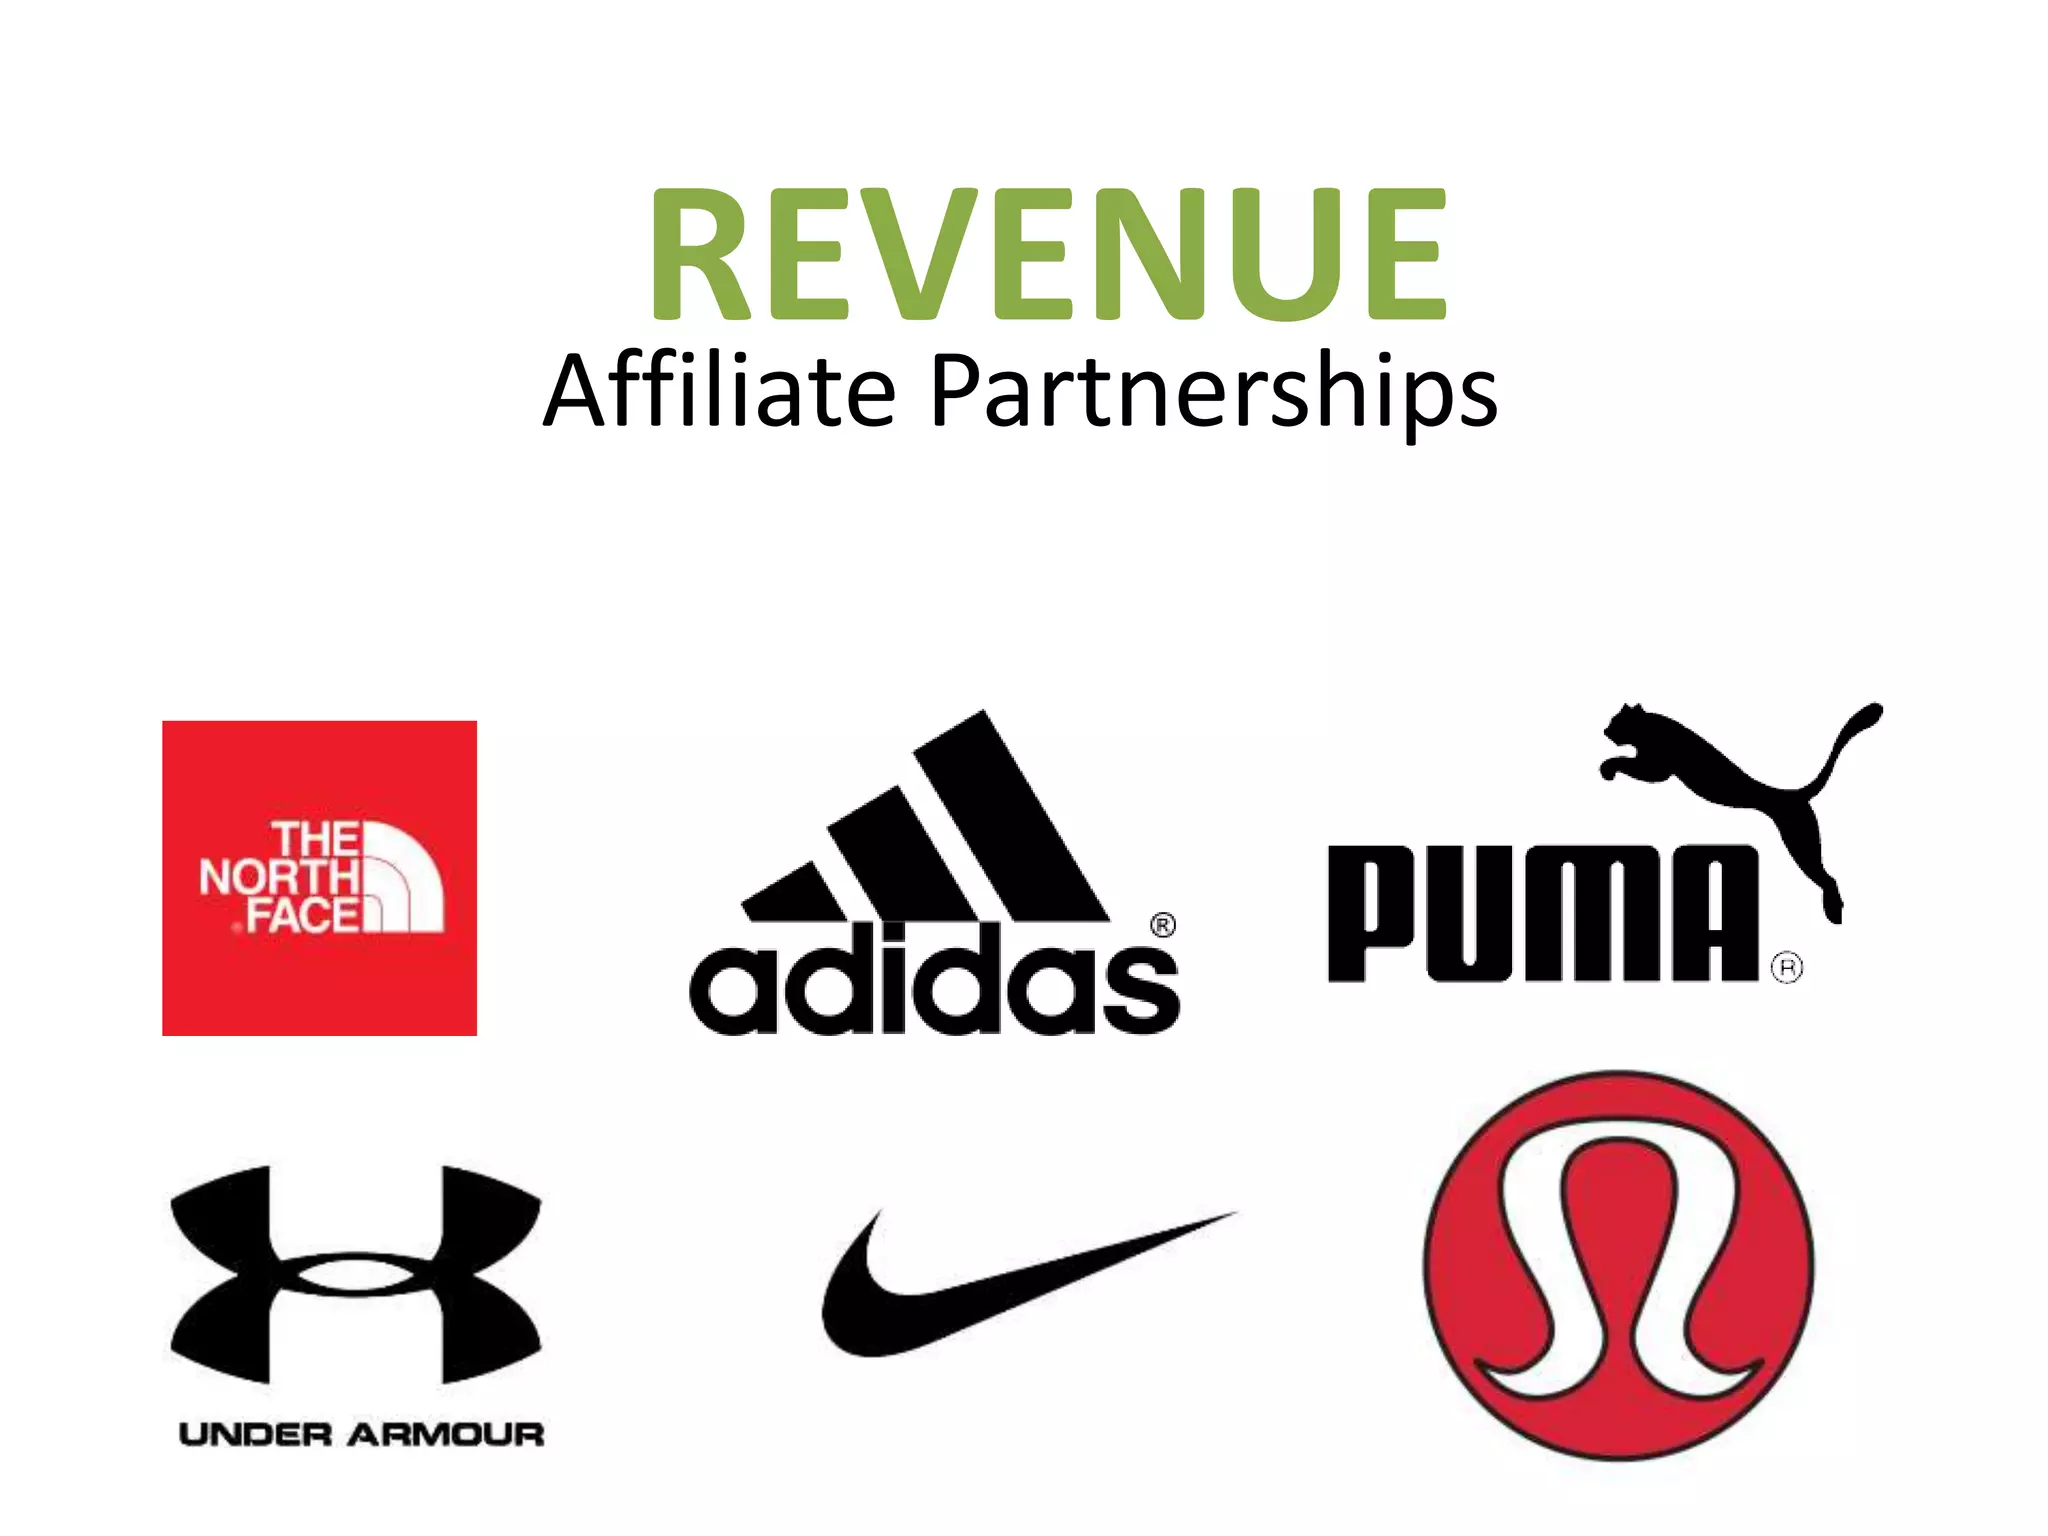
Slide 7 lists major apparel brands (The North Face, Adidas, Puma, Under Armour, Nike, Lululemon) under a 'Revenue: Affiliate Partnerships' heading. This communicates a pragmatic early revenue model: affiliate/referral fees through brand partnerships. By presenting recognizable partners, the deck signals the potential to monetize discovery without heavy inventory or logistical burden, which is attractive to investors because it shortens the path to revenue.

Founders should note how credibility is borrowed from established partners. If you can show logos of target partners or signed letters-of-intent, it reduces perceived execution risk. Also, explicitly tying UX (discovery and preference data) to a clear monetization channel (affiliate commissions, brand promotions) helps close the loop for investors on how usage becomes revenue.

Key Takeaway: Tie your UX to a simple, believable revenue mechanism and use partner logos to reduce perceived market risk.
Market Size & Growth Signals

Market Size & Growth Signals

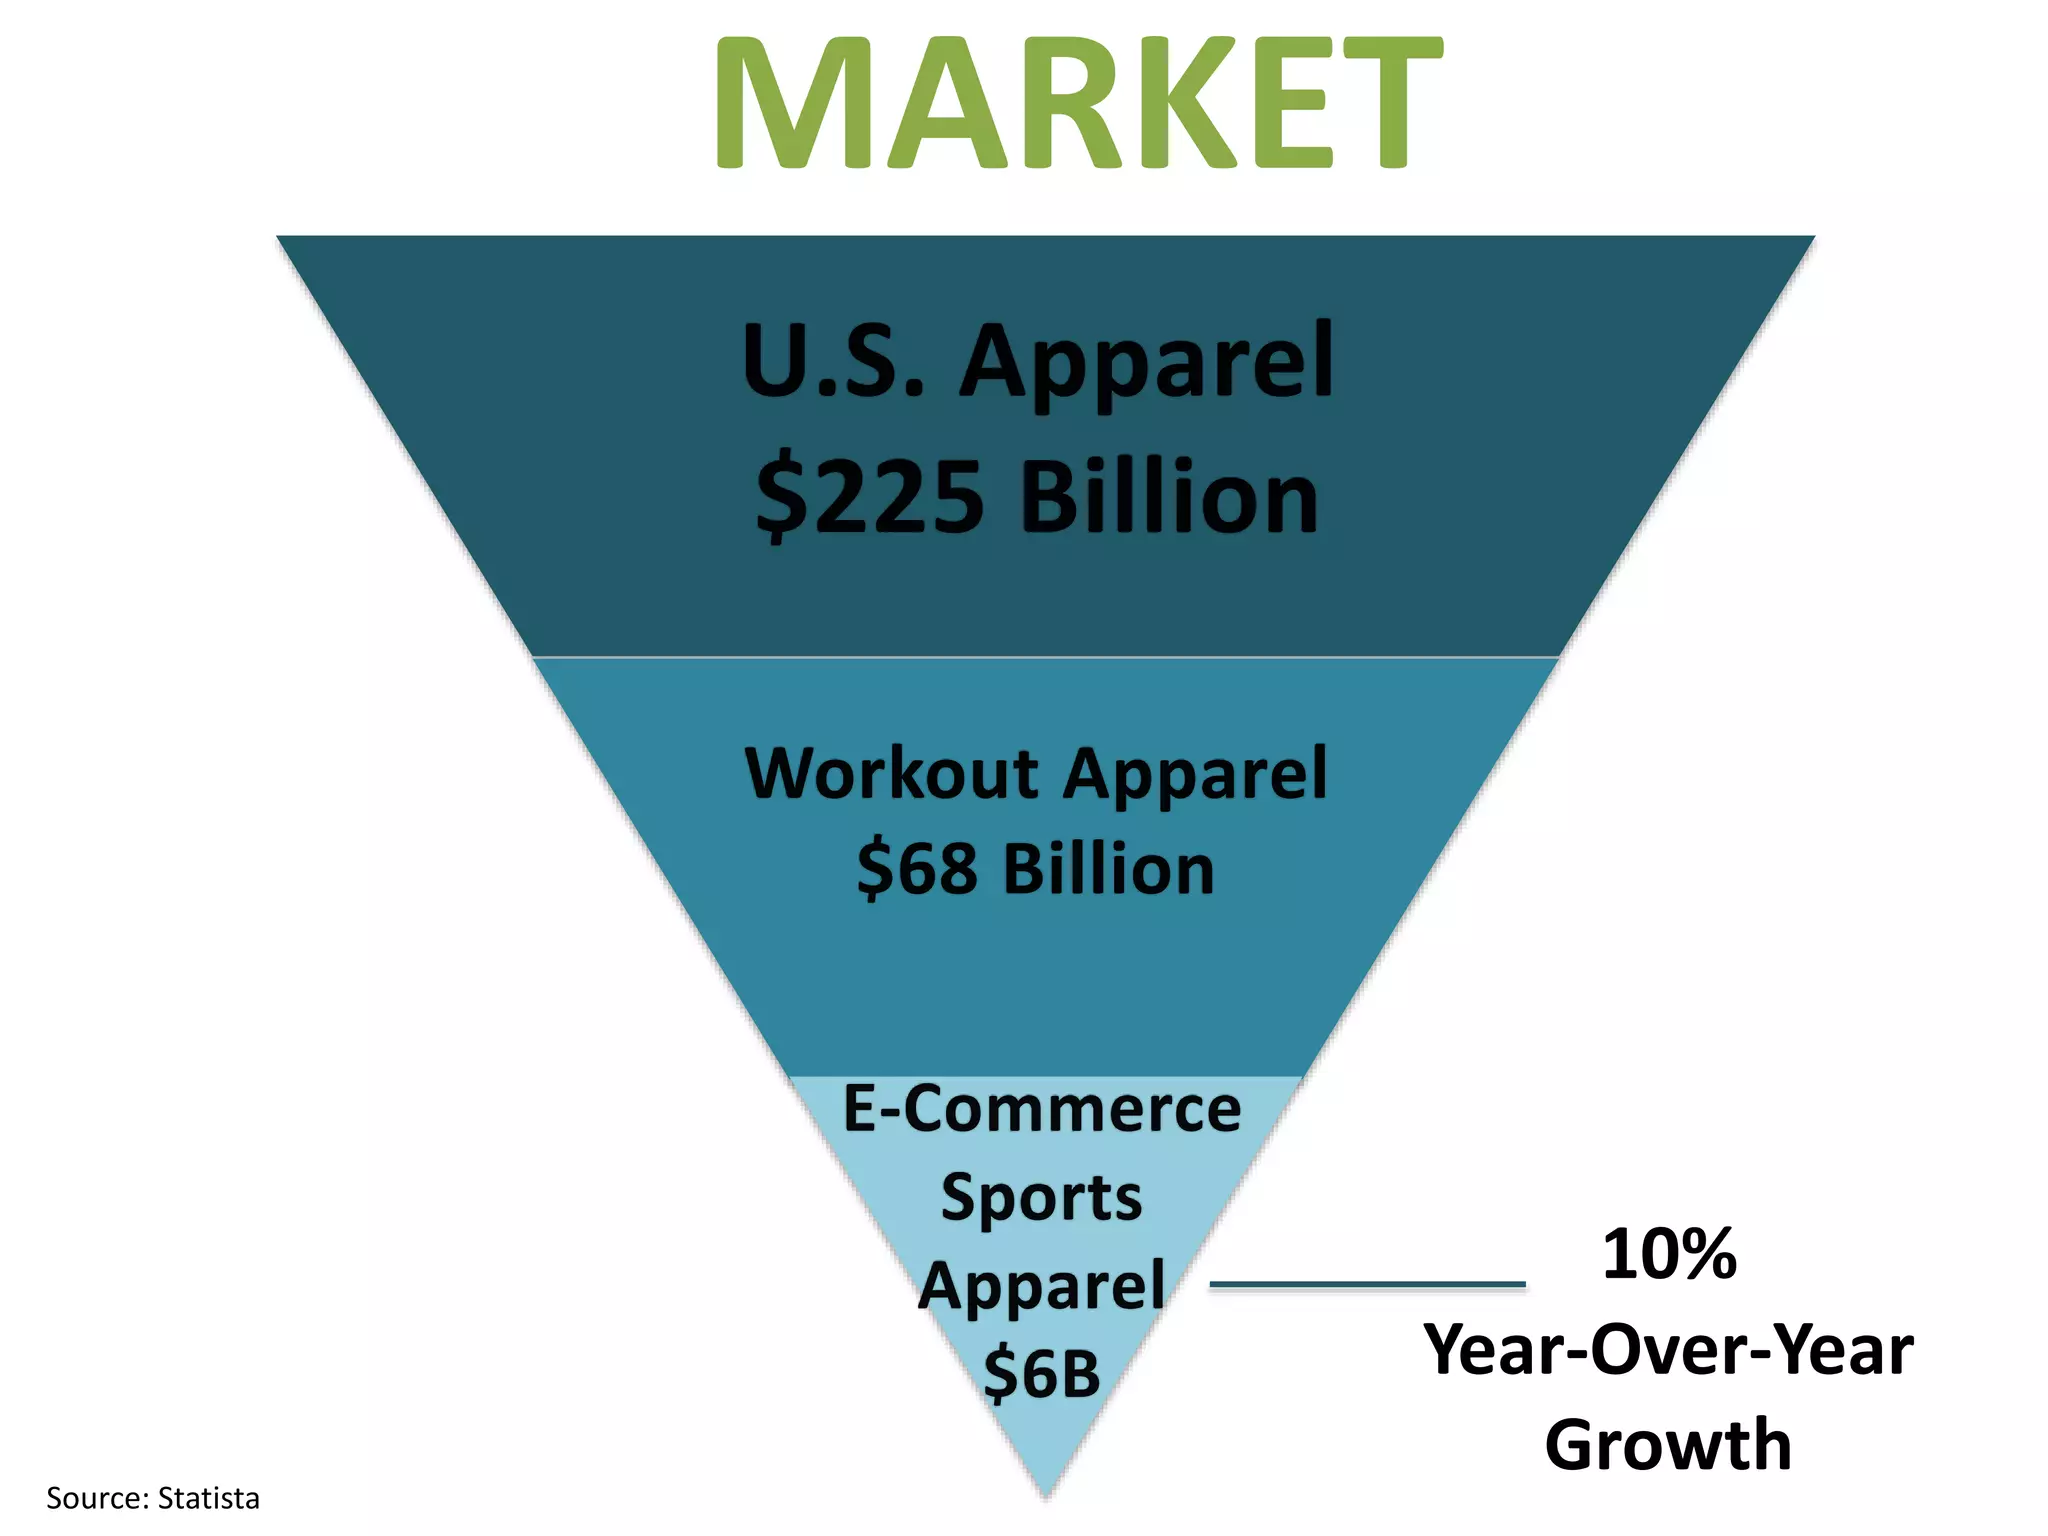
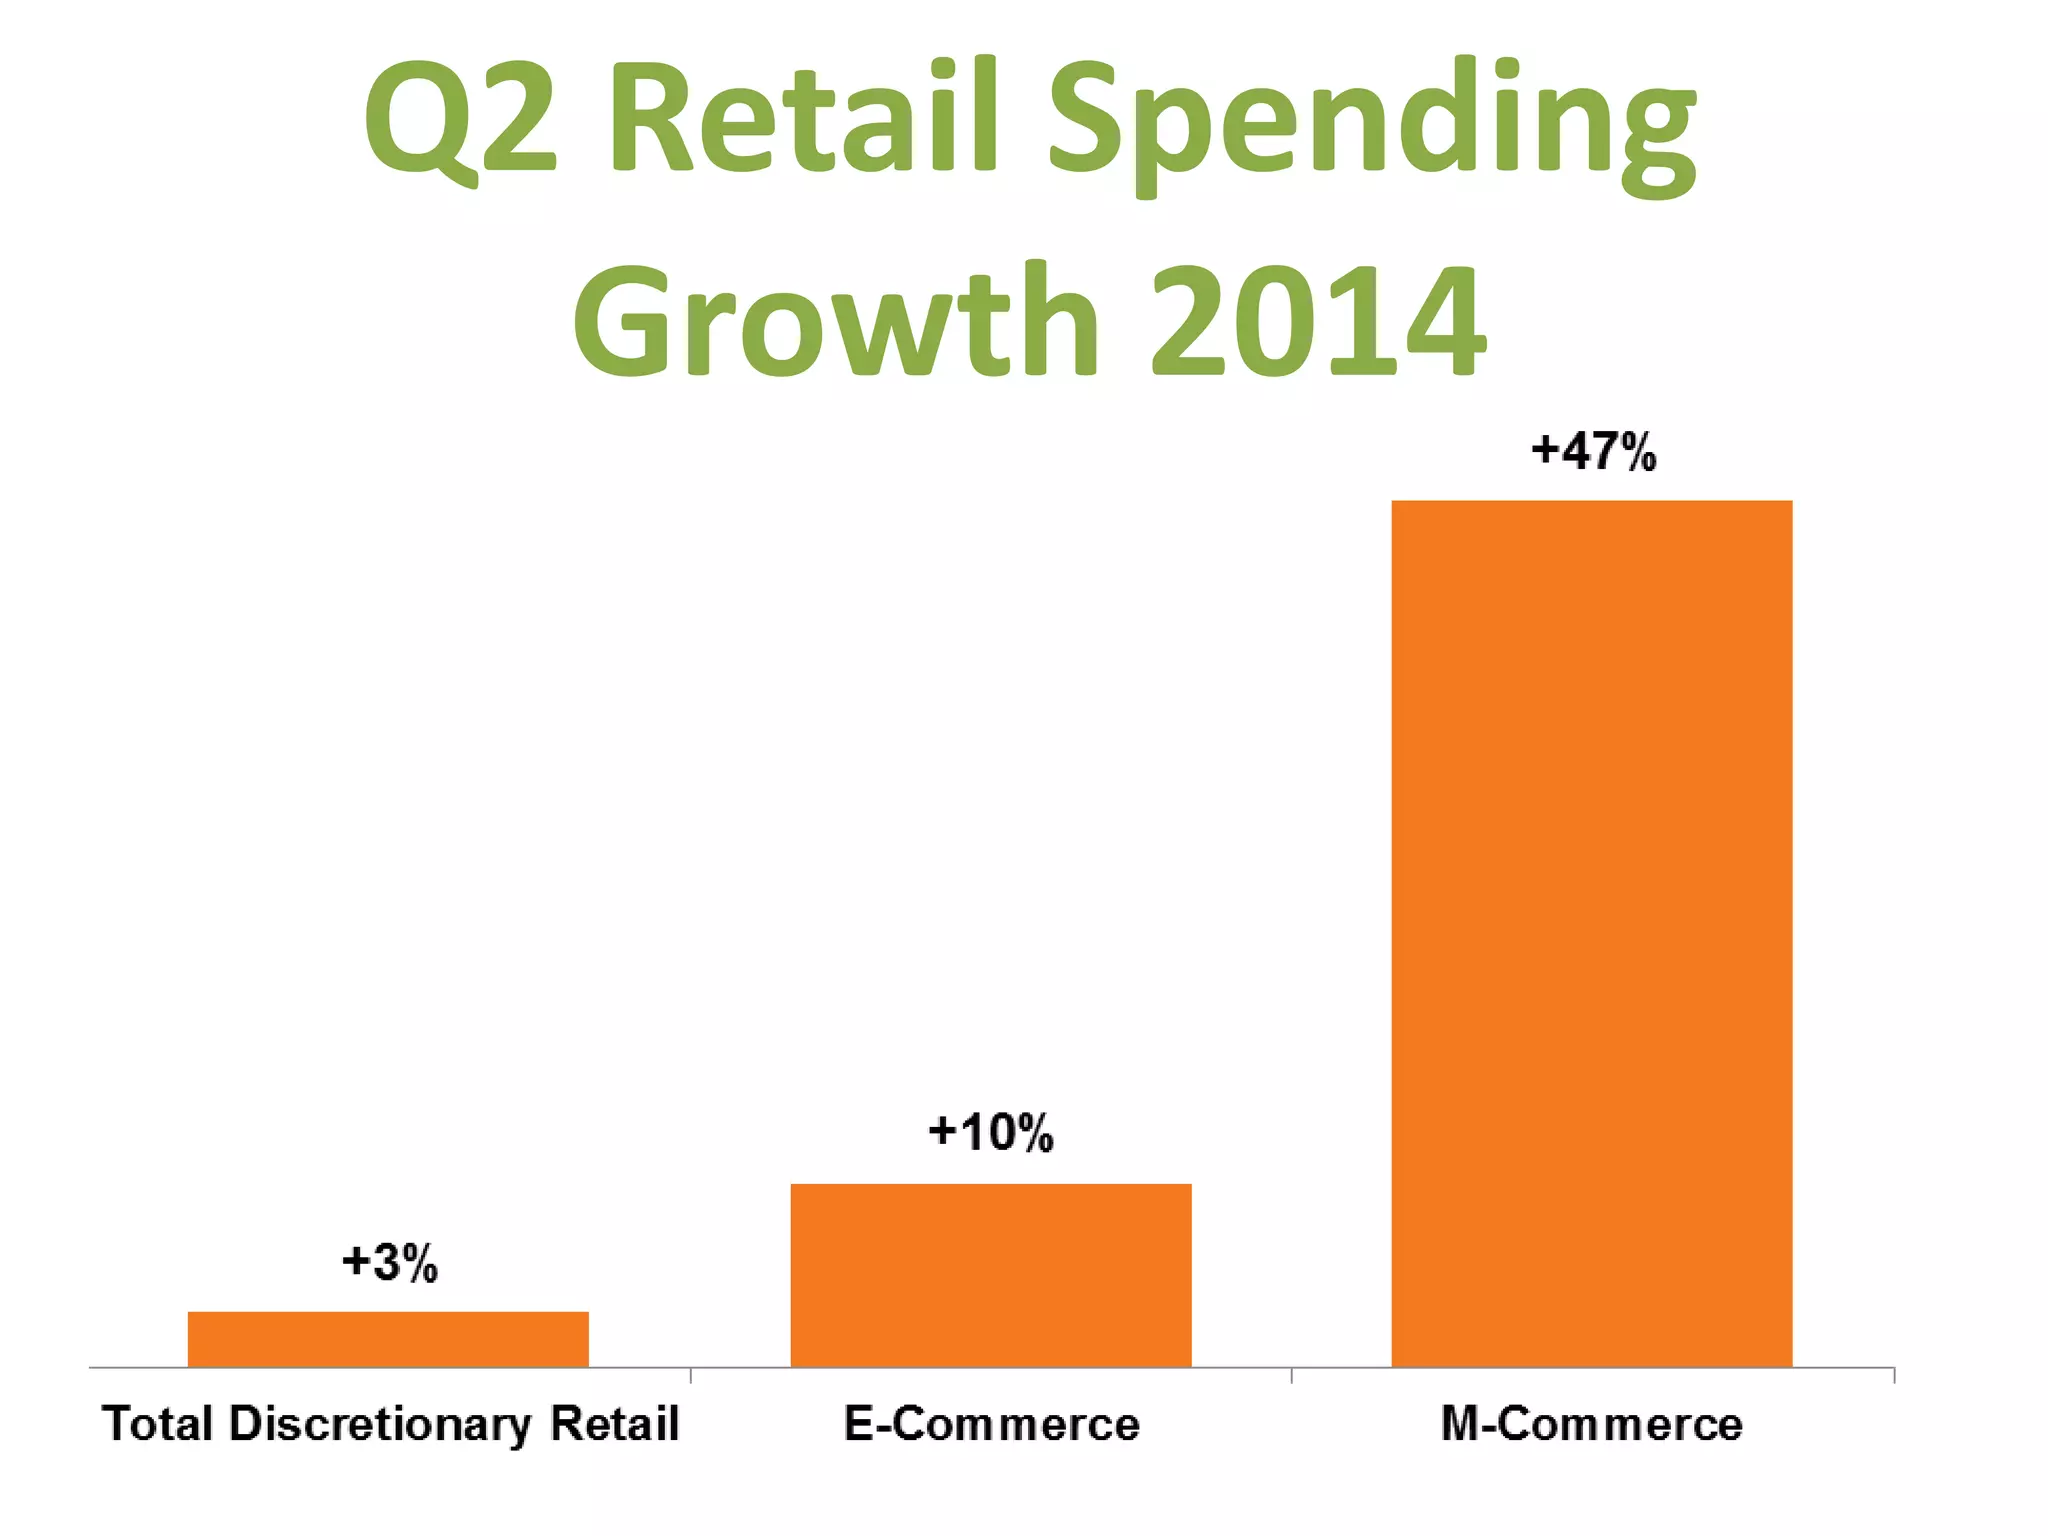
Slide 8 (market funnel) and Slide 9 (Q2 retail spending growth) together map a believable market opportunity: large U.S. apparel market -> workout apparel -> e-commerce sports apparel, with cited growth rates and a 10% year-over-year e-commerce segment growth. The inverted pyramid visual clarifies the addressable segments and narrows down to a realistic e-commerce niche. The adjacent growth chart highlights the disproportionate expansion of mobile commerce (M-commerce), reinforcing why a mobile-first product is timely.

For founders, this is a reminder to present market sizing hierarchically (total market -> niche -> addressable) and to include current growth dynamics that validate product timing. Using an industry source (Statista) and breaking the market into layers helps investors model penetration scenarios that underpin financial projections.

Key Takeaway: Use a layered market funnel plus recent growth metrics to show both long-term scale and immediate timing advantages.
Competition & Differentiation

Competition & Differentiation

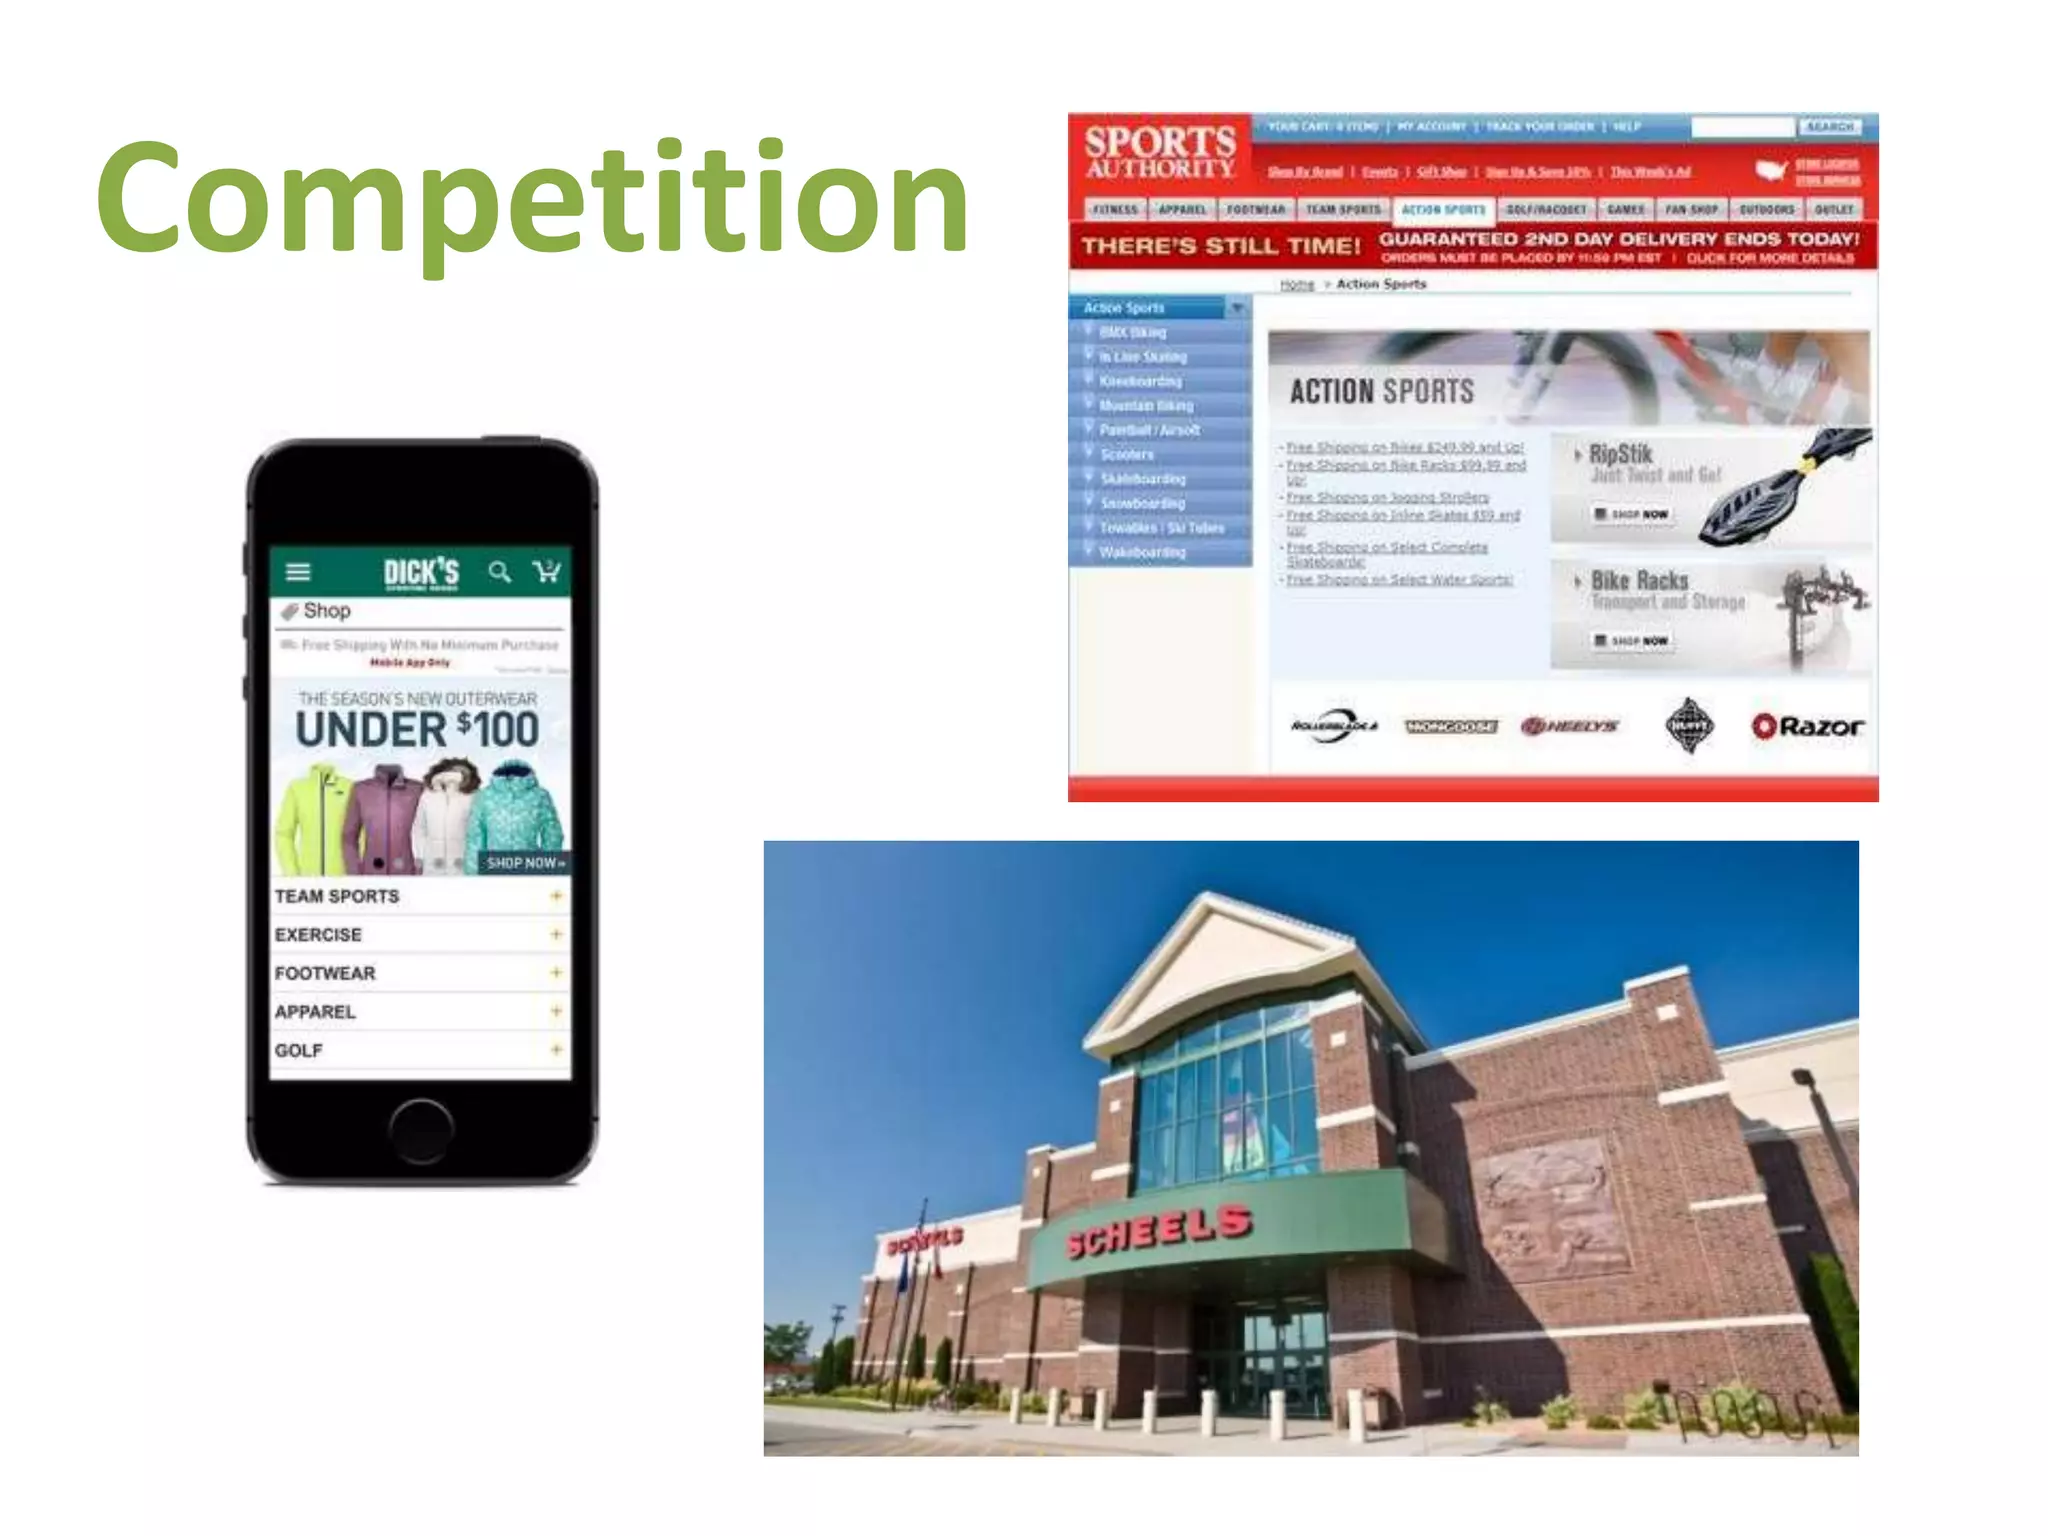
Slide 10 highlights competing channels: mobile apps and websites of large sporting retailers and brick-and-mortar specialty stores. By juxtaposing screenshots and a storefront photo, the deck clarifies that Zoom competes with both incumbent retailers' digital experiences and physical stores. The implicit claim is that Zoom's curated, preference-driven mobile discovery differentiates from retailers' catalog-like or search-first experiences.

Founders should emulate the clarity here: explicitly map where your product sits relative to incumbents and show how your UX or business model addresses gaps. It's also useful to acknowledge competitive strengths (scale of incumbents) while explaining defensible ways to capture niche value (better personalization, affiliate partnerships, lower capital requirements).

Key Takeaway: Map direct and indirect competitors visually and state how your UX and go-to-market fill specific gaps they leave open.

Conclusion: Key Lessons

This deck balances storytelling, product, market, and monetization in a compact, visual way. Strengths include strong context-setting imagery, a clear brand promise, focused product micro-interactions, and pragmatic early monetization through affiliate partnerships. The market slides anchor opportunity with layered sizing and growth signals while the competition slide candidly positions the product against incumbents.

Actionable advice for founders: open with the customer's physical or emotional context, present one clear product interaction that drives value, link UX to a simple revenue model, and show realistic market sizing and competitive positioning. Finally, use recognizable partner logos or committed pilots to lower execution risk in the eyes of investors.

Full Deck Analysis

11 sections

Overview

Company: Zoom (Athletic/Sports Apparel E-Commerce Platform)
Round: Series B ($30M)
Year: 2014
Outcome: IPO at $16B valuation

Critical Note: This is NOT the Zoom Video Communications company. This is a mobile-first shopping platform for athletic apparel that was active in 2014. The company appears to have either pivoted, been acquired, or ceased operations, as it did not become the video conferencing giant that IPO’d at $16B.


Executive Summary

Zoom is a mobile-first e-commerce platform designed to simplify athletic apparel discovery through personalized, preference-driven shopping. The deck positions Zoom as a curated shopping experience for “active people,” leveraging intelligent filtering (price, brand, type, size, material) and social recommendations (“Today’s Like”) to drive engagement and conversion. The pitch capitalizes on explosive m-commerce growth (+47% YoY in Q2 2014) and partnerships with tier-1 athletic brands (Nike, Adidas, Puma, Under Armour, The North Face, Lululemon) to generate affiliate-based revenue. However, the deck lacks critical Series B elements: no traction metrics, no team credentials, no explicit funding ask, and no clear differentiation vs. established competitors like Dick’s Sporting Goods.


Problem Statement

Implicit Problem (Not Explicitly Stated):
The deck does not articulate a clear problem statement. Instead, it assumes:

  • Athletic apparel shopping is fragmented - Consumers must navigate multiple retailers, brands, and channels
  • Discovery is inefficient - Traditional e-commerce and retail don’t personalize the shopping experience for active people
  • Mobile shopping is underserved - While m-commerce is growing 47% YoY, most athletic retailers lack optimized mobile experiences

Slides 1-2 establish context with a bustling retail environment and large product catalog (751 men’s items), implying scale and complexity. Slide 3 introduces Zoom as the solution to this implicit problem.

Weakness: The deck never explicitly states the customer pain point or why existing solutions (Dick’s, Sports Authority, brand websites) are inadequate.


Solution

Core Value Proposition: “Interactive shopping for active people”

Zoom is a mobile-first e-commerce platform that simplifies athletic apparel discovery through:

  1. Personalized Product Discovery (Slides 4-6)
    • Multi-dimensional filtering: Price, Brand, Type, Size, Material
    • Preference-based recommendations (“Today’s Like”)
    • User profiles with wish lists and shopping carts
    • Curated product feeds based on user behavior
  2. Mobile-First Design (Slides 4-5)
    • Optimized iOS app (iPhone 5 mockup shown)
    • Fast, intuitive interface
    • One-tap checkout implied
  3. Social Shopping Elements (Slide 5)
    • “Today’s Like” feature suggests social recommendations
    • User profiles and activity tracking
    • Community-driven curation
  4. Broad Brand Access (Slide 7)
    • Partnerships with 6 major athletic brands
    • Aggregated inventory from multiple sources
    • Single destination for athletic apparel shopping

Key Insight: Zoom positions itself as a curation and recommendation engine, not a retailer. The color-coded filtering system (red/green bars in Slide 4) suggests intelligent categorization, though the specific algorithm is not explained.


Market Opportunity

Market Size Analysis (Slide 8)

Total Addressable Market (TAM): $225 Billion

  • U.S. Apparel market (all categories)

Serviceable Addressable Market (SAM): $68 Billion

  • U.S. Workout/Athletic Apparel market
  • Zoom’s primary focus

Serviceable Obtainable Market (SOM): $6 Billion

  • U.S. E-Commerce Sports Apparel market
  • Zoom’s initial addressable market

Market Growth: 10% Year-Over-Year (for e-commerce sports apparel)

Market Dynamics (Slide 9)

Q2 2014 Retail Spending Growth:

  • Total Discretionary Retail: +3%
  • E-Commerce: +10%
  • M-Commerce: +47% ← Zoom’s primary channel

Strategic Implication: M-commerce is growing 15x faster than traditional retail and 4.7x faster than e-commerce, creating a tailwind for mobile-first shopping platforms.

Market Assessment

Strengths:

  • $6B addressable market is substantial
  • 10% annual growth in e-commerce sports apparel
  • 47% growth in m-commerce validates mobile strategy
  • Athletic apparel is a resilient, growing category

Weaknesses:

  • $6B is relatively modest compared to total retail ($225B)
  • U.S.-only focus (no international expansion mentioned)
  • No market share targets or penetration assumptions provided
  • Doesn’t address how Zoom will capture share from established players

Business Model

Revenue Model: Affiliate Partnerships (Slide 7)

Zoom generates revenue through affiliate commissions on sales driven through its platform.

Partner Brands (6 confirmed):

  1. Nike
  2. Adidas
  3. Puma
  4. Under Armour
  5. The North Face
  6. Lululemon

How It Works:

  • User discovers product on Zoom app
  • User clicks through to brand/retailer website
  • User completes purchase
  • Zoom receives affiliate commission (typically 5-15%, not specified in deck)

Unit Economics:

  • Not disclosed - Deck provides no information on:
    • Average order value (AOV)
    • Commission rates per partner
    • Customer acquisition cost (CAC)
    • Lifetime value (LTV)
    • Conversion rates
    • Revenue per user

Business Model Assessment:

Strengths:

  • Asset-light model (no inventory, fulfillment, or customer service)
  • Scalable (incremental users = incremental revenue)
  • Aligned with partner interests (drives sales for brands)
  • Proven model (Amazon Associates, Skimlinks, etc.)

Weaknesses:

  • Dependent on partner cooperation and commission rates
  • Vulnerable to partners building their own apps (e.g., Nike already has a strong app)
  • No direct customer relationship (users go to partner sites to purchase)
  • Limited pricing power (partners set commissions)
  • No recurring revenue (transactional only)

Traction & Metrics

Critical Gap: The deck provides zero traction metrics.

Missing Data:

  • Monthly Active Users (MAU)
  • Daily Active Users (DAU)
  • User growth rate
  • Revenue (total or run rate)
  • Number of transactions
  • Average order value
  • Customer acquisition cost
  • Retention/churn rates
  • Partner performance data
  • App downloads
  • App store ratings

What This Means:
For a Series B pitch in 2014, the absence of traction metrics is a major red flag. By Series B, investors expect to see:

  • Proof of product-market fit (strong retention, viral growth)
  • Revenue traction (even if small)
  • User growth trajectory
  • Unit economics validation

Possible Explanations:

  1. Zoom is very early-stage (pre-product or MVP only)
  2. Traction metrics are presented verbally or in a separate financial model
  3. Metrics are weak and intentionally omitted from the deck
  4. This is a preliminary deck, not the final investment pitch

Competitive Positioning

Competitors Identified (Slide 10):

  1. Dick’s Sporting Goods - Mobile app + web + physical retail
  2. Sports Authority - Website + physical retail
  3. Scheels - Physical retail

Competitive Landscape Assessment:

Competitor Strengths Weaknesses
Dick’s Sporting Goods Brand recognition, physical stores, logistics, large inventory Broad (not specialized), legacy web/app, less personalized
Sports Authority Established brand, inventory depth Web-focused, less mobile-optimized, broad category focus
Scheels Physical presence, local community Offline-only, limited geographic reach
Zoom Mobile-first, personalized discovery, curated experience No brand recognition, no physical presence, no logistics

Zoom’s Differentiation (Implied, Not Explicit):

  • Mobile-first design - Optimized for on-the-go shopping
  • Personalized discovery - Multi-dimensional filtering and recommendations
  • Curation - “Today’s Like” suggests algorithmic or social recommendations
  • Simplicity - Focused on athletic apparel (not broad retail)

Critical Weakness: The deck does not explicitly articulate why Zoom wins. It shows competitors but doesn’t explain:

  • Why users would choose Zoom over Dick’s app or brand websites
  • What defensible advantages Zoom has
  • Why competitors can’t replicate Zoom’s features
  • How Zoom avoids commoditization

Competitive Risk: Dick’s Sporting Goods (a $3B+ company) could easily replicate Zoom’s filtering and recommendation features. Without clear differentiation or switching costs, Zoom is vulnerable to being out-competed by larger, better-capitalized rivals.


Team

Team Information: Not provided in the deck.

Missing:

  • Founder names and backgrounds
  • CEO/leadership credentials
  • Relevant experience (e-commerce, mobile, retail)
  • Advisory board members
  • Key hires

Impact: For a Series B pitch, the absence of team information is a significant omission. Investors invest in teams as much as ideas. Without knowing who’s building Zoom, it’s impossible to assess execution risk.


Go-to-Market Strategy

Distribution Channels (Implied):

  1. Mobile App - iOS (iPhone 5 shown; Android not mentioned)
  2. Affiliate Partnerships - Partnerships with Nike, Adidas, etc. may include co-marketing

User Acquisition (Not Discussed):

  • No mention of marketing strategy
  • No paid acquisition channels (Facebook ads, Google, etc.)
  • No organic/viral growth mechanisms
  • No partnership-driven distribution

Market Entry (Not Discussed):

  • No geographic rollout plan
  • No vertical expansion strategy (beyond athletic apparel)
  • No timeline for product launches

Assessment: The deck is silent on go-to-market strategy, which is critical for Series B. How will Zoom acquire users at scale? What’s the CAC? What’s the payback period?


The Ask

Funding Amount: $30M (Series B)

Use of Proceeds: Not specified in the deck.

Missing Information:

  • Breakdown of how $30M will be allocated (product, marketing, operations, team, etc.)
  • Runway (how long will $30M last?)
  • Hiring plans
  • Product roadmap
  • Geographic expansion plans
  • Timeline to profitability or next milestone

Closing Slide (Slide 11): Simply repeats the Zoom logo and tagline with no explicit ask, call-to-action, or next steps.

Assessment: The deck lacks a clear, compelling ask. A strong Series B closing would state:

  • “We’re raising $30M to…”
  • “With this funding, we will…”
  • “Our milestones are…”
  • “Contact us at…”

Investor Deep Dive

Executive summary, strengths & red flags

Executive Summary

Zoom is a mobile-first e-commerce platform designed to simplify athletic apparel discovery through personalized, preference-driven shopping. The deck positions Zoom as a curated shopping experience for "active people," leveraging intelligent filtering (price, brand, type, size, material) and social recommendations ("Today's Like") to drive engagement and conversion. The pitch capitalizes on explosive m-commerce growth (+47% YoY in Q2 2014) and partnerships with tier-1 athletic brands (Nike, Adidas, Puma, Under Armour, The North Face, Lululemon) to generate affiliate-based revenue. However, the deck lacks critical Series B elements: no traction metrics, no team credentials, no explicit funding ask, and no clear differentiation vs. established competitors like Dick's Sporting Goods.

Key Strengths

5 identified

1

Strong Market Timing & Tailwinds

- M-commerce growing at +47% YoY (Slide 9) vs. +3% for traditional retail

2

Tier-1 Brand Partnerships

- 6 major athletic brands (Nike, Adidas, Puma, Under Armour, The North Face, Lululemon) as affiliate partners (Slide 7)

3

Clear, Focused Value Proposition

- "Interactive shopping for active people" is simple, memorable, and specific (Slides 3, 11)

4

Thoughtful Product Design

- Multi-dimensional filtering (price, brand, type, size, material), personalized recommendations, user profiles, wish lists (Slides 4-6)

5

Visual Presentation Quality

- Clean, modern design; consistent branding; professional mockups; clear data visualization (Slides 1-11)

More Pitch Decks To Study

Compare structure, fundraising context, and investor-facing story across similar startup decks.