Compare your deck to Front

Compare Your Deck

Front Pitch Deck (2022)

SaaS
Stage: Series D
Raised: $65M
Year: 2022
Slides: 11
Outcome: Valued at $1.7B

Pitch Deck

1 / 11
Front pitch deck - The Opening: Brand and Tone
Click to expand

Deck Analysis

This Series D pitch deck from Front (2022) presents a concise, design-forward fundraising narrative for a customer communication hub. It balances product explanation, customer validation, market sizing, and operational traction while using strong visuals and a consistent brand aesthetic. Notable elements include clear metrics up front, recognizable logos for credibility, and a simple progression from problem to product to market opportunity — making it easy for investors to follow the thesis and assess scale and defensibility.

The Opening: Brand and Tone

The Opening: Brand and Tone

The title slide (clean, large typography, soft gradient background) sets a calm, modern tone and positions Front as a premium product. It uses minimal text — just the company name and date — which signals confidence: the team trusts the following slides and the brand to carry meaning. The visual consistency here (logo placement, color palette) primes investors for a professionally designed presentation and prepares them for a product-driven story.

Founders can learn the importance of first impressions: a simple, well-executed cover slide conveys polish and attention to detail, which is especially important for B2B SaaS where design and UX often correlate with customer experience. It also gives the presenter flexibility to jump into the narrative without overloading the opener with numbers or claims.
Key Takeaway: Use a minimalist, on-brand cover to establish credibility and let the rest of the deck carry the narrative.
Key Metrics Upfront: Building Credibility Quickly

Key Metrics Upfront: Building Credibility Quickly

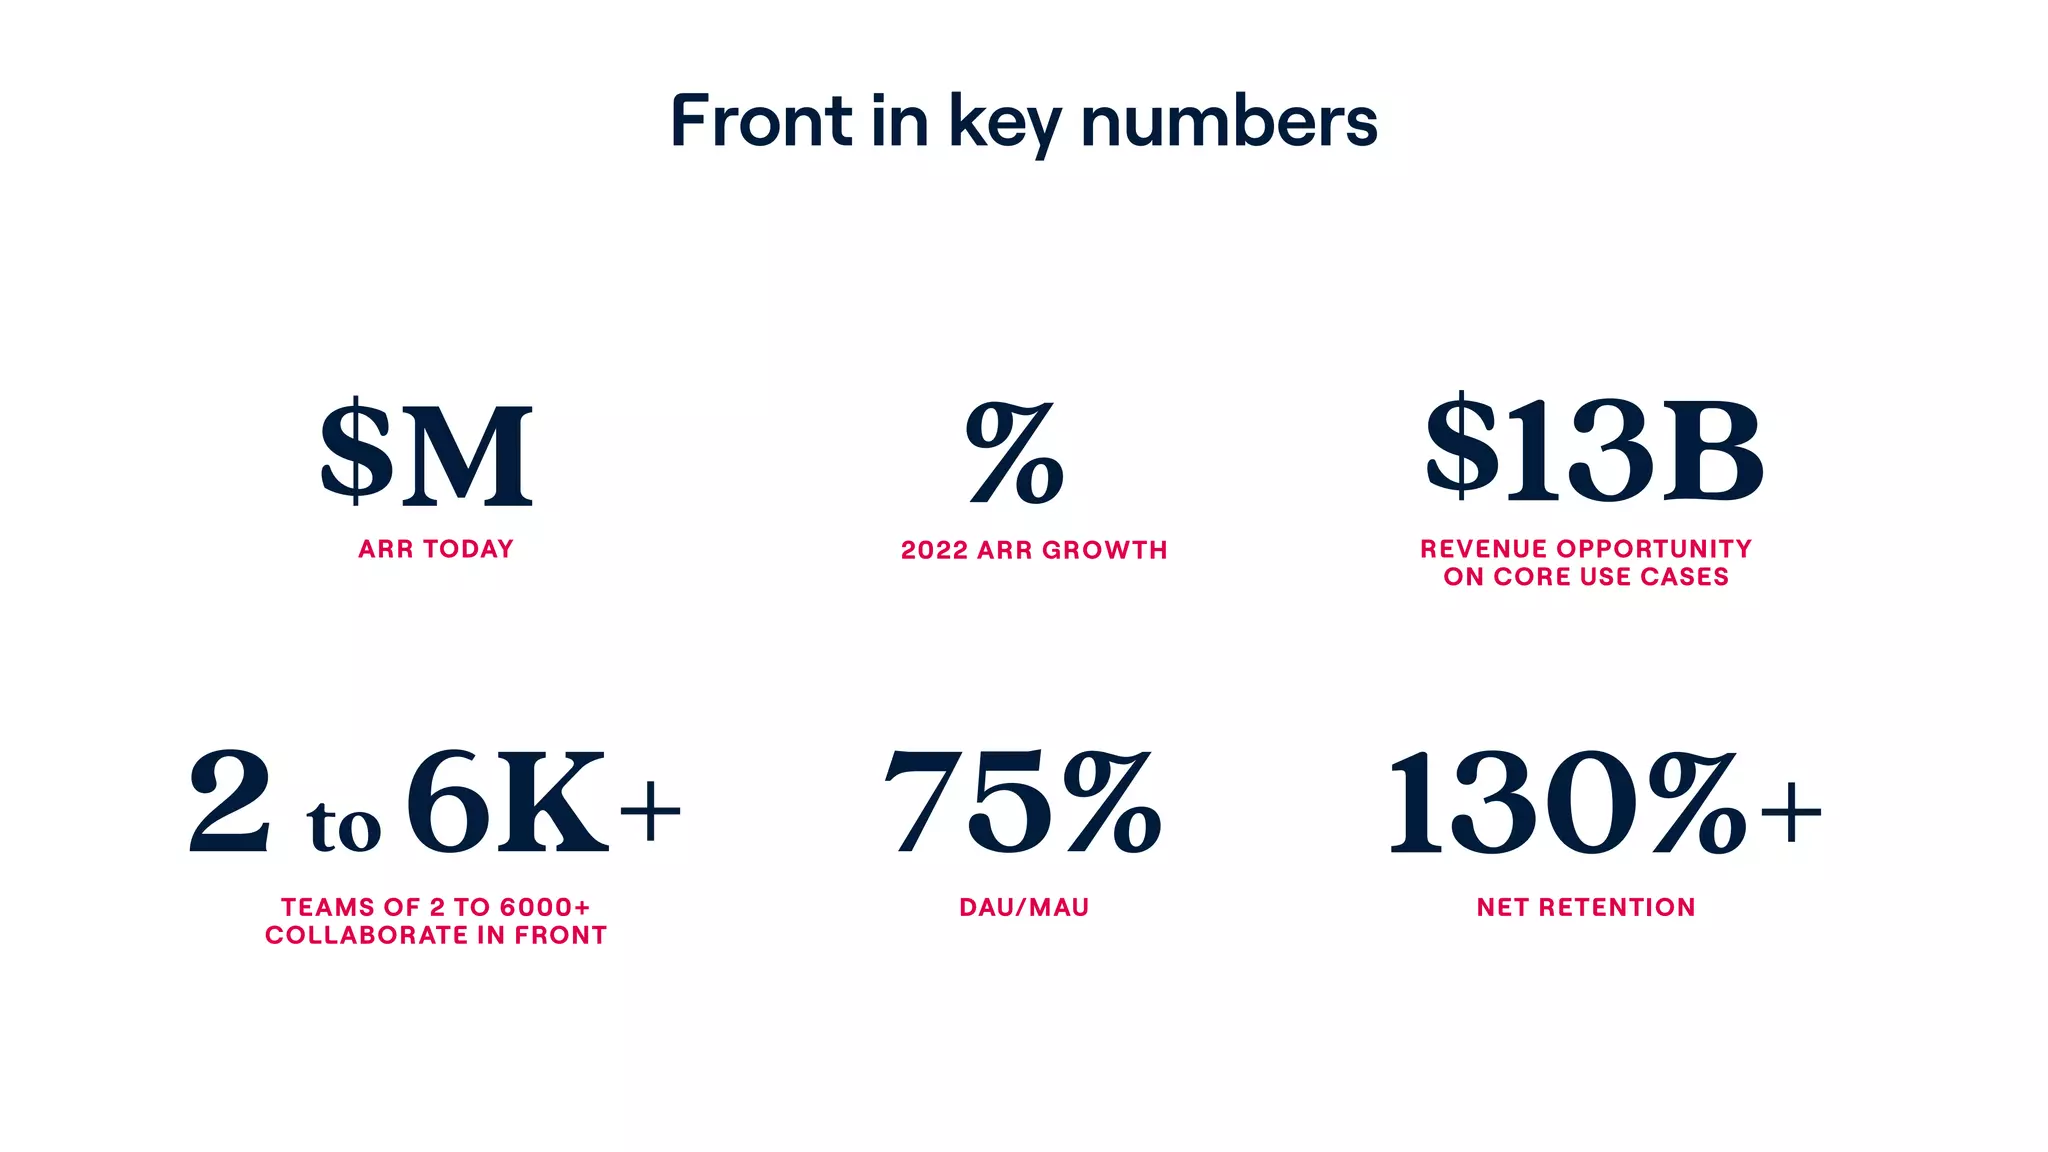
Slide 2 puts core metrics front-and-center (ARR, growth, revenue opportunity, team sizes, DAU/MAU, net retention). Even without exact numeric ARR and growth values visible here, the layout communicates what metrics matter and that Front is tracking them. Showing net retention >130% and DAU/MAU at 75% is a strong signal of product-market fit and engagement — two of the most important indicators for SaaS investors.

This arrangement teaches founders to lead with the KPI story early. Investors read for traction; placing stickiness, retention, and TAM-oriented metrics early helps establish that the company is beyond mere concept and growing predictably. The slide also balances ambition (TAM) with operational rigor (retention and engagement), which reduces investor risk perception.

Key Takeaway: Lead with a compact KPI slide that highlights retention, engagement, TAM and growth to establish traction quickly.
Customer Logos: Social Proof and Segmentation

Customer Logos: Social Proof and Segmentation

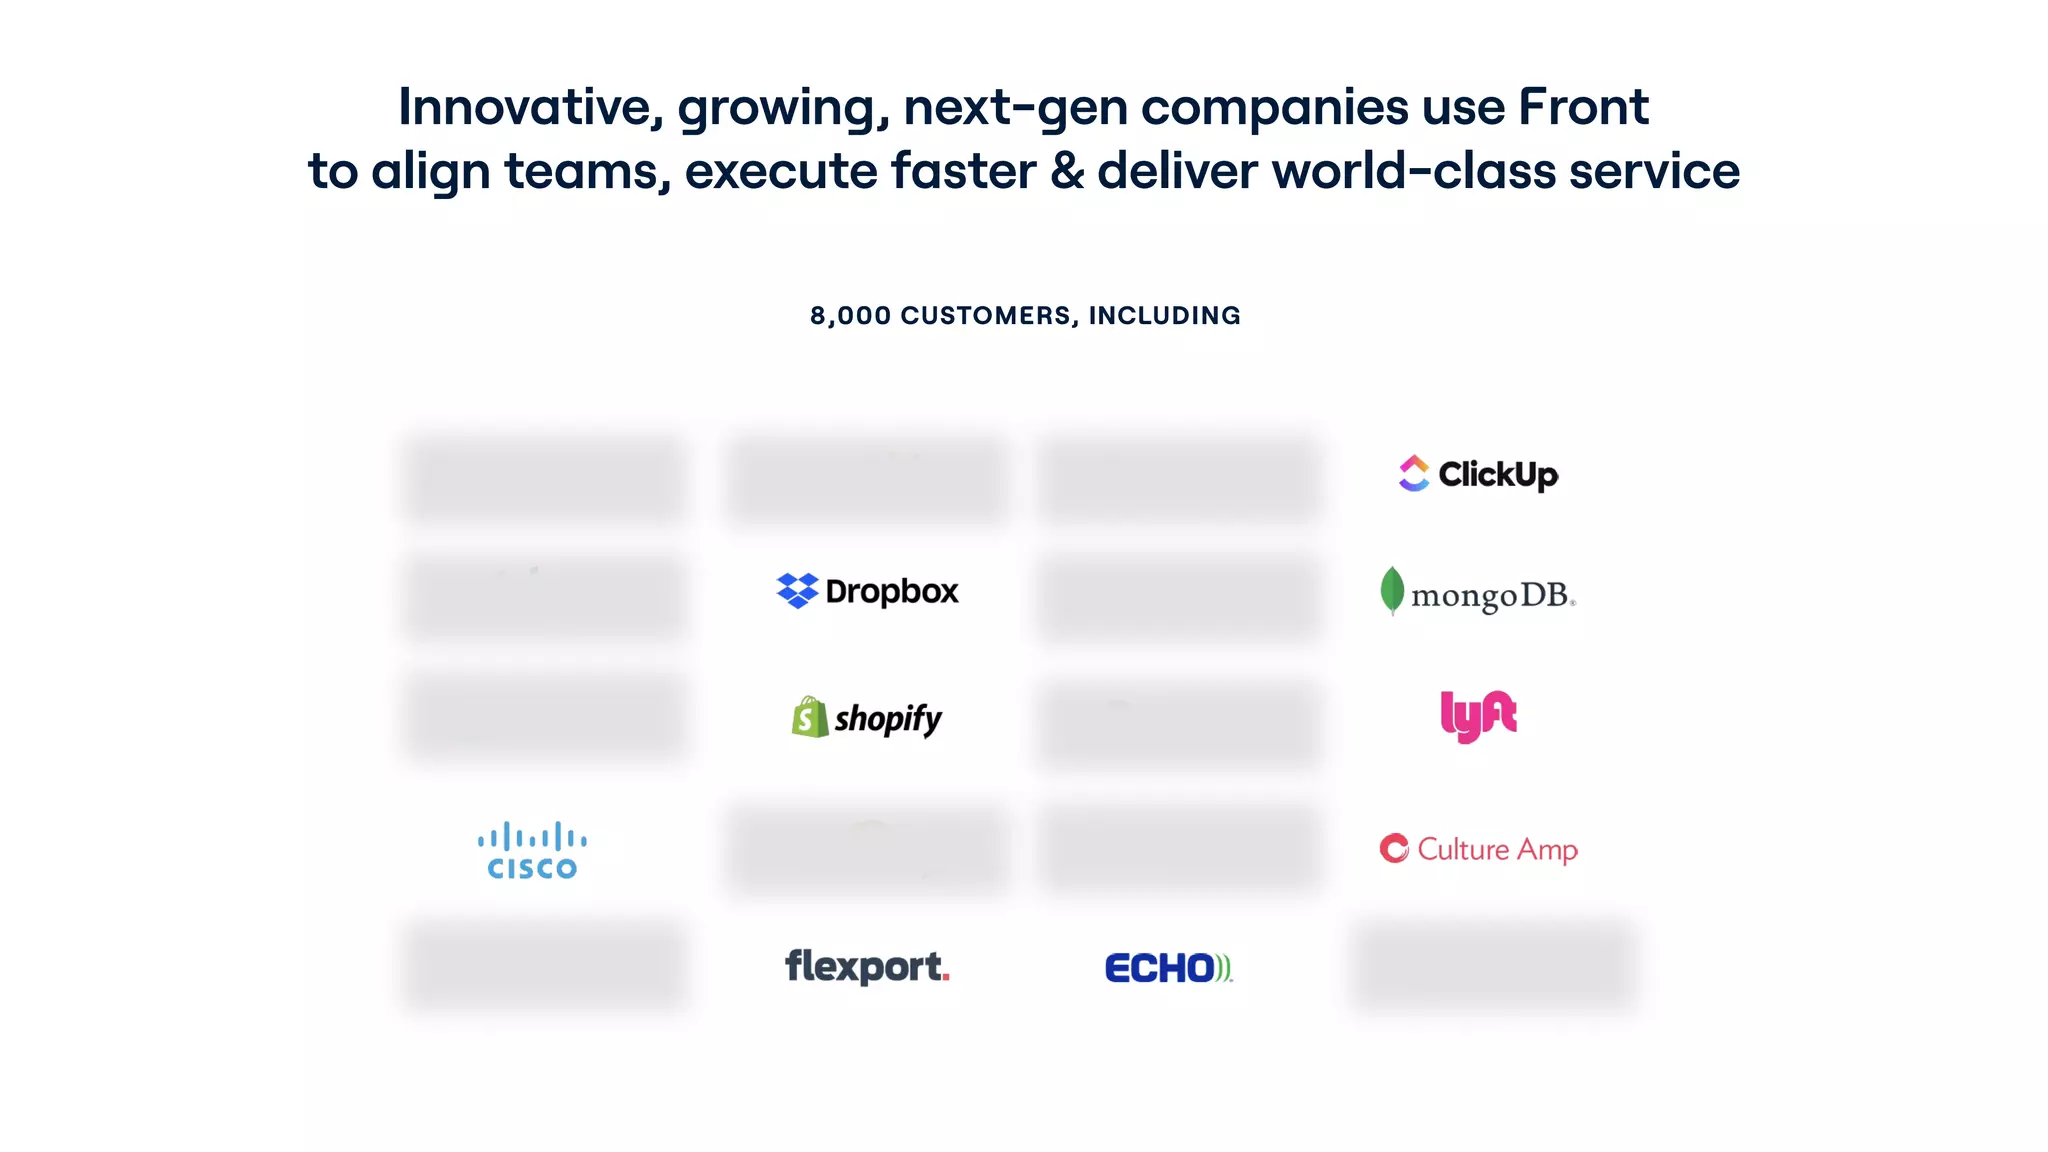
Slide 3 showcases customer logos and states the customer count (8,000 customers) — a classic social proof play. The mix includes well-known tech brands (Dropbox, Shopify, ClickUp) plus enterprise names (Cisco), which signals that Front spans both high-growth startups and large organizations. This breadth helps argue that the product is both flexible and enterprise-capable.

For founders, the lesson is twofold: first, quality logos accelerate credibility far more than additional text, and second, explicitly calling out customer count alongside logos provides context on adoption depth. If you’ve secured marquee customers across segments, showcase that diversity to demonstrate both product-market fit and the ability to scale into larger accounts.

Key Takeaway: Use recognized customer logos plus a clear customer count to provide instant social proof and highlight cross-segment traction.
What the Product Is: Clear, Visual Product Story

What the Product Is: Clear, Visual Product Story

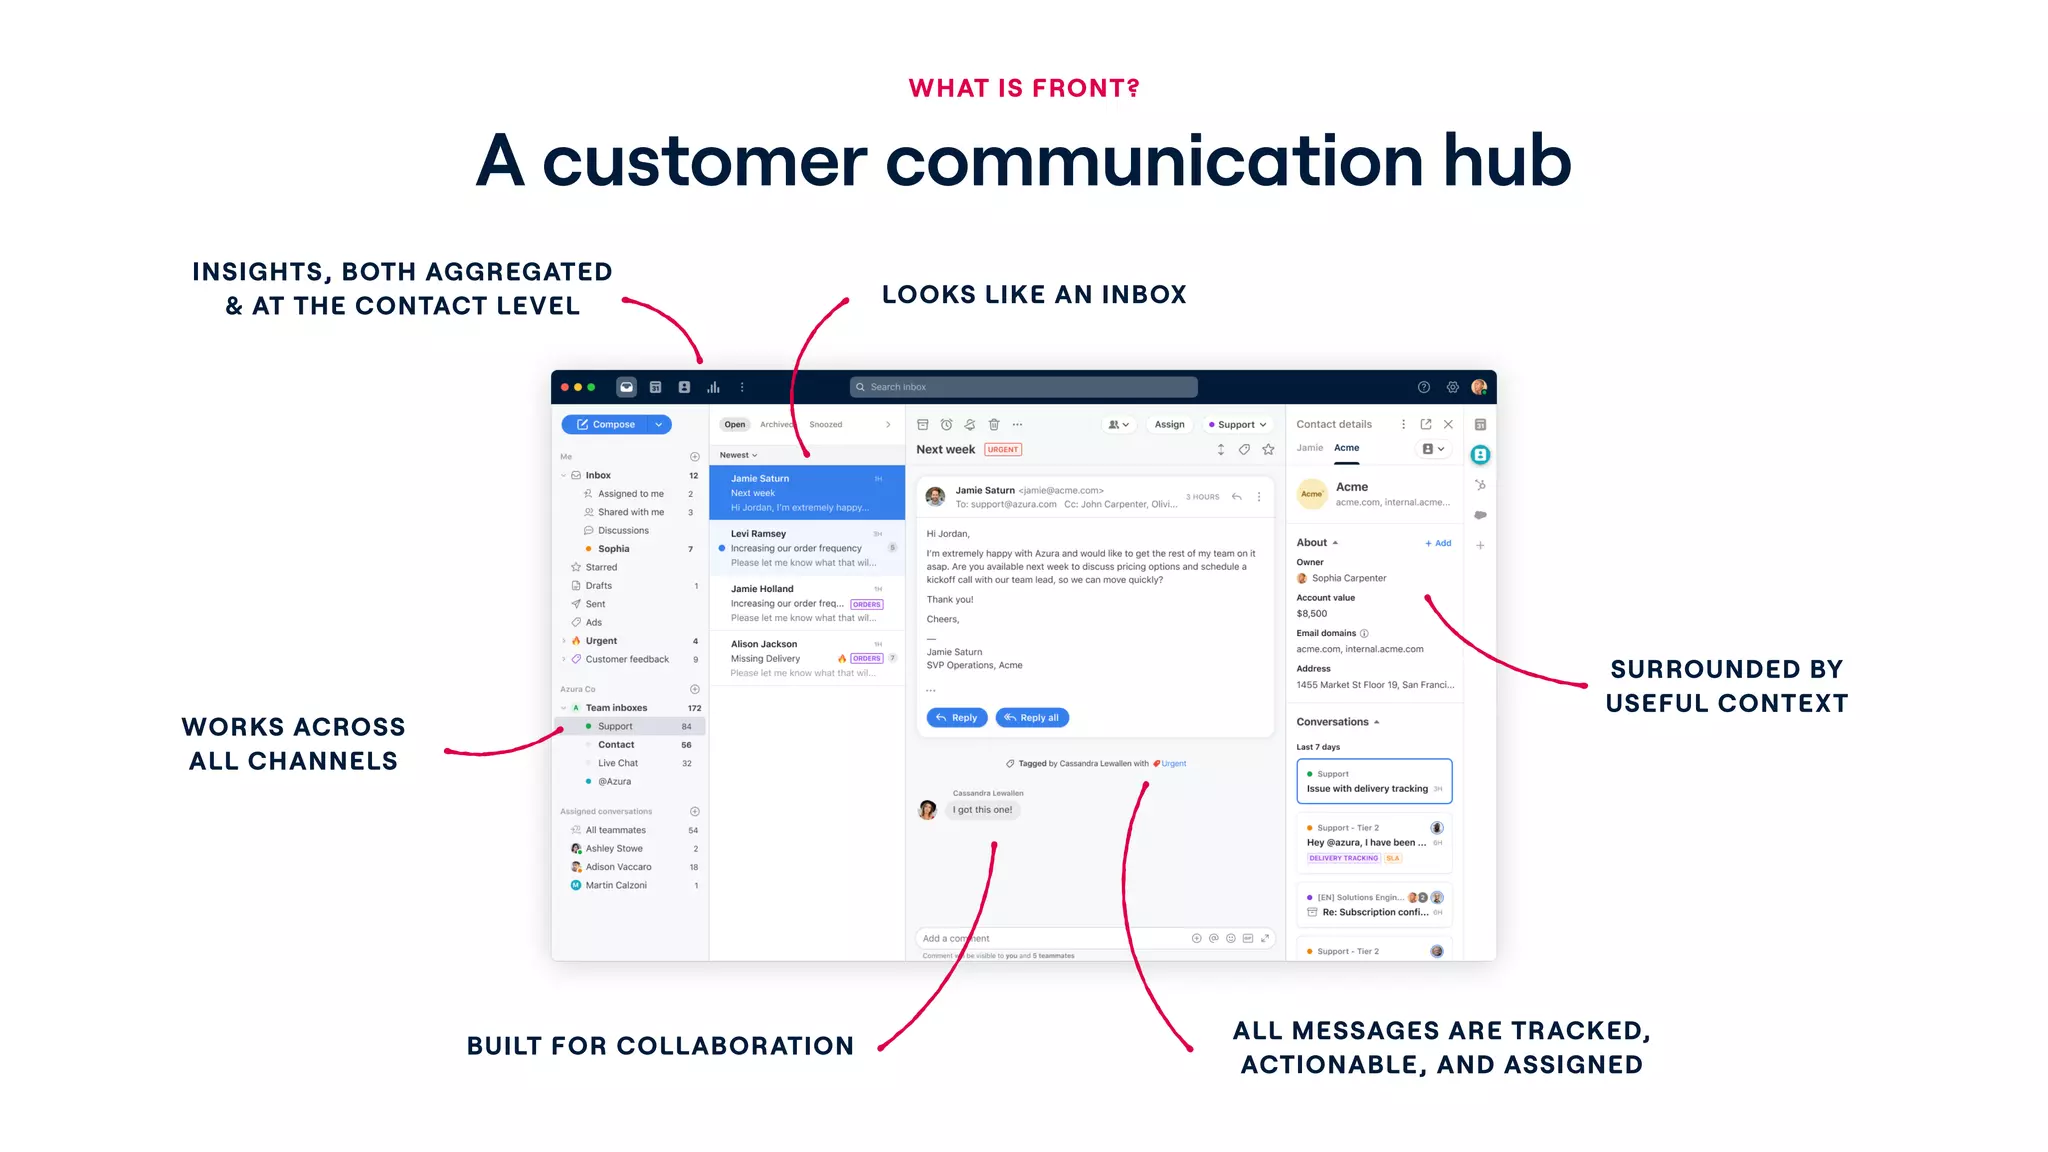
Slide 4 answers the core question — what is Front? — using a large product screenshot annotated with short value statements: looks like an inbox, works across channels, built for collaboration, surrounded by useful context, and messages are tracked and actionable. The visual + callout approach is highly effective because it shows rather than tells: investors immediately see the UI and mental model (an inbox for teams) and the specific capabilities that differentiate it from a standard email client.

Founders should emulate this: combine a real product screenshot with a few crisp callouts that map product features to customer benefits. This reduces abstraction, helps non-technical investors understand the experience, and anchors future slides about use cases and monetization in a tangible UI.

Key Takeaway: Show the product in-context with concise callouts to make the value tangible and reduce conceptual friction.
Market Positioning: Mapping the Opportunity

Market Positioning: Mapping the Opportunity

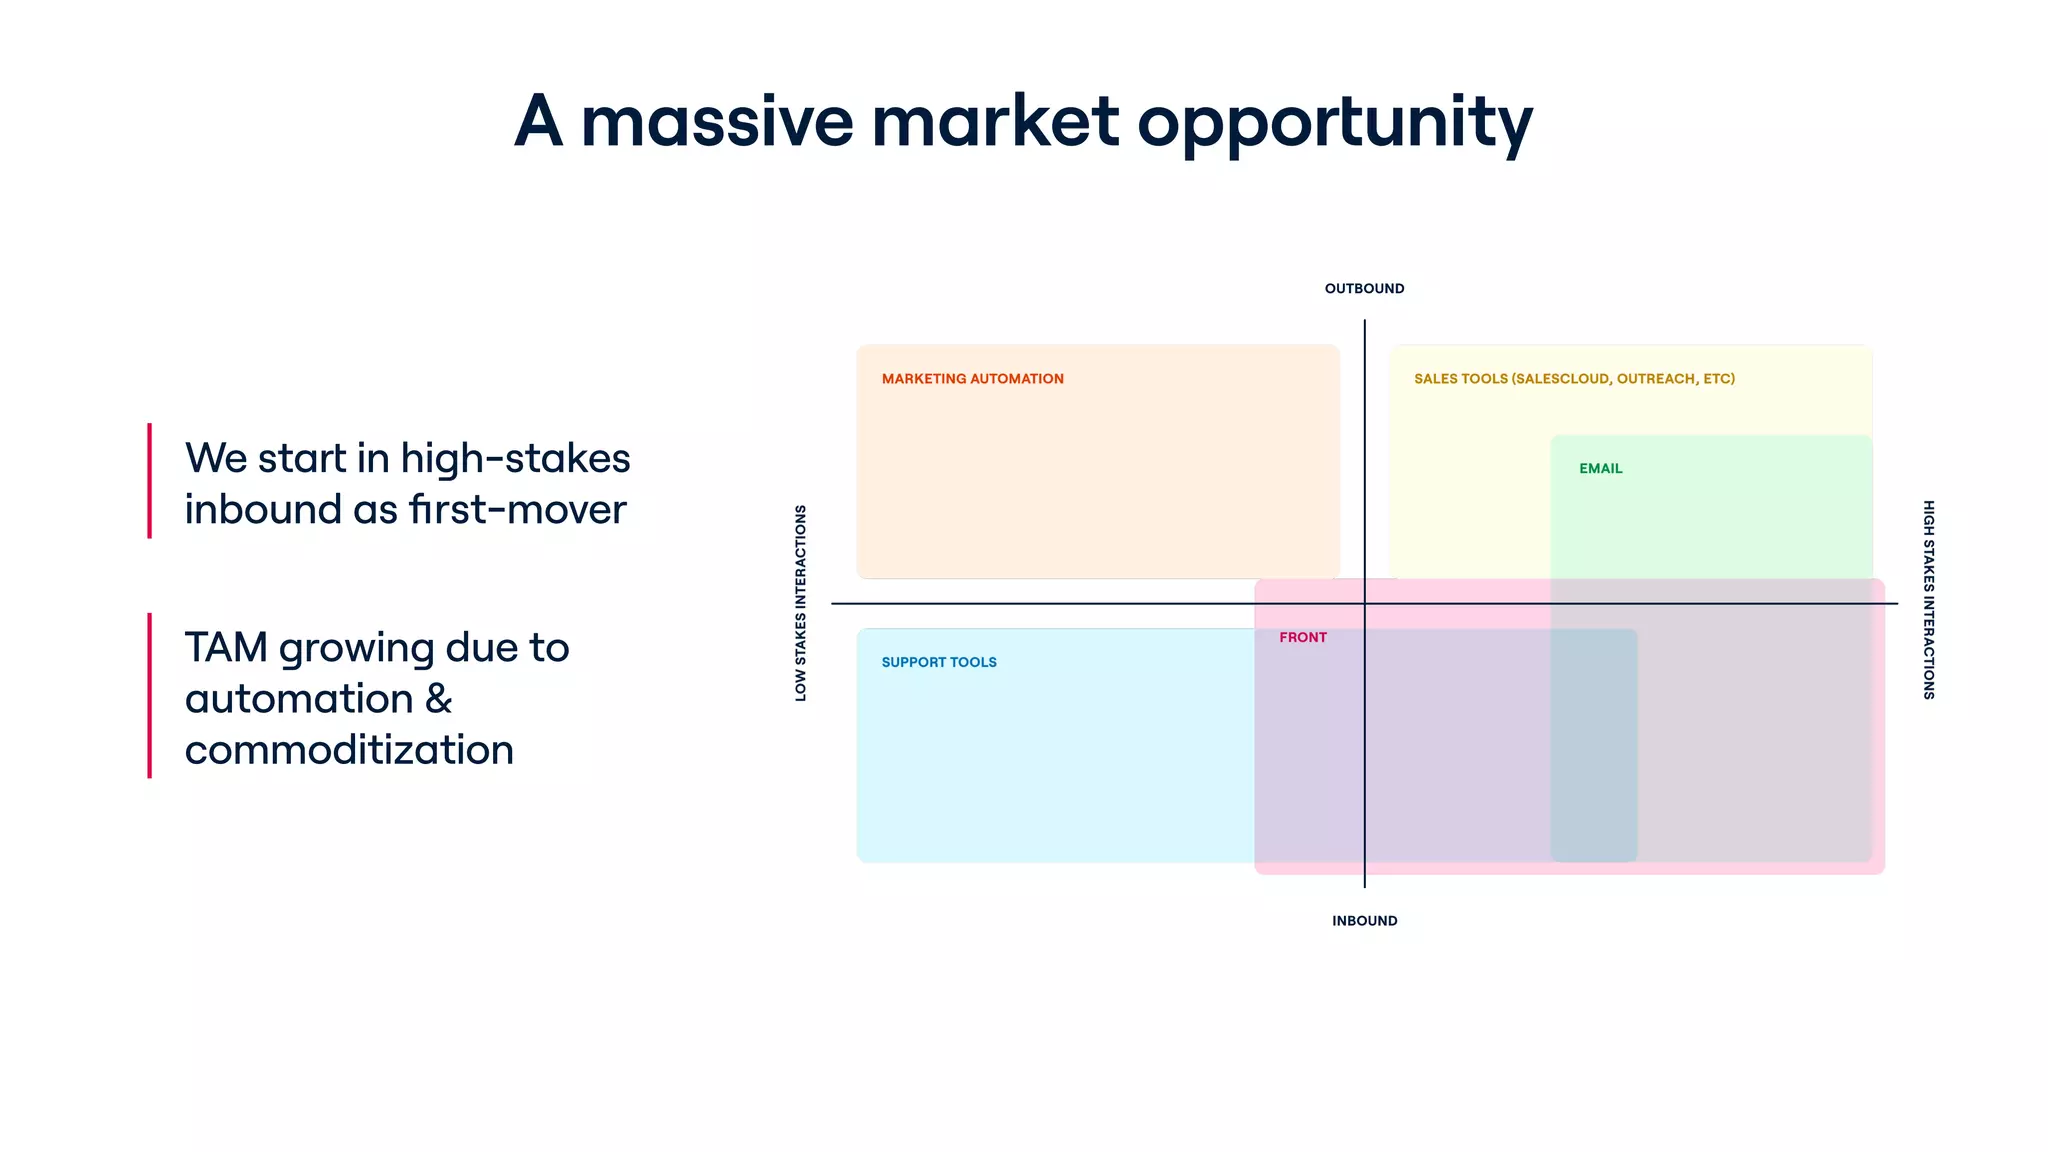
Slide 5 uses a quadrant/overlap diagram to place Front relative to marketing automation, sales tools, support tools, and email. The graphic emphasizes Front's position as focused on inbound, high-stakes interactions and captures how adjacent markets are shifting (automation commoditizing TAM). The left-side bullets explain the go-to-market approach (start in high-stakes inbound) and why TAM is expanding, which ties product positioning to a pragmatic growth plan.

This slide is effective because it visually communicates strategy and competitive differentiation simultaneously. Founders should use simple visual maps to explain where they play, how adjacent categories behave, and why their initial beachhead is defensible. It’s a clear way to show both immediate market and future expansion vectors without long text explanations.

Key Takeaway: Use a simple competitive map to show your beachhead and how adjacent markets create expansion opportunities.
Use Cases & Customer Outcomes: Specifics that Sell

Use Cases & Customer Outcomes: Specifics that Sell

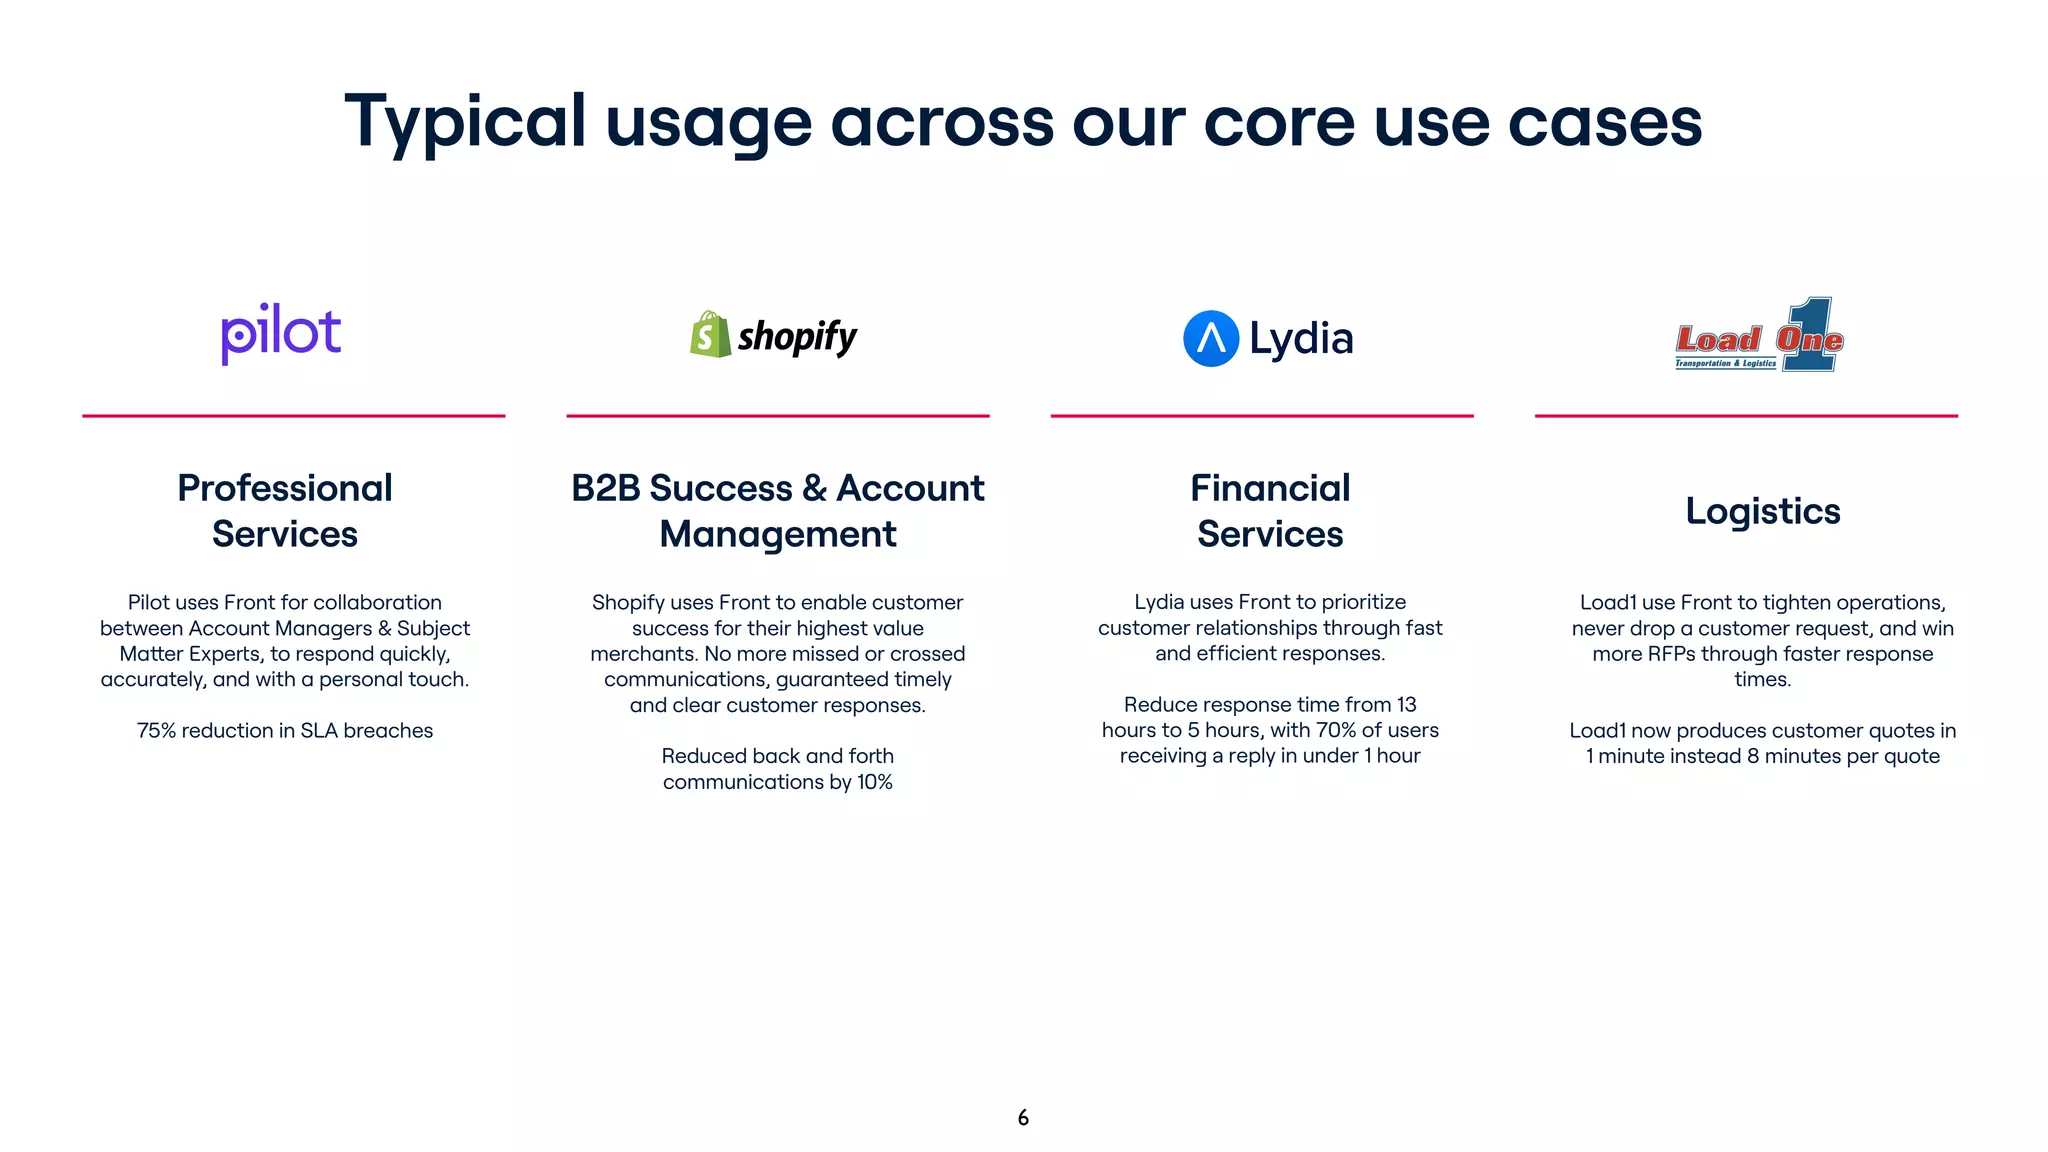
Slide 6 lays out typical usage across core use cases (professional services, B2B success/account management, financial services, logistics) with short outcome-focused descriptions and percentages (e.g., SLA reduction, response-time improvements). This makes the product’s ROI explicit for different buyer personas and industries, and demonstrates that Front tailors to measurable pain points rather than being a one-size-fits-all messaging app.

The practical takeaway for founders is to always translate features into concrete customer outcomes: time saved, SLA improvements, percent reductions, or process efficiencies. Specific, quantified results make case studies persuasive for both sales and investors, and help later justify pricing and expansion strategies.

Key Takeaway: Frame product features through industry-specific use cases and measurable outcomes to make ROI obvious.
Traction and Unit Metrics: Showing Product Stickiness

Traction and Unit Metrics: Showing Product Stickiness

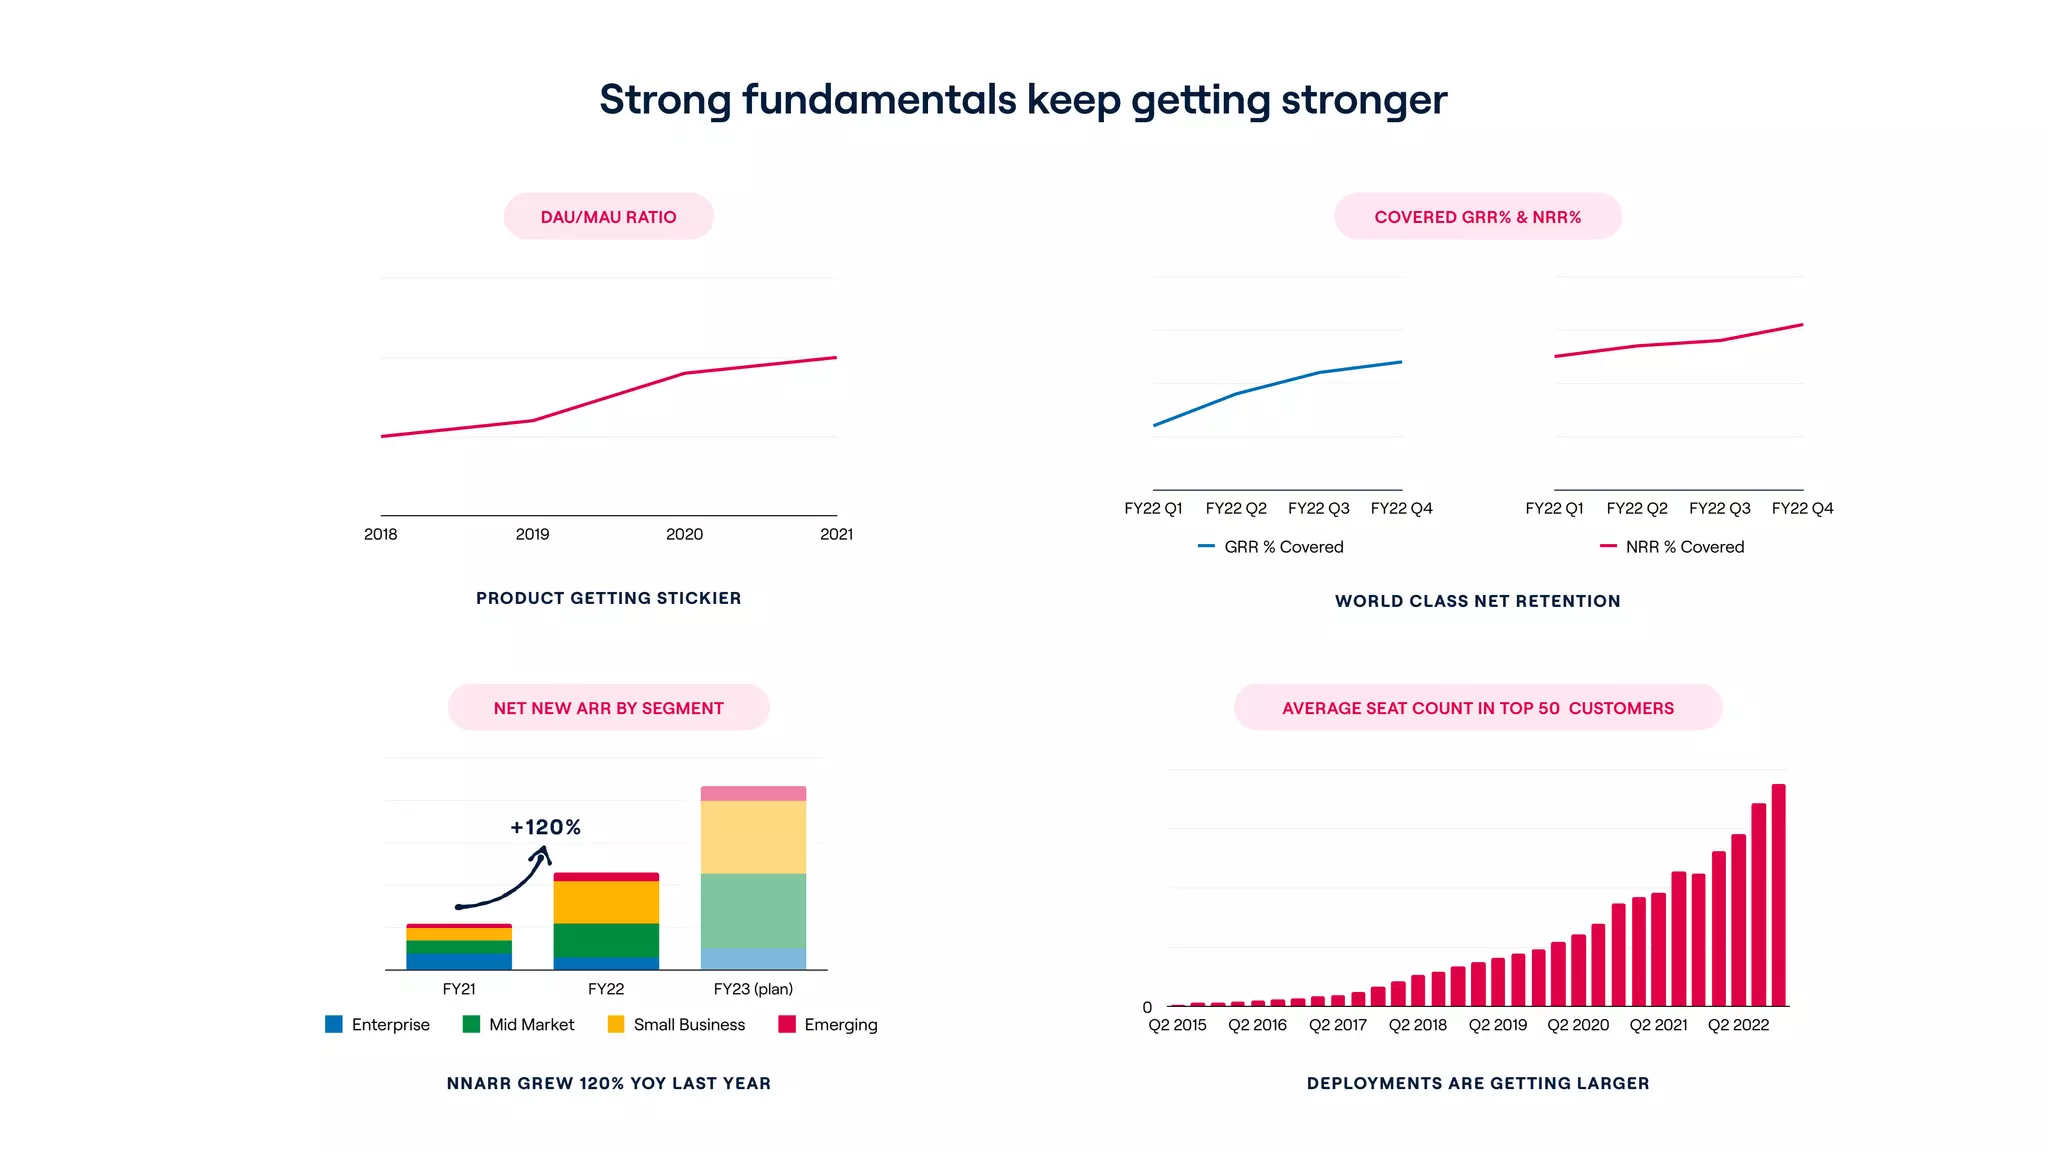
Slide 8 consolidates durability metrics — DAU/MAU trend, GRR/NRR coverage, net new ARR by segment, and average seat count growth — into one slide demonstrating strong fundamentals. The mixed use of line charts and stacked bars shows both user engagement improvements and revenue expansion across segments, highlighting that deployments are getting larger and retention remains high. These are the kinds of metrics that indicate a scalable SaaS business with land-and-expand dynamics.

For founders, this emphasizes the need to present both engagement (stickiness) and revenue expansion (NRR, seat growth) together. Investors look for the compound effect: high engagement leads to expansion, which improves unit economics. Showing these trends visually (quarter-over-quarter and year-over-year) makes the growth pattern credible and easier to digest.

Key Takeaway: Combine engagement and revenue expansion metrics to prove stickiness and scalable land-and-expand economics.
Vision: A Long-Term Platform Narrative

Vision: A Long-Term Platform Narrative

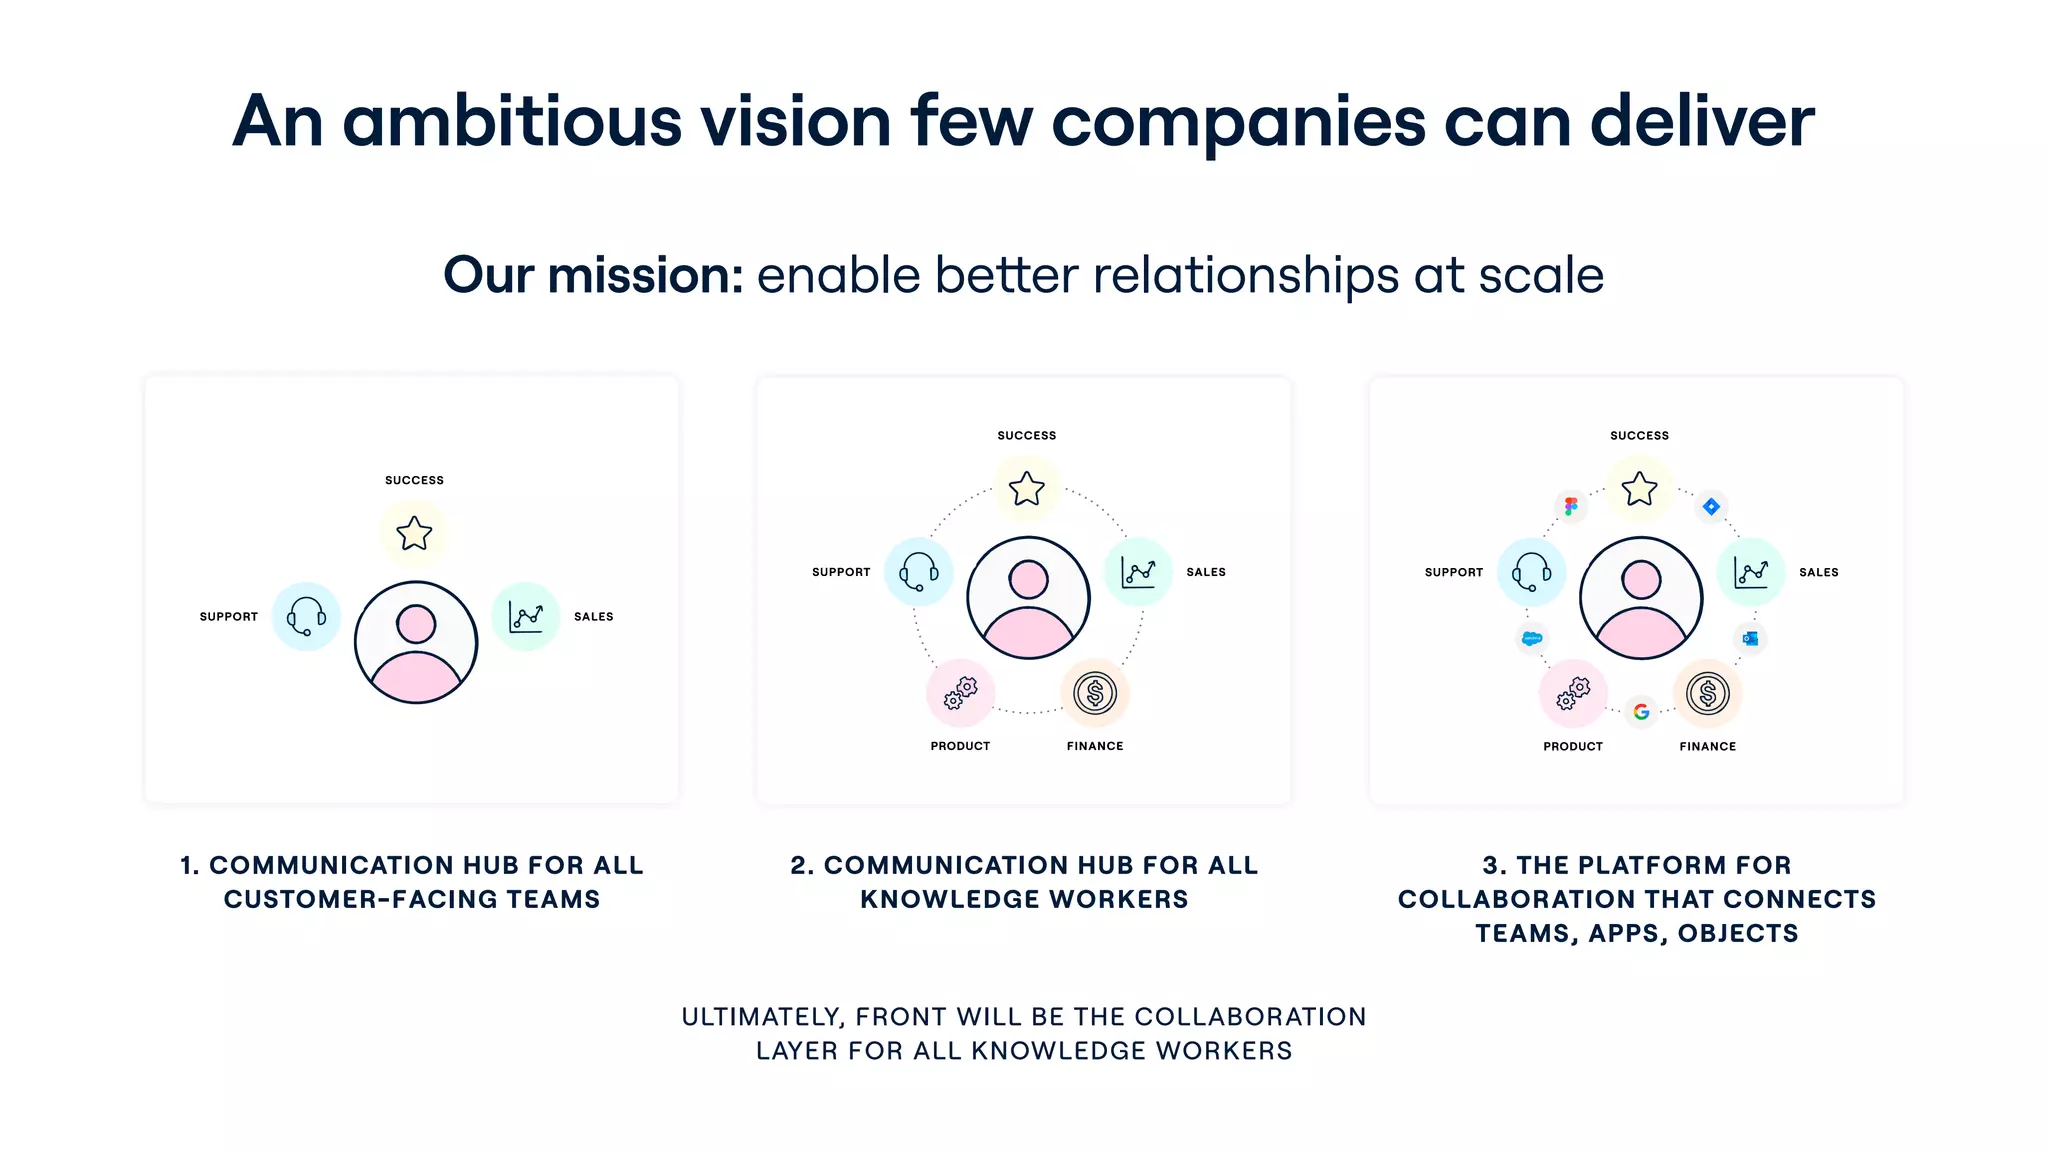
Slide 9 articulates a three-step vision: be the communication hub for customer-facing teams, expand to all knowledge workers, and become the collaboration platform connecting teams, apps, and objects. The visuals show progressive concentric circles of integration — a simple but powerful way to convey long-term ambition without losing the immediate product focus. This signals to investors that the team has a defensible roadmap for moving up-market and broadening use cases.

This slide is useful for founders because it demonstrates how to balance near-term commercial priorities with a credible long-term platform narrative. Lay out a plausible path from niche to platform and illustrate the stages; investors want to see both a bite-sized beachhead and a vision for durable expansion that leverages integrations and network effects.

Key Takeaway: Present a staged product roadmap that links a defensible beachhead to an aspirational platform vision.

Conclusion: Key Lessons

This deck succeeds by combining visual clarity, early emphasis on metrics, and a clear path from product to market to platform. Strengths include: a polished, consistent design language; KPI-first sequencing (retention, engagement, TAM); strong social proof via recognizable customers; a concrete product walkthrough; and a staged vision for expansion. Each of these elements reduces investor friction by answering the most common questions (what is it, who uses it, how sticky is it, and what’s the upside).

Actionable advice for founders: lead with your strongest traction metrics, show the product in context with concise callouts, use customer logos and specific use cases to signal credibility, and map a realistic beachhead that connects to a larger platform opportunity. Keep slides visually simple, quantify outcomes where possible, and structure the narrative so each slide answers a single investor question — proximity to product-market fit, ability to scale, and defensibility.

Full Deck Analysis

11 sections

Overview

Company: Front
Round: Series D ($65M)
Year: 2022
Outcome: Valued at $1.7B


Executive Summary

Front’s Series D pitch deck presents a compelling investment case for a customer communication platform that has achieved strong product-market fit across 8,000 customers with exceptional unit economics (130%+ NRR, 75% DAU/MAU). The deck effectively demonstrates how Front has captured the “high-stakes inbound” segment as a first-mover and positions an ambitious three-stage expansion roadmap into broader knowledge worker collaboration. The presentation balances quantified business metrics with customer validation and a strong executive team, though it strategically obscures certain financial details (specific ARR and growth percentages) and lacks depth on competitive defensibility against larger incumbents.


Problem Statement

The deck articulates the problem implicitly across two dimensions:

Slide 5 (Market Opportunity) identifies structural inefficiencies in customer communication:

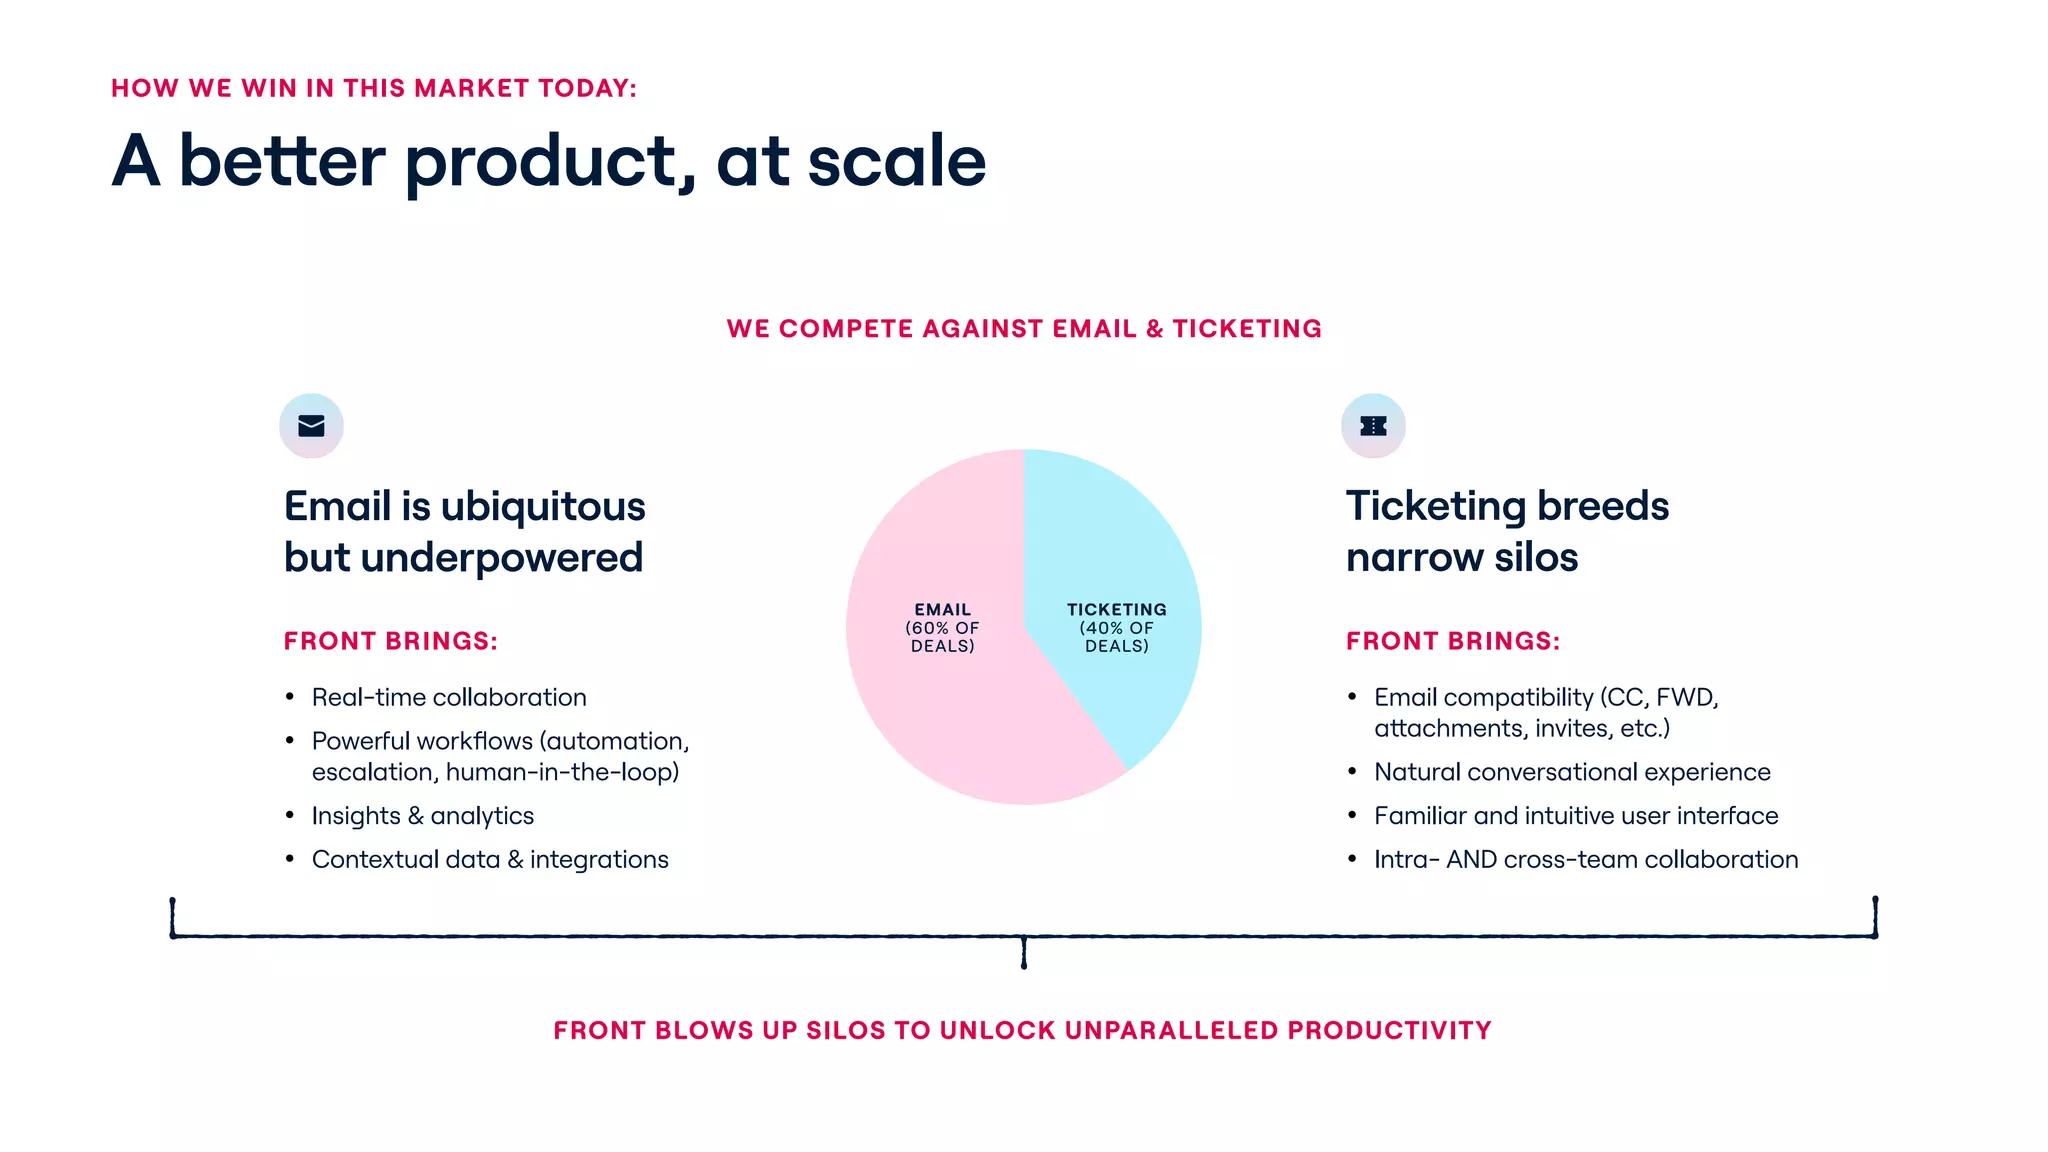
  • Email is ubiquitous but underpowered: Teams rely on email for customer communication but lack real-time collaboration, workflows, and insights
  • Ticketing breeds narrow silos: Support tools isolate customer interactions from sales, success, and other teams, preventing holistic relationship management

Slide 7 (Competitive Positioning) reinforces this:

  • Email lacks: real-time collaboration, powerful workflows (automation, escalation, human-in-the-loop), insights & analytics, contextual data & integrations
  • Ticketing lacks: email compatibility, conversational UX, cross-team collaboration

Slide 6 (Use Cases) demonstrates real-world pain points:

  • Pilot (Professional Services): SLA breaches due to fragmented communication
  • Shopify: Excessive back-and-forth communications reducing efficiency
  • Lydia (Financial Services): Slow response times (13 hours) to customer inquiries
  • Load One (Logistics): Manual quote generation taking 8 minutes per quote

The problem is framed as a workflow efficiency and team alignment challenge rather than a technology infrastructure problem—positioning Front as a productivity tool rather than a replacement for email or ticketing systems.


Solution

Slide 4 (Product Definition) defines Front as “A customer communication hub” with six core capabilities:

  1. Works across all channels: Unifies email, chat, social, and other communication channels in a single interface
  2. Looks like an inbox: Familiar UI reduces adoption friction (leverages email mental model)
  3. Insights at multiple levels: Provides both aggregated team insights and contact-level intelligence
  4. Surrounded by useful context: Right-panel displays customer/account data, conversation history, and relevant metadata
  5. Built for collaboration: Enables team members to collaborate on customer conversations with assignments, mentions, and shared context
  6. All messages are tracked, actionable, and assigned: Ensures accountability and prevents messages from falling through cracks

Slide 7 emphasizes Front’s differentiation:

  • vs. Email: Adds real-time collaboration, powerful workflows, insights, and integrations
  • vs. Ticketing: Maintains email compatibility while enabling cross-team collaboration and conversational UX

The solution is positioned as a bridge between email and ticketing—capturing the ubiquity and familiarity of email while adding the structure and collaboration of ticketing systems.


Market Opportunity

Slide 5 (Market Opportunity Map) presents a 2x2 matrix positioning Front:

Axes:

  • Horizontal: Inbound ↔ Outbound communication
  • Vertical: Low-stakes ↔ High-stakes interactions

Market Segments Identified:

  • Marketing Automation (top-left): High-stakes outbound
  • Sales Tools (top-right): Salescloud, Outreach, etc.
  • Support Tools (bottom-left): Low-stakes inbound
  • Front’s Position (center): High-stakes inbound, expanding to adjacent segments

TAM Data:

  • Core Use Case TAM: $13B (referenced in Slide 2)
  • Deal Split: 60% email, 40% ticketing (Slide 7)
  • Growth Drivers: Automation & commoditization of adjacent categories

Assessment of TAM Analysis:
The deck provides a $13B TAM figure but lacks:

  • Breakdown by segment (support, sales, success, etc.)
  • Geographic scope (US-only or global?)
  • Competitive context (what % is addressable vs. captured by Zendesk, Intercom, HubSpot?)
  • Timeline for expansion into adjacent segments (when does Front move from inbound to outbound/sales?)

The “commoditization” growth driver is counterintuitive—typically commoditization shrinks TAM by reducing pricing power, not expanding it.


Business Model

Revenue Model (inferred, not explicitly stated):

  • SaaS subscription based on per-seat pricing (Slide 8 shows “Average Seat Count in Top 50 Customers” growing from ~0 to ~40+ seats, indicating seat-based expansion)
  • Land-and-expand: Customers start with one team (support or sales) and expand to additional teams and seats

Unit Economics (Slide 8):

Metric Value Trend
DAU/MAU 75% ↑ Improving (2018-2021)
GRR% Covered Not specified ↑ Upward through FY22
NRR% Covered 130%+ ↑ Upward through FY22
Net New ARR Growth (YoY) +120% ↑ Accelerating
Avg Seat Count (Top 50 Customers) ~40+ seats ↑ Growing since 2015

Capital Efficiency (Slide 10):

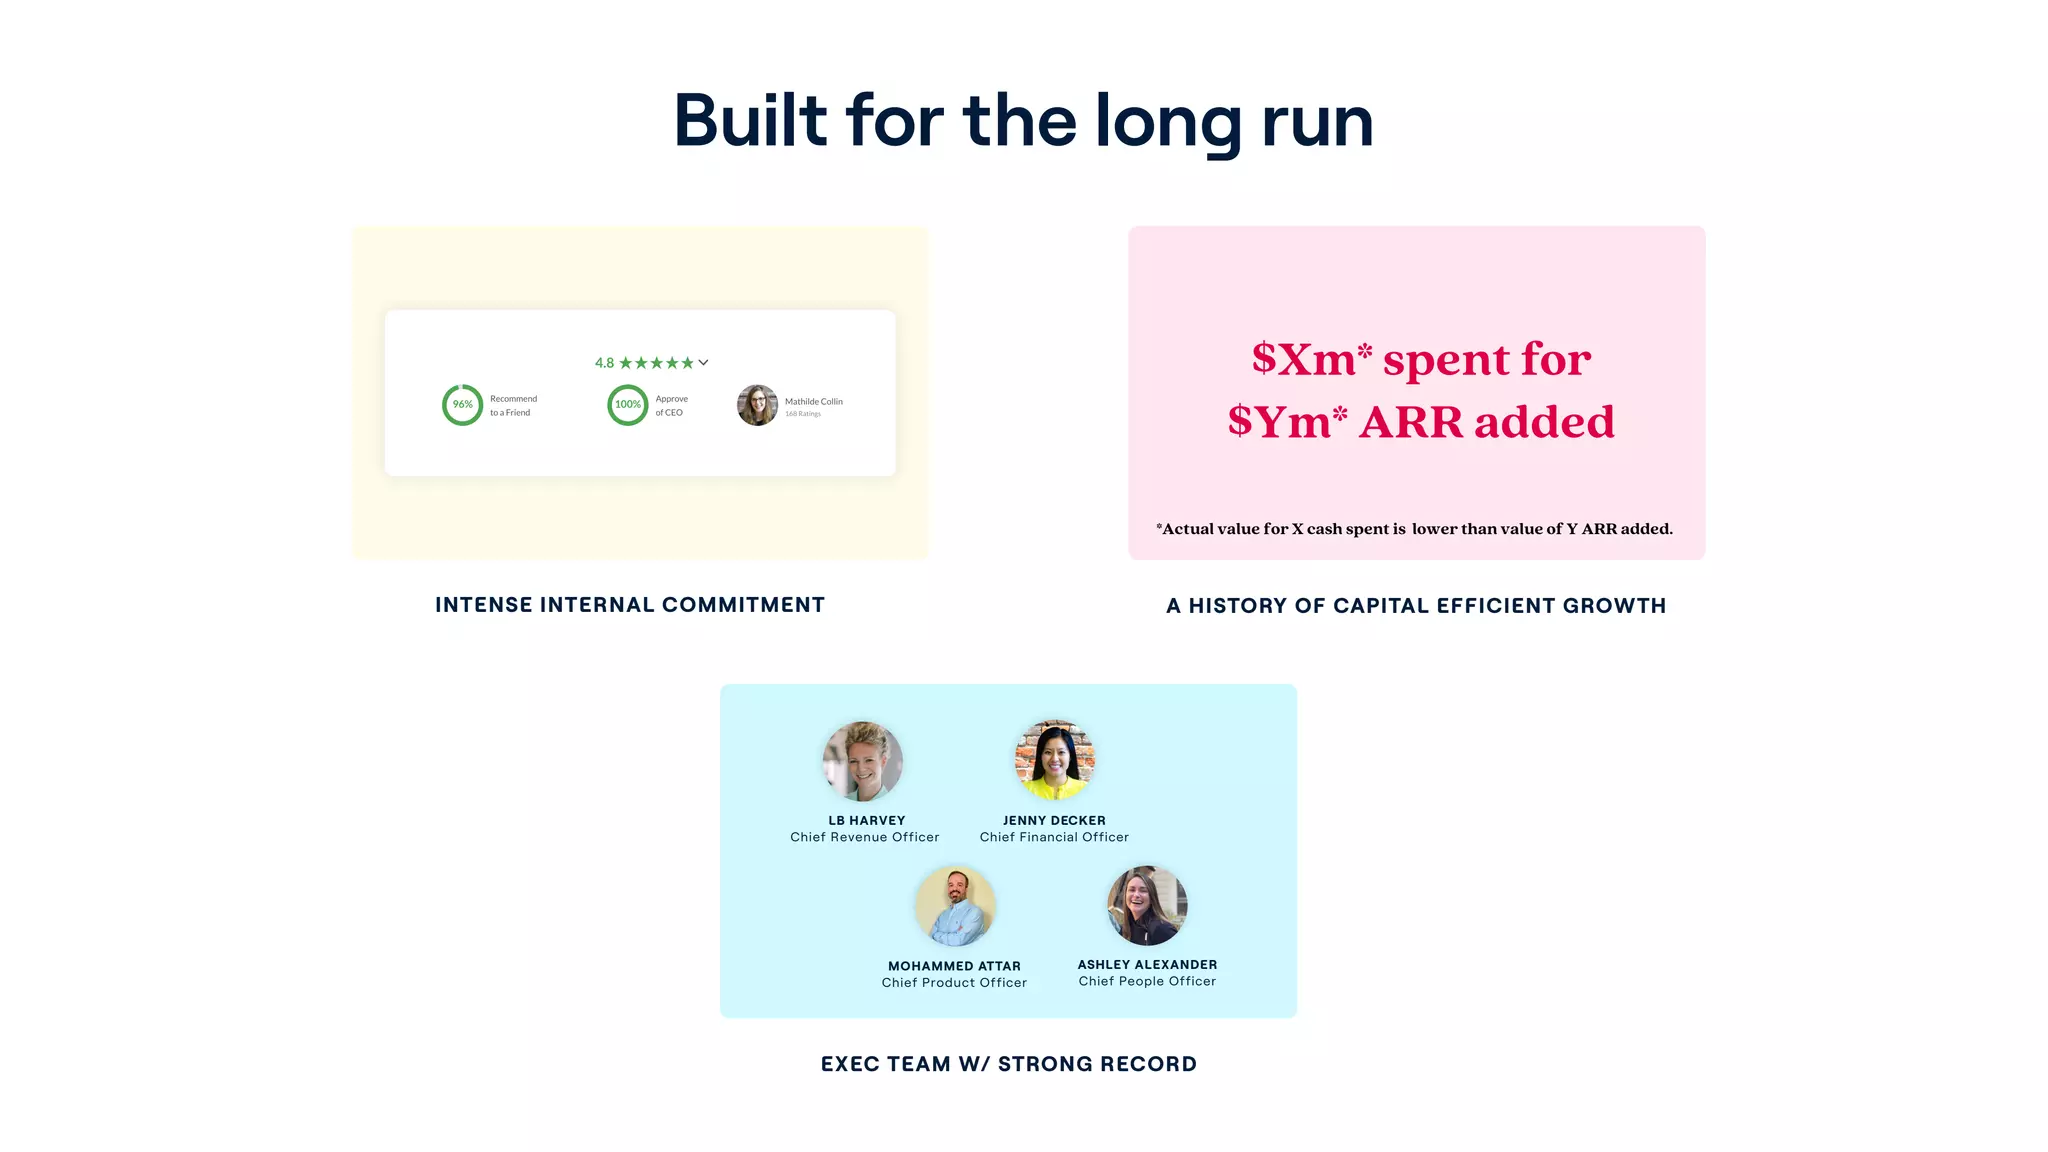
  • “$Xm spent for $Ym ARR added” (specific numbers redacted)
  • Footnote: “Actual value for X cash spent is lower than value of Y ARR added”
  • Interpretation: ARR added exceeds cash spent (favorable ratio), suggesting efficient customer acquisition and expansion

Assessment:

  • 130%+ NRR is exceptional: Indicates strong expansion revenue (upsells, cross-sells) and low churn
  • 75% DAU/MAU is excellent: Shows high engagement for B2B collaboration tool (typical B2B SaaS is 40-60%)
  • +120% NNARR growth is accelerating: New customer acquisition is growing faster than overall ARR
  • Seat count growth validates land-and-expand: Top 50 customers expanding from single-digit to 40+ seats shows successful expansion motion

Traction & Metrics

Slide 2 (Key Numbers):

Metric Value
ARR $M (specific value redacted)
2022 ARR Growth % (specific % redacted)
Revenue Opportunity (Core Use Cases) $13B
Customer Scale 2-6K+ teams of 2-6000+ collaborating
DAU/MAU 75%
Net Retention 130%+

Slide 3 (Customer Validation):

  • Total Customers: 8,000
  • Named Customers: ClickUp, Dropbox, MongoDB, Lyft, Shopify, Cisco, Flexport, Echo, Culture Amp
  • Redacted Customers: Multiple (blurred logos suggest additional high-profile or competitive customers)

Slide 6 (Use Case Outcomes):

Customer Industry Outcome Impact
Pilot Professional Services Collaboration between Account Managers & SMEs 75% reduction in SLA breaches
Shopify B2B Success & Account Management Enable customer success for high-value merchants 10% reduction in back-and-forth communications
Lydia Financial Services Prioritize customer relationships through fast responses Response time 13h → 5h; 70% reply within 1 hour
Load One Logistics Tighten operations, win more RFPs Quote generation 8 min → 1 min

Slide 8 (Growth Metrics):

Metric Period Value
NNARR Growth FY22 vs. FY21 +120% YoY
NNARR by Segment FY21-FY23 Enterprise, Mid-Market, Small Business, Emerging all growing
Seat Count Growth Q2 2015 - Q2 2022 ~0 → ~40+ seats in top 50 customers

Assessment:

  • 8,000 customers is substantial scale for a Series D company
  • Customer quality is high: Mix of recognizable brands (Shopify, Dropbox, Lyft, Cisco) validates product-market fit
  • Quantified outcomes are concrete: 75% SLA reduction, 13h → 5h response time, 8 min → 1 min quote generation show real business impact
  • +120% NNARR growth is accelerating: Suggests improving sales efficiency and/or expanding TAM
  • Seat count growth validates expansion: Land-and-expand motion is working

Red Flag: Specific ARR and growth percentages are redacted, making it impossible to assess absolute performance or compare to industry benchmarks.


Competitive Positioning

Slide 7 (How We Win) frames competition as:

Primary Competitors: Email tools + Ticketing systems (not named: Zendesk, Intercom, HubSpot)

Deal Split: 60% email, 40% ticketing

Differentiation vs. Email:

  • Problem: Email is ubiquitous but underpowered
  • Front’s Solution:
    • Real-time collaboration
    • Powerful workflows (automation, escalation, human-in-the-loop)
    • Insights & analytics
    • Contextual data & integrations

Differentiation vs. Ticketing:

  • Problem: Ticketing breeds narrow silos
  • Front’s Solution:
    • Email compatibility (CC, FWD, attachments, invites)
    • Natural conversational experience
    • Familiar and intuitive user interface
    • Intra- AND cross-team collaboration

Positioning Statement: “Front blows up silos to unlock unparalleled productivity”

Market Position (Slide 5): “High-stakes inbound first-mover” with expansion into adjacent segments (outbound, sales, marketing)

Assessment:

Strengths:

  • Clear problem-solution mapping
  • Specific feature differentiation
  • Acknowledges actual competitors (email + ticketing) rather than naming non-competitors
  • “First-mover in high-stakes inbound” is a defensible niche

Weaknesses:

  • Doesn’t name major competitors: Zendesk, Intercom, HubSpot are the real threats, but deck avoids naming them
  • Competitive moat is unclear: Why can’t Zendesk or Intercom copy Front’s approach?
  • Oversimplifies competition: Treats email and ticketing as separate competitors, but integrated platforms (Zendesk, Intercom) serve both
  • No win rate data: Doesn’t show how often Front wins in competitive deals
  • Expansion risk: Moving into outbound/sales puts Front in direct competition with Salesforce, HubSpot, Outreach—much larger, entrenched players

Team

Executive Leadership (Slide 10):

Role Name Background
Chief Revenue Officer LB Harvey (Not provided)
Chief Financial Officer Jenny Decker (Not provided)
Chief Product Officer Mohammed Attar (Not provided)
Chief People Officer Ashley Alexander (Not provided)

Culture Metrics (Slide 10):

  • Recommend to a Friend: 96%
  • Approve of CEO: 100%
  • Overall Rating: 4.8 stars

Assessment:

Strengths:

  • Balanced functional expertise: CRO (revenue), CFO (finance), CPO (product), CPO (people) covers all critical functions
  • Exceptional culture metrics: 96% recommendation rate and 100% CEO approval are outstanding
  • Mature leadership team: Presence of CFO and CPO suggests experienced operators

Weaknesses:

  • Missing CEO/Founder: Unusual for Series D pitch to omit founder story and CEO credentials
  • No background context: Deck doesn’t provide prior experience, track record, or where they came from
  • Limited team scope: Only shows 4 executives; doesn’t mention company size, engineering depth, or board composition
  • No board representation: Doesn’t mention board members or investor involvement
  • Testimonial source unclear: 4.8 stars from where? (G2? Glassdoor? Internal survey?)

Go-to-Market Strategy

Implied GTM Model (inferred from use cases and customer data):

Customer Segments:

  • Professional Services (Pilot)
  • B2B Success & Account Management (Shopify)
  • Financial Services (Lydia)
  • Logistics (Load One)
  • Plus: Tech companies (ClickUp, Dropbox, MongoDB), Ride-sharing (Lyft), E-commerce (Shopify), Networking (Cisco), Logistics (Flexport, Load One)

Sales Motion (inferred):

  • Land: Sell to one team (support, sales, or success) within a customer
  • Expand: Grow seat count and expand to adjacent teams within same customer
  • Evidence: Slide 8 shows average seat count in top 50 customers growing from ~0 (2015) to ~40+ (2022)

Distribution Channels (not explicitly stated):

  • Likely direct sales (given enterprise focus and high ACV implied by seat-based pricing)
  • Possibly self-serve/freemium for SMB segment (Slide 8 shows “Small Business” segment growing)

Assessment:

  • Land-and-expand is working: Seat count growth validates expansion motion
  • Multi-segment approach: Selling across professional services, fintech, logistics, tech shows broad applicability
  • No GTM strategy details provided: Deck doesn’t explain sales process, sales cycle length, CAC, or payback period

The Ask

Slide 1 (Context):

  • Round: Series D
  • Amount: $65M
  • Valuation: $1.7B (implied from context)

Use of Funds (not explicitly stated in deck):
The deck does not detail how the $65M will be allocated. Typical Series D uses include:

  • Sales & marketing expansion
  • Product development (especially for Stage 2/3 vision expansion)
  • International expansion
  • M&A or strategic partnerships
  • Working capital

Assessment:

  • Valuation context: $1.7B valuation at Series D suggests strong investor demand and confidence in growth trajectory
  • Missing detail: Deck doesn’t explain use of funds, which is typically a critical part of Series D pitch

Investor Deep Dive

Executive summary, strengths & red flags

Executive Summary

Front's Series D pitch deck presents a compelling investment case for a customer communication platform that has achieved strong product-market fit across 8,000 customers with exceptional unit economics (130%+ NRR, 75% DAU/MAU). The deck effectively demonstrates how Front has captured the "high-stakes inbound" segment as a first-mover and positions an ambitious three-stage expansion roadmap into broader knowledge worker collaboration. The presentation balances quantified business metrics with customer validation and a strong executive team, though it strategically obscures certain financial details (specific ARR and growth percentages) and lacks depth on competitive defensibility against larger incumbents.

Key Strengths

7 identified

1

Exceptional Unit Economics with Proof of Expansion

- indicates strong expansion revenue and low churn—a critical SaaS metric that signals product-market fit

2

Strong Customer Validation Across Diverse Verticals

- is substantial scale for Series D

3

Clear Competitive Positioning as "Best of Both Worlds"

- Captures ubiquity of email while adding structure of ticketing

4

Ambitious but Grounded Vision with Massive TAM Expansion

- shows long-term thinking: customer-facing teams → all knowledge workers → collaboration platform

5

Exceptional Company Culture

- and are outstanding metrics

6

Capital Efficient Growth

- (with ARR added > cash spent) indicates efficient customer acquisition

7

Visual Design & Presentation Quality

- Pink/navy color scheme, logo placement, typography maintained throughout

Red Flags & Weaknesses

8 identified

1

Vague Financial Metrics Undermine Credibility

- ("$M" instead of actual number)

2

Incomplete Competitive Analysis

- Zendesk, Intercom, HubSpot are the real threats, but deck avoids naming them

3

Missing CEO/Founder Story

- Deck shows 4 executives but omits CEO/Founder

4

Vague Stage 3 Vision

- is abstract and unclear

5

TAM Analysis Lacks Depth

- By segment? By geography? By customer type?

6

Limited Executive Background Context

- Where did LB Harvey, Jenny Decker, Mohammed Attar, Ashley Alexander come from?

7

No GTM Strategy Details

- Deck doesn't explain sales process, sales cycle, or sales team structure

8

Use of Funds Not Specified

- Sales & marketing? Product? International expansion? M&A?

More Pitch Decks To Study

Compare structure, fundraising context, and investor-facing story across similar startup decks.