Compare your deck to Gitpod

Compare Your Deck

Gitpod Pitch Deck (2020)

SaaS
Stage: Seed
Raised: $3M
Year: 2020
Slides: 11
Outcome: Raised $25M Series A (2021)

Pitch Deck

1 / 11
Gitpod pitch deck - The Opening: Clear identity and value proposition
Click to expand

Deck Analysis

This deck presents Gitpod, a 2020 seed-stage company offering "dev environments as code" — cloud-hosted, prebuilt development workspaces that eliminate local setup and waiting time for builds/tests. The presentation quickly establishes a concrete productivity problem for professional dev teams, lays out an automated, repeatable solution (integrating with GitHub/GitLab and using Theia as the IDE), demonstrates try-it-yourself flows and prebuild advantages, and positions Gitpod against incumbents with an open-core go-to-market approach. The deck is notable for pairing a clear developer pain point with product demo cues, technical credibility (open-source Theia), and early traction/monetization thinking.

The Opening: Clear identity and value proposition

The Opening: Clear identity and value proposition

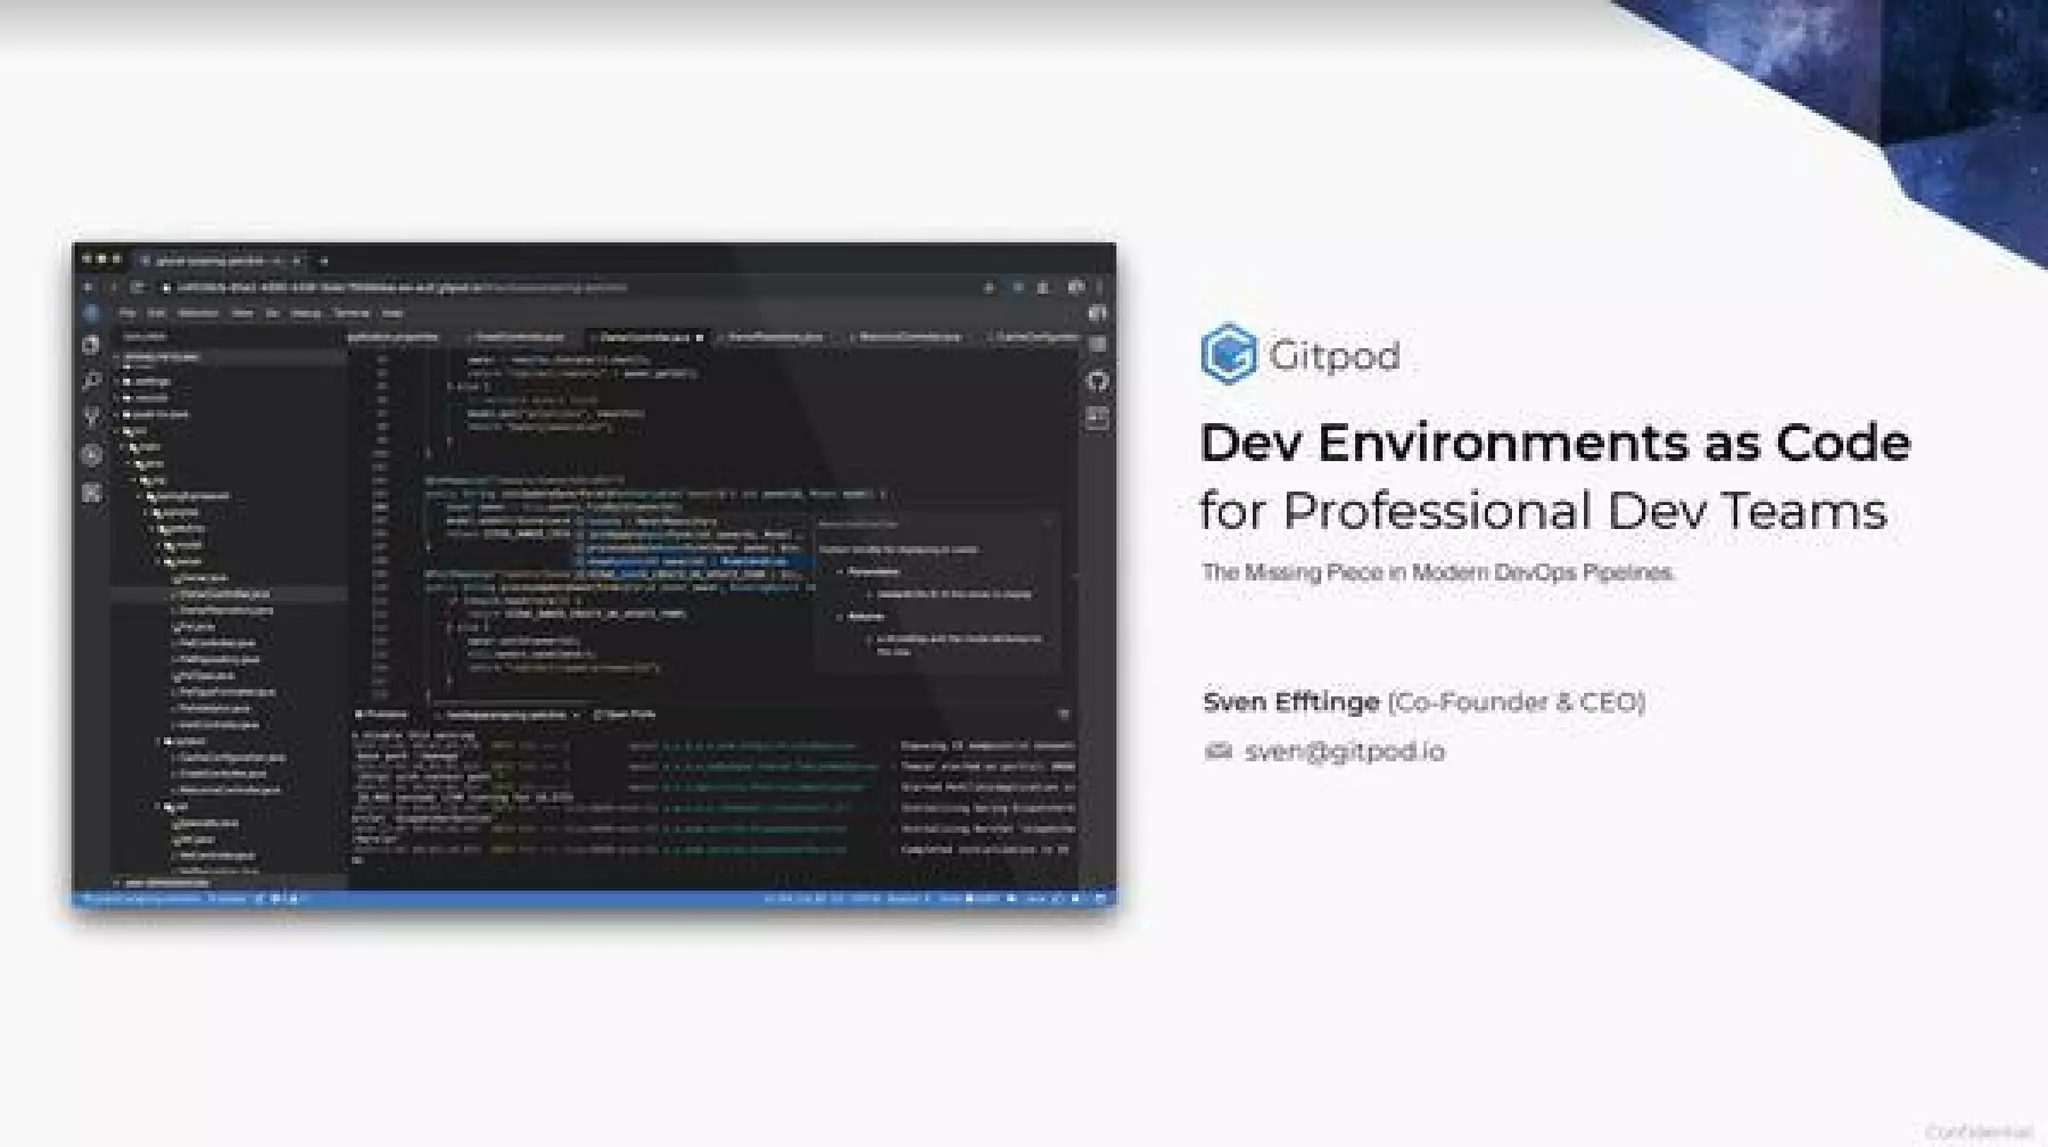
Slide 1 serves as a concise title slide that establishes brand, product positioning, and the founder's credibility (co-founder & CEO named). The visual of an IDE on the left immediately signals the product context (developer workflows), while the title "Dev Environments as Code for Professional Dev Teams" communicates both the technical approach (infrastructure-as-code mindset) and the target customer. For investors and technical buyers, this combination—product + audience + technical framing—sets immediate expectations about the rest of the deck.

Founders can learn from this slide the importance of a single clear positioning statement on the opening slide: who you are building for, what you build, and the unique angle that differentiates you (in this case, treating dev environments as code). The inclusion of the founder and contact in small print builds approachability without distracting from the main message.
Key Takeaway: Open with a one-line product + customer positioning paired with a contextual visual (the product in use) to set immediate expectations.
The Problem: Quantifying developer time loss

The Problem: Quantifying developer time loss

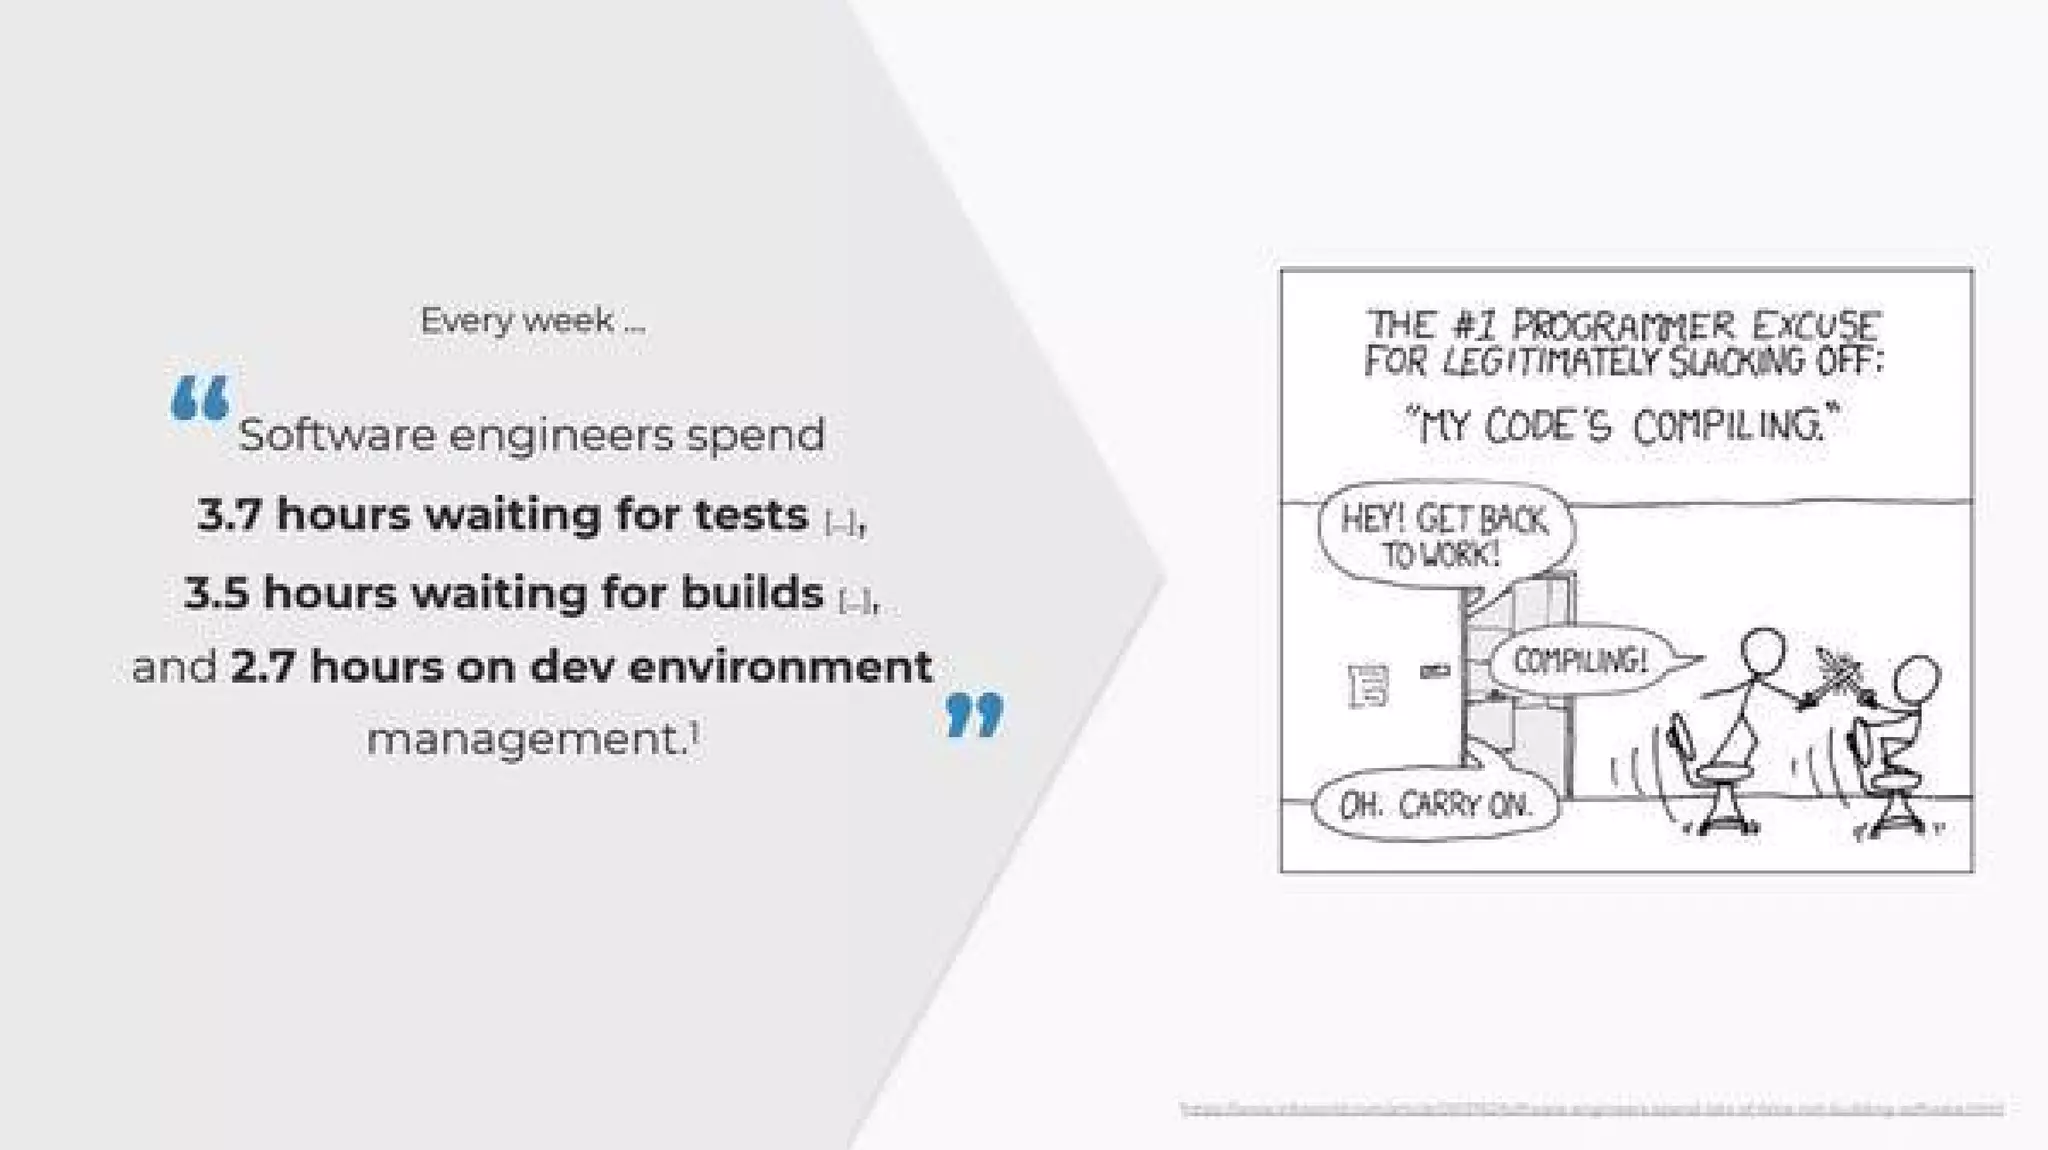
Slide 2 uses hard, relatable metrics to quantify the pain: developers spend multiple hours each week waiting for tests, builds, and environment setup. The slide pairs a bold numeric callout with a humorous xkcd-style comic, balancing seriousness (wasted time) with developer-culture humor. This combination helps the audience both empathize with the issue and believe it is widespread and costly.

The slide is effective because it anchors the problem in time (hours/week), making the ROI of a solution easy to imagine. Founders should note how pairing data with emotional resonance (humor or storytelling) strengthens the problem statement and makes it memorable for investors and users alike.

Key Takeaway: Quantify the customer pain with concrete metrics and pair them with a culturally resonant visual to make the problem both convincing and memorable.
User Journey: Showing the friction developers face

User Journey: Showing the friction developers face

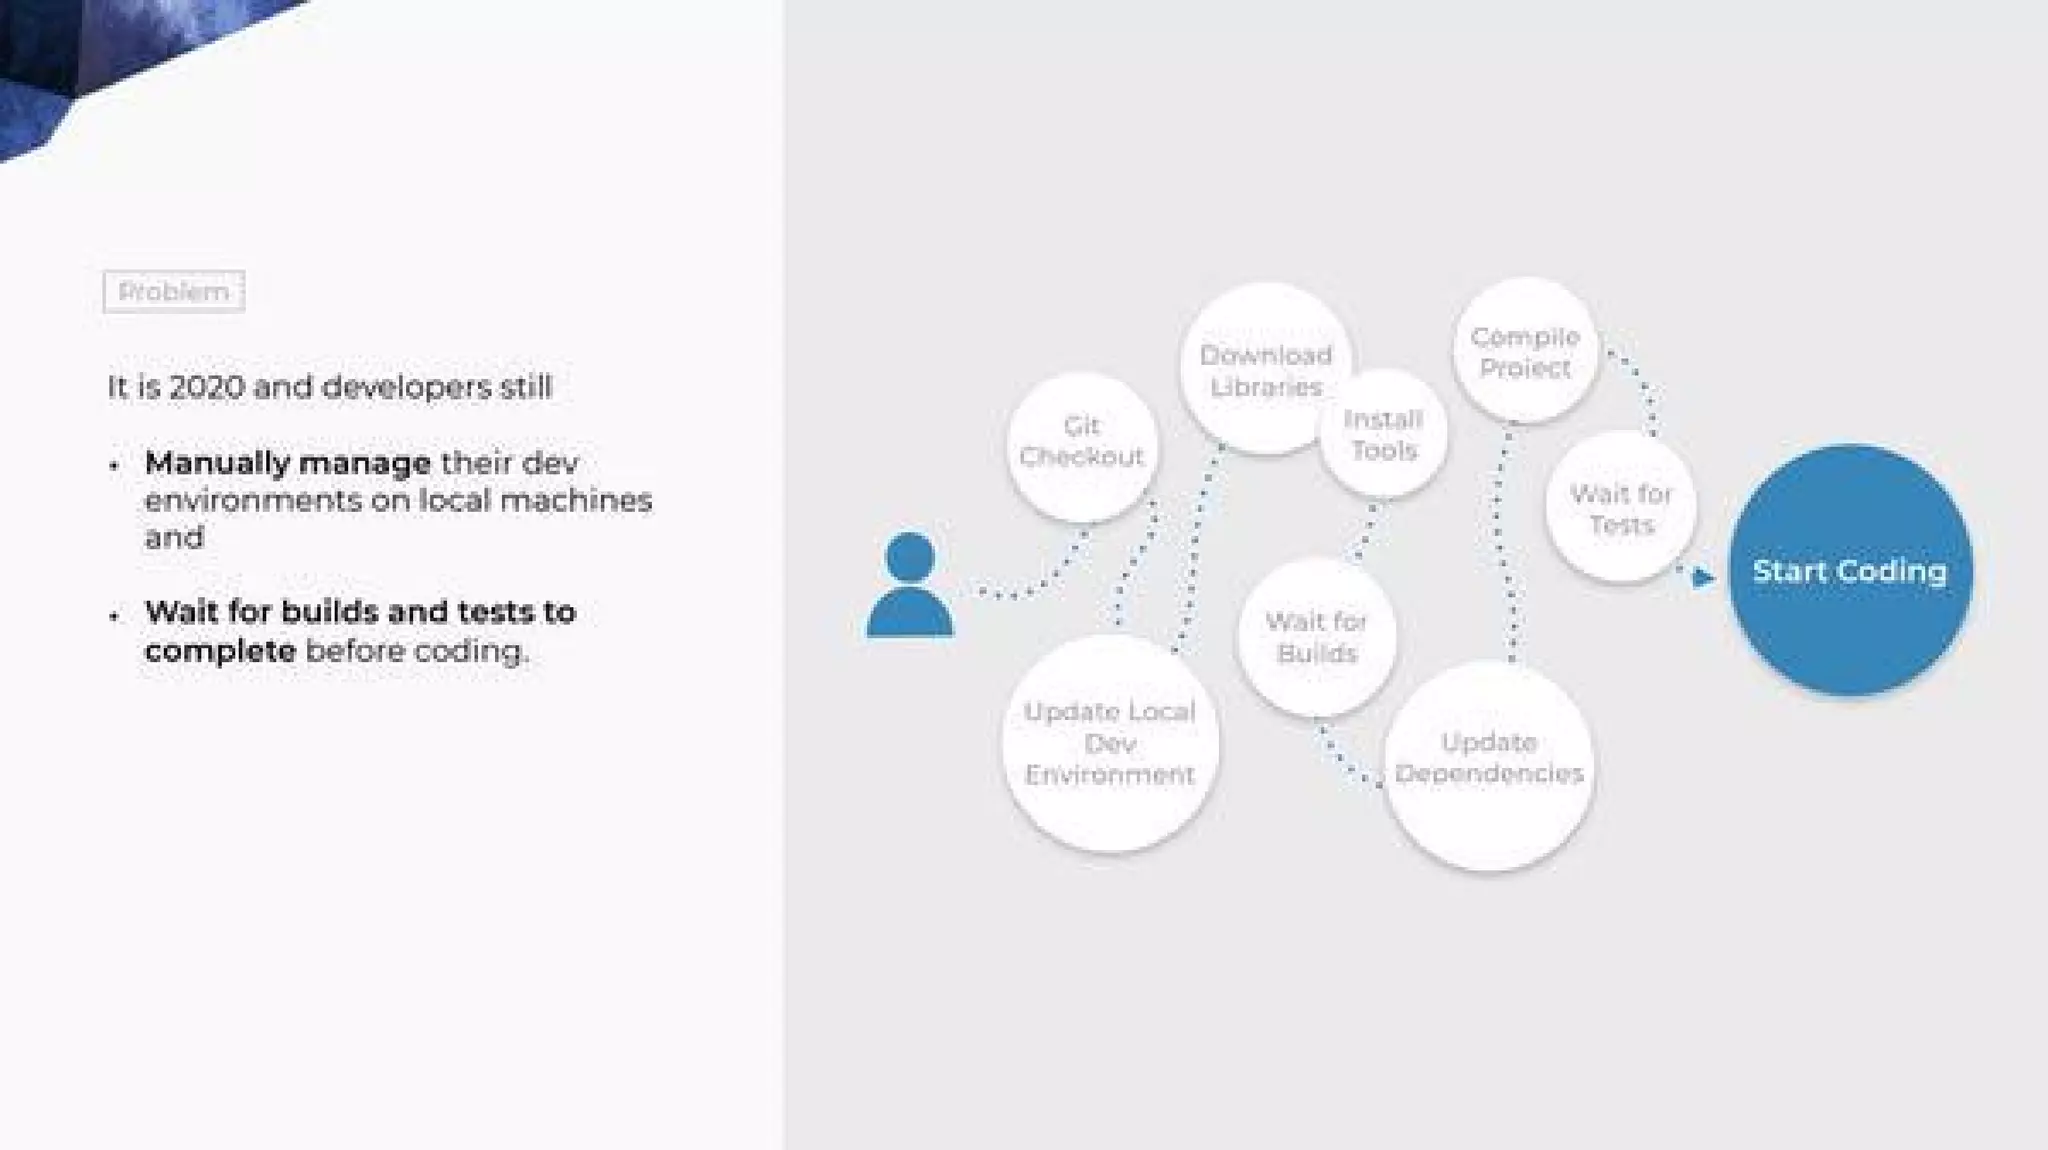
Slide 3 maps the pre-product developer workflow: checkout, download libs, install tools, wait for builds/tests, update local dev env — all before the developer can start coding. Presenting this as a multi-step flow visually communicates both complexity and the multiple failure points that add friction. It's a practical way of showing that the issue is not a single outage but systemic overhead that compounds per developer and per branch.

This section teaches founders to diagram real user workflows to show where their product inserts value. A simple bubble/flow diagram helps quantify the time and cognitive cost developers face, and it primes the audience to appreciate an automated solution. It also helps product and engineering-focused investors quickly reason about technical feasibility and integration points.

Key Takeaway: Map the customer's end-to-end workflow to highlight cumulative friction points where your product delivers measurable value.
The Solution: Automate and describe dev environments as code

The Solution: Automate and describe dev environments as code

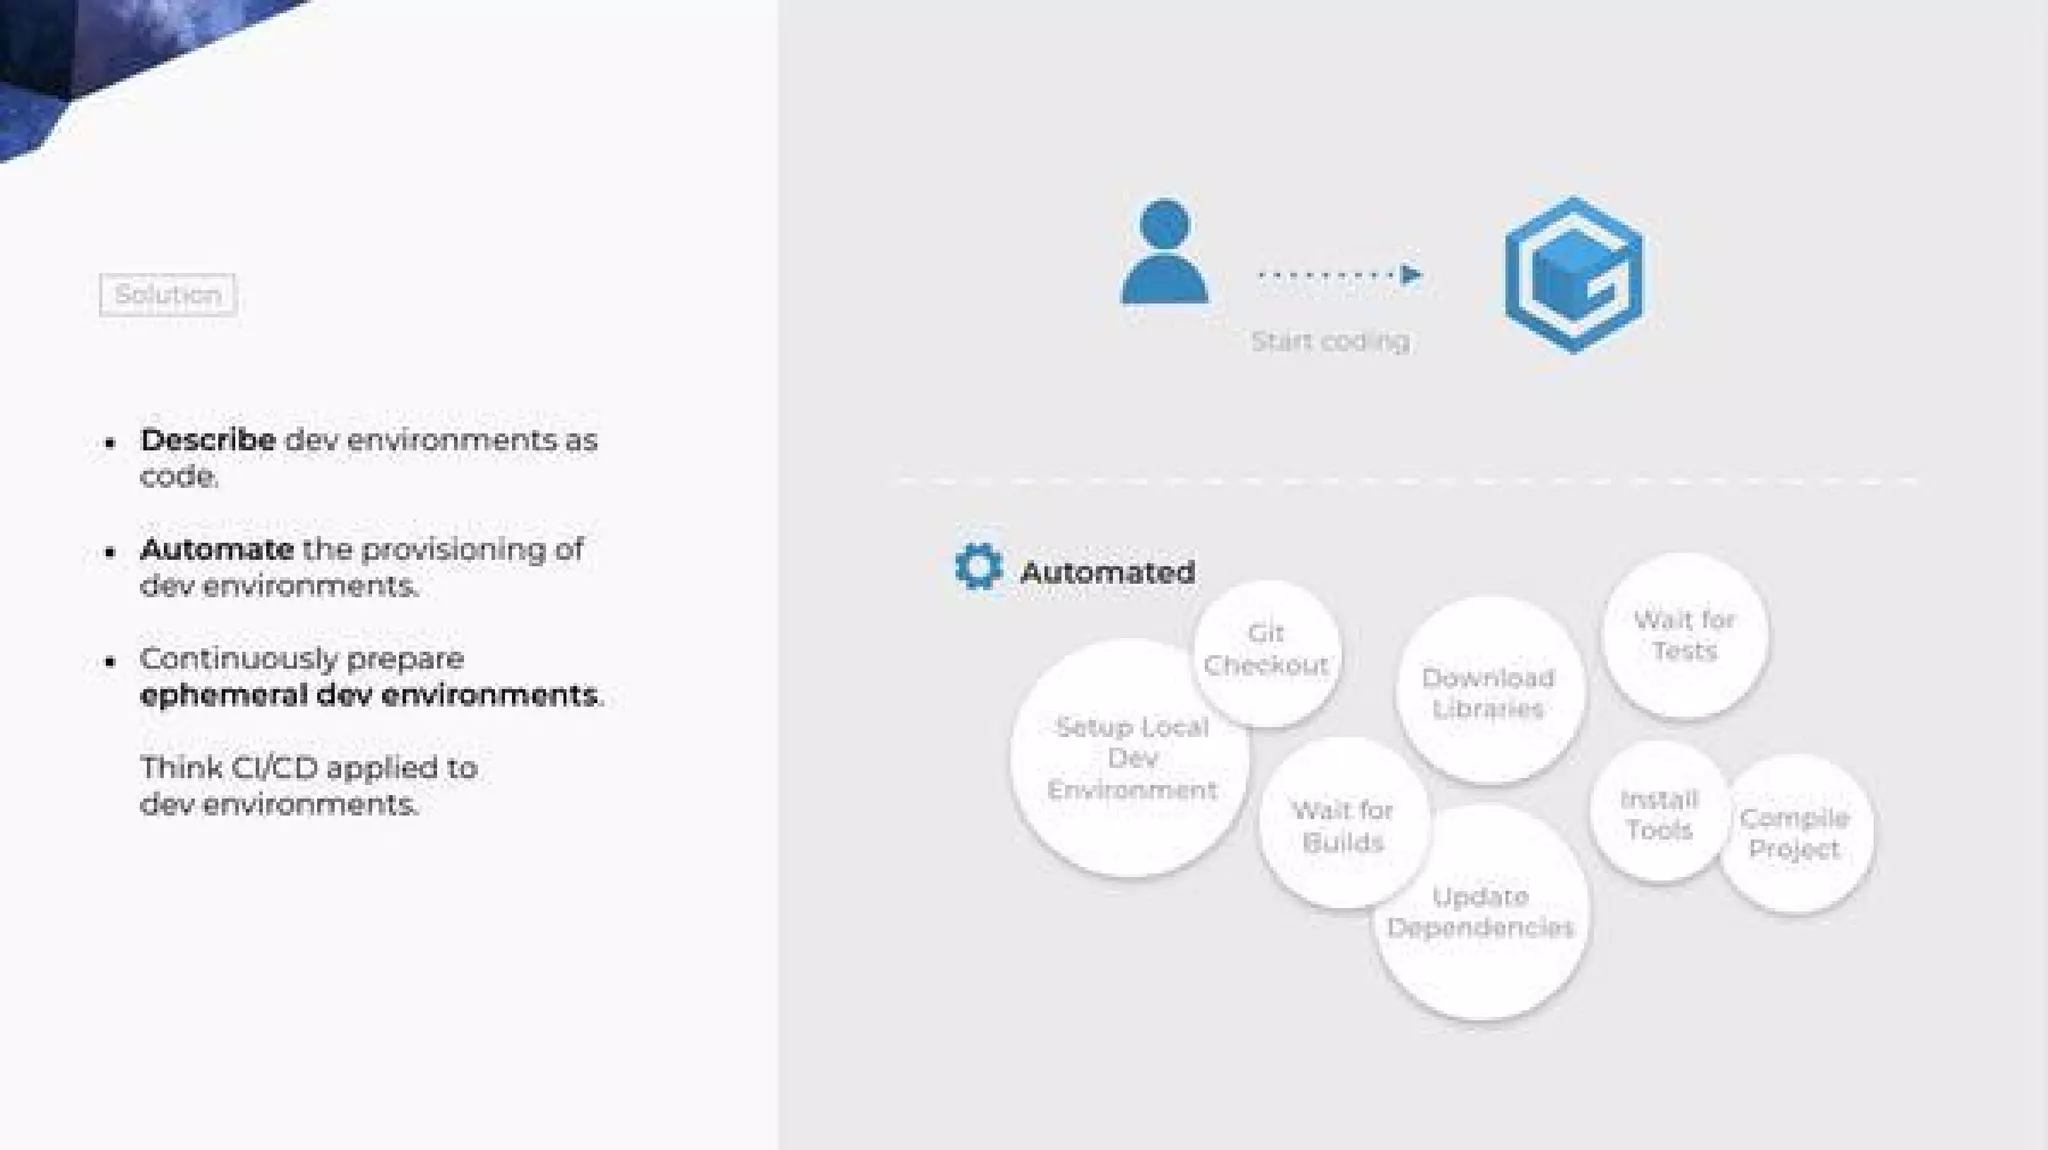
Slide 4 presents Gitpod's solution: describe dev environments as code, automate provisioning, and provide ephemeral prebuilt workspaces. The slide contrasts the manual flow with an automated model, using callouts to show the steps Gitpod removes or automates. This makes the value tangible — faster onboarding, fewer local config issues, and CI/CD-like automation for dev environments.

Founders should emulate the clarity here: explain not only WHAT you build (cloud dev environments) but HOW it changes an established workflow (replaces manual setup, shortens time-to-code). Emphasizing ephemeral, reproducible workspaces appeals to both developers (productivity) and engineering managers/DevOps (consistency, security).

Key Takeaway: Describe the technical approach and its direct impact on workflows—show what you remove and what you automate to make the value obvious.
Demo / Try-it-yourself: Removing friction to trial

Demo / Try-it-yourself: Removing friction to trial

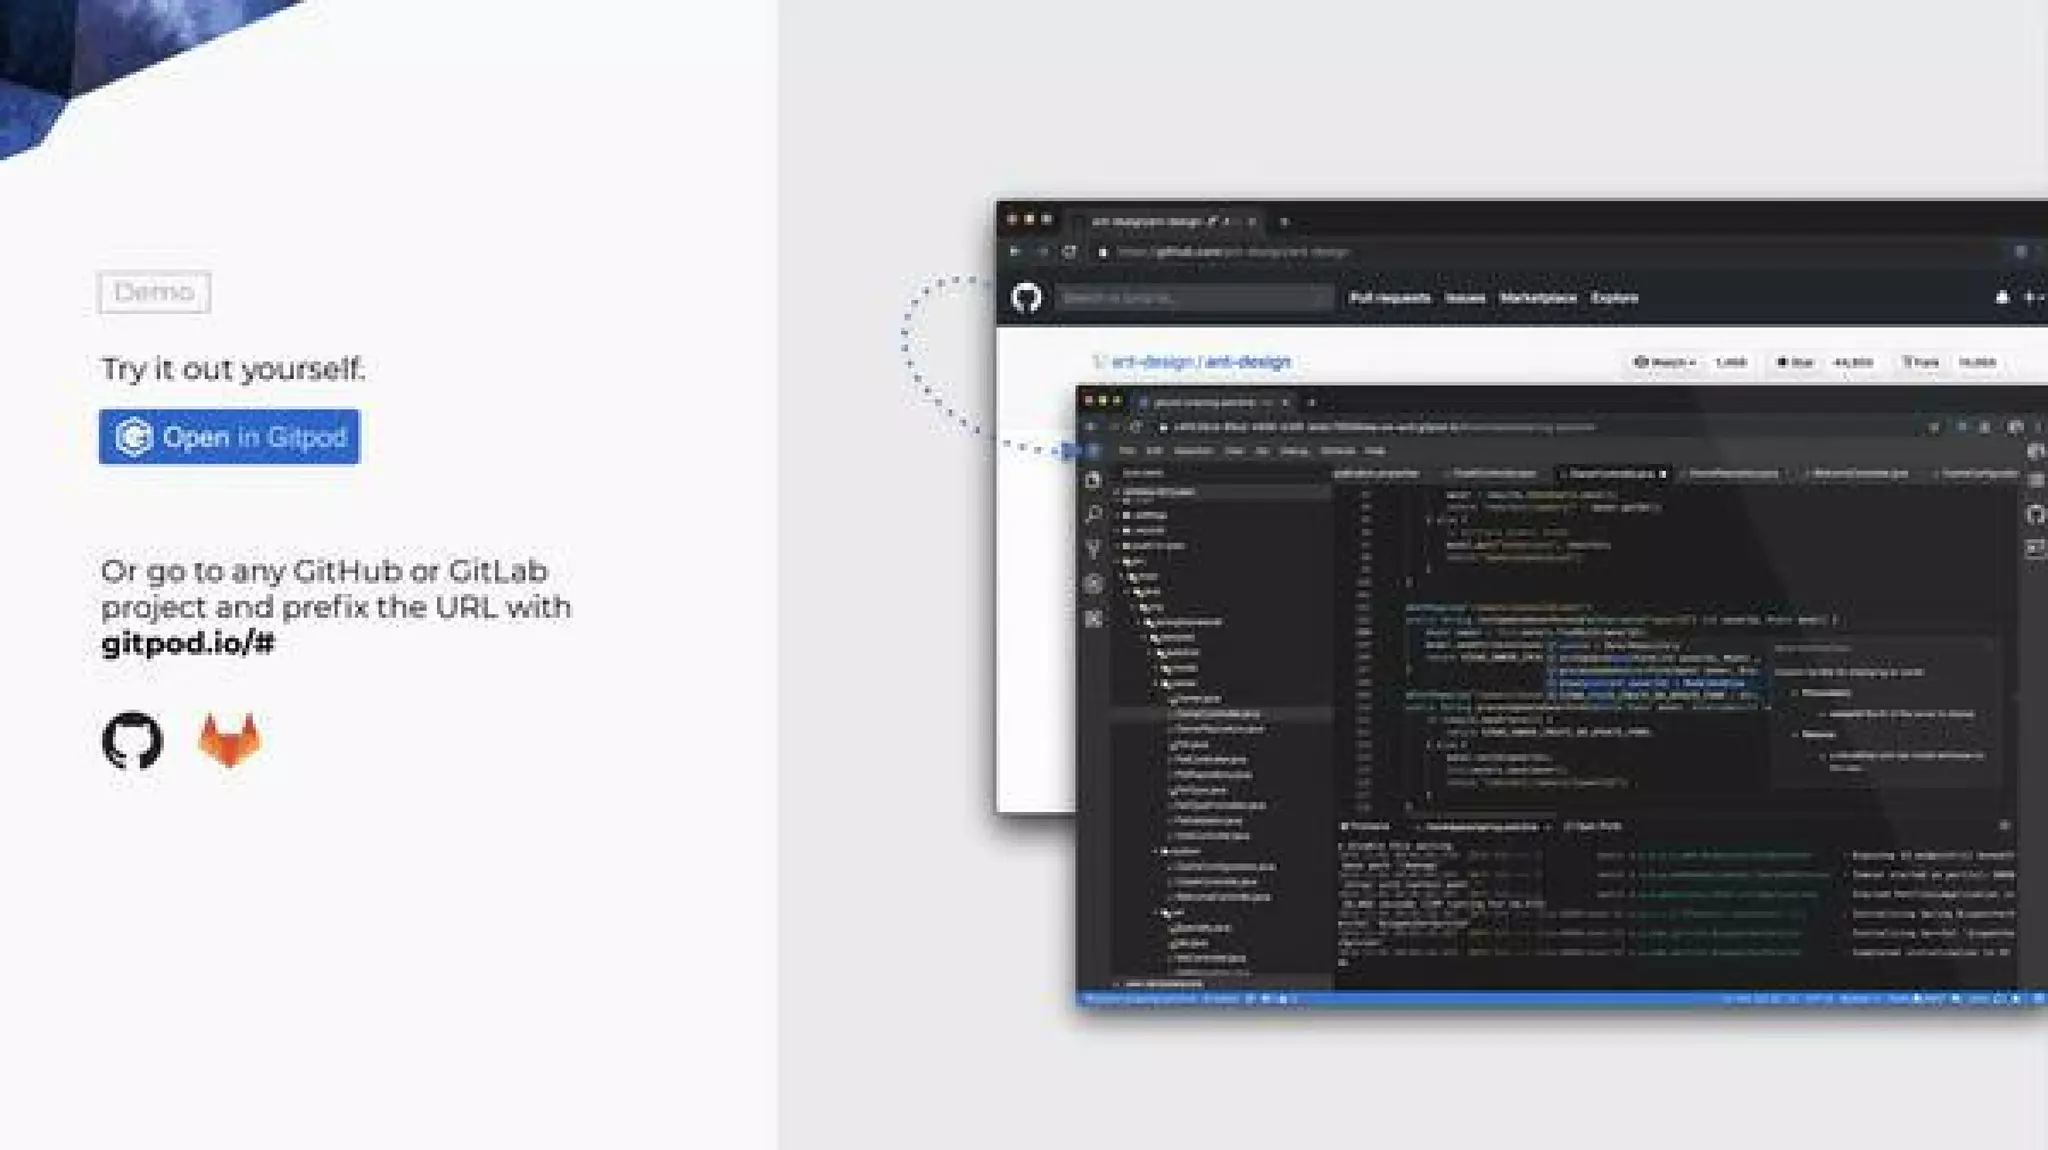
Slide 5 is a demo/CTA slide that invites viewers to "Try it out yourself" with an "Open in Gitpod" button and instructions for prefixing GitHub/GitLab URLs. This lowers the barrier to adoption and demonstrates confidence: the product is accessible and instantly usable. By enabling frictionless hands-on experience, the company accelerates user acquisition and shortens the feedback loop.

The takeaway for founders is to include a clear, low-friction path to a product demo in the deck and to make that path as simple as one click or a single URL change. For developer tools, interactivity and immediate gratification (open a workspace in seconds) can be orders-of-magnitude more persuasive than slides alone.

Key Takeaway: Make trialing the product trivial—one-click demos or simple URL hooks convert curiosity into hands-on usage quickly.
Competition & Positioning: Showing the landscape and differentiators

Competition & Positioning: Showing the landscape and differentiators

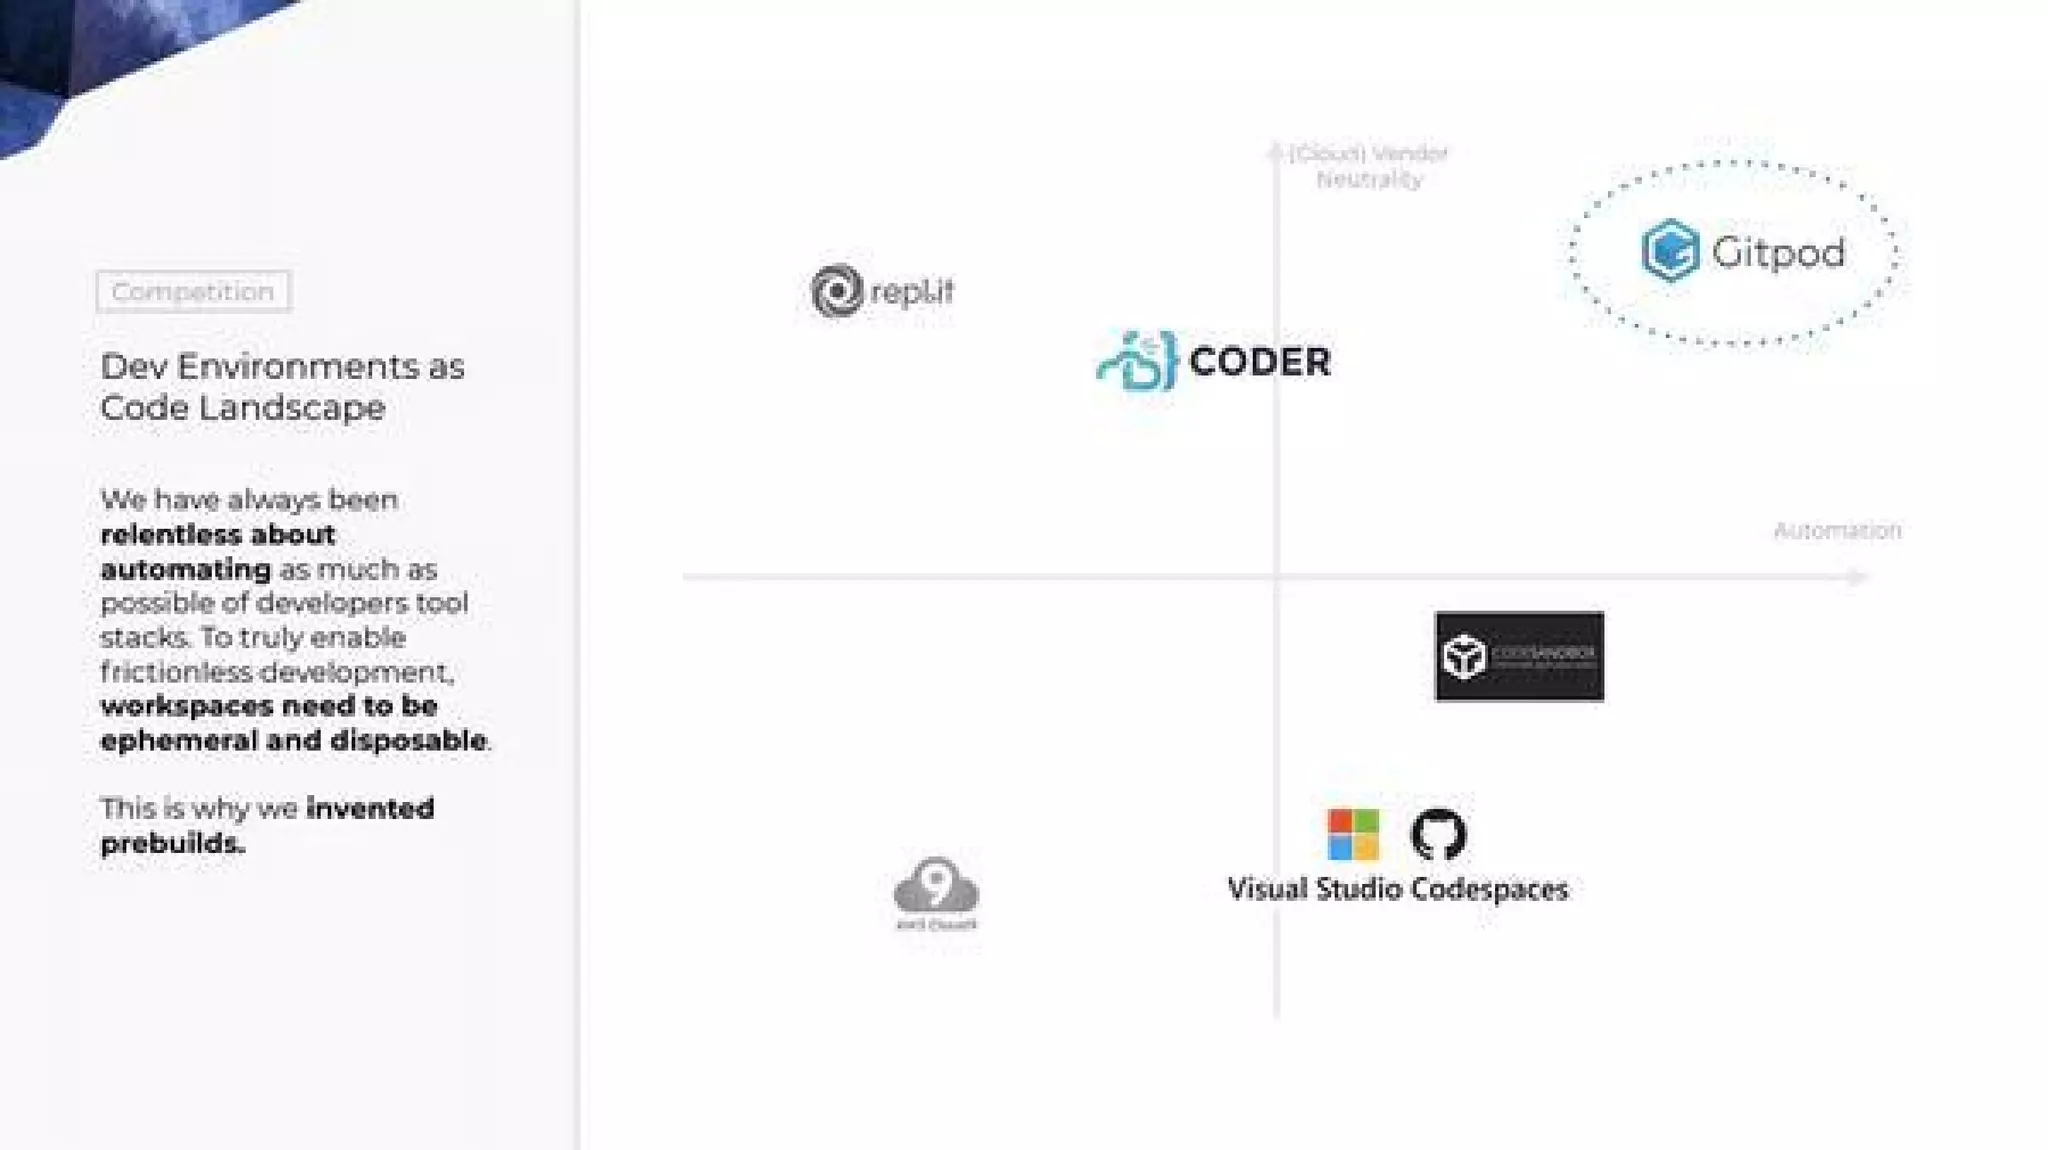
Slide 9 (Dev Environments as Code Landscape) positions Gitpod in a quadrant of automation vs. vendor neutrality, placing Gitpod in the high-automation, vendor-neutral corner. Logos of competitors (Codespaces, Repl.it, etc.) are arranged to show Gitpod's relative strengths: automation/prebuilds and open approach. This visual communicates market awareness and helps investors quickly understand defensibility and differentiation.

Founders should emulate this approach by honestly mapping competitors, articulating where they sit on relevant axes, and demonstrating a clear, defensible niche. The slide pairs product positioning with a strategic message (prebuilds, ephemeral workspaces) that explains why Gitpod isn't just another cloud IDE but a distinct technical and GTM play.

Key Takeaway: Use a simple competitive map to show where you win and why — pick axes that reflect buyer priorities (e.g., automation, neutrality, scale).
Traction & Team: Credibility through growth and founders

Traction & Team: Credibility through growth and founders

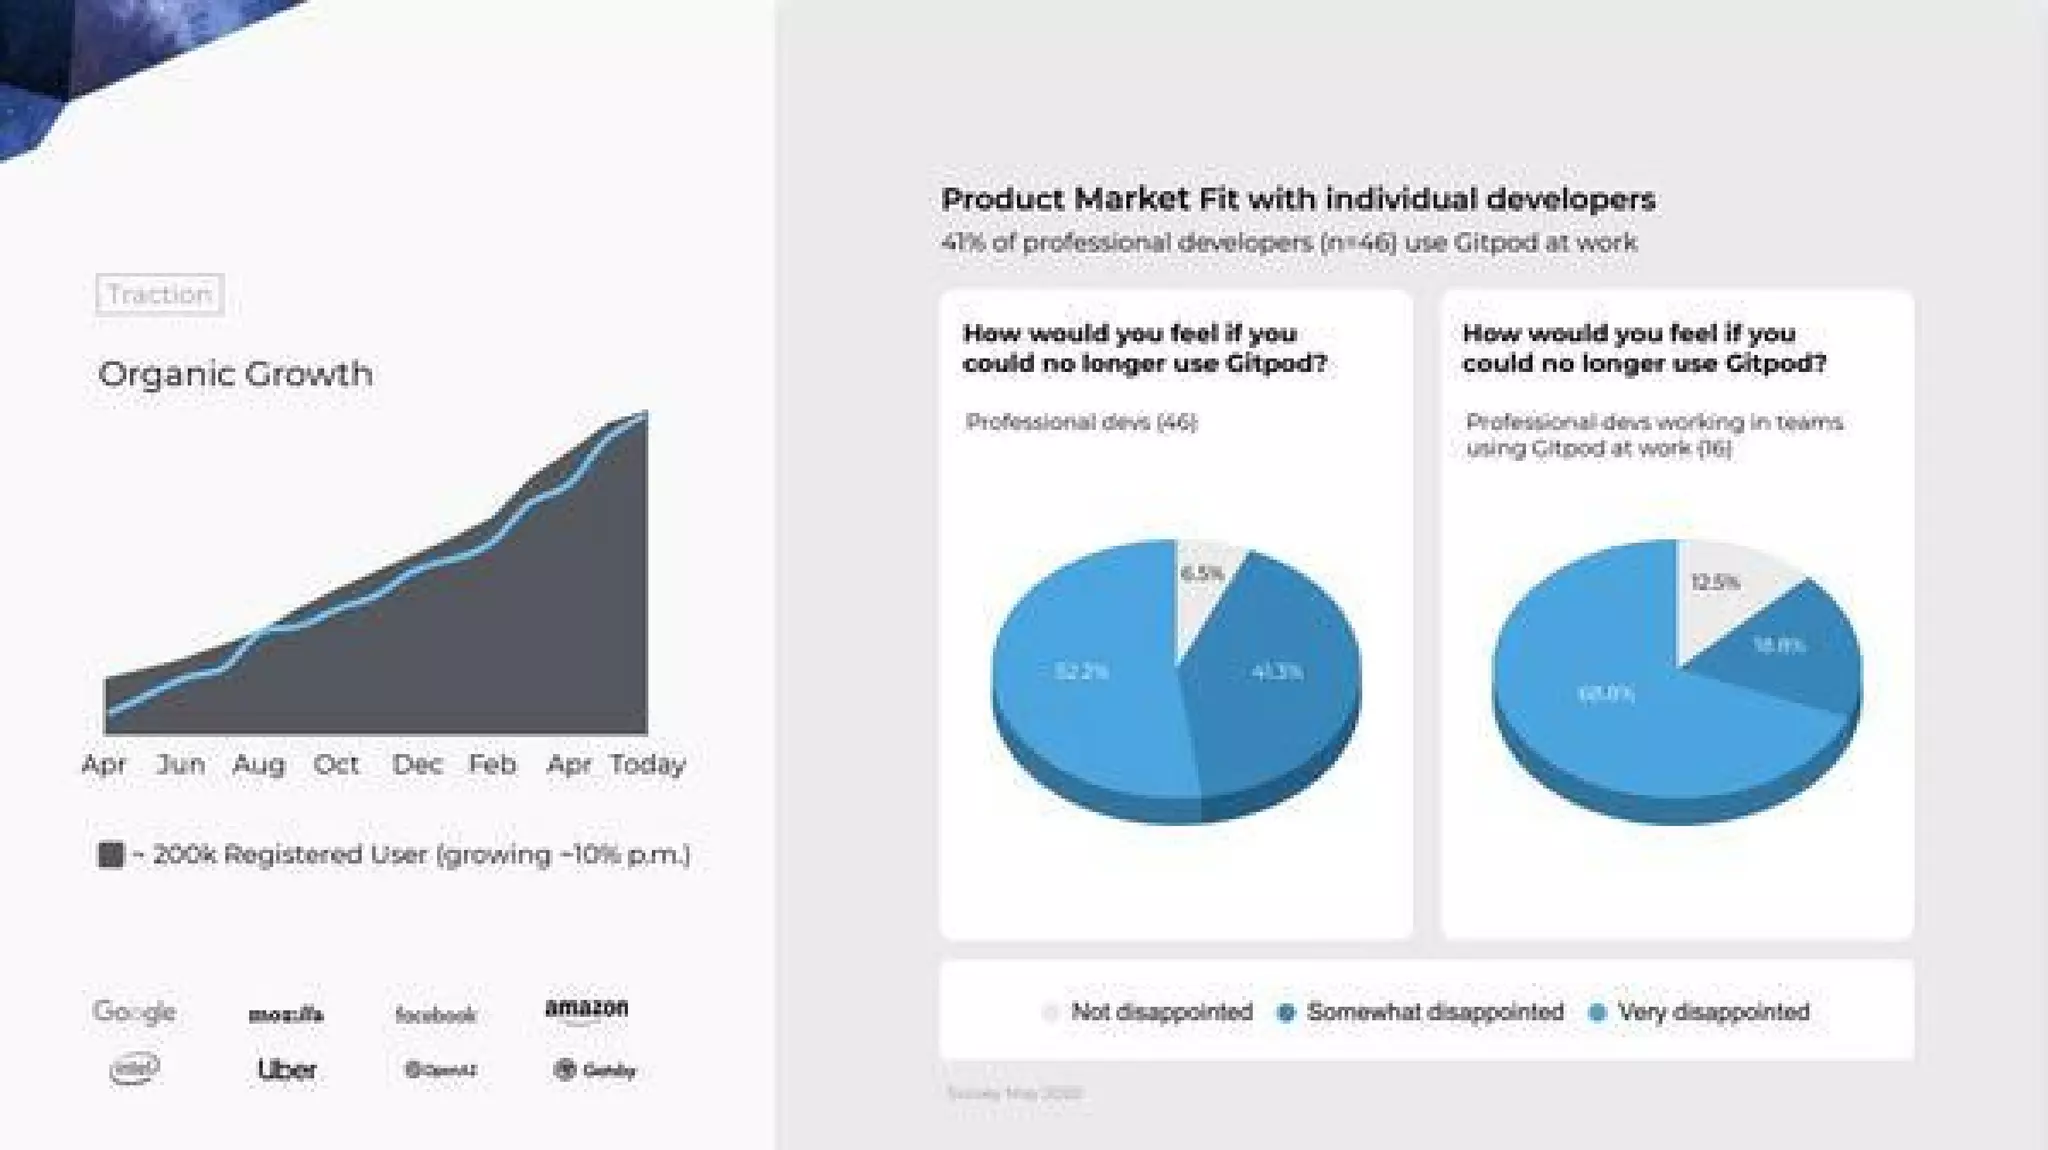
Slide 10 lays out organic growth and user metrics (registered users graph) and NPS-style pie charts on how disappointed users would be if the product disappeared — a proxy for product-market fit. The inclusion of recognizable customer logos at the bottom further validates enterprise relevance. Slide 11 complements this with the founding team's experience building development tools and open-source projects, reinforcing technical credibility.

Together these slides balance quantitative traction with qualitative credibility. For founders, the lesson is to combine user-growth charts with signals of stickiness (surveys, customer logos) and to highlight team pedigree when the product is technically sophisticated. Investors look for both repeatable growth and founders who can execute in complex technical domains.

Key Takeaway: Pair growth and retention signals with team technical credibility to convince investors you can scale and execute on a complex, developer-focused product.

Conclusion: Key Lessons

Gitpod's deck is a strong example of how to sell a developer infrastructure product: open with crisp positioning, quantify the developer pain, diagram the existing workflow, then show precisely how automation replaces friction. The deck blends technical depth (prebuilds, open-source Theia integration) with practical GTM elements (try-it links, open-core model, competitor map) and credible traction & team signals. For founders, actionable advice is to lead with a measurable problem statement, provide an immediate trial that demonstrates the core value, map competitors honestly, and showcase team and usage signals that validate both product-market fit and technical execution capability.

Full Deck Analysis

11 sections

Overview

Company: Gitpod
Round: Seed ($3M)
Year: 2020
Outcome: Raised $25M Series A (2021)

Executive Summary

Gitpod’s 2020 seed deck presents a tightly focused product-led story: developer environments are slow and brittle; Gitpod automates “dev environments as code” and provides ephemeral, prebuilt workspaces in the cloud. The deck mixes quantified pain (time lost waiting), product/demo evidence, open‑source credibility (Theia), meaningful traction ( ~200k registered users, monthly growth), and a clear go‑to‑market posture (SaaS + self‑hosted open core).

Problem Statement

How the deck articulates the problem:

  • Slide 2 quantifies wasted developer time: “Every week… 3.7 hours waiting for tests, 3.5 hours waiting for builds, and 2.7 hours on dev environment management.” This gives a concrete productivity loss per developer.
  • Slide 3 summarizes the root causes: in 2020 developers still manually manage local dev environments and must wait for builds/tests to complete before coding.
  • Slide 4 and the diagram on Slide 3 emphasize many pre‑coding steps (checkout, download libs, install tools, update local dev environment, wait for builds/tests) that create friction before “Start Coding.”

The deck therefore frames the problem as both measurable (hours lost) and systemic (manual, brittle local workflows).

Solution

How the deck positions the solution:

  • Slide 4: “Describe dev environments as code,” “Automate provisioning,” and “Continuously prepare ephemeral dev environments.” The messaging positions Gitpod as CI/CD applied to dev workspaces.
  • Slide 5: product demonstration — one-click “Open in Gitpod” and workflow note that you can prefix any GitHub/GitLab URL with gitpod.io/# to launch a workspace.
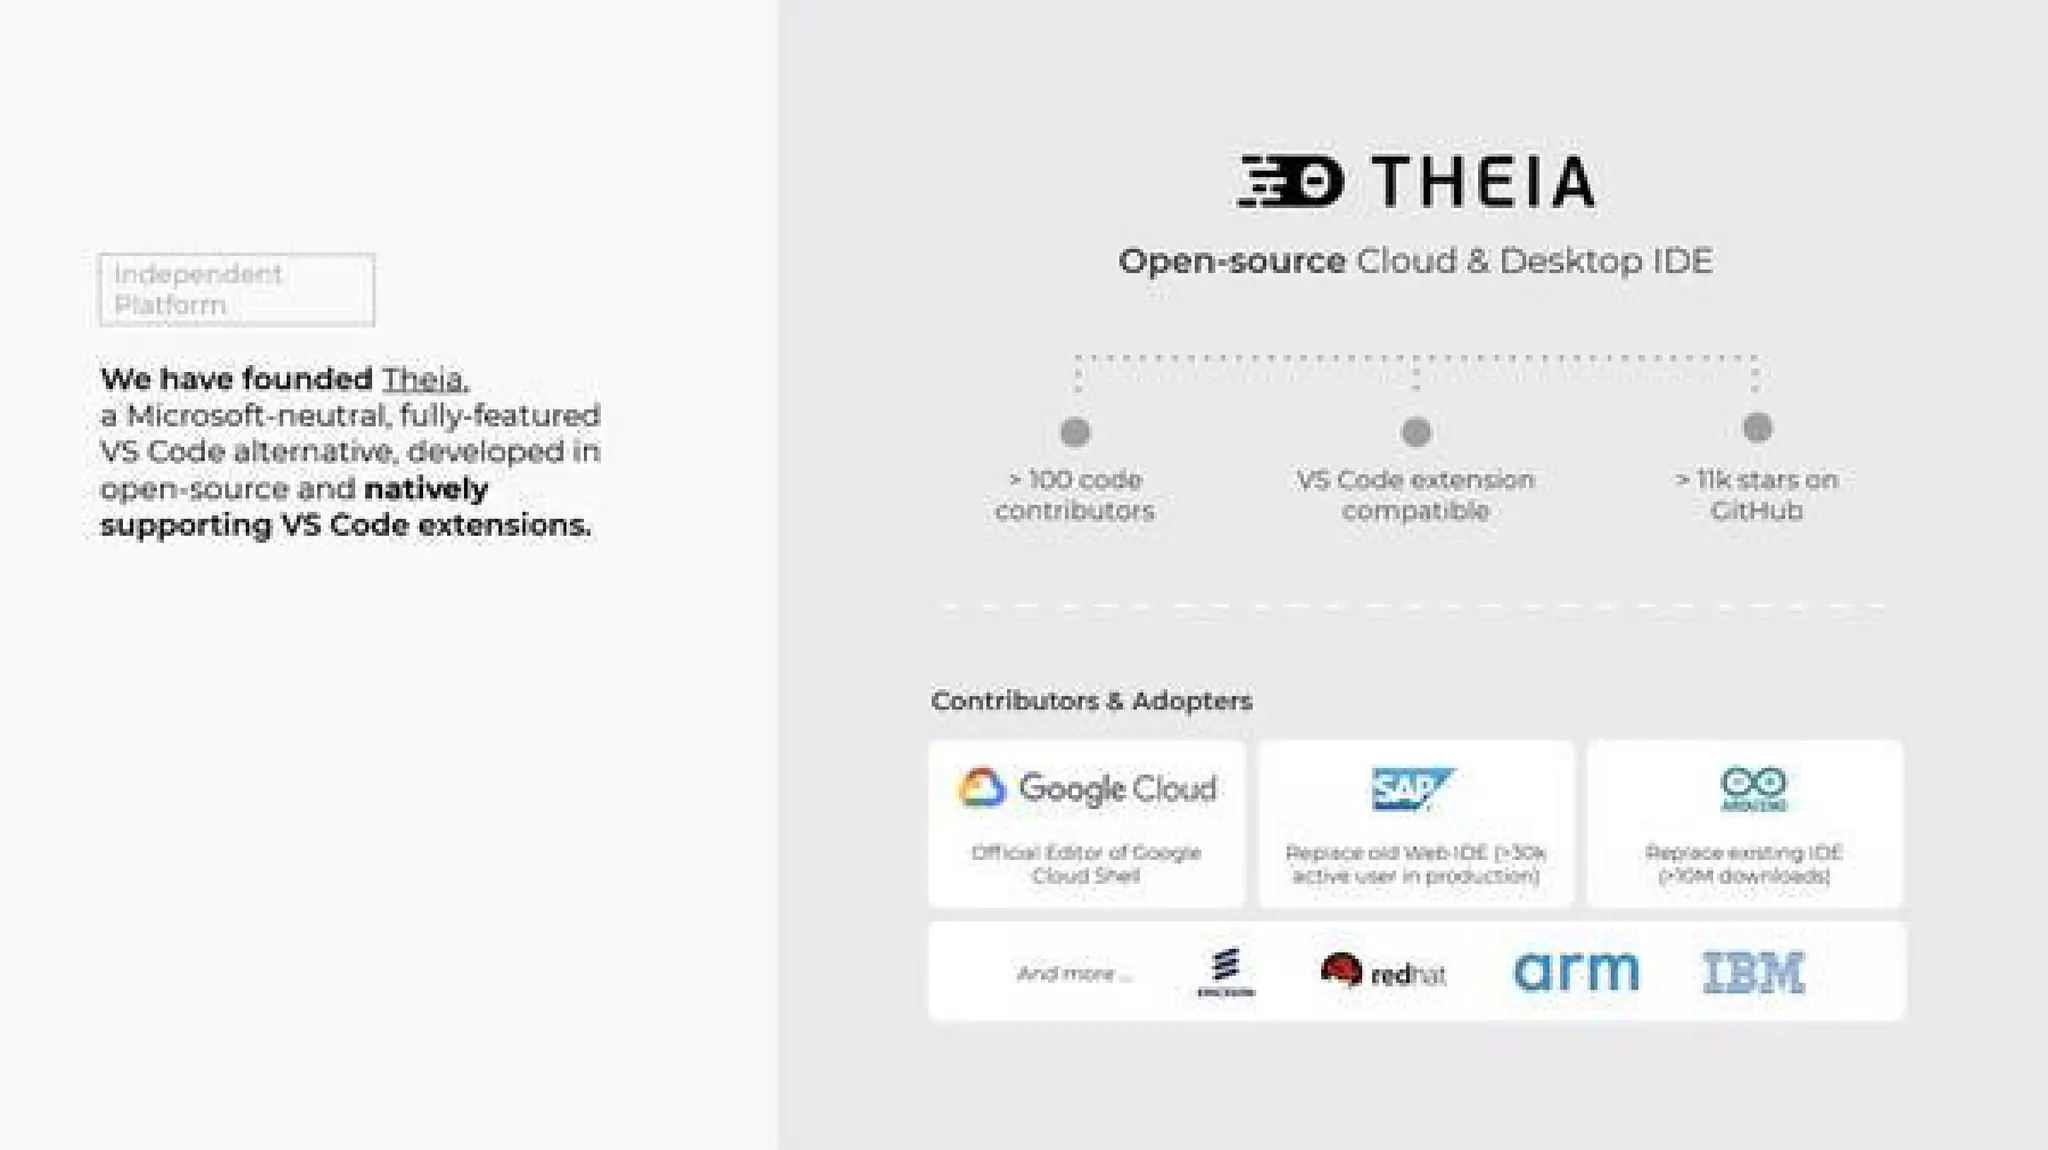
  • Slide 6: technical foundation and independence — they founded Theia (an open source cloud/desktop IDE compatible with VS Code extensions), giving Gitpod deep IDE integration credibility.
  • The solution emphasizes immediate productivity (prebuilt ephemeral workspaces), developer ergonomics (browser IDE), and automation to remove local setup steps.

Market Opportunity

  • The deck does not present explicit TAM/SAM/SOM numerics or dollar estimates.
  • Implicit market signals are used instead: targeting professional software development teams, enterprise adopters (logos / contributors like Google Cloud, SAP, Arduino, Red Hat, ARM, IBM on Slide 6), and the broad developer tooling category.
  • Recommendation: the deck would have benefitted from explicit TAM/SAM/SOM slides (e.g., number of professional developers × ARPU).

Business Model

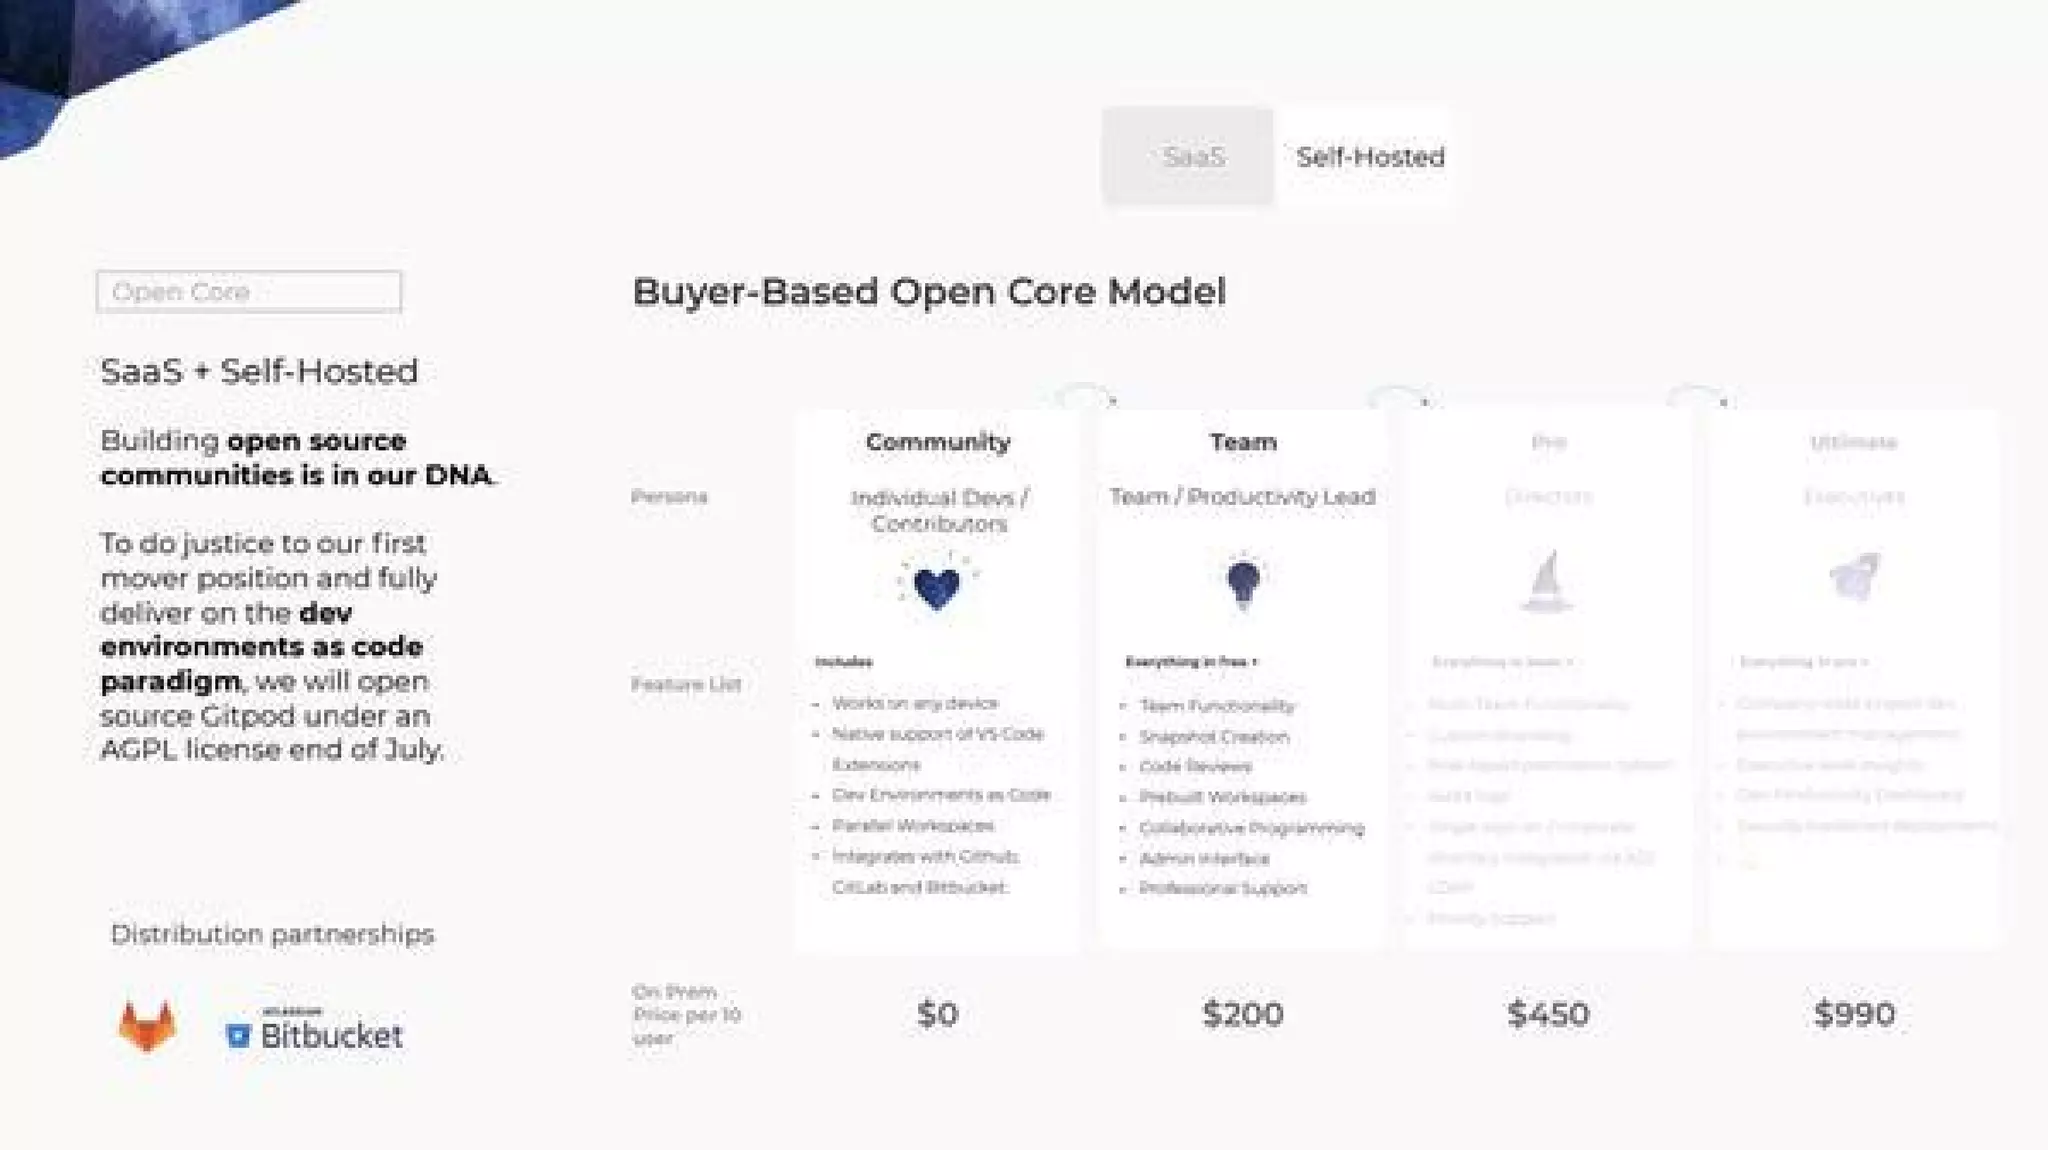
  • Model shown: Buyer‑based open core model (Slide 9/10 area). They present both SaaS and self‑hosted options and emphasize open‑source (AGPL) plus commercial tiers.
  • Pricing visual (Slide 9/10) shows tiered pricing columns with labels that appear to be $0 / $200 / $450 / $990 (likely per seat / per month or per team — the slide text implies price-per-seat but it is not explicitly labeled on the slide images).
  • Distribution partnerships noted (Slide 5 / 9): GitHub/GitLab integration and channel partnerships (Bitbucket/GitLab?).
  • Unit economics are not shown (LTV, CAC, gross margin, ARPU).

Traction & Metrics

  • Registered users: Slide 10 shows “200k+ Registered User” with a growth chart indicating steady organic growth (noted ~10% p.m. in small text on the slide).
  • Growth trend: upward trajectory across months (Apr → Today), with the graph and note claiming continued ~10% monthly growth.
  • Product‑market fit signal: Slide 10 indicates strong sentiment from a small sample: “Product Market Fit with individual developers — 47% of professional developers (n=46) use Gitpod at work” and pie charts showing user disappointment if Gitpod were gone (visual PMF evidence).
  • Open source & adoption: Slide 6 shows Theia with >100 contributors, VS Code extension compatibility, and >11k stars on GitHub — plus prominent contributors/adopters: Google Cloud (official editor of Cloud Shell), SAP, Arduino, Red Hat, ARM, IBM.
  • Customer logos and prior partnerships appear across slides but there are no explicit revenue, ARR, or paid customer counts disclosed in the deck images.

Competitive Positioning

  • Slide 8 positions competitors on a 2D map (automation vs. vendor neutrality). Gitpod is placed high on both automation and vendor neutrality.
  • Competitors shown include: repl.it, Coder, Visual Studio Codespaces, AWS Cloud9 and smaller cloud IDEs. Gitpod differentiates by:
    • Emphasizing prebuilt, ephemeral workspaces (automation + disposability).
    • Open core approach + Theia (vendor neutrality + open-source integration).
    • Direct GitHub/GitLab workflow integration (one-click workspaces).
  • The deck claims Gitpod invented “prebuilds” as a differentiator.

Team

  • Slide 11 lists founders and team:
    • Sven Efftinge — Founder & CEO (visible name).
    • Dr. Jan Köhnlein — Founder, VP Engineering.
    • Moritz Eysholdt — Founder, CTO.
    • Johannes Landgraf — CCO (joined on commercial side).
  • Founders worked together >10 years; they have track records building development tools, programming languages and open-source communities (Theia). Slide 6 references a strong open-source contributor base and enterprise collaborators.

Go-to-Market Strategy

  • Product-led growth + self-serve “Open in Gitpod” flow (Slide 5): users can launch any GitHub/GitLab project by prefixing URL with gitpod.io/#.
  • Distribution partnerships called out (Slide 9/10): integration partnerships (GitHub, GitLab, Bitbucket) and channel/distribution partners.
  • Business model combines free/open core and paid tiers for teams/enterprises (Slide 9/10 pricing grid).
  • Not a lot of explicit sales motion detail — limited detail on outbound sales, enterprise contracting process, or channel economics.

The Ask

  • Fundraising shown: Seed round $3M (this deck used in their $3M seed raise).
  • The slides do not include detailed line-item use-of-funds or an explicit ask allocation in the images provided.

Investor Deep Dive

Executive summary, strengths & red flags

Executive Summary

Gitpod's 2020 seed deck presents a tightly focused product-led story: developer environments are slow and brittle; Gitpod automates “dev environments as code” and provides ephemeral, prebuilt workspaces in the cloud. The deck mixes quantified pain (time lost waiting), product/demo evidence, open‑source credibility (Theia), meaningful traction ( ~200k registered users, monthly growth), and a clear go‑to‑market posture (SaaS + self‑hosted open core).

Key Strengths

3 identified

1

Clear, quantified problem statement — Slide 2 uses concrete weekly hours lost (3.7h tests, 3.5h builds, 2.7h env mgmt), which makes the productivity case tangible.

2

Strong technical credibility and open‑source backbone — founding Theia (Slide 6) and showing >100 contributors, VS Code extension compatibility and >11k stars demonstrates technical leadership and ecosystem fit.

3

Product-led demo + low friction onboarding — "Open in Gitpod" and URL prefix workflow (Slide 5) provide a clear, immediate way to try the product and reduce adoption friction.

Red Flags & Weaknesses

3 identified

1

No explicit TAM / revenue projections — the deck fails to present dollar-based market sizing (TAM/SAM/SOM) or financial model assumptions; investors must infer market opportunity from logos rather than numbers.

2

Limited revenue & unit economics disclosure — no ARR/MRR, paid customer counts, ARPU, CAC, or gross margin are shown, making it harder to assess business sustainability.

3

Small sample for PMF evidence and few enterprise customer details — PMF claims reference a small survey (n=46) and while logos/partners are shown, there are no named paid enterprise references, case studies, or clear revenue conversion metrics.

More Pitch Decks To Study

Compare structure, fundraising context, and investor-facing story across similar startup decks.