Compare your deck to Leapsome

Compare Your Deck

Leapsome Pitch Deck (2022)

SaaS
Stage: Series A
Raised: $60M
Year: 2022
Slides: 19
Outcome: Private, valued at $400M+

Pitch Deck

1 / 19
Leapsome pitch deck - Cover & Value Proposition
Click to expand

Deck Analysis

This pitch deck for Leapsome (Series A) positions the company as a one-stop people enablement platform combining performance management, engagement, and development tools. The deck is concise, visually clean, and focused on demonstrating product breadth (reviews, goals/OKRs, surveys, feedback, 1:1s, learning) plus market opportunity and traction. Notable elements include a problem-first framing (employee churn), clear product-module visuals, customer logos, growth metrics, and differentiators like GDPR/EU data security — all presented in a way that supports a SaaS growth narrative.

Cover & Value Proposition

Cover & Value Proposition

The opening slide (slide 1) is simple and direct: brand, tagline (“We help teams grow and succeed”), and short positioning (“The One-Stop People Enablement Platform”). This immediately communicates the mission without clutter and sets the expectation that the deck will explain how the product supports team growth across people processes. The minimalist design, with a faint product screenshot in the background, signals product-driven credibility while keeping the focus on the core message.

For founders: a clear, short value proposition on the first slide helps an investor decide quickly if the deck is relevant. The cover balances brand, mission, and product hinting — an effective pattern for SaaS companies selling to HR and C-suite buyers because it ties emotional benefit (teams succeed) to a practical promise (one platform).
Key Takeaway: Lead with a concise value statement that combines the emotional outcome and the product role — keep the cover uncluttered and product-hinted.
Problem Framing: Core Drivers of Success

Problem Framing: Core Drivers of Success

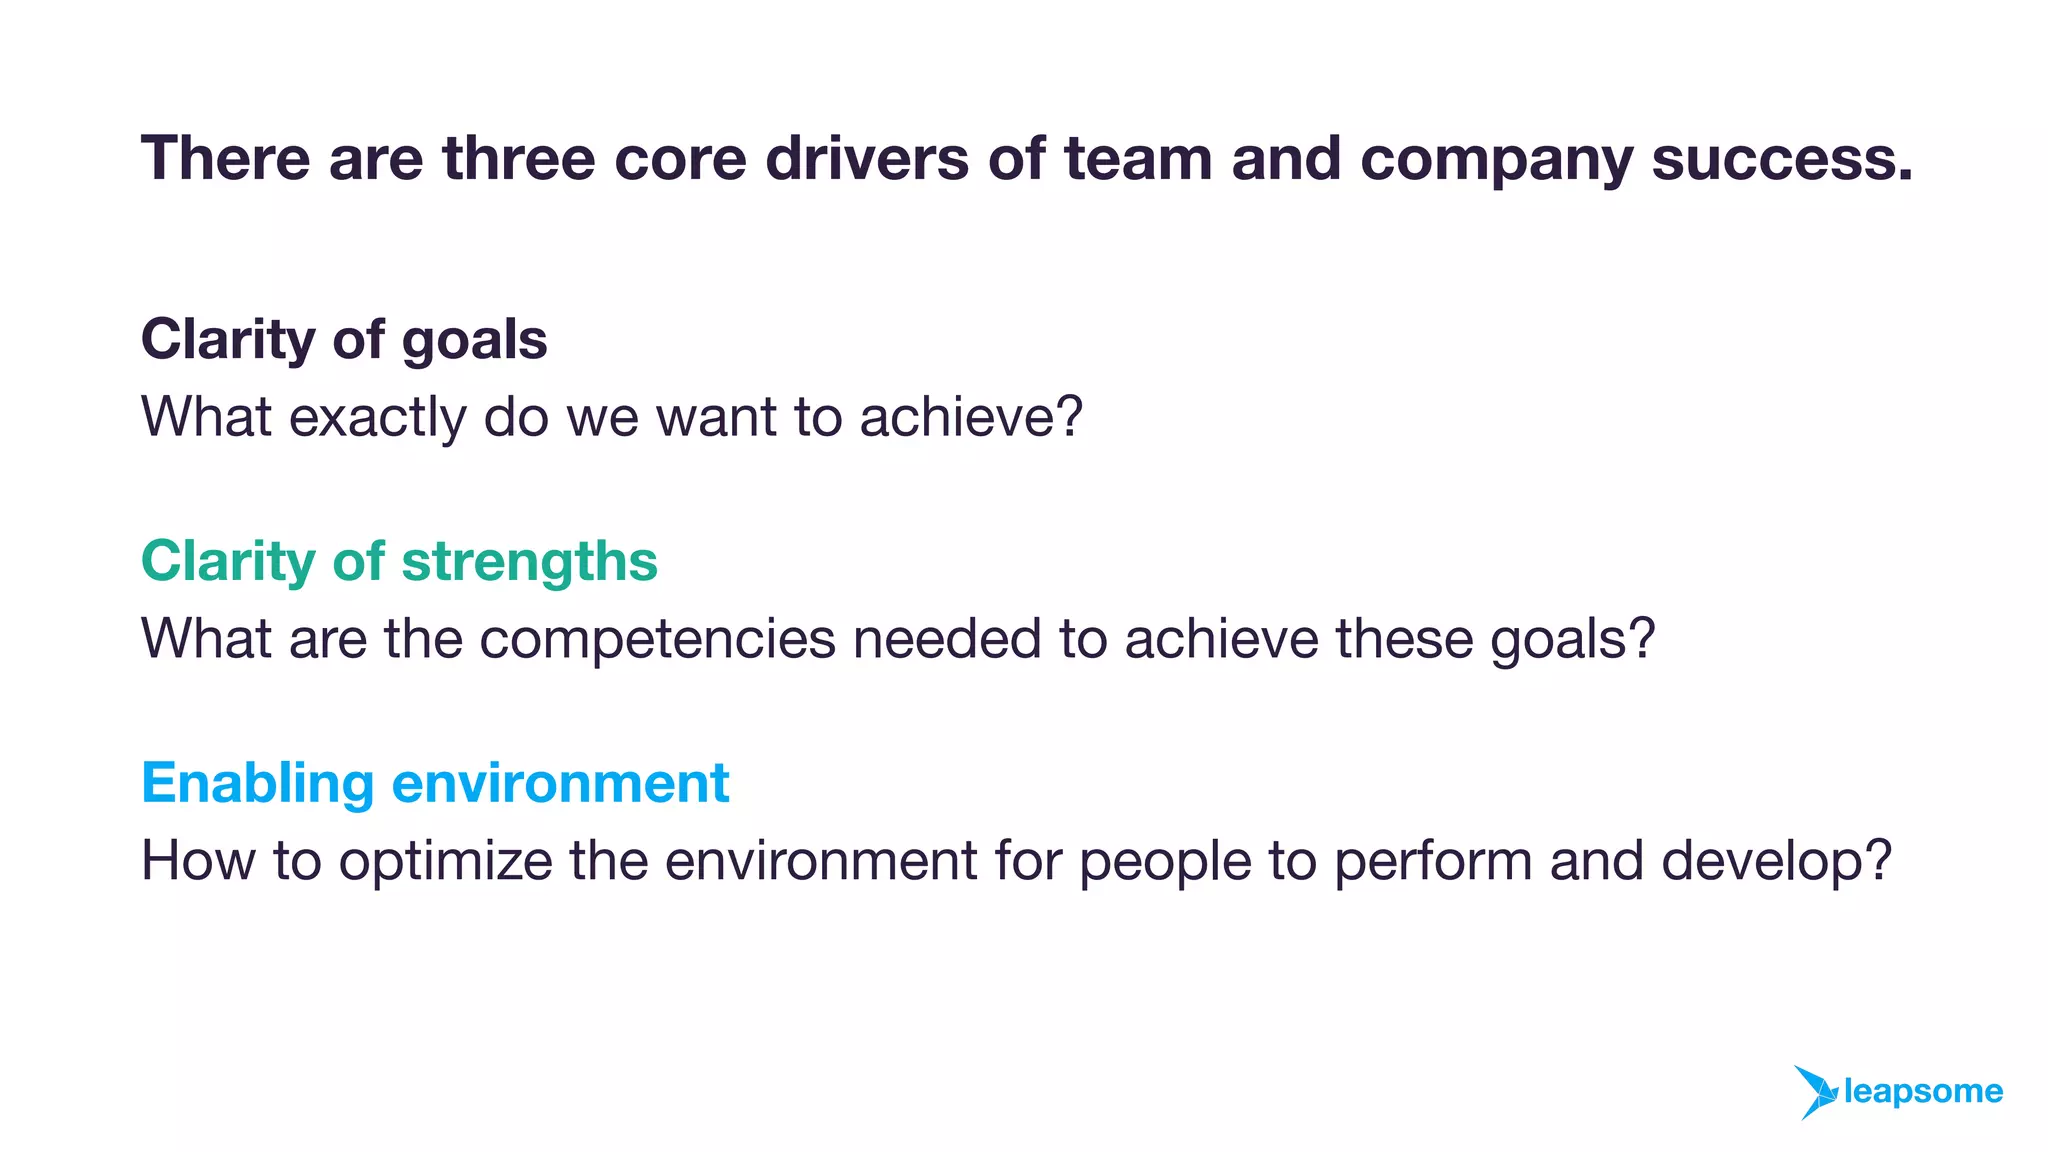
Slide 3 articulates three core drivers of team and company success: clarity of goals, clarity of strengths, and an enabling environment. This framing is effective because it translates a broad HR problem into three actionable dimensions that map directly to product modules. It prepares the audience to see the product as a holistic solution rather than a point tool — a key positioning for winning enterprise buyers who prefer integrated platforms.

Founders should note the cognitive clarity: an explicit problem decomposition makes it easier to align metrics, product features, and customer pain points later in the deck. It also primes investors to judge product-market fit by whether features map cleanly to these drivers.

Key Takeaway: Break the problem into a small number of clear, product-mapped drivers to make it easy for investors to see how your features solve a coherent set of needs.
Why It Matters: Cost of Churn & Risk

Why It Matters: Cost of Churn & Risk

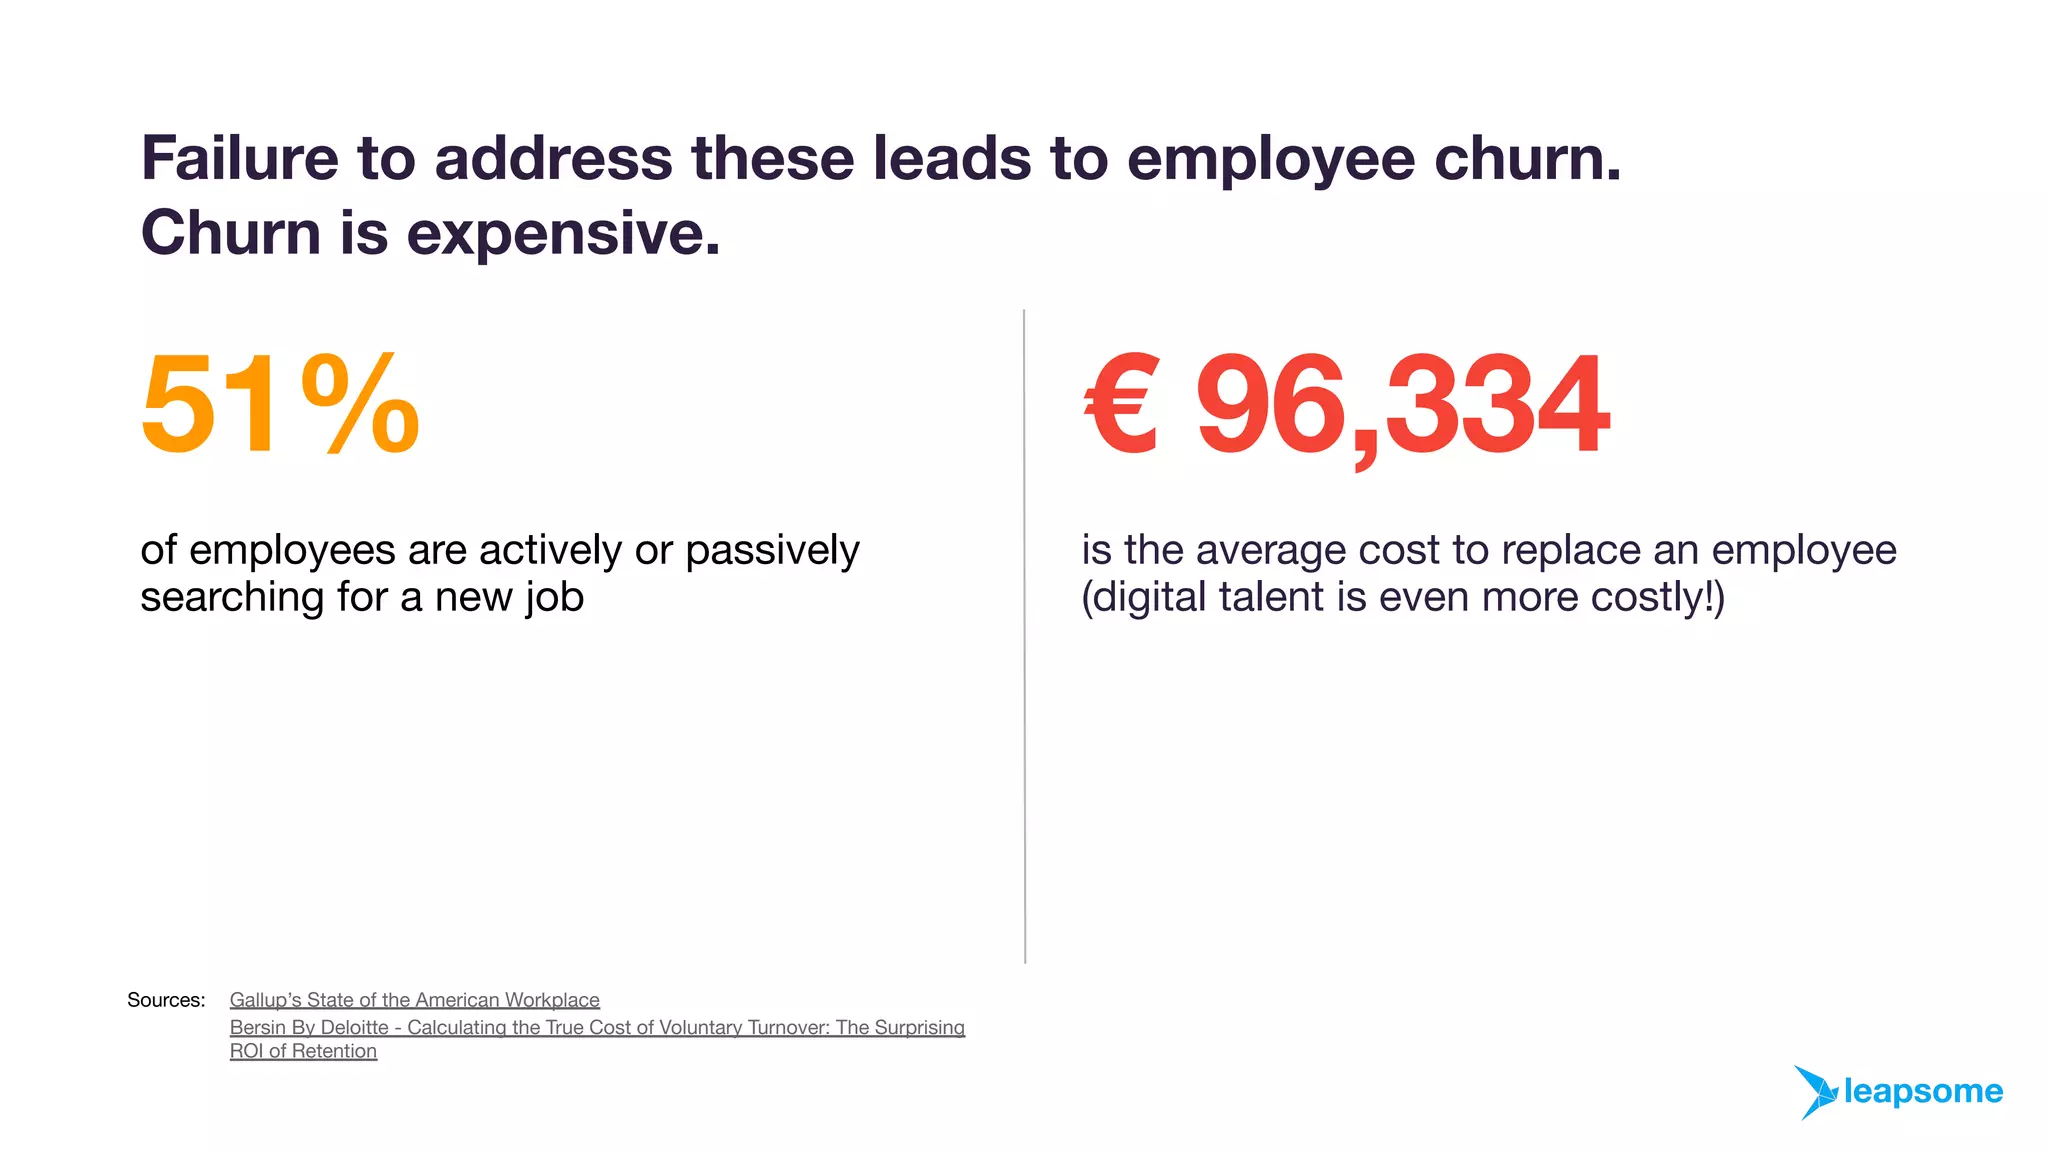
Slide 4 quantifies the problem with two strong data points: 51% of employees are searching for a new job and the average cost to replace an employee (presented in euros). Using a mix of engagement and expensive replacement cost creates urgency — showing both behavioral intent and a financial hit. The slide is visually sparse but uses large, contrasting numbers to ensure the stats land immediately.

This is a classic investor-oriented move: tie product benefits to economics. For founders, include sourced, high-impact stats and connect them to the ROI of your solution (retention, productivity) so that investors can more easily model customer payback and enterprise ROI.

Key Takeaway: Use one or two powerful, sourced metrics to quantify the problem and create investor-calculable urgency tied to customer economics.
Product Overview: Integrated Modules

Product Overview: Integrated Modules

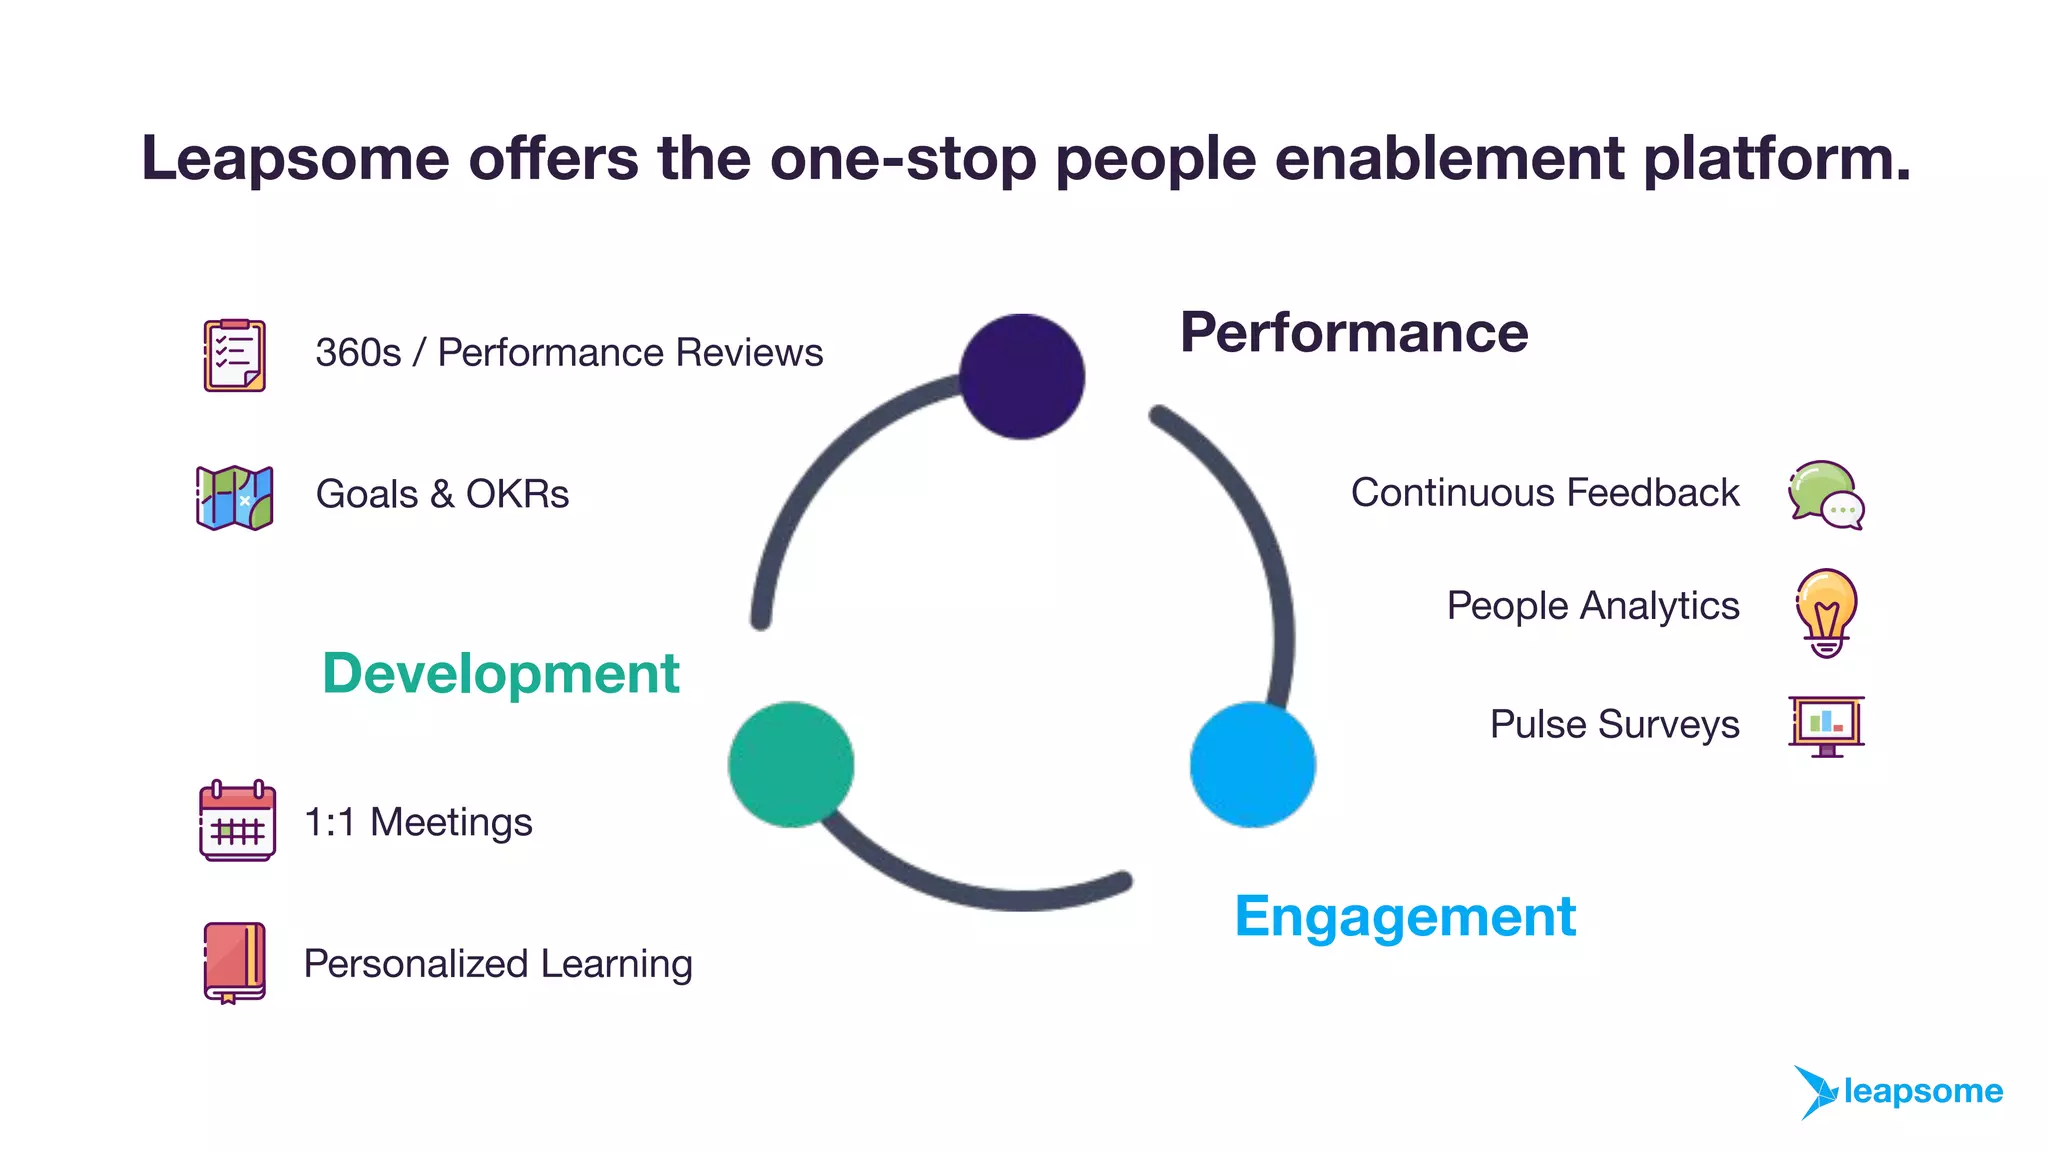
Slide 5 presents the product as a cycle of Performance, Engagement, and Development with specific modules listed around the circle (reviews, goals & OKRs, feedback, people analytics, pulse surveys, 1:1 meetings, learning). The visualization emphasizes continuity — that data and workflows flow between modules — which supports the one-stop platform claim. Icons add personality and make the functional list easier to scan.

This section is effective because it translates the earlier problem drivers into concrete product capabilities. Founders should emulate this by mapping features to the customer journey and showing how modules interlock; integrated value beats best-of-breed claims when selling to HR functions seeking consolidation.

Key Takeaway: Show how discrete features form an integrated workflow rather than a set of isolated tools — a visual product map sells platform value to enterprise buyers.
Product Depth: Example — 360s & Reviews

Product Depth: Example — 360s & Reviews

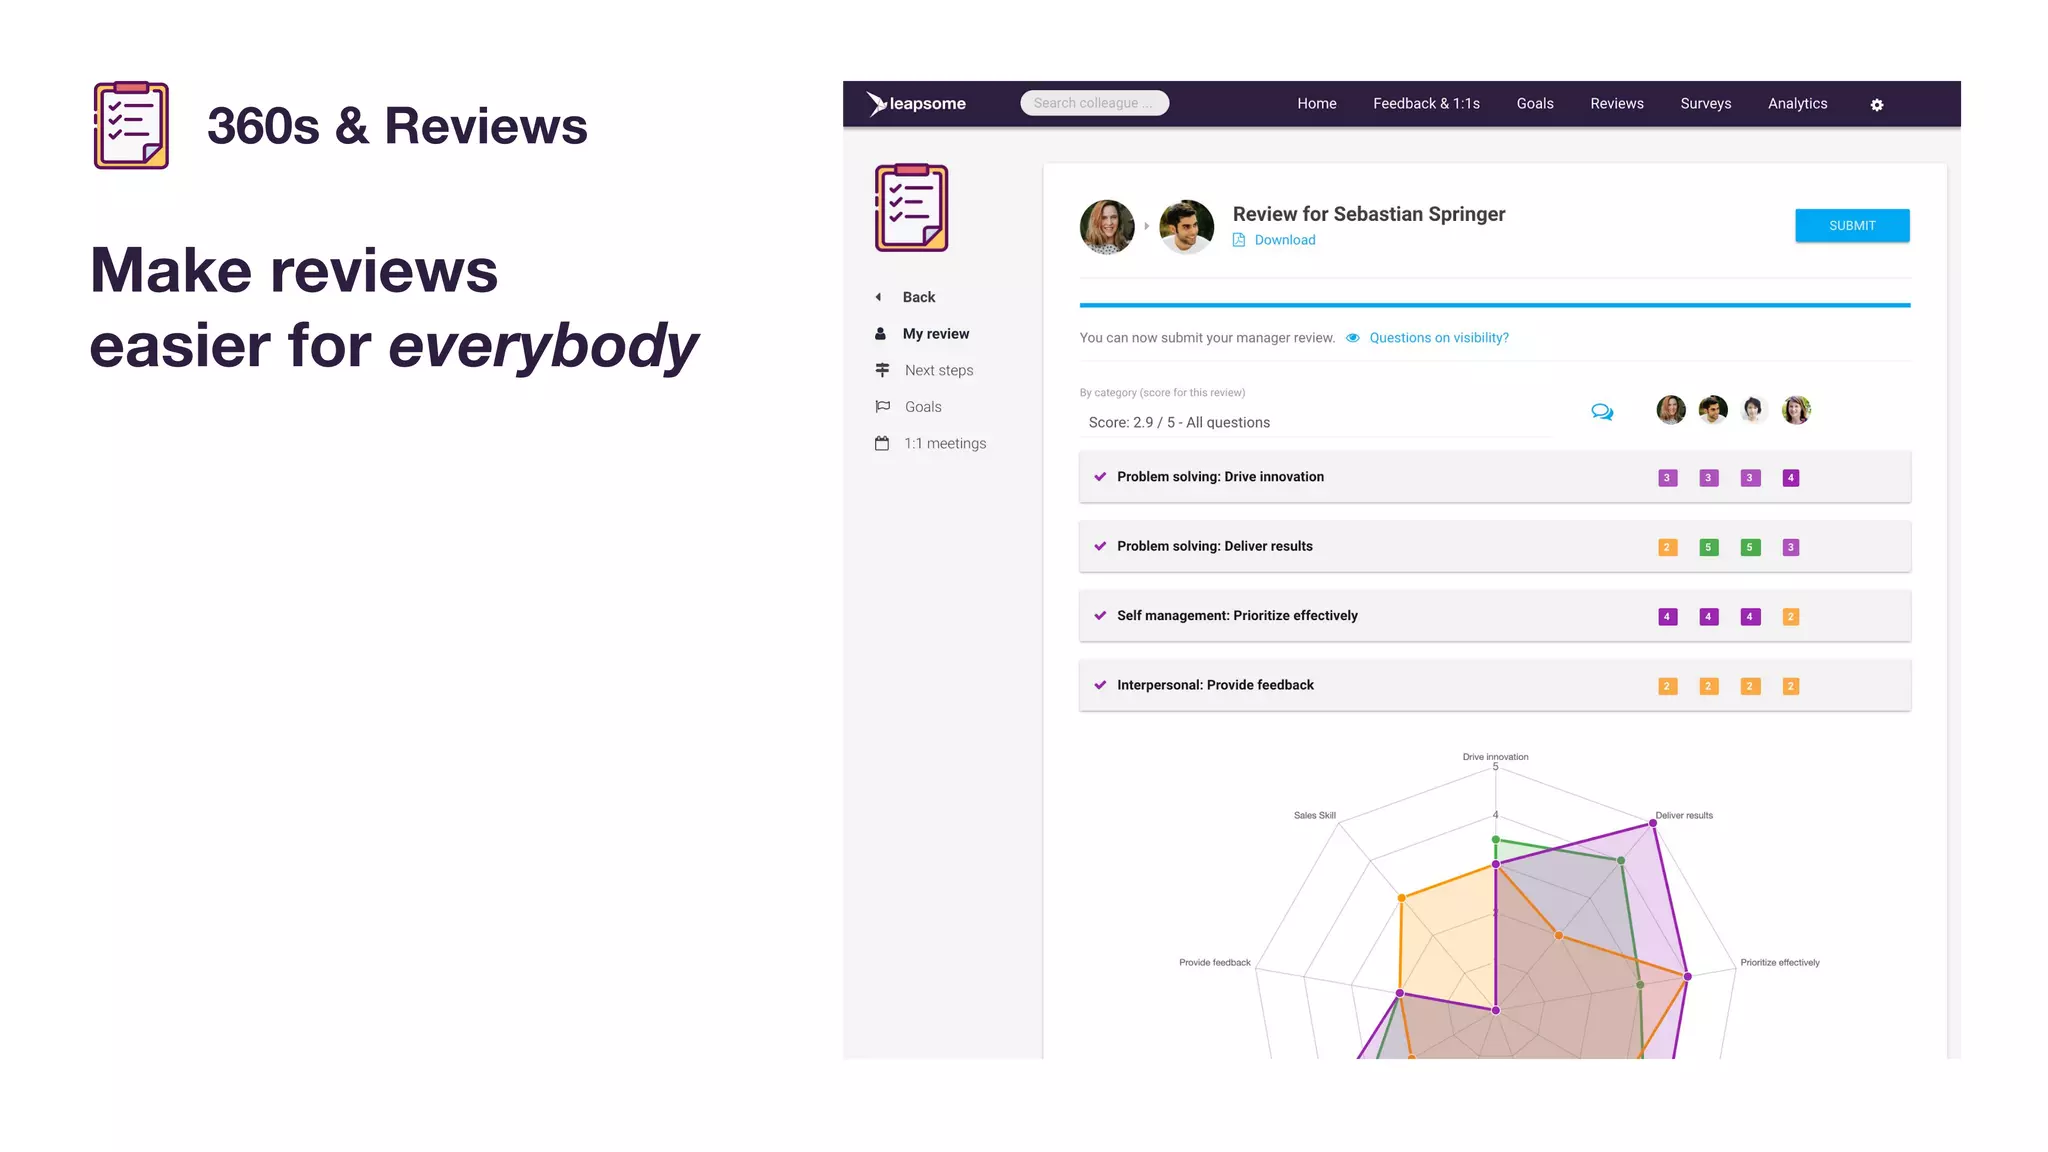
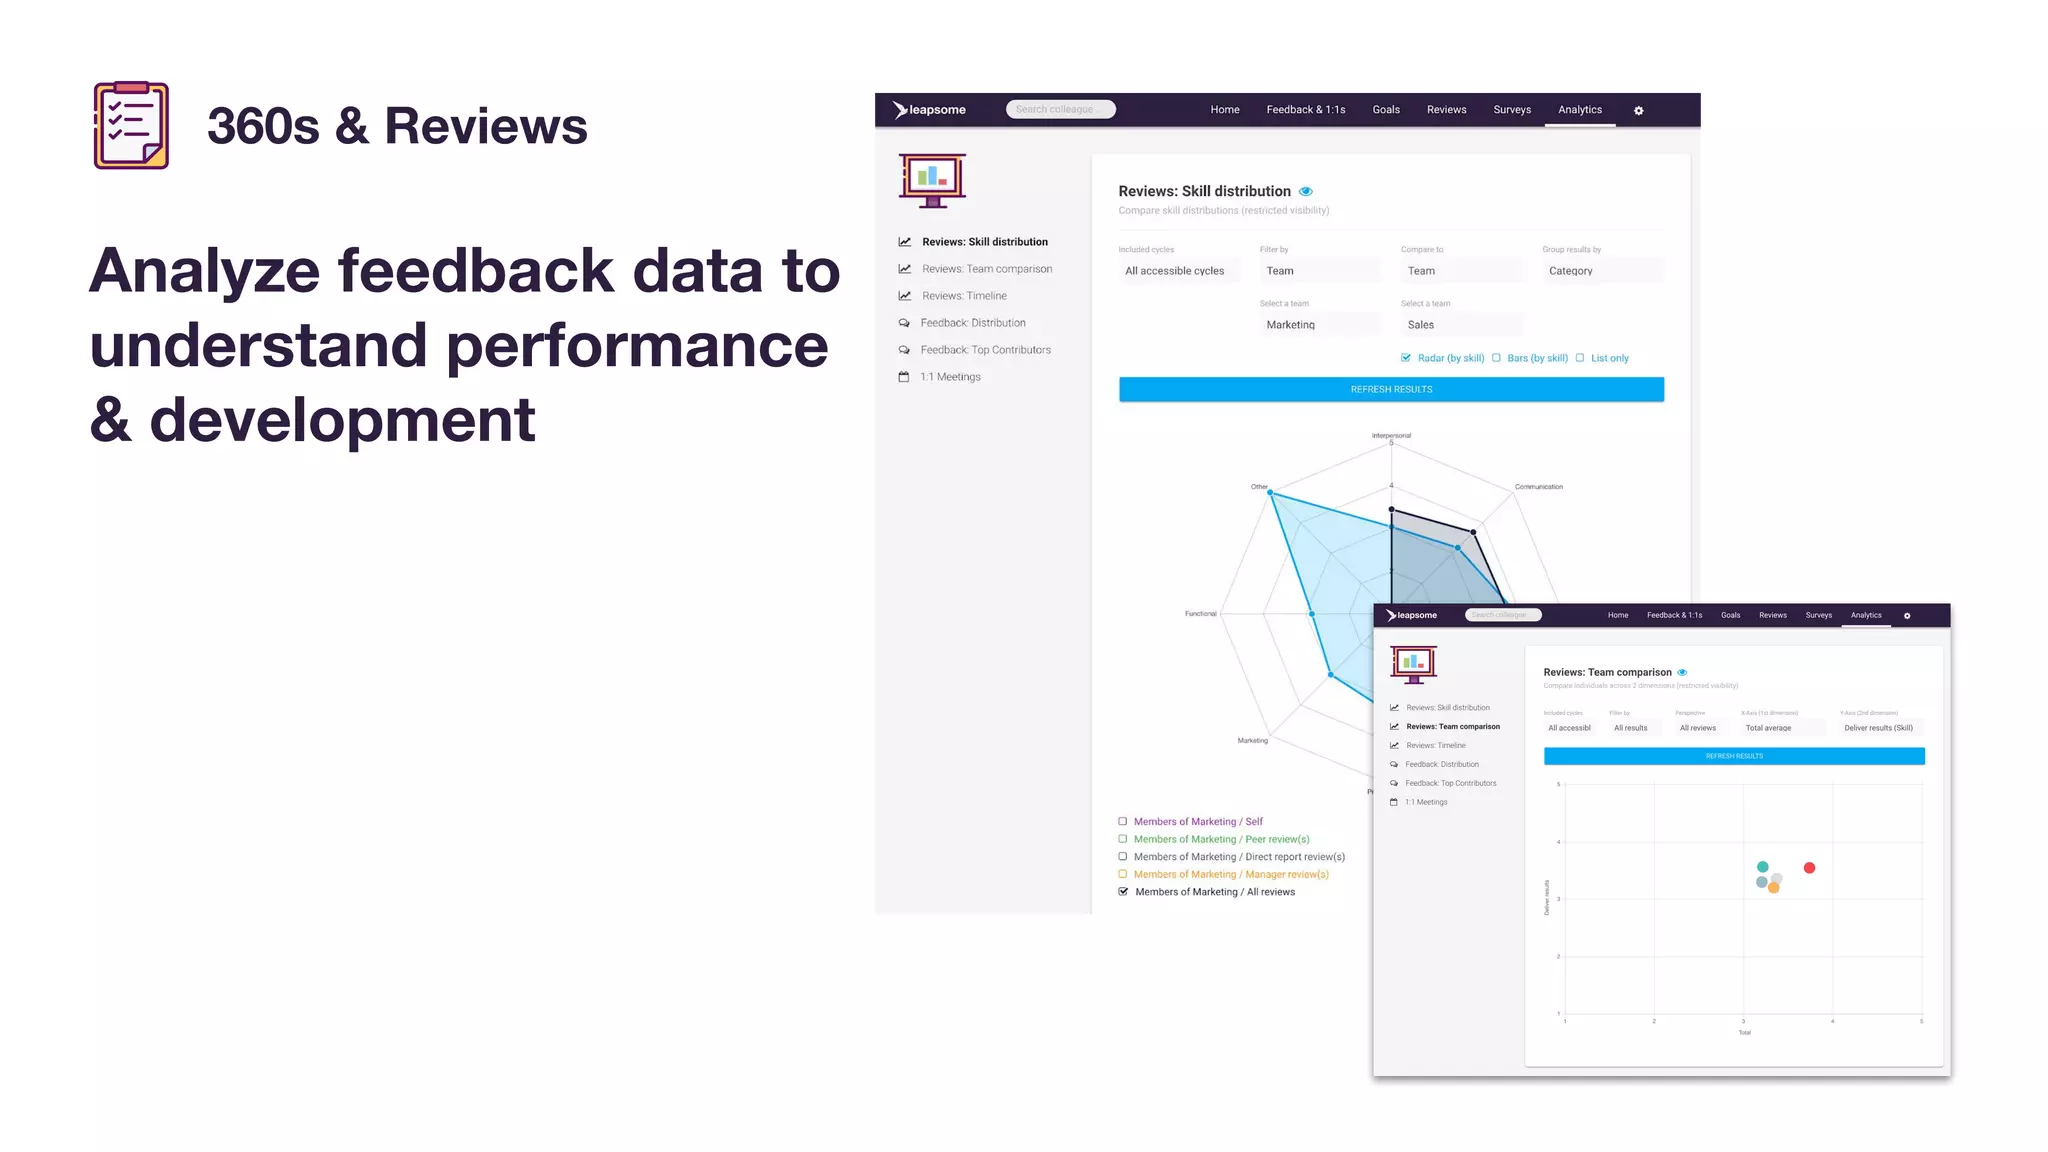
Slides 6 and 7 (using slide 06 URL) dive into a specific module — 360s and performance reviews — with screenshots that highlight ease of use, radar visualizations, and analytics for team comparison. These visuals demonstrate both end-user UX (simple, clean review flows) and admin analytics capability (skill distribution, team comparison). Showing a representative, polished workflow helps buyers and investors imagine adoption and scale.

For founders: include at least one deep-dive screenshot that shows both the front-end user experience and the backend analytics. It establishes credibility that the product is production-ready and that the company has thought through data capture and reporting — two critical requirements for enterprise purchasing and retention.

Key Takeaway: Include a product deep-dive screenshot that proves the UX and data/analytics capabilities — this builds credibility for enterprise adoption.
Differentiation & Security Positioning

Differentiation & Security Positioning

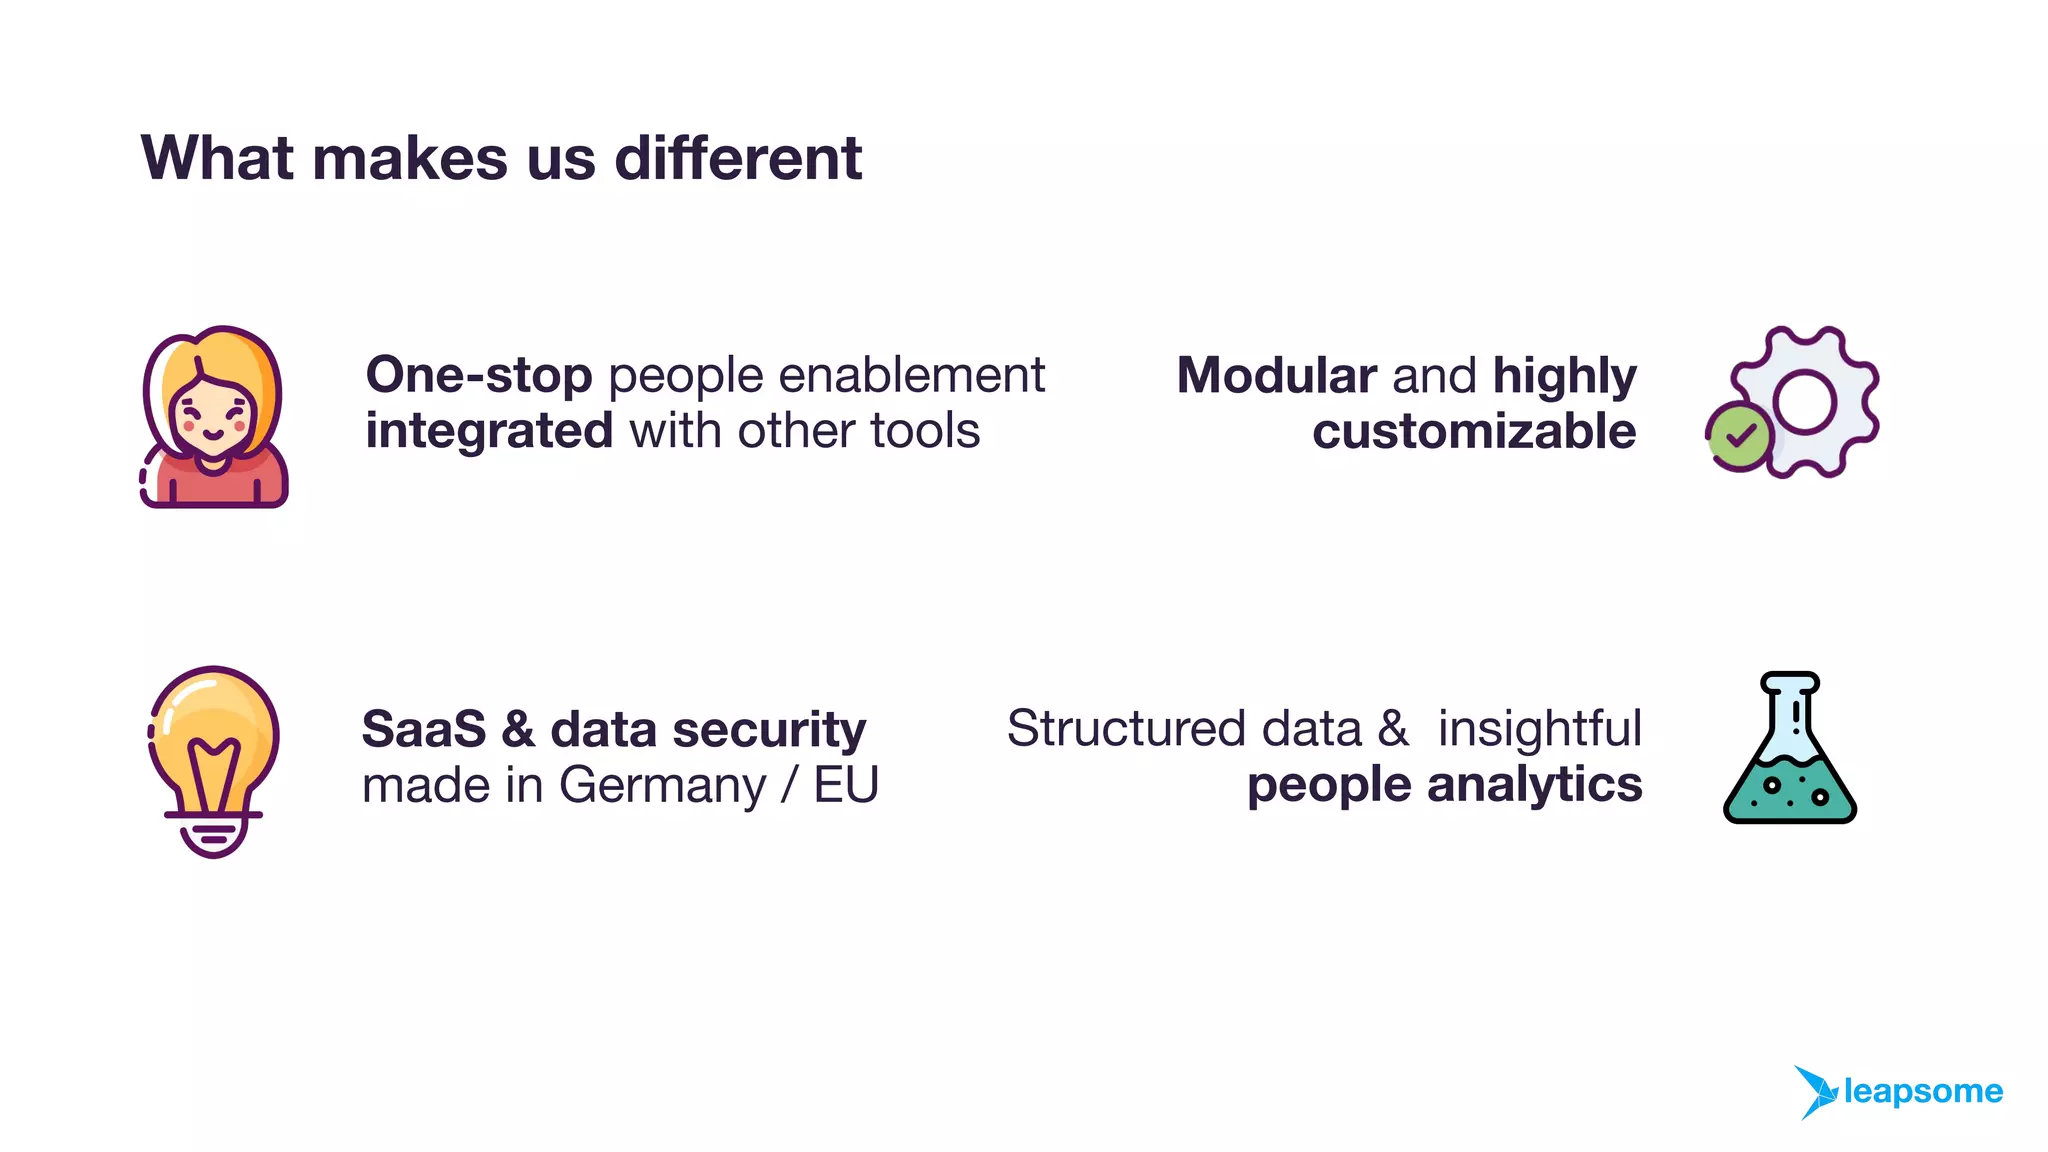
Slide 15 lists what makes Leapsome different: one-stop platform integration, modular/customizable architecture, SaaS and EU data security, and structured people analytics. This combination addresses three buyer concerns: breadth (consolidation), flexibility (rollout/customization), and compliance (GDPR/EU hosting). Highlighting 'made in Germany/EU' and GDPR compliance is a strategic differentiator for EU enterprise customers and procurement teams.

Founders in HR SaaS should call out explicit differentiators beyond product features — compliance, data residency, and modular deployment models can be decisive in enterprise selection and justify pricing premiums or RFP inclusion.

Key Takeaway: Spell out non-obvious differentiators — compliance, deployment model, and analytics depth — because enterprises often buy on those factors, not just feature lists.
Traction: Growth Curve & Momentum

Traction: Growth Curve & Momentum

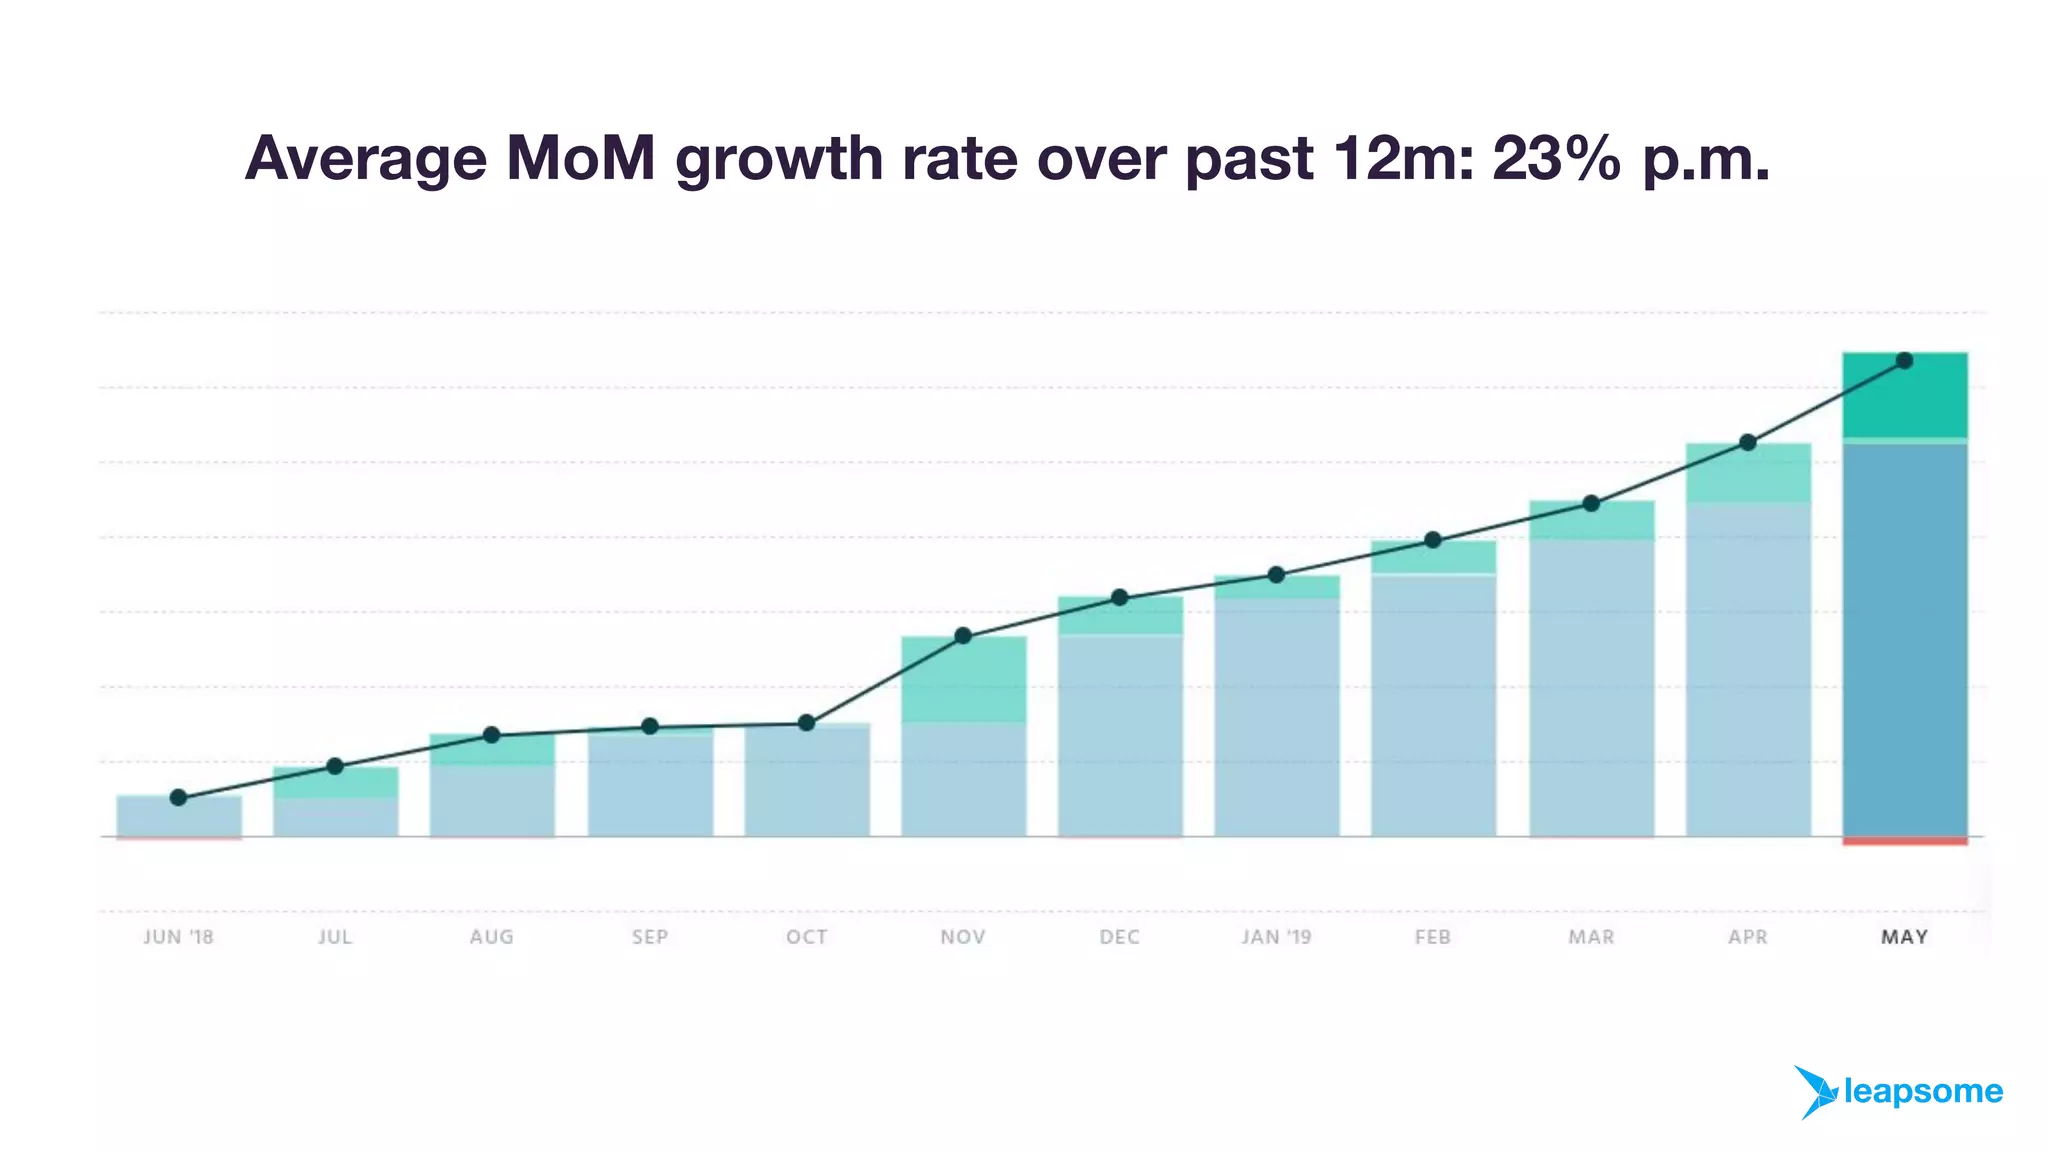
Slide 17 shows a clear upward MoM growth chart (average 23% month-over-month) with stacked bars and a trendline. This visual communicates momentum succinctly — a steep, sustained climb is one of the most persuasive things a growth-stage SaaS company can show. The chart lacks raw numbers on the slide, but the clear trend and labeling convey rapid adoption and compounding growth dynamics.

For founders: present growth visually with a simple chart and a concise, credible metric. Investors look for consistent acceleration and evidence that growth scales month-to-month. Accompany charts with a short caption explaining drivers (e.g., land-and-expand, channel expansion) in the spoken pitch or appendix.

Key Takeaway: Show sustained, accelerating growth visually and pair it with a brief explanation of the growth levers to make momentum believable and actionable for investors.

Conclusion: Key Lessons

Leapsome’s deck is a strong example of a product-led SaaS pitch that combines problem urgency, tightly-mapped product modules, enterprise differentiators (GDPR/EU hosting, modularity), customer logos, and clear growth metrics. Strengths include a succinct value proposition, effective problem-to-solution mapping, and a polished product deep dive that proves the UX and analytics. The deck repeatedly links product capabilities to measurable business outcomes (reduced churn, performance improvement), which makes it easier for investors and buyers to quantify value.

Actionable advice: (1) Lead with a crisp one-line value proposition that ties emotional and practical benefits; (2) Break the problem into a small set of drivers and map product modules to those drivers; (3) Use one or two impactful, sourced metrics to quantify urgency and ROI; (4) Include at least one detailed product screenshot showing both user flows and analytics to demonstrate readiness for enterprise; and (5) Call out non-obvious differentiators (data residency, compliance, modular rollout) that matter for procurement. Together these elements create a compelling narrative that supports both product-market fit and scalable commercial growth.

Full Deck Analysis

11 sections

Overview

Company: Leapsome
Round: Series A ($60M)
Year: 2022
Outcome: Private, valued at $400M+
Market: People Enablement / HR Technology
Geography: European-focused (Germany/EU), expanding globally

Executive Summary

Leapsome is a one-stop people enablement platform addressing the €96,334 cost of employee turnover by enabling organizations to manage performance, engagement, and development in a single integrated system. The deck effectively establishes a compelling problem (51% of employees actively/passively job searching), demonstrates product breadth across seven core modules, and showcases traction with 30+ recognizable customers including Mercedes-Benz, Bayer, and Merck. However, the pitch lacks critical specificity around team credentials, exact funding ask/use of funds, and quantified targets for the Series A period, which are typical expectations for Series A investors.

Problem Statement

Slide 4: “Failure to address these leads to employee churn. Churn is expensive.”

The deck establishes a clear, data-backed problem:

  • 51% of employees are actively or passively searching for a new job (Gallup’s State of the American Workplace)
  • €96,334 is the average cost to replace an employee (Bersin By Deloitte)
  • Digital talent replacement costs are even higher (unquantified)

Problem Framework (Slide 3): The deck articulates three core drivers of team/company success:

  1. Clarity of goals — “What exactly do we want to achieve?”
  2. Clarity of strengths — “What are the competencies needed to achieve these goals?”
  3. Enabling environment — “How to optimize the environment for people to perform and develop?”

Effectiveness: The problem statement is emotionally resonant (churn = expensive) and financially quantified (€96,334 cost), making it compelling for HR leaders and CFOs. The three-driver framework is logical but not proprietary—similar frameworks exist in HR/OD literature. The deck doesn’t provide data on how many companies fail to address these drivers or what the financial impact is at scale.

Solution

Slides 5-13: Product Overview & Deep Dives

Leapsome positions itself as “The One-Stop People Enablement Platform” with seven core modules organized around three outcome pillars:

Product Architecture

Performance Pillar:

  • 360s / Performance Reviews (Slides 6-7)
  • Continuous Feedback
  • People Analytics

Engagement Pillar:

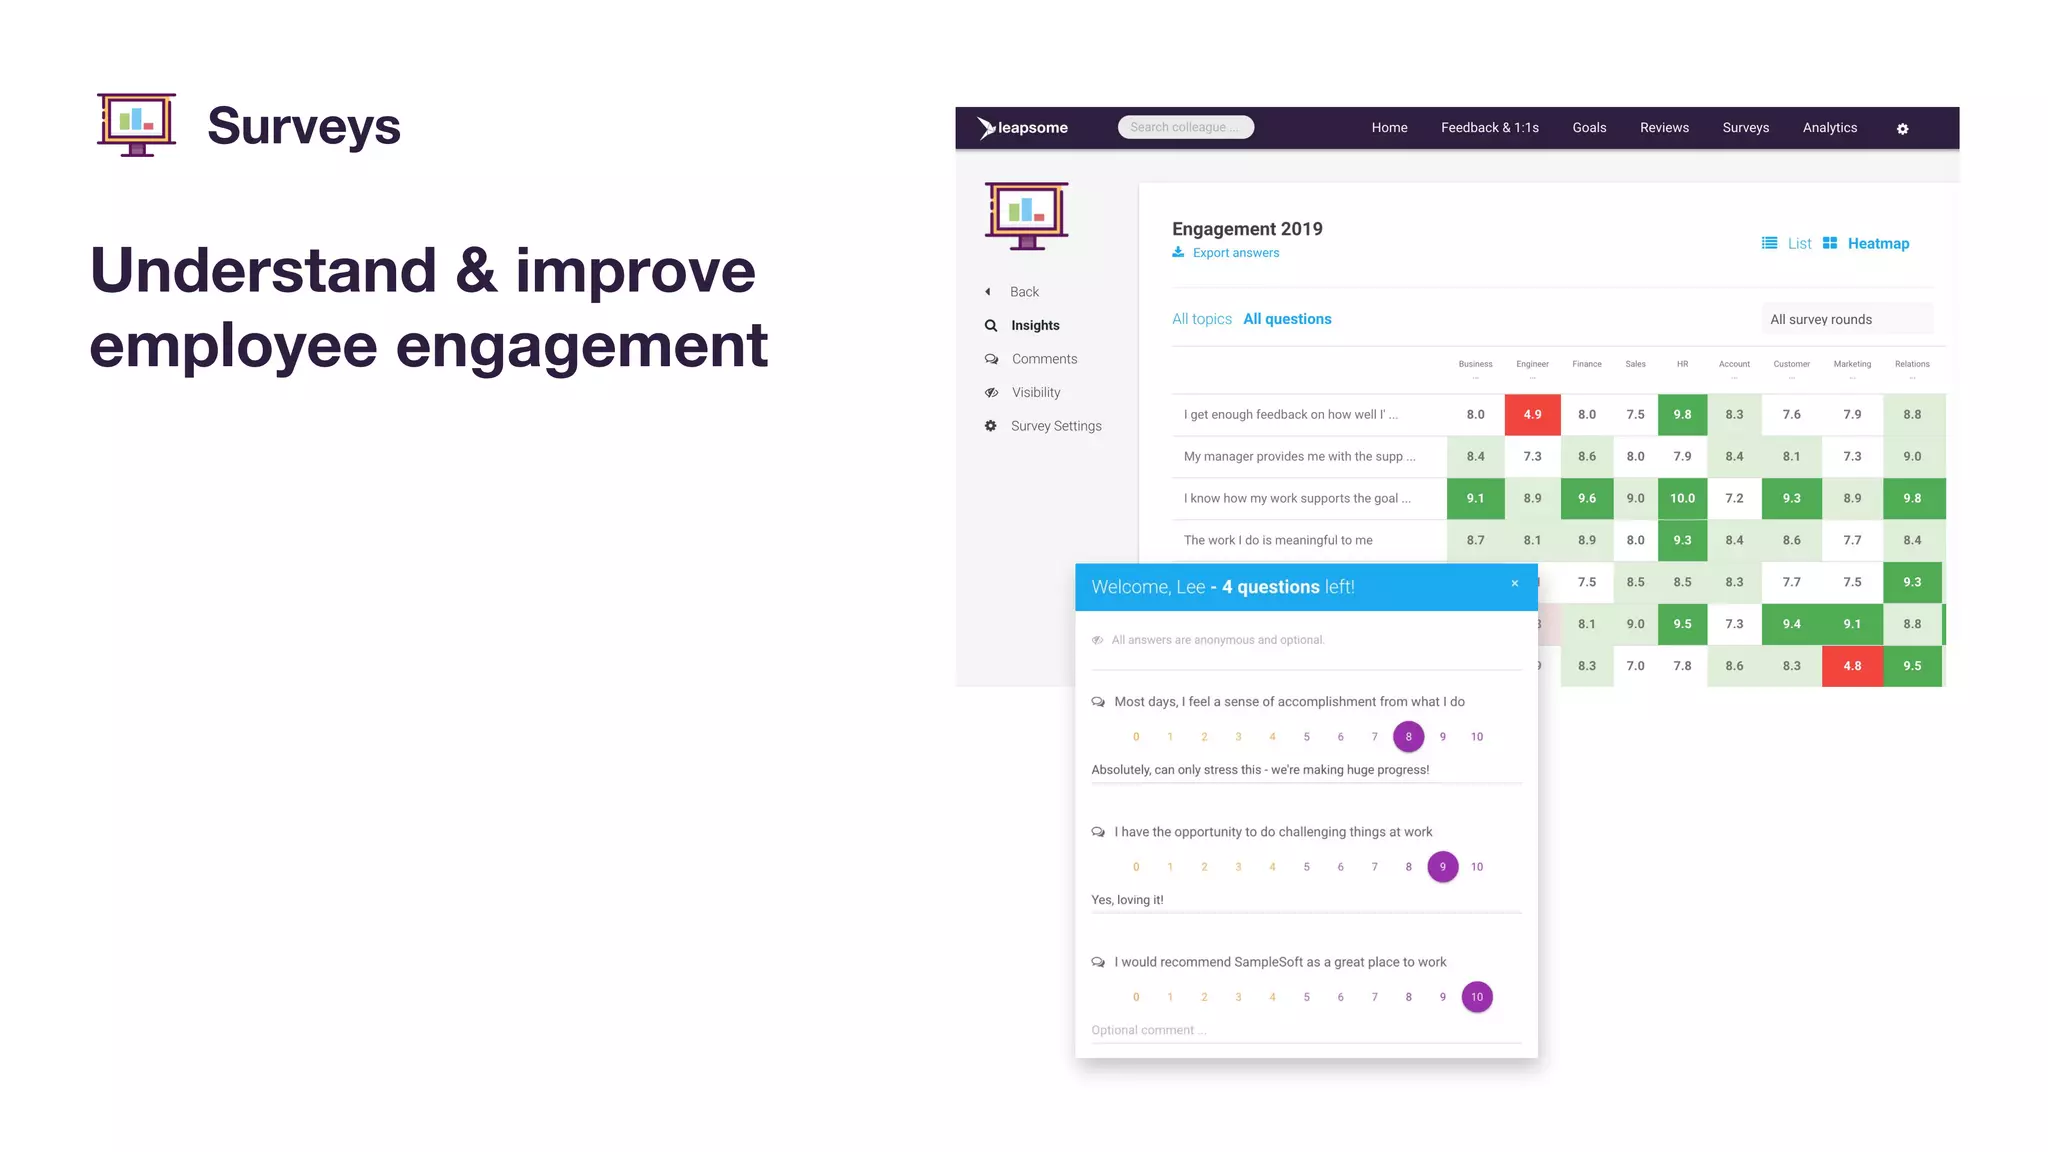
  • Pulse Surveys (Slide 10)
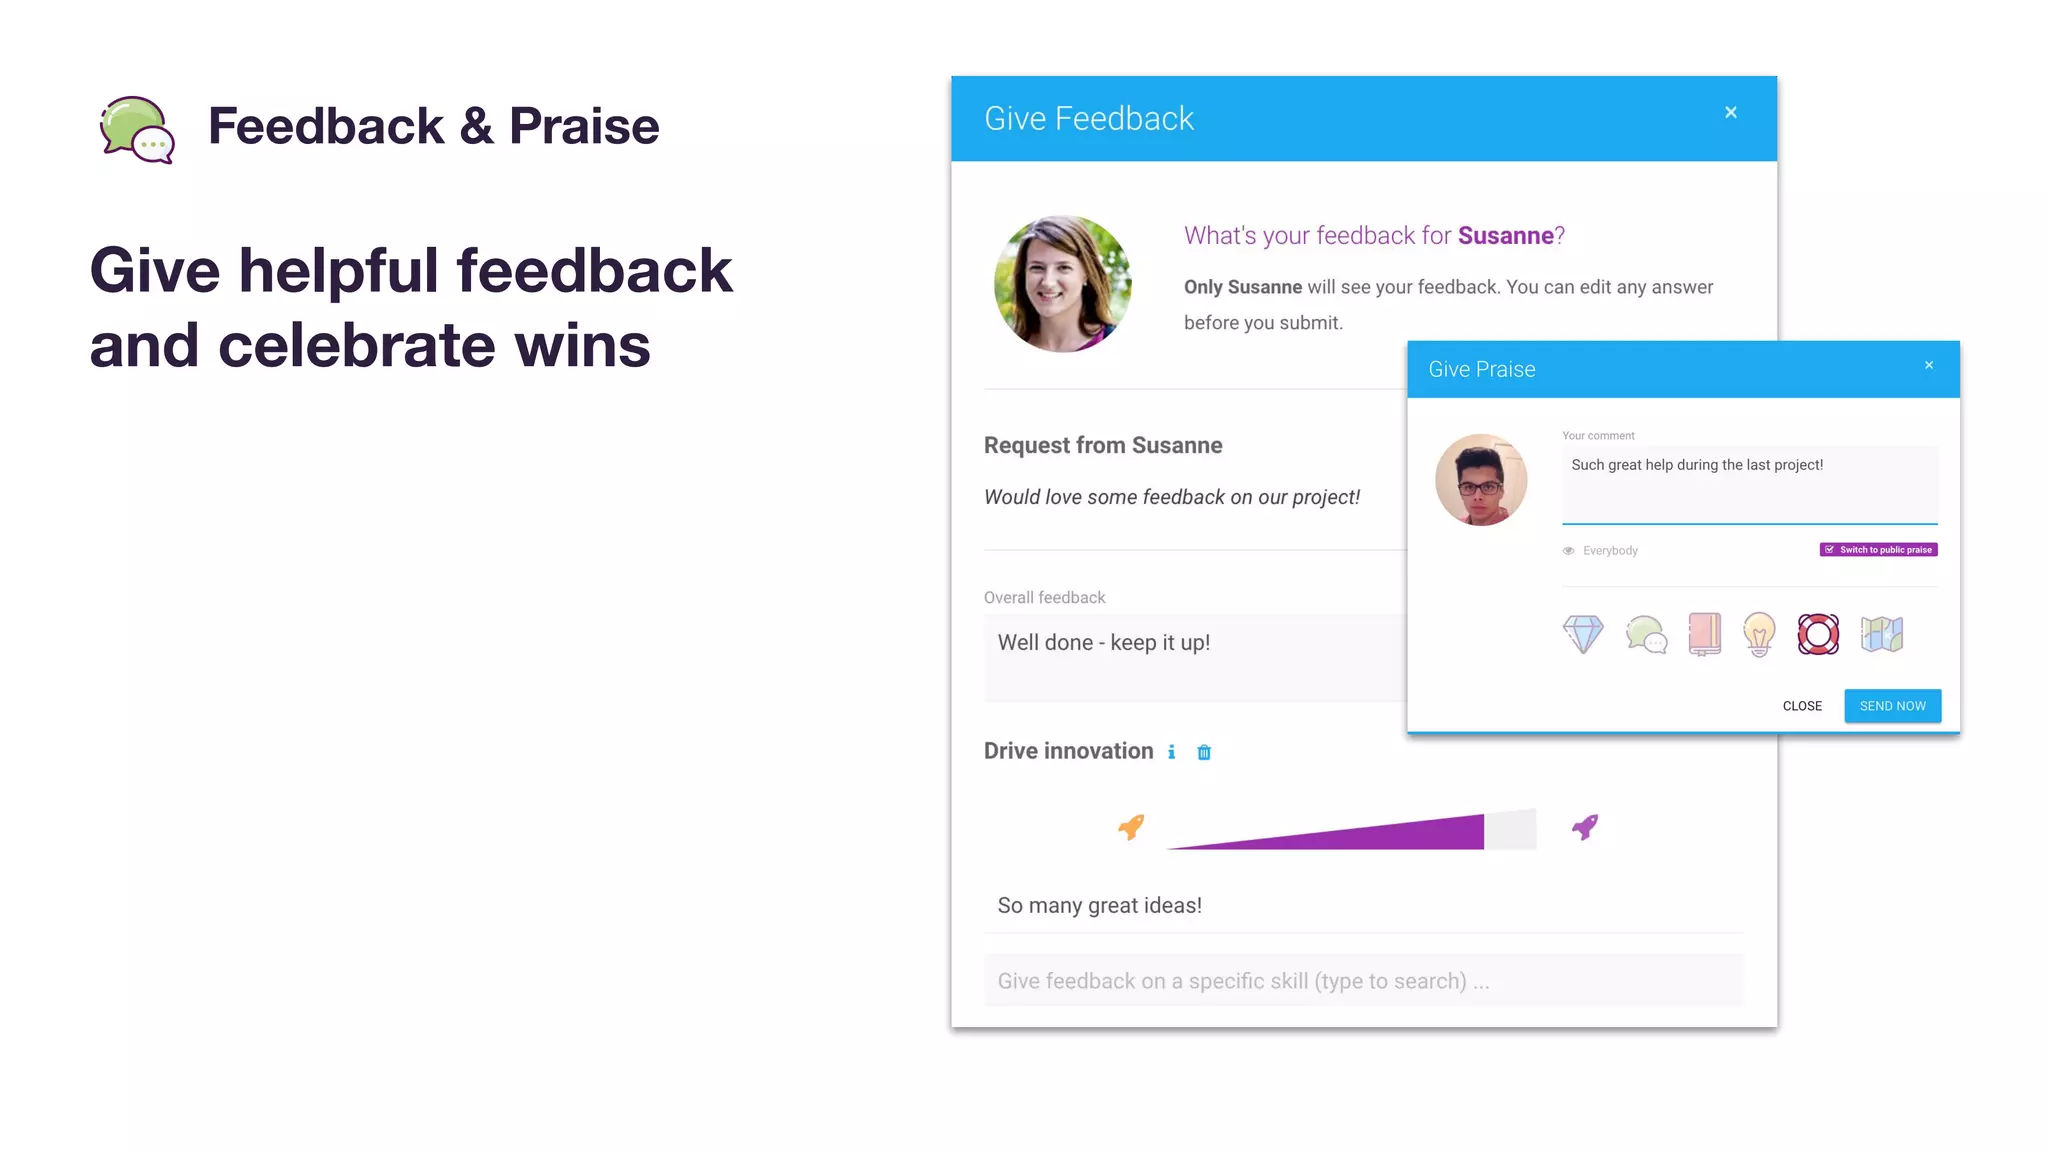
  • Feedback & Praise (Slide 11)

Development Pillar:

  • Goals & OKRs (Slides 8-9)
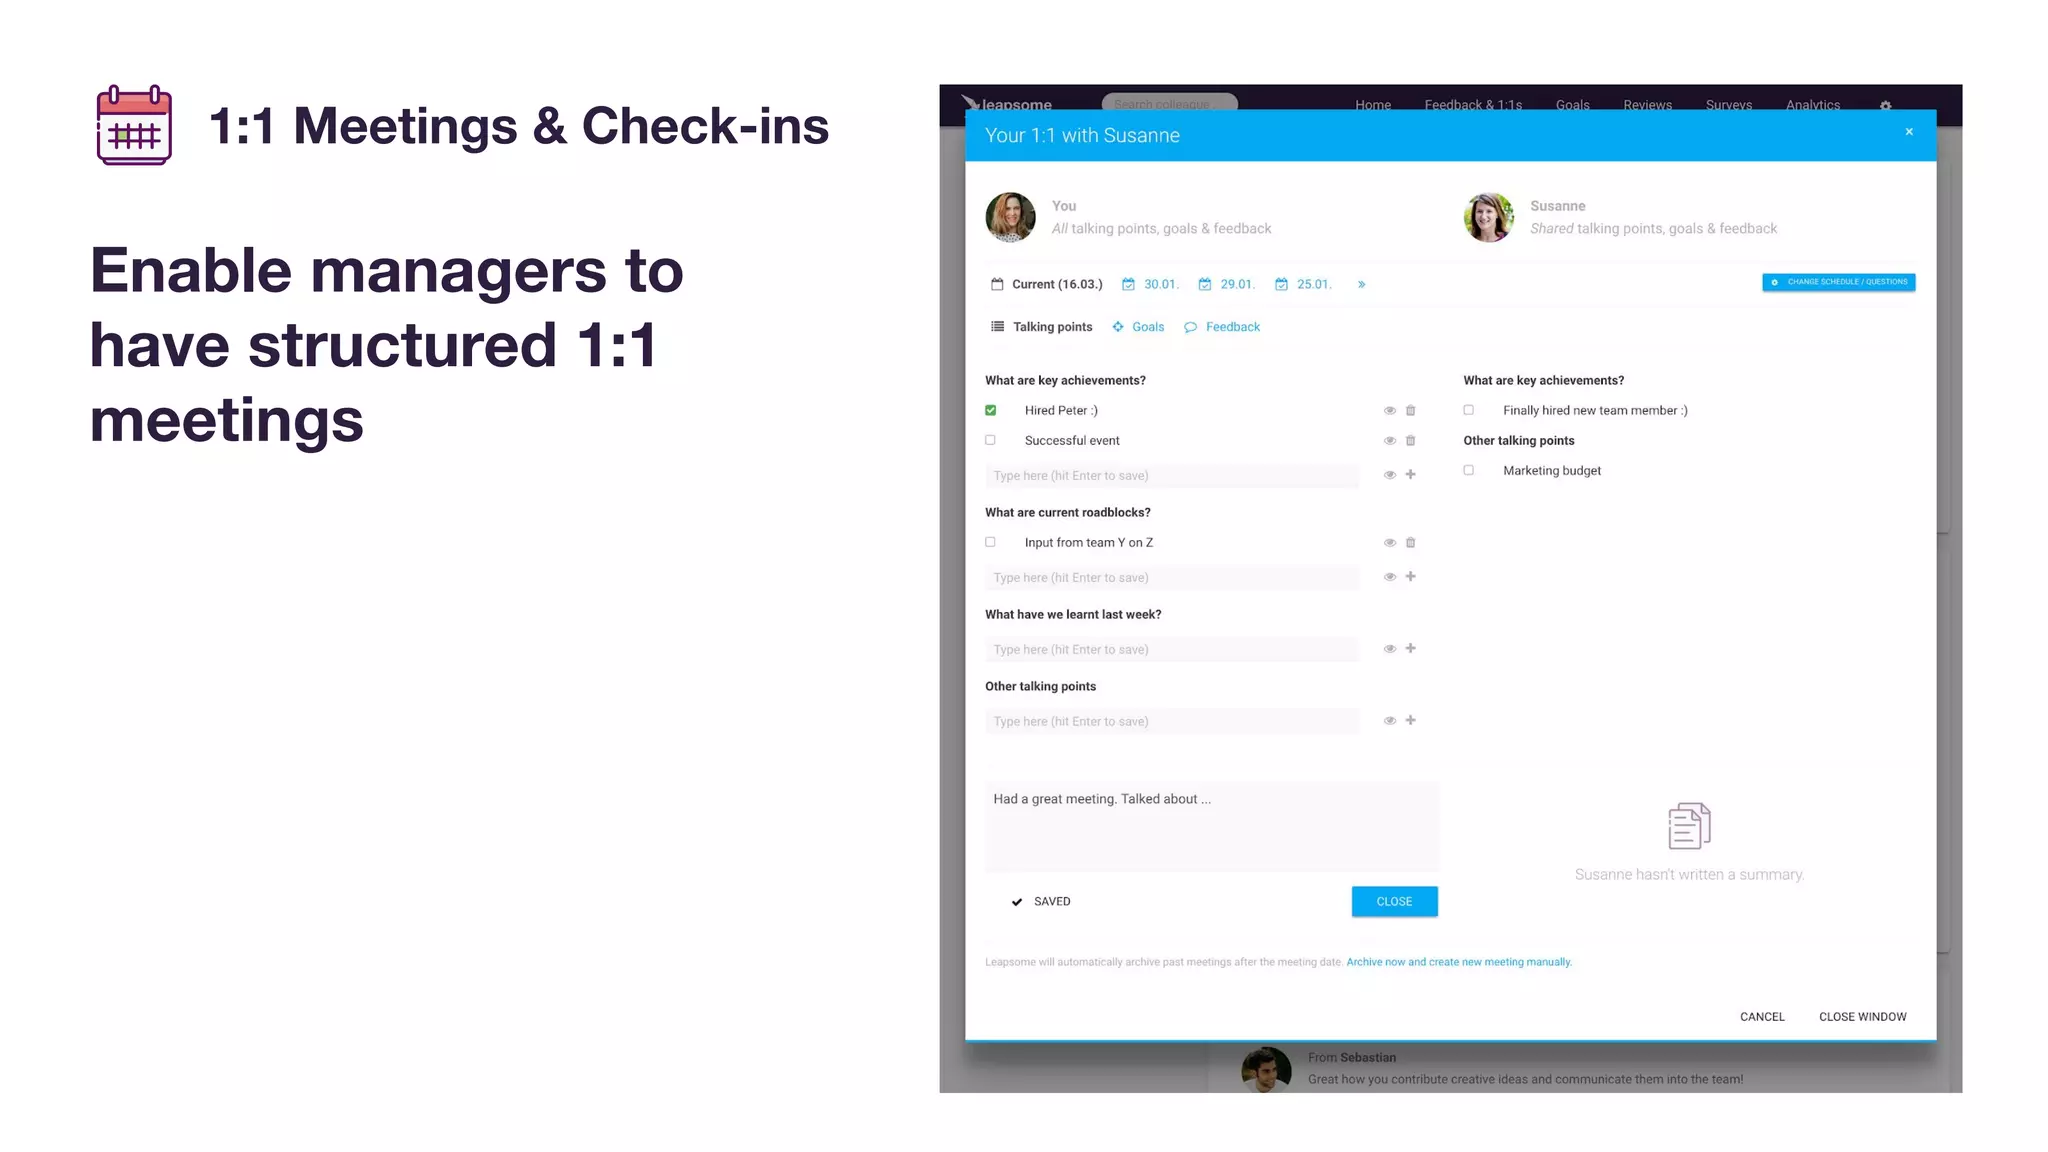
  • 1:1 Meetings & Check-ins (Slide 12)
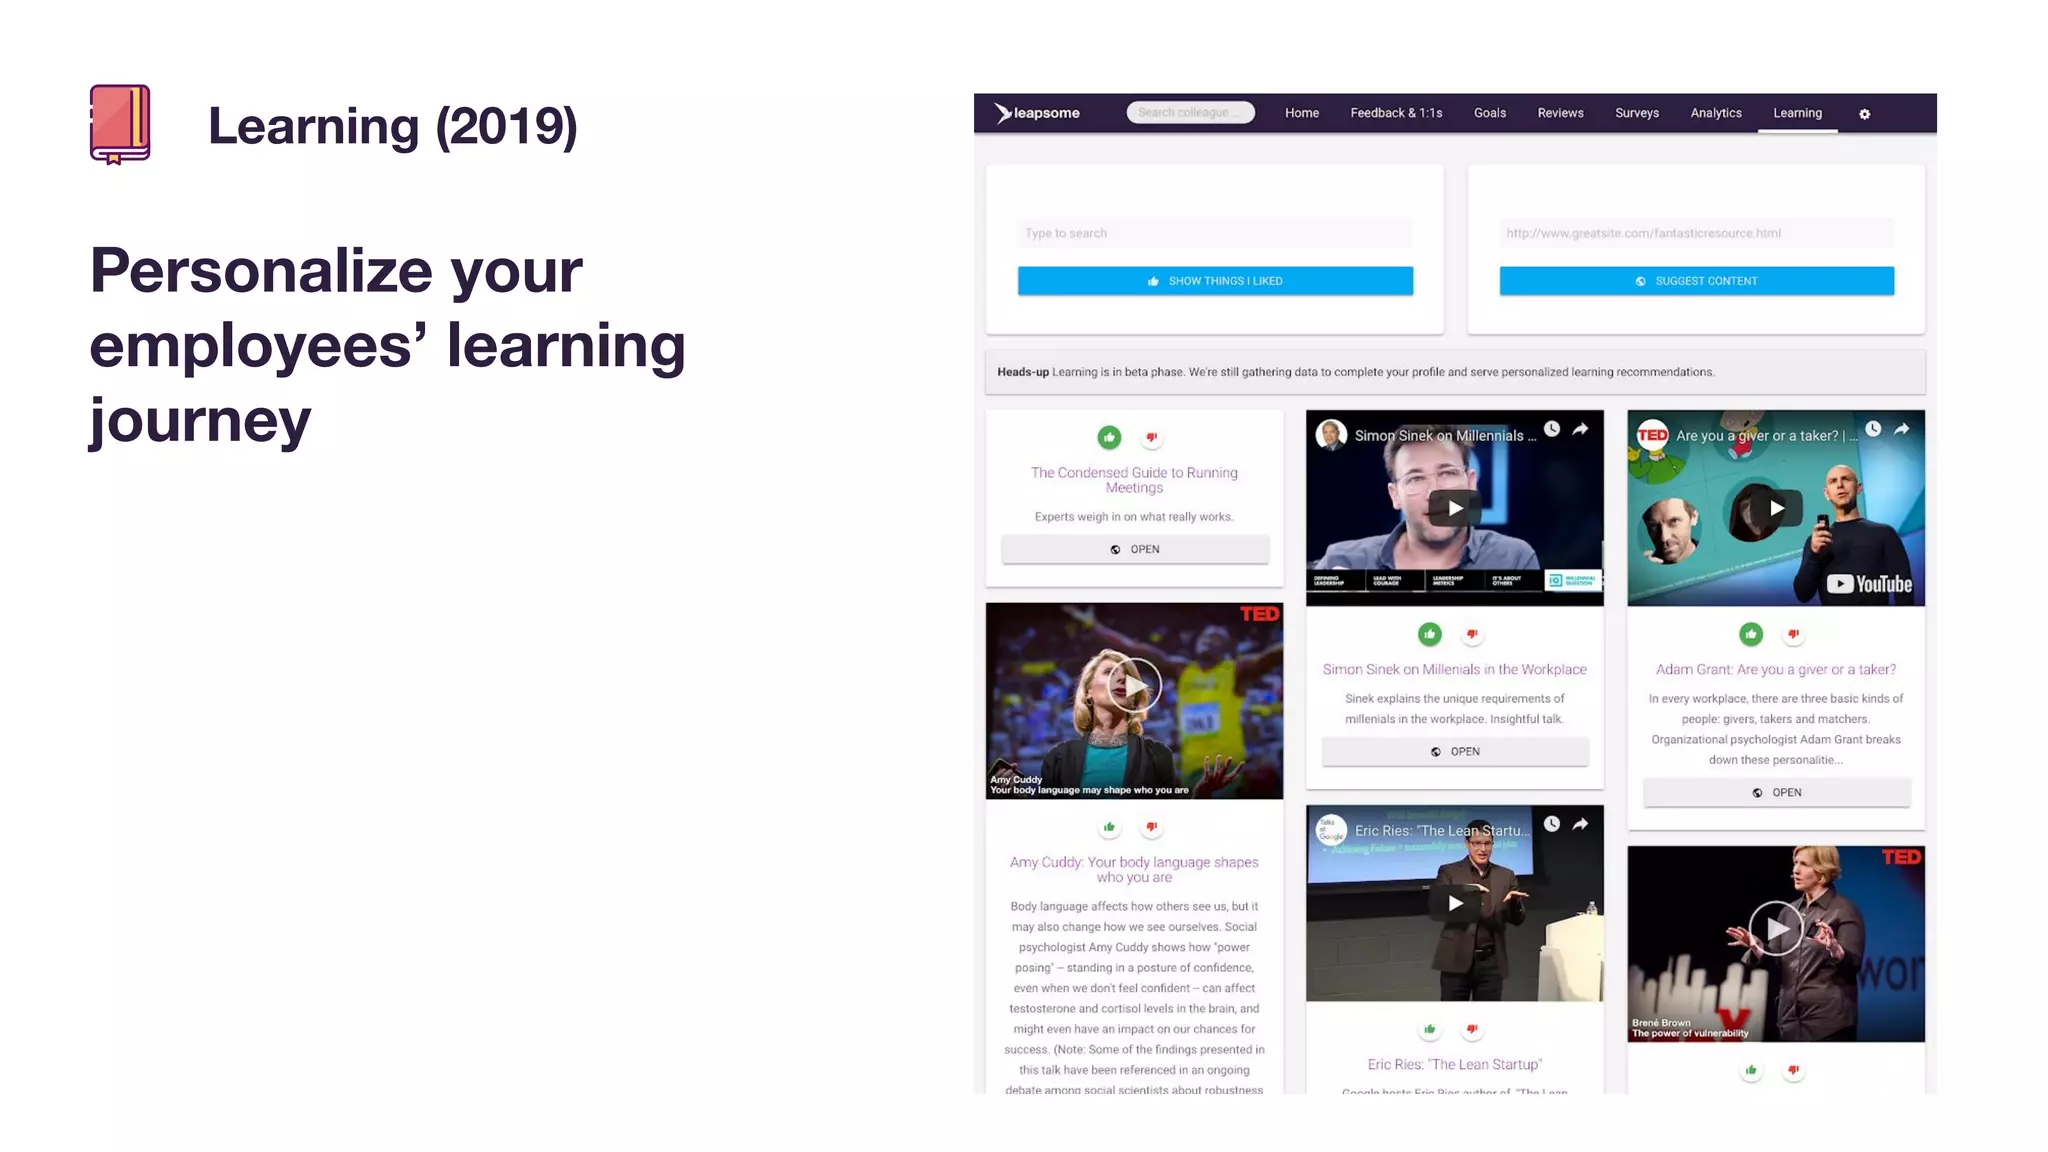
  • Personalized Learning (Slide 13)

Key Product Capabilities

  1. 360s & Performance Reviews — Multi-rater feedback with skill distribution analytics and radar chart visualizations
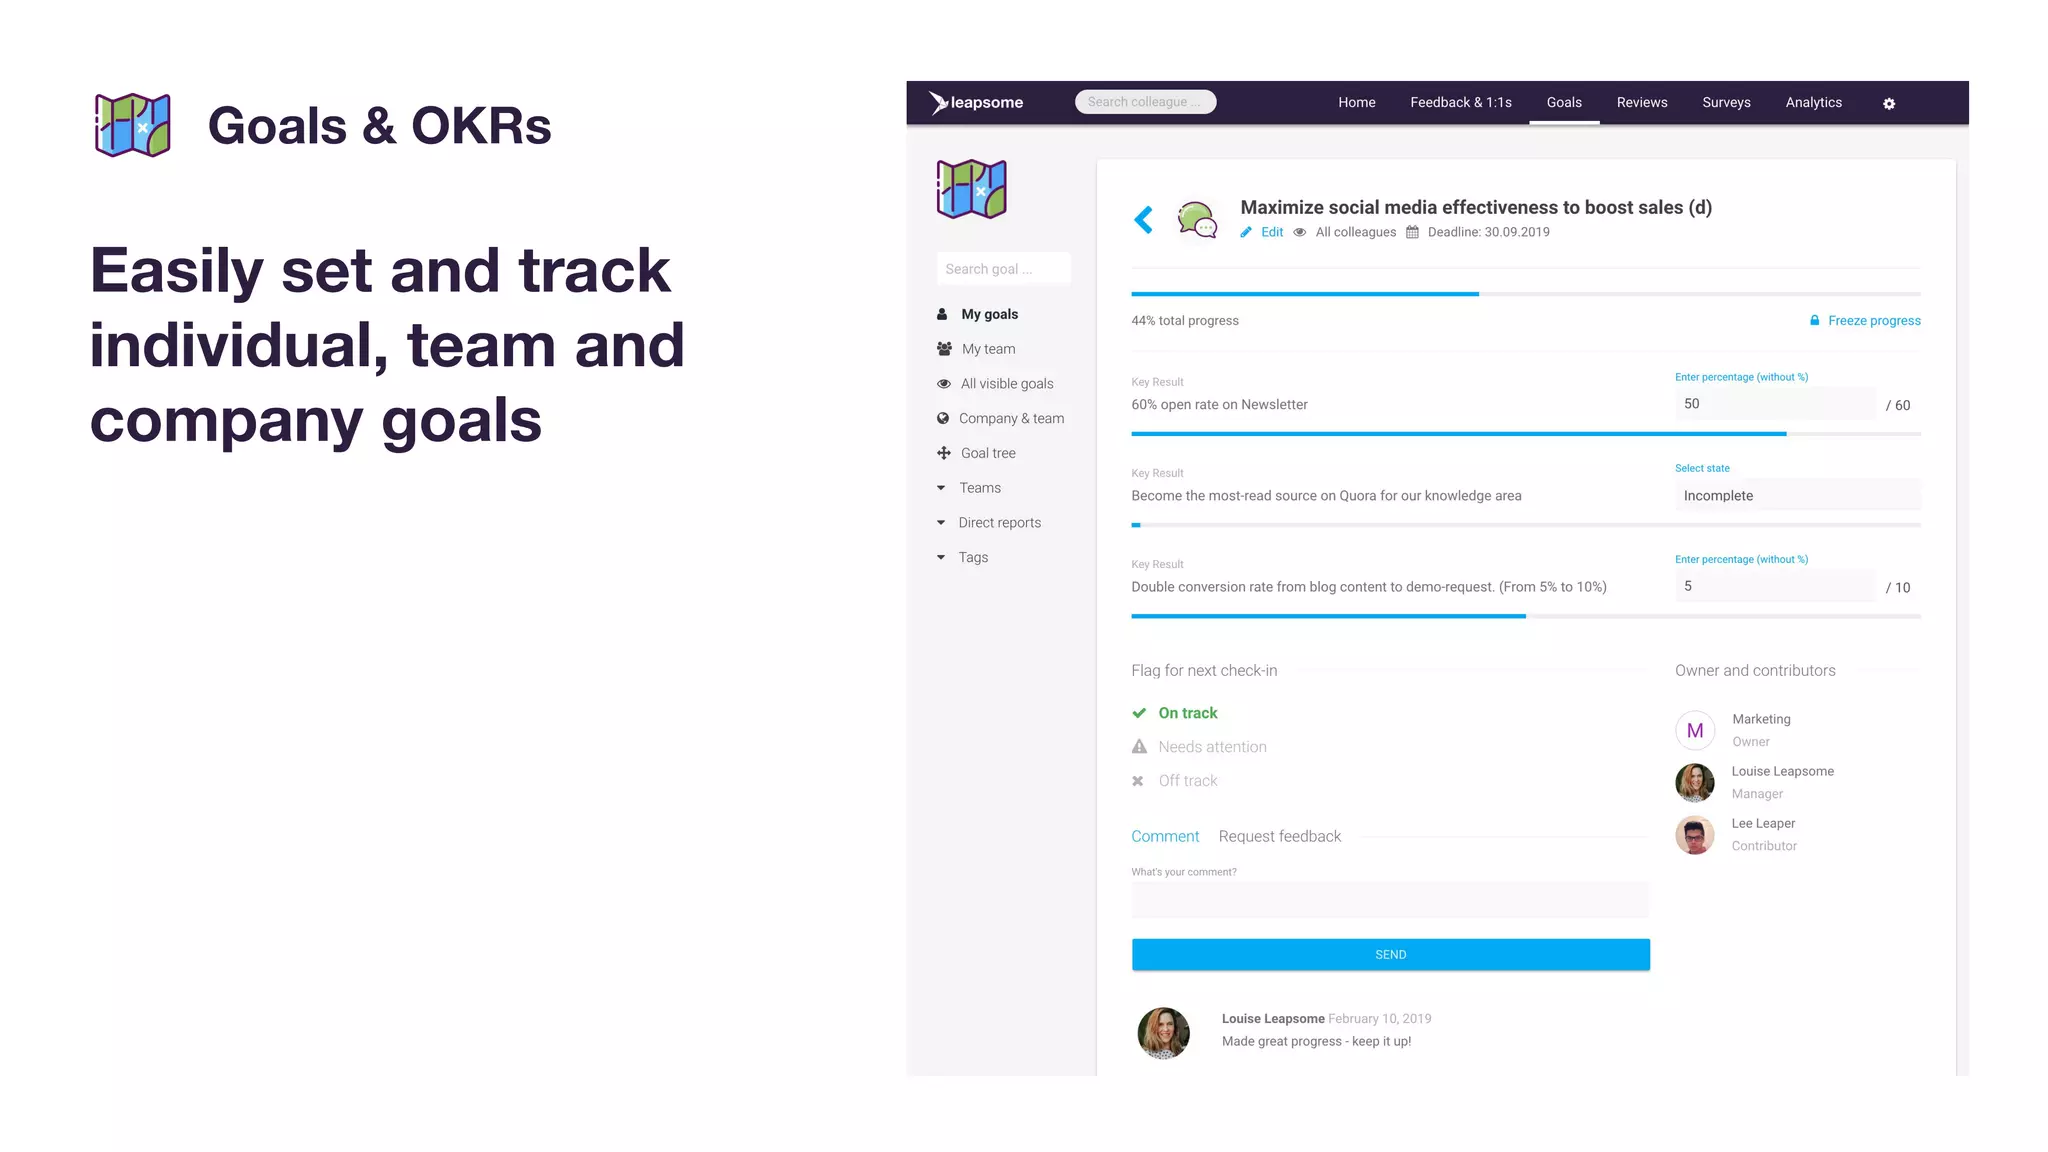
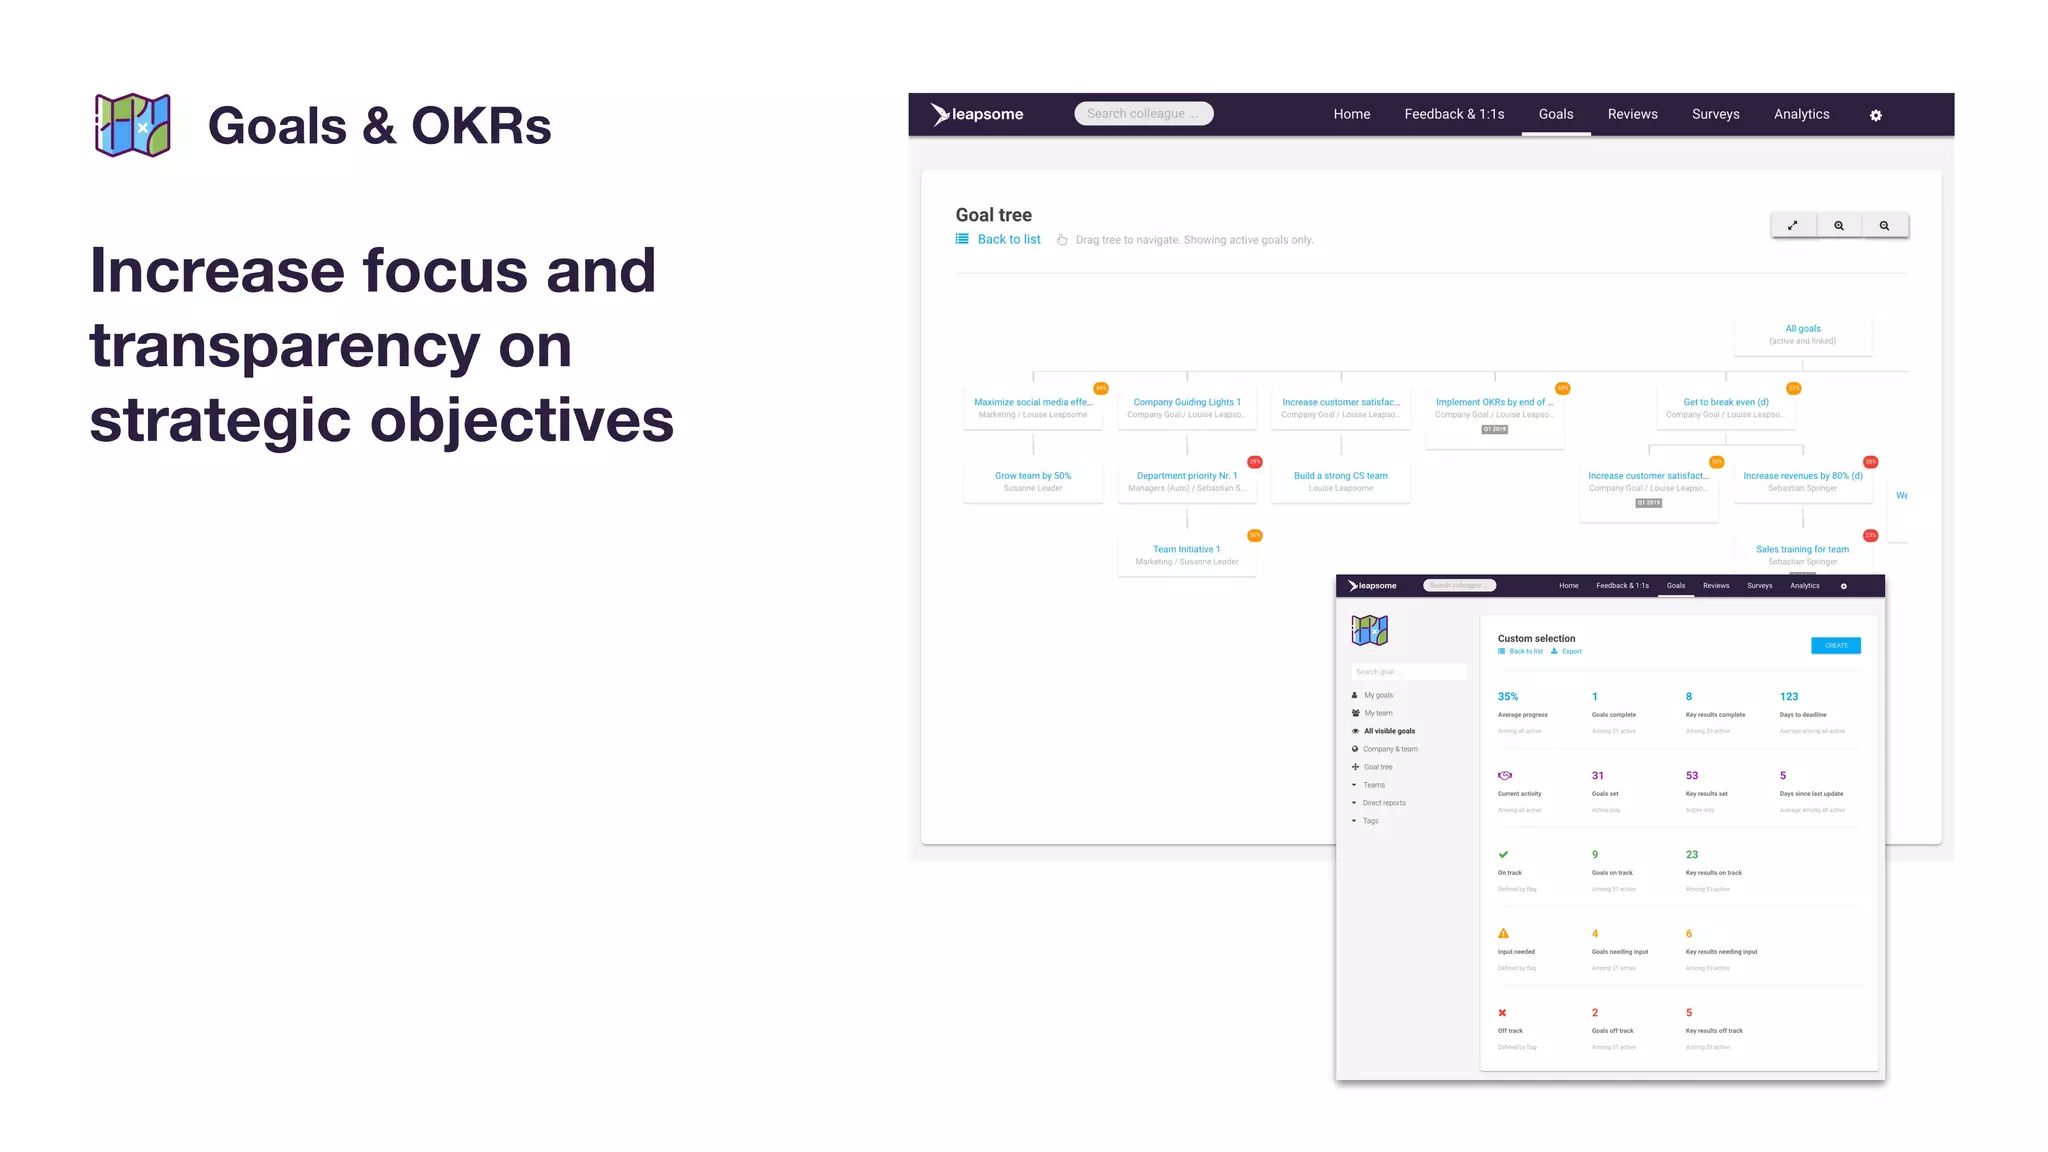
  2. Goals & OKRs — Hierarchical goal setting with cascade visualization (company → team → individual) and real-time progress tracking
  3. Surveys — Engagement pulse surveys with cross-departmental heatmap comparison and anonymous responses
  4. Feedback & Praise — Dual-mode feedback (constructive + recognition) with emoji reactions and privacy controls
  5. 1:1 Meetings — Structured agenda templates with asynchronous preparation and shared talking points
  6. Learning — Personalized learning recommendations with curated content (TED, YouTube, articles)
  7. People Analytics — Aggregated insights across reviews, feedback, goals, and surveys

Differentiation Claims (Slide 14)

  1. One-stop people enablement integrated with other tools — Addresses tool sprawl concern
  2. Modular and highly customizable — Enables sequential roll-out and enterprise flexibility
  3. SaaS & data security made in Germany / EU — GDPR compliance and European data centers
  4. Structured data & insightful people analytics — Data-driven vs. feature-driven positioning

Effectiveness: The product is comprehensive and well-demonstrated through real screenshots. However, the deck lacks:

  • Explicit competitive comparison (vs. Workday, SuccessFactors, 15Five, Lattice, etc.)
  • Quantified customer outcomes (e.g., “reduces review time by 40%”, “improves engagement by X%”)
  • Explanation of what makes analytics “insightful” vs. competitors
  • Clarity on integration capabilities and API ecosystem

Market Opportunity

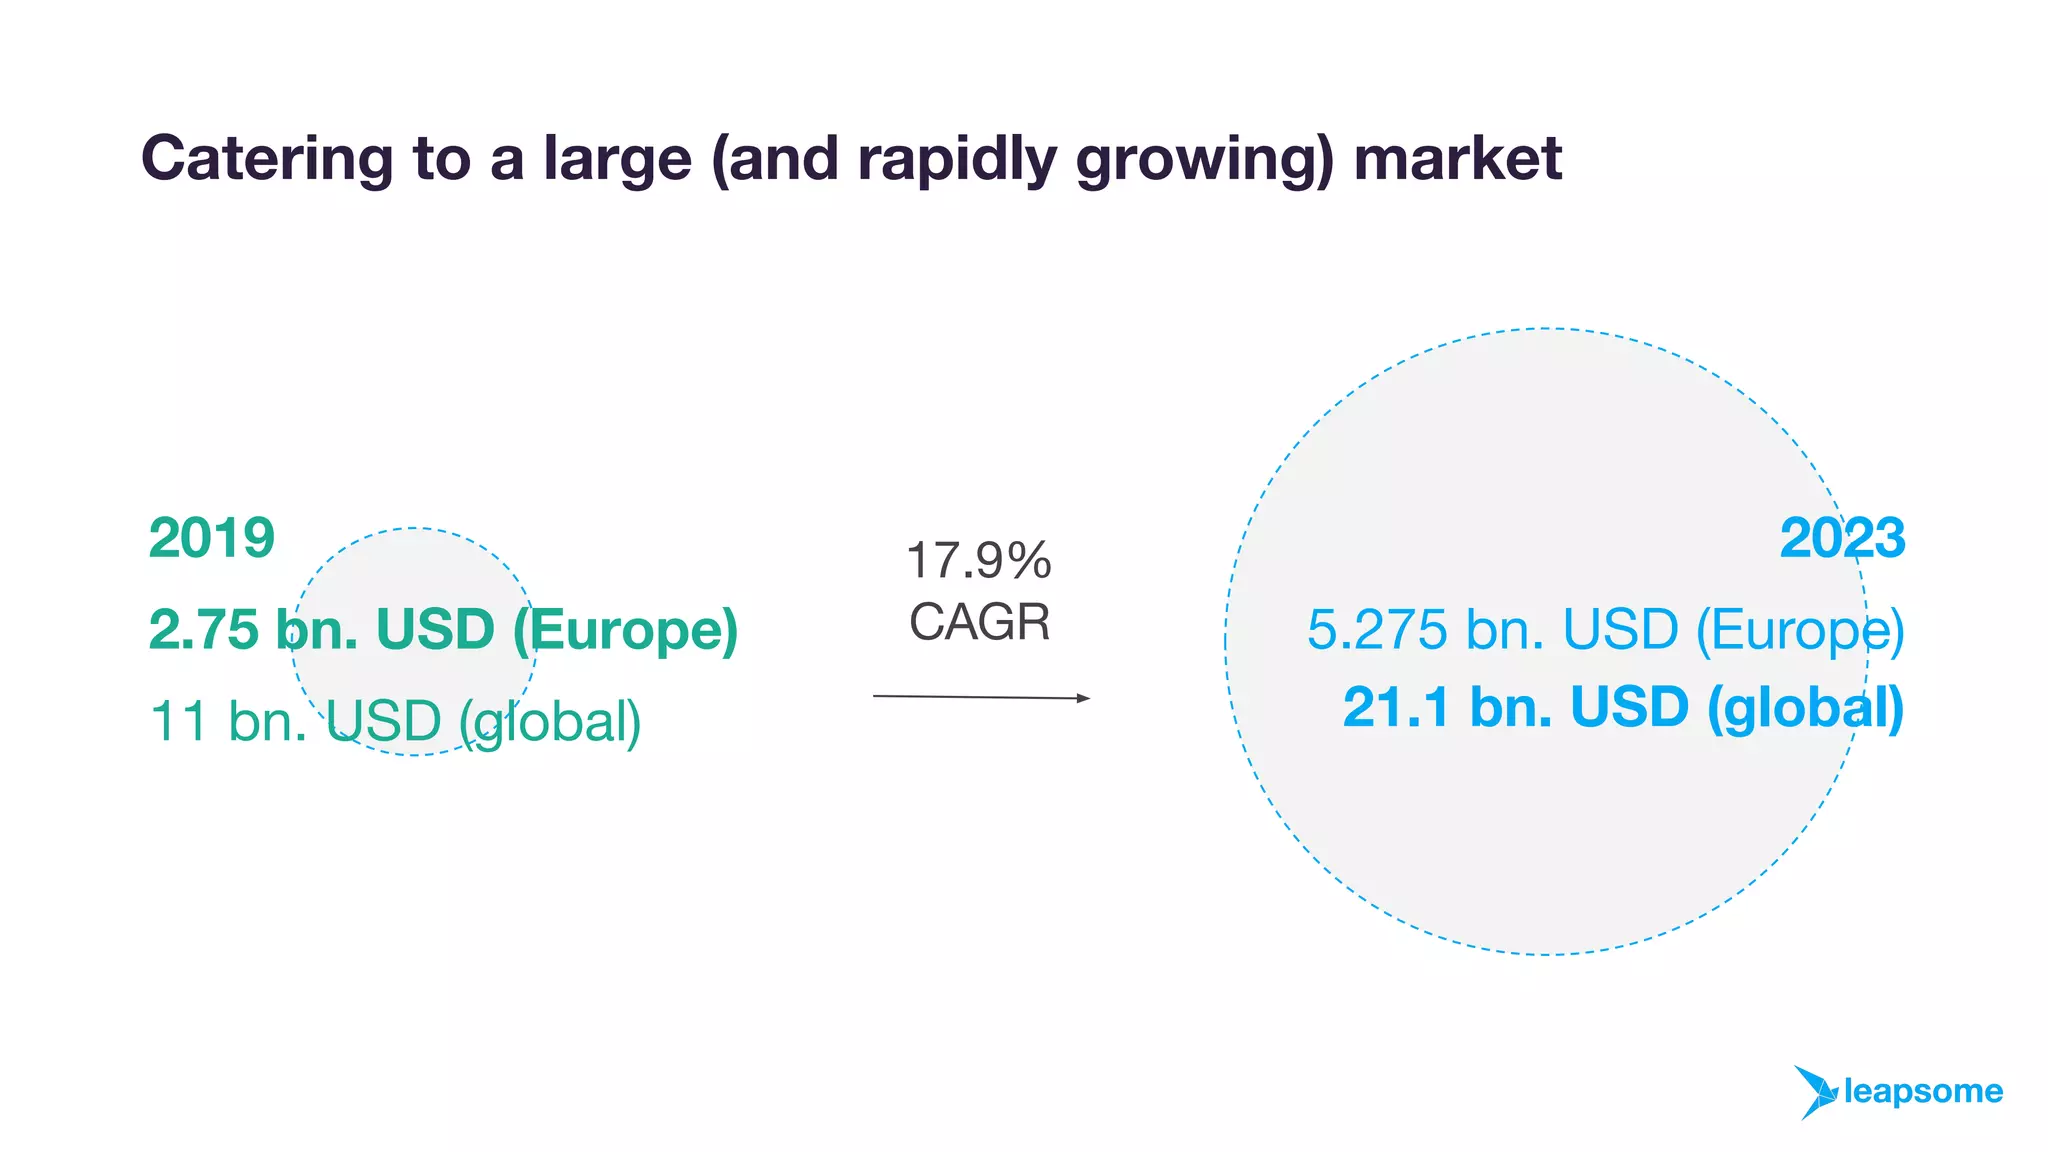
Slide 17: “Catering to a large (and rapidly growing) market”

Market Sizing

Metric 2019 2023 CAGR
Europe $2.75 billion $5.275 billion 17.9%
Global $11 billion $21.1 billion 17.9%

Market Growth: ~1.9x growth globally (11bn → 21.1bn) over 4 years

Critical Gaps in Market Analysis

The deck does not provide:

  • Market definition — What exactly is this market? (HR tech? People enablement? Performance management? Learning & development?)
  • TAM/SAM/SOM breakdown — Total addressable market vs. serviceable addressable market vs. serviceable obtainable market
  • Data source — No citation of research firm (Gartner, Forrester, IDC, etc.) or methodology
  • Growth drivers — Why is the market growing at 17.9% CAGR? (remote work? digital transformation? employee experience focus?)
  • Leapsome positioning — What portion of this market does Leapsome target? What’s the addressable market for Leapsome specifically?
  • Competitive context — Market share of competitors or Leapsome’s current position

Effectiveness: The headline numbers (17.9% CAGR, ~2x market growth) are impressive and demonstrate strong tailwind. However, without market definition or data source, investors cannot validate the claim or assess Leapsome’s addressable opportunity. This is a significant weakness for Series A investors who need to understand TAM/SAM/SOM.

Business Model

Not explicitly shown in deck. Based on product positioning and customer base, likely:

  • SaaS subscription model (per-user or per-company pricing)
  • Target segments: SME (small/medium enterprise) and Enterprise
  • Geographic focus: Europe (especially Germany/EU), expanding globally

Slide 18 mentions two distinct segments:

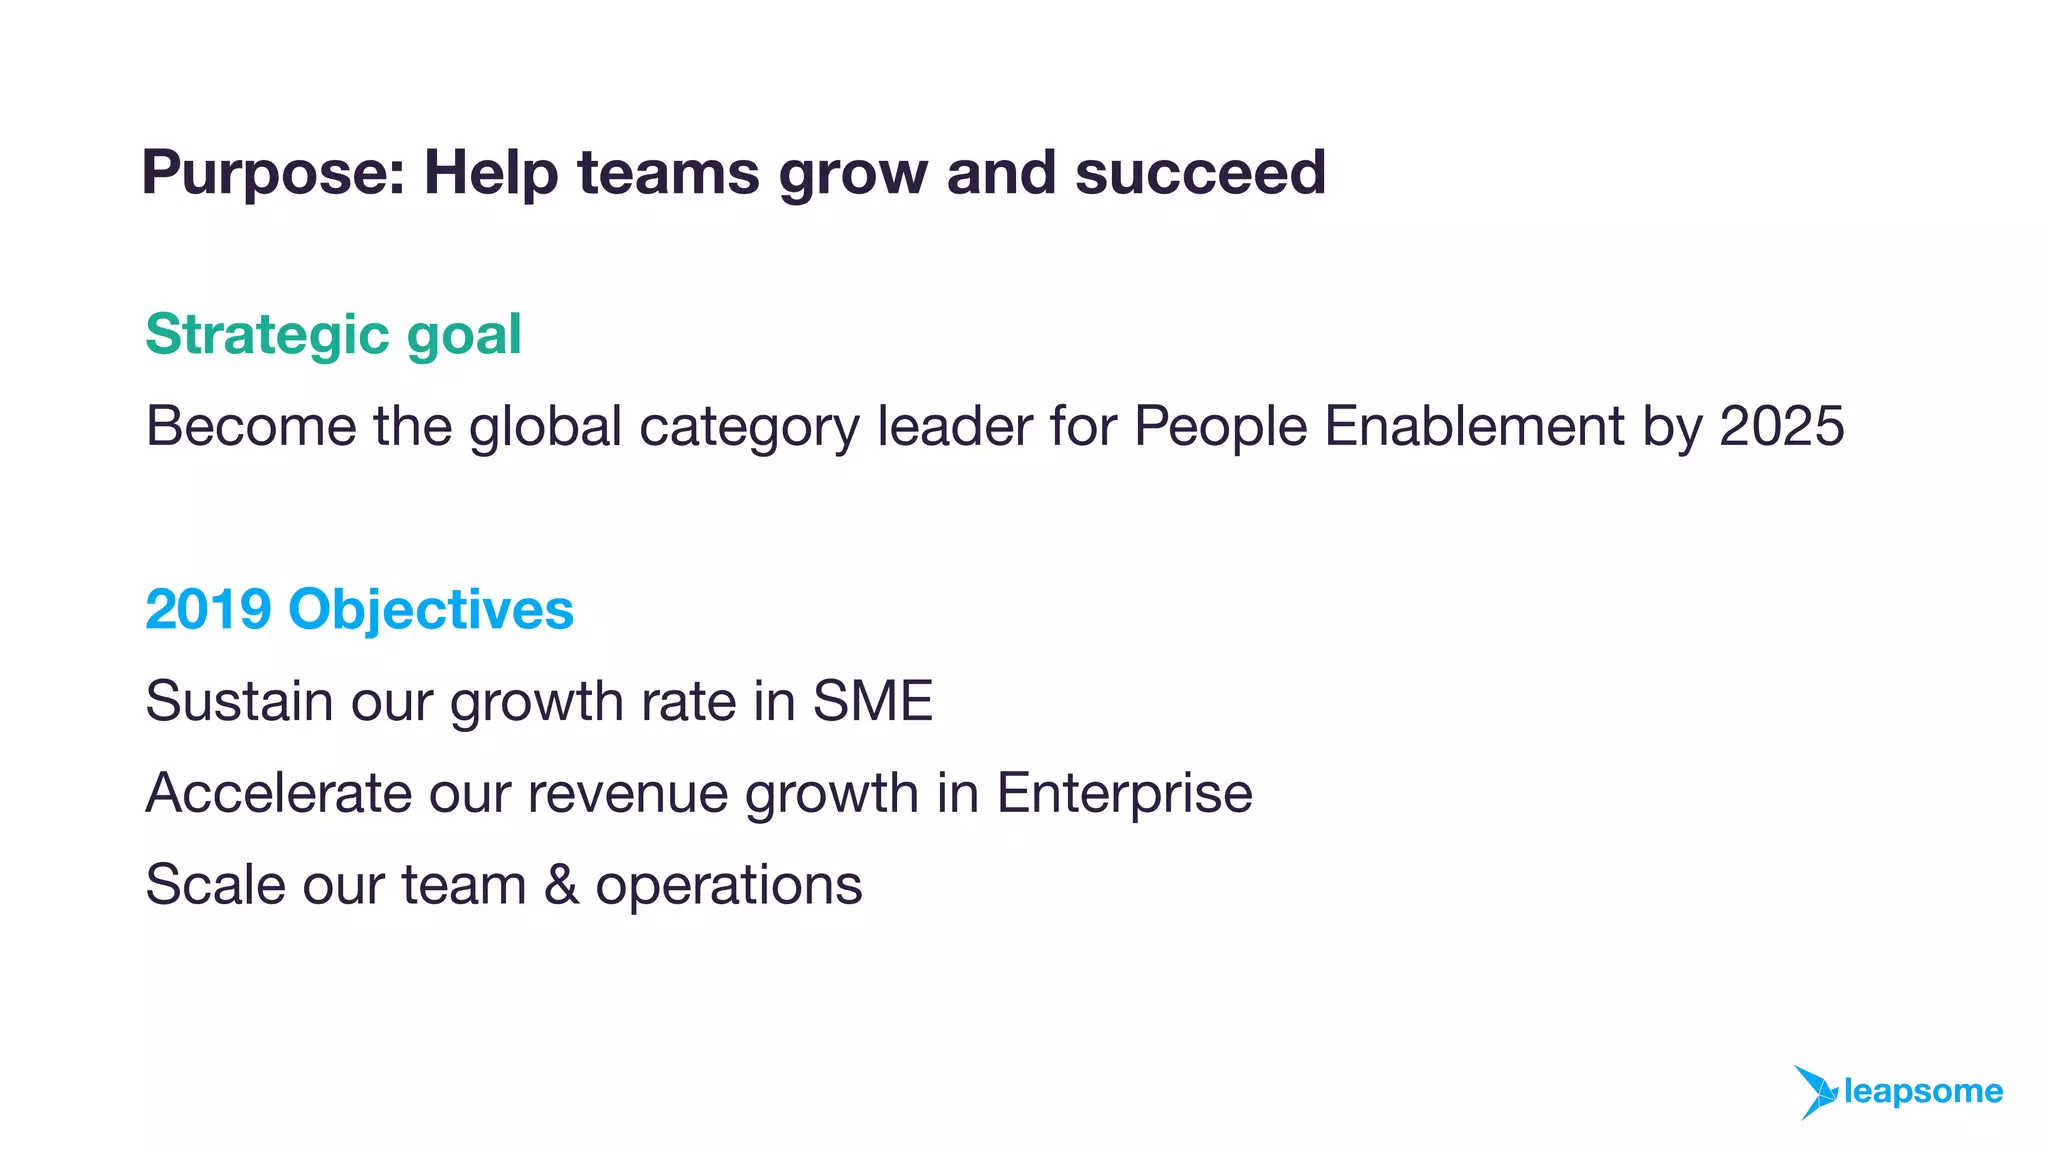
  • SME: “Sustain our growth rate in SME”
  • Enterprise: “Accelerate our revenue growth in Enterprise”

This suggests different pricing, GTM, or product strategies by segment, but the deck doesn’t explain:

  • Pricing tiers or unit economics
  • Average contract value (ACV) by segment
  • Customer acquisition cost (CAC) or lifetime value (LTV)
  • Gross margin or net revenue retention (NRR)
  • Sales cycle length or sales model (self-serve vs. sales-led)

Critical Gap: Series A investors typically require detailed unit economics and business model clarity. This deck lacks that specificity.

Traction & Metrics

Growth Metrics

Slide 16: “Average MoM growth rate over past 12m: 23% p.m.”

  • Metric: 23% month-over-month growth (June 2018 – May 2019)
  • Trend: Consistent upward trajectory with acceleration from January 2019 onward
  • Visualization: Stacked bar chart with trend line overlay

Critical Gaps:

  • Metric definition unclear — Is this MRR (Monthly Recurring Revenue)? Customer count? Usage/engagement? The deck doesn’t specify.
  • No absolute numbers — Doesn’t show starting value (June 2018) or ending value (May 2019)
  • No baseline context — Doesn’t explain what the company was growing from
  • Stacked bar categories unexplained — Two colors suggest two categories, but no legend
  • Red indicator unexplained — Small red line at bottom right is unclear (churn? negative metric?)

Customer Traction

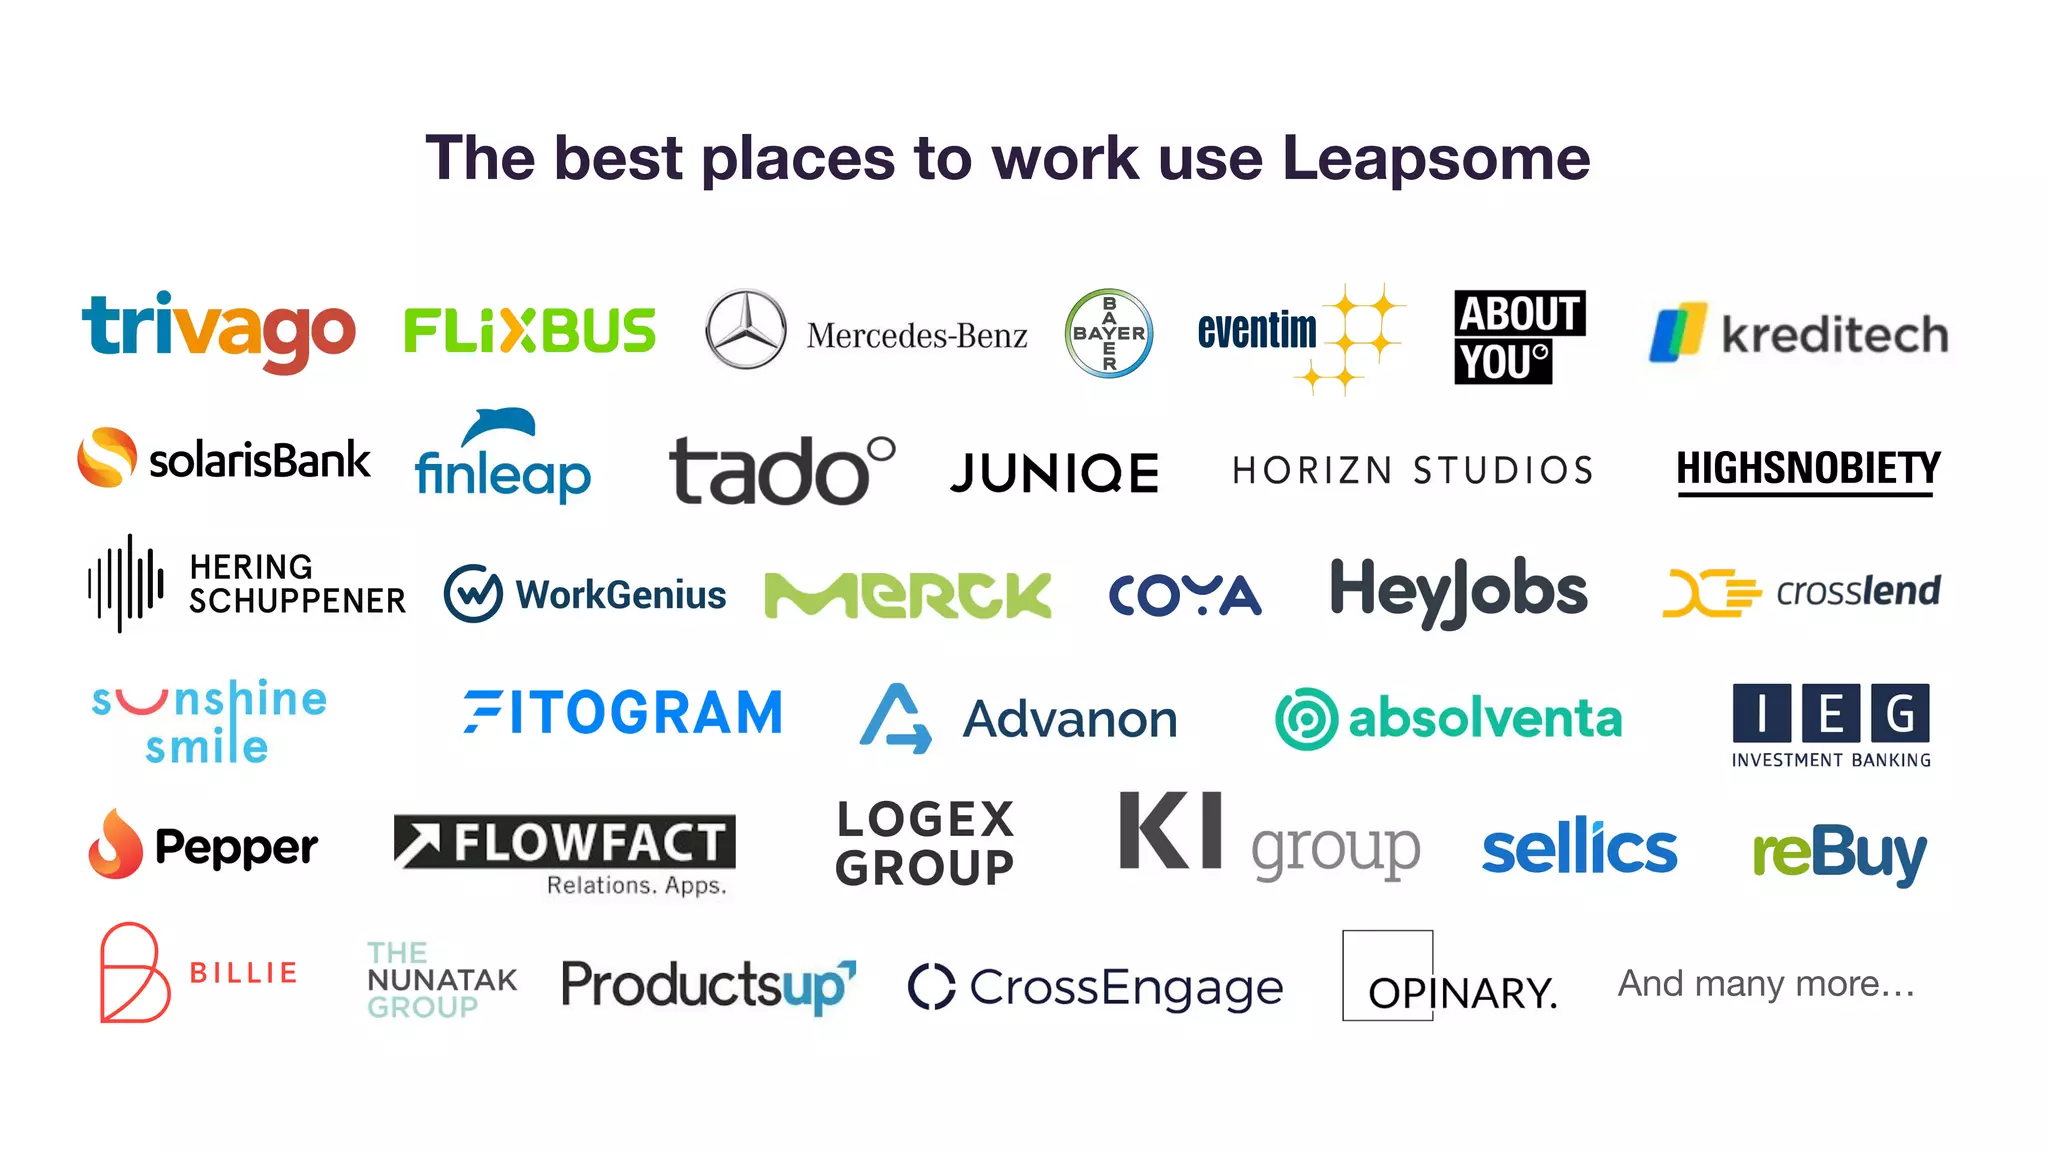
Slide 15: “The best places to work use Leapsome”

  • Customer count: 30+ visible logos (exact count unclear; “And many more…” suggests additional customers)
  • Notable customers:
    • Enterprise: Mercedes-Benz, Bayer, Merck
    • High-growth startups: trivago, FlixBus, Billie, Juniqe
    • Fintech: SolarisBank, finleap, Coya, Advanon, Pepper
    • E-commerce: tado°, Horizn Studios, Sellics, reBuy
    • HR Tech: WorkGenius, HeyJobs
  • Geographic concentration: Primarily European (German, UK, EU-based)

Critical Gaps:

  • No customer count quantification — “And many more…” is vague; doesn’t specify total customers
  • No customer metrics — Doesn’t show:
    • Customer acquisition timeline
    • Retention/churn rates
    • Net revenue retention (NRR)
    • Customer satisfaction (NPS, CSAT)
    • Deal sizes or contract values
  • No customer stories — Doesn’t show specific use cases, outcomes, or testimonials
  • No growth trajectory — Doesn’t show customer growth over time

Overall Traction Assessment

Strengths:

  • 23% MoM growth is impressive for SaaS
  • 30+ recognizable customers including enterprise brands (Mercedes-Benz, Bayer, Merck)
  • Mix of startups and enterprises shows platform scalability

Weaknesses:

  • Growth metric definition is ambiguous
  • No absolute revenue or customer numbers
  • No retention/satisfaction metrics
  • No customer outcome data
  • No forward-looking projections

Competitive Positioning

Slide 14: “What makes us different”

Stated Differentiators

  1. One-stop people enablement integrated with other tools
    • Addresses tool sprawl and integration complexity
    • Implies broader feature set than point solutions
  2. Modular and highly customizable
    • Enables sequential roll-out (reduces implementation risk)
    • Appeals to enterprise buyers with specific needs
  3. SaaS & data security made in Germany / EU
    • GDPR compliance and European data centers
    • Addresses data privacy concerns (especially relevant post-GDPR)
    • Geographic advantage for EU customers
  4. Structured data & insightful people analytics
    • Data-driven positioning vs. feature-driven competitors
    • Implies superior analytics capabilities

Competitive Landscape (Inferred)

The deck doesn’t explicitly name competitors, but implied competitors based on product positioning:

  • Full-suite HR platforms: Workday, SuccessFactors, BambooHR
  • Performance management: 15Five, Lattice, Culture Amp
  • Learning & development: LinkedIn Learning, Cornerstone OnDemand
  • Engagement/surveys: Officevibe, Peakon, Glint

Critical Gaps

  • No explicit competitive comparison — Doesn’t show feature/pricing comparison vs. named competitors
  • No market share data — Doesn’t show Leapsome’s position vs. competitors
  • Vague differentiation claims — “Integrated”, “customizable”, “analytics” are common in HR tech; doesn’t explain how Leapsome is different
  • No proof of differentiation — No data, customer quotes, or benchmarks backing claims
  • “Made in Germany” appeal limited — Relevant to EU buyers but may not resonate globally

Effectiveness: The differentiation is reasonable but lacks specificity and proof. For Series A investors, this is a weakness—they need to understand why Leapsome will win vs. well-funded competitors.

Team

Slide 19: Contact Information

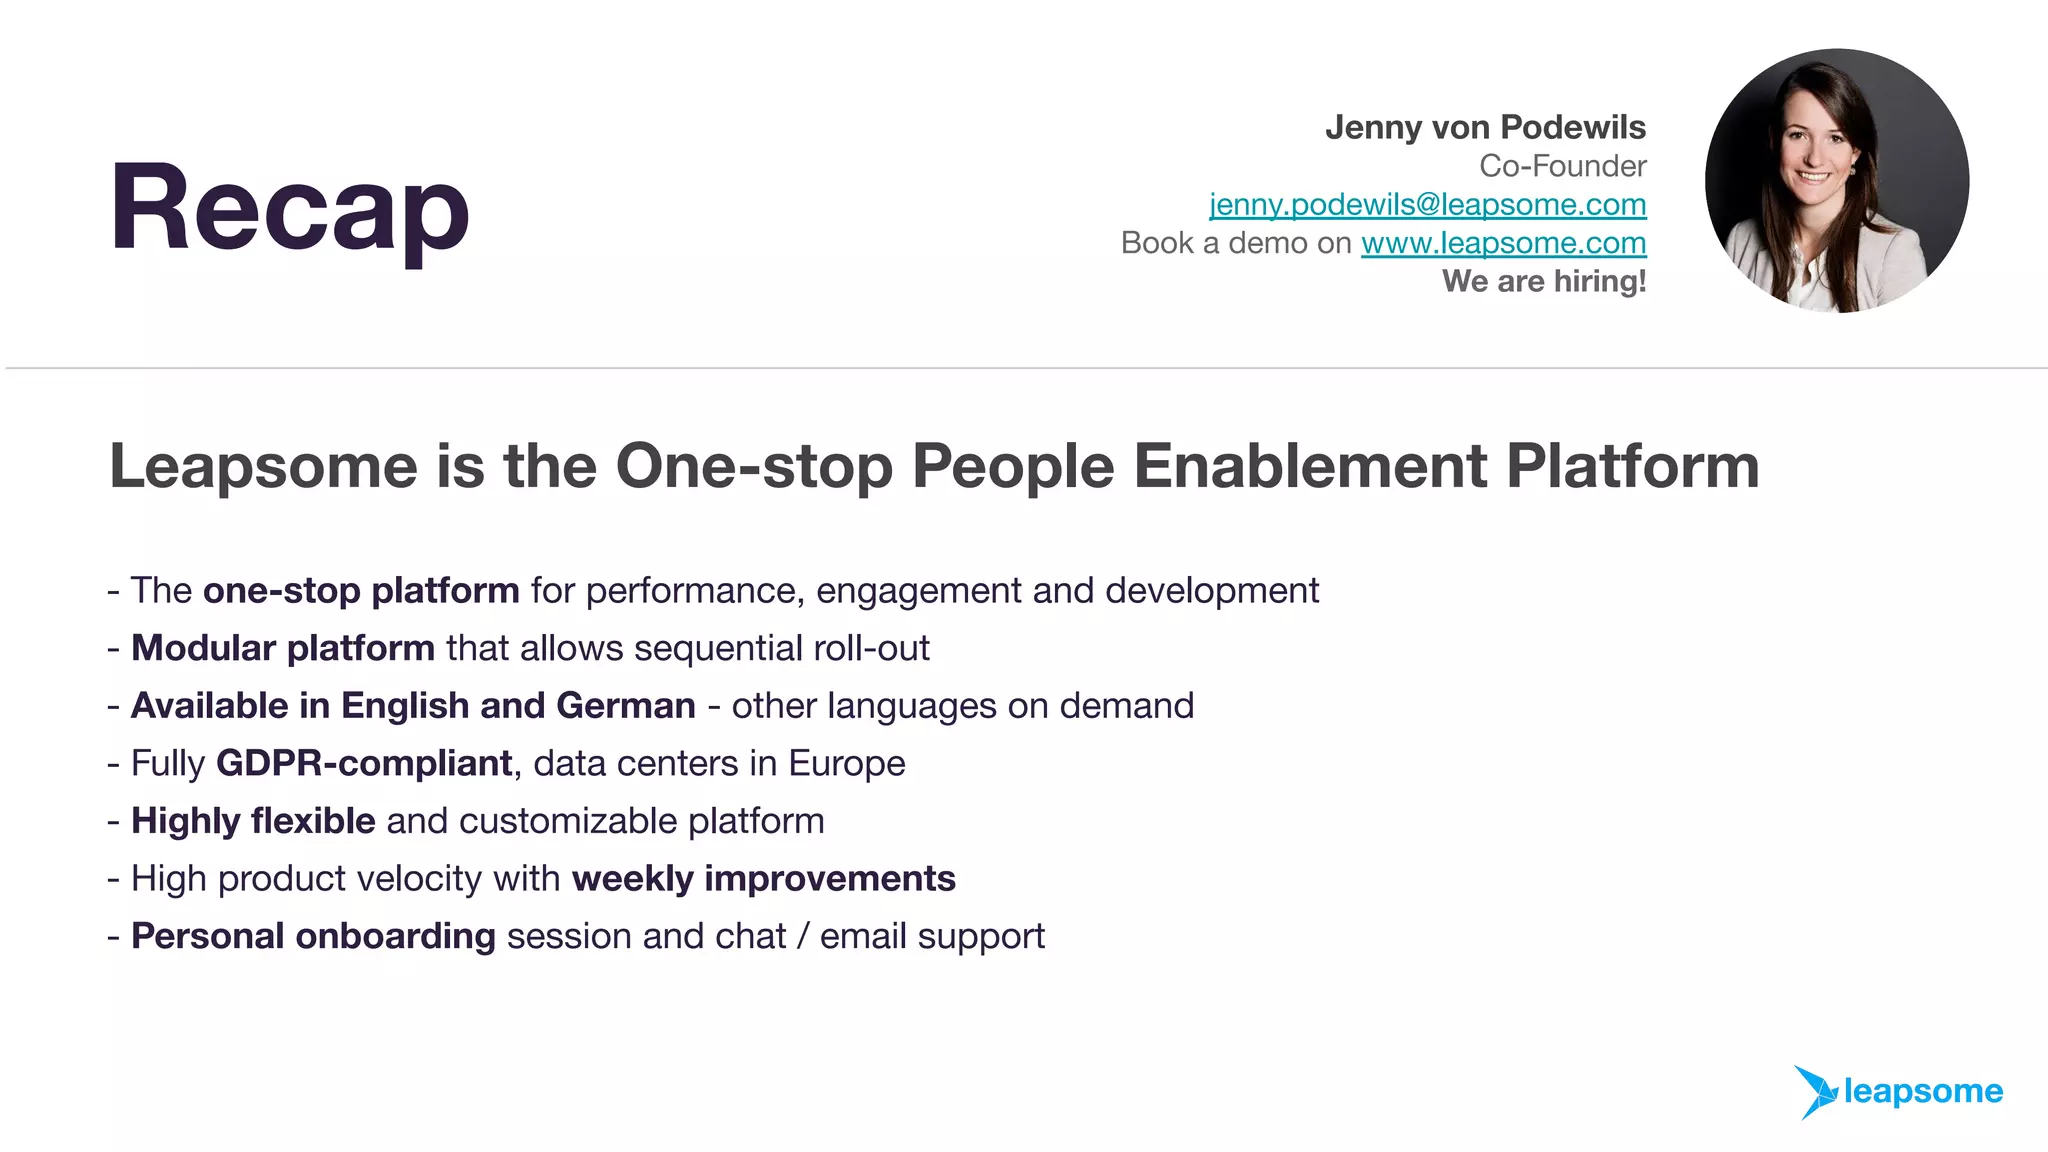
  • Founder shown: Jenny von Podewils, Co-Founder
  • Contact: [email protected]
  • Hiring status: “We are hiring!”

Critical Gap: The deck lacks a dedicated team slide showing:

  • Full founding team (names, titles, photos)
  • Key hires and their backgrounds
  • Relevant experience and credentials
  • Organizational structure
  • Board members or advisors

This is a significant weakness for a Series A pitch. Investors typically evaluate team as heavily as product and market. The lack of team information suggests either:

  1. The team is not well-known/credentialed (risk factor)
  2. The deck was adapted from a conference presentation (Slide 2 suggests this)
  3. Team information is provided separately in appendix or during presentation

What we can infer:

  • Jenny von Podewils is a co-founder (suggests at least 2 founders)
  • Company is actively hiring (signals growth confidence)
  • No information on team size, backgrounds, or key hires

Go-to-Market Strategy

Not explicitly shown in deck.

Inferred GTM Strategy

Based on customer base and positioning:

Customer Segments:

  • SME (Small/Medium Enterprise): “Sustain our growth rate in SME” (Slide 18)
  • Enterprise: “Accelerate our revenue growth in Enterprise” (Slide 18)

Geographic Focus:

  • Primary: Europe (especially Germany/EU) — evidenced by “Made in Germany” positioning, European data centers, English/German language support
  • Secondary: Global expansion (implied by “global category leader by 2025” goal)

Sales Model (Inferred):

  • Likely mix of self-serve (SME) and sales-led (Enterprise)
  • Personal onboarding and support mentioned (Slide 19) suggests enterprise-focused approach

Marketing Channels (Inferred):

  • Conference presence (NOAH Conference, Slide 2)
  • Content marketing (recognizable customers suggest word-of-mouth)
  • Direct sales for enterprise

Critical Gaps:

  • No explicit GTM strategy shown
  • No sales model or sales cycle information
  • No marketing budget or channel allocation
  • No customer acquisition cost (CAC) or payback period
  • No expansion strategy (upsell, cross-sell, geographic expansion)

The Ask

Not explicitly stated in deck.

What We Know

  • Series A amount: $60M (from context)
  • Valuation: $400M+ (from context, post-Series A)
  • Use of funds: Not specified in deck

Inferred Use of Funds

Based on Slide 18 objectives, likely allocation:

  1. Sales & Marketing — “Accelerate our revenue growth in Enterprise”
  2. Product Development — “High product velocity with weekly improvements” (Slide 19)
  3. Team & Operations — “Scale our team & operations” (Slide 18)
  4. Geographic Expansion — Implied by “global category leader by 2025” goal

Critical Gap: The deck does not explicitly state:

  • Series A amount being raised
  • Use of funds breakdown (% to sales, product, operations, etc.)
  • Hiring plans or team expansion targets
  • Geographic expansion timeline
  • Product roadmap or feature priorities

This is a significant omission for Series A investors who need to understand how capital will be deployed.

Investor Deep Dive

Executive summary, strengths & red flags

Executive Summary

Leapsome is a one-stop people enablement platform addressing the €96,334 cost of employee turnover by enabling organizations to manage performance, engagement, and development in a single integrated system. The deck effectively establishes a compelling problem (51% of employees actively/passively job searching), demonstrates product breadth across seven core modules, and showcases traction with 30+ recognizable customers including Mercedes-Benz, Bayer, and Merck. However, the pitch lacks critical specificity around team credentials, exact funding ask/use of funds, and quantified targets for the Series A period, which are typical expectations for Series A investors.

Key Strengths

6 identified

1

Clear Problem Articulation with Financial Quantification

- Slide 4 shows €96,334 cost to replace employee + 51% of employees job searching

2

Comprehensive Product Demonstration with Real Screenshots

- Slides 6-13 show actual product UI across seven modules

3

Impressive Customer Roster with Enterprise Brands

- Slide 15 shows 30+ customers including Mercedes-Benz, Bayer, Merck

4

Strong Growth Metrics

- Slide 16 shows 23% MoM growth over 12 months

5

European Market Focus with Data Privacy Advantage

- Slide 14 emphasizes "Made in Germany / EU" + GDPR compliance + European data centers

6

Integrated Platform Positioning

- Slide 5 shows seven modules organized around three outcome pillars

Red Flags & Weaknesses

10 identified

1

Ambiguous Growth Metric Definition

- Slide 16 states "23% MoM growth" but doesn't define metric (MRR? customers? engagement?)

2

Missing Team Credentials and Organizational Structure

- Slide 19 shows only one co-founder (Jenny von Podewils); no team slide

3

No Explicit Funding Ask or Use of Funds

- Deck doesn't state Series A amount or allocation

4

Market Opportunity Lacks Definition and Source

- Slide 17 shows $2.75bn (Europe) / $11bn (global) market but no data source or market definition

5

Competitive Differentiation Lacks Proof

- Slide 14 lists four differentiators but provides no data, customer quotes, or benchmarks

6

No Customer Outcome Data or Retention Metrics

- Slide 15 shows customer logos but no NPS, CSAT, retention rate, or customer outcomes

7

Strategic Goals Lack Quantification and Intermediate Milestones

- Slide 18 states "Become global category leader by 2025" but doesn't define "leader" or show intermediate milestones

8

Learning Module Marked as "Beta"

- Slide 13 states "Learning is in beta phase. We're still gathering data..."

9

No Competitive Comparison or Market Share Data

- Deck doesn't name competitors or show Leapsome's position vs. competitors

10

Deck Appears Adapted from Conference Presentation

- Slide 2 is NOAH Conference social media slide (unusual for Series A pitch)

More Pitch Decks To Study

Compare structure, fundraising context, and investor-facing story across similar startup decks.