Compare your deck to SafeGraph

Compare Your Deck

SafeGraph Pitch Deck (2017)

SaaS
Stage: Series A
Raised: $16M
Year: 2017
Slides: 14
Outcome: Acquired by Dewey (2023)

Pitch Deck

1 / 14
SafeGraph pitch deck - The Opening: Clear brand and positioning
Click to expand

Deck Analysis

This Series A SafeGraph deck (2017) presents a focused data company positioning itself as the "system of truth" for physical places. The slides quickly establish market timing, product scope (places, geometry, foot-traffic patterns), a single-minded product strategy (data-only, truth-focused), an open standard initiative (Placekey), evidence of traction (customers and community), and an experienced team. Notable elements include a tightly consistent visual identity, strong emphasis on data quality and standards, and concrete metrics and ecosystem plays that signal defensibility and network effects.

The Opening: Clear brand and positioning

The Opening: Clear brand and positioning

Slide 1 is a clean, professional cover that sets the tone: a strong logo, tagline "The Source of Truth for Physical Places," and restrained layout. The simple, confident creative briefs the audience immediately — this is a data-first company with a mission to be authoritative. The design choice to foreground a single phrase (source of truth) signals focus and helps investors anchor subsequent slides to that claim.

For founders, this demonstrates the value of a focused opening: a memorable tagline + minimal visual noise primes listeners and gives a single frame of reference for the rest of the pitch. It’s effective because it isn’t trying to sell everything at once — it makes a single claim and then proves it on later slides.

Key Takeaway: Lead with one clear positioning statement that the rest of your deck can consistently reinforce.
Market moment: Why now

Market moment: Why now

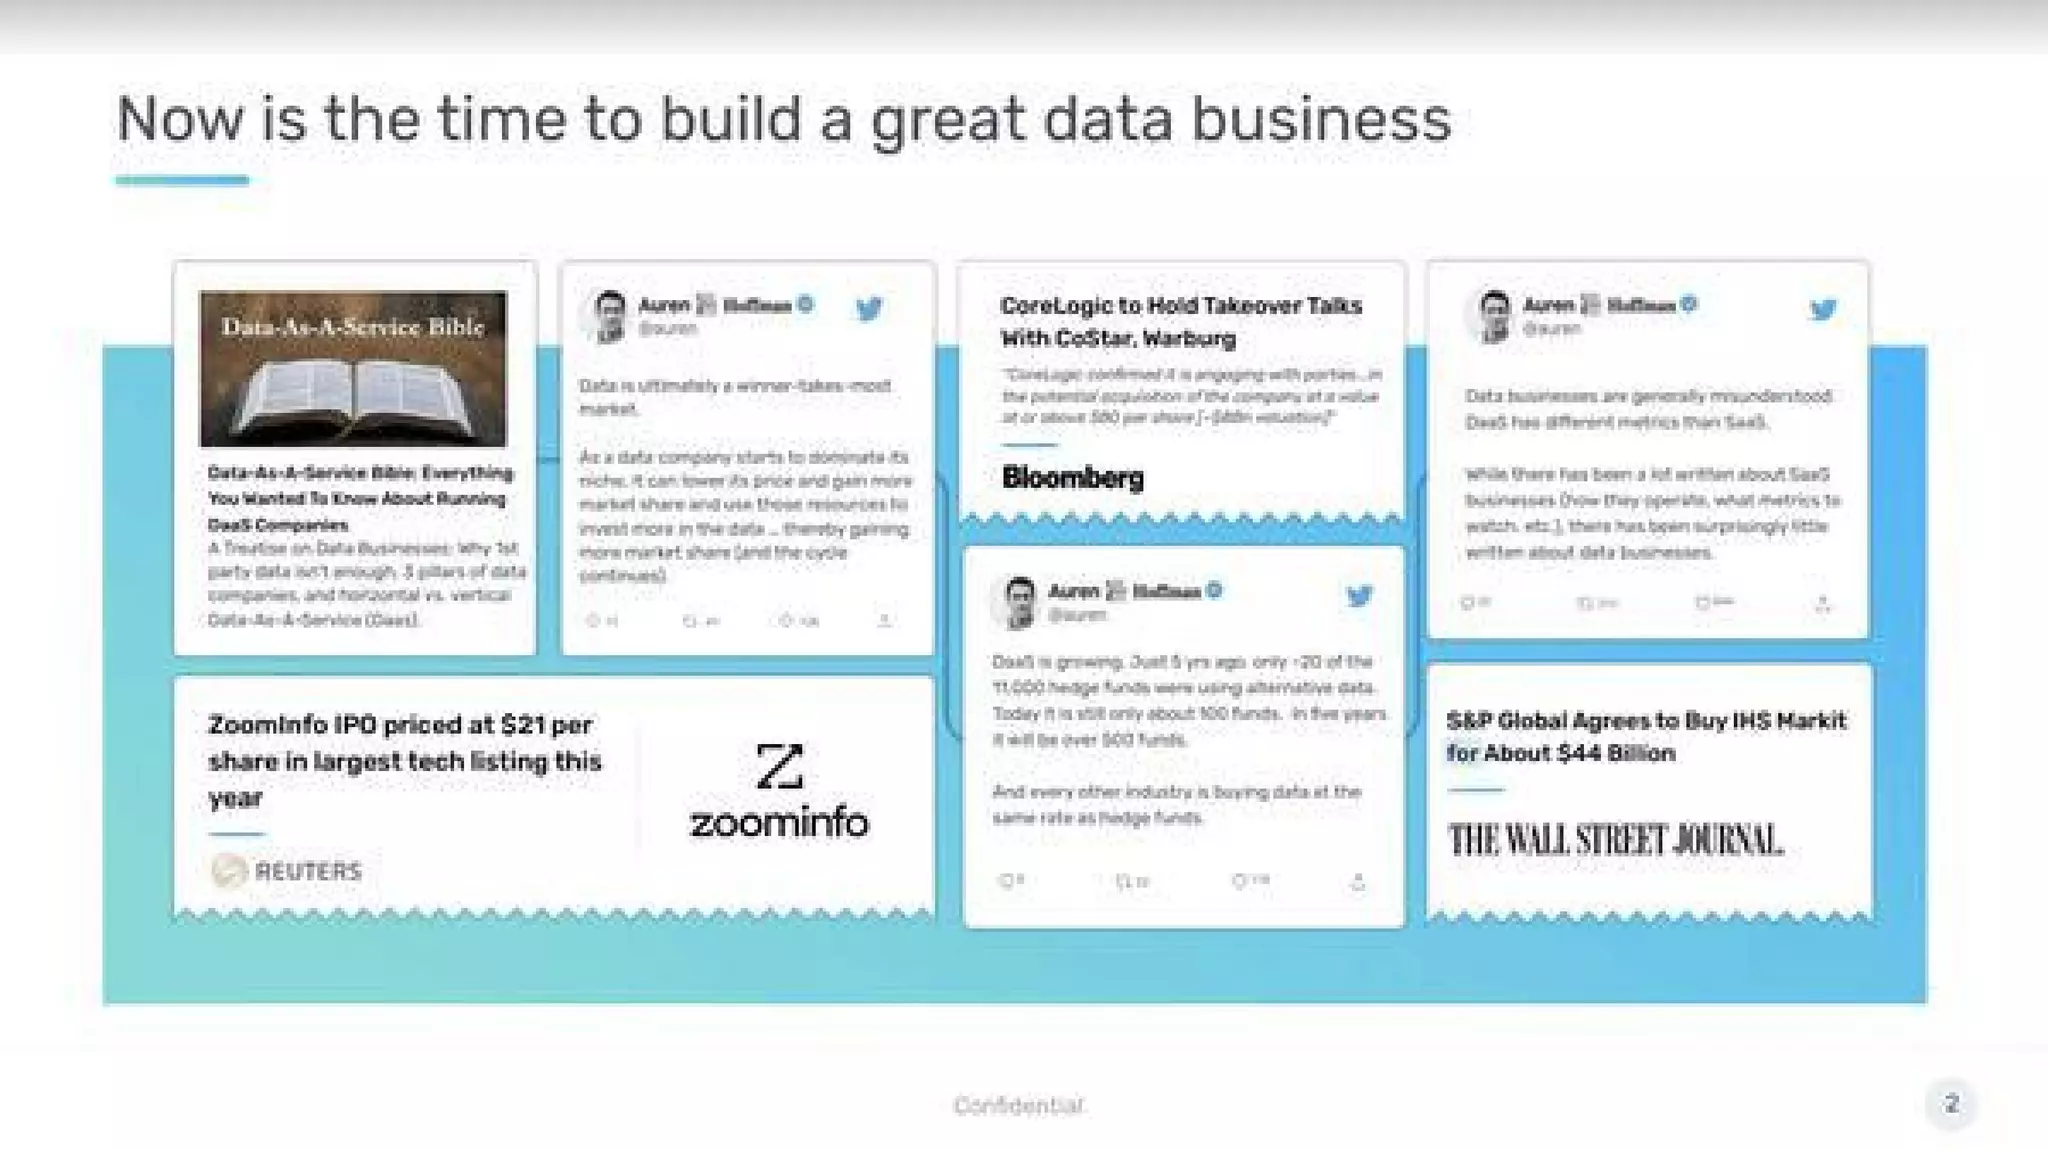
Slide 2 collects third-party headlines and signals (industry commentary, IPOs, M&A) to argue that "now is the time to build a great data business." Rather than deep market sizing, SafeGraph uses social proof and sector momentum — articles, tweets, and competitor activity — to show rising investor and strategic interest in data businesses. This helps justify urgency without overloading on projections.

Founders can learn to use curated market signals to create urgency: pick representative, credible examples that show category validation (IPOs, acquisitions, thought leaders) instead of long-winded TAM math. The approach is persuasive when combined with later slides that demonstrate product-market fit and unique defensibility.

Key Takeaway: Use credible, short market signals (IPOs, acquisitions, expert quotes) to build immediate category momentum.
Value prop: The system of truth for places

Value prop: The system of truth for places

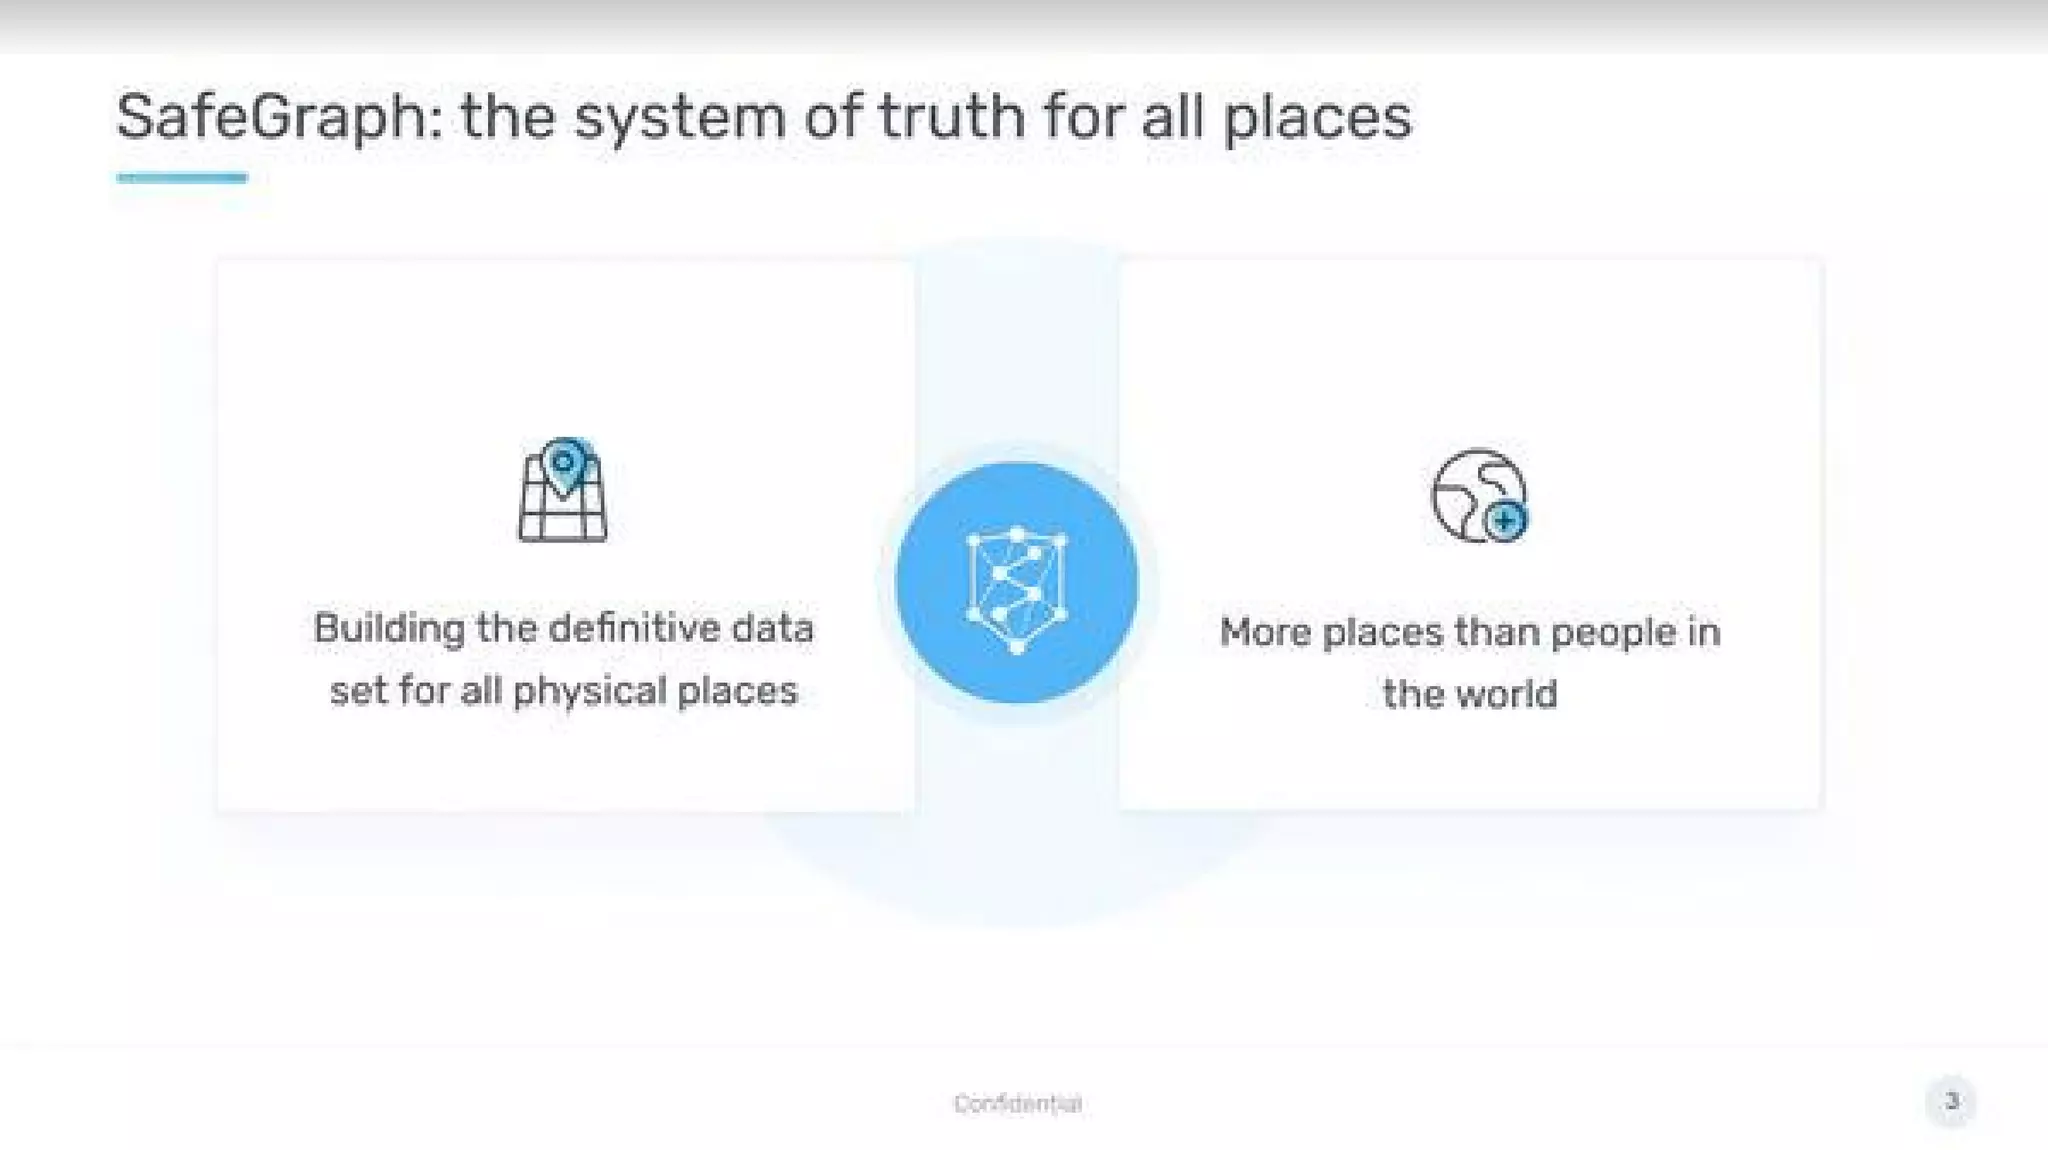
Slide 3 succinctly communicates SafeGraph’s core proposition: a definitive dataset for all physical places, and a claim that they have "more places than people in the world." The two-panel visual (definition + scale claim) explains both what they build (a definitive dataset) and why it matters (large addressable universe). It’s a concise articulation of product and scale without distracting details.

This is an example of how to frame a product: describe the artifact you build and quantify the scope or scale claim in the same breath. Investors want to know both what you make and whether it scales; combining the two in a single slide reduces ambiguity and sets expectations for later slides about coverage and usage.

Key Takeaway: Pair a crisp product definition with a scale claim early so investors understand both function and market potential.
Product focus: Data-only, truth-first strategy

Product focus: Data-only, truth-first strategy

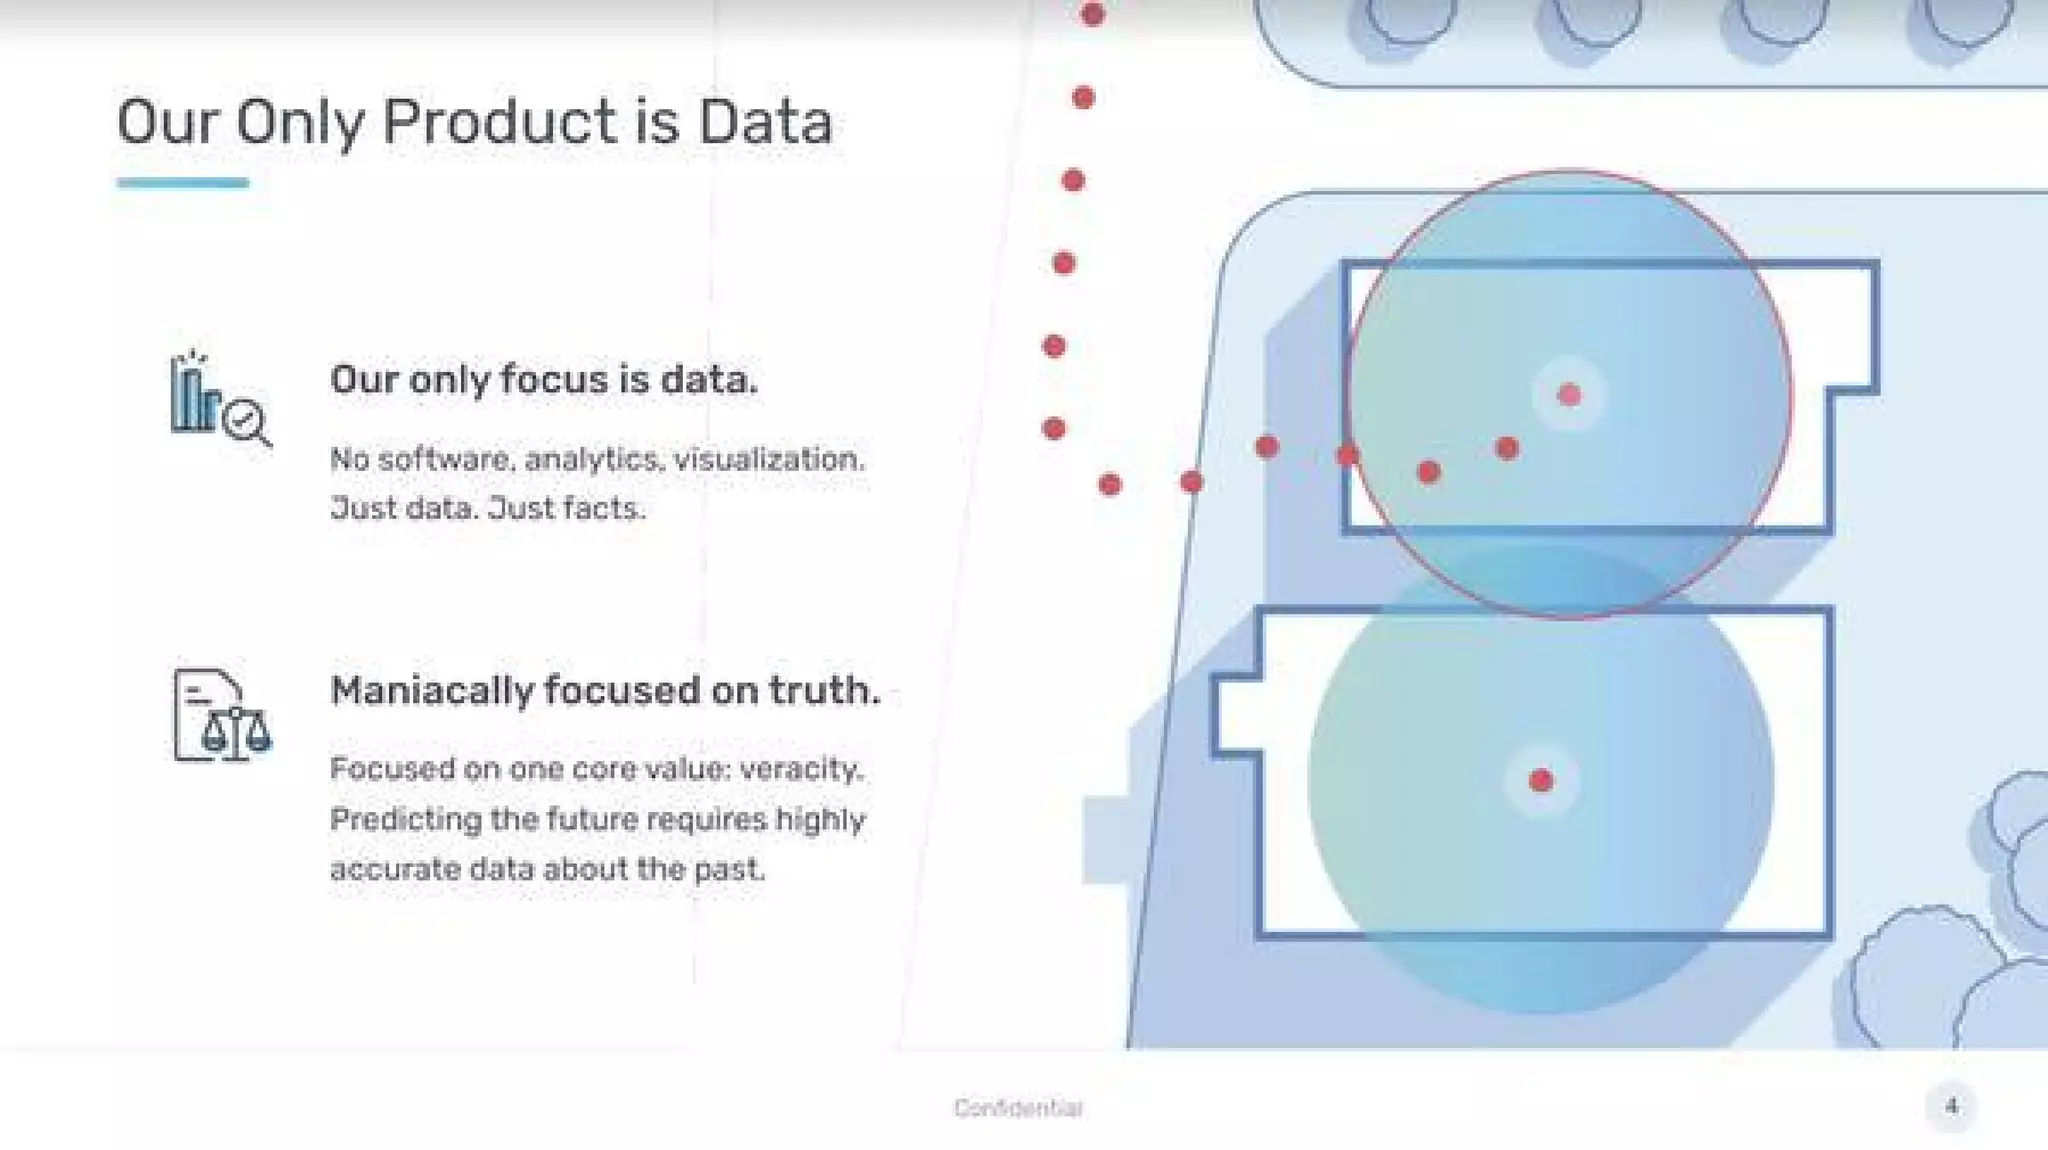
Slide 4 emphasizes a discipline: "Our Only Product is Data." The slide outlines that SafeGraph focuses solely on data (no software or analytics products) and centers the company on veracity. The visuals (mapping/footprint imagery) back the claim that accuracy matters for downstream predictive use cases. It’s an effective way to set boundaries: investors immediately understand the company’s core competency and go-to-market implications.

Founders should note the power of constraint. Declaring what you are not (no analytics, no SaaS bells-and-whistles) clarifies resource allocation, hiring, and GTM strategy. It also signals to buyers and partners what to expect from the product (clean, high-quality datasets) and helps avoid feature creep that dilutes a nascent company’s value proposition.

Key Takeaway: Define a strict product boundary and core value (e.g., data veracity) to align engineering, go-to-market, and messaging.
What they ship: Places, geometry, and patterns

What they ship: Places, geometry, and patterns

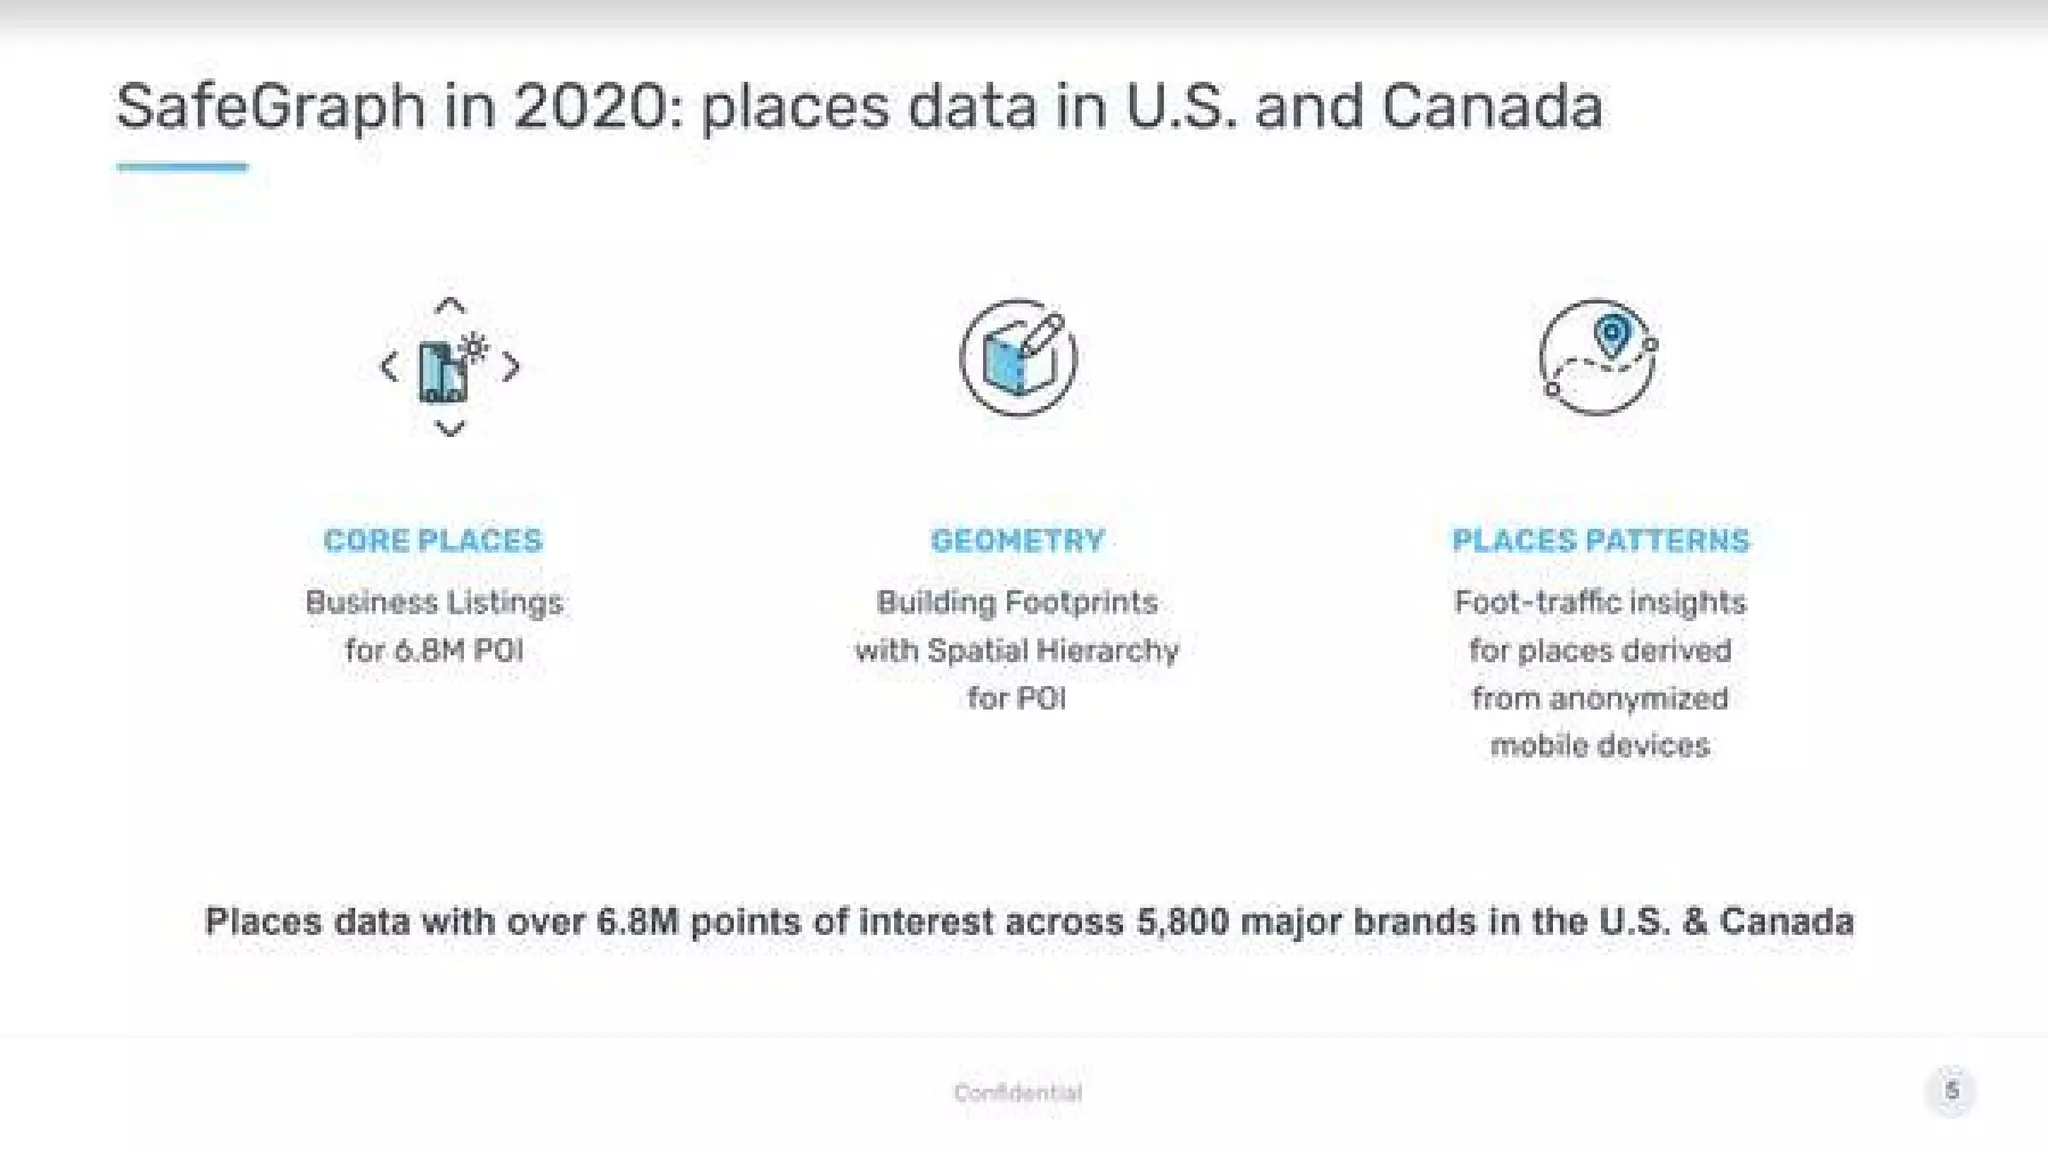
Slide 5 lays out the three core data products: Core Places (business listings), Geometry (building footprints, spatial hierarchy), and Places Patterns (anonymized foot-traffic insights). This is a strong micro-product map: each pillar is named, briefly described, and implicitly tied to buyer needs (location intelligence, mapping, behavioral signals). The final line quantifying 6.8M POIs across 5,800 major brands gives concrete coverage credibility.

This slide demonstrates how to structure product offering slides: keep the taxonomy small (3 pillars), use simple labels that non-experts can grasp, and quantify coverage to move claims from abstract to tangible. It prepares investors for later revenue and customer examples by showing what buyers actually purchase.

Key Takeaway: Present your product as a small set of clear, differentiated pillars and quantify coverage to make your offering concrete.
Standards & network effects: Placekey initiative

Standards & network effects: Placekey initiative

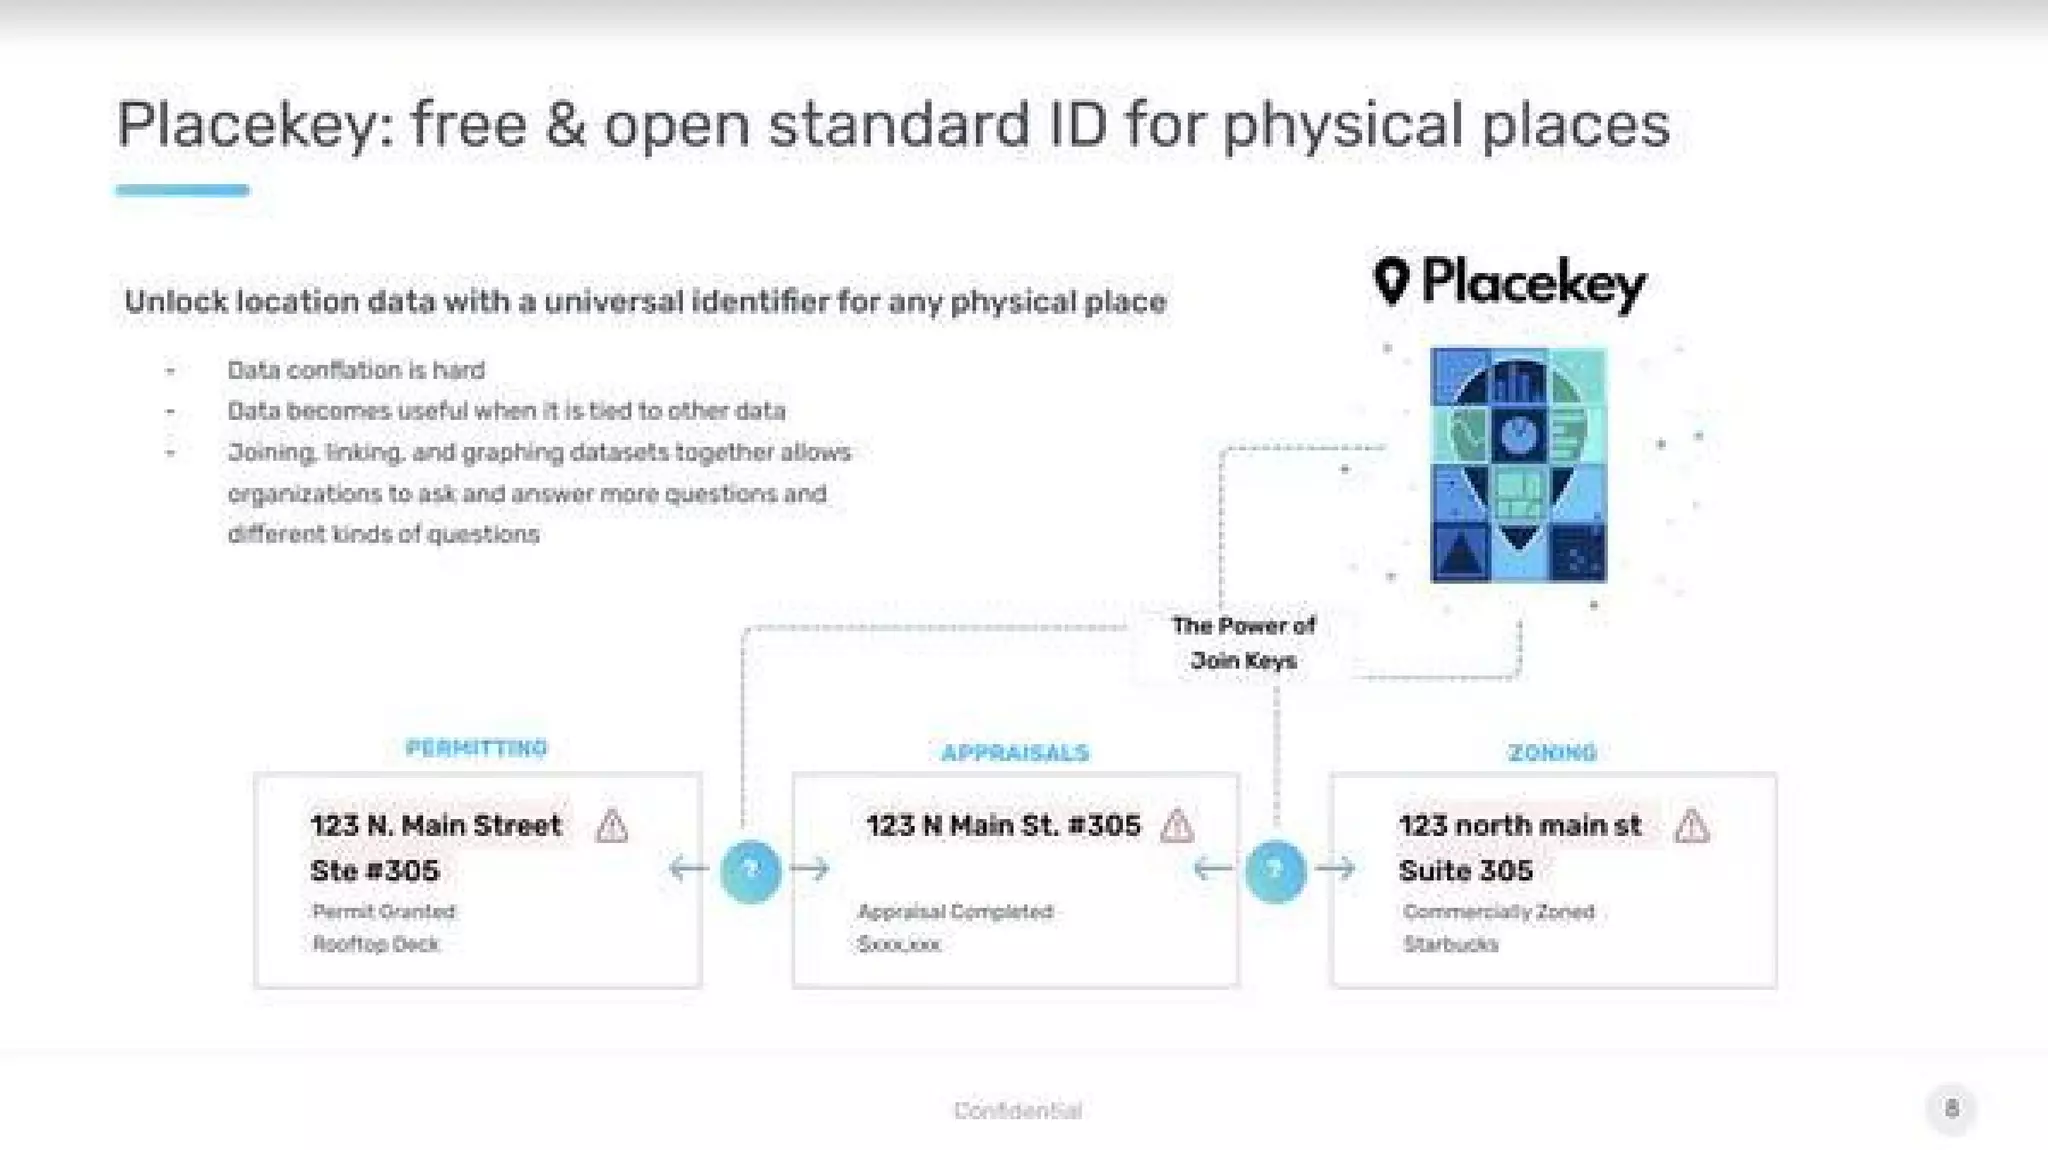
Slide 8 explains Placekey — an open identifier for physical places — and why it matters: resolving data confusion and enabling joins across datasets. The diagram shows different records (permits, appraisals, zoning) being linked by a join key into a common identifier system. Positioning an open standard alongside the commercial product signals a platform and ecosystem play that can create defensibility and improve data quality by crowd-sourced joins.

This is an instructive example for founders building data businesses: invest in standards and interoperability early if your value increases when datasets are joined. An open standard can catalyze adoption, reduce buyer friction, and create indirect network effects as other organizations contribute alignment and mappings.

Key Takeaway: Consider an open standard to accelerate data interoperability and create indirect network effects that strengthen your dataset.
Team & credibility: Experienced operators

Team & credibility: Experienced operators

Slide 12 presents the leadership roster with titles and prior company logos. The layout emphasizes operator experience across engineering, product, sales, and operations — a critical signal for investors that the team can execute on a technically demanding data product and grow a commercial business. Including recognizable prior firms builds credibility by association and helps answer the 'can they scale?' question.

For founders, this underscores the importance of showcasing relevant domain experience and complementary functions in leadership. Investors look for teams that combine product credibility (data/engineering chops) with commercial experience (sales/partnerships) — this slide balances those signals well.

Key Takeaway: Show a leadership team with complementary domain and commercial experience to reduce execution risk in investor assessments.

Conclusion: Key Lessons

SafeGraph’s deck succeeds by being focused, evidence-driven, and disciplined: it states a single positioning, demonstrates market timing with credible third-party signals, maps a concise product taxonomy, quantifies coverage, shows a standards-led plan (Placekey) to unlock interoperability, and validates execution with traction and an experienced team. Actionable advice for founders: keep messaging simple and repeatable, prioritize credibility (data coverage, customer logos, metrics), use standards or open initiatives to create defensibility for data products, and present a team that clearly matches the technical and go-to-market challenges of your business. Together these elements reduce perceived risk and make it easy for investors to understand both the opportunity and how the company plans to capture it.

Full Deck Analysis

11 sections

Overview

Company: SafeGraph
Round: Series A ($16M)
Year: 2017
Outcome: Acquired by Dewey (2023)

Executive Summary

SafeGraph pitched itself as a data-first company building the definitive “system of truth” for physical places — business listings, building geometry (footprints) and anonymized foot-traffic patterns. The deck emphasizes scale (millions of POIs and a global Placekey initiative), strong unit economics, broad cross-industry use cases, and rapid adoption by researchers and government organizations (including the CDC and Fed). Notable for its data-first positioning, community/network approach (Placekey), and clear early traction metrics rather than product/UX bells and whistles.

Problem Statement

  • Data about physical places is fragmented, inconsistent and hard to join across datasets (Slides 2, 3, 8).
  • The deck frames the market problem as: many downstream analytics/AI use cases fail without a clean, verifiable dataset of places and their geometry and patterns (Slide 3: “system of truth for all places”).
  • Slide 8 (Placekey) explicitly calls out “Data conflation is hard” and that value arises when location data is tied together with a universal identifier.

Solution

  • A single, data-first product offering comprised of:
    • Core Places: curated business listings / points-of-interest (POI) (Slide 5).
    • Geometry: building footprints and spatial hierarchy for POIs (Slide 5).
    • Places Patterns: anonymized mobile-device derived foot-traffic insights (Slide 5).
  • A complementary open identifier initiative, Placekey, meant to become the universal join key for place data (Slide 8).
  • Product positioning: no software layers or analytics sold—just high-quality data (Slide 4: “Our Only Product is Data” — “Just data. Just facts.”).

Market Opportunity

  • The deck does not present a classic TAM/SAM/SOM waterfall with dollar figures. Instead it demonstrates market size via:
    • Coverage metrics: 6.8M points of interest in U.S. & Canada across ~5,800 major brands (Slide 5).
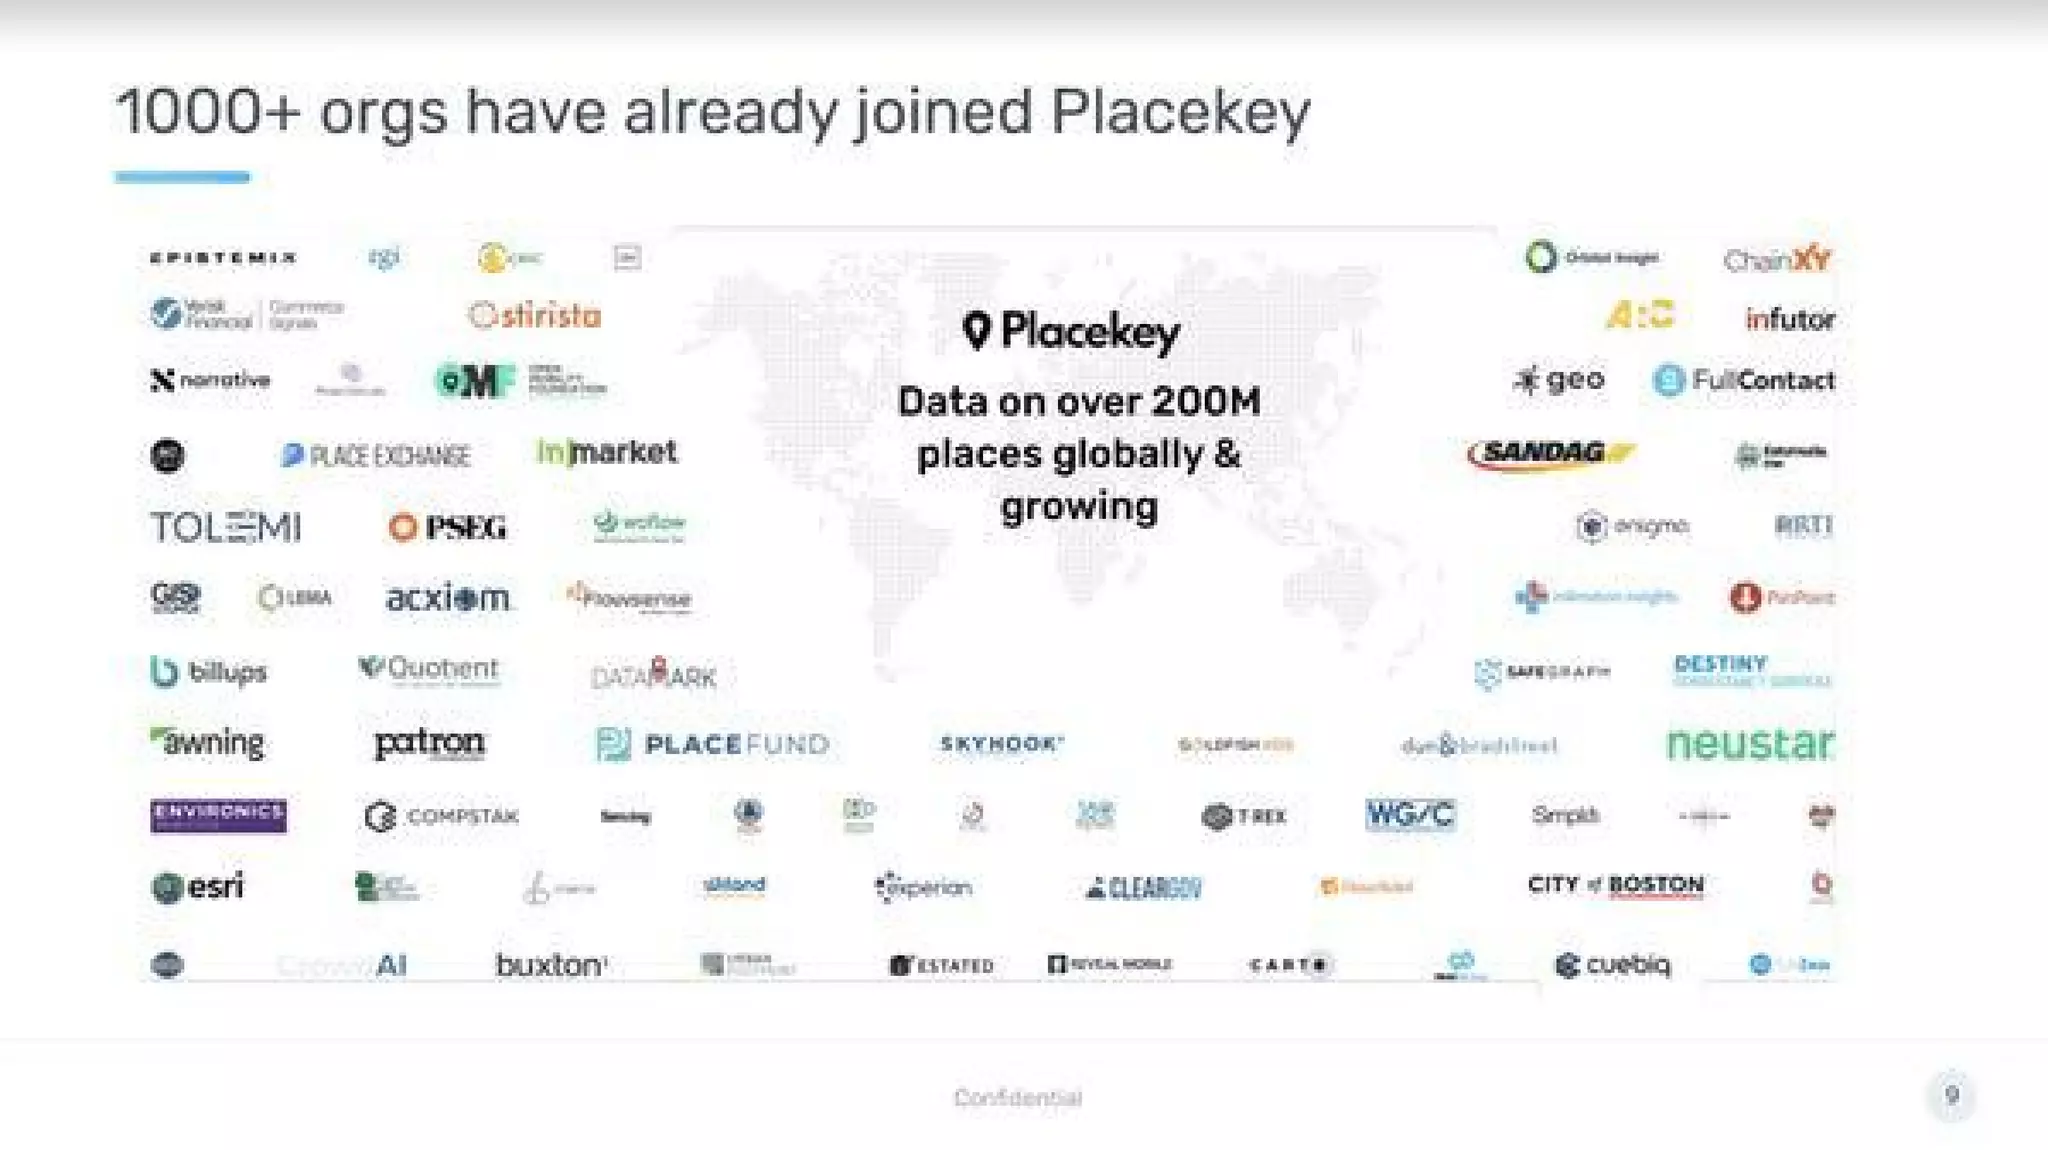
    • Global ambition via Placekey: “Data on over 200M places globally & growing” and 1,000+ organizations participating (Slide 9).
  • Implicit market signals: relevance to many verticals (retail, real estate, geospatial, supply chain, healthcare) and large buyers (Fed, CDC, large enterprises referenced in use-case grid on Slide 6/7).

Business Model

  • Pure data business: revenue via selling datasets / data subscriptions and presumably enterprise contracts for access to Places, Geometry and Places Patterns (Slide 4 & 5).
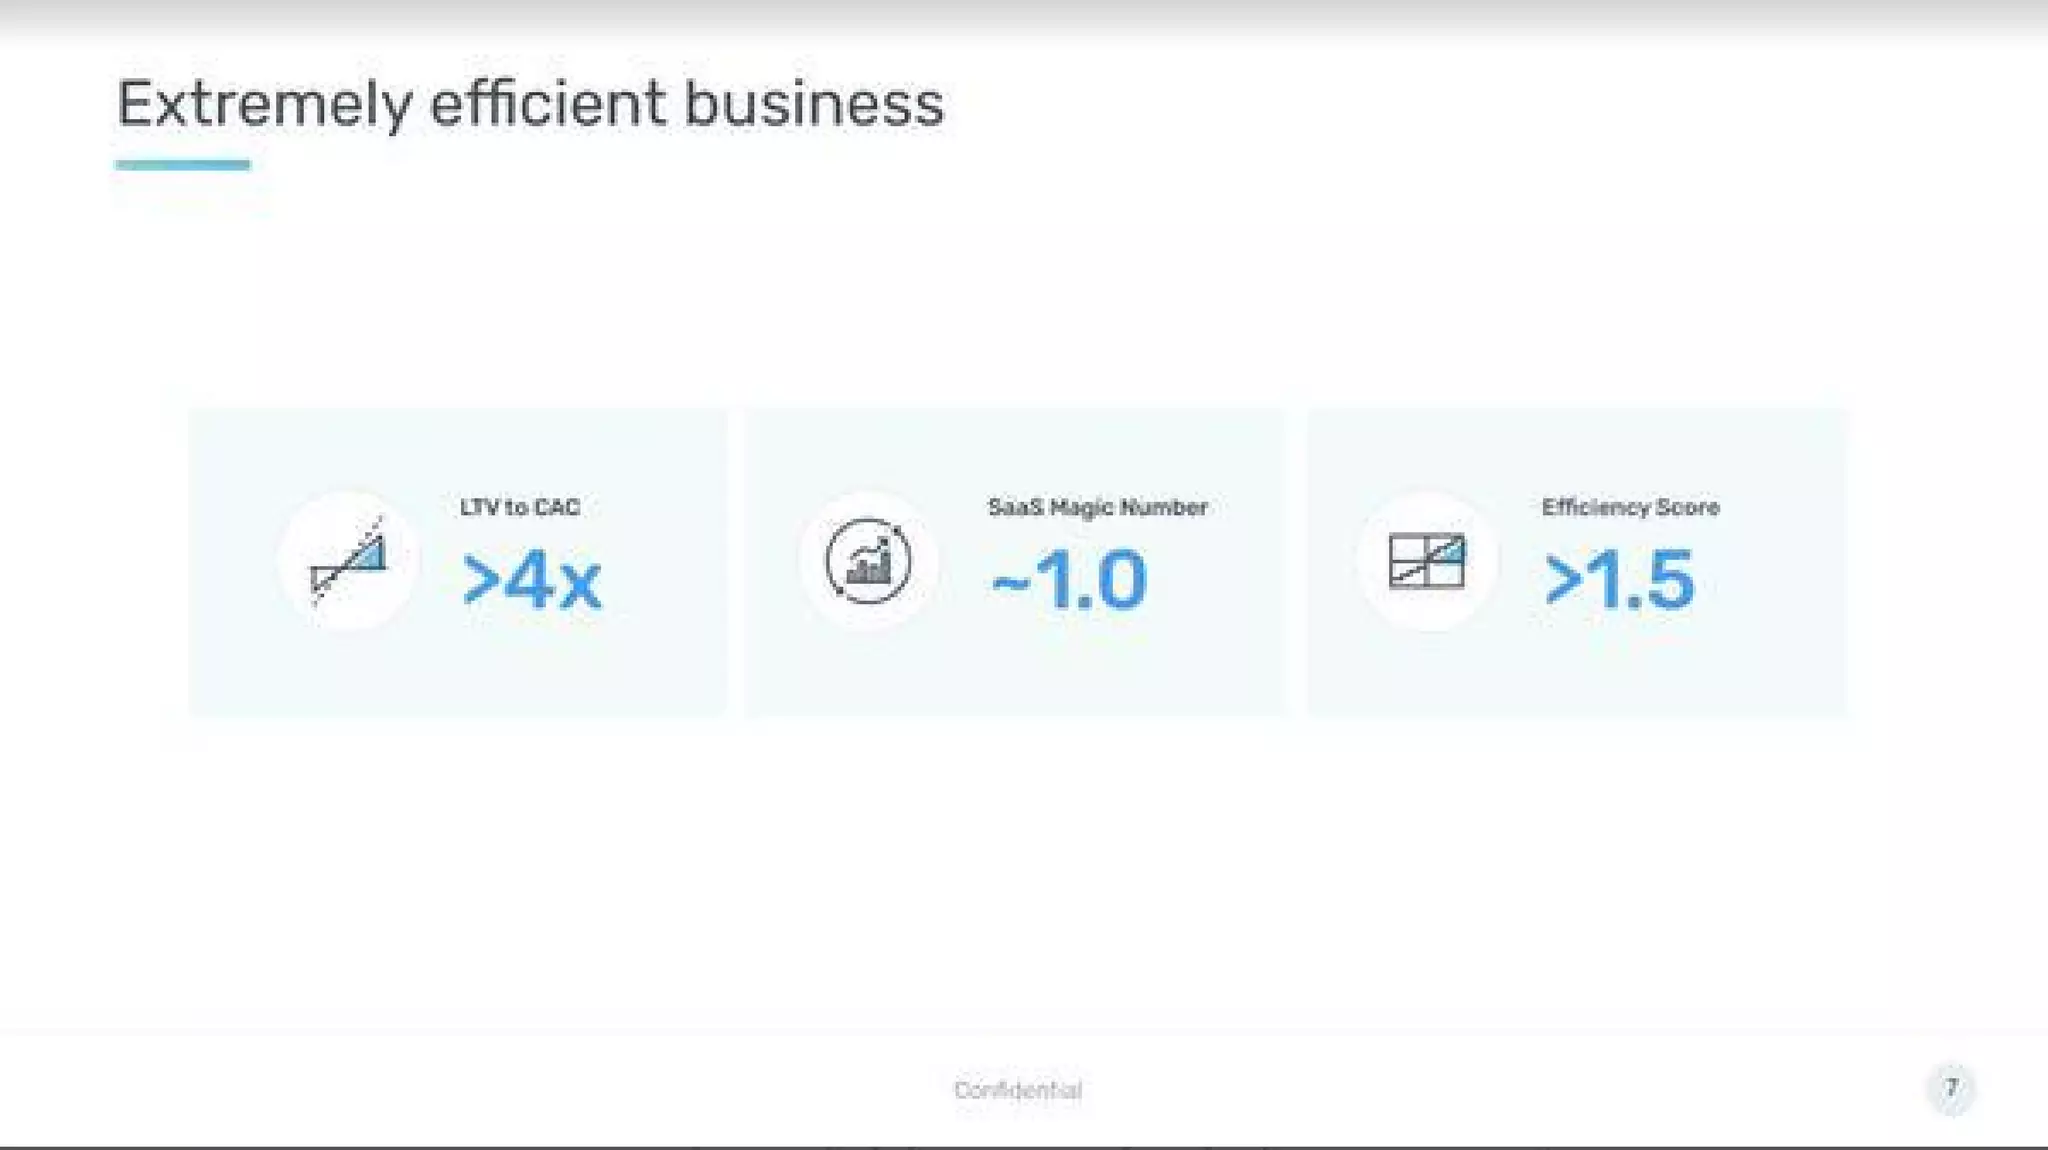
  • Unit economics shown (Slide 7):
    • LTV : CAC > 4x
    • SaaS Magic Number ≈ 1.0
    • Efficiency Score > 1.5
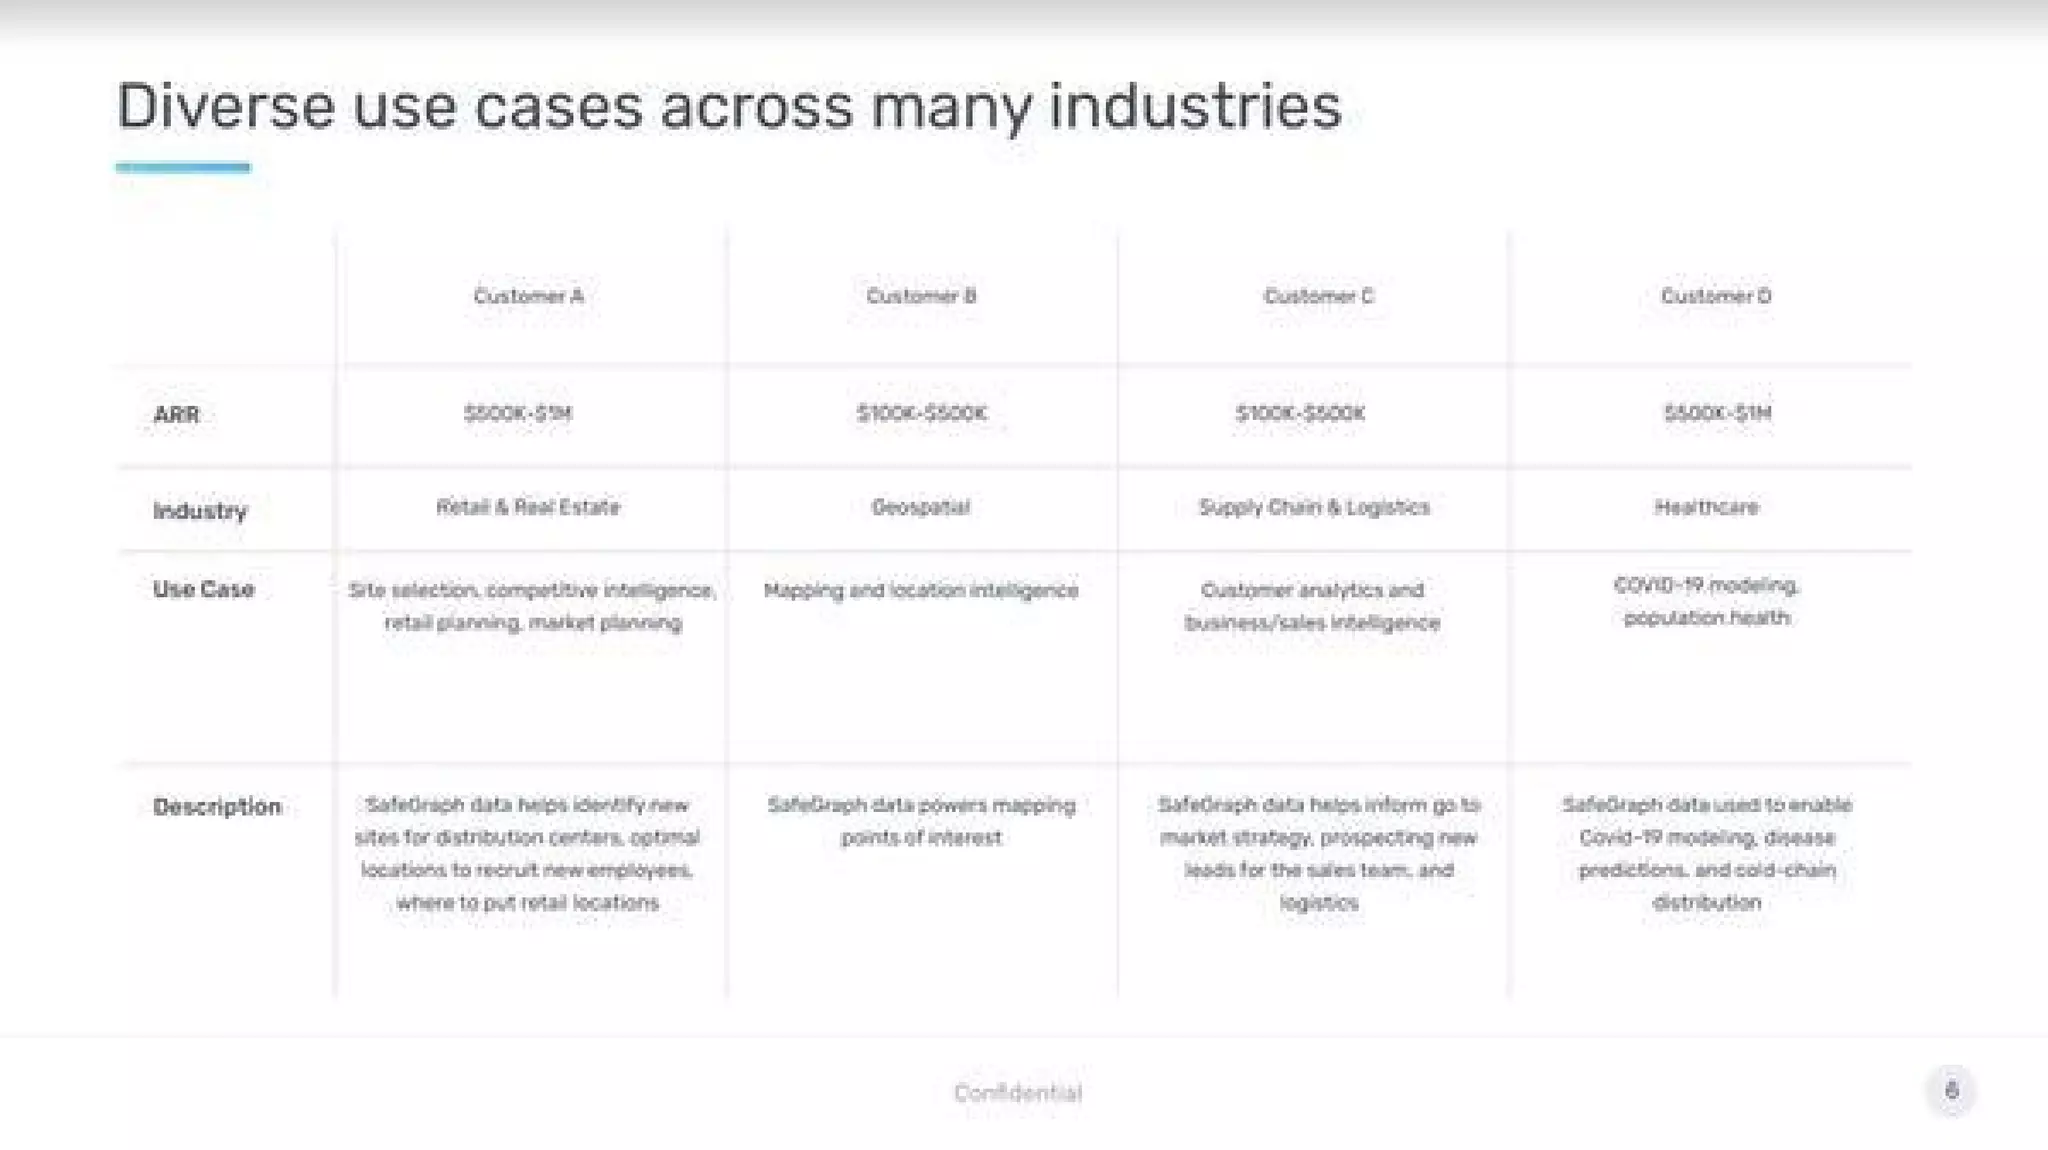
  • Customer ARR bands are exposed in a case-table (Slide 6) implying multi-hundred-thousand to million-dollar ARR customers (table shows customers with ARR ranges such as ~$100K–$500K and $500K–$1M).

Traction & Metrics

  • Data coverage: 6.8M POIs (U.S. & Canada) and >200M places globally via Placekey (Slides 5 & 9).
  • Community / adoption:
    • 1,000+ organizations joined Placekey (Slide 9).
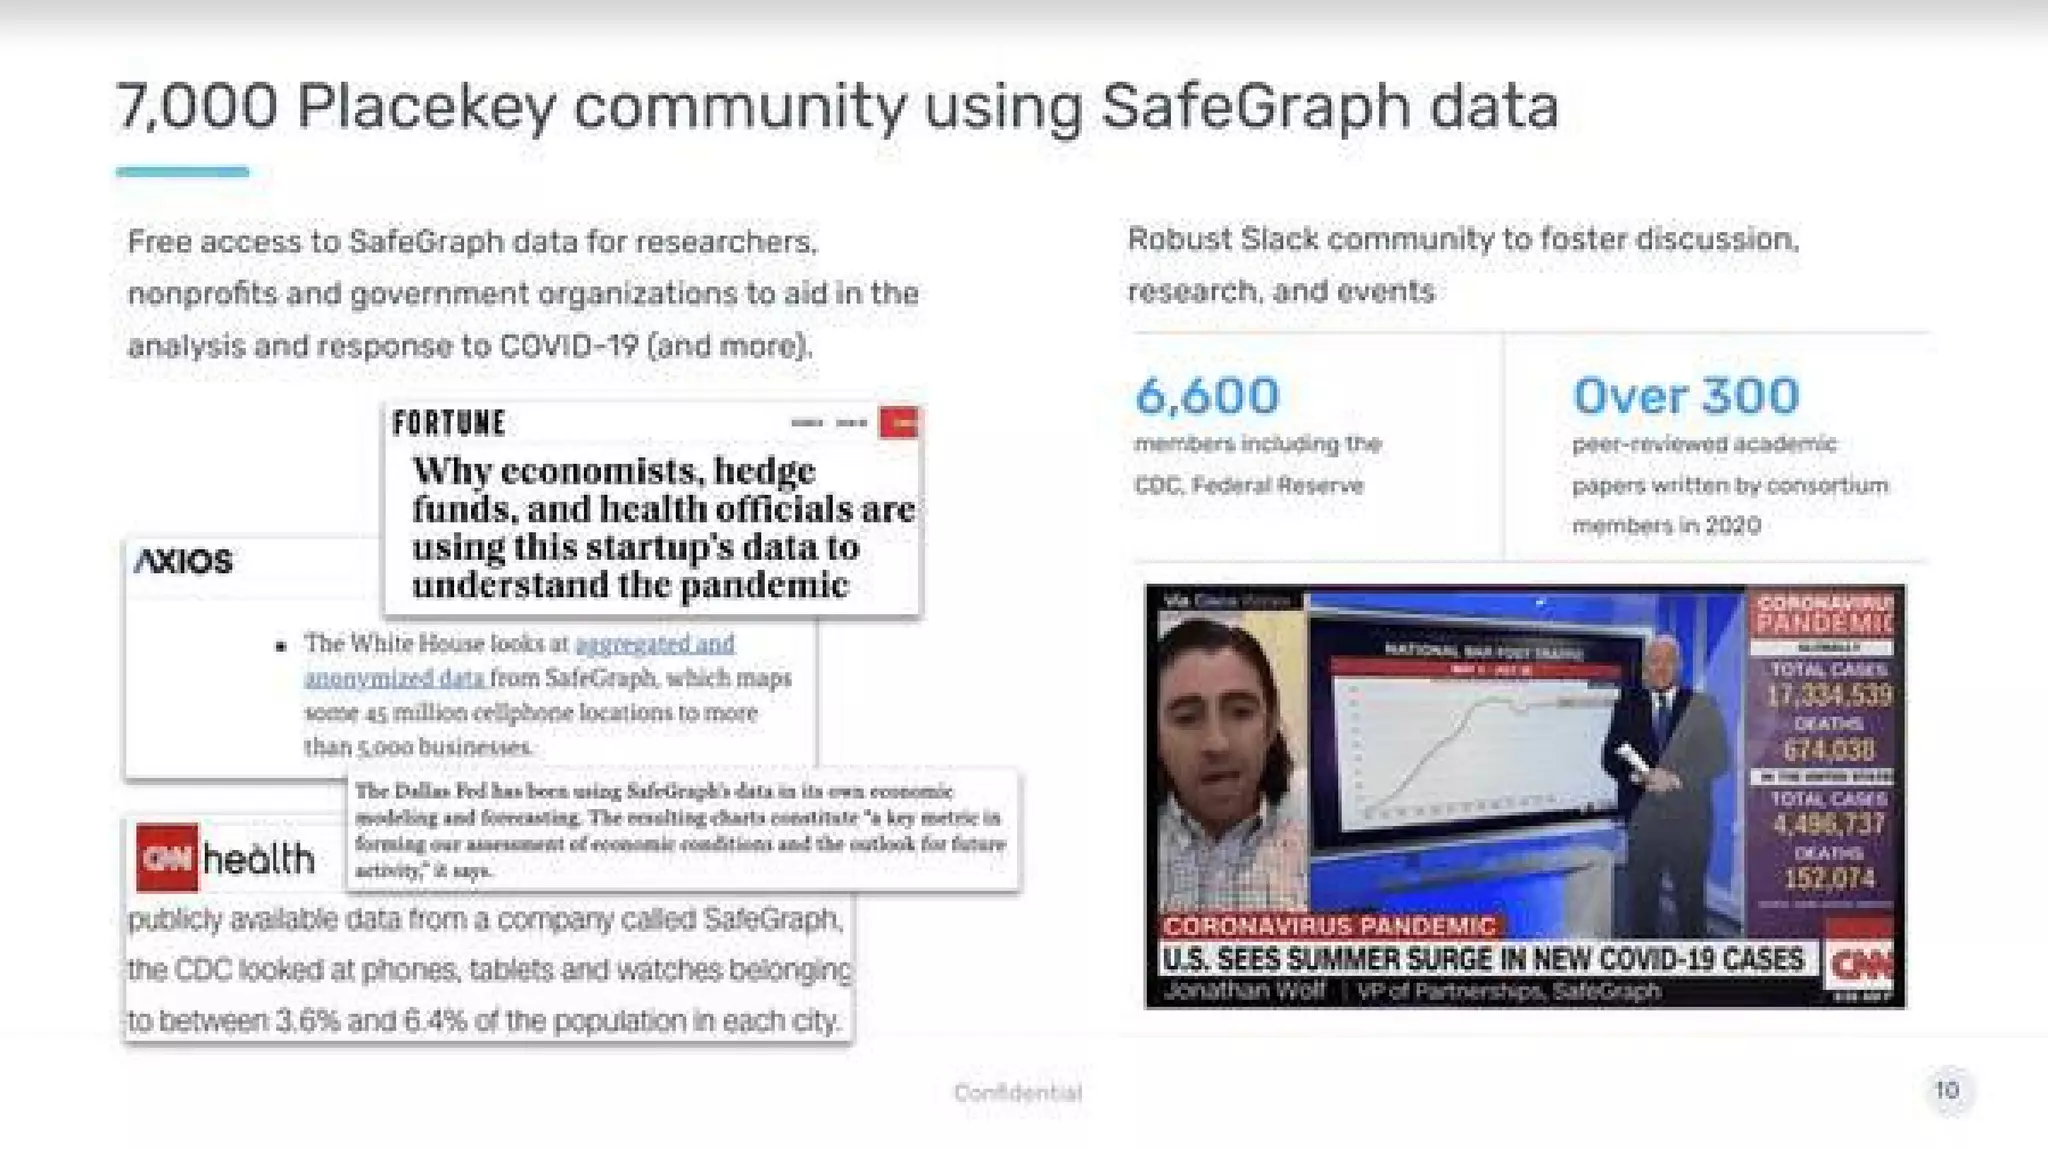
    • 7,000 Placekey community using SafeGraph data; 6,600 community members including CDC and Federal Reserve (Slide 10).
    • Over 300 peer-reviewed academic papers written by consortium members in 2020 (Slide 10).
  • Customer examples and ARR bands (Slide 6): multiple customers with ARR ranges between ~$100K and >$500K.
  • Public / research usage: cited by outlets and used by policy/government bodies for COVID analysis (Slide 10).
  • Financially oriented metrics: LTV:CAC >4x and magic number ~1.0 (Slide 7).

Competitive Positioning

  • Differentiators emphasized by the deck:
    • Single-minded, data-first product (no software/UI distractions) and focus on veracity/truth (Slide 4).
    • Scale of coverage and accuracy (POI, geometry, foot-traffic patterns) (Slides 5).
    • Open standard / network effect via Placekey to join disparate datasets (Slide 8–9).
    • Research & government adoption as credibility / validation (Slide 10).
  • Implicit competition: other location data vendors (slide 2 references market activity e.g., ZoomInfo IPO, CoreLogic acquisitions), but SafeGraph pitches accuracy + openness + community as the moat.

Team

  • Leadership framed as experienced operators with prior senior roles at major data, mapping and platform companies (Slide 13).
  • Team slide highlights executive-level hires with prior experience at recognized data/tech firms (marketing, engineering, product, sales/ops). The deck emphasizes domain expertise in data, mapping and go-to-market.

Go-to-Market Strategy

  • Enterprise sales with meaningful ARR customers (Slide 6).
  • Multi-industry targeting demonstrated by case table: Retail & Real Estate, Geospatial, Supply Chain & Logistics, Healthcare (Slide 6).
  • Community/network strategy via Placekey to win an open standard and create pull-through (Slides 8–10).
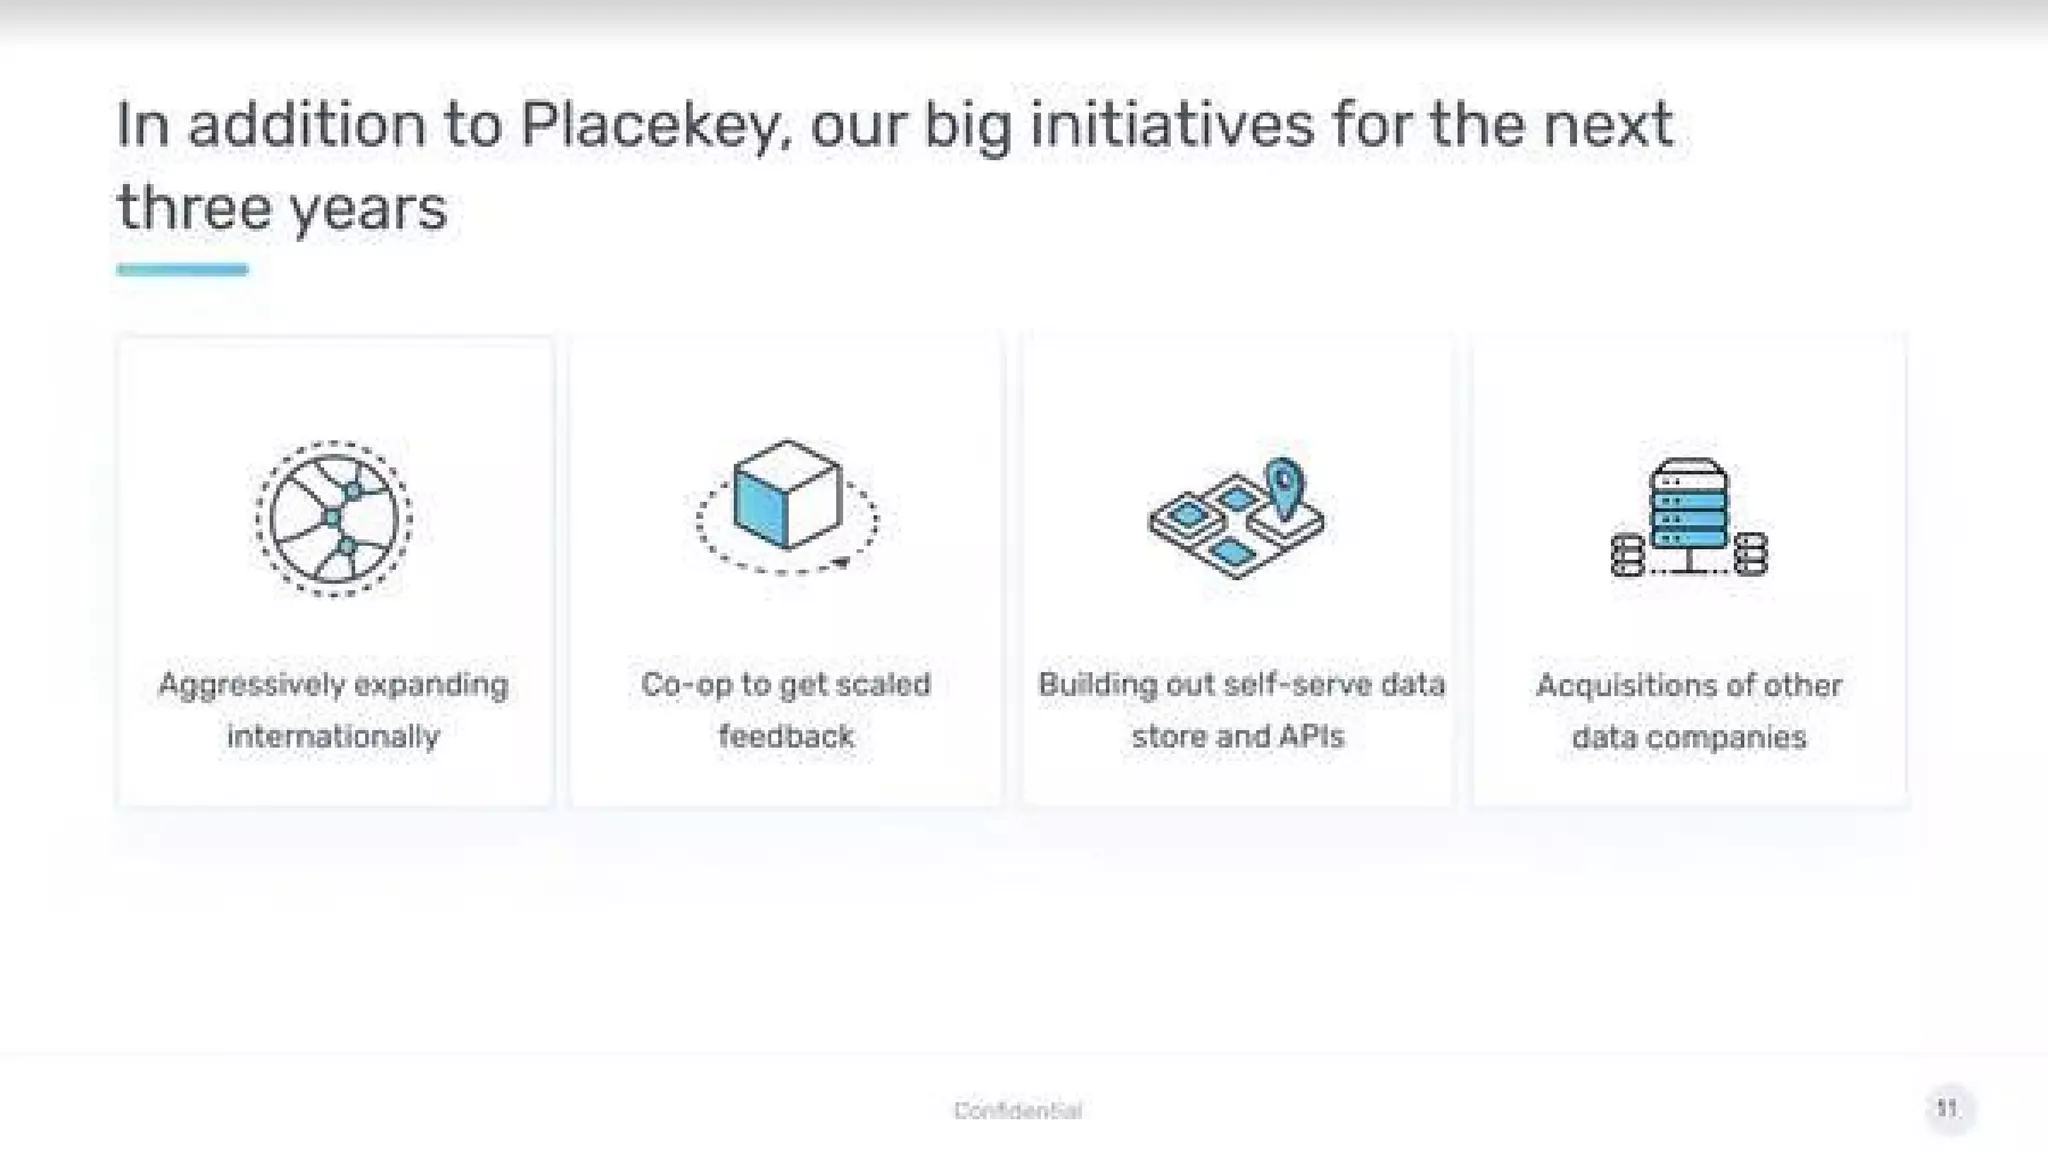
  • Product expansion roadmap includes building self-serve data store & APIs and a cooperative (“co-op”) model to scale feedback (Slide 11).
  • International expansion listed as a priority (Slide 11).

The Ask

  • Raised in this round: Series A, $16M (context provided).
  • Fund use (implied from Slide 11): scale Placekey internationally, grow co-op and community, build self-serve data store/APIs, and pursue acquisitions of other data companies.

Investor Deep Dive

Executive summary, strengths & red flags

Executive Summary

SafeGraph pitched itself as a data-first company building the definitive “system of truth” for physical places — business listings, building geometry (footprints) and anonymized foot-traffic patterns. The deck emphasizes scale (millions of POIs and a global Placekey initiative), strong unit economics, broad cross-industry use cases, and rapid adoption by researchers and government organizations (including the CDC and Fed). Notable for its data-first positioning, community/network approach (Placekey), and clear early traction metrics rather than product/UX bells and whistles.

Key Strengths

3 identified

1

Data-first clarity and focus — the deck repeatedly emphasizes “our only product is data” and a mission to be the definitive places dataset, which is simple and compelling for data buyers (Slide 4, Slide 3).

2

Strong proof of demand and adoption — millions of POIs, participation by thousands in Placekey, government and research adoption (Slides 5, 9, 10). These are credible social proofs for enterprise buyers and investors.

3

Measured unit economics and early ARR indicators — LTV:CAC >4x and a SaaS magic number ~1.0 signal disciplined customer economics and monetization (Slide 7).

Red Flags & Weaknesses

3 identified

1

No explicit TAM / monetizable market sizing — the deck shows coverage metrics (POIs) but does not quantify total addressable revenue or break down revenue opportunity (no dollar TAM/SAM/SOM) (Slides 2, 5).

2

Revenue transparency is limited — while ARR bands per customer are shown in a use-case table (Slide 6) and unit economics are described (Slide 7), the deck does not show aggregate ARR, revenue growth curves, churn, or runway. Investors would want clearer topline figures.

3

Privacy & regulatory risk not addressed — the product uses anonymized mobile-device data (Places Patterns, Slide 5), but the deck doesn’t detail privacy controls, compliance posture, or potential regulatory exposure (important given later scrutiny of location data).

More Pitch Decks To Study

Compare structure, fundraising context, and investor-facing story across similar startup decks.