Compare your deck to BrowserStack

Compare Your Deck

BrowserStack Pitch Deck (2018)

SaaS
Stage: Series A
Raised: $50M
Year: 2018
Slides: 9
Outcome: Valued at $4B after Series B (2021)

Pitch Deck

1 / 9
BrowserStack pitch deck - Cover & Brand Identity: Clear, confident opening
Click to expand

Deck Analysis

This deck presents BrowserStack, a developer-focused SaaS company that provides a global device and browser testing cloud. It highlights the company story, scale metrics, product breadth, and customer trust to justify its Series A raise and position as a category leader. Notable strengths are strong developer mindshare, clear product positioning across manual and automated testing, and heavy enterprise adoption that together make a compelling growth and valuation narrative.

Cover & Brand Identity: Clear, confident opening

Cover & Brand Identity: Clear, confident opening

The opening slide uses a large, clean logo and a minimalist background to establish a strong and recognizable brand presence. The simplicity communicates confidence and places the emphasis on the company name, which helps set the tone for a corporate, enterprise-ready SaaS pitch.

Founders can learn from this restraint: a bold, uncluttered cover creates immediate recognition and signals professionalism. It also makes the deck adaptable for multiple audiences, from investors to enterprise buyers, while keeping the brand front and center.

Key Takeaway: Start with a simple, memorable cover that emphasizes brand identity and sets a professional tone.
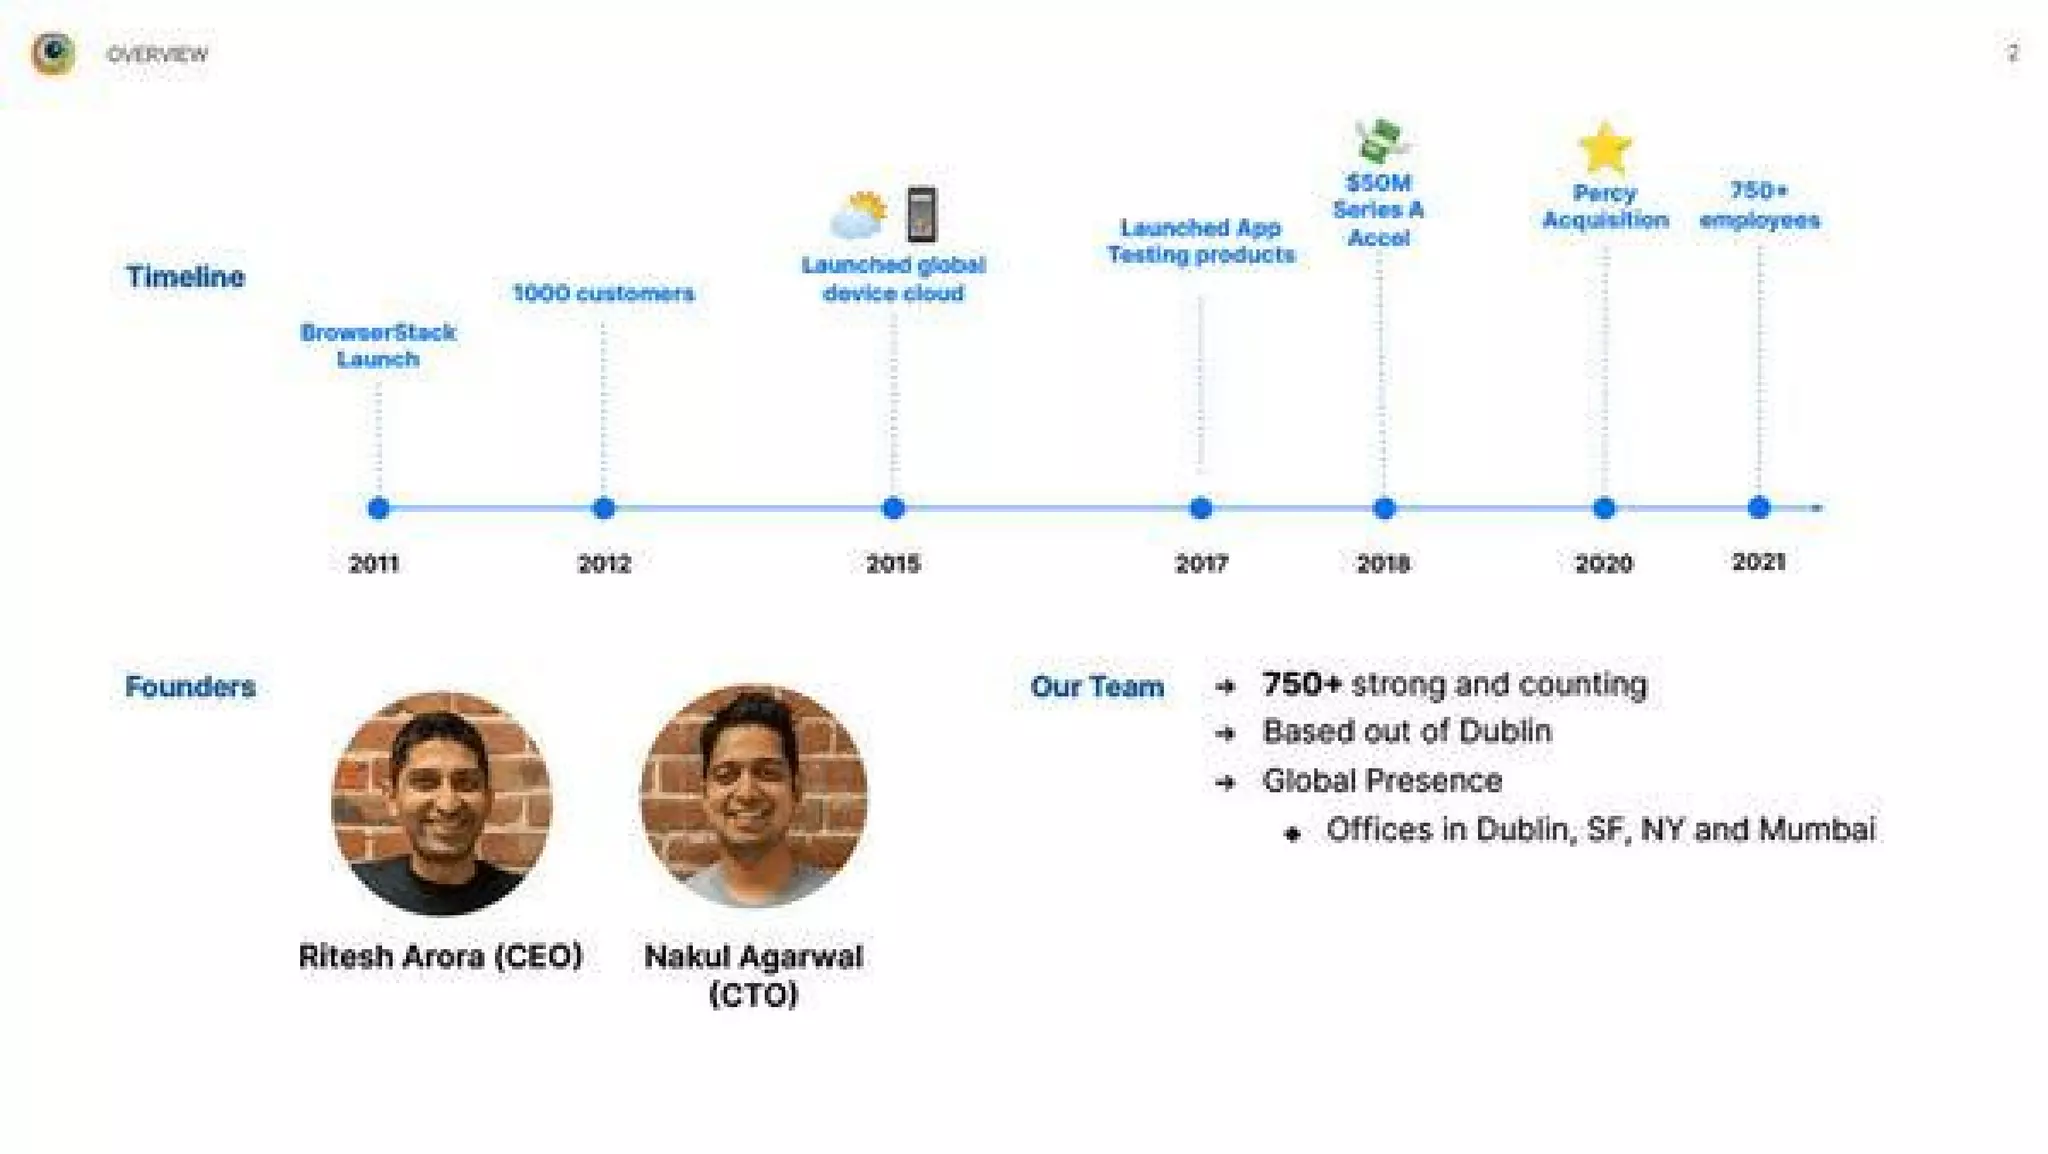
Timeline & Founders: Narrative of traction and team

Timeline & Founders: Narrative of traction and team

This slide combines a chronological product and company timeline with founder portraits and team statistics. Showing the launch, product milestones, Series A, acquisition events, and employee growth provides a compact narrative of progress and momentum. Including founder photos humanizes the story and pairs leadership credibility with measurable milestones.

The timeline plus team data is effective because it answers both the ‘what’ and the ‘who’ questions investors and partners care about: how the product evolved and who executed on it. Founders should emulate this approach by pairing milestones with people metrics to convey both operational progress and team capability.

Key Takeaway: Pair a concise timeline of product/company milestones with founder and team signals to demonstrate momentum and execution capacity.
Developer Mindshare: Metrics and social proof

Developer Mindshare: Metrics and social proof

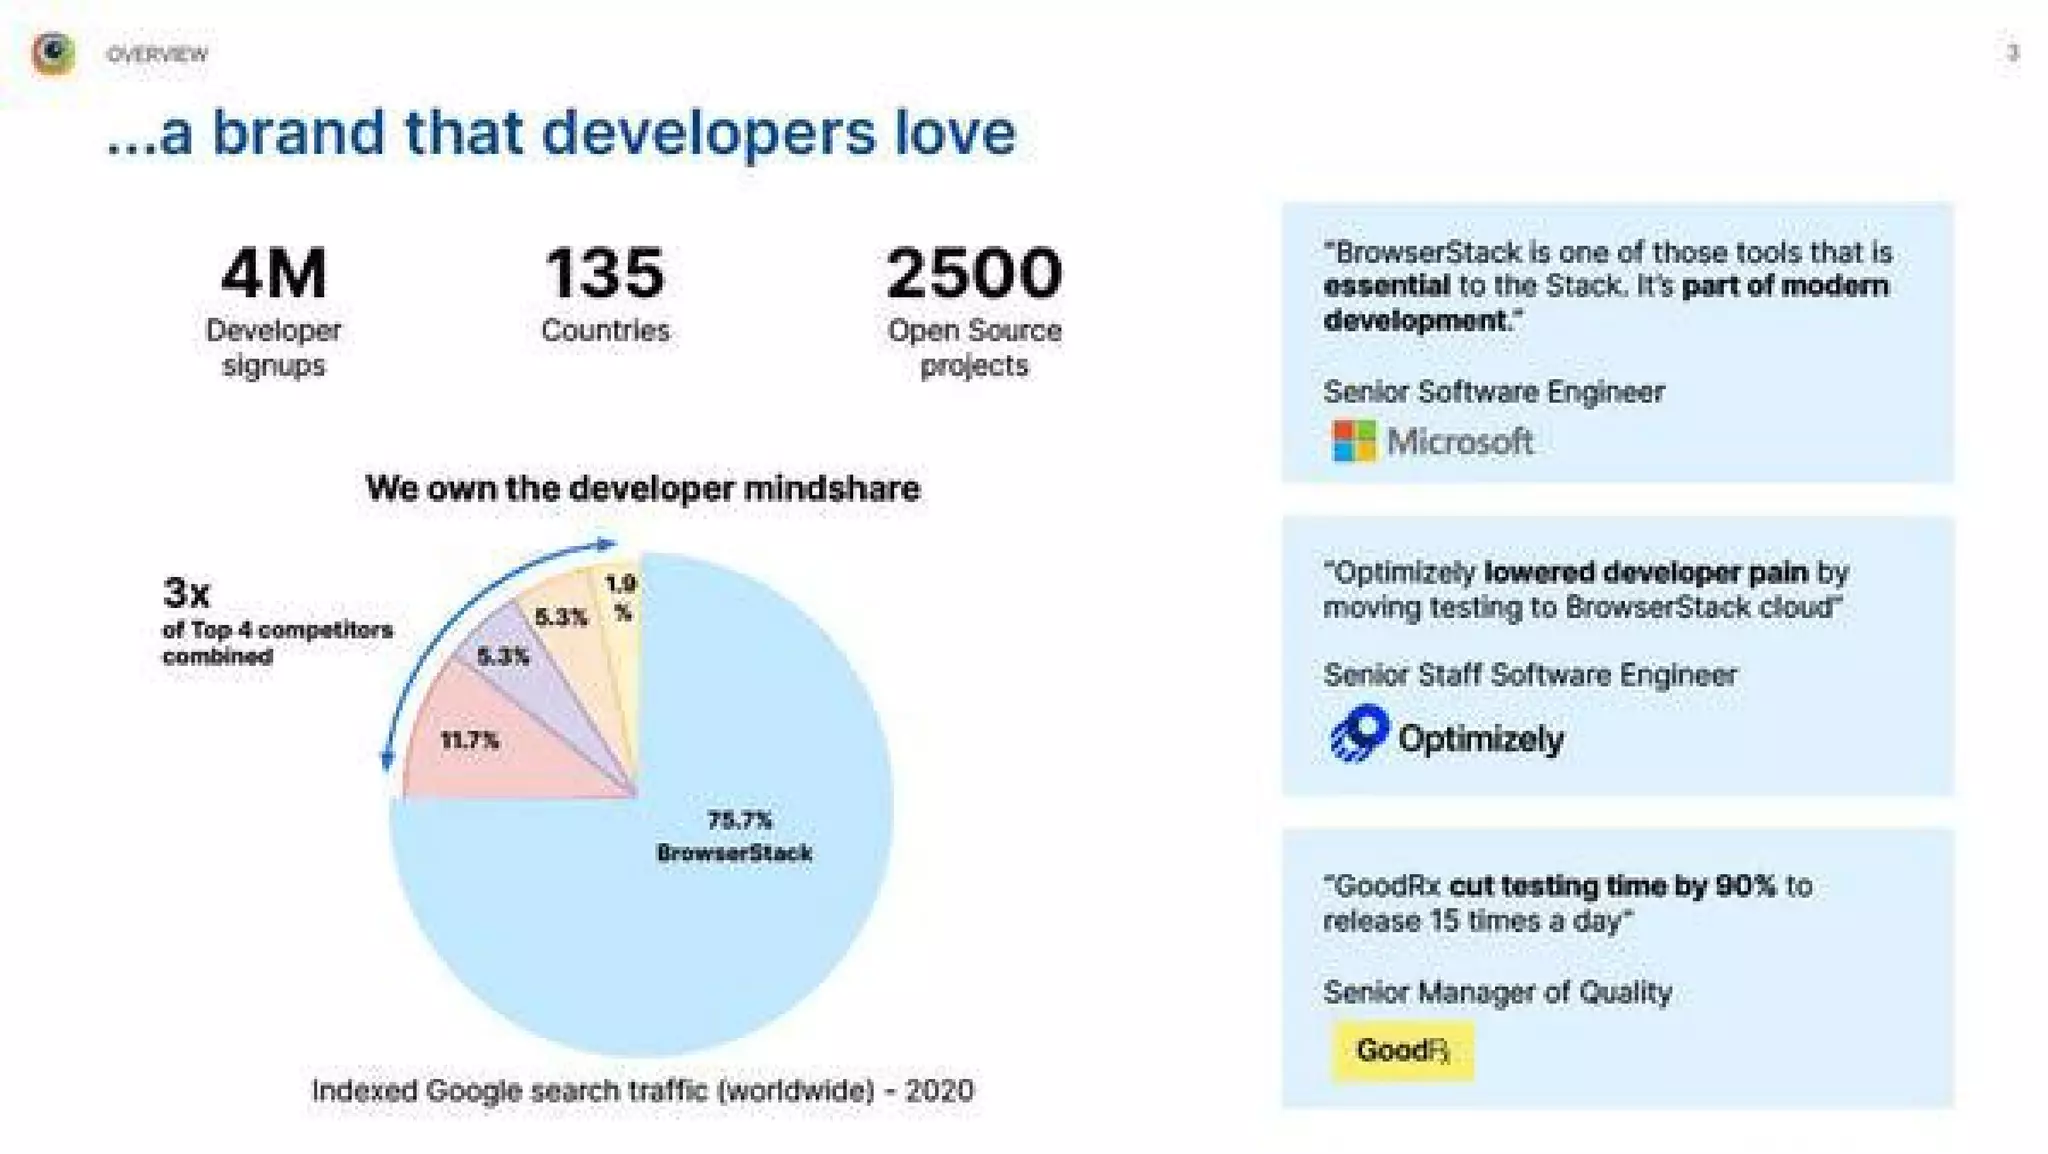
This slide foregrounds developer-focused KPIs such as developer signups, global reach, and open source endorsements, plus a pie chart showing dominant share of indexed search traffic. It also includes customer testimonials from recognizable engineering orgs. The mix of quantitative metrics and qualitative quotes is powerful: numbers show scale while quotes connect to product relevance and user sentiment.

For founders in developer tools, this slide is a model for demonstrating product-market fit. Present developer-centric adoption metrics, share of search or organic mindshare, and short, specific quotes from engineers to prove that the product is not only used but loved by its target audience.

Key Takeaway: Show both quantifiable reach and authentic developer testimonials to prove developer-first product-market fit.
Scale & Operational Footprint: Credibility through numbers

Scale & Operational Footprint: Credibility through numbers

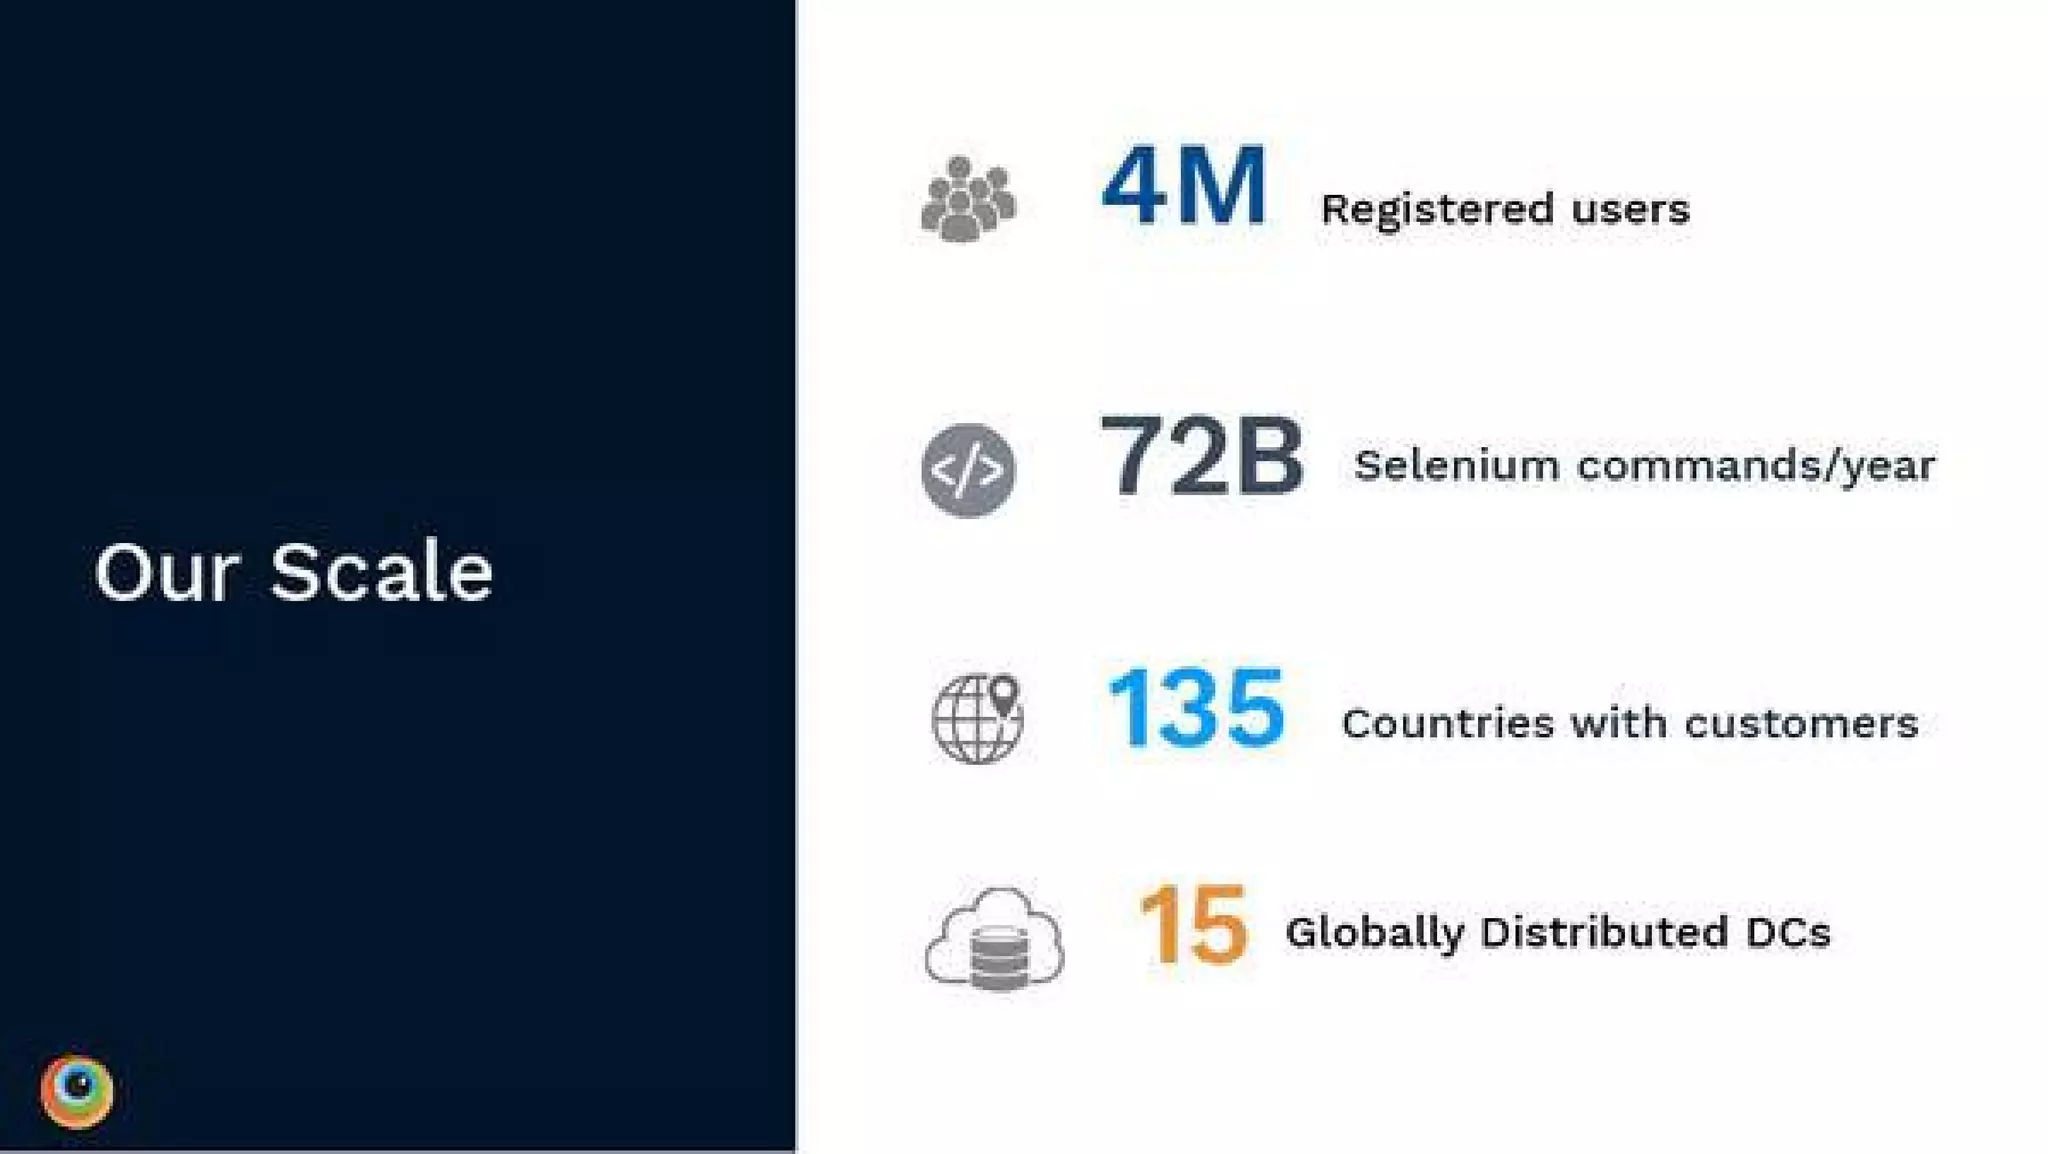
The scale slide lists hard operational metrics: registered users, billions of Selenium commands per year, countries with customers, and globally distributed data centers. These concise, high-impact numbers build trust that the service can handle enterprise loads and complex automation needs. The slide uses icons and large numerals to make the metrics instantly scannable.

Founders should emulate the same discipline when presenting operational scale: pick a few verifiable, impressive metrics that demonstrate capacity and reliability. Highlighting infrastructure reach and usage patterns helps reassure enterprise buyers and investors that the product operates at production scale.

Key Takeaway: Choose a few strong, verifiable operational metrics and present them visually to demonstrate production readiness and scale.
Customer Logos: Enterprise adoption and social proof

Customer Logos: Enterprise adoption and social proof

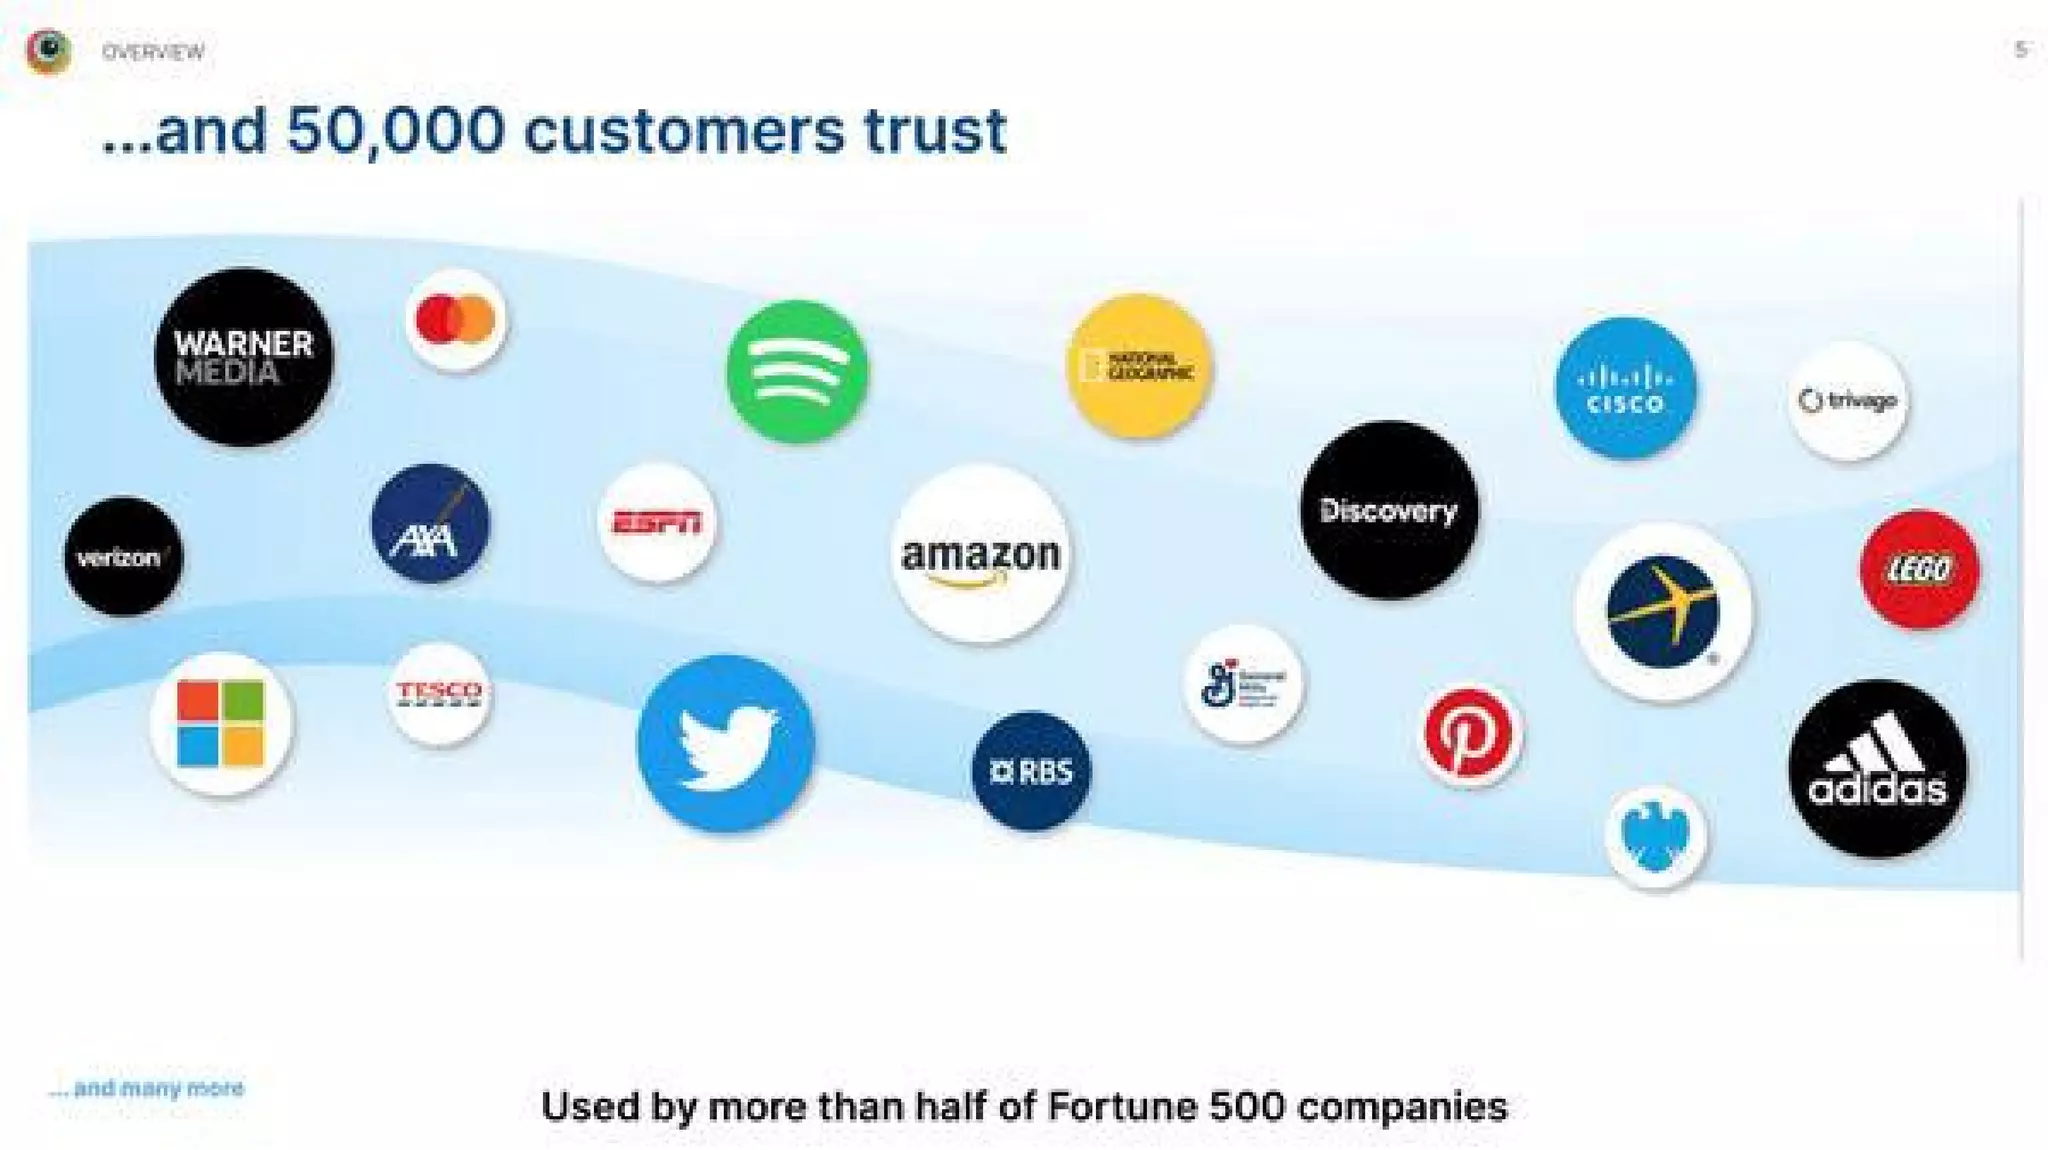
This slide shows a wide array of well-known customers and the claim of 50,000 customers, signaling broad enterprise adoption. A sea of recognizable logos quickly communicates validation across industries and use cases, which is persuasive for both investors and prospective customers. The accompanying line about Fortune 500 adoption reinforces the enterprise angle.

The lesson here is the power of curated social proof. Crowding the slide with diverse, reputable logos builds credibility fast. Startups should assemble a targeted set of customer brands and use them to demonstrate cross-industry traction, while ensuring any claims are accurate and up to date.

Key Takeaway: Use a curated set of high-recognition customer logos to provide fast, visual credibility for enterprise adoption.
Platform Architecture: Mapping use cases to product layers

Platform Architecture: Mapping use cases to product layers

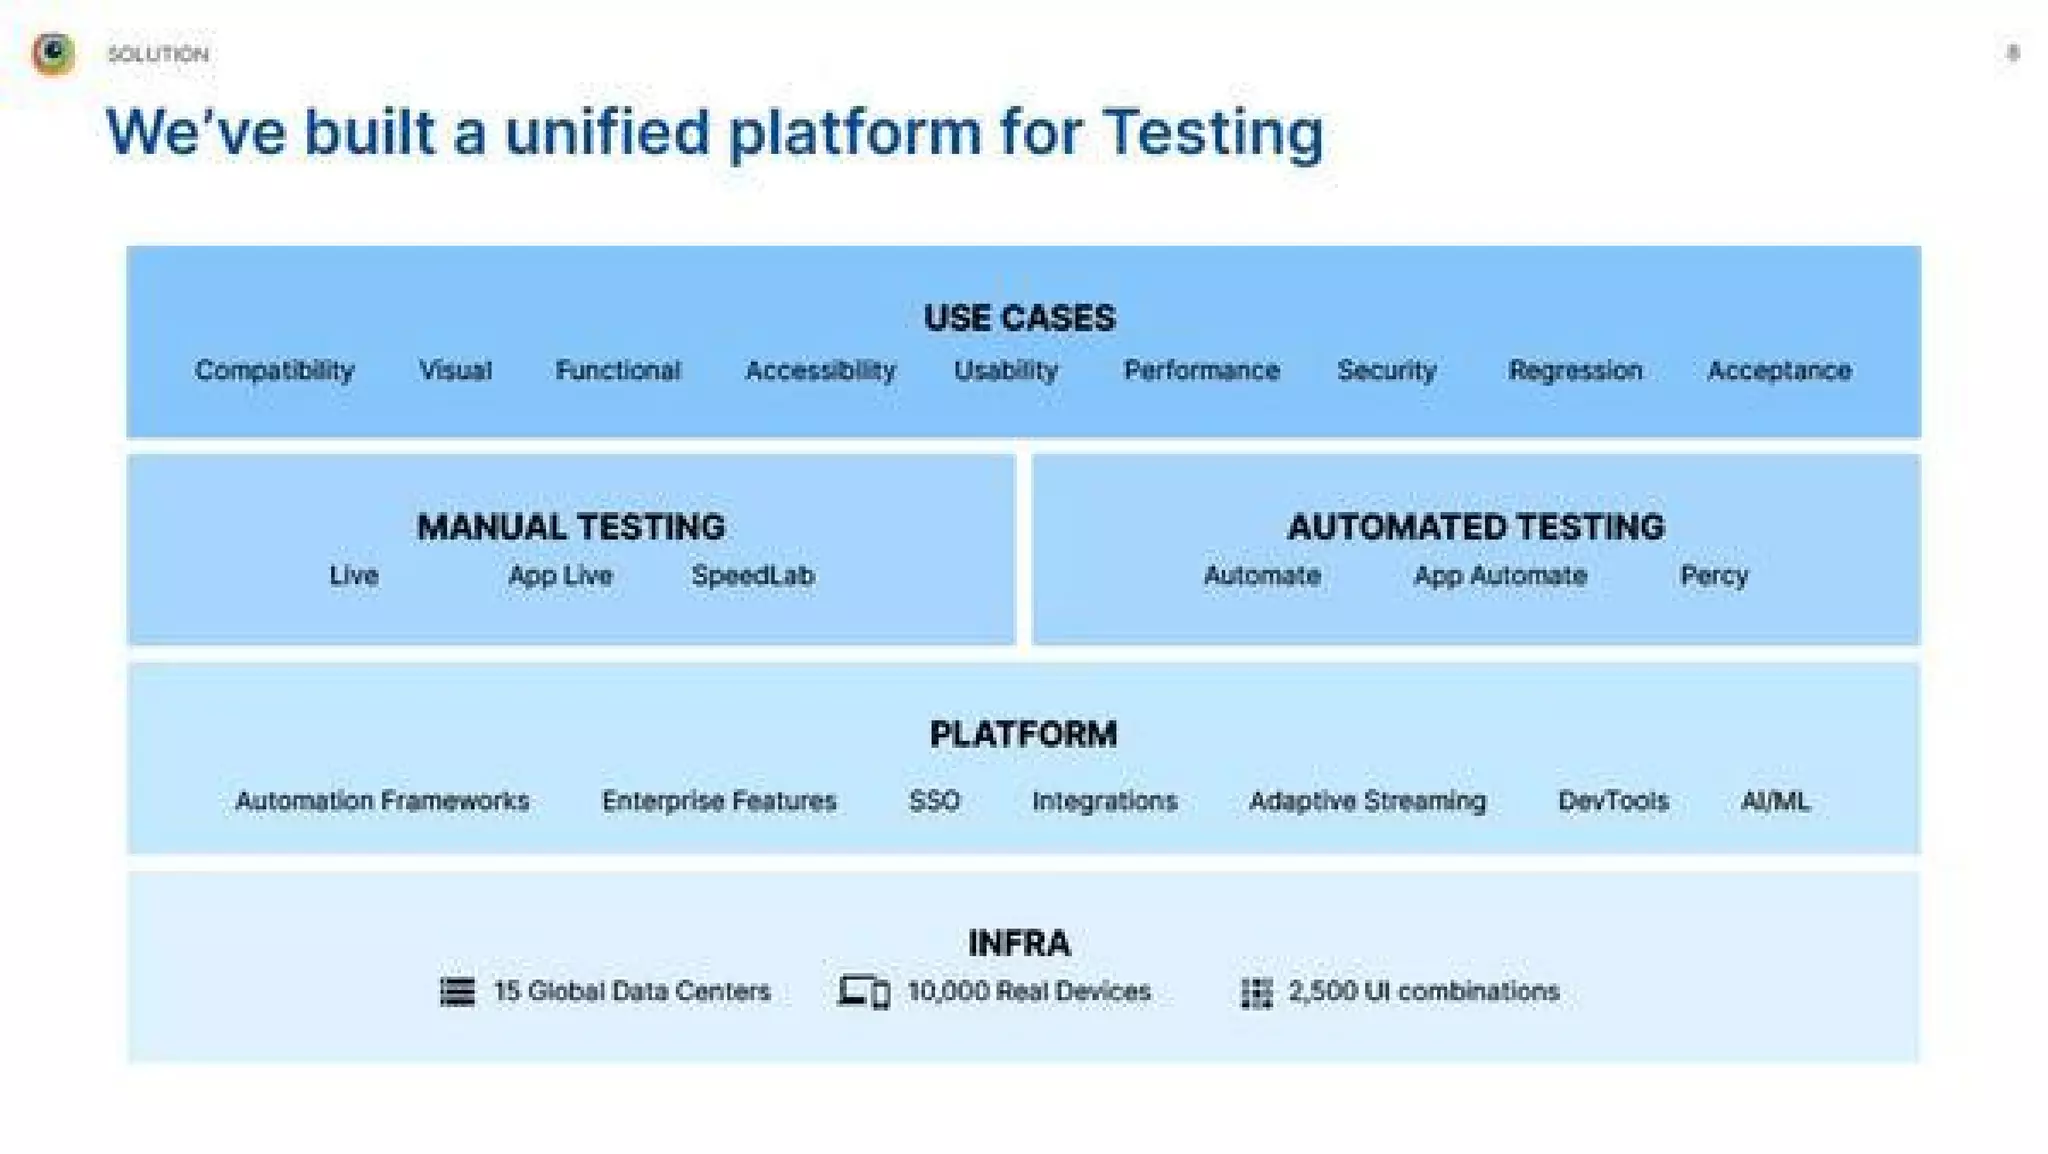
This diagram lays out BrowserStack as a unified testing platform with aligned use cases (compatibility, visual, functional, performance, etc.), separated manual and automated product lines, platform features, and infrastructure. It clearly shows how individual products fit into a coherent stack and how the company supports multiple kinds of testing needs across stages of development.

This slide is a strong example of product positioning: it helps non-technical stakeholders understand breadth without losing nuance. Founders should show how products connect into a single platform and which problems each product solves, making it easier for buyers and investors to see upsell paths and platform defensibility.

Key Takeaway: Map product capabilities to concrete use cases in a layered diagram to show coherence, expansion potential, and platform defensibility.
Product Suite: Clear pricing anchors and entry points

Product Suite: Clear pricing anchors and entry points

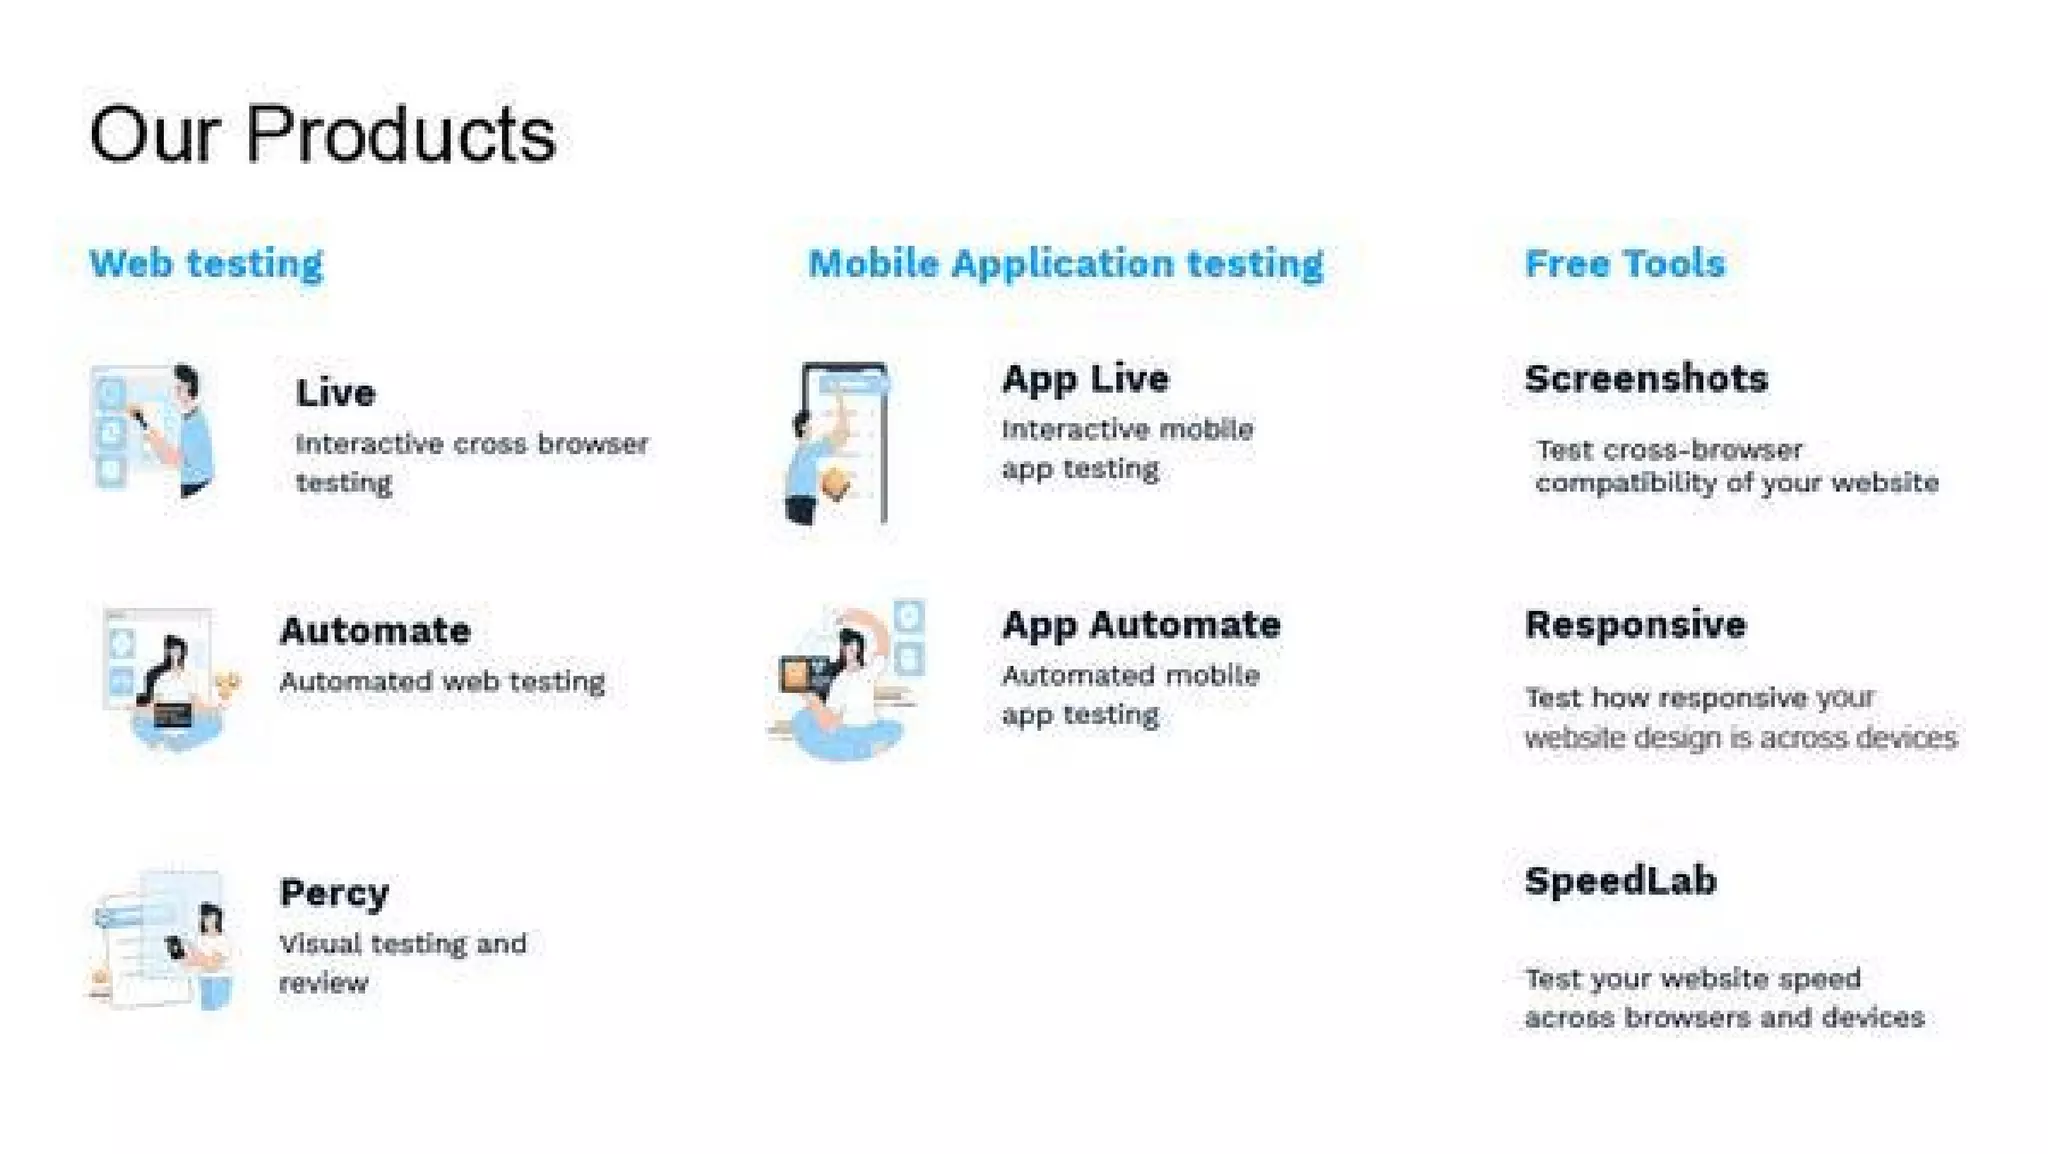
The product slide enumerates core offerings across web testing, mobile app testing, and free tools, using clear names like Live, Automate, App Live, and Percy. Grouping products into categories and calling out free tools provides explicit entry points for trial users and paths to paid features. The simplicity helps buyers quickly locate which product matches their needs.

Founders should organize product pages and decks around user jobs to be done, offering straightforward entry options and demonstrating how free or low-friction tools feed into paid upgrades. Clear names, short descriptors, and logical grouping reduce friction and improve conversion from discovery to paid usage.

Key Takeaway: Group products by user job, use clear names and brief descriptors, and include free entry tools to lower conversion friction and drive expansion.

Conclusion: Key Lessons

BrowserStack's deck succeeds by aligning brand, traction, scale, product architecture, and customer validation into a coherent narrative. It balances quantitative operational evidence with qualitative developer credibility and enterprise social proof to make a strong case for investment and enterprise adoption.

Actionable advice for founders: open with a clean brand statement; pair timelines with team signals; present developer or user mindshare with testimonials; choose a handful of verifiable scale metrics; showcase customer logos for social proof; and map products to use cases in a layered platform diagram. Together these elements build trust, reduce friction, and clearly communicate why the company deserves investment and enterprise adoption.

Full Deck Analysis

11 sections

Overview

Company: BrowserStack
Round: Series A ($50M)
Year: 2018
Outcome: Valued at $4B after Series B (2021)

Executive Summary

This Series A deck presents BrowserStack as the dominant, developer-first testing platform powering large cloud providers and thousands of enterprises. It emphasizes product-led scale (developer signups, large customer logos, global infrastructure) and positions BrowserStack as the de facto standard for “test” in the DevOps toolchain. The deck is strong on traction and product breadth, but light on explicit financials and go-to-market unit economics.

Problem Statement

  • The deck frames the core problem implicitly rather than via a single “here’s the pain” slide: testing across browsers/devices at scale is hard, fragmented, and slows development/CI/CD (implied across Slides 7–9).
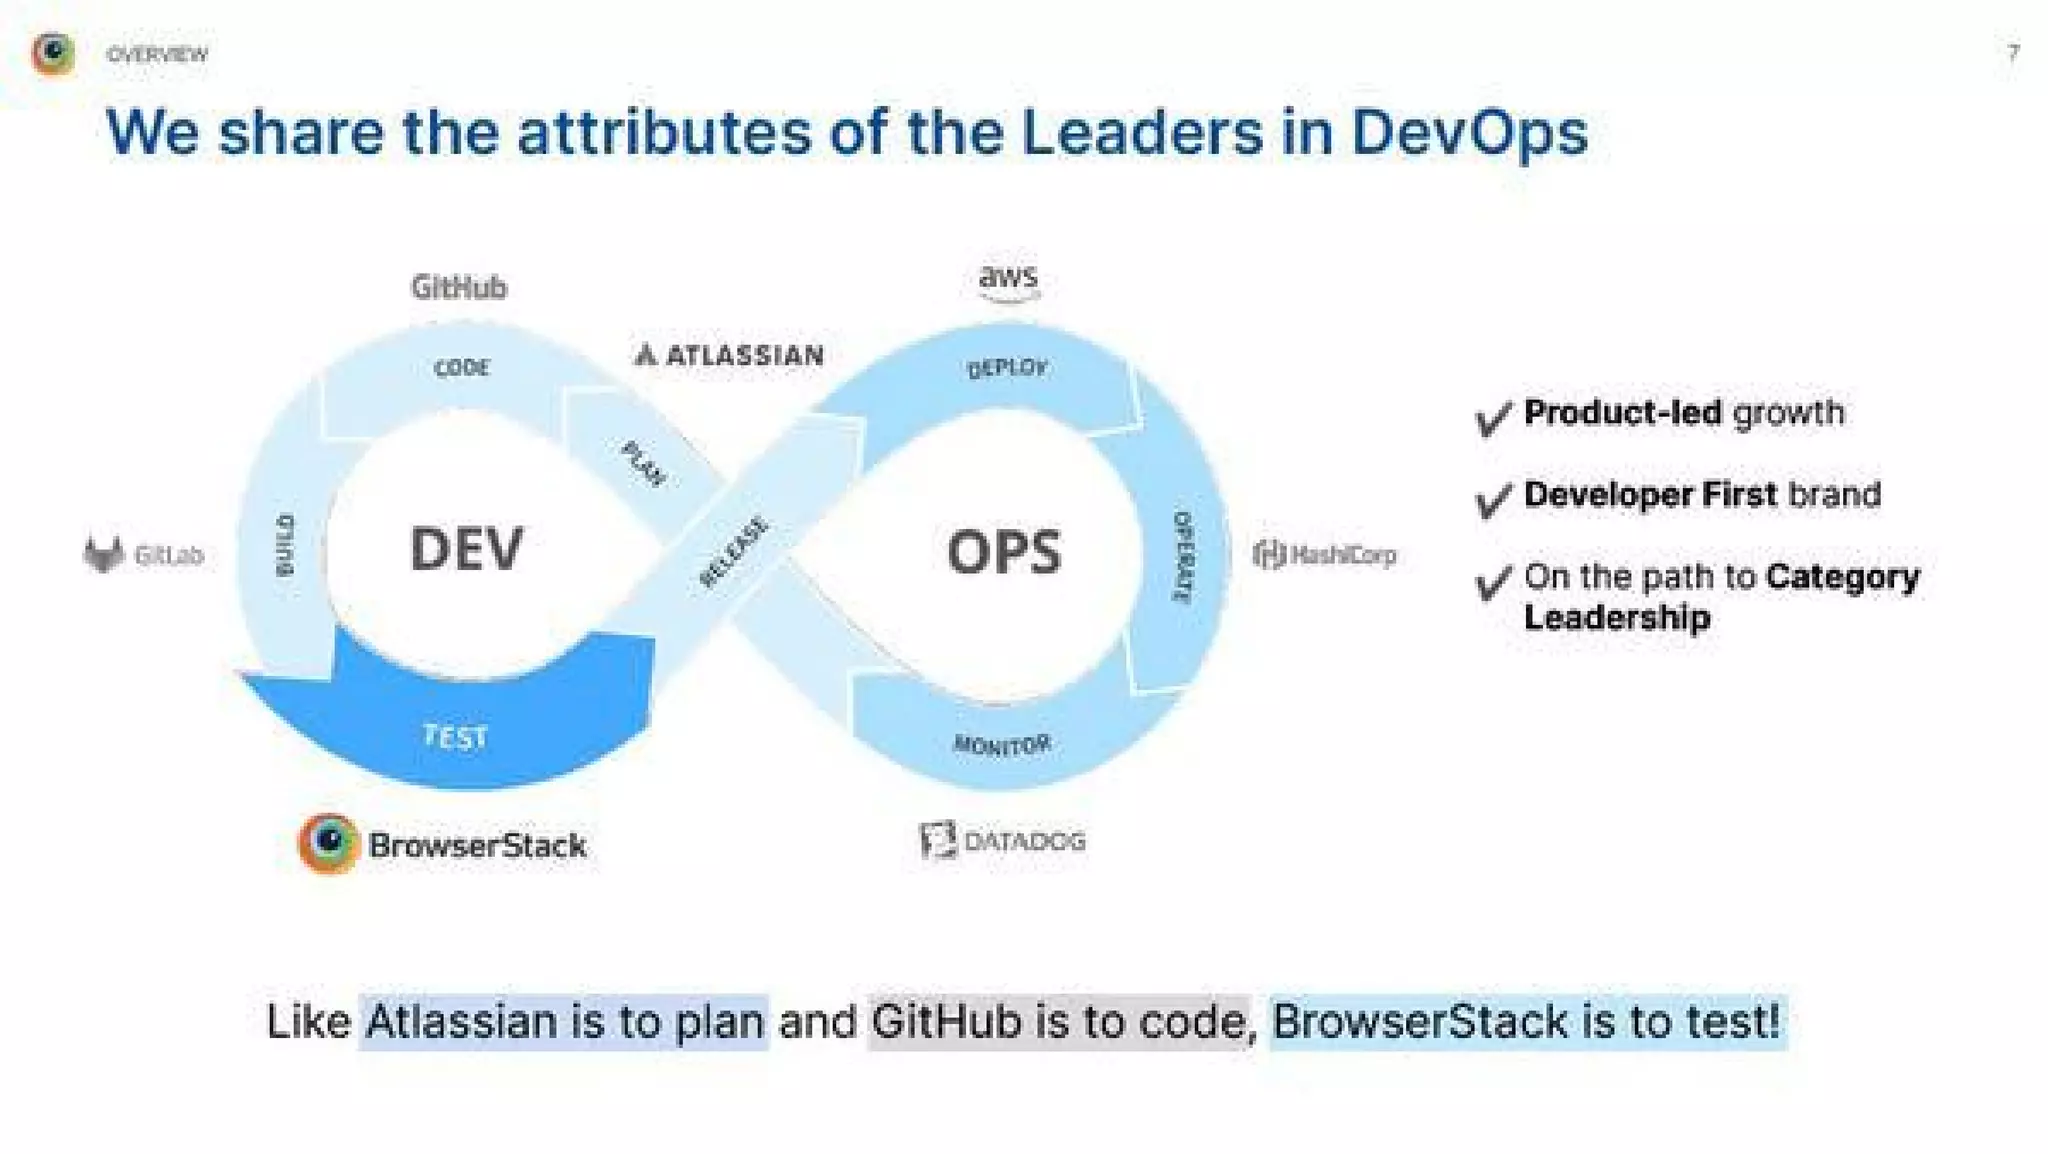
  • Slide 7 places BrowserStack inside the DevOps loop as the dedicated “test” layer — implying teams need a reliable cloud testing layer integrated into developer workflows.
  • The need for many testing use-cases (compatibility, visual, functional, accessibility, performance, security, regression, acceptance) is listed on Slide 8 to show the breadth of testing problems teams face.

Solution

  • BrowserStack presents a unified testing platform (Slide 8) that combines:
    • Manual testing: Live, App Live, SpeedLab
    • Automated testing: Automate (web), App Automate (mobile), Percy (visual)
    • Platform features: Automation frameworks, SSO, integrations, adaptive streaming, DevTools, AI/ML
    • Infrastructure: 15 global data centers, 10,000 real devices, 2,500 UI combinations
  • The deck emphasizes product-led adoption and developer-first UX — positioning BrowserStack as the integrated, enterprise-grade answer to distributed cross-browser/device testing.

Market Opportunity

  • The deck does not provide an explicit TAM/SAM/SOM numeric breakdown.
  • Implied market signals:
    • Used by more than half of Fortune 500 companies (Slide 5, header)
    • 135 countries with customers (Slide 4)
    • 50,000 customers (Slide 5 headline)
  • Missing: no explicit TAM, enterprise software market sizing, or pricing-based market modeling in the slides shown.

Business Model

  • SaaS / subscription model suggested by:
    • Enterprise features, SSO and integrations (Slide 8 platform)
    • Explicit product tiers: manual vs automated vs platform (Slide 9)
  • Target customers: developers, engineering teams, enterprise IT (logos on Slide 5 and Slide 6).
  • The deck does not show ARR, pricing bands, gross margins, CAC, LTV, or concrete unit economics.

Traction & Metrics

Concrete traction figures shown in the deck:

  • 50,000 customers (Slide 5 header)
  • 4M developer signups / registered users (Slide 3 and Slide 4)
  • 72B Selenium commands per year (Slide 4)
  • 135 countries with customers (Slides 3 & 4)
  • 15 globally distributed data centers (Slide 4 and Slide 8 infra)
  • 10,000 real devices & 2,500 UI combinations (Slide 8 infra)
  • Market-share signal: 75.7% of indexed Google search traffic for the category (Slide 3 pie chart, labelled “Indexed Google search traffic (worldwide) - 2020” — BrowserStack 75.7%)
  • Customer logos: Amazon, Microsoft, Google, Oracle, Spotify, Twitter, Adidas, Discovery, etc. (Slide 5 & Slide 6)
  • Timeline / company history: launched 2011; 1000 customers by 2012; device cloud 2015; app testing 2017; Series A 2018; Percy acquisition 2020; 750+ employees in 2021 (Slide 2).

Competitive Positioning

  • Claimed category dominance and developer mindshare:
    • Pie chart indicates BrowserStack captures ~75.7% of indexed Google search traffic vs competitors (Slide 3).
    • Positioning as the “test” layer in DevOps (Slide 7) — differentiates by integrating with developer workflows and DevOps tools.
  • Value props: product-led growth, developer-first brand, enterprise-ready infrastructure and integrations (Slide 7 & Slide 8).
  • Competitors implied but not named in detail; the pie chart hints at smaller fragmented competitors, and logos around DevOps loop reference Atlassian, GitHub, Datadog, HashiCorp as adjacent leaders (Slide 7).

Team

  • Founders shown: Ritesh Arora (CEO), Nakul Agarwal (CTO) (Slide 2).
  • Team scale: 750+ employees (timeline notes on Slide 2 for 2021).
  • The deck emphasizes engineering / developer credibility but does not provide detailed bios, prior exits, or board/advisor slate in the slides provided.

Go-to-Market Strategy

  • Implied GTM is product-led and developer-first (Slide 7).
  • Distribution channels inferred:
    • Free developer signups and self-serve adoption (4M developer signups)
    • Enterprise motion via integrations, SSO, and enterprise features (Slide 8)
    • Brand/motion via open-source and developer community (2,500 open source projects, Slide 3)
    • Customer logos and strategic partnerships with large cloud providers (Slide 6) to embed into enterprise workflows
  • The deck does not present explicit CAC, sales motion splits (inside sales vs field), or direct marketing channels.

The Ask

  • The deck documents the Series A amount: $50M (Slide 2 timeline).
  • The slides shown do not explicitly detail the intended use of funds. Reasonable inferred uses: scale infrastructure (data centers, devices), accelerate product development (Percy acquisition later), and expand GTM/enterprise sales.

Investor Deep Dive

Executive summary, strengths & red flags

Executive Summary

This Series A deck presents BrowserStack as the dominant, developer-first testing platform powering large cloud providers and thousands of enterprises. It emphasizes product-led scale (developer signups, large customer logos, global infrastructure) and positions BrowserStack as the de facto standard for "test" in the DevOps toolchain. The deck is strong on traction and product breadth, but light on explicit financials and go-to-market unit economics.

Key Strengths

3 identified

1

Compelling traction and usage metrics — concrete, high-impact numbers (4M developer signups, 50,000 customers, 72B Selenium commands/year) that validate product-market fit and scale.

2

Clear product breadth and infrastructure credibility — unified platform across manual & automated testing with large infra (15 DCs, 10k devices) provides defensibility and enterprise readiness.

3

Strong brand and market-share signals — developer-first positioning, broad developer signups, and the pie-chart market share (75.7% of indexed searches) communicate category leadership and organic demand.

Red Flags & Weaknesses

3 identified

1

No financials / unit economics disclosed — ARR, growth rate, gross margin, CAC, LTV, churn are absent from the slides shown.

2

No explicit TAM / market sizing — while customer counts and logos imply large opportunity, there is no numeric TAM/SAM/SOM or pricing model shown.

3

GTM and monetization detail sparse — the deck emphasizes developer signups and enterprise features but lacks clarity on sales motion, conversion funnel, pricing tiers, enterprise contract sizes, or retention metrics.

More Pitch Decks To Study

Compare structure, fundraising context, and investor-facing story across similar startup decks.