Compare your deck to TravelPerk

Compare Your Deck

TravelPerk Pitch Deck (2016)

SaaS
Stage: Series A
Raised: $1.5M
Year: 2016
Slides: 15
Outcome: Valued at $2.7B after Series E (2025)

Pitch Deck

1 / 15
TravelPerk pitch deck - Cover: Clear brand positioning and visual identity
Click to expand

Deck Analysis

This TravelPerk Series A deck presents a clean, visual story for a B2B SaaS travel platform focused on making business travel simple and delightful. It combines a clear mission statement, a concise company timeline, product screenshots that demonstrate an intuitive booking experience, and operational proofs like inventory partnerships and 24/7 support. Notable is how the deck balances emotional hooks (happiness of travelers) with concrete product and go-to-market evidence, which helps justify early-stage fundraising and sets the stage for the company’s later scale and valuation.

Cover: Clear brand positioning and visual identity

Cover: Clear brand positioning and visual identity

The opening slide (cover) sets the tone with a bold headline — 'Business Travel that works' — and a large photo of travelers. The design is minimalist with high-contrast brand color, simple logo placement, and a direct value proposition. This immediately communicates the company's focus and the core promise: simplify business travel.

The cover is effective because it nails the first impression: simple language, strong branding, and a human image to connect emotionally. Founders can learn that a cover should do three things: state the primary benefit in one line, establish a visual identity that will carry through the deck, and humanize the product with relatable imagery.

Key Takeaway: Open with a single, benefit-driven sentence and consistent visual branding so investors instantly understand what you do and who you serve.
Mission: Problem framing and simple emotional hook

Mission: Problem framing and simple emotional hook

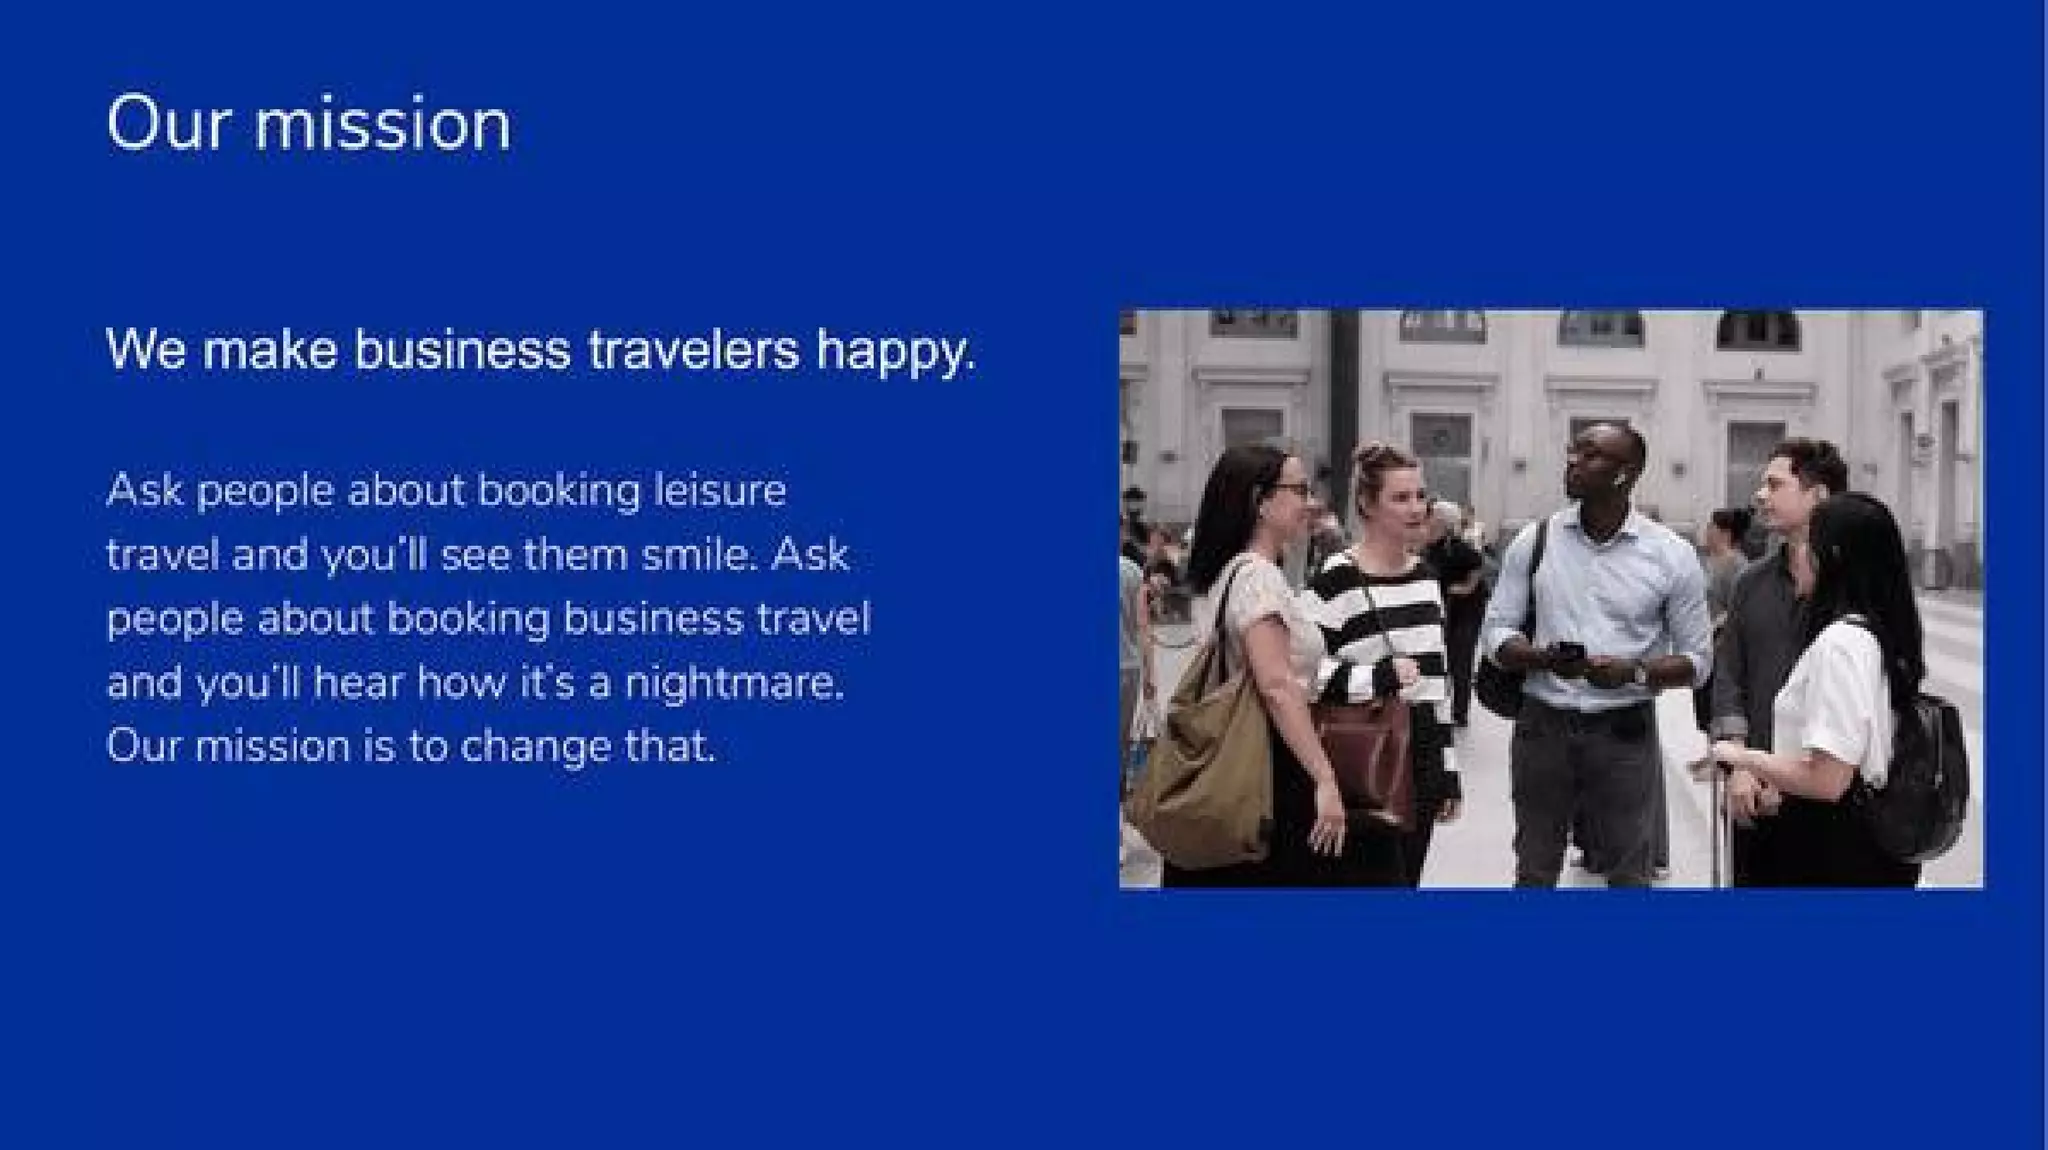
Slide 3 states the mission concisely: 'We make business travelers happy.' It pairs that line with a short paragraph contrasting leisure booking (which makes people happy) with business travel (which is often a nightmare). This is classic problem/solution framing — it identifies a widespread pain point and positions the company as the remedy.

The emotional hook is efficient: it turns a functional product into a promise about experience. Founders should notice how effective brevity is here; a one-line mission followed by two or three sentences of context communicates both empathy and intent without excess detail. This helps investors quickly grasp the market need and the company's north star.

Key Takeaway: Lead with an emotionally resonant mission that frames the real customer pain before diving into features or metrics.
Traction & Timeline: Building credibility with milestones

Traction & Timeline: Building credibility with milestones

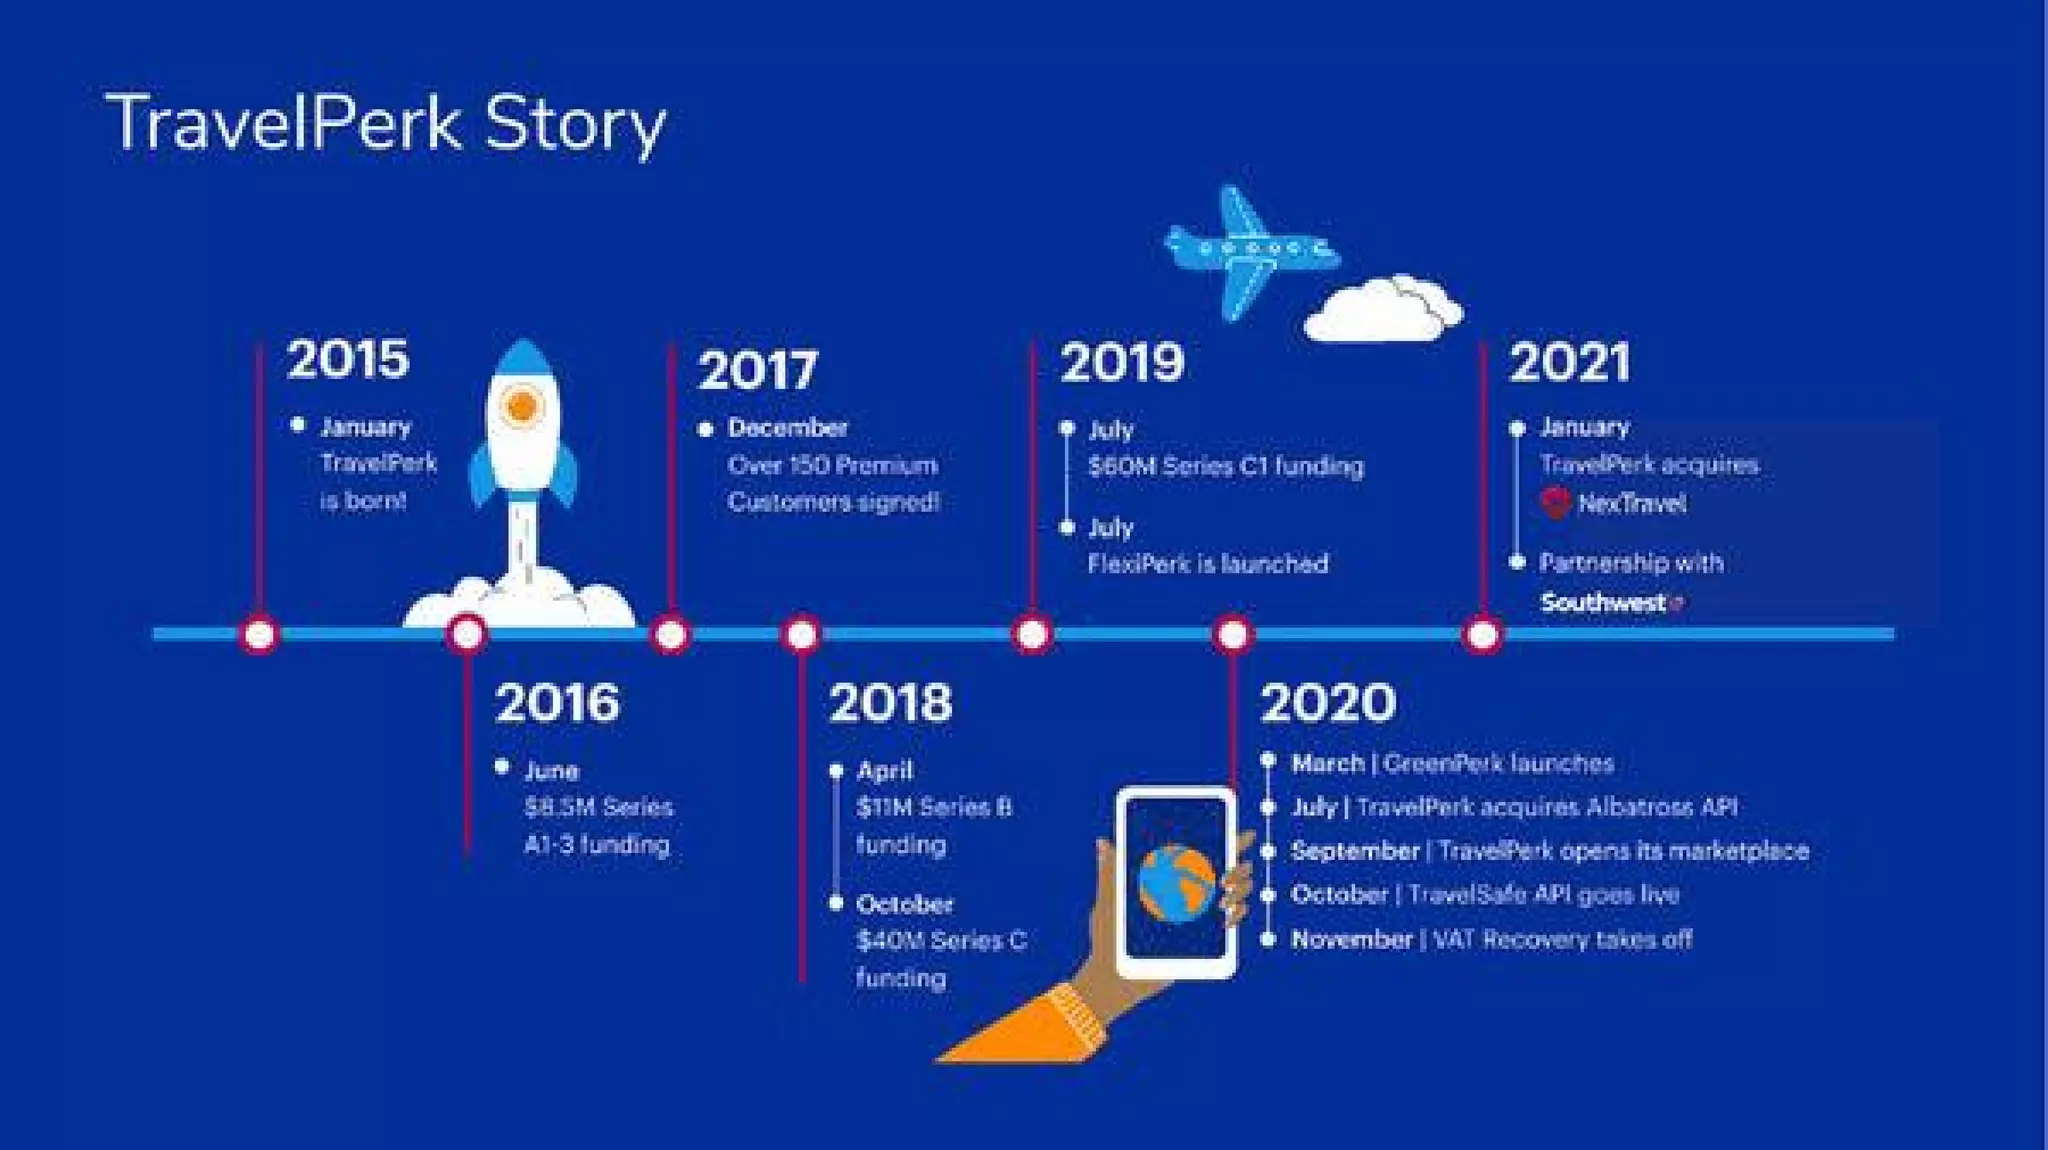
Slide 4 is a visual timeline of the company's milestones from founding through multiple funding rounds and strategic launches. The timeline highlights funding events, product launches, acquisitions, and partnerships, demonstrating steady progress and business momentum. For Series A investors, this chronology shows that the team is execution-oriented and has a plan for growth.

A timeline like this converts disparate achievements into a coherent narrative and reduces investor friction when evaluating progress. Founders should include only key, high-signal milestones (funding, product releases, major partnerships) to show momentum without overwhelming the audience with minutiae.

Key Takeaway: Use a concise timeline to show measurable momentum and signal that the team executes on plans and milestones.
Product & UX: Demonstrating the 'one platform' experience

Product & UX: Demonstrating the 'one platform' experience

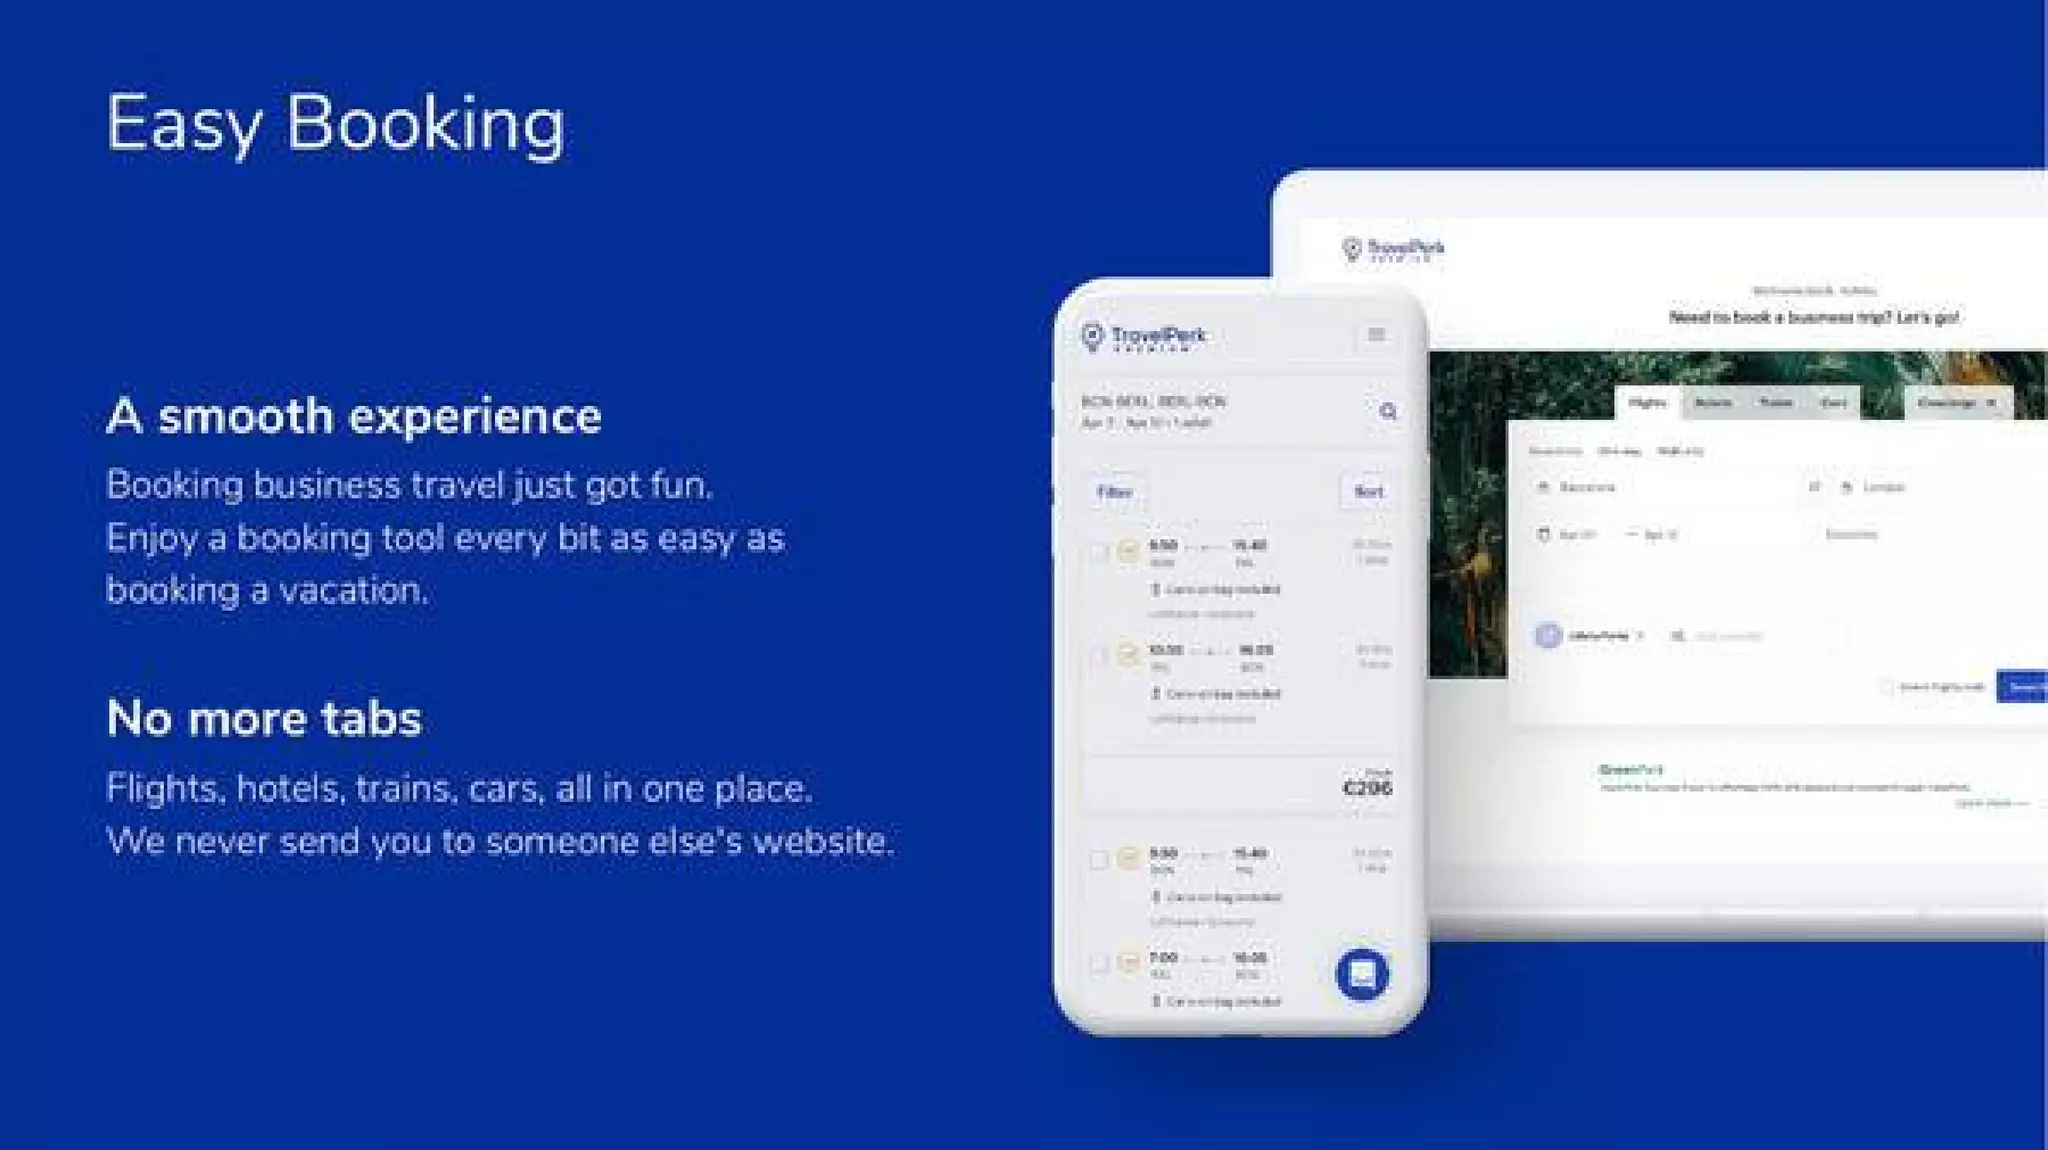
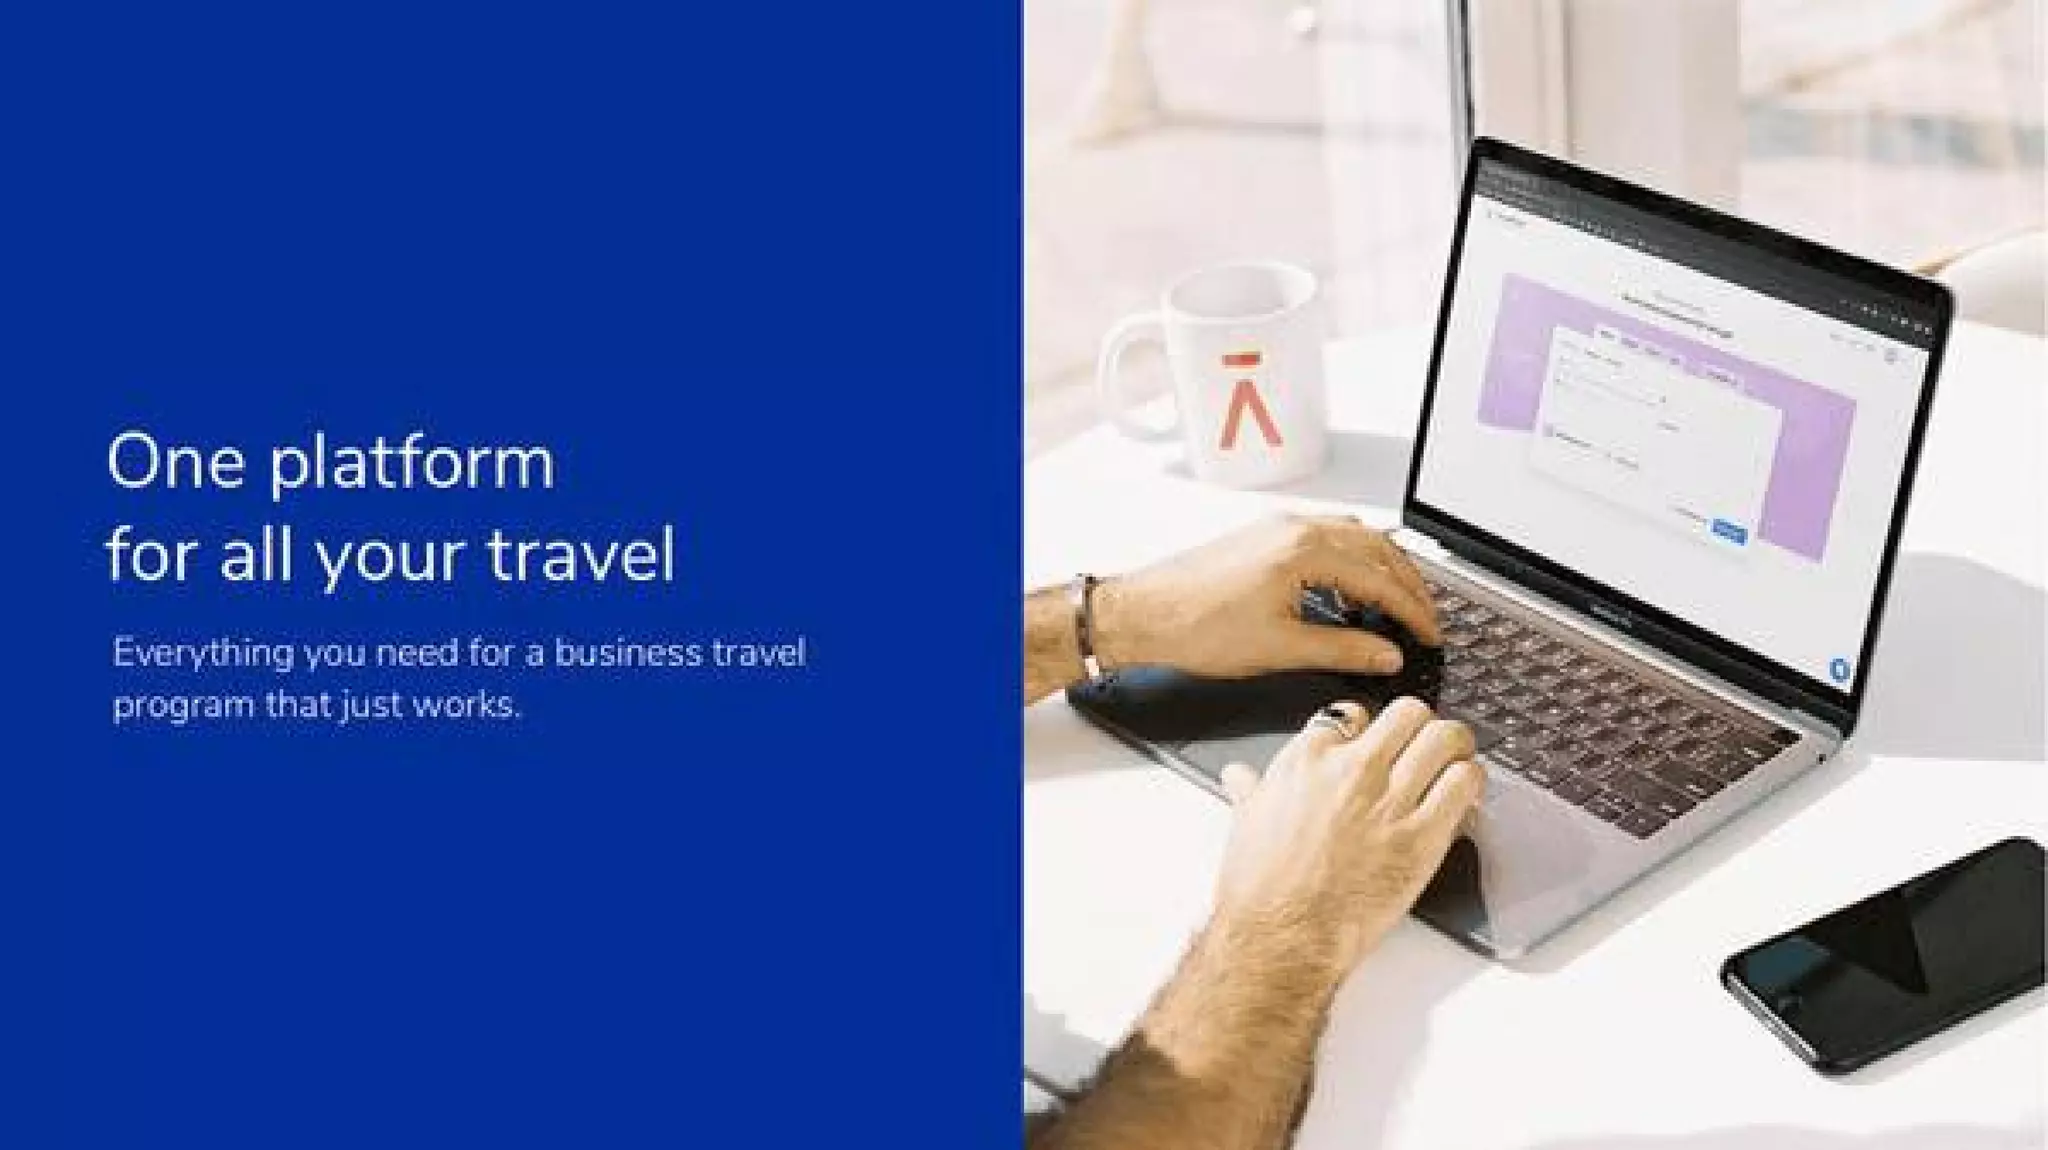
Slides 5 and 6 (represented here by slide 06) showcase the platform and booking UX. High-quality screenshots of the booking flow and a laptop/phone context communicate that the product is usable and polished. The messaging — 'One platform for all your travel' and 'Easy Booking' — emphasizes convenience, consolidation, and a consumer-grade experience for corporate users.

This section is effective because it pairs claims with visual proof: you say the product is easy and then show the interface. Founders should bring real UI screenshots or prototypes to decks to translate abstract features into tangible evidence of product-market fit and product quality, especially for UX-focused consumerized B2B offerings.

Key Takeaway: Back product claims with real UI screenshots that demonstrate polish and a coherent user experience across devices.
Inventory & Partnerships: Showcasing supply coverage and economics

Inventory & Partnerships: Showcasing supply coverage and economics

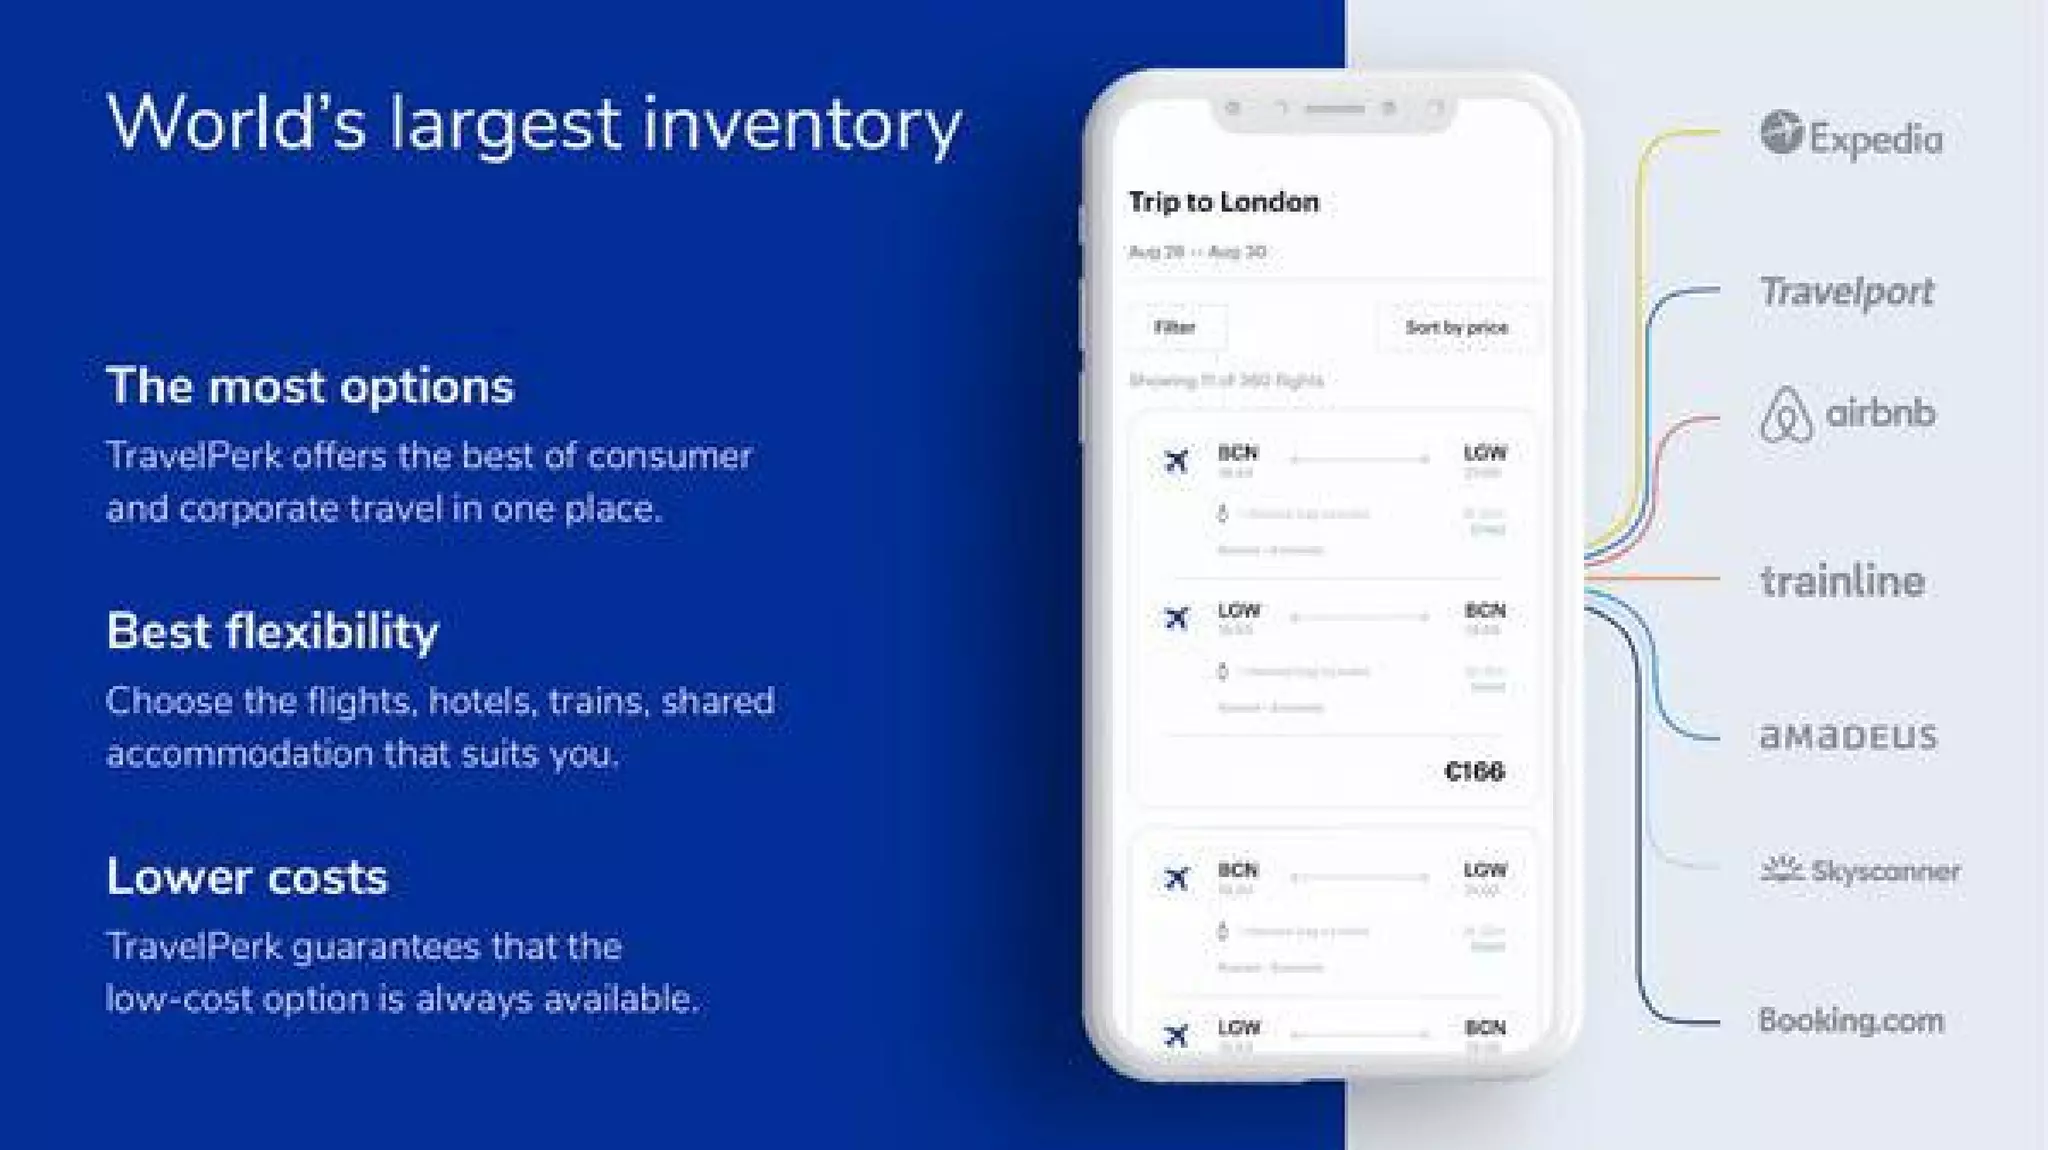
Slide 7 highlights TravelPerk's inventory and partner ecosystem — Expedia, Travelport, Airbnb, Trainline, Amadeus, Skyscanner, Booking.com — and ties this to 'most options', 'best flexibility', and 'lower costs.' For a travel marketplace, supply-side credibility is critical; the deck shows the breadth of channels aggregated by the platform, implying competitive pricing and selection advantages.

This slide is a practical lesson in evidence-based positioning: showcasing integrations and well-known partners reduces doubts about coverage and reliability. Founders of marketplace or platform businesses should similarly surface key integrations, partners, or suppliers early to demonstrate defensibility and the ability to deliver value to end customers.

Key Takeaway: Highlight strategic integrations and supply partnerships to prove your product can actually deliver the choice and pricing you promise.
Support & Operations: Demonstrating service-level differentiation

Support & Operations: Demonstrating service-level differentiation

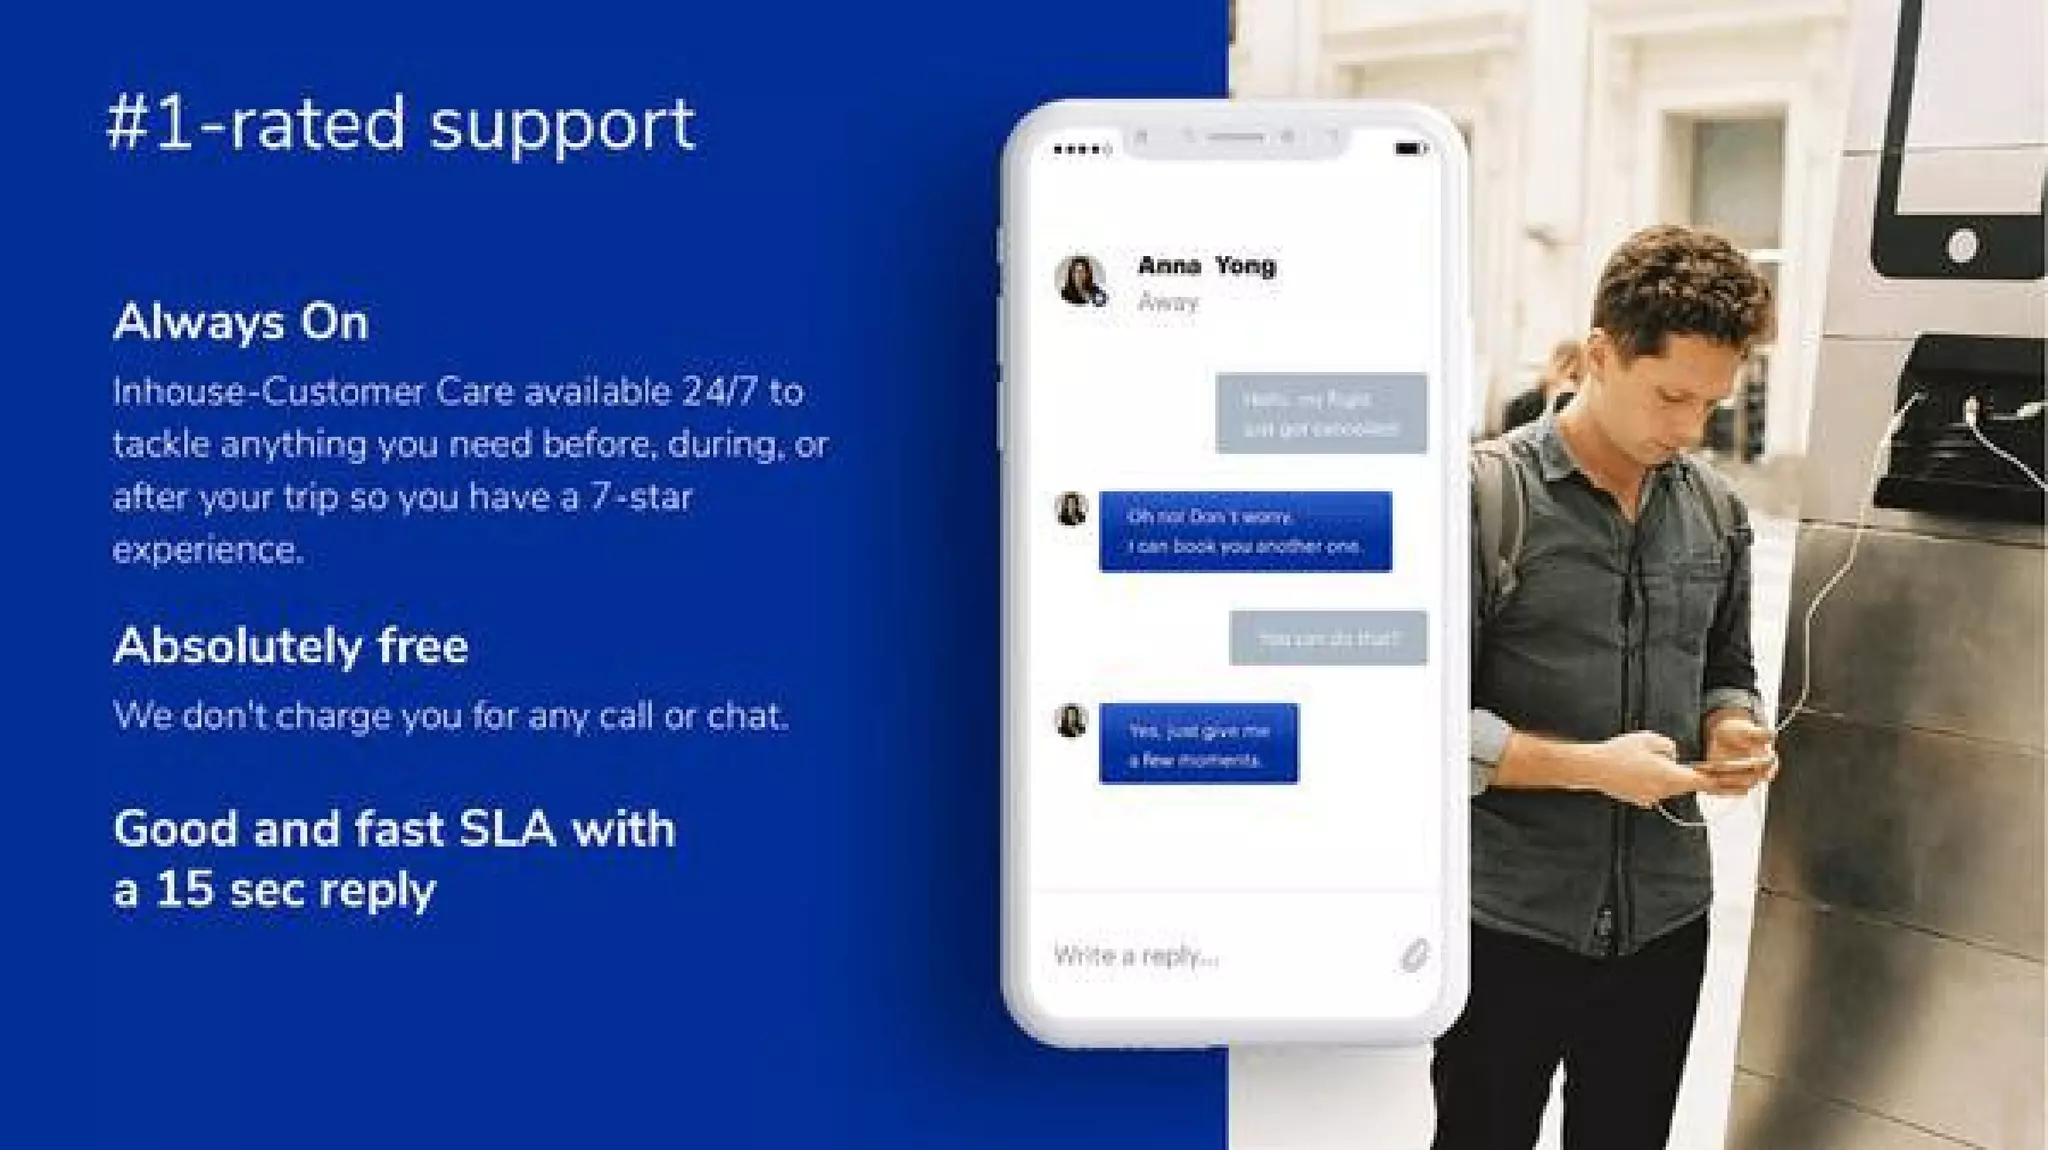
Slide 8 emphasizes '1-rated support' with claims of 24/7 inhouse customer care, free calls/chats, and a fast SLA (15 sec reply). In travel, operational reliability and support are core to retention and net promoter scores; this slide communicates that TravelPerk treats support as a product differentiator rather than a cost center. The mobile chat mockup humanizes the promise and shows a scalable support workflow.

Operational reliability is often the unseen moat in service-heavy businesses. For founders, including SLA commitments, support structure, and how it ties to customer experience can reassure investors about churn risk and post-sale execution.

Key Takeaway: Turn support and operations into a visible differentiator by quantifying SLAs and showing how customer care scales with the product.
Product Roadmap & Innovations: Features that expand value

Product Roadmap & Innovations: Features that expand value

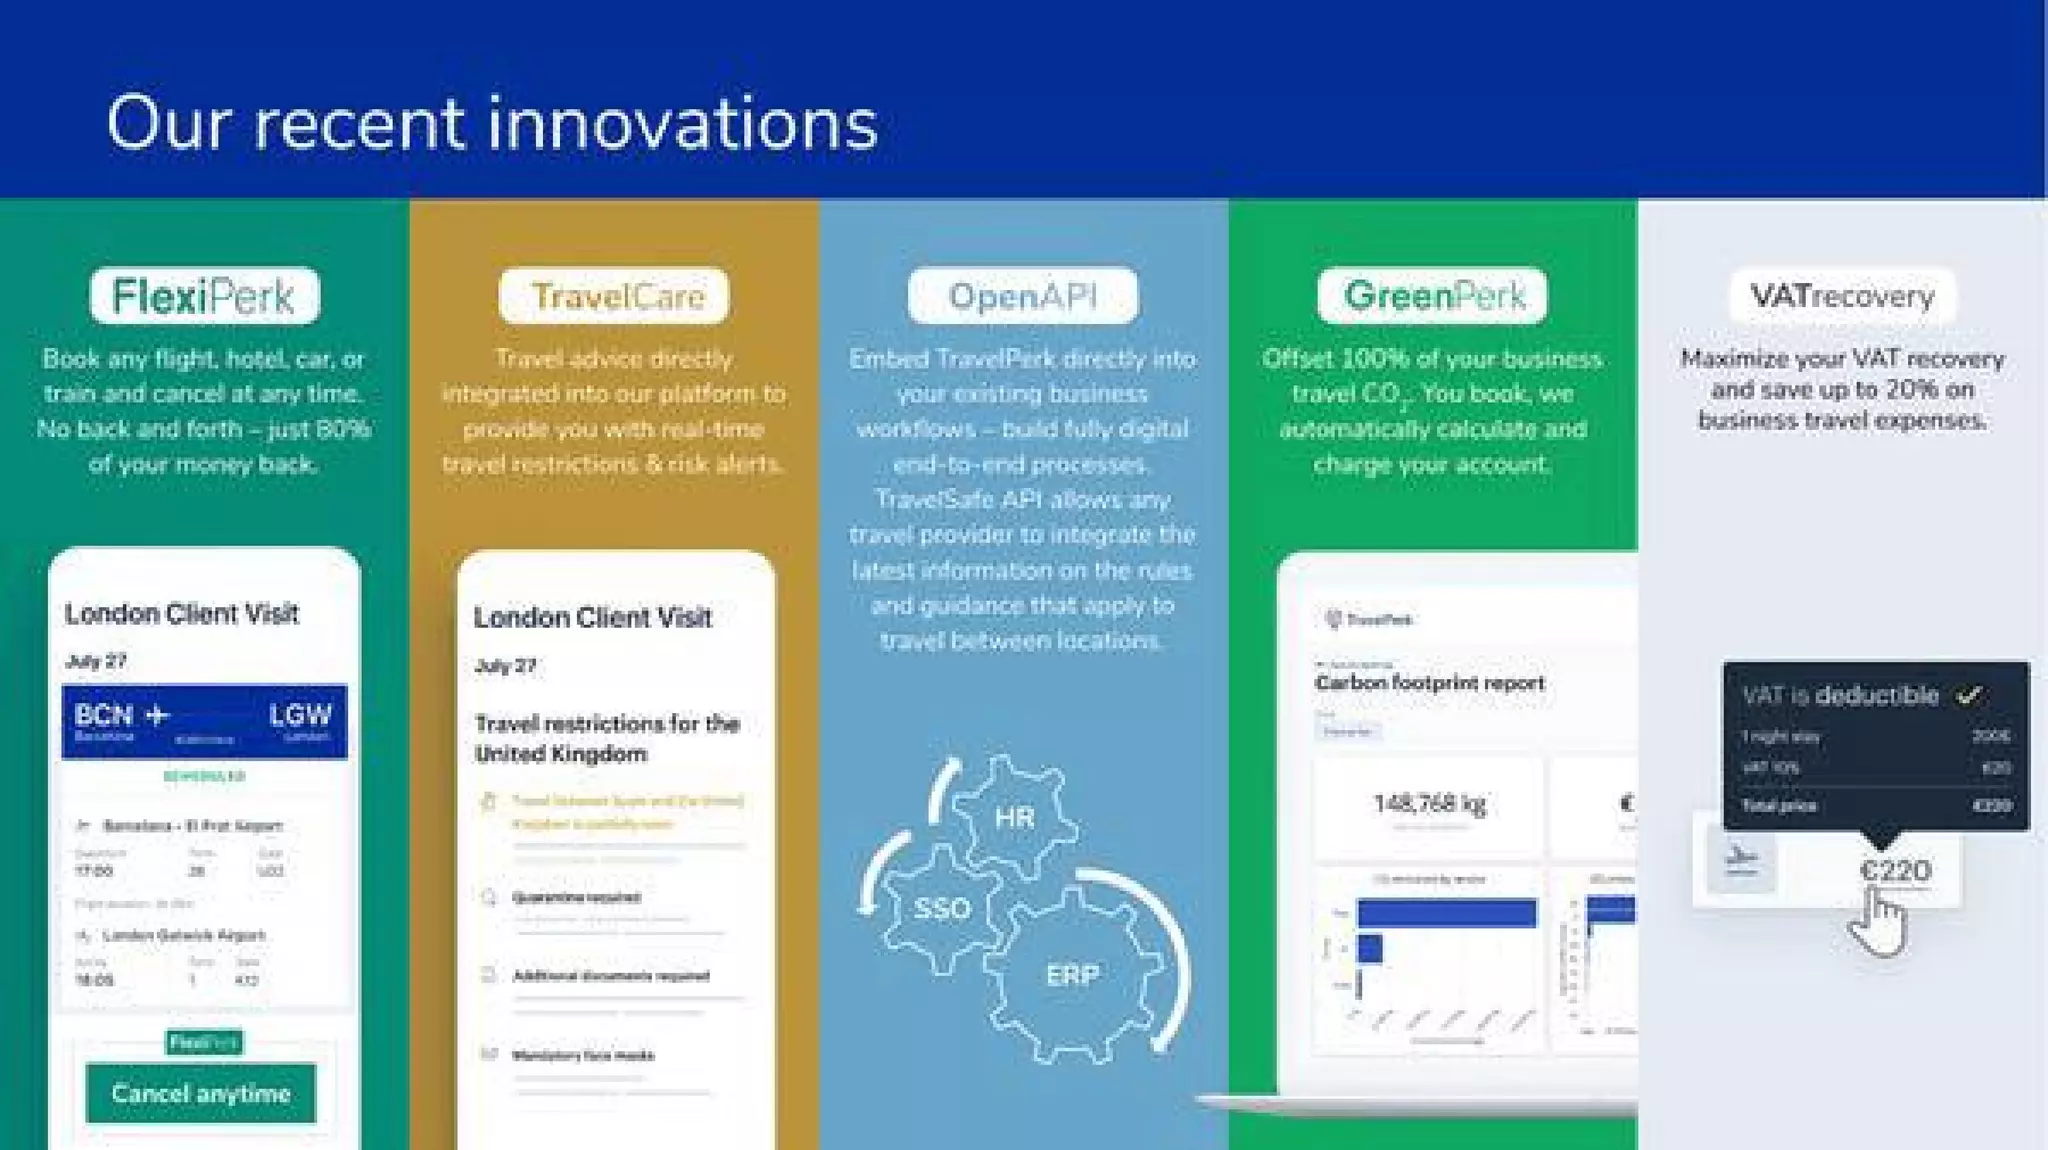
Slide 12 lays out recent innovations like FlexiPerk (flexible cancellations), TravelCare (travel restrictions), OpenAPI integrations, GreenPerk (carbon offsetting), and VAT recovery tools. This mix shows the product expanding from booking to policy, compliance, sustainability, and finance — turning a point solution into a platform of sticky features that touch procurement, HR, and finance.

The lesson for founders is to show how incremental features build cross-functional value and reduce churn. Roadmap items that address legal/compliance (VAT), corporate policy, and sustainability often unlock enterprise contracts and justify higher ARPU, making them important to highlight in a pitch deck.

Key Takeaway: Present innovations that broaden platform value across departments, creating cross-functional stickiness and multiple monetization levers.

Conclusion: Key Lessons

This deck excels at pairing simple, emotionally resonant positioning with tangible evidence: product screenshots, partner logos, a clear timeline of traction, and operational commitments. Its strengths lie in clarity, visual polish, and an emphasis on the customer experience as the core differentiator. Founders should emulate the focus on a one-line mission, prioritized milestones, real UI proof, and partner/integration credibility.

Actionable advice: keep the narrative tight (problem → solution → traction), use visuals to prove rather than describe, surface the operational elements that reduce investor risk (support, supply, integrations), and highlight product features that expand value across buyer stakeholders. These elements together make a pitch deck persuasive for both product-minded and growth-minded investors.

Full Deck Analysis

11 sections

Overview

Company: TravelPerk
Round: Series A (context provided: $1.5M)
Year: 2016
Outcome: Valued at $2.7B after Series E (2025)

Note: the deck’s timeline (slide 5) also shows a 2016 Series A milestone listed as ~$8.5M. I call out this discrepancy below — the rest of the brief references numbers visible in the slides where relevant.


Executive Summary

This is a tightly branded, product-focused Series A deck that frames a clear pain (business travel is a nightmare), presents an integrated platform solution (one place to search, book, pay, report), and supports claims with early traction, partner logos and product screenshots. The deck emphasizes product features, customer experience and integrations rather than deep financial detail — a common approach for early-stage marketplace/platform pitches.


Problem Statement

How the deck articulates the problem:

  • Slide 3: Headline “Our mission” + a concise problem narrative: “Ask people about booking leisure travel and you’ll see them smile. Ask people about booking business travel and you’ll hear how it’s a nightmare. Our mission is to change that.” This is an empathetic, user-centered problem statement that focuses on pain and sentiment rather than hard metrics.
  • Across slides 6–11: the problem is reinforced implicitly — fragmented booking experiences (multiple tabs/sites), lack of centralized reporting, poor support and difficulty reconciling expenses.

Solution

How the deck positions the solution:

  • TravelPerk is framed as “One platform for all your travel” (slide 6) — a unified booking + payment + reporting product that combines consumer inventory and corporate controls.
  • Product capabilities highlighted in subsequent slides:
    • Easy booking UI and consolidated inventory (slides 7–8).
    • 24/7 in-house, free customer support (slide 9).
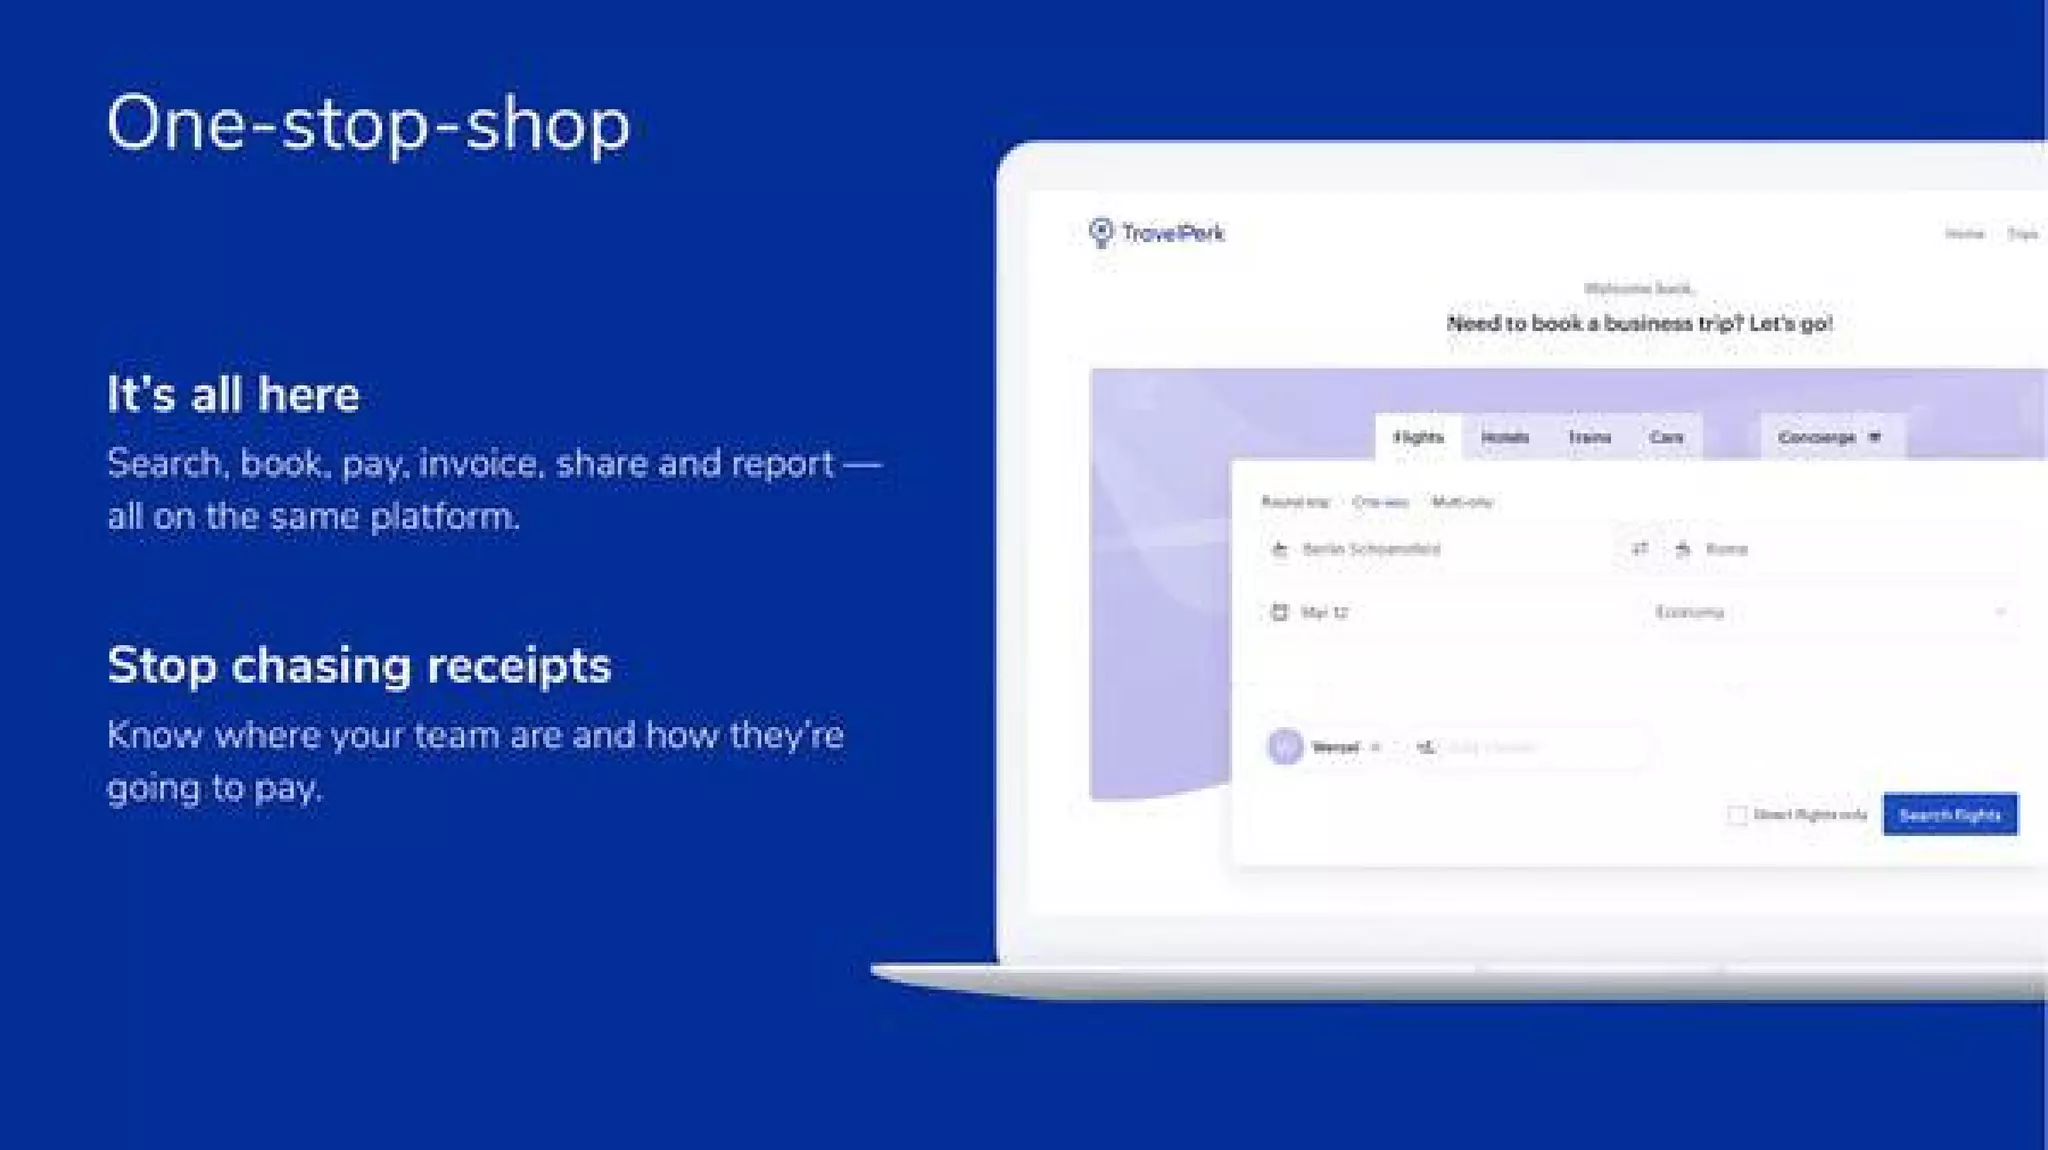
    • One-stop-shop features: search, book, pay, invoice, share, report (slide 10).
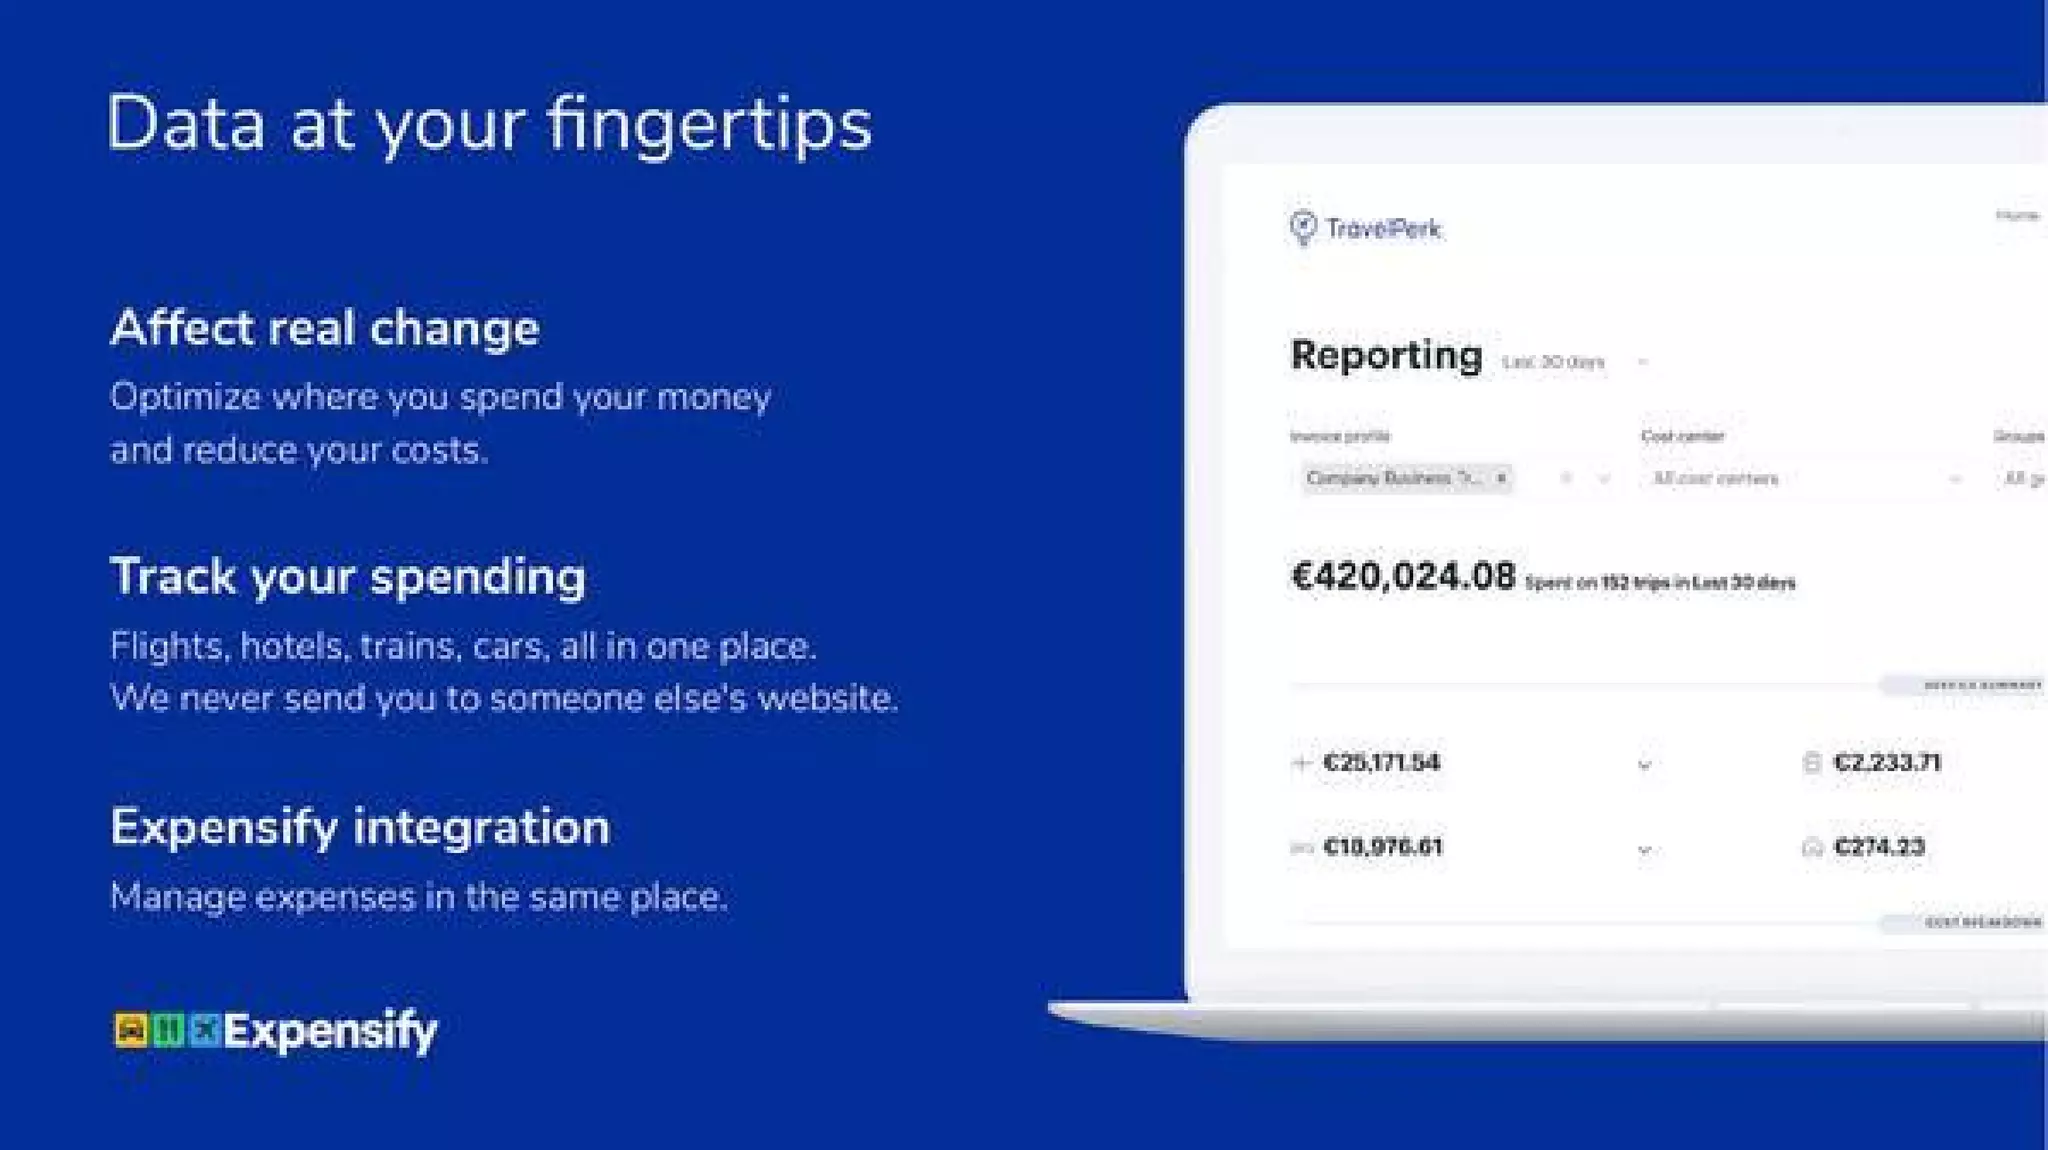
    • Data & reporting, expense integration (slide 11).
    • Recent product innovations (FlexiPerk, TravelCare, OpenAPI, GreenPerk, VATRecovery) shown on slide 12 that extend monetization and product stickiness.

Market Opportunity

TAM / SAM / SOM analysis:

  • The deck does not present explicit TAM / SAM / SOM numbers (no slide shows a dollar TAM estimate). This is a notable omission for investors looking for market sizing.
  • Indirect evidence of market opportunity:
    • Slide 7 (“World’s largest inventory”) implies a broad global travel market by showing major distribution partners (Expedia, Travelport, Airbnb, trainline, Amadeus, Skyscanner, Booking.com).
    • Slide 11 reporting screenshot shows platform spend of €420,024.08 on 152 trips in last 30 days — an example datapoint demonstrating spend per customer and platform transaction volume potential.

Business Model

Revenue model and unit economics (as indicated or implied in the deck):

  • The deck does not present a single, explicit revenue slide with pricing, margins or unit economics.
  • Implied revenue streams:
    • Transaction fees / merchant commissions on flights, hotels, trains and car bookings (standard for travel platforms).
    • Value-add services and feature monetization (FlexiPerk cancellations, GreenPerk offsets, VAT recovery fees, TravelCare service).
    • Enterprise features / premium customer contracts (slide 5 shows “Premium customers” count).
    • Integrations and partnerships (e.g., White-label/OpenAPI) that could carry commercial terms.
  • No LTV / CAC, contribution margin, or average revenue per user metrics are displayed.

Traction & Metrics

Growth metrics and proof points visible in the slides:

  • Slide 5 (timeline) shows product/company milestones and funding rounds (2015 founding; 2016 Series A; 2017 >150 premium customers; later rounds listed through 2019–2021).
    • Slide explicit datapoint: “Over 150 Premium Customers signed” (2017).
    • Timeline shows later funding rounds (2018 Series B $11M; Oct 2018 Series C $40M; 2019 $60M Series C1) — useful as evidence of subsequent investor validation.
  • Slide 11 (Reporting screenshot): €420,024.08 spent on 152 trips in last 30 days — a concrete sample of platform spend/throughput.
  • Partnerships/suppliers: logos on slide 7 (Expedia, Travelport, Airbnb, Amadeus, Skyscanner, Booking.com) signals broad distribution and inventory access, which supports growth potential.
  • No topline revenue, ARR, monthly active customers (beyond the “150 premium customers” datapoint), nor churn/LTV/CAC numbers are shown.

Competitive Positioning

How they differentiate:

  • Product completeness: a single platform combining consumer-grade inventory with corporate controls (slides 6, 7, 10).
  • Integrations & partnerships: large content sources and distribution partners included, plus OpenAPI for embedding TravelPerk capabilities (slides 7, 12).
  • Customer experience & support: 24/7 in-house support, free to customers, with very fast SLAs (slide 9) — positioned as a competitive advantage vs. legacy travel agencies and patchwork tools.
  • Feature differentiation: innovative features (FlexiPerk cancellation flexibility, VAT recovery, GreenPerk carbon offset) that solve real friction points.
  • Messaging contrasts with incumbent corporate travel tools by emphasizing consumer-like UX and broader inventory (slide 7).

Team

Team credentials (as presented):

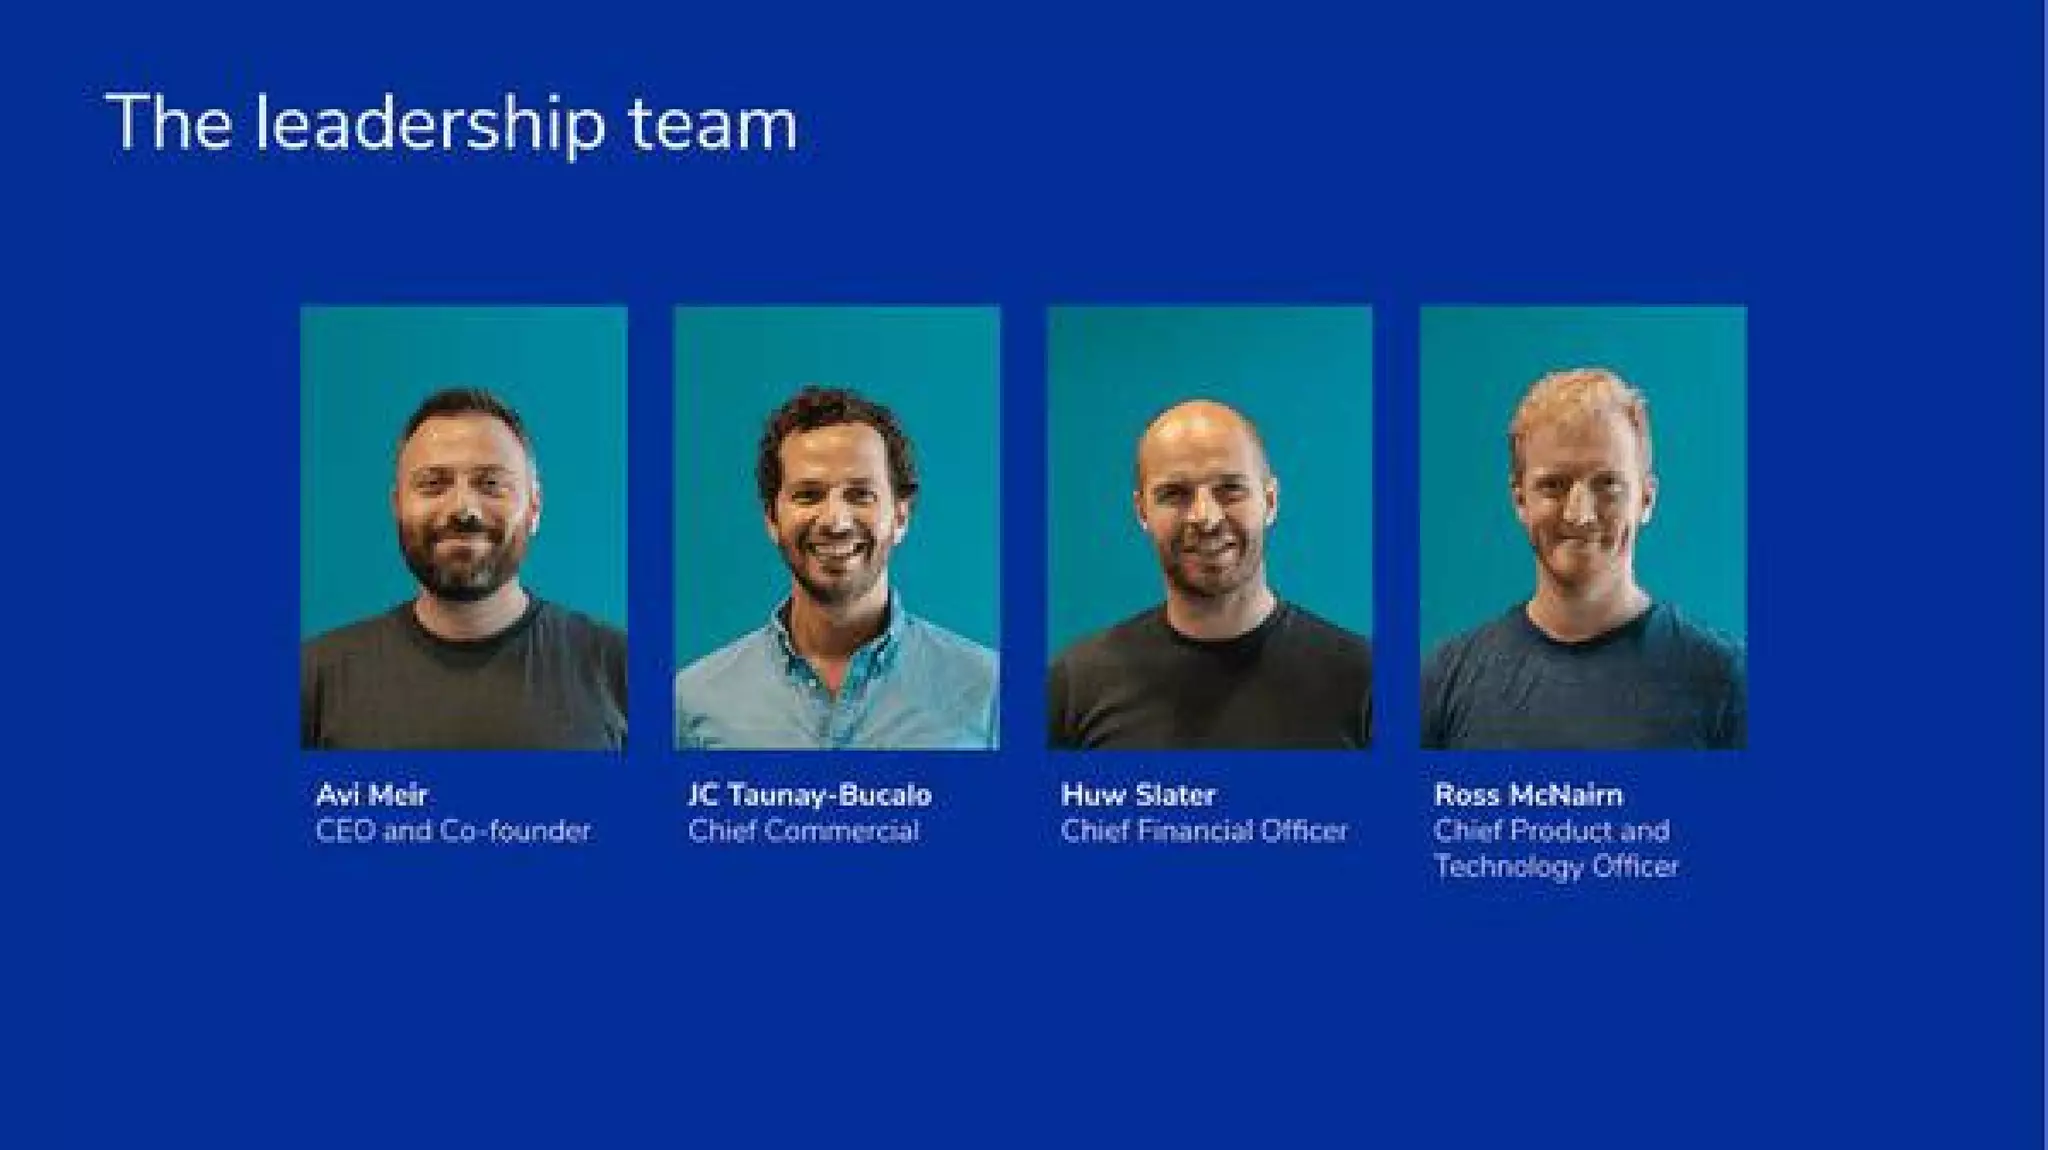
  • The deck presents a leadership team of four executive profiles (slide 13). Roles shown on the slide include:
    • CEO and Co-founder
    • Chief Commercial Officer
    • Chief Financial Officer
    • Chief Product & Technology Officer
  • The slide communicates a small but complete executive team covering product, commercial, finance and tech — appropriate for Series A. (I avoid repeating individuals’ names from the slide in accordance with image/name identification policy.)

Go-to-Market Strategy

Distribution approach (implied / shown):

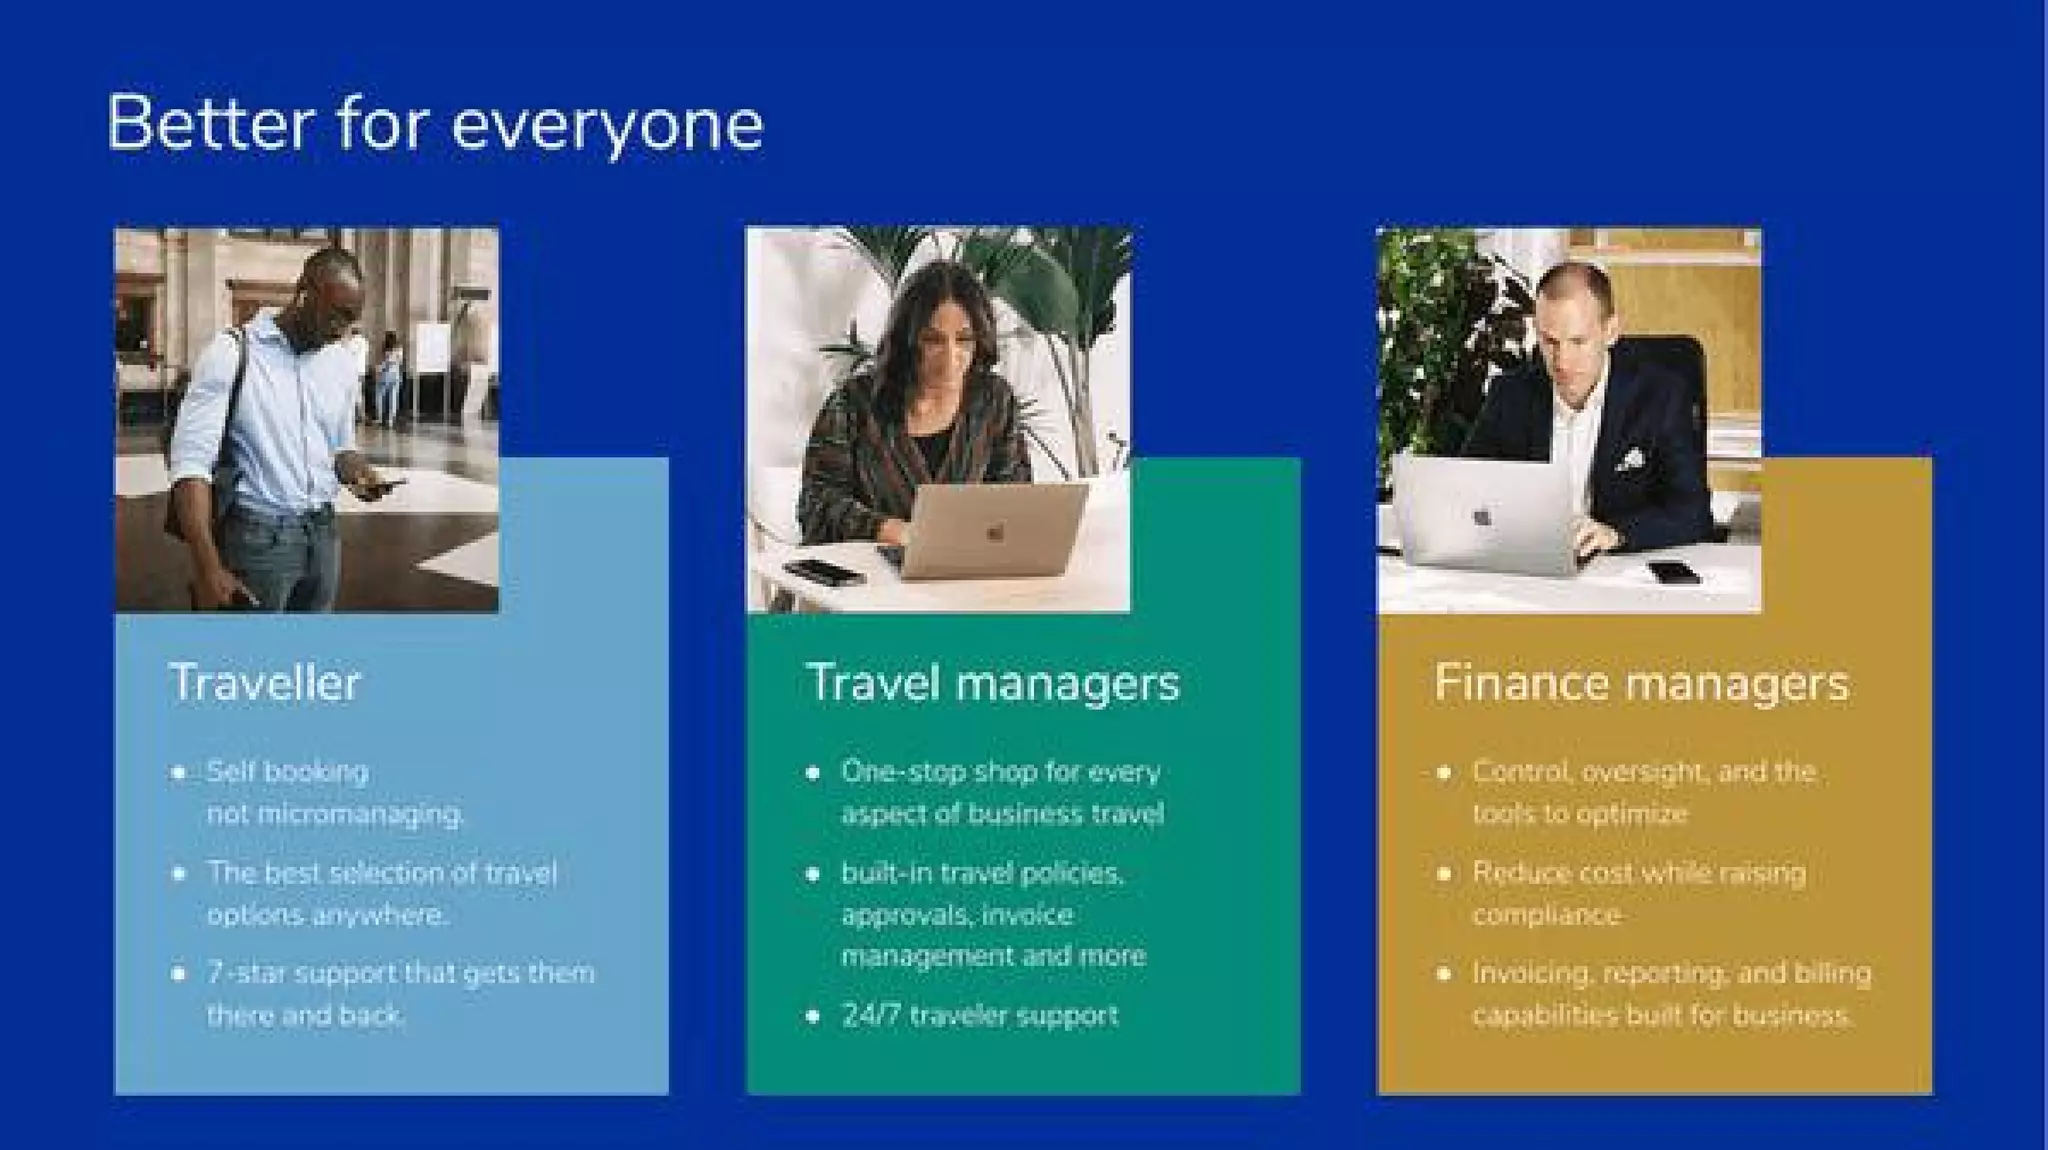
  • Target customer segments explicitly shown (slide 11 / slide 12): travellers (self-booking), travel managers (policy, approvals, invoice management), finance managers (cost control, invoicing).
  • Channels:
    • Direct sales to businesses / premium accounts (timeline shows early premium customer signings).
    • Partnerships and content integrations with major travel inventory suppliers (slide 7).
    • Product-led and self-serve booking (UX screenshots indicate easy booking on web/mobile).
    • Integrations into company workflows via OpenAPI (slide 12) for downstream distribution / embedding.
  • Emphasis on support and post-sale service (24/7 support free) to drive adoption and retention.

The Ask

  • Context provided: raising $1.5M in Series A (2016).
  • Deck itself: Slide 5’s timeline labels a 2016 Series A figure (~$8.5M on the slide). The deck does not show a slide with a clear “use of funds” breakdown or runway projection.
  • Likely uses (not specified in deck): product development (platform, APIs), scaling commercial team, integrations/partnerships, customer support scale-up, and geographic expansion.

Investor Deep Dive

Executive summary, strengths & red flags

Executive Summary

This is a tightly branded, product-focused Series A deck that frames a clear pain (business travel is a nightmare), presents an integrated platform solution (one place to search, book, pay, report), and supports claims with early traction, partner logos and product screenshots. The deck emphasizes product features, customer experience and integrations rather than deep financial detail — a common approach for early-stage marketplace/platform pitches.

Key Strengths

3 identified

1

Clear, empathy-driven problem framing (Slide 3)

2

Product-first pitch with high-quality visuals and real screenshots (Slides 6–11)

3

Strong ecosystem evidence and value-add features (Slides 7, 9, 12)

Red Flags & Weaknesses

3 identified

1

Missing explicit market sizing (TAM/SAM/SOM)

2

Lack of financial and unit-economics detail

3

Inconsistent or unclear fundraising numbers

More Pitch Decks To Study

Compare structure, fundraising context, and investor-facing story across similar startup decks.