Compare your deck to Mixpanel

Compare Your Deck

Mixpanel Pitch Deck (2014)

SaaS
Stage: Series B
Raised: $65M
Year: 2014
Slides: 12
Outcome: Valued at $865M

Pitch Deck

1 / 12
Mixpanel pitch deck - Opening: Strong brand and visual focus
Click to expand

Deck Analysis

This Series B pitch deck from Mixpanel (2014) presents a concise, design-forward case for scaling a product analytics platform. The deck pairs stark, high-contrast slides with clear problem statements, a defensible technology advantage, and traction data (MRR growth and sales KPIs) to persuade investors that Mixpanel had product-market fit and a repeatable go-to-market. What makes it notable is the disciplined focus: the narrative moves quickly from why traditional metrics are broken to Mixpanel's differentiated database and revenue momentum, backed by operational metrics and fundraising history.

Opening: Strong brand and visual focus

Opening: Strong brand and visual focus

Slide 1 is a minimalist title slide that foregrounds the Mixpanel brand with a simple logo on a deep blue background. The lack of clutter and the consistent visual treatment set a professional tone and implicitly communicate confidence and maturity. For investors, a clear, polished cover signals attention to detail — an important trait for analytics companies that sell precision.

The lesson here is not just aesthetics: the opening slide primes the audience for a narrative that is concise and product-centric. Founders should use the cover to set expectations about the style and rigor of the presentation — a messy or overly busy opener undermines credibility before a single data point is shown.

Key Takeaway: Use a clean, on-brand opener to set tone and signal professionalism and focus.

Problem: Vividly framing the decision-making gap

Problem: Vividly framing the decision-making gap

Slide 2 states Problem 1: most people make decisions by guessing or using their gut, and will be either lucky or wrong. This is an effective early move because it defines a universal pain point — poor decision-making — and positions the product as a remedy. The phrasing is evocative and memorable, which helps anchor the rest of the narrative: it's not merely a technical feature request, it's a mission to change behavior.

By stating a broad human problem rather than a niche technical issue, Mixpanel creates empathy and urgency. Founders should emulate this by articulating the emotional or business fallout of the problem they solve (lost revenue, wasted time, wrong bets) before diving into product mechanics. A crisp, human-focused problem makes the solution feel consequential.

Key Takeaway: Start with a clear, human-centered problem statement that communicates why resolving it matters at scale.
Problem (continued): Calling out weak incumbent metrics

Problem (continued): Calling out weak incumbent metrics

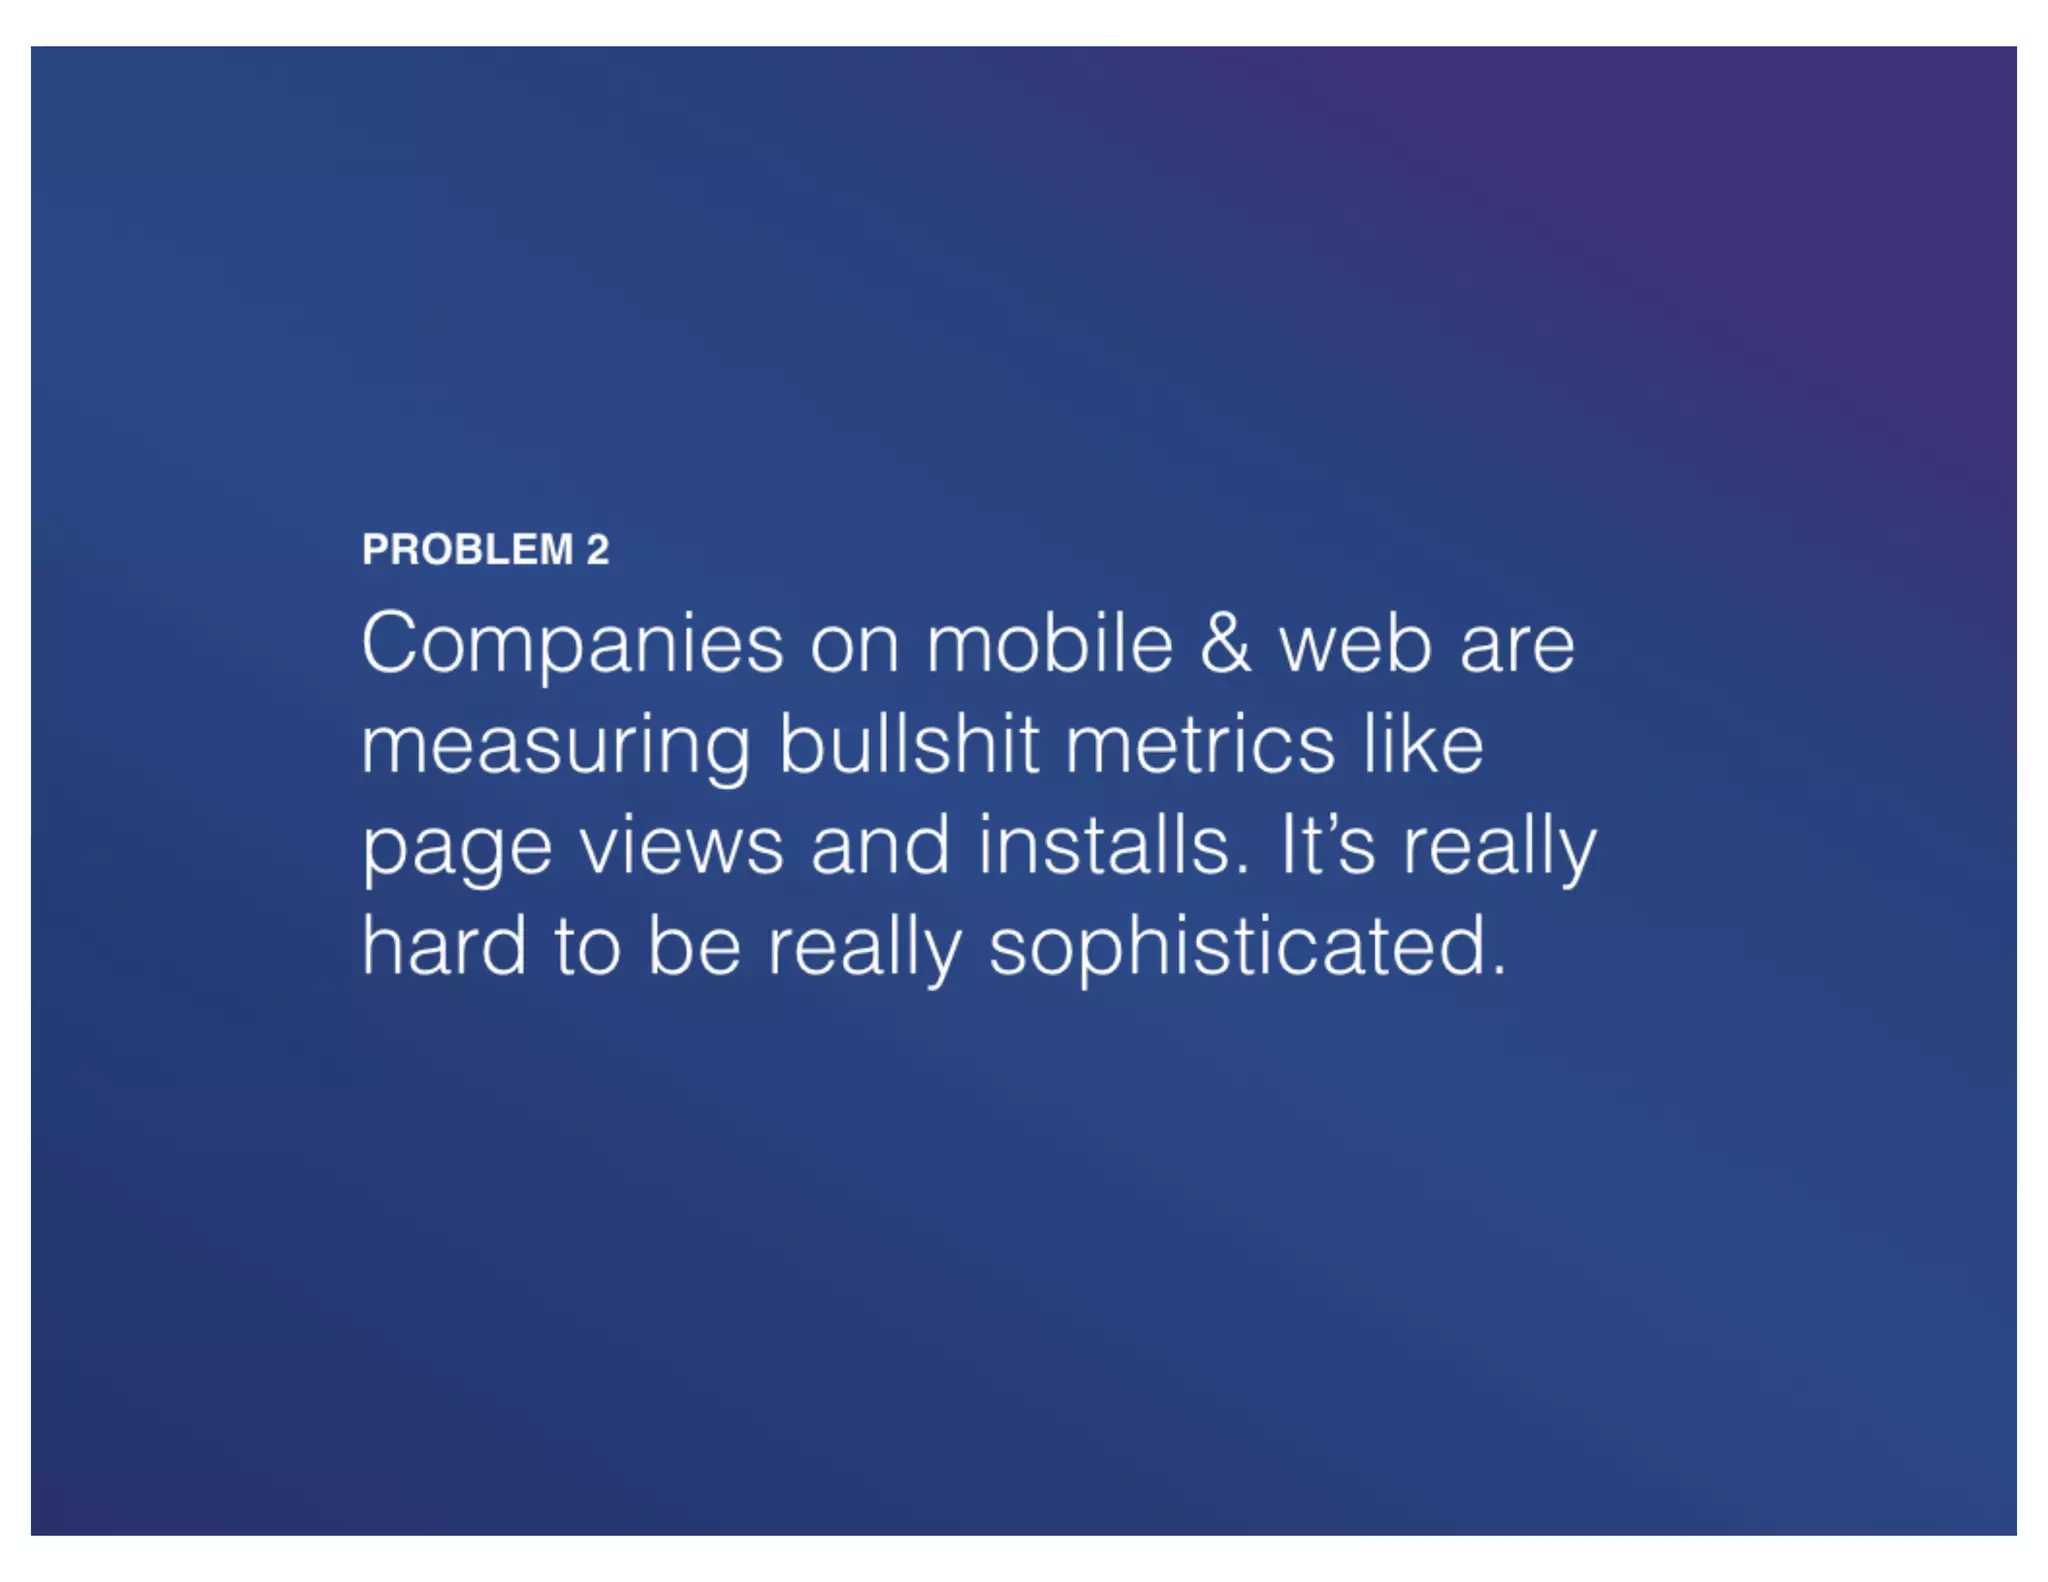
Slide 3 doubles down with Problem 2: companies measure weak metrics (page views, installs) and struggle to be sophisticated. This slide sharpens the competitive landscape by explaining why incumbent metrics are insufficient for modern product teams. It prepares investors to see analytics as a strategic, product-facing capability rather than a vanity tracking tool.

This two-slide problem articulation (human behavior + broken status quo) is pedagogically strong: it moves from abstract pain to specific operational failures. Founders should aim to define both the emotional and the technical dimensions of the problem so investors can connect product design decisions to real market demand.

Key Takeaway: Explain both the human cost and the technical shortcomings of current solutions to make your product’s value obvious.
Solution & Mission: Clear product positioning and ambition

Solution & Mission: Clear product positioning and ambition

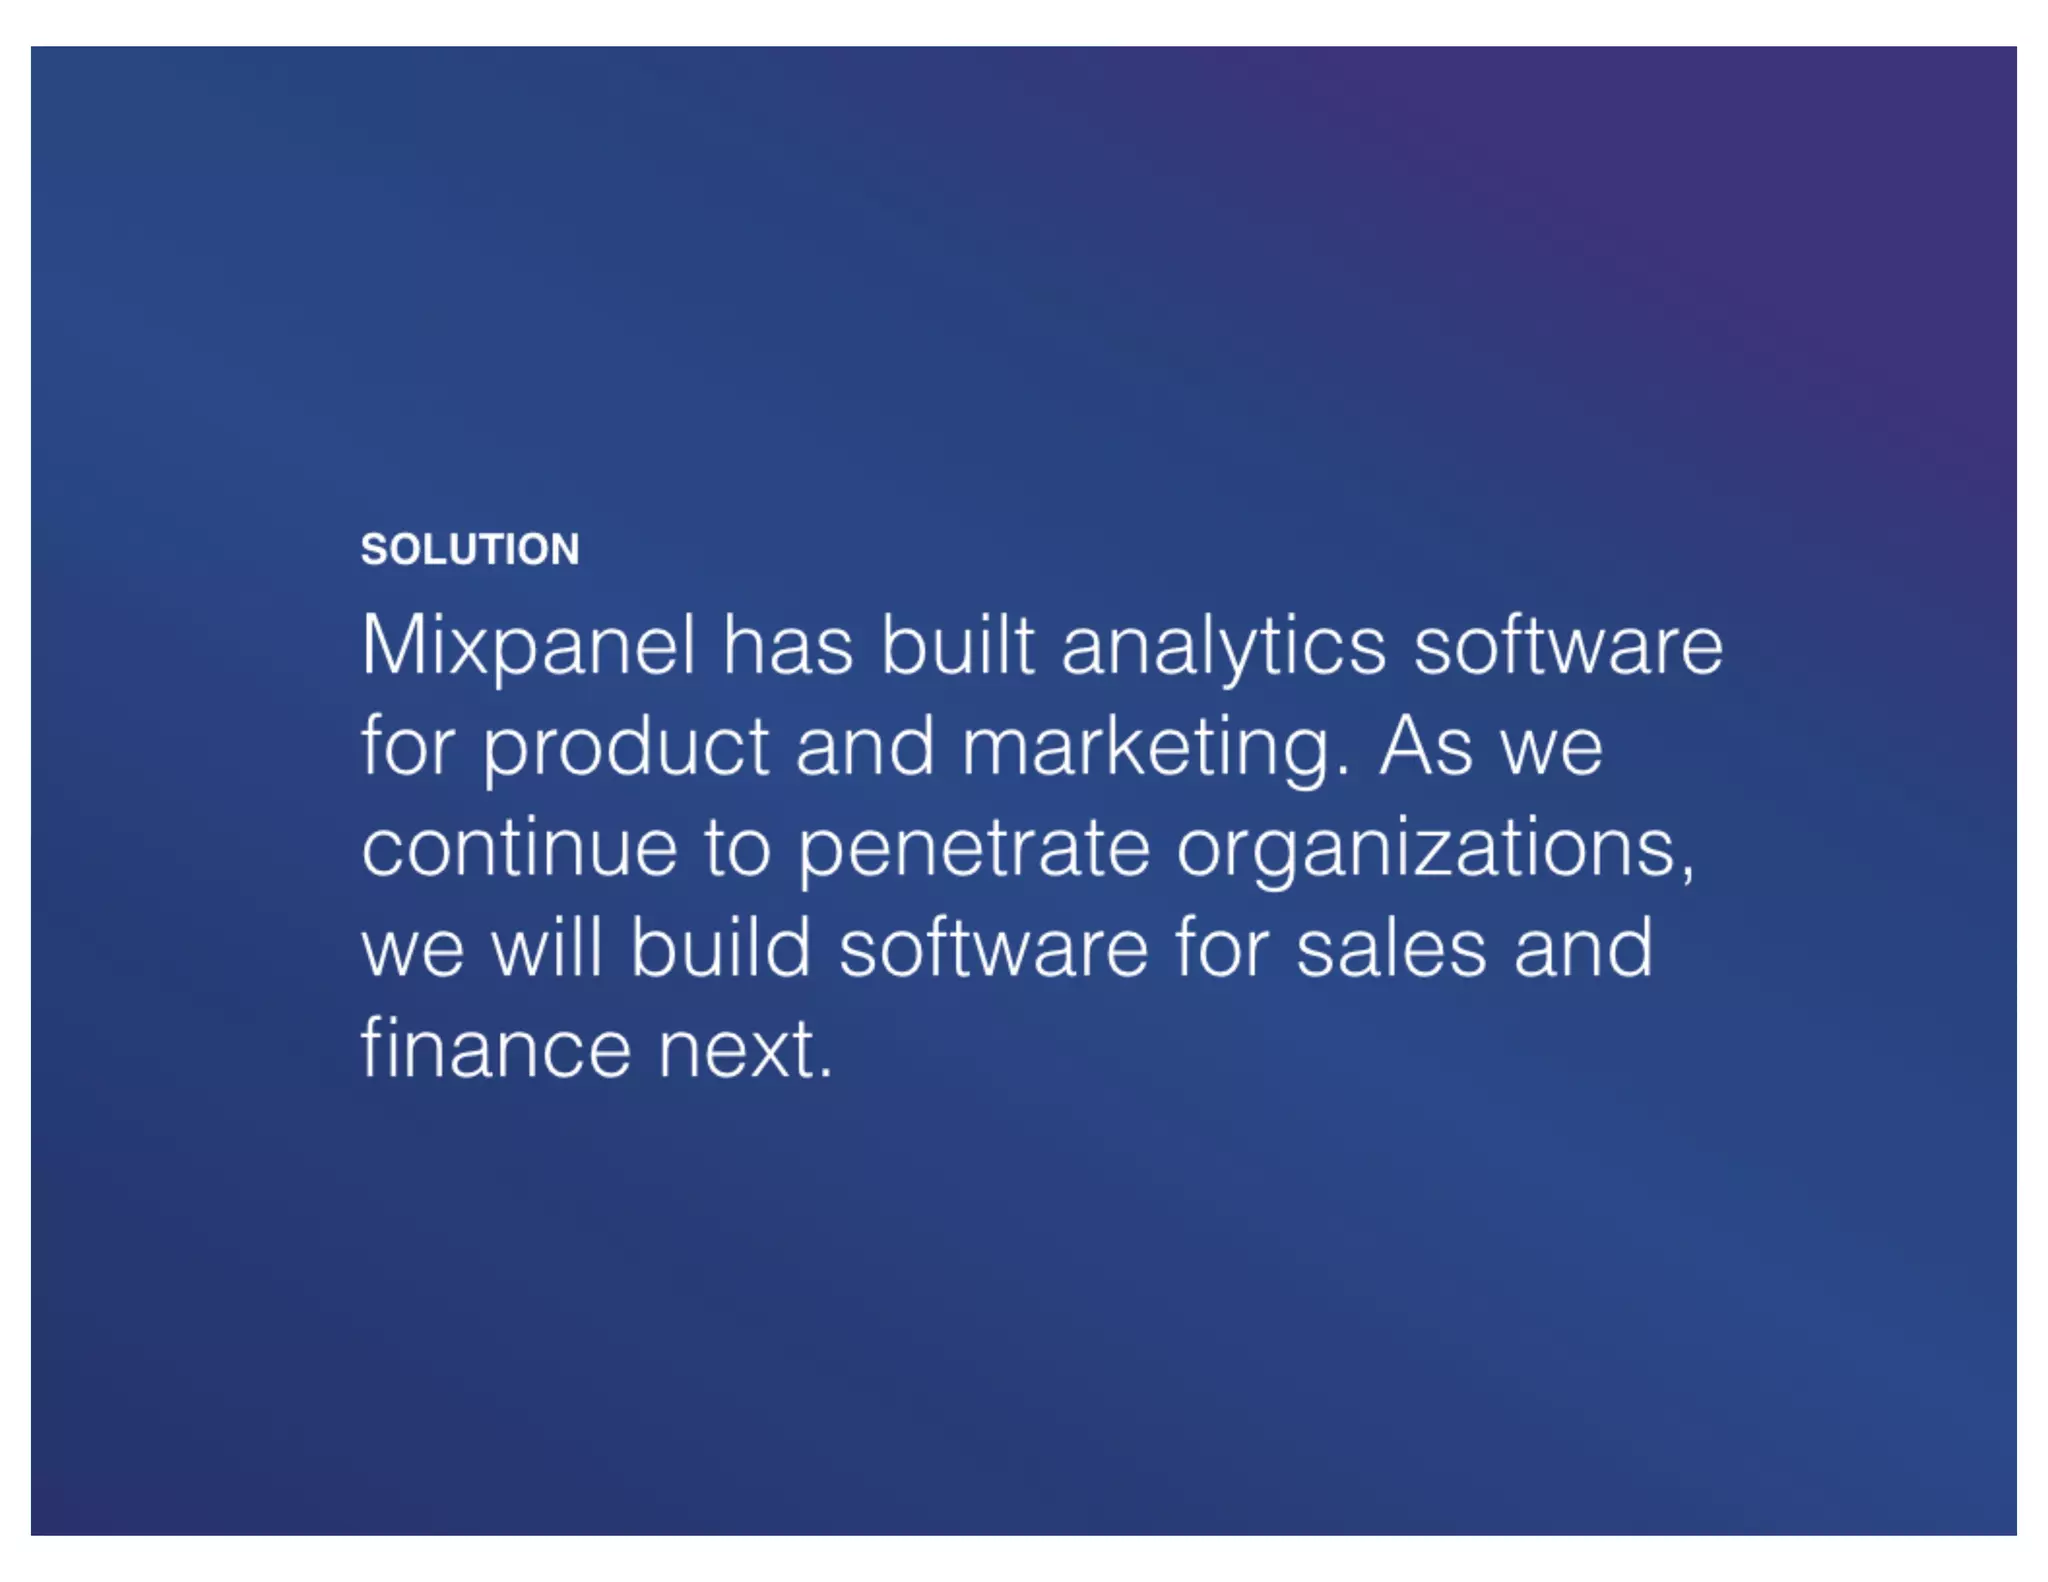
Slide 4 (Solution) and Slide 5 (Mission) together position Mixpanel as analytics built for product and marketing, with a mission to help the world learn from its data. The solution slide is explicit about current focus (product and marketing) and intelligent about roadmap (sales and finance next), showing thoughtful expansion without overpromising. The mission slide succinctly elevates the company beyond a product to a broader purpose, which helps with storytelling and talent/partner attraction.

This structure — specific immediate value plus an aspirational mission — balances realism and ambition. Founders should state the current product boundary clearly and sketch the next markets in a way that suggests scalability. Combining a tactical solution slide with a one-line mission helps investors see both near-term monetization and long-term vision.

Key Takeaway: Pair a concrete product focus and go-to-market plan with a one-line mission that signals long-term ambition.
Traction: Monthly recurring revenue growth chart

Traction: Monthly recurring revenue growth chart

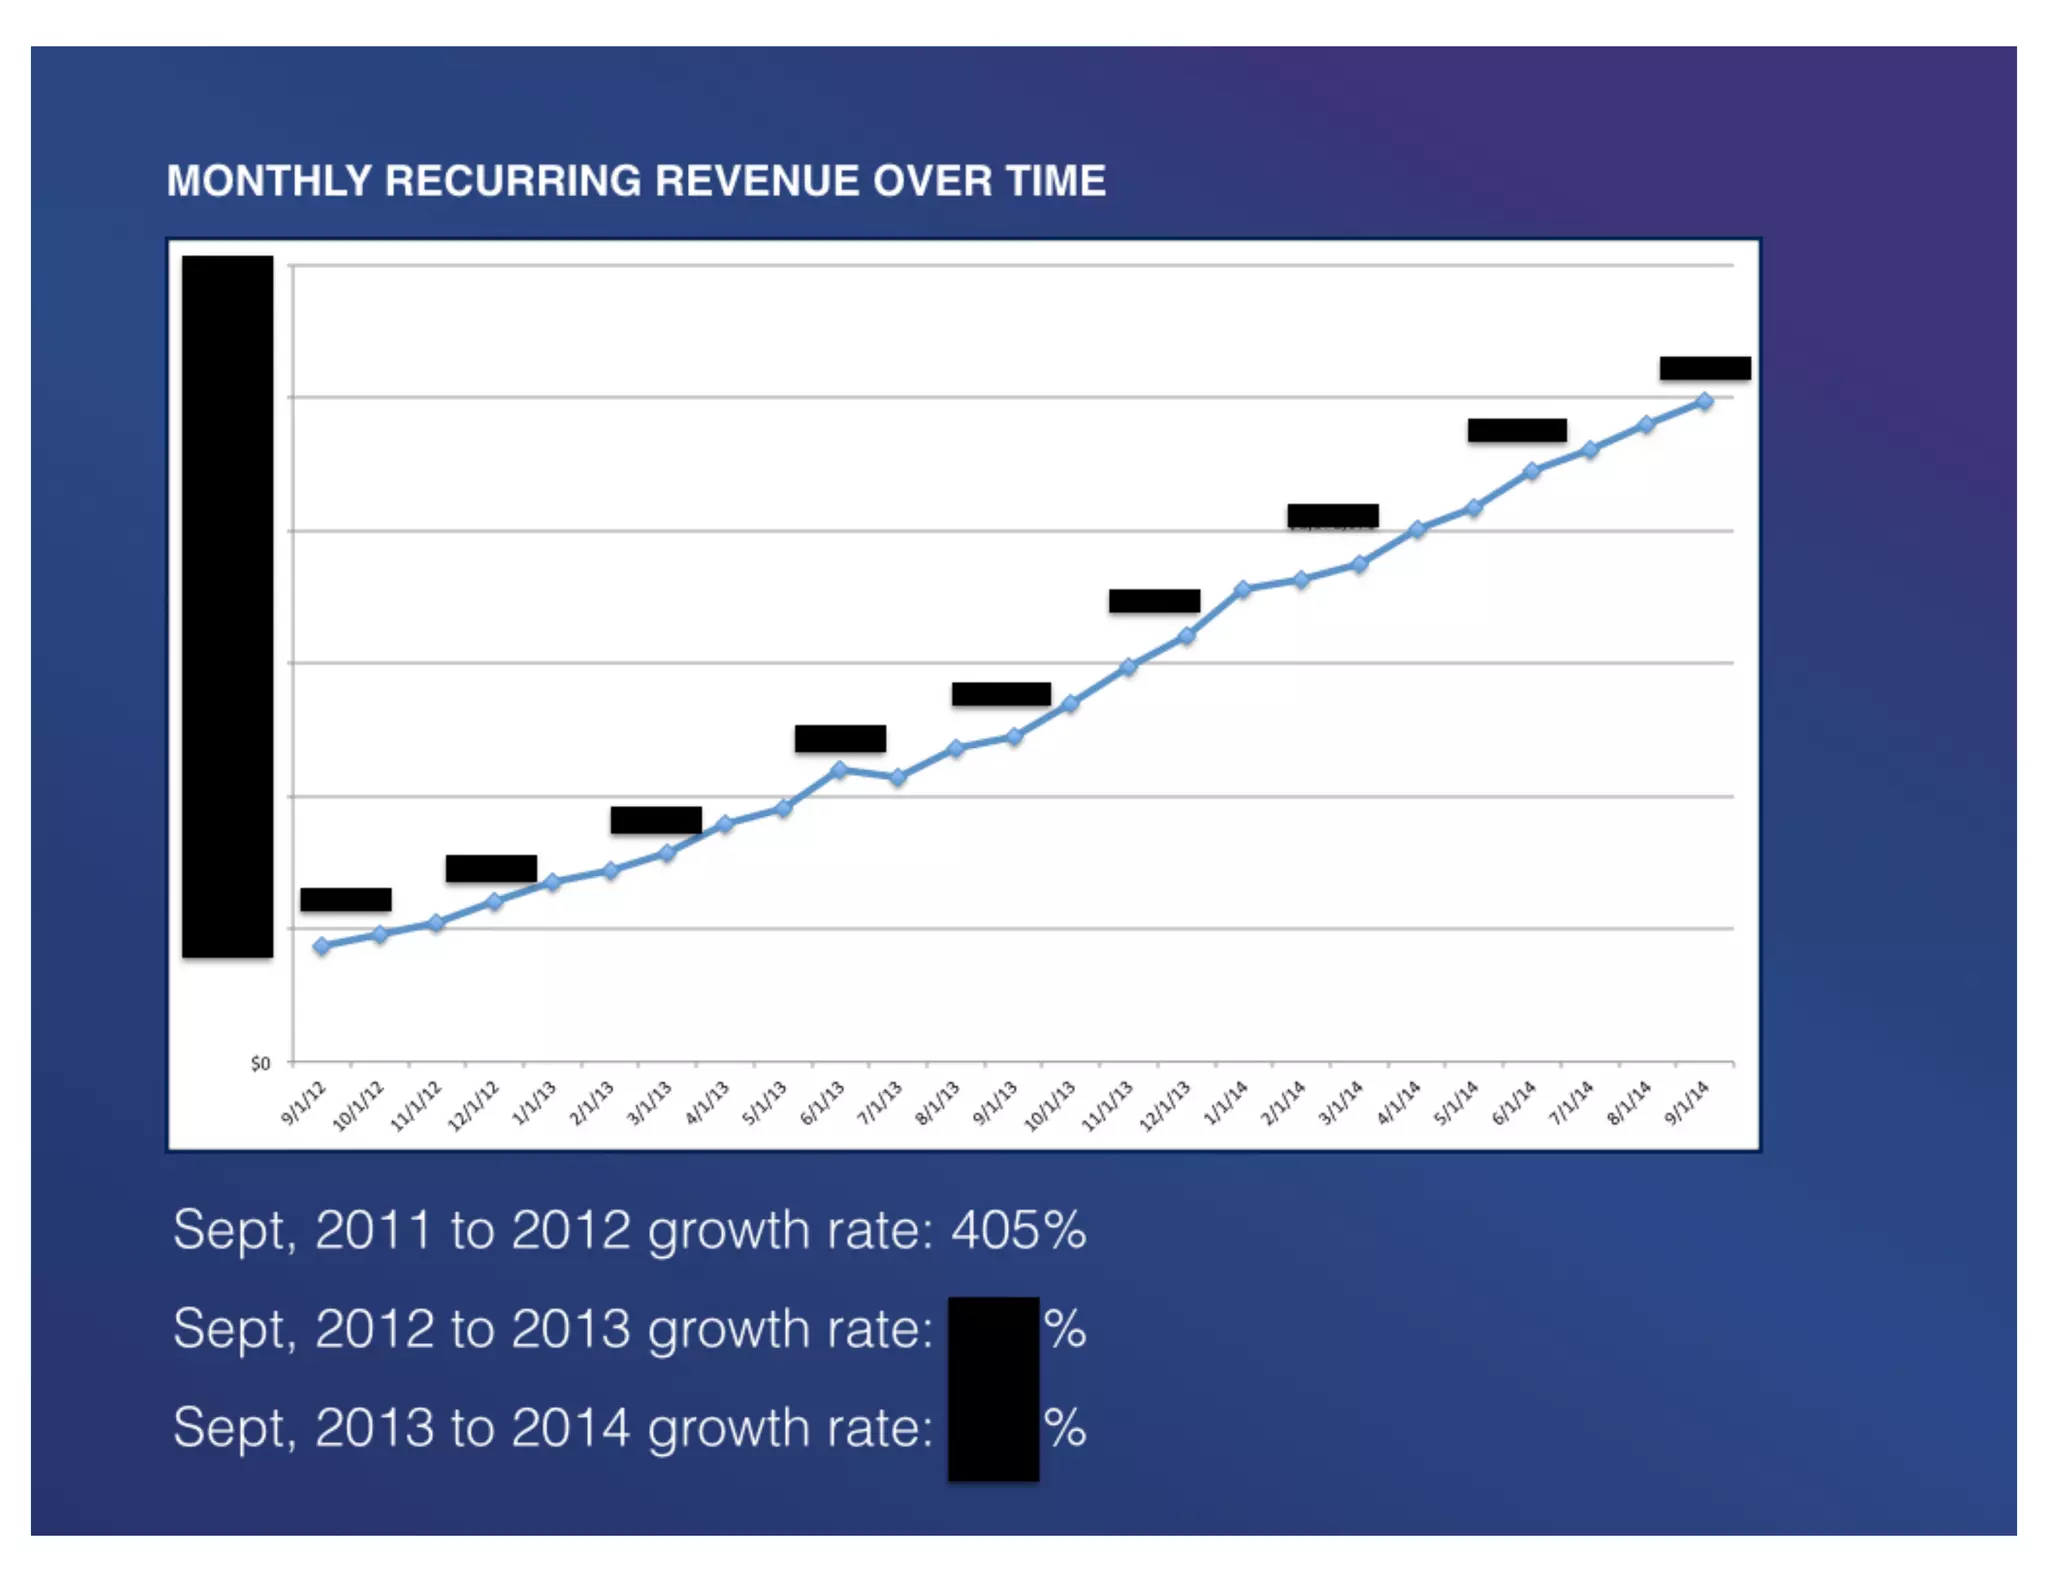
Slide 7 presents an MRR chart showing steady, steep growth from 2012 to 2014 and lists year-over-year growth rates (one shown: 405% from Sept 2011 to 2012). The visual of a rising line combined with explicit growth percentages is highly persuasive: it quantifies momentum and demonstrates that demand translates into revenue. The chart’s timeline and annotations indicate consistent progress rather than a single spike, which reduces investor concern about one-off wins.

This slide is a classic example of letting metrics tell the story: clean visuals + a few highlighted growth figures make traction indisputable. Founders should prioritize credible, chart-based evidence of user and revenue growth in early slides — graphs are often more convincing than long lists of customers because they show repeatability and scale.

Key Takeaway: Present clear, time-based revenue charts and a few key growth rates to prove sustained traction and repeatability.
GT Maturity: Sales KPIs and go-to-market metrics

GT Maturity: Sales KPIs and go-to-market metrics

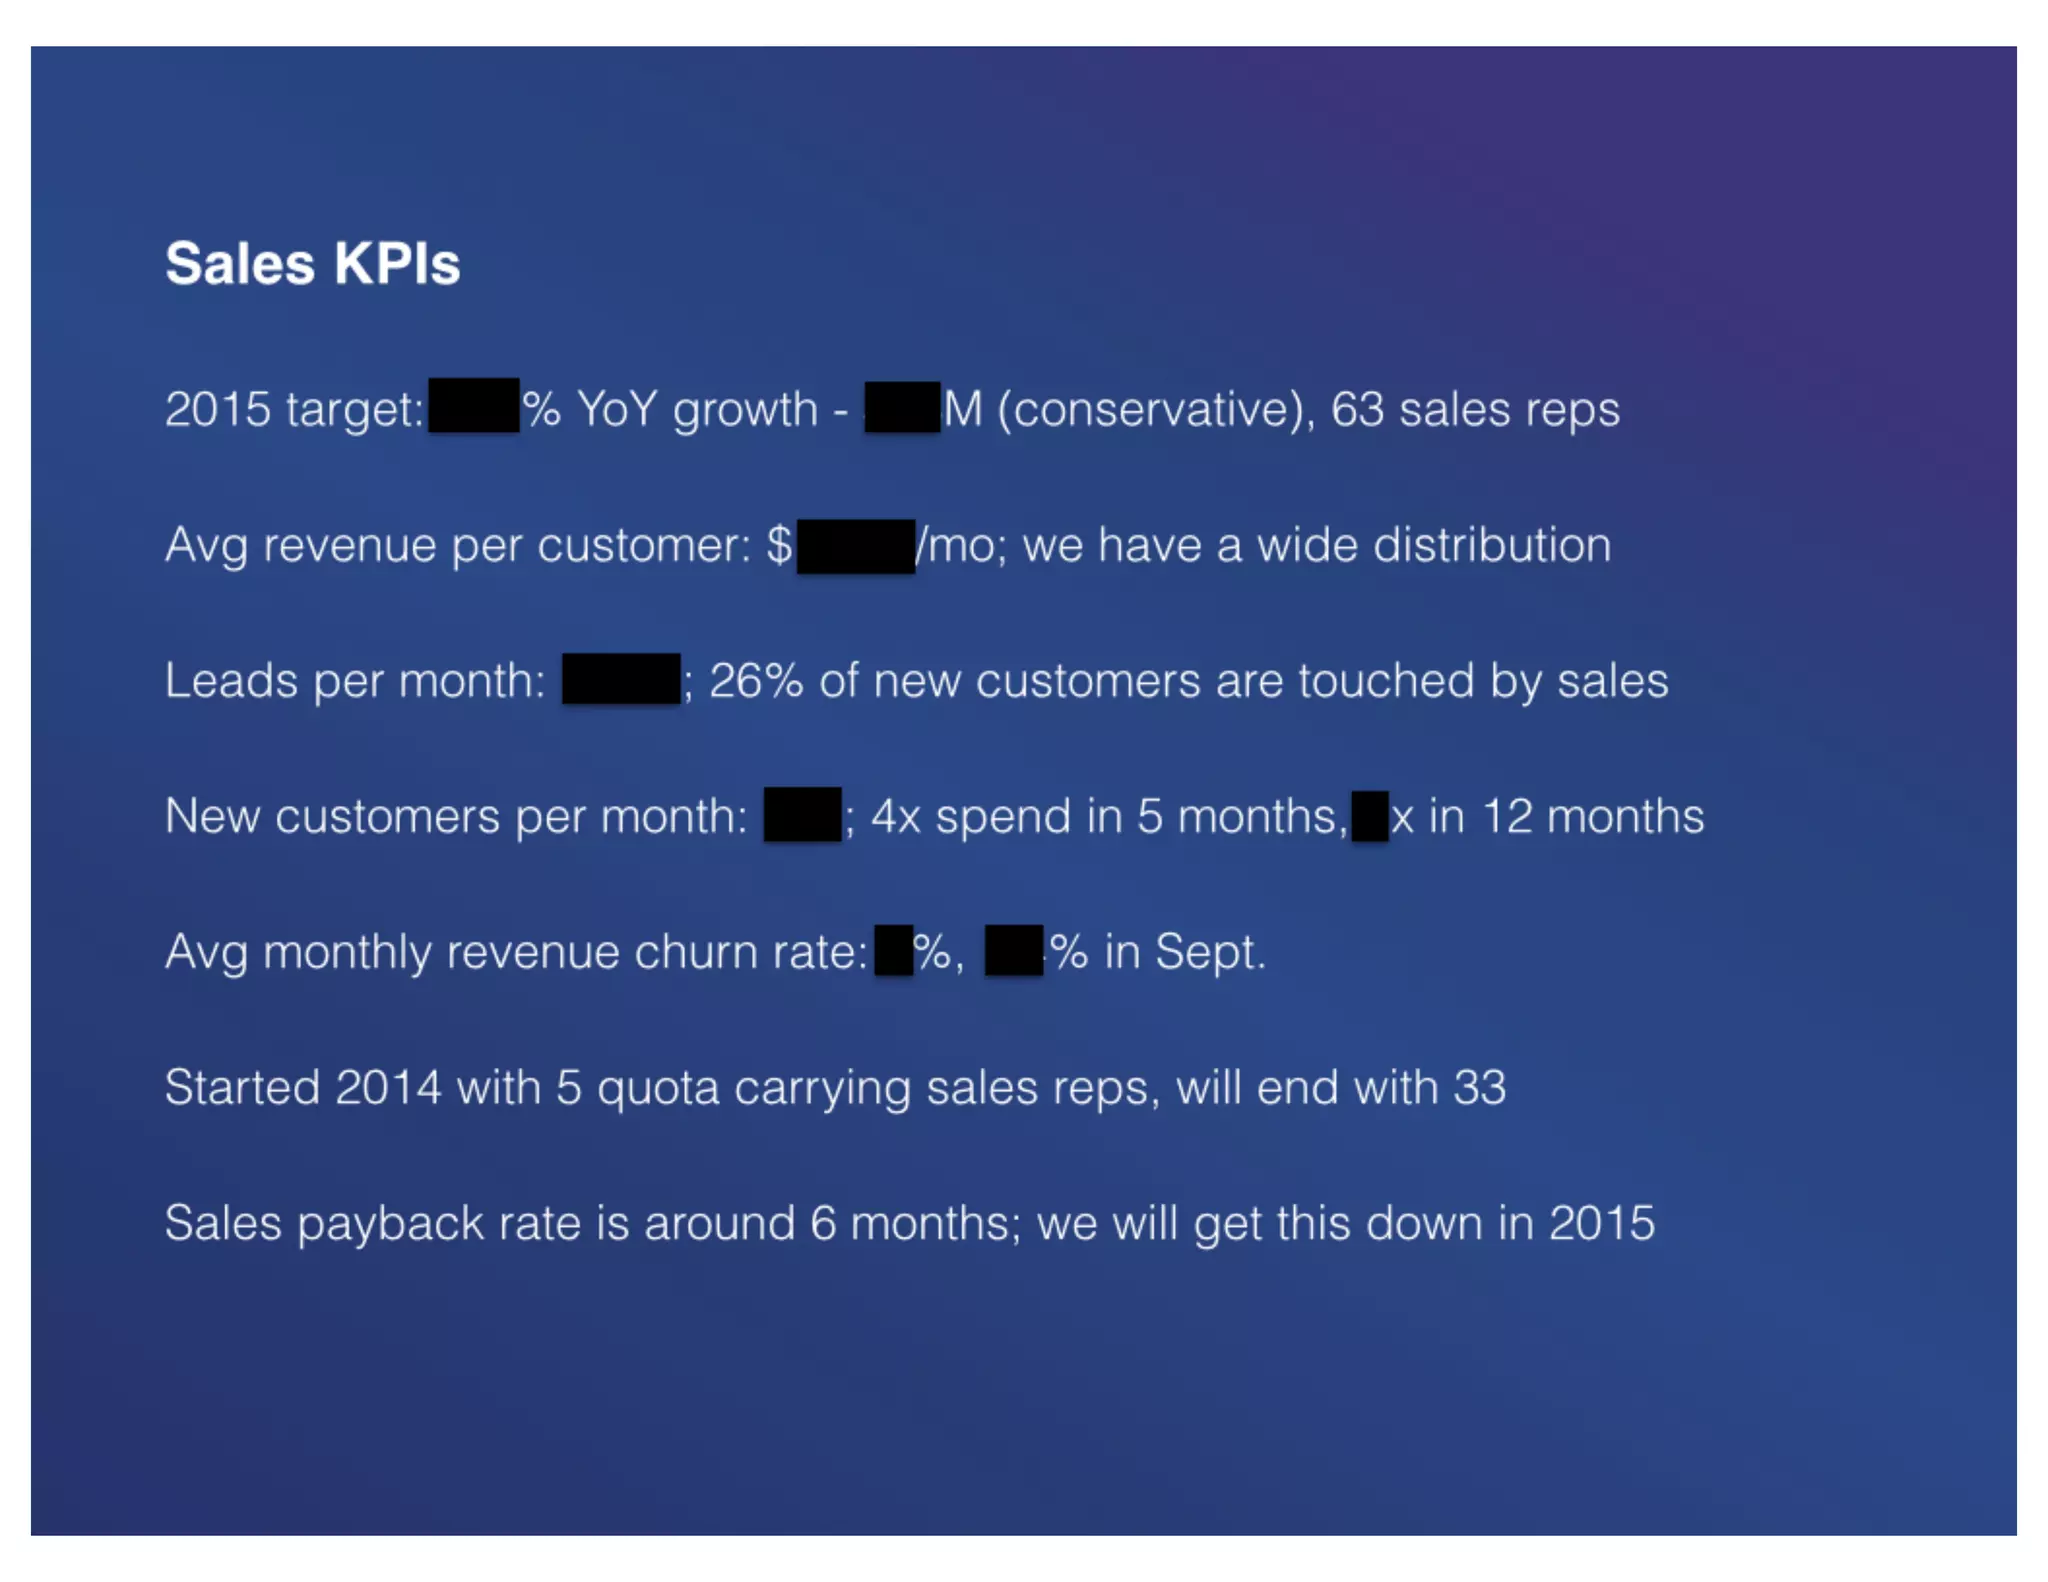
Slide 9 (Sales KPIs) provides granular operational metrics: targets, average revenue per customer, leads and new customers per month, churn rates, and sales headcount evolution. This level of detail signals that Mixpanel has moved beyond product-market fit into a metrics-driven commercial operation. Including payback period and hiring plans shows unit-economics awareness and an actionable plan for scaling the sales organization.

For investors, these are the slides that move the conversation from product to business — demonstrating CAC, churn, sales productivity, and scalability. Founders raising growth rounds should mirror this: show the engine driving current revenue, efficiency levers, and how incremental investment will change the math (e.g., shorter payback, higher ARPU). Operational transparency builds confidence.

Key Takeaway: Include concrete GTM metrics (ARPU, churn, payback, lead flow, hiring plans) to demonstrate you understand how to scale revenue efficiently.
Financing & credibility: Funding history and investor roster

Financing & credibility: Funding history and investor roster

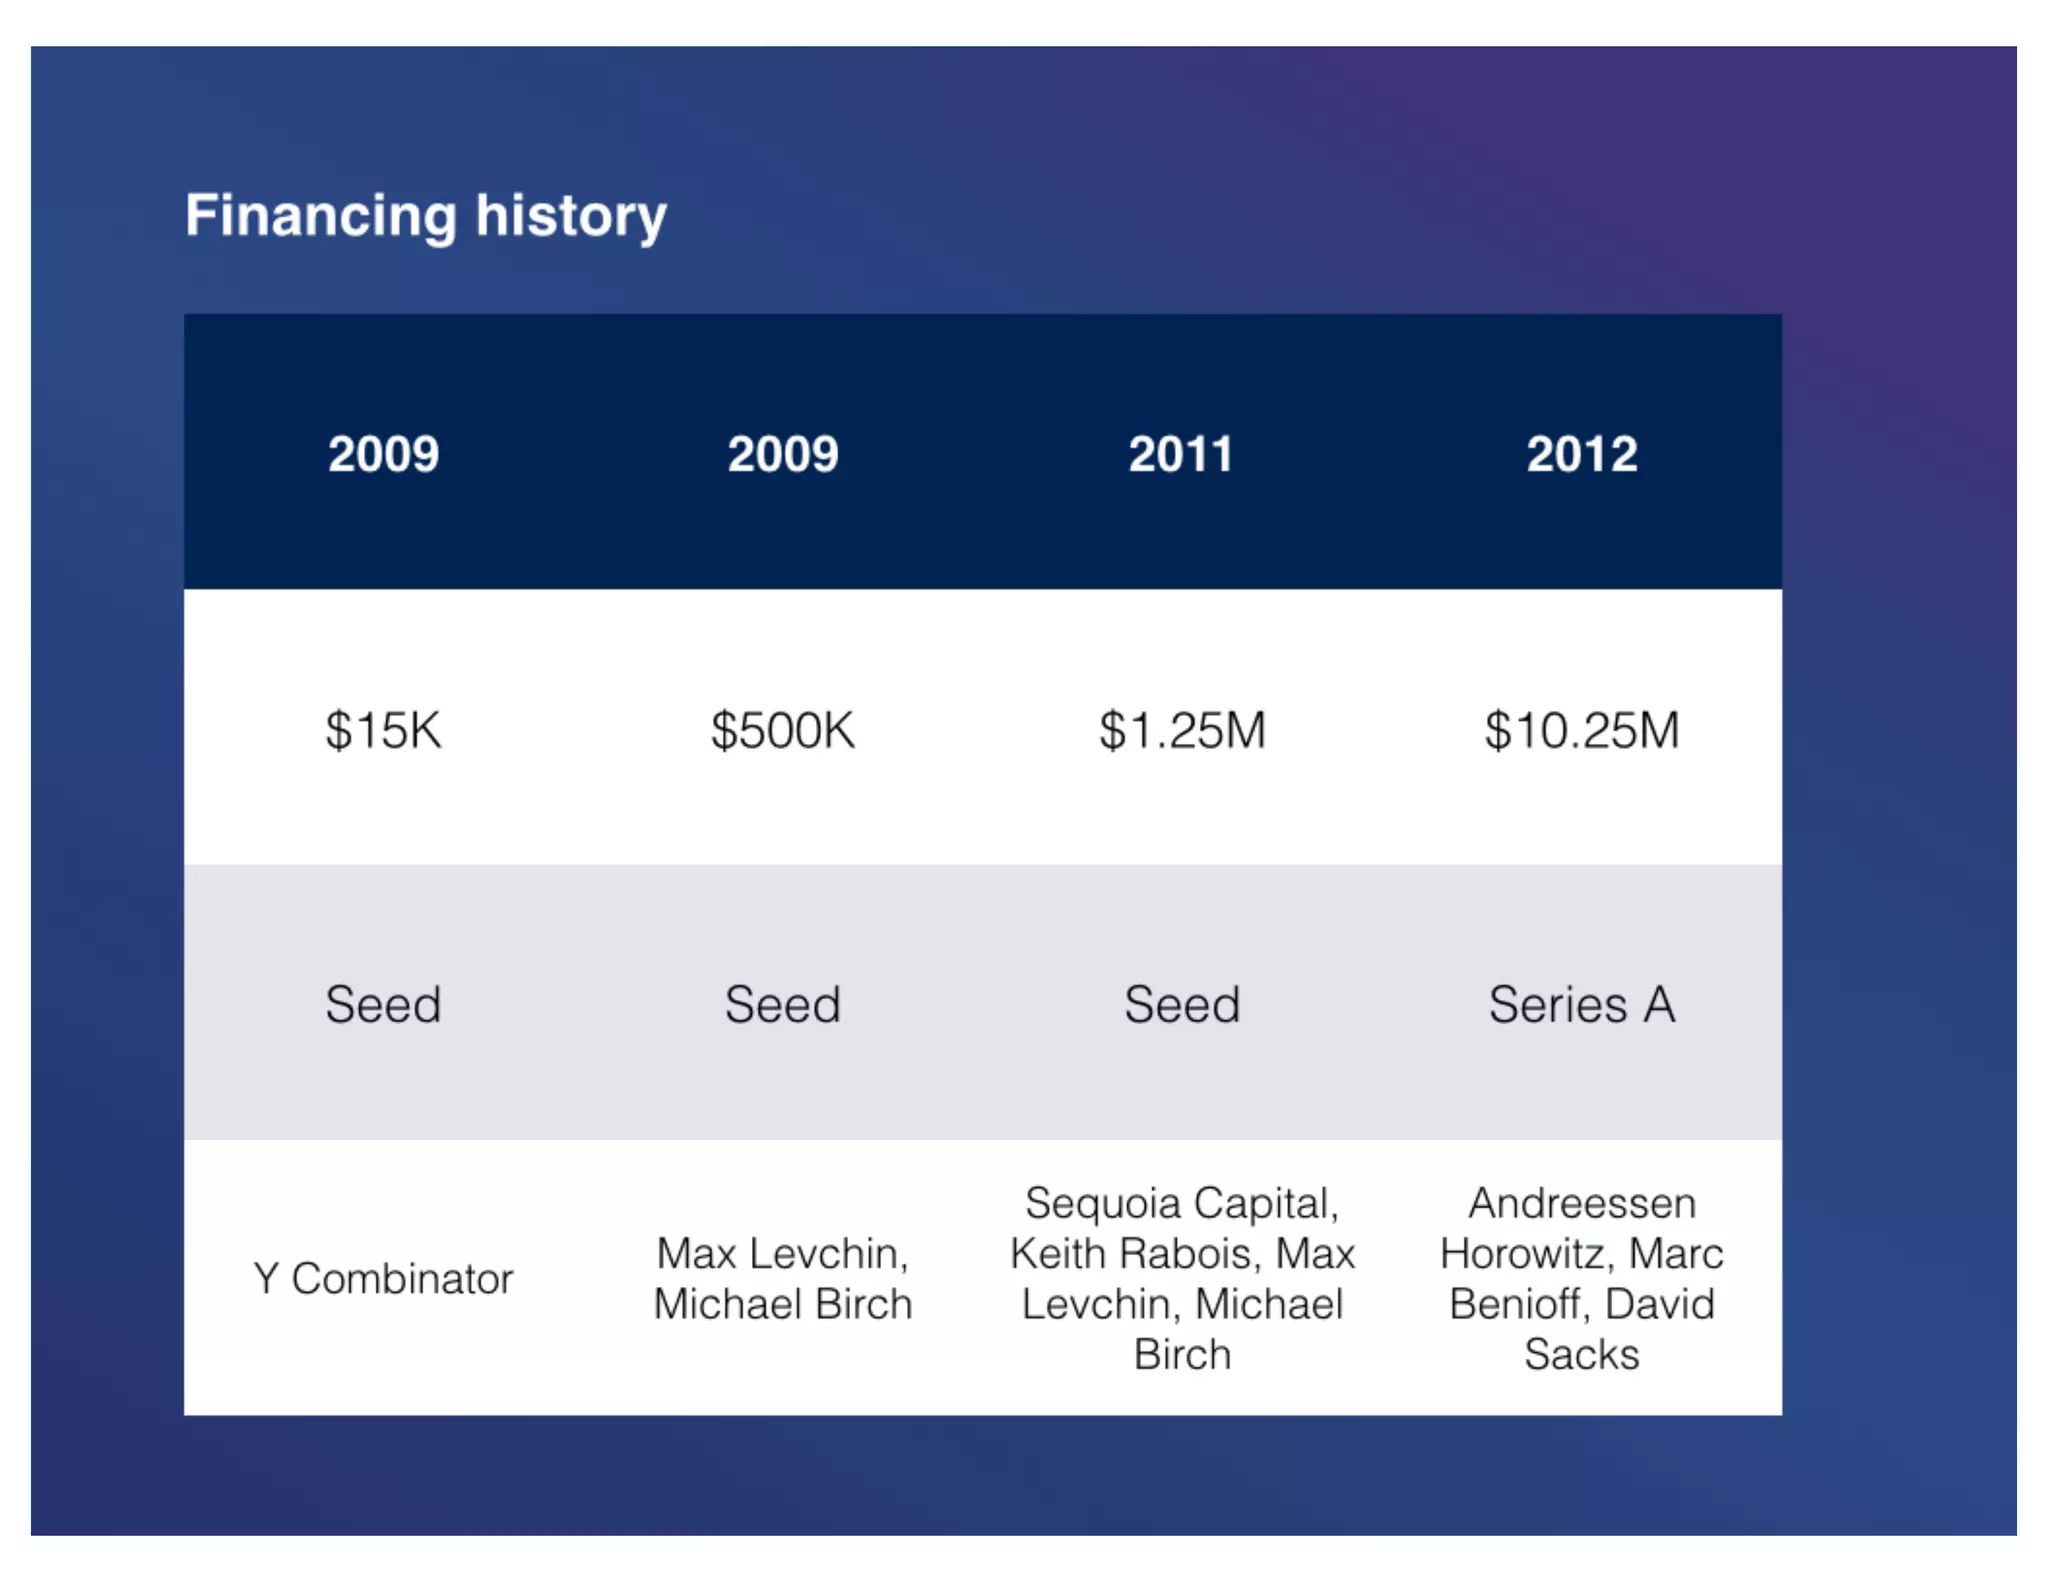
Slide 12 summarizes Mixpanel’s financing history (seed rounds and a Series A) and highlights notable backers including Y Combinator, Sequoia, and Andreessen Horowitz, with amounts from $15K up to $10.25M. This slide serves two purposes: it shows capital sufficiency to date and, importantly, social proof through respected investors. A well-known investor list reduces perceived risk and signals validation by experienced firms.

Including precise fundraising history helps investors contextualize the ask and the company’s runway progression. Founders should clearly document prior capital, lead investors, and how prior rounds were deployed — but avoid overloading the slide with minutiae. The combination of dollar amounts, round types, and credible names is efficient and persuasive.

Key Takeaway: Present a concise financing timeline with amounts and reputable investors to show validation and capital strategy clarity.

Conclusion: Key Lessons

Mixpanel’s Series B deck succeeds by combining a sharp problem narrative, a focused product/missions statement, clear traction visuals, and operational sales metrics — all wrapped in consistent, high-quality design. The deck moves quickly from why the market needs a better analytics solution to how Mixpanel has built defensible technology and is scaling revenue. For founders, the actionable takeaways are: (1) frame the problem in human and technical terms, (2) show repeatable revenue with simple charts and a few growth rates, (3) present GTM metrics that prove unit economics and scalability, and (4) use a clean visual identity to project professionalism.

When building your own deck, prioritize clarity over quantity: pick the handful of slides that prove market need, product differentiation, traction, and the plan to scale. Use concise language, one strong graph for momentum, and operational KPIs that tie spending to revenue outcomes. That combination persuades investors that you understand both the product and the business of scaling it.

Full Deck Analysis

11 sections

Overview

Company: Mixpanel
Round: Series B ($65M)
Year: 2014
Outcome: Valued at $865M
Status: Successfully raised capital; company later achieved $865M valuation (13.3x the Series B round)


Executive Summary

Mixpanel’s Series B pitch deck is a masterclass in data-driven storytelling for a high-growth SaaS company. The deck articulates a clear problem (companies making decisions without sophisticated analytics), positions a differentiated solution (event-based analytics database built in 2010), and backs claims with exceptional traction metrics (405% YoY MRR growth). The presentation balances aspirational vision (“Help the world learn from its data”) with operational rigor (detailed KPIs, hiring plans, geographic expansion roadmap), making a compelling case for why Mixpanel deserves $65M to scale from a product-led startup into an enterprise analytics leader.


Problem Statement

Slides 2-3: Two-Part Problem Narrative

The deck establishes two interconnected problems:

  1. Problem 1 (Slide 2): Lack of Data-Driven Decision Making
    • “Most of the world will make decisions by either guessing or using their gut. They will be either lucky or wrong.”
    • Approach: Broad, emotional appeal to the universal pain of uncertainty
    • Weakness: Lacks quantification; feels somewhat hyperbolic
  2. Problem 2 (Slide 3): Vanity Metrics in Mobile & Web
    • “Companies on mobile & web are measuring bullshit metrics like page views and installs. It’s really hard to be really sophisticated.”
    • Approach: Specific to target market; uses provocative language (“bullshit”) to establish credibility through candor
    • Strength: Directly addresses the addressable market (mobile/web companies) and the specific inadequacy of existing tools
    • Weakness: Dismissive tone may alienate companies currently using these metrics

Problem Validation: The deck does not provide quantitative evidence (e.g., “80% of companies lack real-time analytics”) to substantiate these claims. This is a notable gap for a Series B deck, where investors expect market research or customer validation.


Solution

Slide 4: Solution Statement

“Mixpanel has built analytics software for product and marketing. As we continue to penetrate organizations, we will build software for sales and finance next.”

Key Positioning Elements:

  • Current Focus: Product and marketing teams (the early adopter segment)
  • Future Expansion: Sales and finance (TAM expansion narrative)
  • Implicit Differentiation: Ability to answer questions that “existing technology could not answer” (Slide 6)

Slide 6: Competitive Advantage

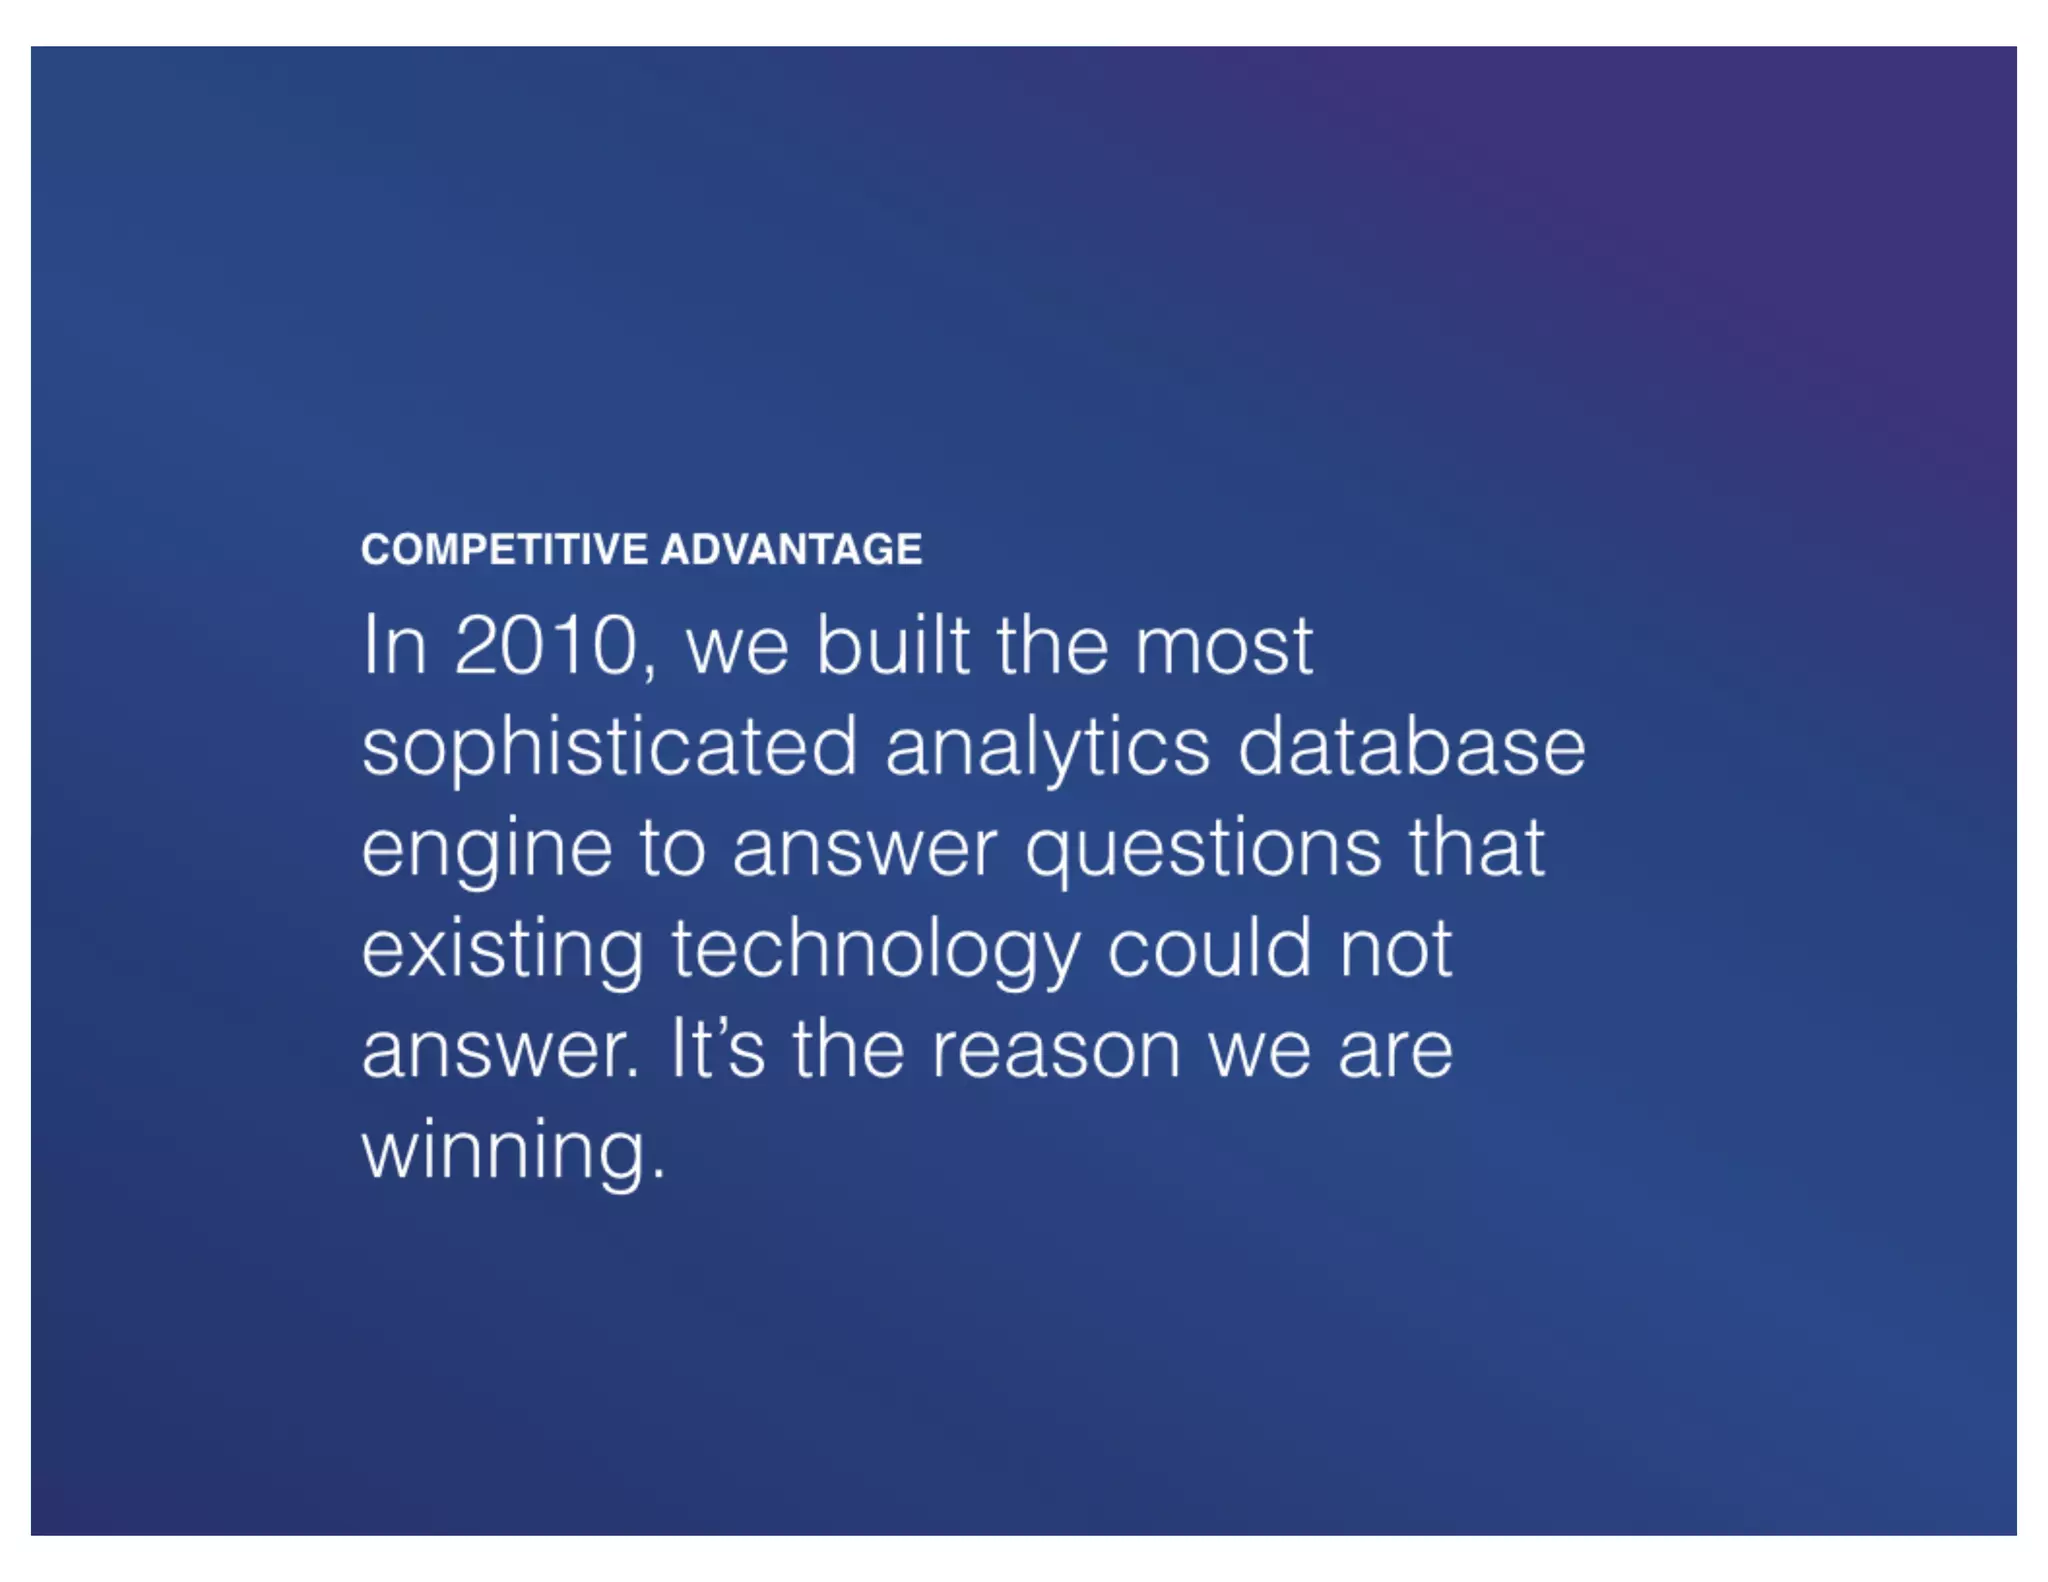
“In 2010, we built the most sophisticated analytics database engine to answer questions that existing technology could not answer. It’s the reason we are winning.”

Strengths:

  • Establishes early-mover advantage (4+ years of development by 2014)
  • References proprietary technology (database engine) as moat
  • Confident assertion of market leadership (“reason we are winning”)

Weaknesses:

  • Lacks technical specificity on what makes the database “sophisticated”
  • No explanation of event-based analytics vs. traditional analytics
  • “Winning” claim is unsubstantiated at this point in the deck (though validated by Slide 7)

Slide 5: Mission Statement

“Help the world learn from its data.”

  • Aspirational and memorable, but generic (could apply to any analytics company)
  • Serves as values/culture statement rather than differentiator

Market Opportunity

TAM/SAM/SOM Analysis:

The deck does not provide explicit TAM, SAM, or SOM analysis. This is a significant omission for a Series B pitch, where investors typically expect:

  • Total addressable market size (e.g., “Global analytics software market: $X billion”)
  • Serviceable addressable market (e.g., “Mobile & web analytics: $Y billion”)
  • Serviceable obtainable market (e.g., “Mixpanel’s 5-year target: $Z million”)

Implicit Market Signals:

  1. Geographic Expansion (Slide 10): Plans to expand into NY (2015) and international (2016) suggest belief in large, underserved markets
  2. Vertical Expansion (Slide 4): Current focus on product/marketing; future expansion to sales/finance implies TAM expansion within existing customer base
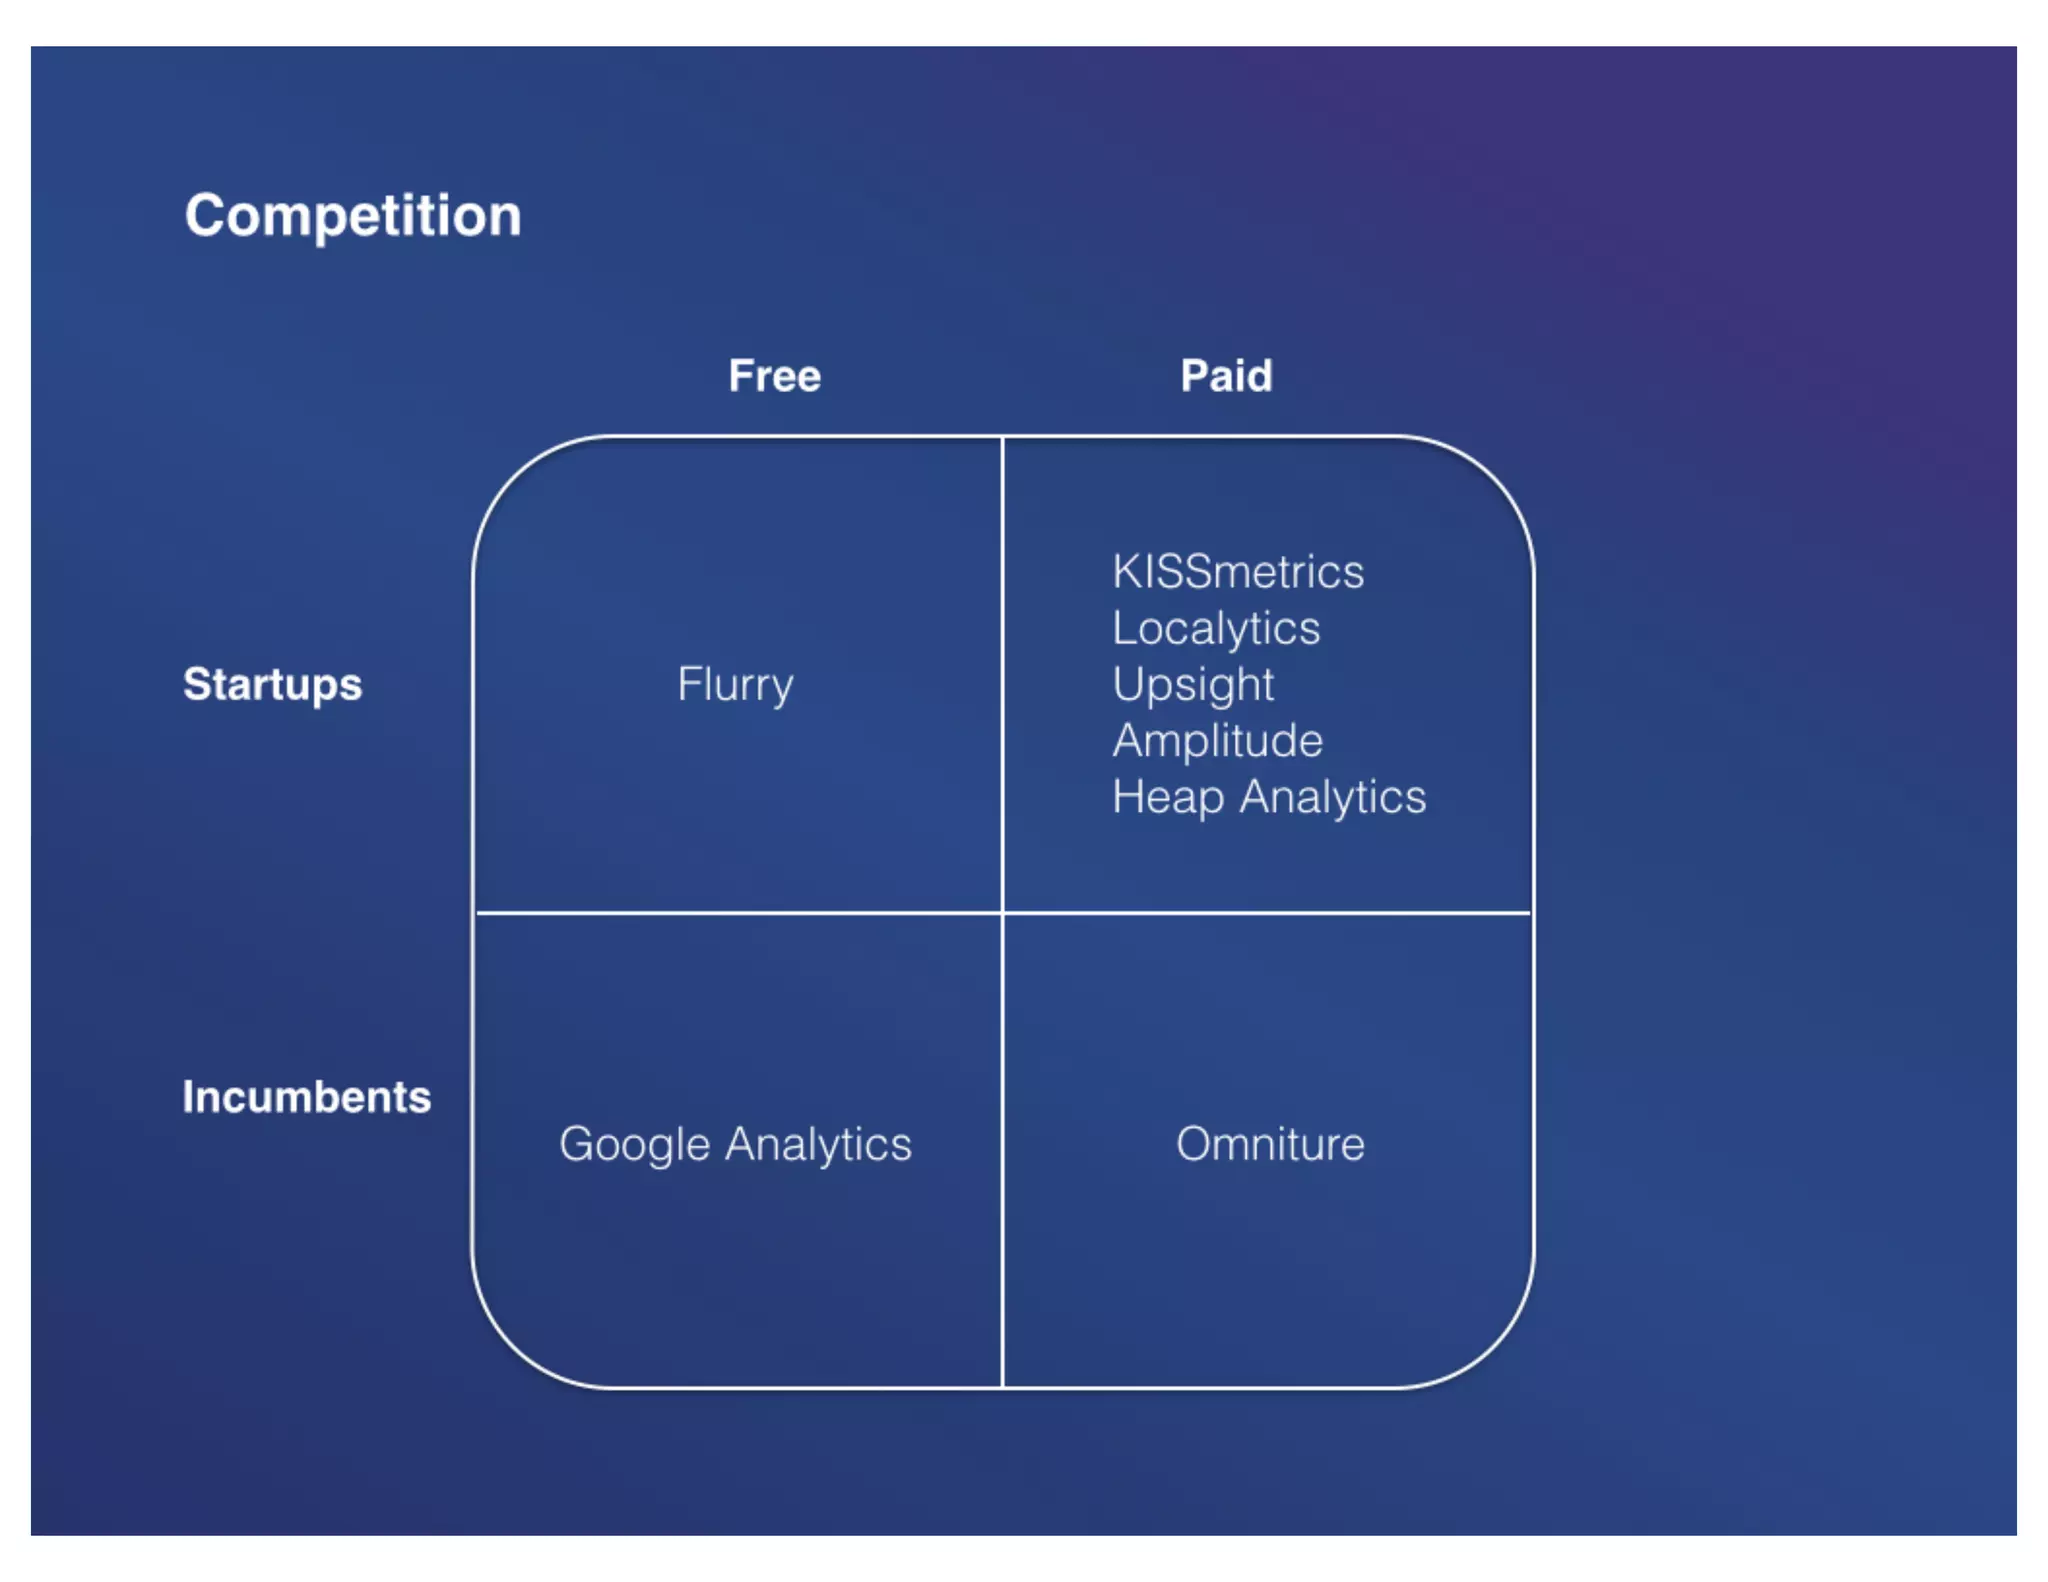
  3. Competitive Landscape (Slide 11): Identifies multiple competitors (Amplitude, KISSmetrics, Heap, Localytics, Upsight) in paid startup segment, suggesting a fragmented, growing market

Market Size Inference:

  • If Mixpanel is targeting $10.25M Series A (2012) and $65M Series B (2014), and assuming 3-5 year payback periods, the implied TAM is likely $500M-$1B+ in annual analytics software spend
  • The presence of 5+ well-funded competitors in the paid startup segment suggests a market large enough to support multiple winners

Business Model

Revenue Model: SaaS (Subscription)

The deck confirms a recurring revenue model through:

  • Slide 7: “Monthly Recurring Revenue Over Time” chart showing consistent MRR growth from Sept. 2011 to Sept. 2014
  • Slide 8: References to “Avg revenue per customer: $[REDACTED]/mo” and “New customers per month: [REDACTED]”

Pricing Tiers (Implied):

  • Freemium model (Slide 9: “Our best marketing programs are freemium usage”)
  • Expansion revenue model (Slide 8: “4x spend in 5 months, [REDACTED]x in 12 months”)
  • Suggests tiered pricing with upsell potential

Unit Economics (Partially Visible):

Metric Value Assessment
Sales Payback Period ~6 months Healthy for enterprise SaaS; target is improvement in 2015
Sales-Touched Customers 26% Strong product-led growth (74% self-serve)
Customer Expansion 4x in 5 months Excellent expansion revenue
Monthly Marketing Spend $83K (~$1M/year) Lean for 405% growth; suggests strong organic demand
Sales Reps 5 (2014 start) → 33 (2014 end) 6.6x growth; confidence in scalability

Profitability Path:

  • Not explicitly addressed in the deck
  • Aggressive headcount doubling (every 6-9 months) suggests prioritizing growth over profitability
  • No mention of path to profitability or unit economics at scale

Traction & Metrics

Slide 7: Monthly Recurring Revenue Growth (The Centerpiece)

Period Growth Rate Assessment
Sept. 2011 to Sept. 2012 405% Exceptional; validates product-market fit
Sept. 2012 to Sept. 2013 [REDACTED]% Likely 200%+ (redacted for confidentiality)
Sept. 2013 to Sept. 2014 [REDACTED]% Likely 150%+ (redacted for confidentiality)

Key Insight: The 405% YoY growth in 2011-2012 is exceptional for a SaaS company and directly substantiates the “we are winning” claim from Slide 6. The redacted subsequent growth rates suggest continued strong growth, though potentially decelerating (typical for scaling companies).

Slide 8: Sales KPIs (Operational Metrics)

Metric Value Interpretation
Sales Team Growth 5 → 33 reps (6.6x) Aggressive scaling; confidence in market demand
Sales-Touched Customers 26% 74% self-serve; strong product-led growth
Customer Expansion 4x in 5 months Excellent expansion revenue; customers increasing spend
Sales Payback Period ~6 months Healthy; target is improvement in 2015
Leads Per Month [REDACTED] Organically acquired (strong signal)
Integration Rate [REDACTED]% Freemium-to-paid conversion (critical metric, redacted)
Paid Conversion Rate [REDACTED]% Integration-to-paid conversion (critical metric, redacted)
Monthly Revenue Churn [REDACTED]% Key retention metric (redacted)

Slide 9: Marketing Metrics

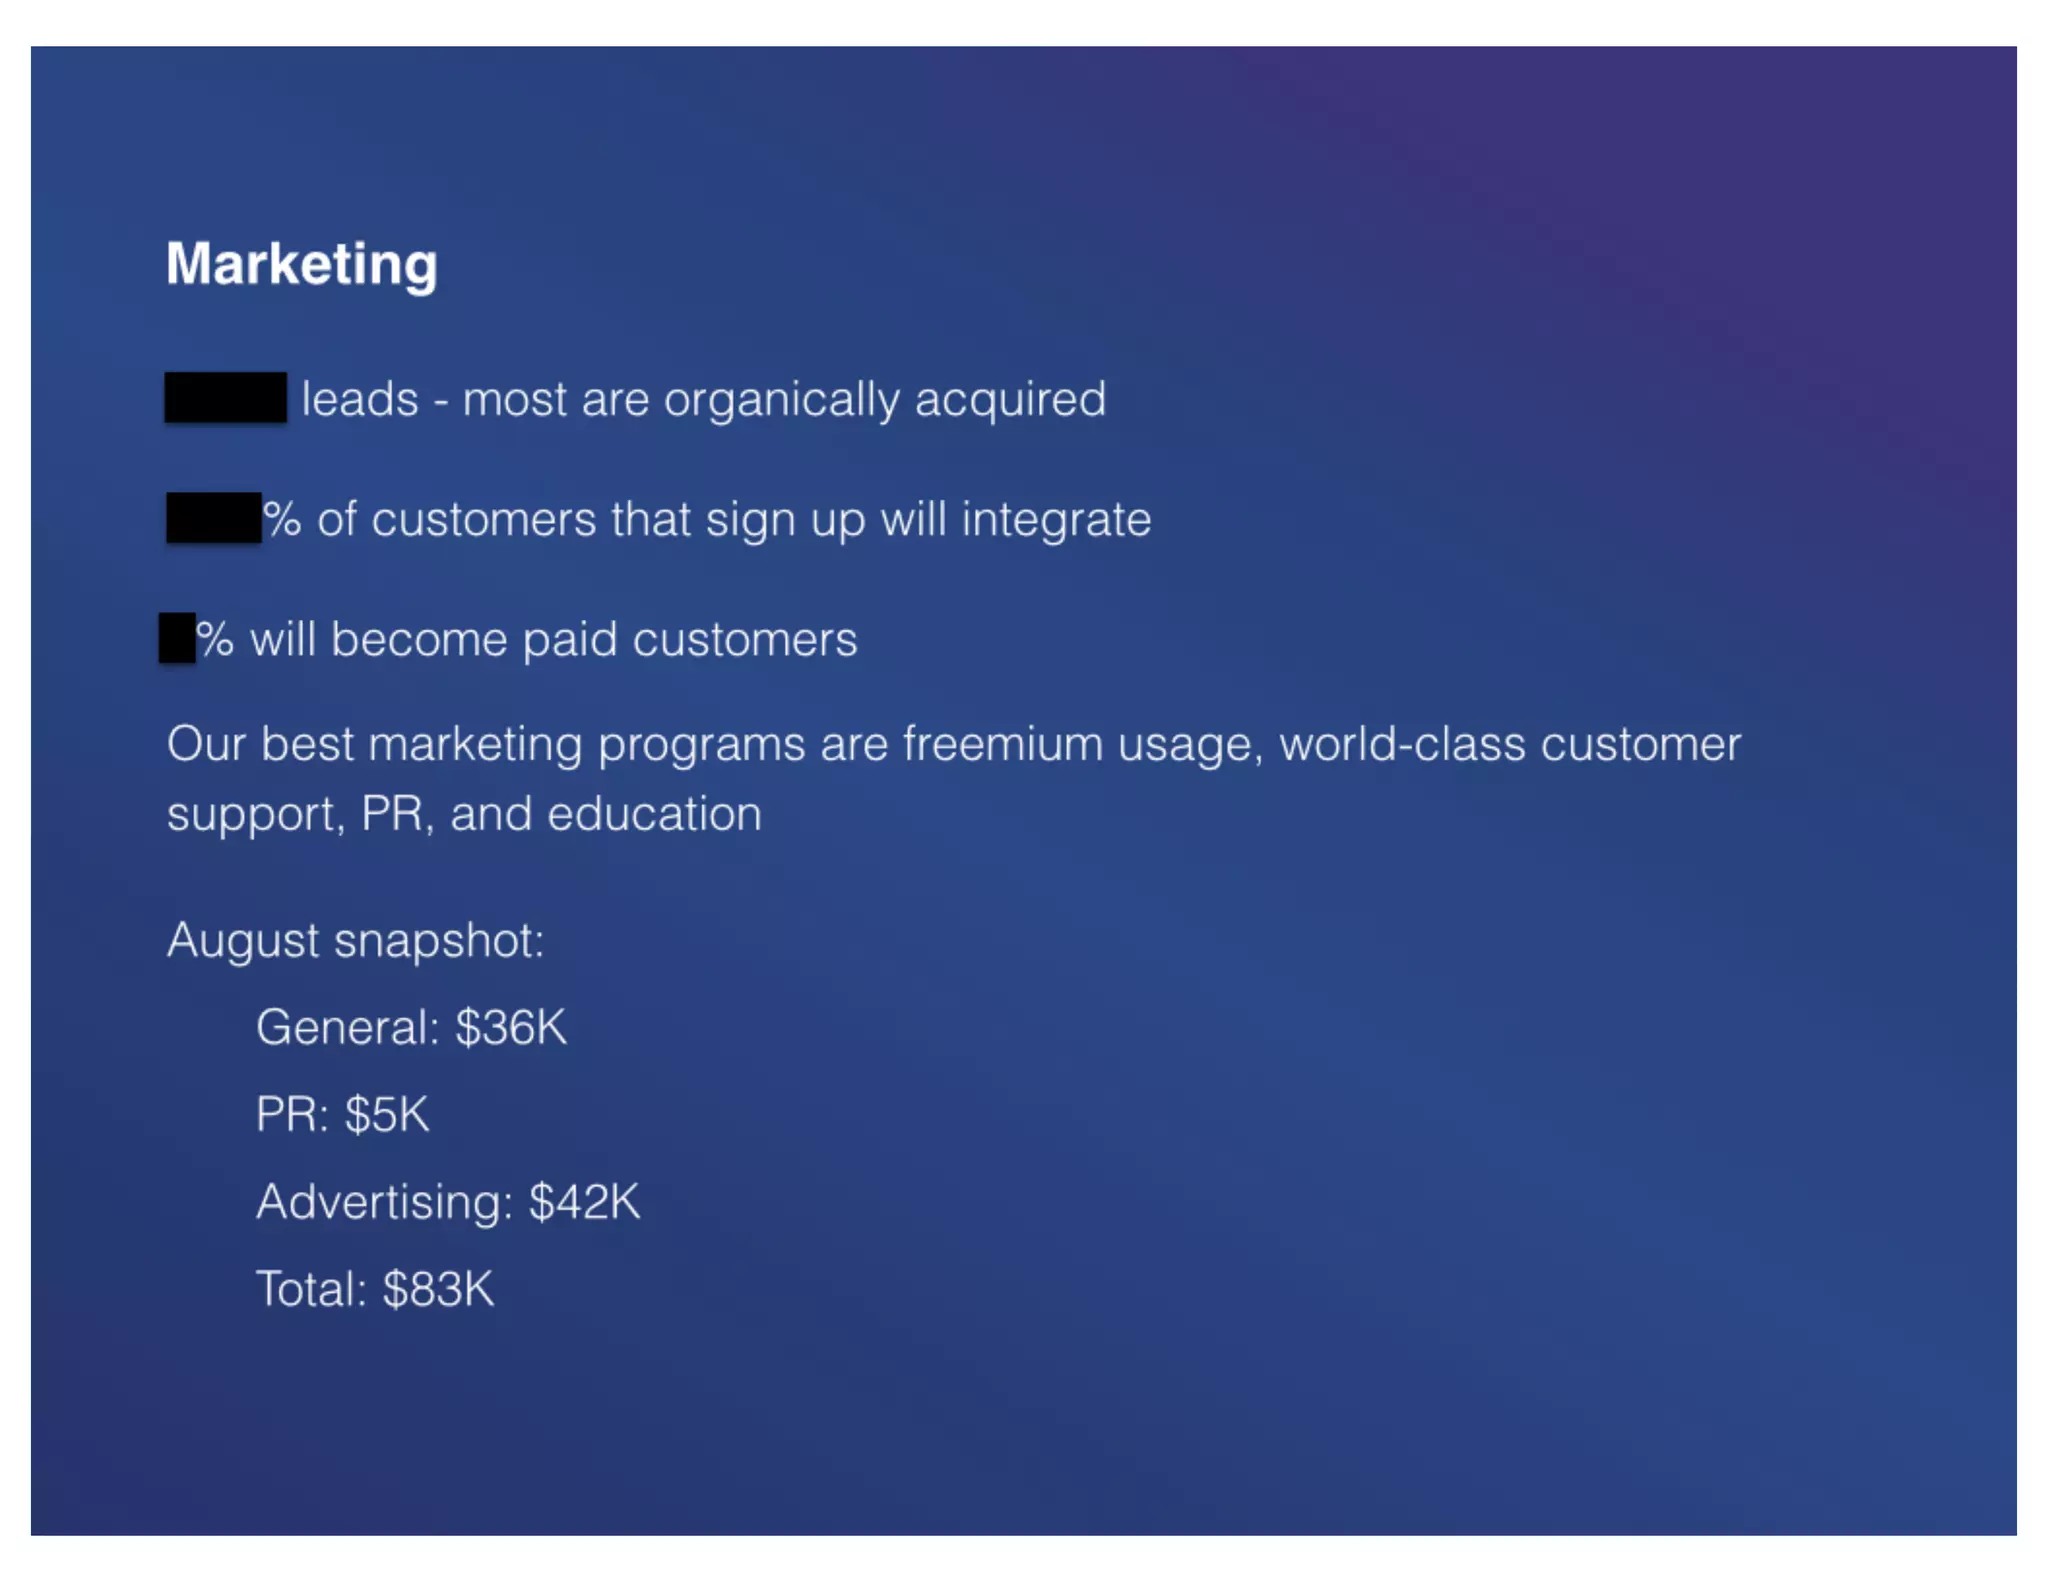
Channel Monthly Spend % of Budget Assessment
General $36K 43% Likely content, events, partnerships
Advertising $42K 51% Paid acquisition (Google, Facebook, etc.)
PR $5K 6% Earned media; low spend suggests strong organic PR
Total $83K/month 100% ~$1M/year; lean for 405% growth

Key Insight: The $83K/month marketing spend is remarkably efficient. For a company growing 405% YoY, this suggests:

  1. Strong product-market fit (organic demand)
  2. Freemium model driving self-serve adoption
  3. Word-of-mouth and PR effectiveness
  4. Potential for significant CAC reduction through marketing optimization

Competitive Positioning

Slide 11: Competitive Landscape Matrix

The deck positions competitors in a 2x2 matrix (Free/Paid vs. Startups/Incumbents):

Segment Competitors Mixpanel’s Position
Free/Startups Flurry —
Paid/Startups KISSmetrics, Localytics, Upsight, Amplitude, Heap Analytics Implied (not shown)
Free/Incumbents Google Analytics —
Paid/Incumbents Omniture —

Competitive Advantages (Stated):

  1. Proprietary Technology (Slide 6)
    • “Most sophisticated analytics database engine” built in 2010
    • Can “answer questions that existing technology could not answer”
    • Weakness: No technical details or benchmarks provided
  2. Product-Led Growth (Slide 9)
    • Freemium model drives 74% self-serve adoption
    • Strong customer support and education programs
    • Strength: Suggests superior product quality and UX
  3. Market Traction (Slide 7)
    • 405% YoY MRR growth (2011-2012)
    • Consistent month-over-month growth over 36 months
    • Strength: Outpacing competitors in growth rate

Competitive Weaknesses (Not Addressed):

The deck does not explain:

  • Why Mixpanel is winning against Amplitude, KISSmetrics, or Heap (all well-funded competitors)
  • Specific feature/capability advantages
  • Customer win/loss analysis
  • Market share or relative size vs. competitors
  • Why customers choose Mixpanel over alternatives

Assessment: The competitive positioning is weak. While the deck identifies real competitors, it doesn’t articulate a clear differentiation narrative. The matrix is incomplete (Mixpanel is not shown), missing an opportunity to visually demonstrate competitive superiority.


Team

Slide 12: Investor Pedigree (Proxy for Team Quality)

While the deck does not explicitly introduce the founding team, it demonstrates team credibility through investor backing:

Seed Investors (2009):

  • Y Combinator (validates early-stage product-market fit)
  • Max Levchin (PayPal co-founder; serial entrepreneur)
  • Michael Birch (Bebo founder; successful exit)

Series A Investors (2012):

  • Andreessen Horowitz (top-tier VC; validates scalability)
  • Marc Benioff (Salesforce CEO; enterprise expertise)
  • David Sacks (Yammer founder; SaaS expertise)

Key Insight: The quality and consistency of investors (same investors backing multiple rounds) suggests strong team credibility and execution. The presence of Salesforce CEO and Yammer founder as investors indicates enterprise SaaS expertise and potential strategic value.

Team Building (Slide 10):

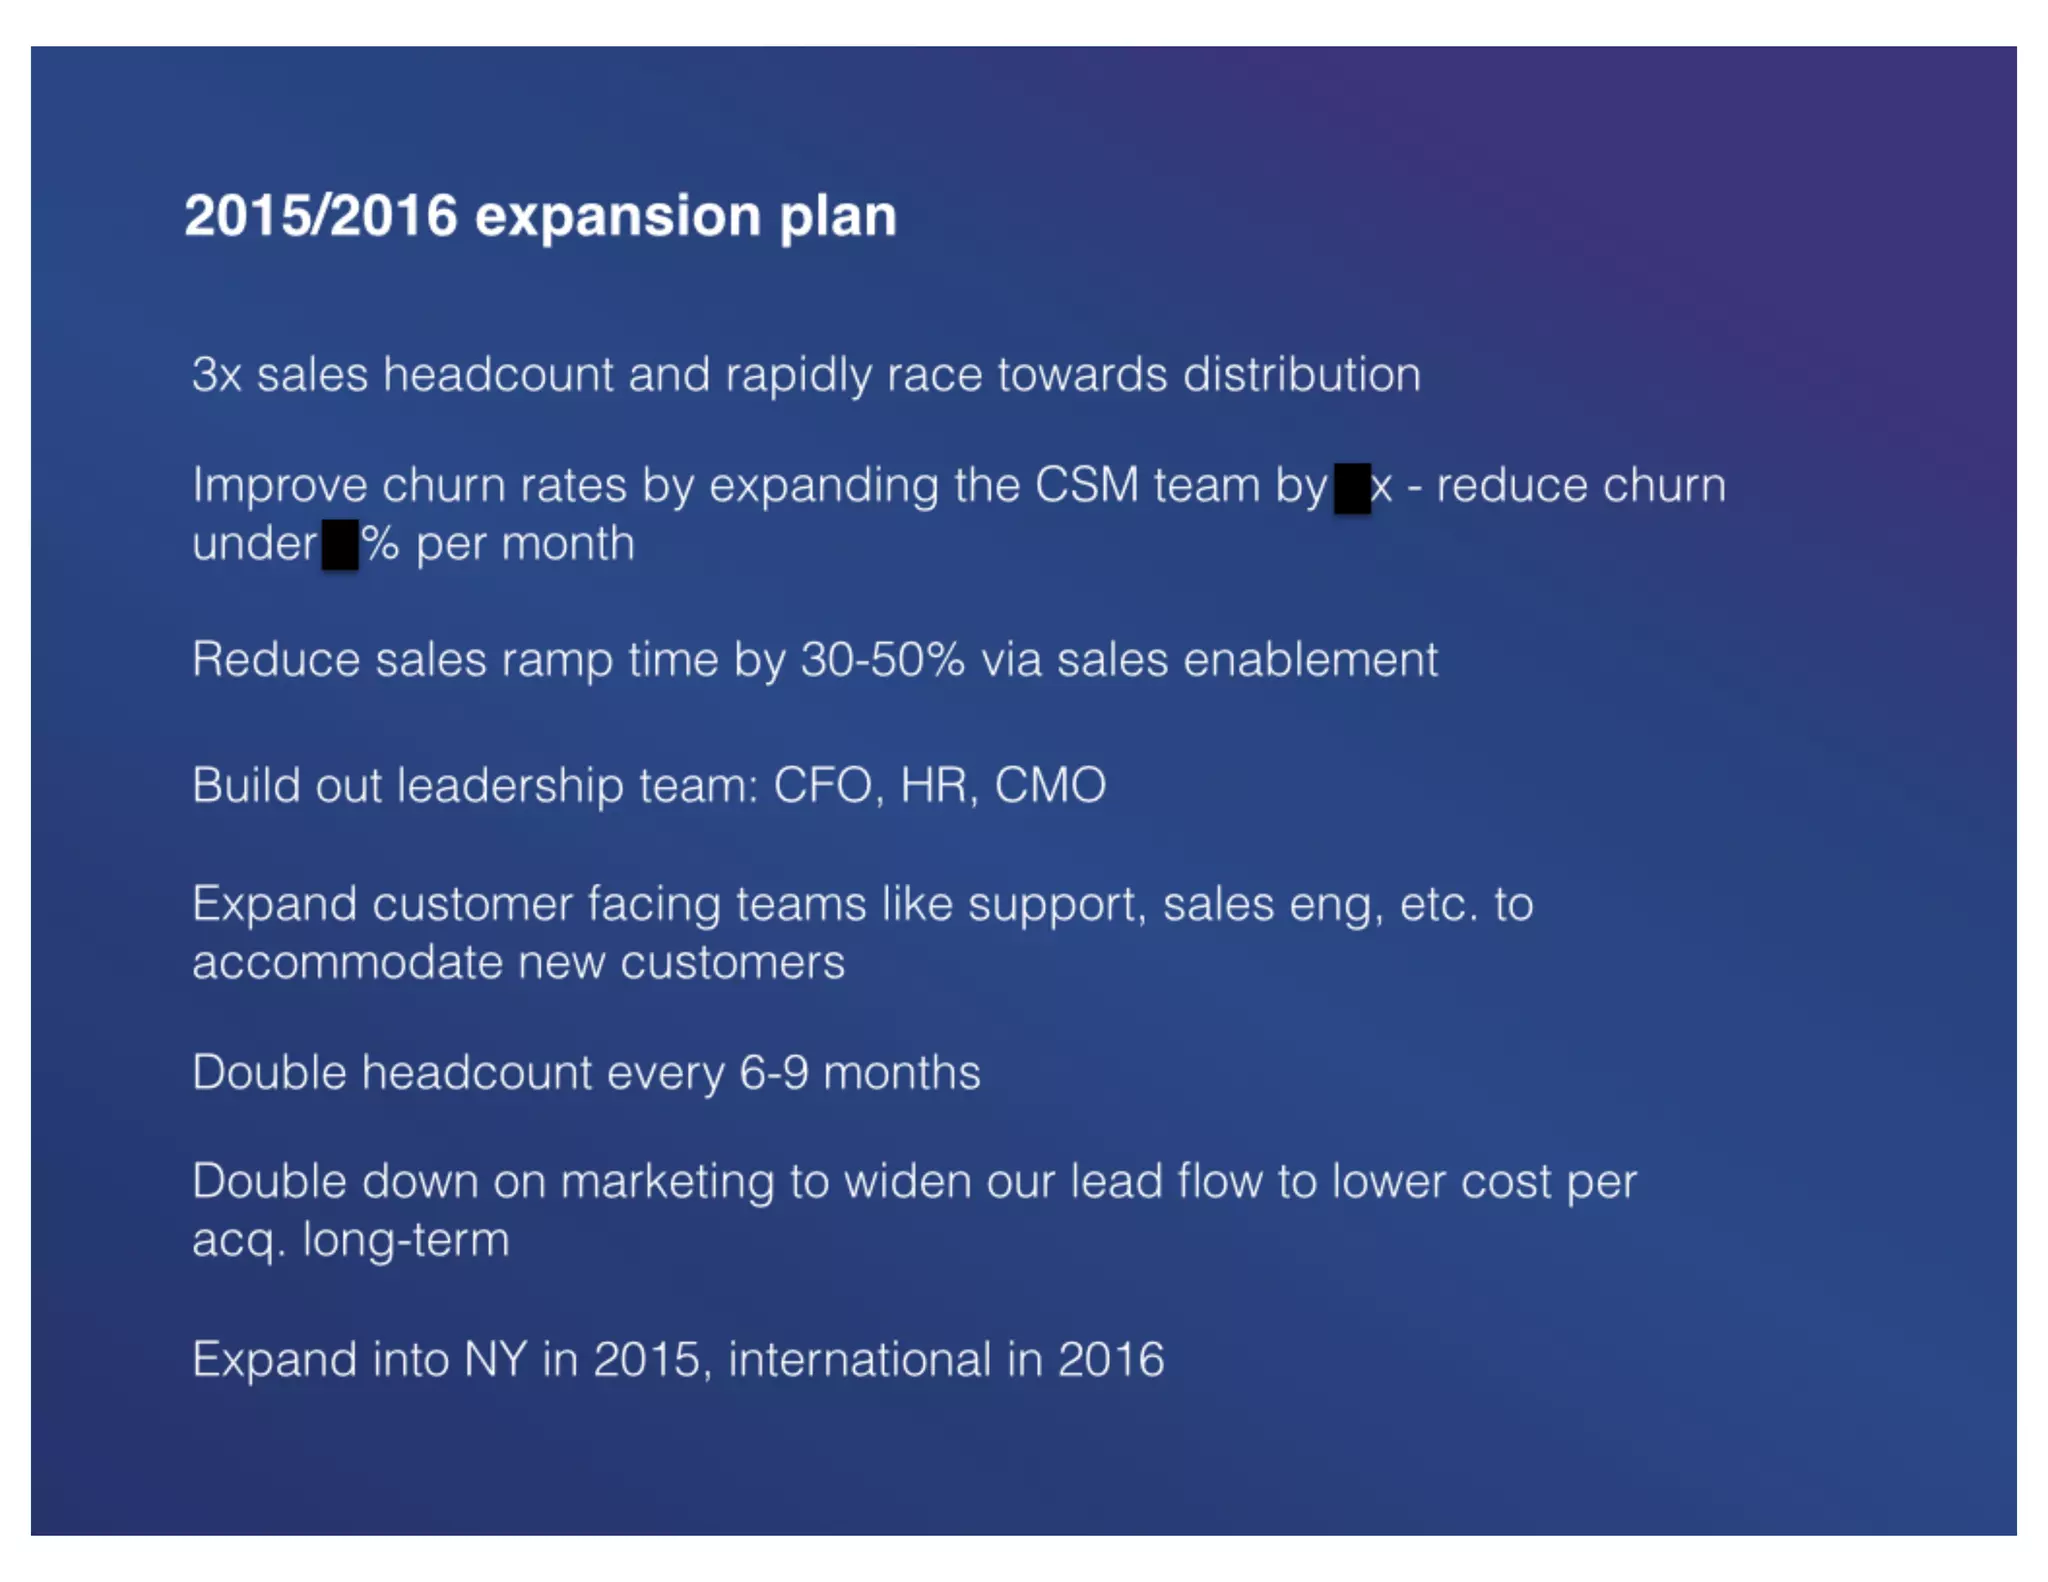
  • Plans to hire CFO, HR, CMO in 2015/2016
  • Suggests current team lacks these functions (typical for a 2014 startup)
  • Indicates maturation and professionalization

Notable Omission: The deck does not introduce the CEO, founders, or key executives by name. This is unusual for a Series B pitch and suggests either:

  1. The deck was presented verbally with team introductions
  2. The team was already known to the investor audience
  3. The focus was intentionally on metrics and traction rather than personalities

Go-to-Market Strategy

Slide 9: Marketing Strategy

Current Approach (2014):

  1. Freemium Model - Primary customer acquisition channel
    • Low friction entry point
    • Allows product evaluation before purchase
    • Drives 74% self-serve adoption
  2. Customer Support - Competitive advantage
    • “World-class customer support” listed as top marketing program
    • Suggests support-driven retention and expansion
  3. PR & Earned Media - Low-cost, high-credibility channel
    • Only $5K/month spend
    • Suggests strong organic PR and thought leadership
  4. Education - Content and knowledge sharing
    • Likely webinars, documentation, best practices
    • Builds community and reduces churn
  5. Paid Advertising - Secondary channel
    • $42K/month (51% of budget)
    • Likely Google Ads, Facebook, LinkedIn targeting product managers

Sales Strategy (Slide 8):

Segment Approach Metrics
Self-Serve Freemium → Paid 74% of new customers
Sales-Assisted Direct sales team 26% of new customers
Sales Team Growth 5 → 33 reps (6.6x) Aggressive expansion
Sales Payback ~6 months Healthy unit economics

Geographic Expansion (Slide 10):

  • NY expansion: 2015
  • International expansion: 2016
  • Suggests confidence in market demand and ability to replicate model in new geographies

Future Strategy (Slide 10):

  • “Double down on marketing to widen lead flow to lower cost per acq. long-term”
  • Implies current CAC is acceptable but target is optimization
  • Suggests shift from freemium-only to more paid acquisition as company scales

The Ask

Series B Round: $65M

Use of Funds (Inferred from Slide 10: 2015/2016 Expansion Plan):

  1. Sales & Distribution (Primary)
    • 3x sales headcount (from 33 to ~100 reps)
    • Sales enablement tools and training
    • Geographic expansion (NY, international offices)
    • Estimated allocation: 40-50% of capital
  2. Customer Success & Retention
    • Expand CSM team by [REDACTED]x
    • Reduce churn under [REDACTED]% per month
    • Support and education expansion
    • Estimated allocation: 15-20% of capital
  3. Operations & Leadership
    • Hire CFO, HR, CMO
    • Build out finance, HR, marketing infrastructure
    • Estimated allocation: 10-15% of capital
  4. Product & Engineering
    • Expand into sales and finance analytics (Slide 4)
    • Maintain competitive database engine
    • Estimated allocation: 15-20% of capital
  5. Marketing & Demand Generation
    • “Double down on marketing” (Slide 10)
    • Increase paid acquisition
    • Estimated allocation: 10-15% of capital

Valuation Implied:

  • Series A (2012): $10.25M raised
  • Series B (2014): $65M raised
  • Valuation Growth: 6.3x capital raised in 2 years
  • Implied Series B Post-Money Valuation: Likely $250M-$400M (based on typical Series B valuations of 3-5x capital raised)
  • Actual Outcome: $865M valuation (suggesting Series B post-money was likely $300M-$400M, with significant growth 2014-2018)

Investor Deep Dive

Executive summary, strengths & red flags

Executive Summary

Mixpanel's Series B pitch deck is a masterclass in data-driven storytelling for a high-growth SaaS company. The deck articulates a clear problem (companies making decisions without sophisticated analytics), positions a differentiated solution (event-based analytics database built in 2010), and backs claims with exceptional traction metrics (405% YoY MRR growth). The presentation balances aspirational vision ("Help the world learn from its data") with operational rigor (detailed KPIs, hiring plans, geographic expansion roadmap), making a compelling case for why Mixpanel deserves $65M to scale from a product-led startup into an enterprise analytics leader.

Key Strengths

5 identified

1

Exceptional Traction with Hard Numbers

- is exceptional for a SaaS company and immediately credible

2

Lean, Efficient Unit Economics

- for 405% growth is remarkably efficient

3

Top-Tier Investor Validation

- are gold-standard VCs

4

Clear Problem-Solution Narrative

- Problem is specific to mobile/web companies and their use of vanity metrics

5

Ambitious but Credible Growth Plan

- is aggressive but not unrealistic given current traction

Red Flags & Weaknesses

7 identified

1

Excessive Redaction of Critical Metrics

- Multiple critical metrics are redacted (churn rate, integration rate, paid conversion rate, growth targets, ARPU)

2

Weak Competitive Positioning

- Competitive matrix identifies 5+ well-funded competitors (Amplitude, KISSmetrics, Heap, Localytics, Upsight) but doesn't explain why Mixpanel is winning

3

No TAM/SAM/SOM Analysis

- Explicit market size estimates, addressable market calculations, or revenue targets

4

Lack of Team Introduction

- CEO, founders, or key executives are not named or introduced

5

No Profitability or Path to Profitability

- No discussion of unit economics at scale, path to profitability, or cash burn rate

6

Problem Validation Lacking

- Problems are stated but not validated with market research, customer interviews, or quantitative data

7

Incomplete Competitive Analysis

- Omniture is positioned as a paid incumbent, but it was acquired by Adobe in 2009 (5 years before this pitch)

More Pitch Decks To Study

Compare structure, fundraising context, and investor-facing story across similar startup decks.