Compare your deck to Zendesk

Compare Your Deck

Zendesk Pitch Deck (2009)

SaaS
Stage: Seed
Raised: $500K
Year: 2009
Slides: 37
Outcome: Acquired by Hellman & Friedman for $10.2B (2022)

Pitch Deck

1 / 37
Zendesk pitch deck slide 1
Click to expand

Deck Analysis

This deck is an early-stage investor pitch from Zendesk (Seed, 2009) that presents a compact, product-focused argument for a SaaS customer-support platform. It balances company positioning, the problem-space, product capabilities, business model and early traction — all the elements investors expect from a seed presentation. Notable here is how the deck pairs clear visual design with measurable signals (revenue growth, customer engagement, pricing tiers), an approach that presaged Zendesk's growth into a multi-billion dollar outcome.

The Opening: Simple, professional cover that sets tone and credibility

The Opening: Simple, professional cover that sets tone and credibility

The title slide (SLIDE 18) presents a clean, corporate layout with the Zendesk mark, a descriptive title (“Zendesk Investor Funding Elevator Pitch Deck”) and a professional photo of someone working with charts. It establishes credibility immediately by signaling this is a business-focused, investor-oriented presentation rather than a casual founder deck. The composition uses diagonal lines and whitespace to look modern and dependable — visual cues that help position the team as competent operators.

For founders, the lesson is the cover’s function: it's not just decorative, it sets expectations. A professional, on-brand cover signals preparation and respect for the audience, which primes investors to evaluate the content more favorably. Keep the cover concise, clearly labeled with the company name and deck purpose, and use imagery that reinforces the business narrative rather than distracting from it.
Key Takeaway: A polished, business-like cover instantly raises credibility — invest time to make it look intentional and aligned with the company story.
Company Overview: Mission, features and core values

Company Overview: Mission, features and core values

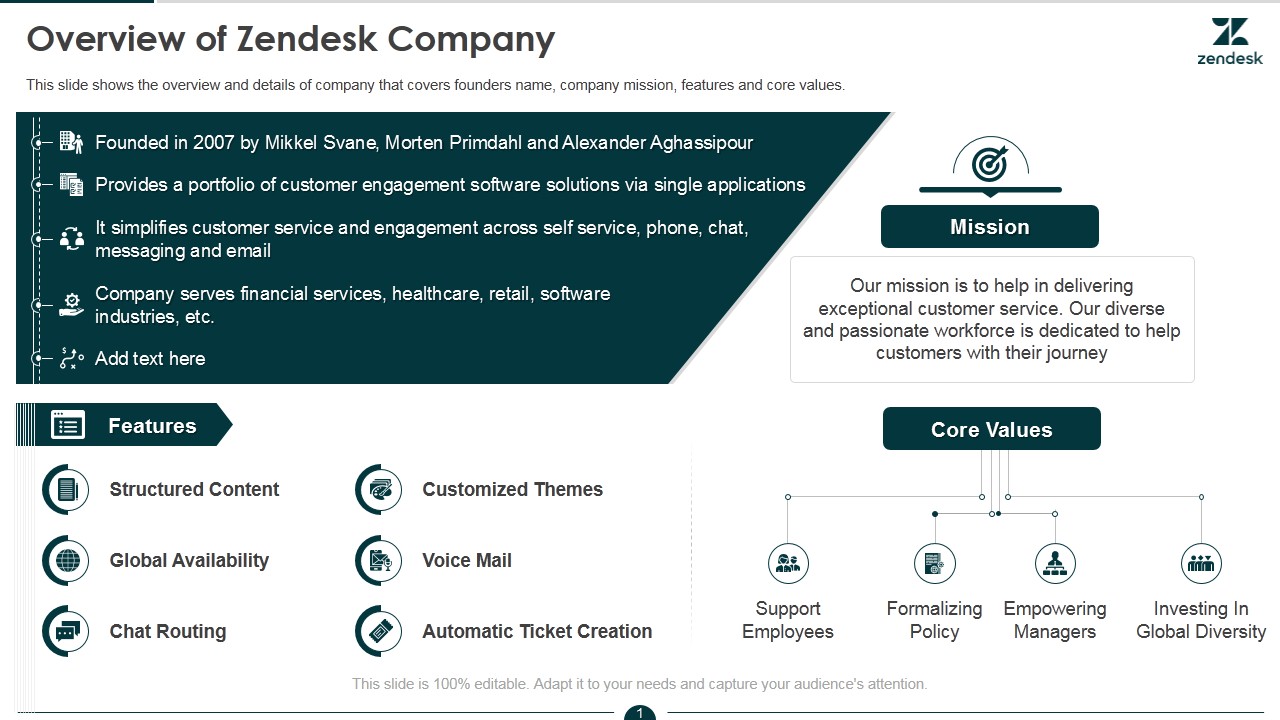
The overview slide (SLIDE 19) concisely communicates founding details, product capabilities and the company mission on a single page. The slide organizes content into a short timeline/founder note, a mission box and a features list with icons, allowing investors to quickly grasp who the team is, what they build, and what the product does. The combination of narrative (mission) and tangible feature bullets creates both emotional and logical reasons to care.

This slide is effective because it respects investors’ limited time: it provides context without deep technical detail, and it pairs mission-driven language with concrete product items (chat routing, automatic ticket creation, global availability). Founders should aim for the same balance — one slide that answers “who you are,” “what you sell,” and “why it matters” using readable bullets and simple icons to increase scannability.

Key Takeaway: Use one tightly structured overview slide that pairs mission with a short set of product features so investors can understand purpose and capability in under 30 seconds.
Problem Statement: Clear articulation of customer pain

Problem Statement: Clear articulation of customer pain

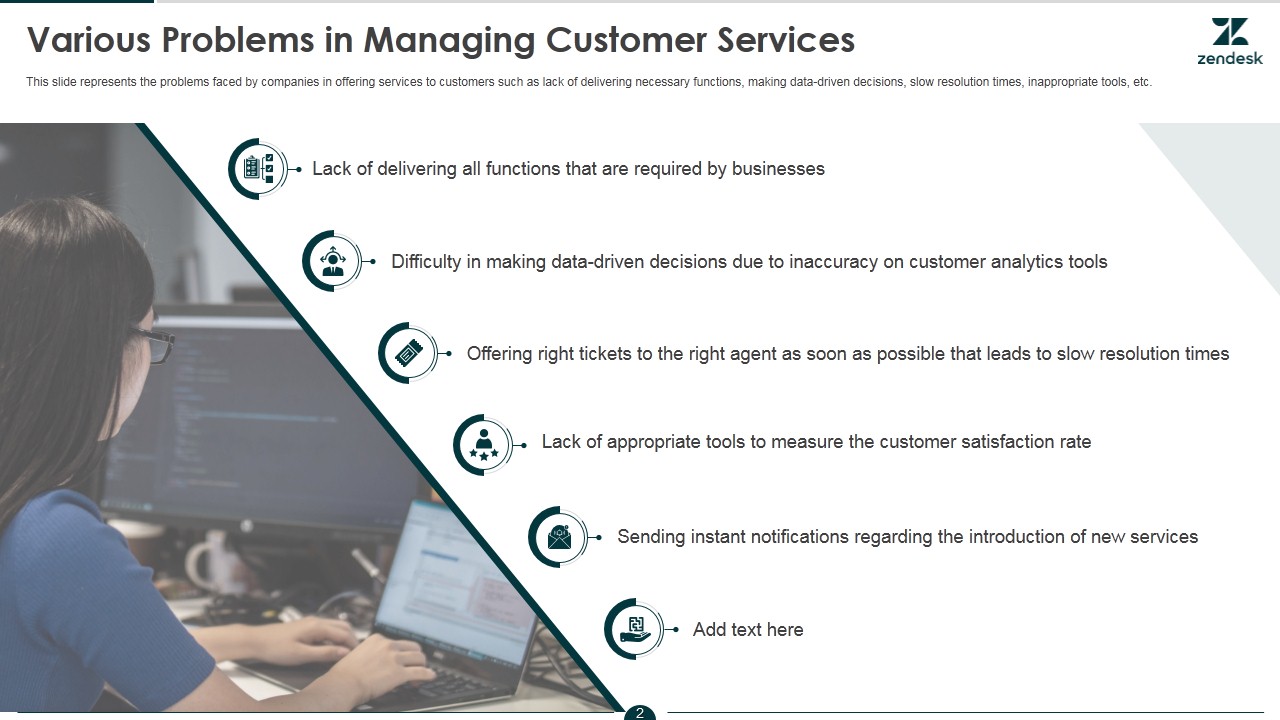
The problems slide (SLIDE 20) lists specific operational issues companies face with customer service: incomplete function coverage, poor analytics, slow ticket routing, lack of measurement tools and notification gaps. The slide couples each problem with icons and uses left-aligned bullets along a strong diagonal visual anchor, which guides the eye and pairs real pain points with implied value the product can deliver.

This slide demonstrates how specificity strengthens a problem statement. Instead of vague claims like “customer service is broken,” Zendesk enumerates concrete workflow failures that map directly to product features. Founders should emulate this: name the operational friction points your product eliminates, prioritize those that have measurable KPIs (response time, CSAT, ticket resolution), and present them visually so investors can immediately see the product-market fit.
Key Takeaway: List the concrete operational pains your product fixes — specific, measurable problems make the value proposition believable and actionable.
Solution Snapshot: How Zendesk addresses the problems

Solution Snapshot: How Zendesk addresses the problems

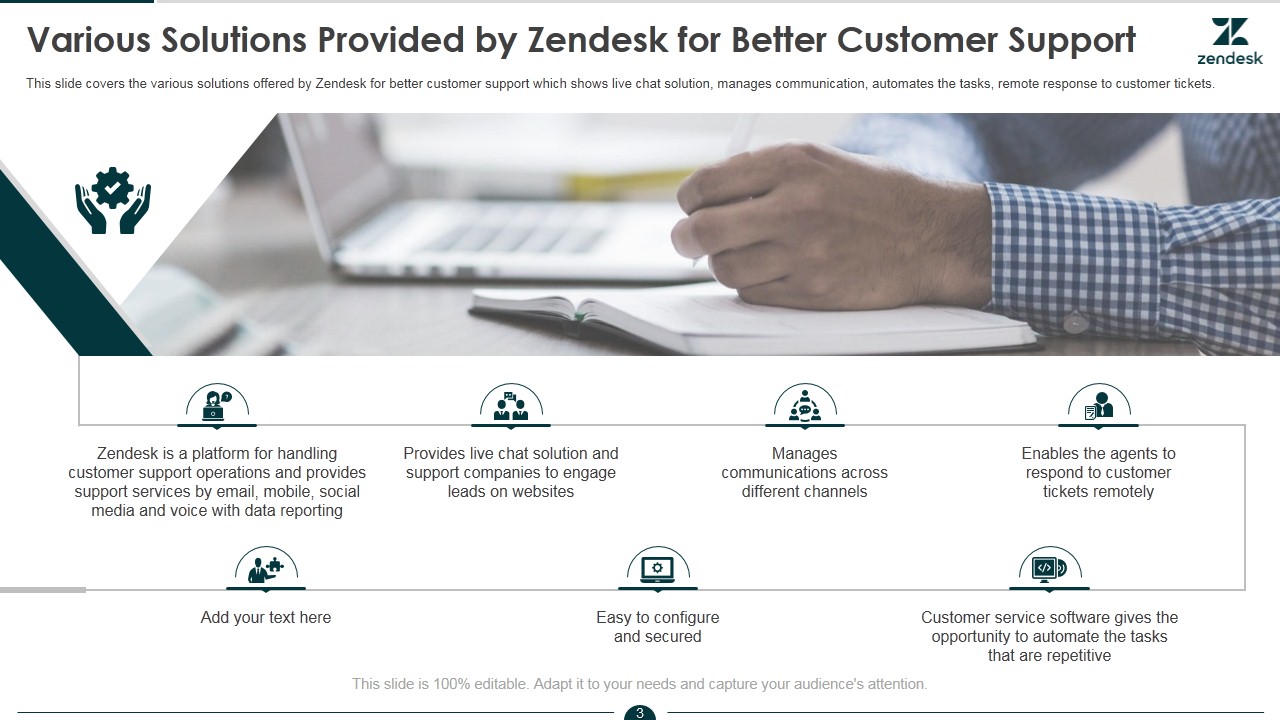
The solutions slide (SLIDE 21) provides a horizontal timeline-style layout showing key capabilities: multi-channel support, live chat, remote ticket response, automation and configurability. The visuals include icons and short captions that directly map to the previously stated problems, which creates a tight problem-solution narrative. The slide avoids deep technical detail and instead focuses on user-facing outcomes — faster response, cross-channel coverage and automation.

This is an effective pattern for founders: present solutions as direct answers to each pain point and keep copy concise. Use short captions and representative icons rather than dense text. If possible, pair each solution with a metric or customer story elsewhere in the deck to strengthen the causal link between feature and business impact.

Key Takeaway: Map each product capability directly to a stated customer pain and present that mapping visually and succinctly to make the solution obvious.
Products & Features: Organized, modular product breakdown

Products & Features: Organized, modular product breakdown

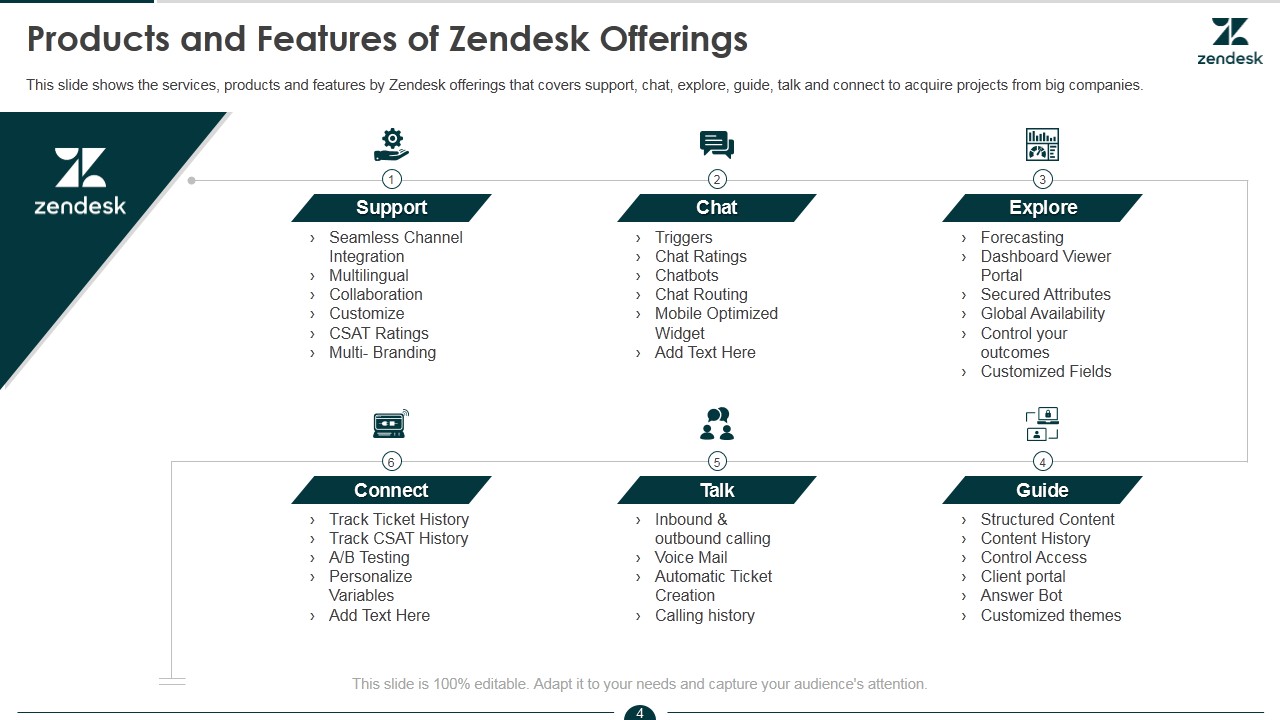
The product/features slide (SLIDE 22) breaks Zendesk offerings into labeled modules (Support, Chat, Explore, Connect, Talk, Guide) with bulleted features under each. This modular layout clarifies the product architecture and potential upsell or packaging strategies. It signals a platform approach — multiple complementary tools under a single brand — which helps investors understand monetization and expansion pathways.

For founders, the takeaway is to show product architecture succinctly: group features into logical modules that reflect both buyer workflows and pricing tiers. This layout also makes it easy to discuss roadmap and integration strategies in follow-up conversations because each module can be expanded into a demo or supporting metric.

Key Takeaway: Organize product functionality into clear modules that align with buyer needs and potential pricing tiers to show scalability and cross-sell opportunities.
Traction: Annual revenue growth and momentum

Traction: Annual revenue growth and momentum

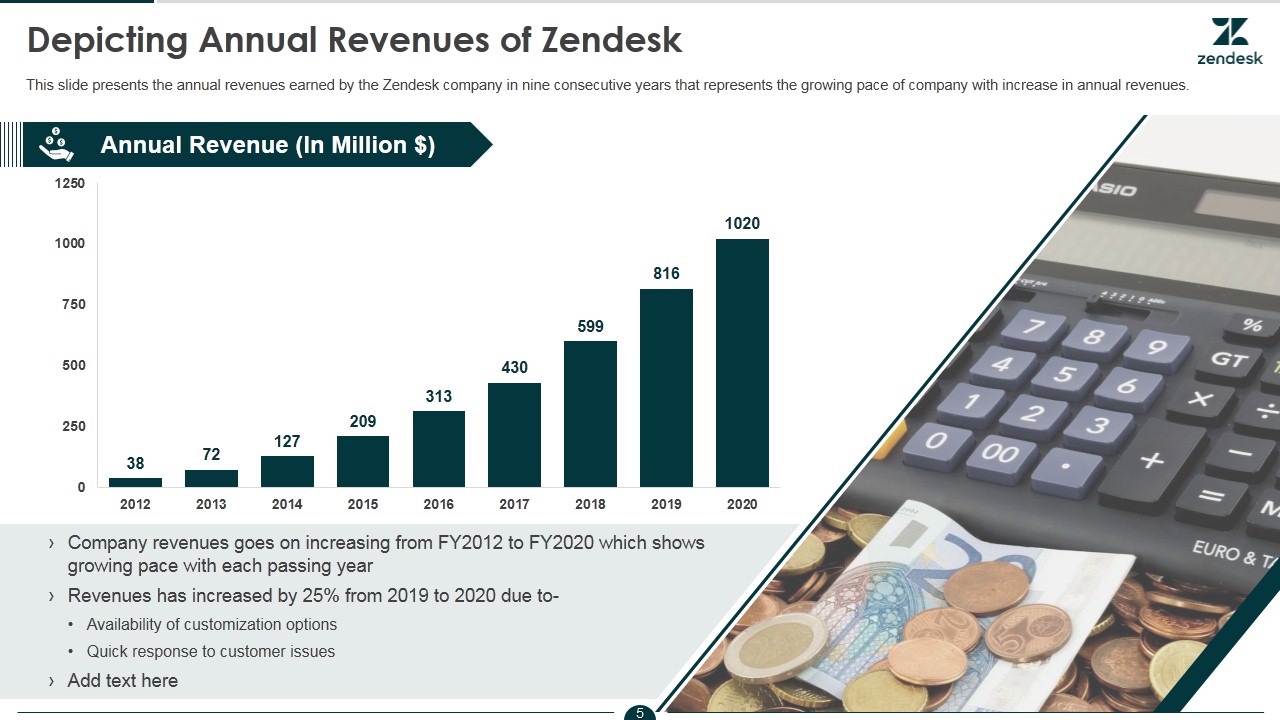
The annual revenue slide (SLIDE 23) uses a bar chart to show revenue growth from FY2012 to FY2020 with a dramatic rise in later years, plus bullet commentary on growth drivers and a numerical highlight of year-over-year increases. Presenting an easily readable chart alongside short interpretive bullets gives both the data and the narrative. The diagonal image treatment keeps the visual identity consistent with earlier slides while reserving the chart area for the hard numbers investors care about.

This is an instructive example for founders: show clean, verifiable traction visuals (charts) and couple them with short explanatory bullets about why growth happened. When possible, cite percentages or compound annual growth rates and annotate major inflection points (product launches, pricing changes, enterprise wins) so investors can connect actions to outcomes.

Key Takeaway: Use a simple chart to display revenue trajectory and annotate growth drivers so investors can see both the numbers and the causal story behind them.
Competitive Positioning: Feature comparison and differentiation

Competitive Positioning: Feature comparison and differentiation

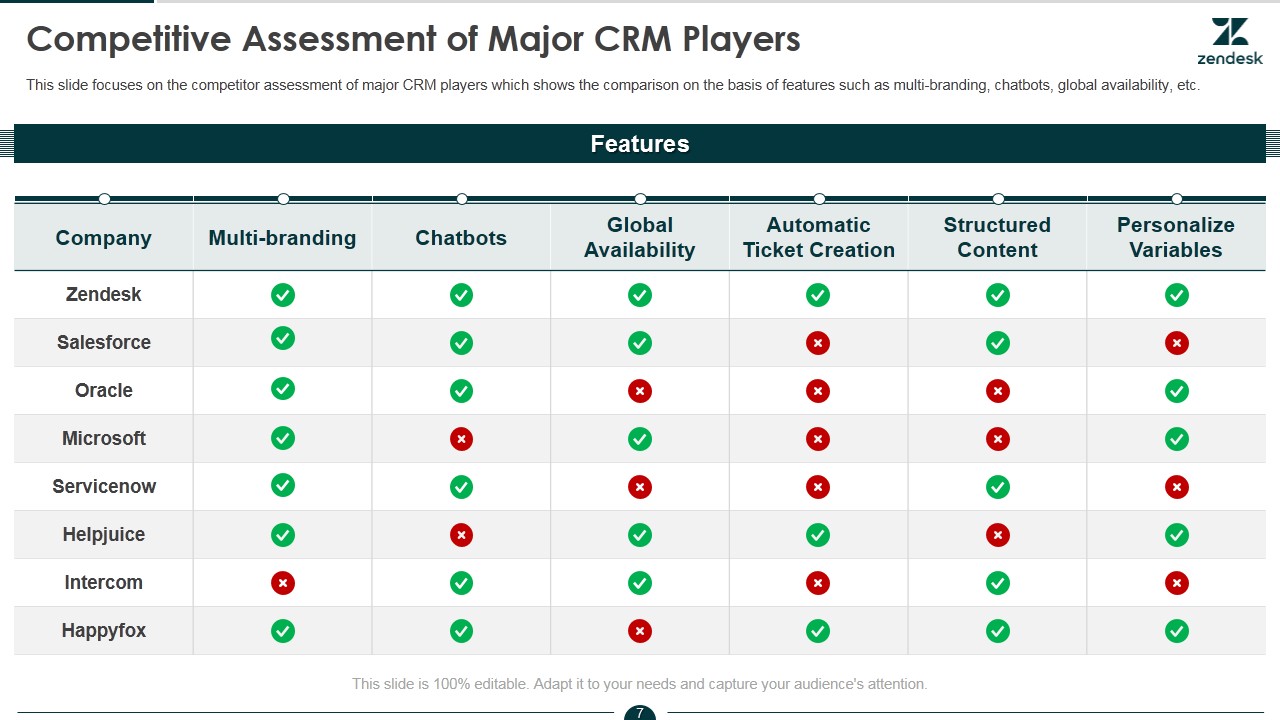
The competitive assessment slide (SLIDE 25) is a tabular feature comparison across major CRM players, using checkmarks to indicate feature presence. This grid makes it easy to see where Zendesk leads (multi-branding, chatbots, global availability, structured content) and where competitors have gaps. The visual taxonomy shows that Zendesk competes on breadth of features and accessibility rather than on a single flagship capability.

For founders, a clear competitive matrix is a high-value slide: it demonstrates market knowledge and highlights defensible differentiators. When building this slide, pick comparison criteria that matter to buyers, include key competitors investors will expect, and be honest about tradeoffs so you can later explain your go-to-market and product roadmap decisions.

Key Takeaway: A direct feature-by-feature competitor matrix highlights real differentiation and shows investors you understand where you win and where you must improve.
Pricing & Monetization: Clear subscription tiers and account limits

Pricing & Monetization: Clear subscription tiers and account limits

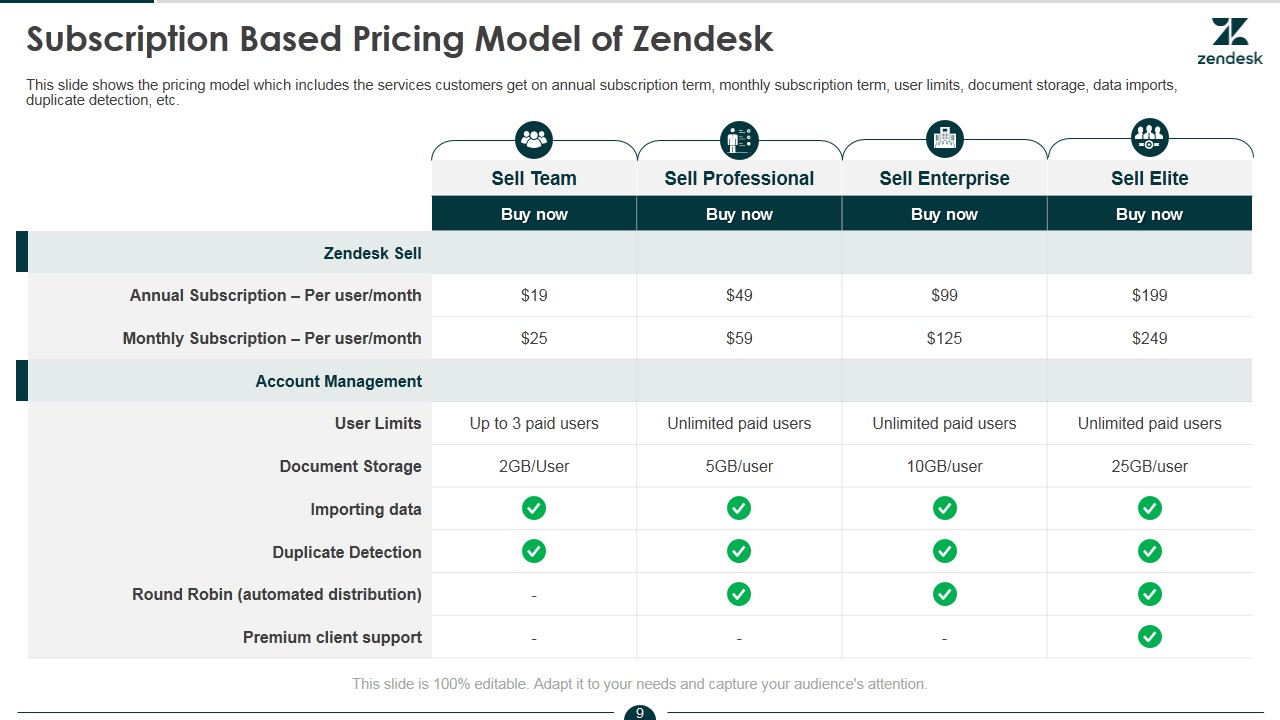
The pricing slide (SLIDE 27) lays out a subscription-based pricing model with named tiers (Sell Team, Professional, Enterprise, Elite), monthly and annual per-user pricing, and account management features like user limits and storage. The table format allows for immediate comparison of capabilities per tier and highlights how upsell can be achieved (higher storage, unlimited users, premium support). Presenting both annual and monthly prices anticipates buyer behavior and shows flexibility in packaging.

Founders should present pricing clearly and defensibly: show typical entry points, what features unlock at higher tiers, and any usage limits that encourage upgrading. Also include rationale for customer segments targeted by each tier (SMB vs enterprise) so investors can evaluate unit economics and revenue expansion potential.

Key Takeaway: Present transparent tiered pricing tied to concrete feature unlocks and limits so investors can quickly evaluate ARPU and expansion pathways.

Conclusion: Key Lessons

Zendesk’s seed-era deck combines clarity, economy and evidence: a crisp cover, a one-slide overview, a concrete problem set, a mapped solution, modular product architecture, visible traction and straightforward pricing. Strengths include the tight problem→solution flow, measurable traction visuals, and a product-to-pricing mapping that shows a clear path to monetization. The deck’s consistent visual language reinforces credibility and aids rapid comprehension.

Actionable advice for founders: (1) craft a one-slide overview that answers who you are, what you build and why it matters; (2) enumerate specific operational pains and map each to a product capability; (3) show clean, verifiable traction (charts + short narrative) and (4) present tiered pricing tied to concrete features to demonstrate a path to revenue expansion. These elements together make a deck that is investor-friendly and strategically persuasive.

Full Deck Analysis

11 sections

Overview

Company: Zendesk
Round: Seed ($500K)
Year: 2009
Outcome: Acquired by Hellman & Friedman for $10.2B (2022)

Executive Summary

This deck presents Zendesk as a focused, product-led SaaS solution for customer support and engagement. It emphasizes a simple, multi-channel support product (email, chat, voice, self‑service), early traction (rapidly rising revenues/customers shown in later slides), and a subscription pricing model — all packaged in a concise investor-facing narrative. The deck is notable for presenting clear product features, competitive differentiation, and early business metrics that presage strong growth.

Problem Statement

How the deck articulates the problem:

  • Slide 19 (“Various Problems in Managing Customer Services”) lists concrete pain points companies face: incomplete toolsets, inaccurate analytics, wrong ticket routing, slow resolution times, lack of CSAT measurement, and poor notification for new services.
  • The problem framing is practical and operational — it targets the day-to-day failure modes of customer support teams rather than abstract industry challenges. This makes the pain relatable to early enterprise buyers and investors.

Solution

How the deck positions the solution:

  • Slides 20–21 describe Zendesk as a unified platform for handling customer support across channels: email, mobile, social, voice, live chat, automation and reporting.
  • Slide 21 breaks out product modules (Support, Chat, Explore, Guide, Talk, Connect) to show a modular, extensible platform.
  • Emphasis on “easy to configure and secured”, automation of repetitive tasks, and live chat / chatbots positions Zendesk as both simple to adopt and able to replace fragmented point tools.

Market Opportunity

TAM/SAM/SOM analysis (explicit numbers shown in the deck):

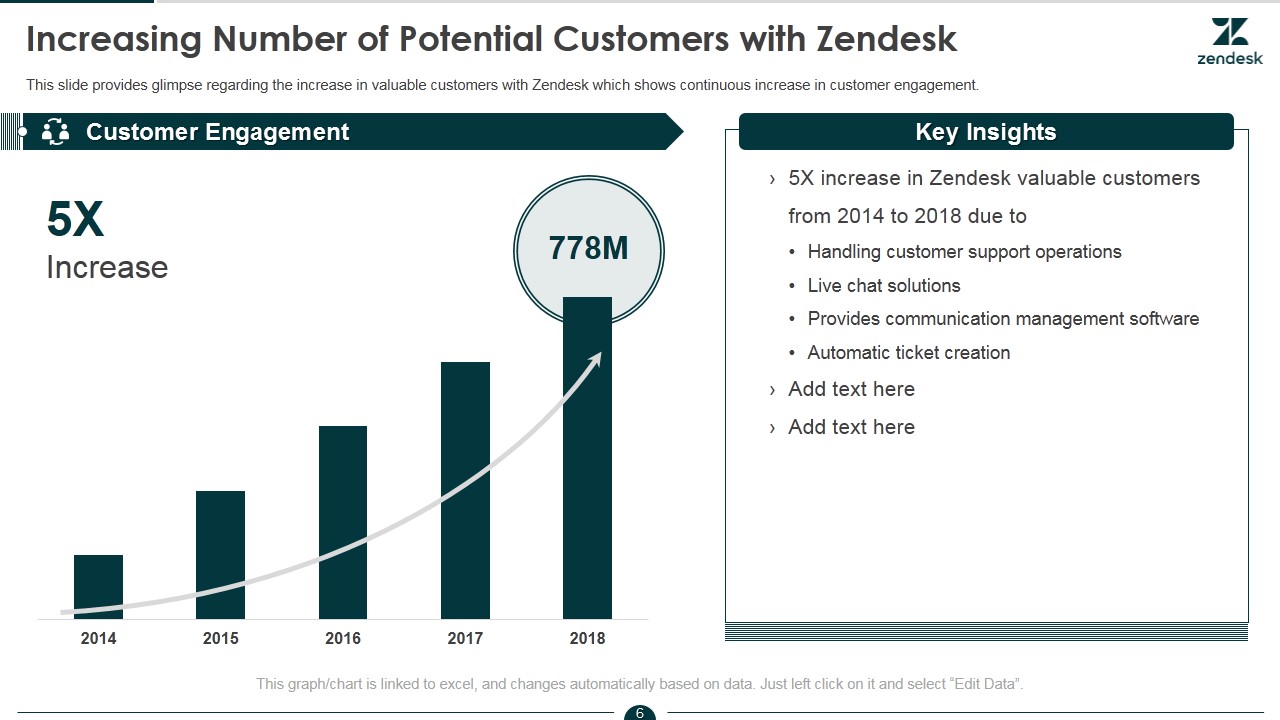
  • Slide 23 (Customer Engagement) shows a 5X increase in “valuable customers” from 2014 to 2018 and highlights a peak value “778M” (the slide calls out “778M” as a figure tied to 2018).
  • Slide 22 (Annual Revenue) presents a long-term revenue growth chart (labeled in millions): 2012: $38M; 2013: $72M; 2014: $127M; 2015: $209M; 2016: $313M; 2017: $430M; 2018: $599M; 2019: $816M; 2020: $1,020M.
  • The deck does not present an explicit TAM / SAM / SOM breakdown or a methodological market sizing slide. Instead, it implies a very large market through rapid revenue growth and adoption metrics.

(Note: several slides present multi-year metrics beyond 2009 — these are shown in the deck but are retrospective/prognostic and are not a classic TAM/SAM/SOM table.)

Business Model

Revenue model and unit economics:

  • Slide 27 (“Subscription Based Pricing Model of Zendesk”) shows a classic SaaS subscription approach with per-user pricing tiers. Example prices shown:
    • Sell Team: Annual per user/month $19 (monthly $25)
    • Sell Professional: $49 (monthly $59)
    • Sell Enterprise: $99 (monthly $125)
    • Sell Elite: $199 (monthly $249)
  • Account features tied to tiers (user limits, document storage, importing, duplicate detection, round-robin distribution, premium support).
  • The model is recurring subscription (monthly/annual) with tiered feature gating — standard SaaS monetization that enables predictable ARR and expansion via seat growth and higher-tier upgrades.
  • The deck does not present explicit unit economics (LTV, CAC, gross margin %) or detailed ARPU by cohort in the visible slides.

Traction & Metrics

Growth metrics and proof points (slide-specific):

  • Slide 22: Annual revenue trajectory (in $M) from 2012 → 2020: 38 → 72 → 127 → 209 → 313 → 430 → 599 → 816 → 1,020.
  • Slide 23: “5X increase in Zendesk valuable customers from 2014 to 2018” and a callout number “778M” (presented in the graphic for 2018).
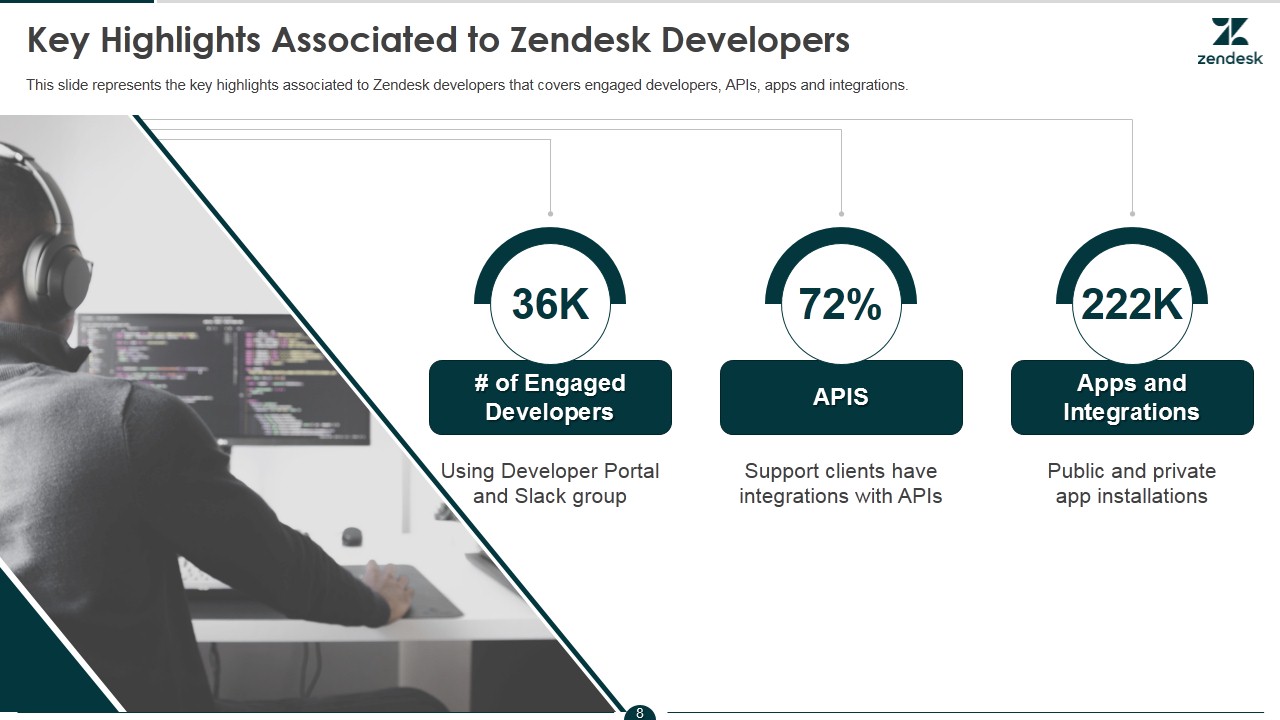
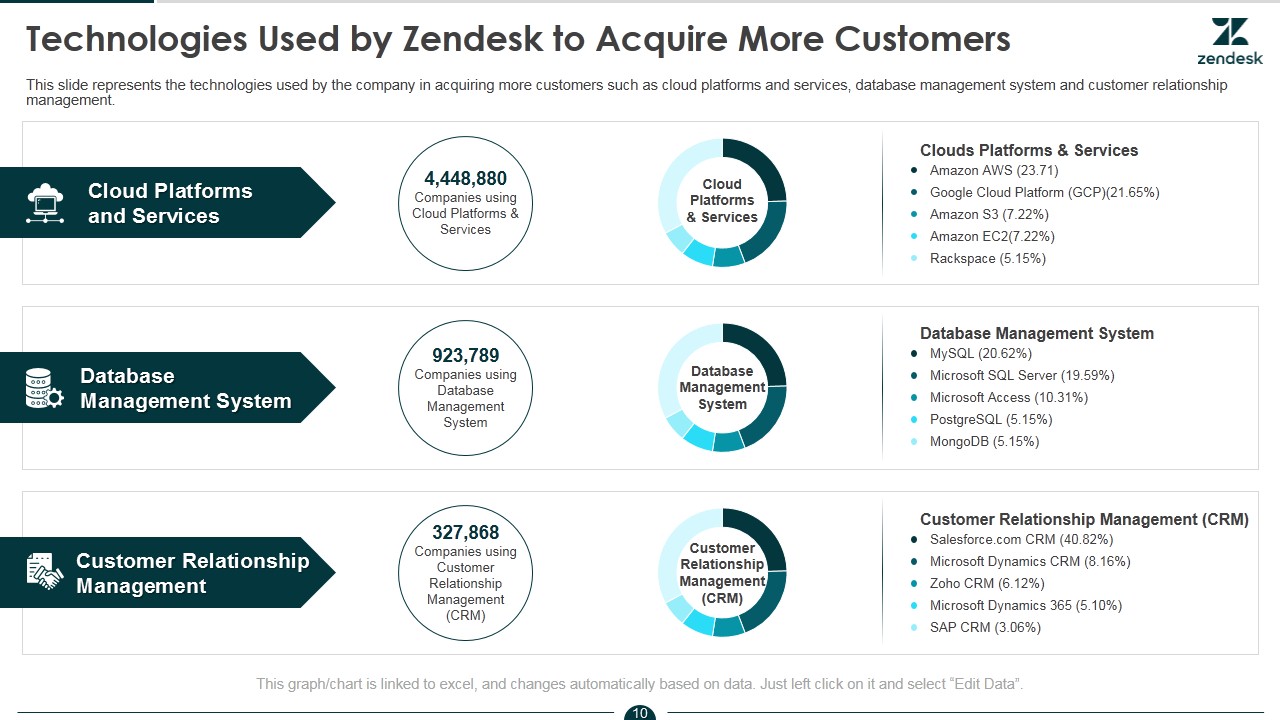
  • Slide 26: Developer ecosystem metrics — 36K engaged developers, 72% APIs, 222K apps and integrations (these reinforce ecosystem traction).
  • Slide 25: Competitive feature matrix comparing Zendesk to Salesforce, Oracle, Microsoft, ServiceNow, etc., showing checkmarks for Zendesk across core features — a qualitative traction/positioning signal.
  • Overall the deck combines revenue growth, customer growth, and a developer ecosystem to demonstrate momentum.

Competitive Positioning

How they differentiate:

  • Product breadth + simplicity: single platform covering support, chat, phone, self service (Slides 20–21).
  • Developer ecosystem / integrations: Slide 26 highlights engaged developers (36K) and large number of apps/integrations (222K), implying extensibility and network effects.
  • Feature parity and focus: Slide 25 competitive matrix shows Zendesk checked across multi-branding, chatbots, global availability, automatic ticket creation, structured content and personalization — positioning Zendesk as both focused and competitive with large incumbents.
  • Emphasis on being light, easy to configure, and quick to deploy (contrasted implicitly with heavy on-premise incumbents).

Team

Team credentials:

  • Slide 18 lists founders (text on slide): Mikkel Svane, Morten Primdahl and Alexander Aghassipour (presented as founders in the company overview).
  • The deck does not contain detailed bios or track records on the slide images provided, but it names the leadership and references an executive management composition in team slides elsewhere (team circular slide appears earlier in the larger template but not filled with detailed bios).

Go-to-Market Strategy

Distribution approach shown:

  • Product-led, self-serve + direct sales hybrid: product modularity (Support, Chat, Guide) and subscription pricing suggest self-service adoption, while tiered pricing and features (enterprise, integrations) imply an enterprise sales motion for upsell.
  • Channels emphasized: website live chat, multi-channel support (email, phone, social), developer marketplace/ ecosystem integrations (Slide 20–21, 26).
  • Slide 21 specifically calls out “Provides live chat solution and support companies to engage leads on websites” — implying customer acquisition via embedded web widget and direct inbound traction.

The Ask

  • Seed ask (as provided externally): $500K. The deck images shown do not include an explicit use-of-funds slide or breakdown of how the $500K would be allocated (hiring, product, sales/marketing, runway). Use-of-funds is therefore not visible in the slides provided.

Investor Deep Dive

Executive summary, strengths & red flags

Executive Summary

This deck presents Zendesk as a focused, product-led SaaS solution for customer support and engagement. It emphasizes a simple, multi-channel support product (email, chat, voice, self‑service), early traction (rapidly rising revenues/customers shown in later slides), and a subscription pricing model — all packaged in a concise investor-facing narrative. The deck is notable for presenting clear product features, competitive differentiation, and early business metrics that presage strong growth.

Key Strengths

3 identified

1

Clear product focus and modular architecture — slides 20–21 concisely show product modules (Support, Chat, Talk, Guide, Explore, Connect), making it easy for investors to understand the offering and expansion path.

2

Early measurable traction — revenue chart (Slide 22) and customer growth (Slide 23) present quantitative growth signals that support the business model and market demand narrative.

3

Developer/ecosystem play — Slide 26’s developer and integrations metrics signal network effects and third-party extensibility, an important value driver for scaling SaaS platforms.

Red Flags & Weaknesses

3 identified

1

Missing explicit TAM/SAM/SOM methodology — while the deck shows large user and revenue figures, it lacks a formal market sizing slide with sourcing and assumptions, which an investor would expect to justify long-term opportunity.

2

No explicit unit economics or CAC/LTV — the deck provides top-line revenue and pricing but omits customer acquisition costs, churn, gross margin, ARPU by cohort, or payback period — critical metrics for scaling SaaS investors.

3

Ask and use-of-funds not detailed — the seed amount is known ($500K) but the deck does not show a capital allocation plan, milestones to be achieved with the raise, or runway projection tied to the funds.

More Pitch Decks To Study

Compare structure, fundraising context, and investor-facing story across similar startup decks.