Compare your deck to Waze

Compare Your Deck

Waze Pitch Deck (2010)

Consumer
Stage: Various
Raised: $67M total
Year: 2010
Slides: 14
Outcome: Acquired by Google for $1.3B

Pitch Deck

1 / 14
Waze pitch deck - Opening: Proof of scale and engagement
Click to expand

Deck Analysis

This pitch deck from Waze (2010 era) presents a location- and drive-based advertising product built on behavioral navigation data. It opens with user metrics to establish reach, then demonstrates a product that converts real-world movement into targeted ad opportunities (in-car, search, and OOH tie-ins). Notable elements are the early emphasis on measurable, context-aware ad formats and the concrete integration with the broader Google Ads ecosystem — a combination that helped make Waze attractive to acquirers and advertisers.

Opening: Proof of scale and engagement

Opening: Proof of scale and engagement

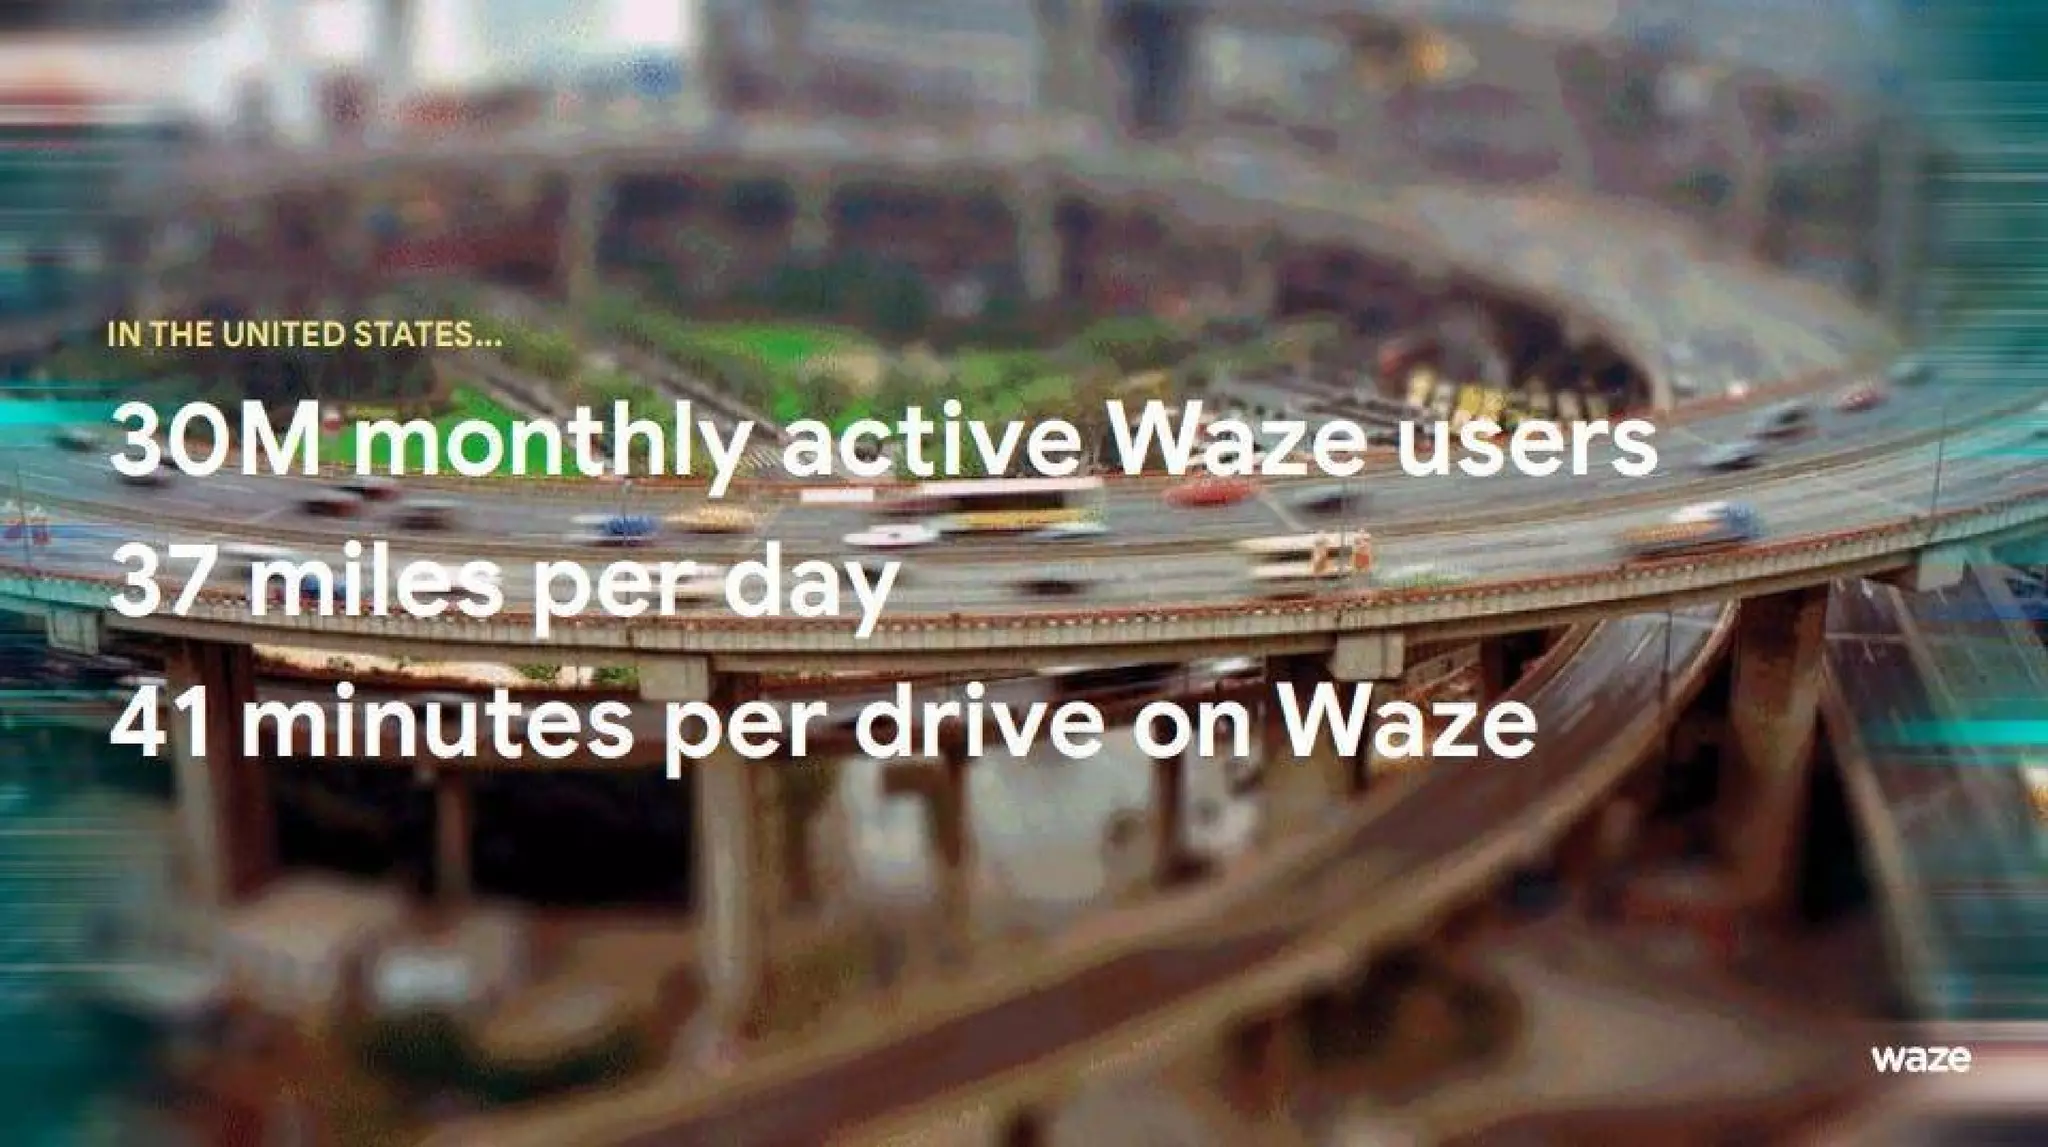
Slide 1 leads with clear, high-level user metrics: monthly active users, average miles driven per day, and minutes per drive. The visual (a busy highway photo) plus large typography telegraphs attention and relevance — advertisers immediately see that Waze is not a niche app but a high-frequency, long-duration platform. This is effective because it answers the first investor question: do you have audience scale and engagement?

Beyond the numbers, the slide implicitly sells the value proposition to advertisers (frequent, extended sessions in cars). Founders can learn from the slide’s prioritization: put your most compelling traction metrics up front and frame them in a way that ties directly to buyer value (advertisers in this case). Keep copy minimal and let a bold visual support the headline metrics.
Key Takeaway: Lead with a few high-impact, context-relevant metrics that directly map to buyer value — make scale and engagement the first thing investors see.
Product differentiation: What the product knows

Product differentiation: What the product knows

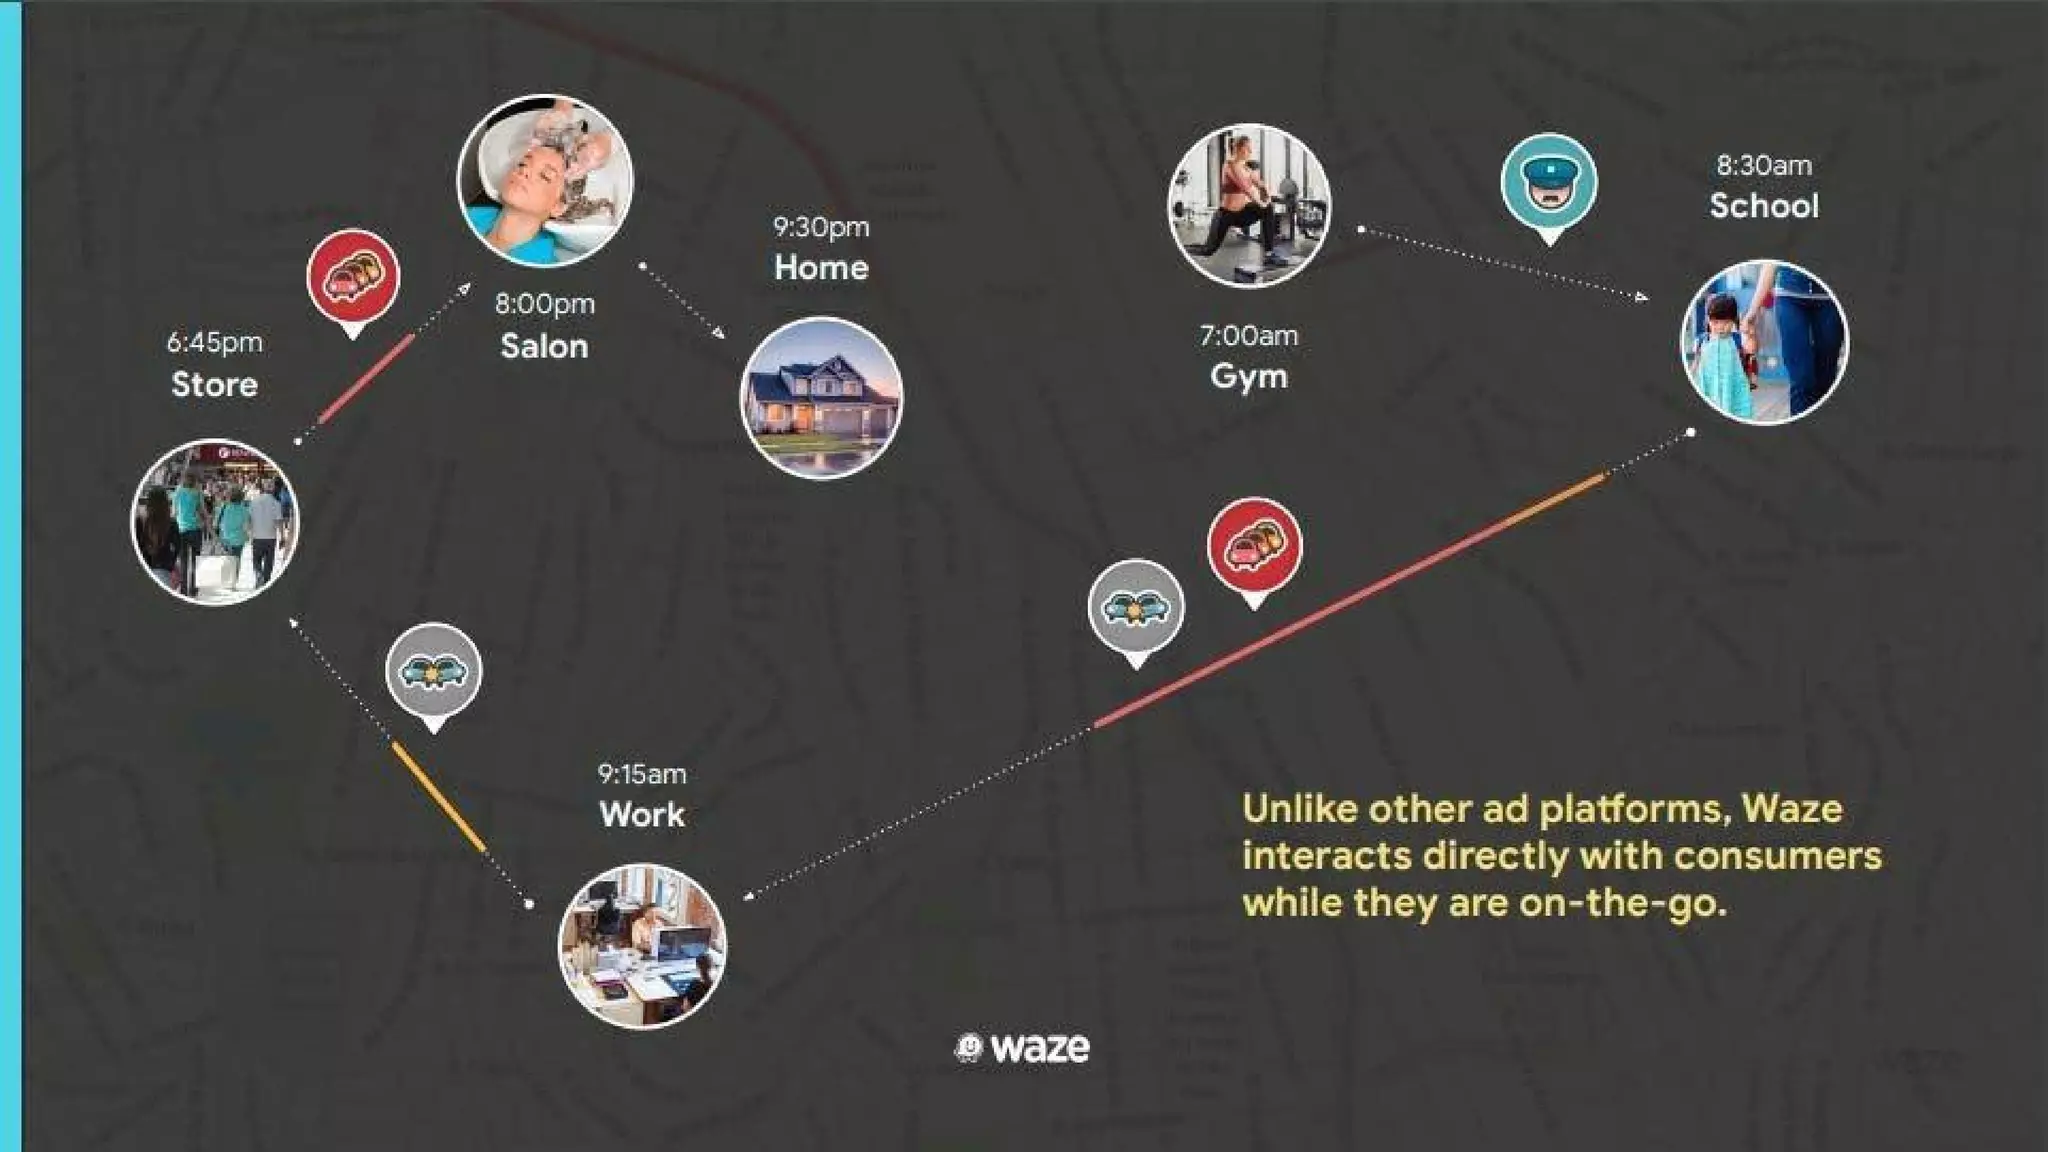
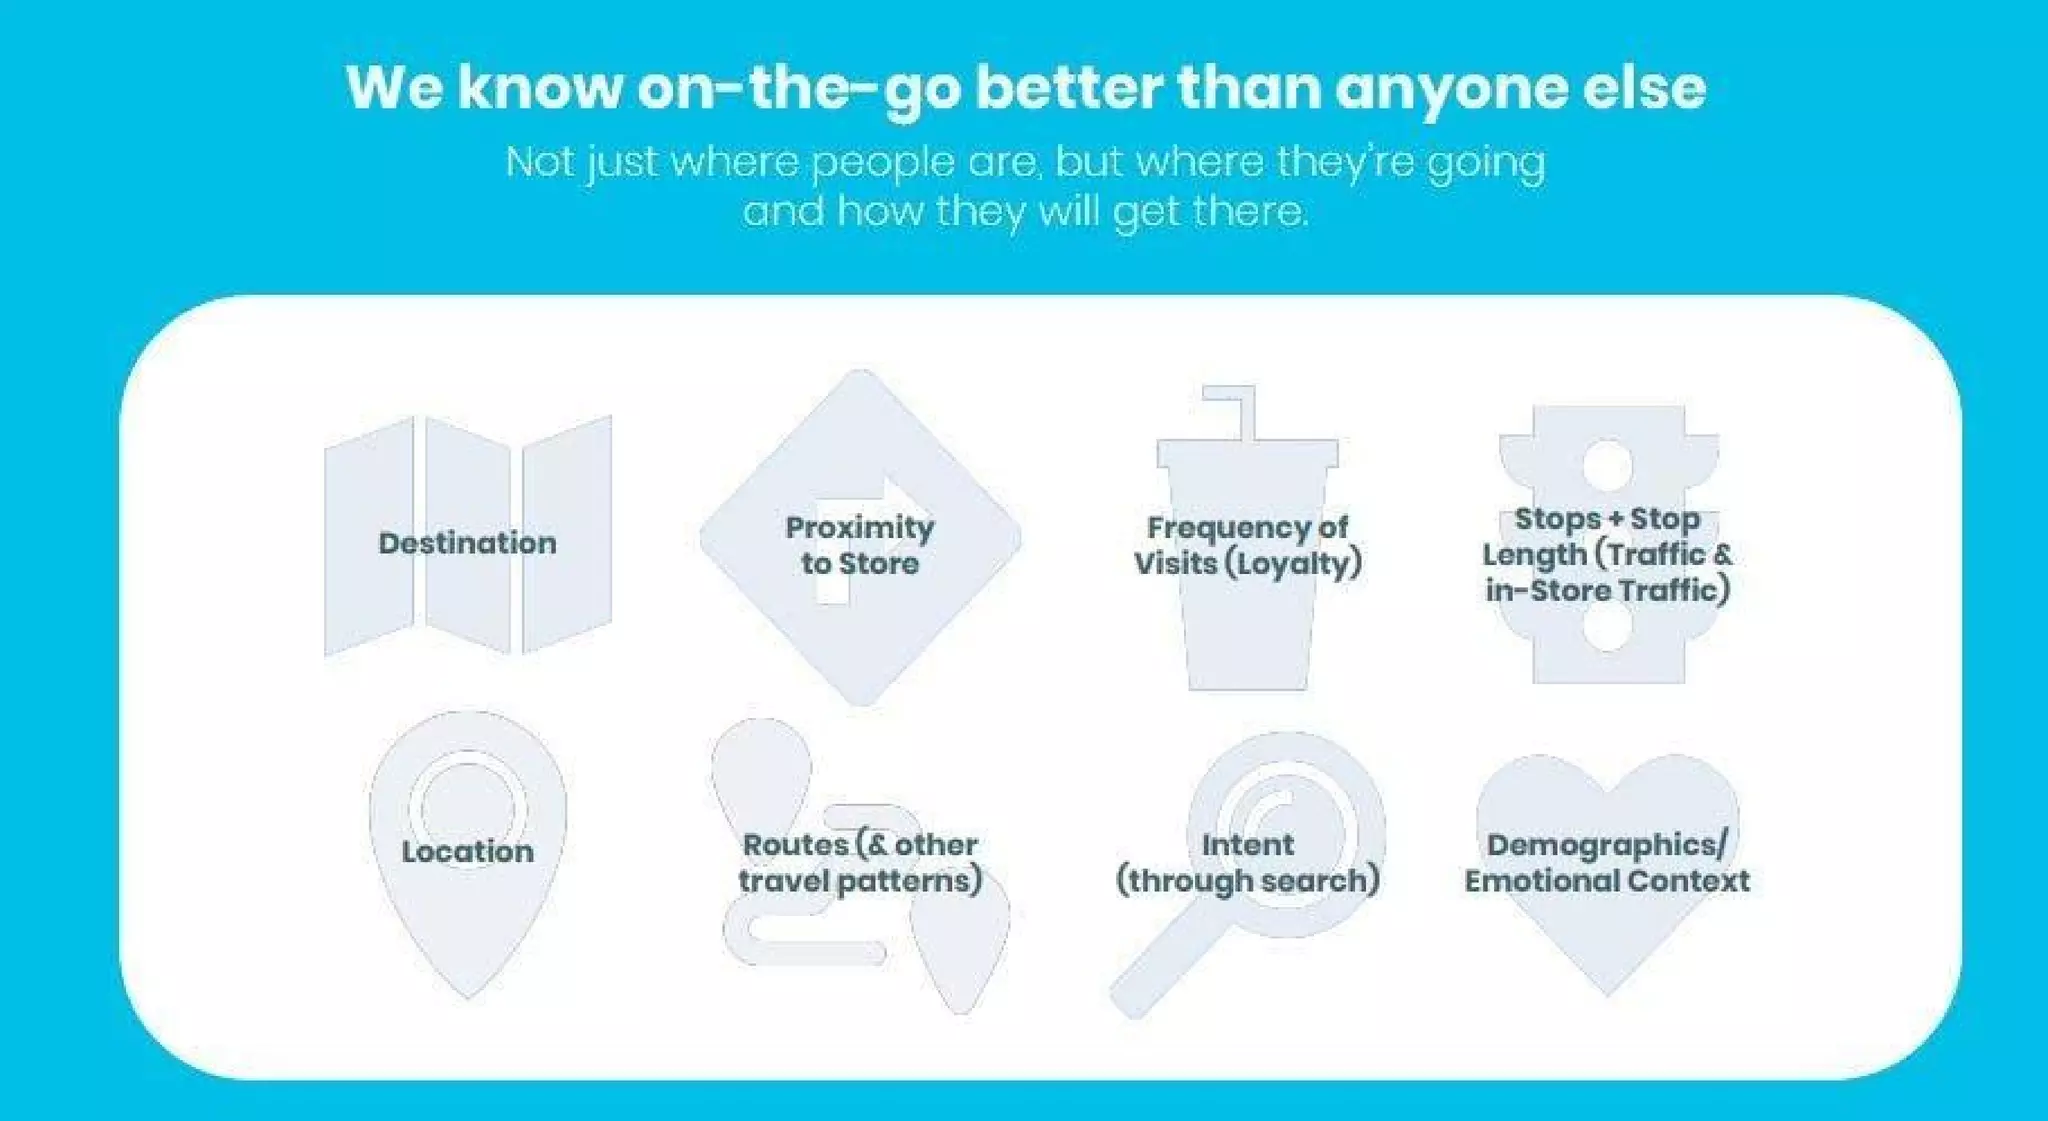
Slide 2 breaks down the unique data assets Waze captures — destination, proximity, frequency of visits, stop length, routes, intent, and even emotional/demographic context. This cataloging of capabilities is a smart move: it translates raw telemetry into advertising signals that buyers understand. Instead of just saying 'we have location data,' Waze maps raw signals to commercial use cases like loyalty measurement and in-store traffic.

For founders, the lesson is to translate technical capabilities into buyer-facing signals. A list of 'what we know' accompanied by short labels shows product depth without overwhelming the reader. It’s also a pre-emptive answer to privacy/utility questions — demonstrating useful, aggregated signals rather than exposing raw location traces.

Key Takeaway: Convert technical data advantages into clear commercial signals (e.g., intent, dwell, loyalty) so customers and investors immediately see monetizable value.
Strategic positioning: Integrating into a larger ad ecosystem

Strategic positioning: Integrating into a larger ad ecosystem

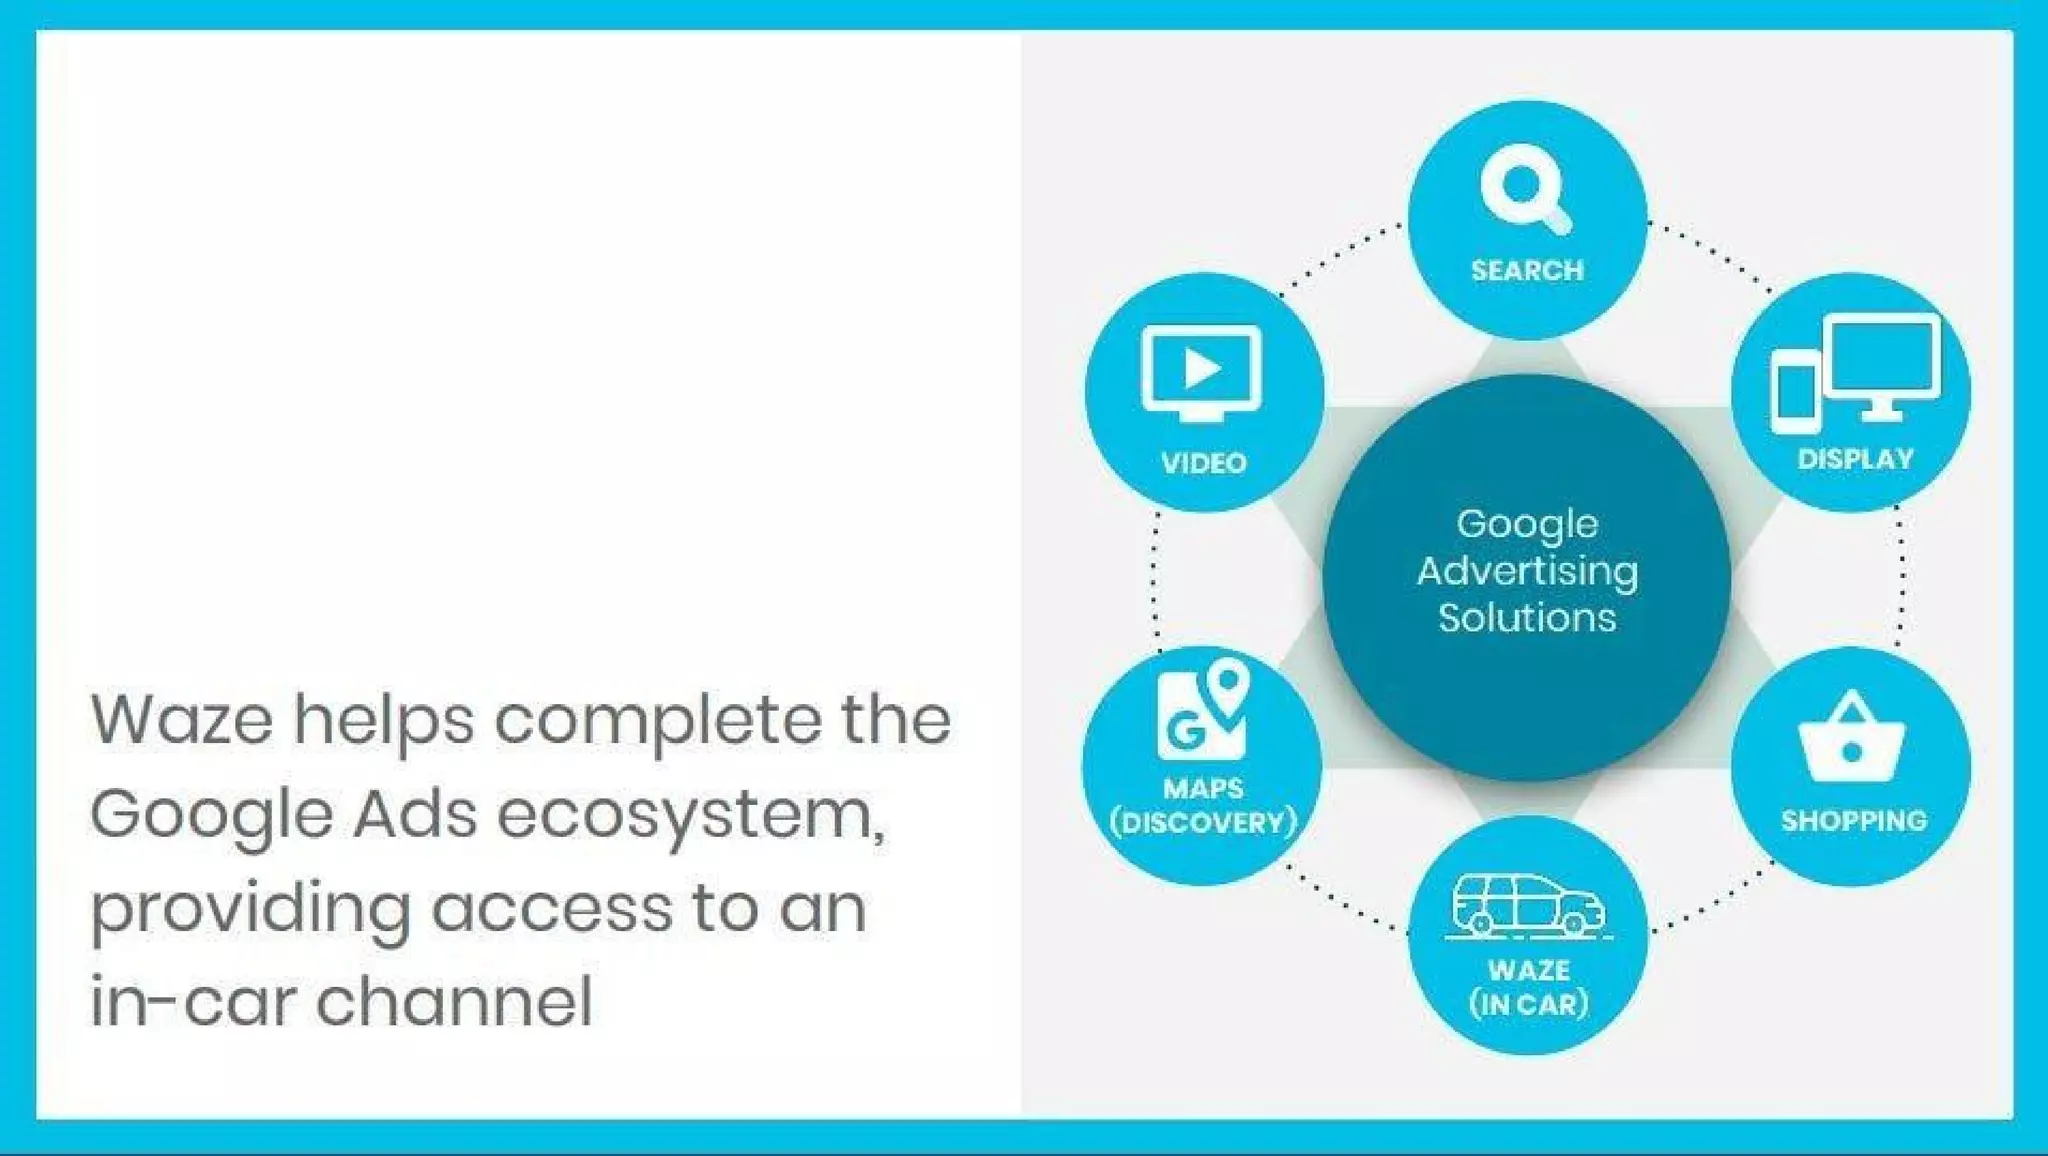
Slide 3 positions Waze as a complementary channel within the Google Ads ecosystem (search, display, video, shopping, maps). This is an important strategic narrative: rather than competing with existing ad channels, Waze fills a distinct in-car, real-time niche. That framing makes the business more defensible and attractive to strategic partners — and helps explain acquisition rationale.

Founders should note how packaging your product as an ecosystem component reduces 'build vs. buy' friction for potential partners and acquirers. The slide visually depicts adjacency to other channels, which simplifies the conversation for marketers looking to plug Waze into omni-channel plans.

Key Takeaway: Frame your product as a complementary, integratable piece of a buyer’s ecosystem to increase strategic appeal and lower adoption friction.
Targeting and timing: Drive-based contextual ads

Targeting and timing: Drive-based contextual ads

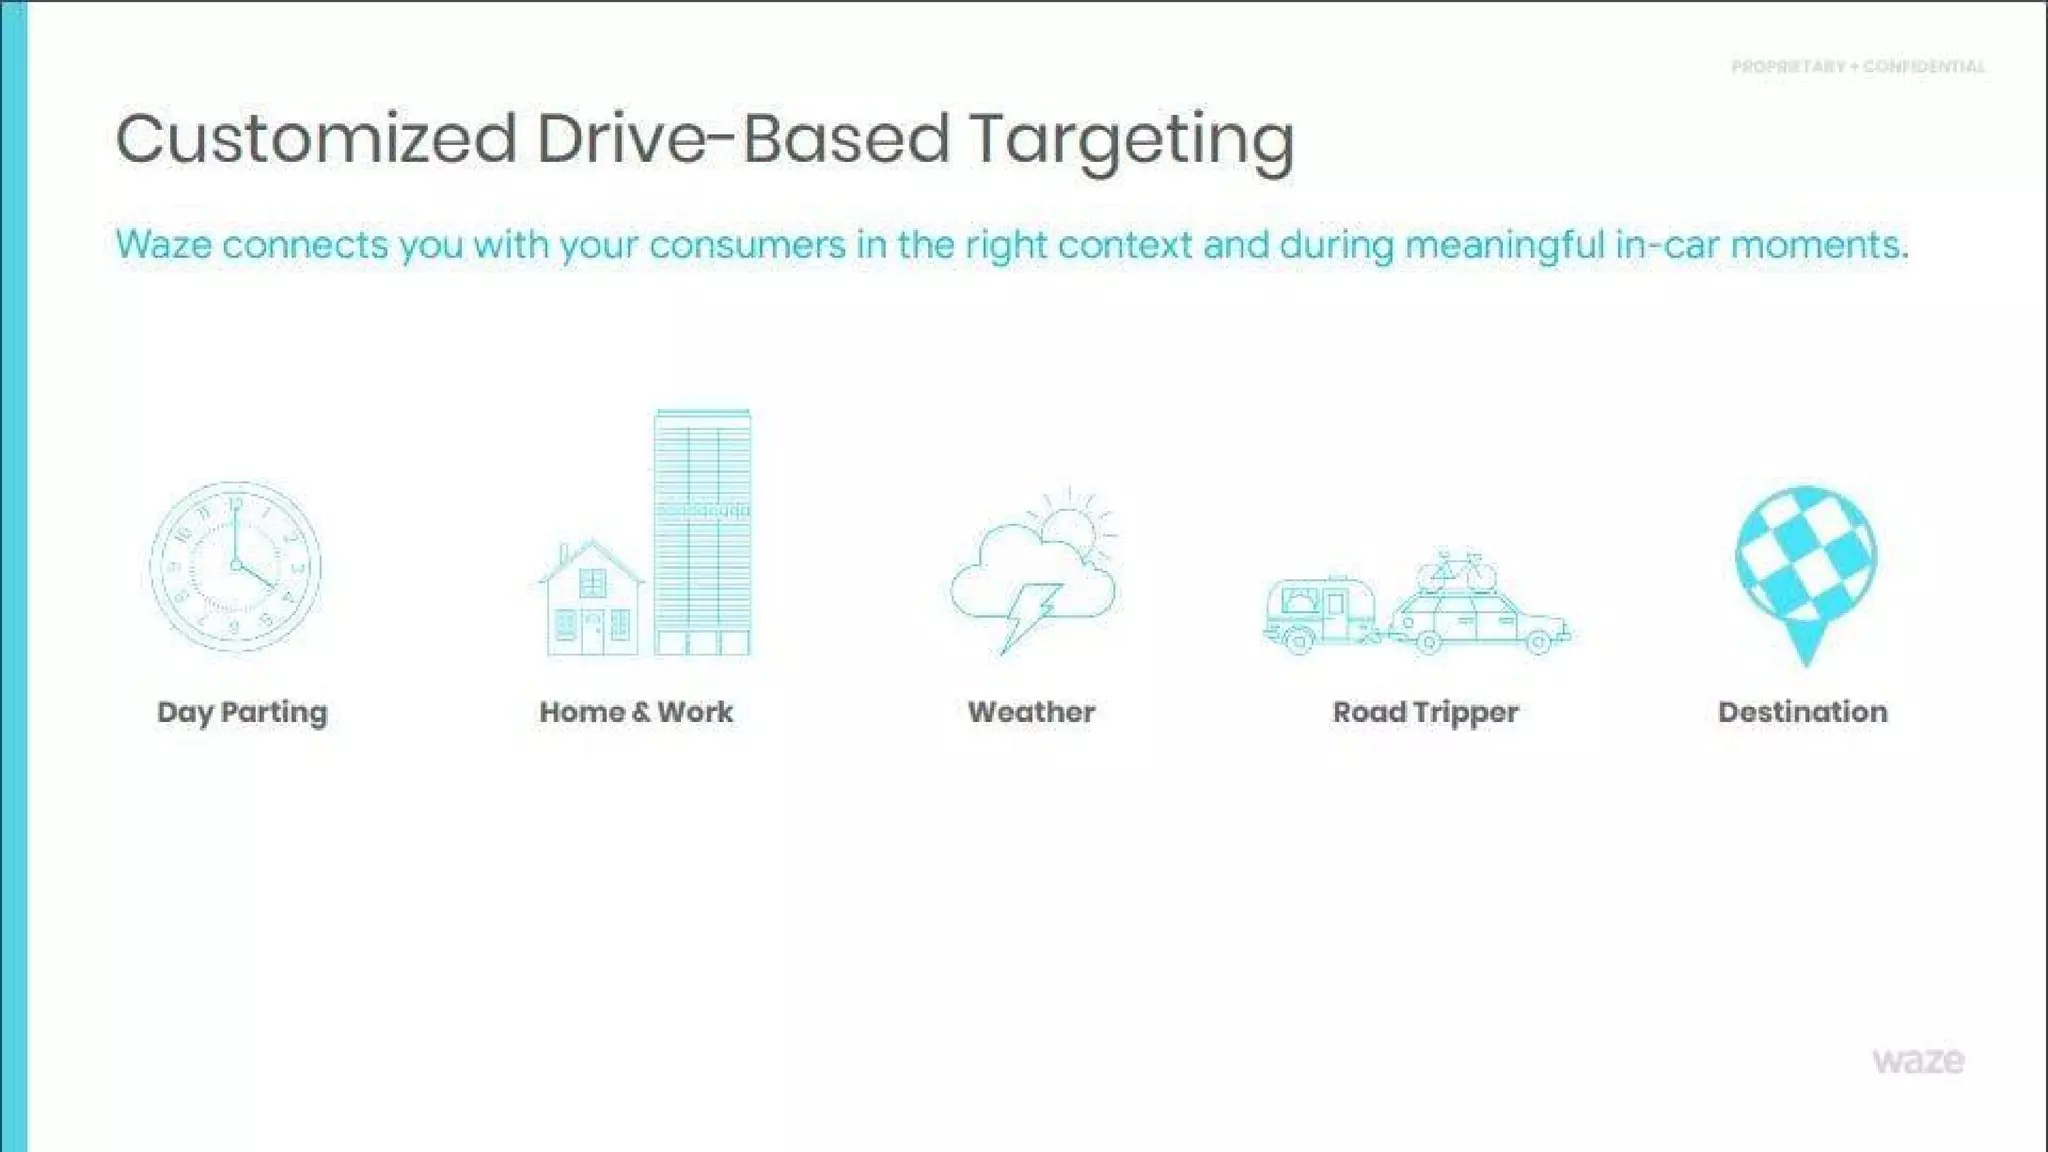
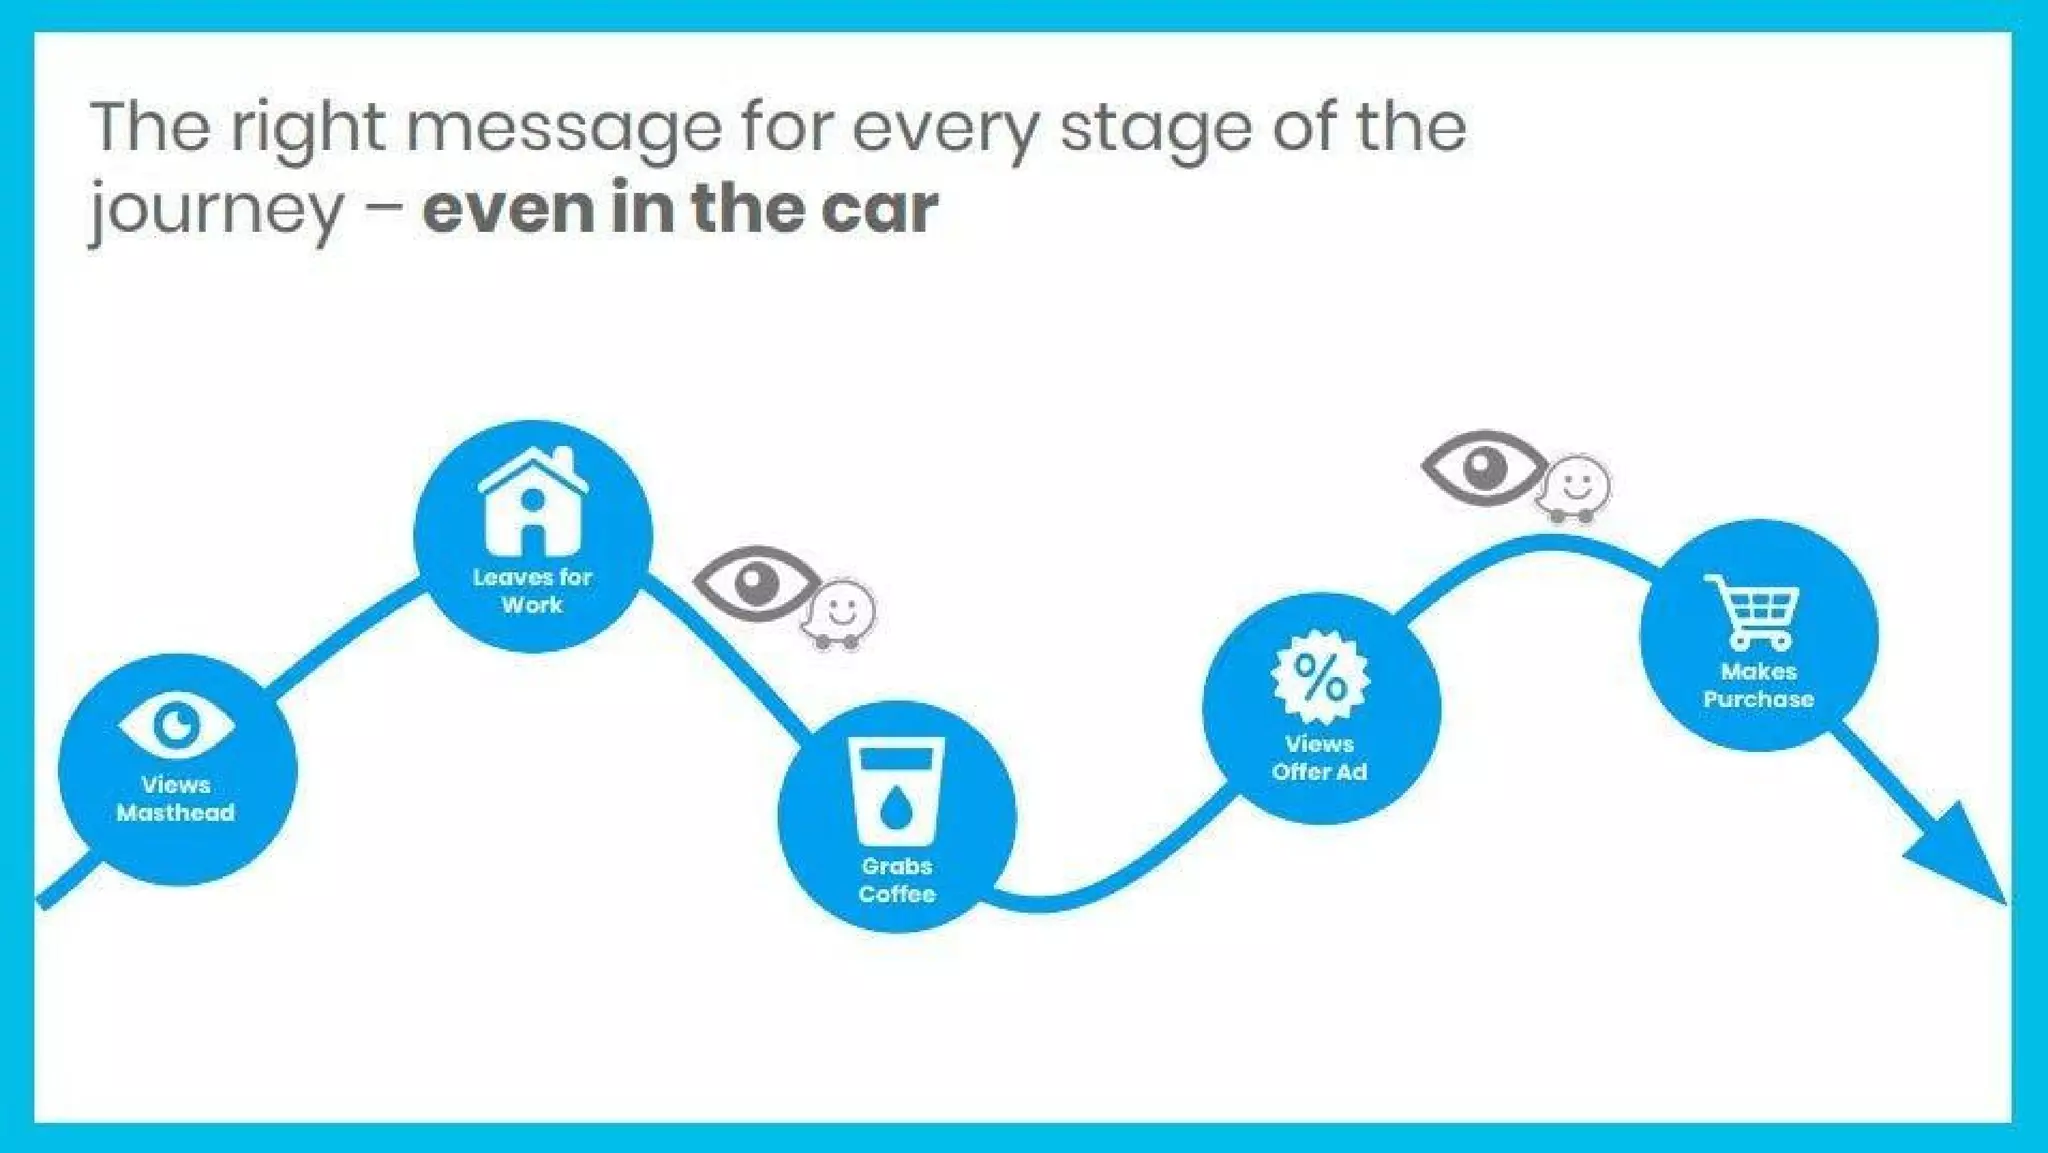
Slide 6 (Customized Drive-Based Targeting) shows how Waze turns contextual moments — dayparting, home & work, weather, road trips, destination — into targeting layers. The visual simplicity communicates a nuanced capability: targeting isn't just geographic, it's journey-based and time-aware. This demonstrates product sophistication while keeping it accessible to non-technical advertisers.

This approach is instructive: successful ad products often win by marrying signal richness with simple, campaign-ready targeting primitives (time of day, trip type, destination). Founders should aim to expose complex models through intuitive knobs so buyers can plan campaigns without deep technical integration.

Key Takeaway: Expose complex contextual targeting through straightforward, campaign-ready primitives (time of day, trip type, destination) so advertisers can act quickly.
Offline + online synergy: OOH innovation and the Zero-Speed Takeover

Offline + online synergy: OOH innovation and the Zero-Speed Takeover

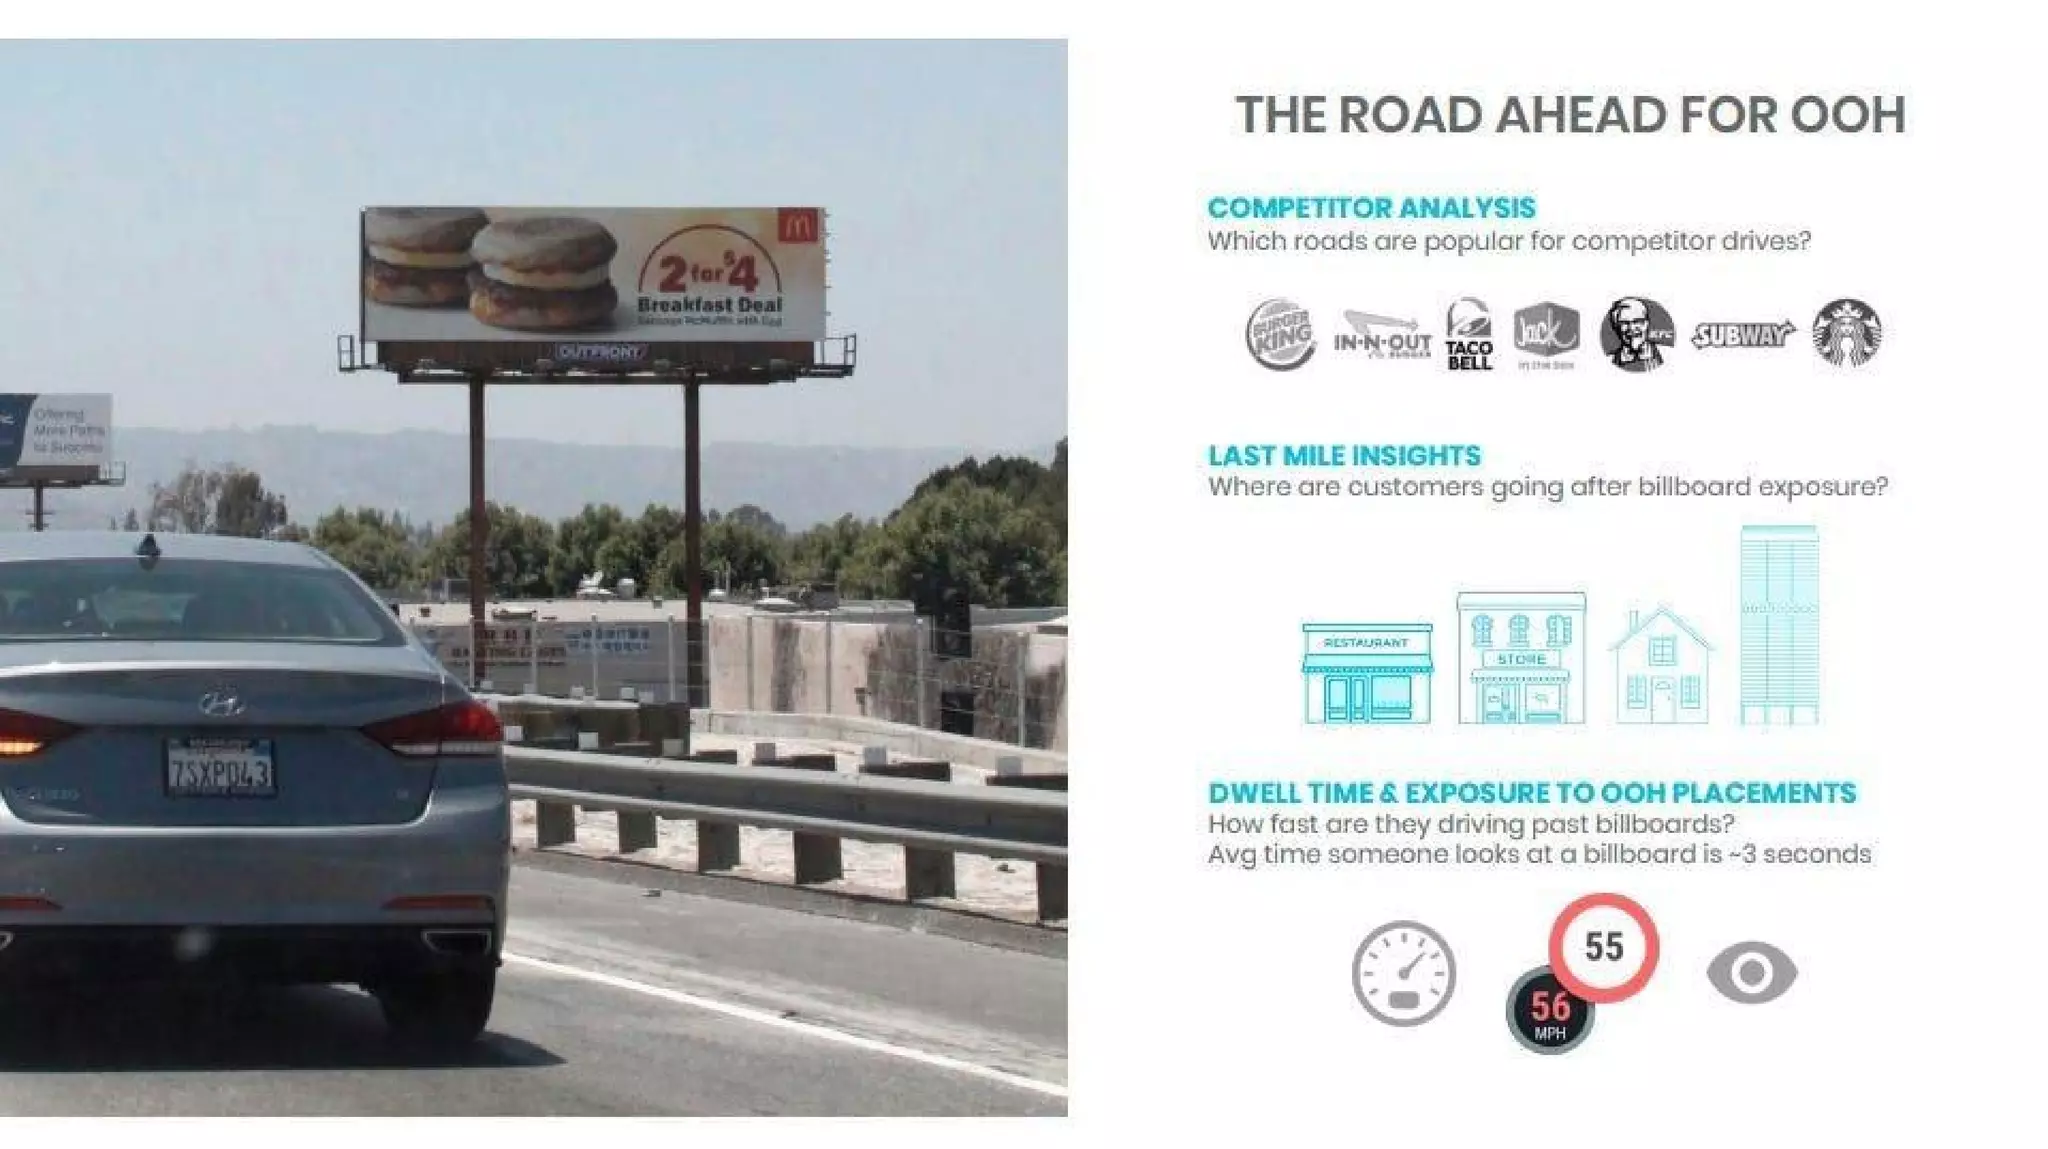
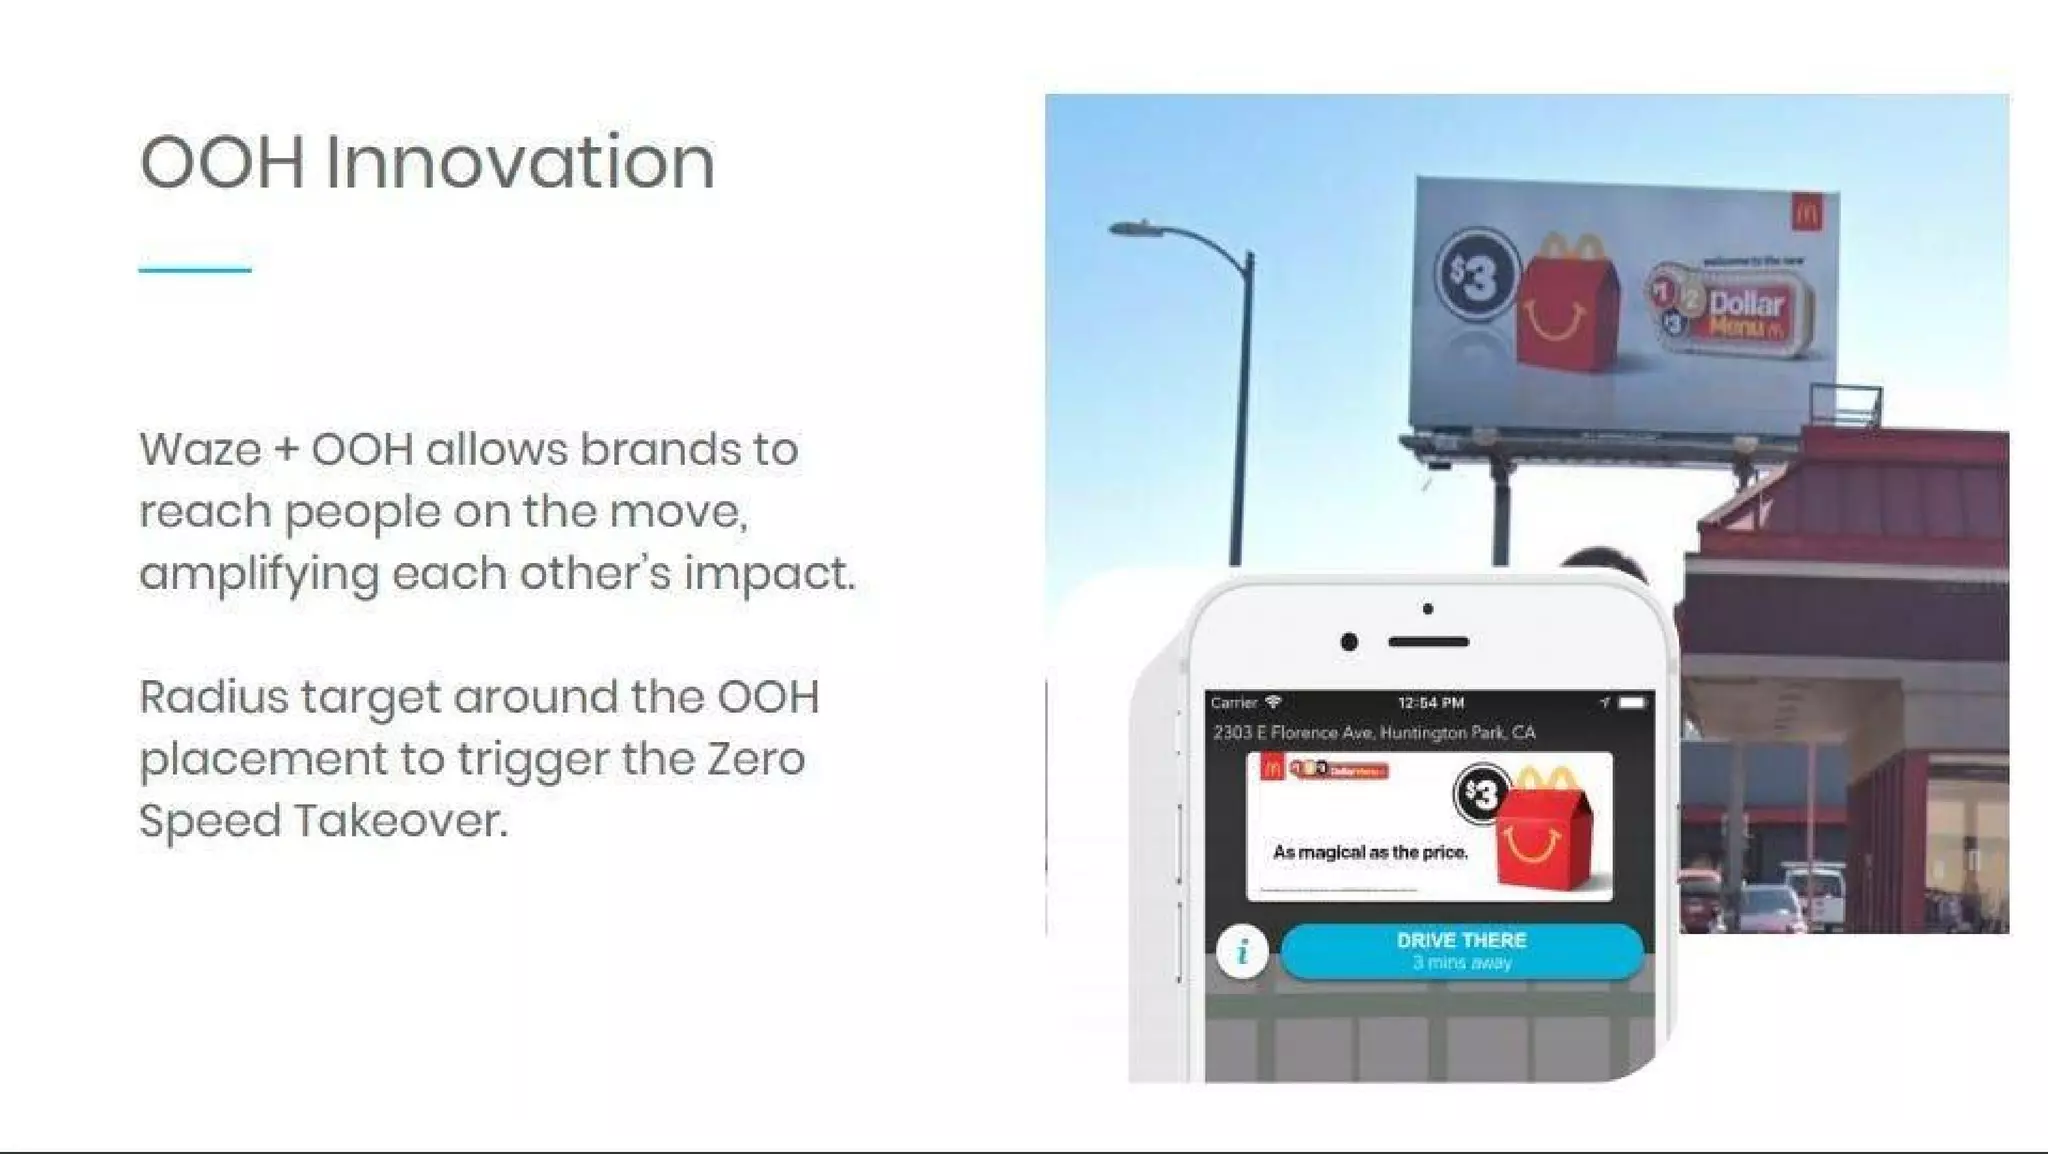
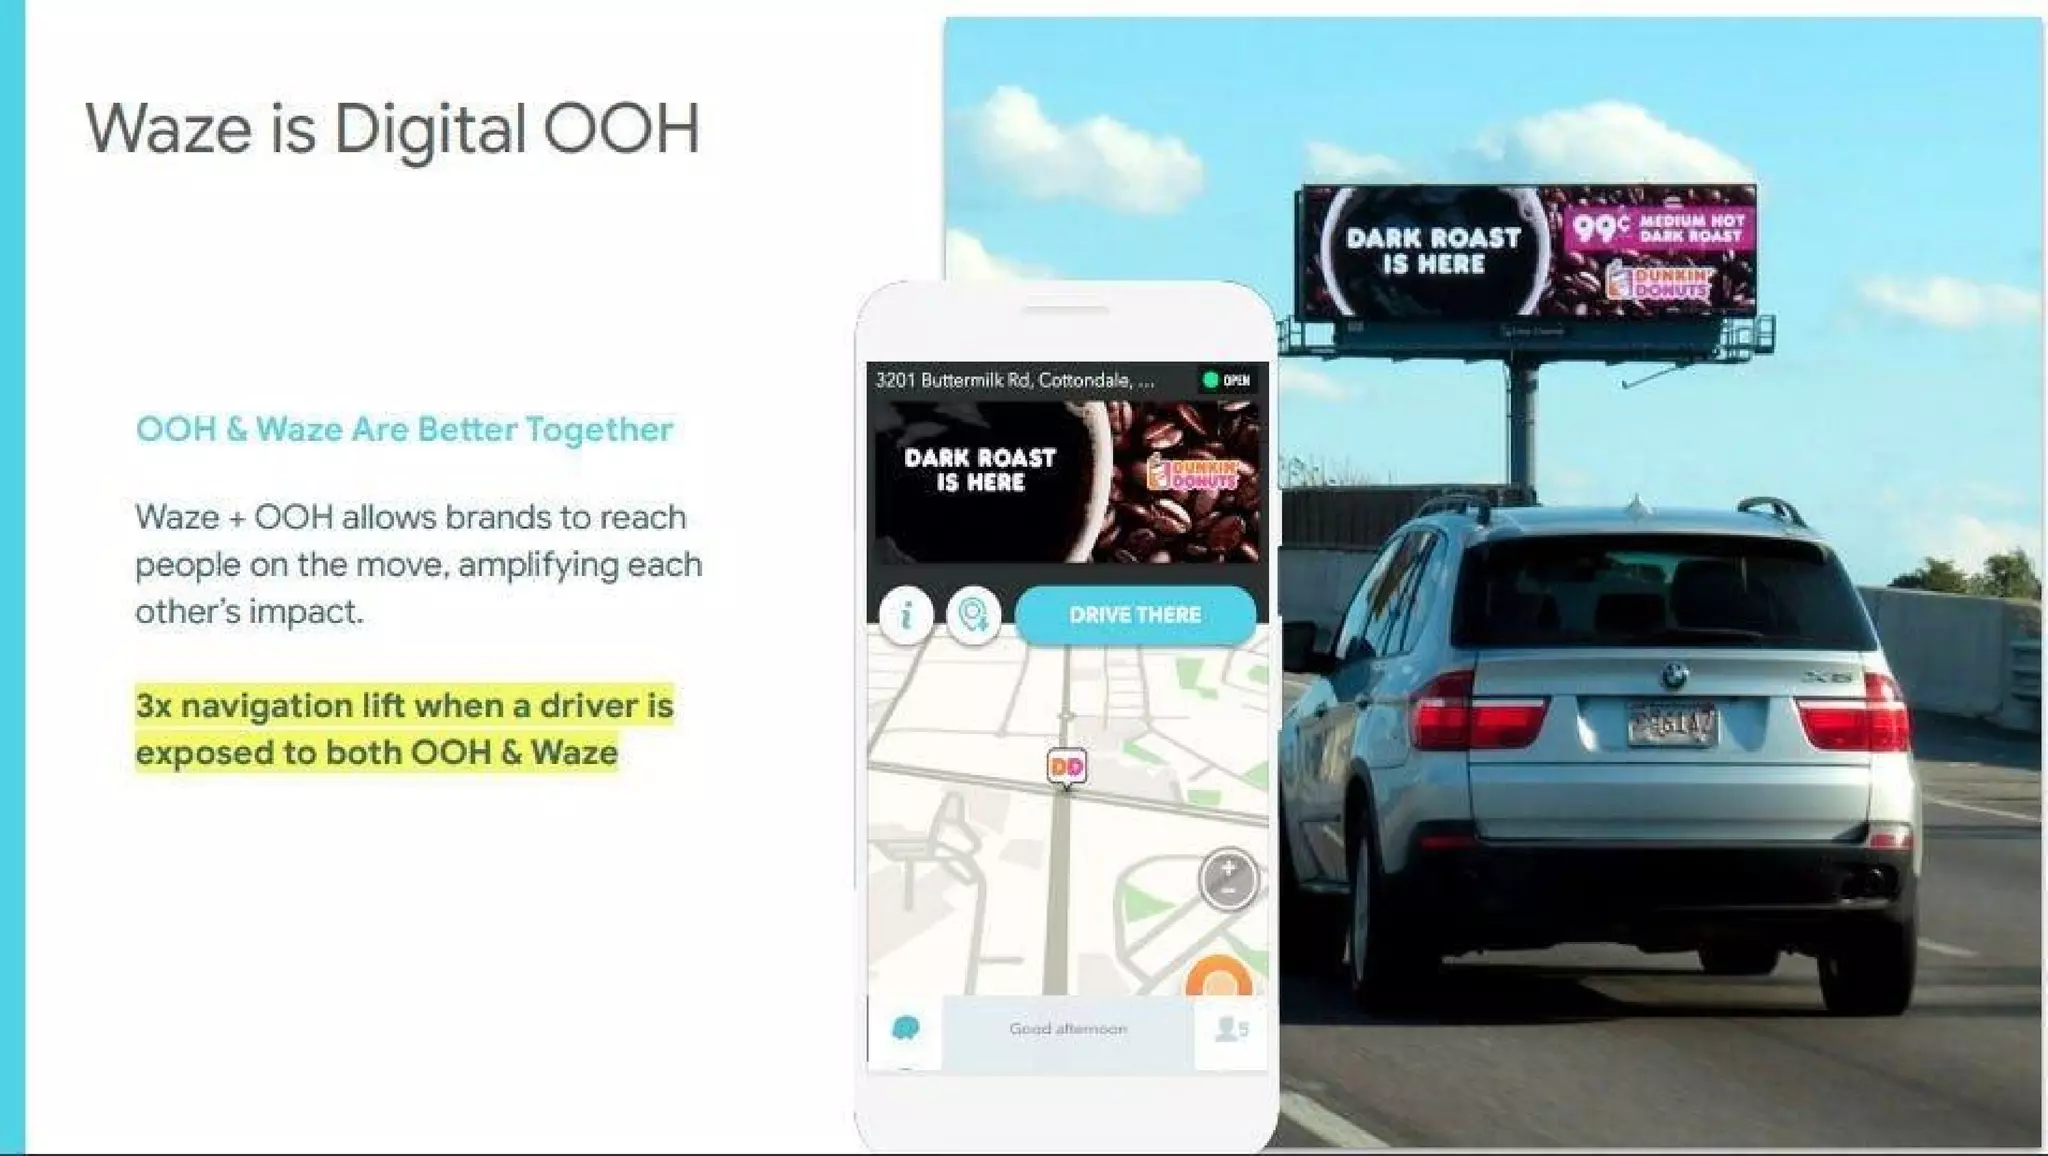
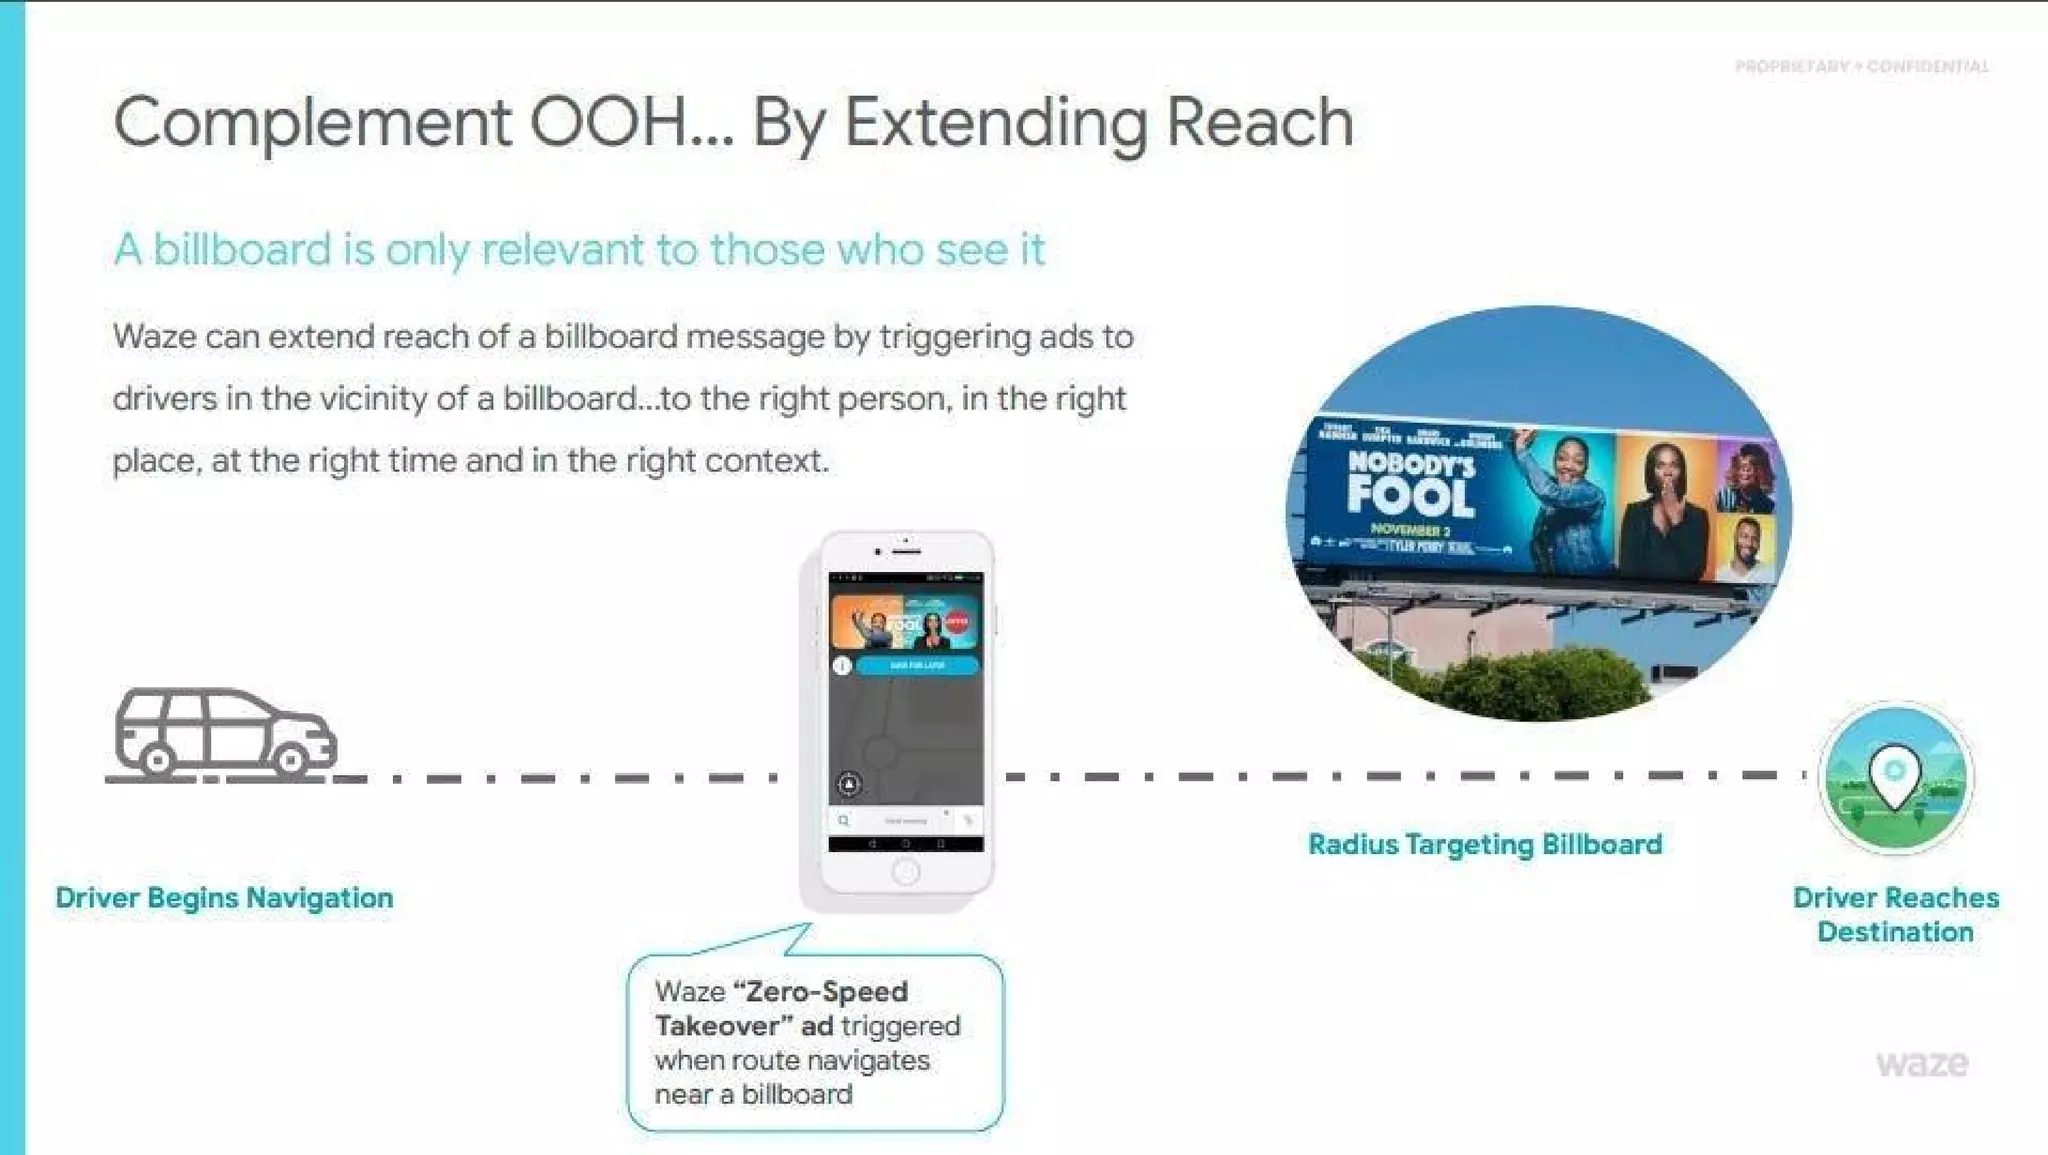
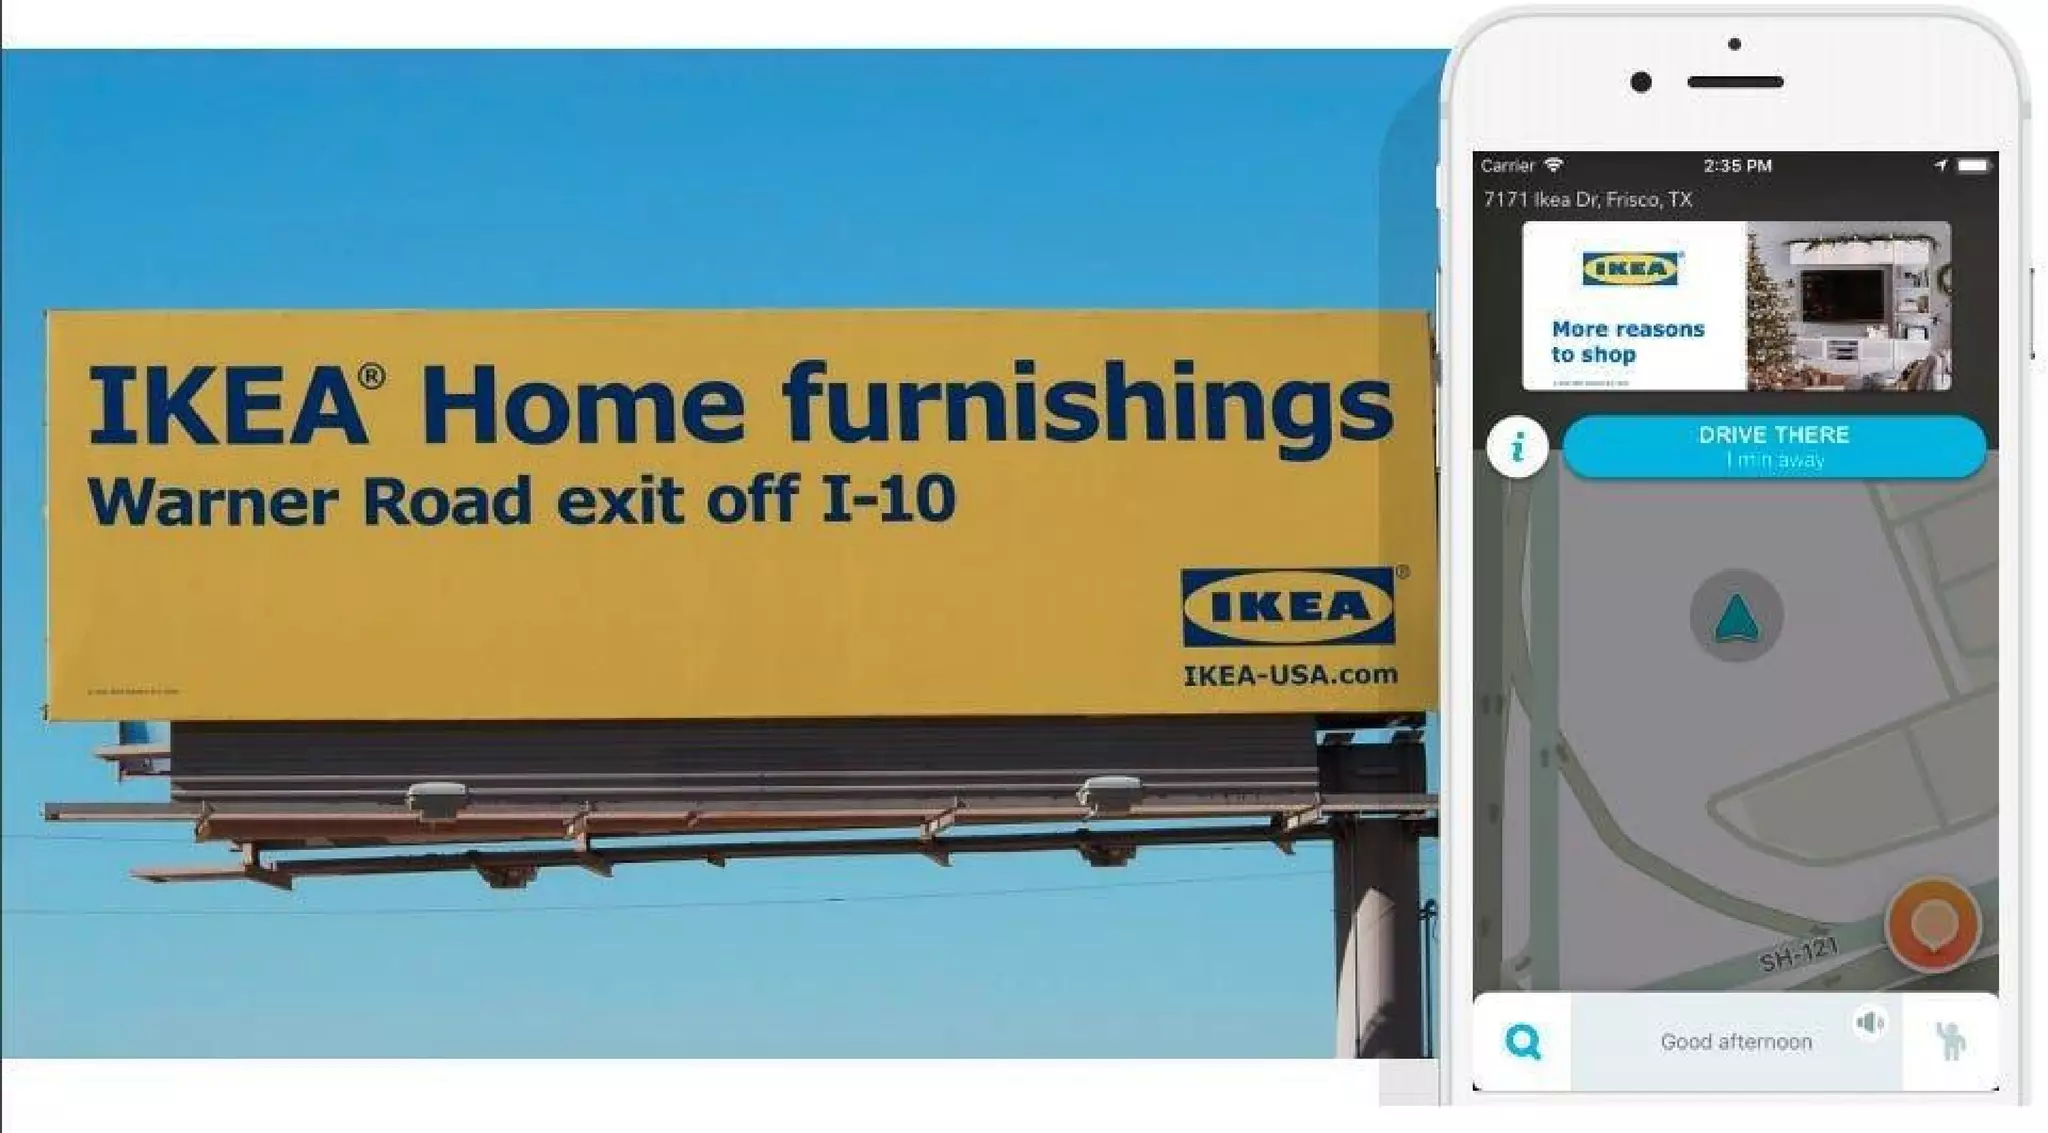
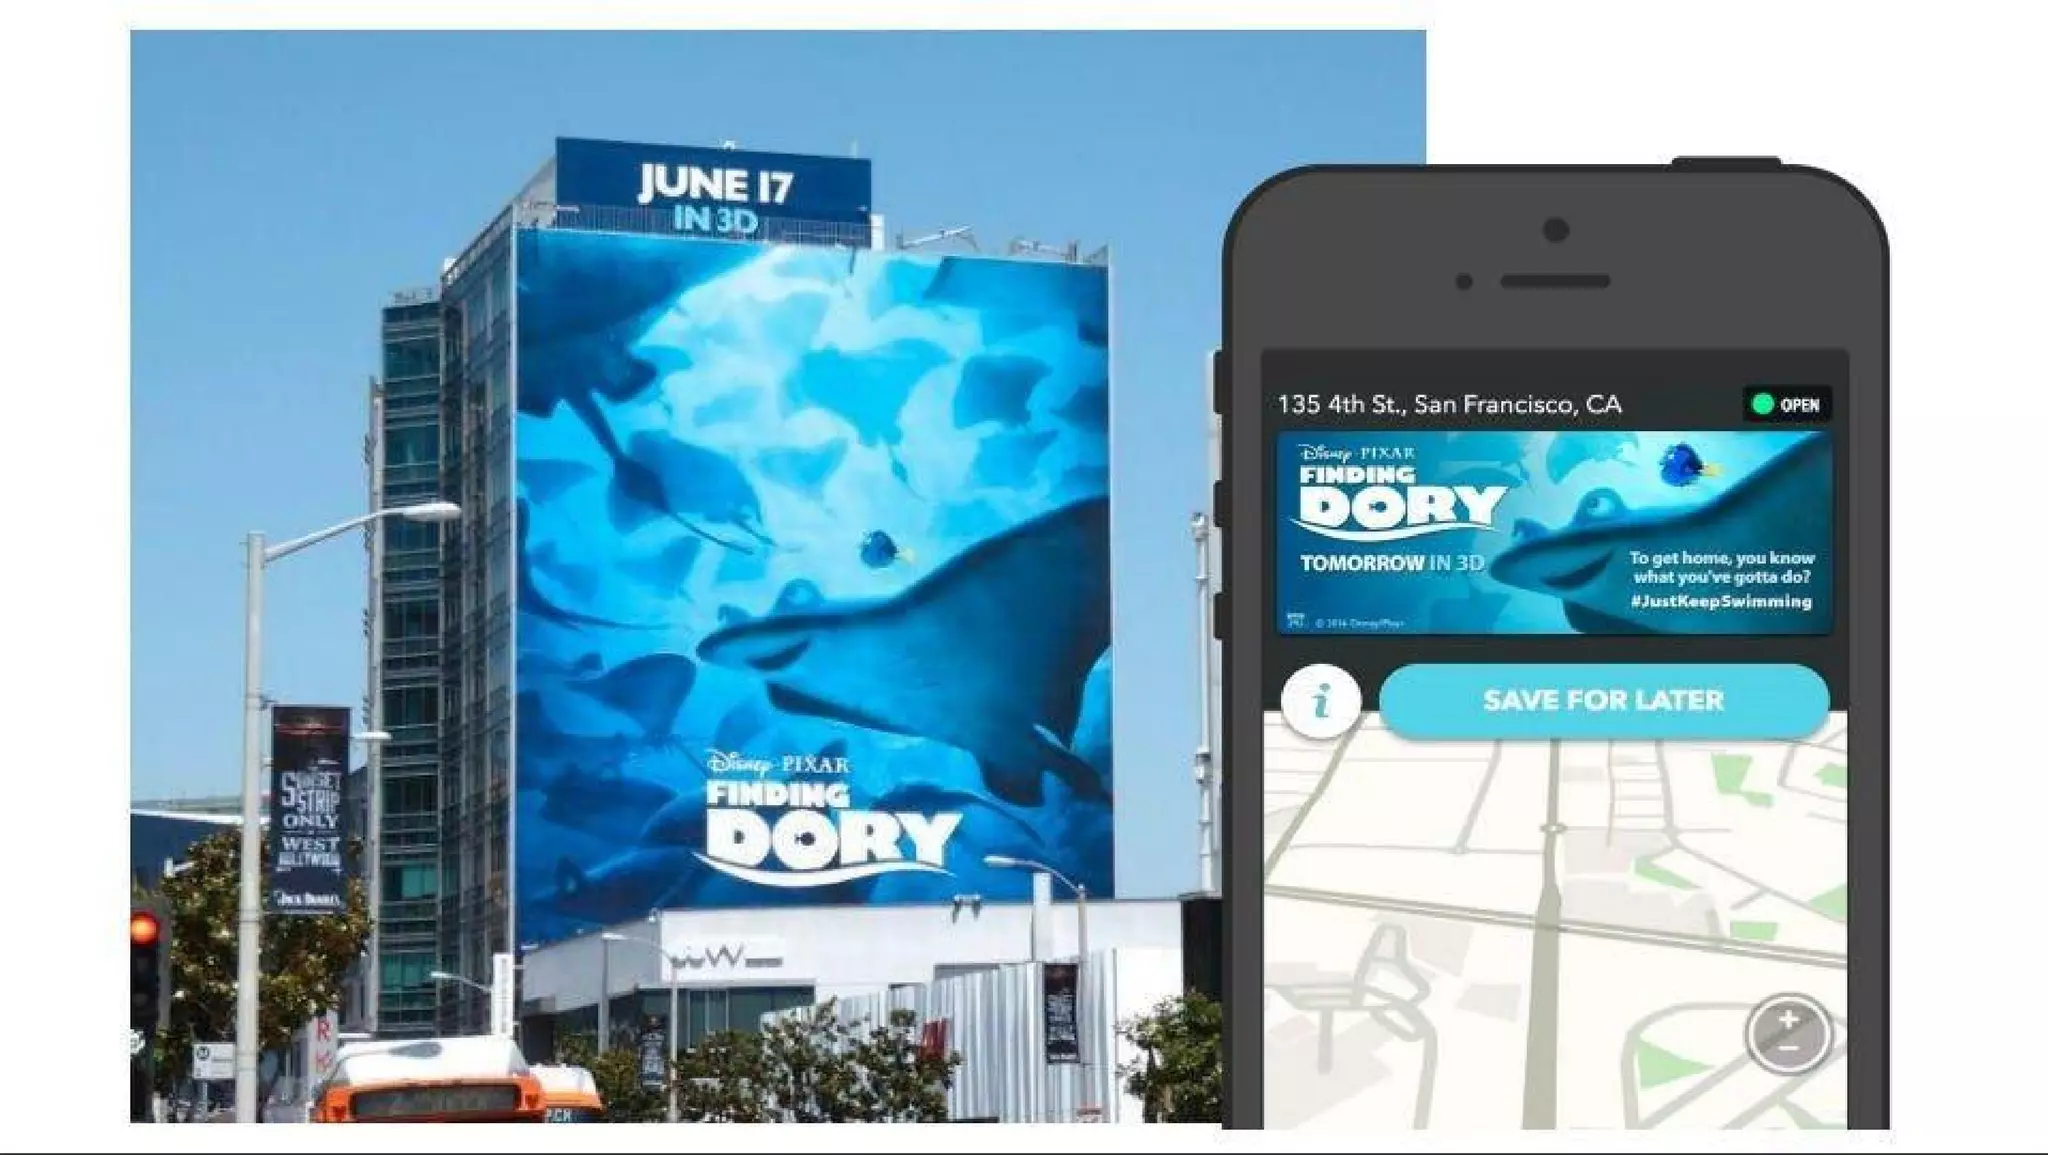
Slide 8 and related OOH slides present a compelling hybrid: outdoor billboards trigger in-app 'Zero-Speed Takeover' ads when drivers come within a radius of the placement. This unites traditional OOH exposure with measurable digital follow-up, addressing a key limitation of billboards (hard-to-measure impact). The deck uses real creative mockups (McDonald’s, IKEA, Finding Dory) which helps advertisers visualize cross-channel campaigns and outcomes.

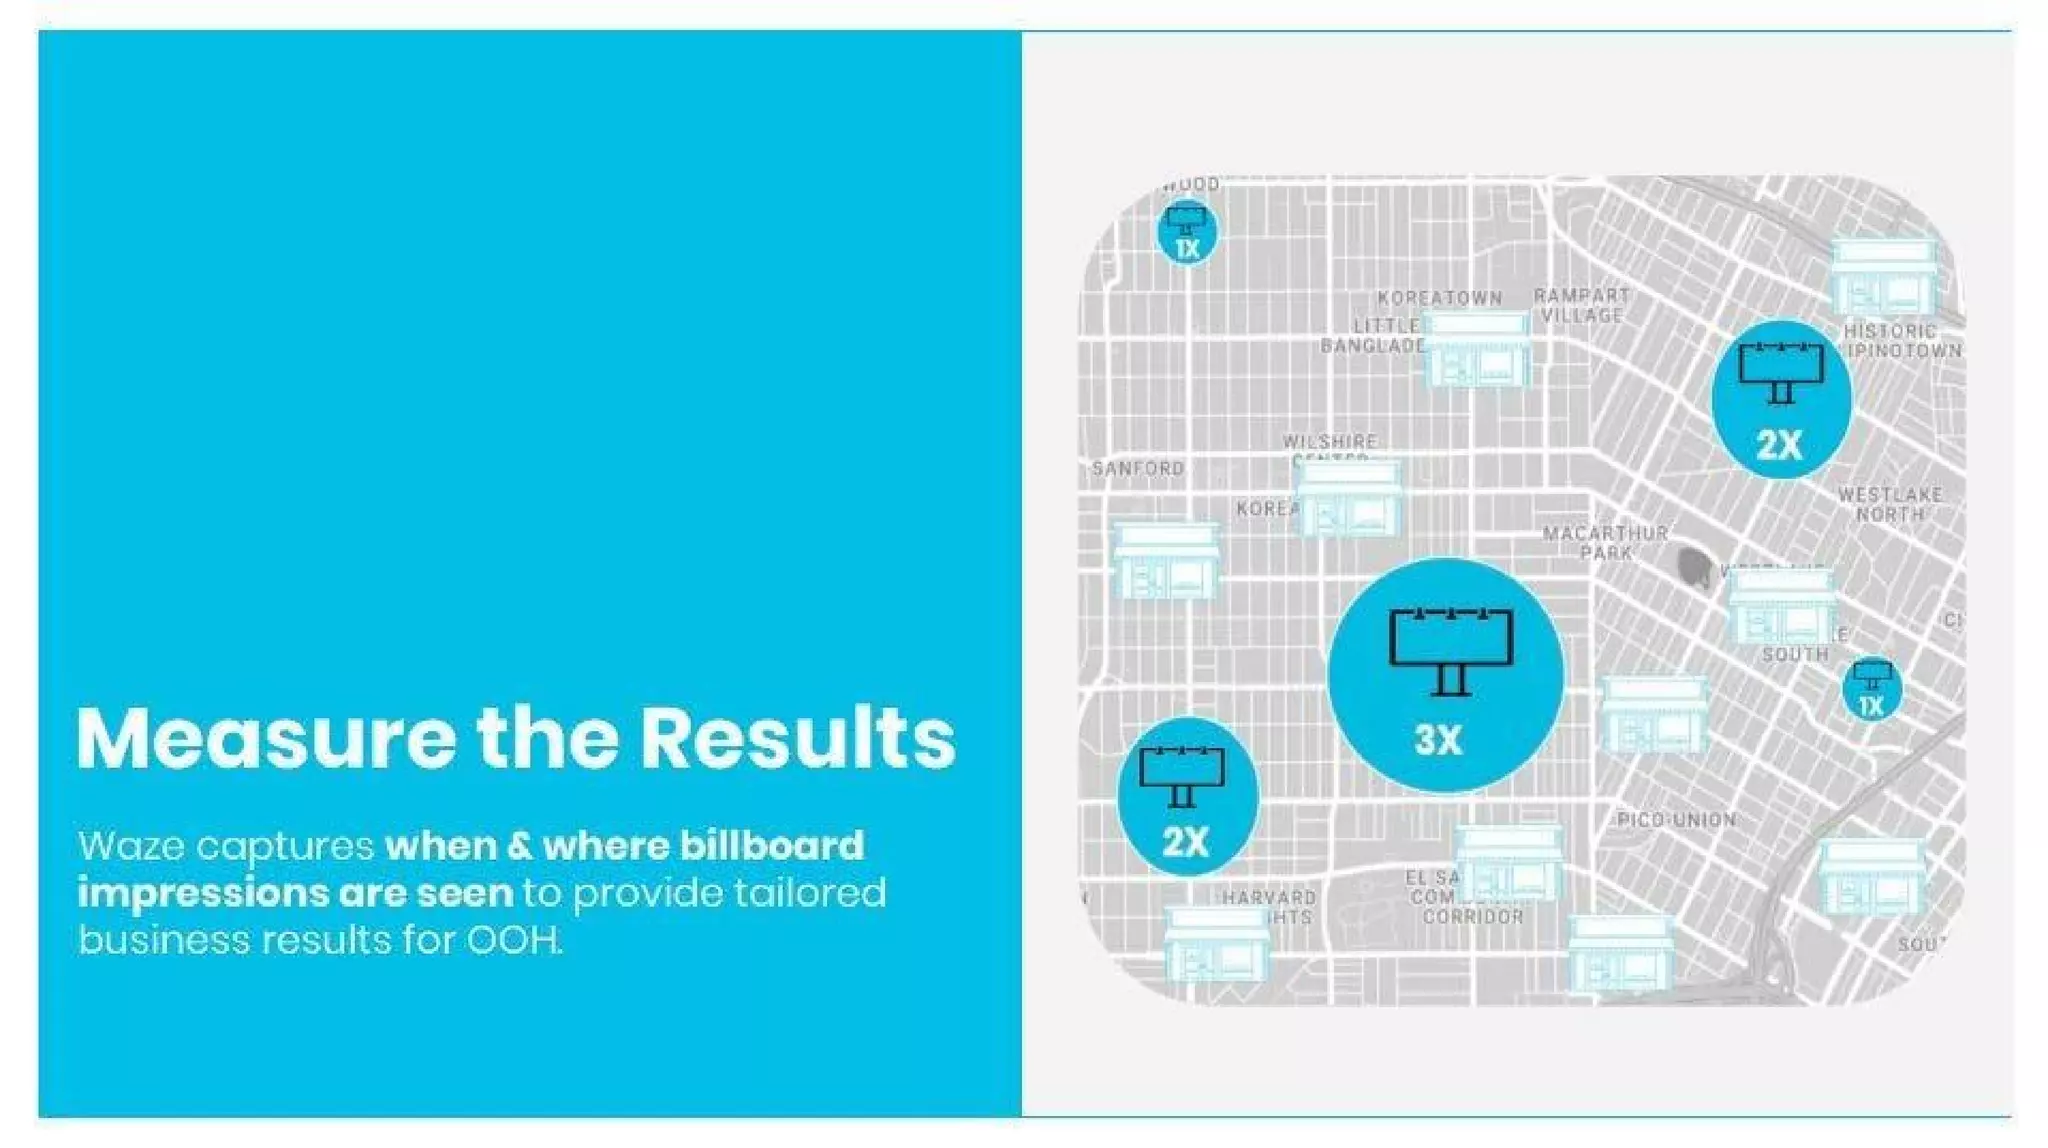
The takeaway for founders is twofold: first, combine offline assets with digital measurement to create unique, defensible products; second, use concrete examples and visuals to make abstract integrations tangible to buyers. Demonstrating measurable lifts (e.g., navigation lift when exposed to OOH + Waze) turns a product into a clear ROI story rather than a speculative technology play.

Key Takeaway: Pair offline inventory with digital triggers and measurable outcomes to create differentiated, ROI-oriented ad products that bridge legacy and programmatic channels.
Go-to-market: Core ad formats and buyer-facing executions

Go-to-market: Core ad formats and buyer-facing executions

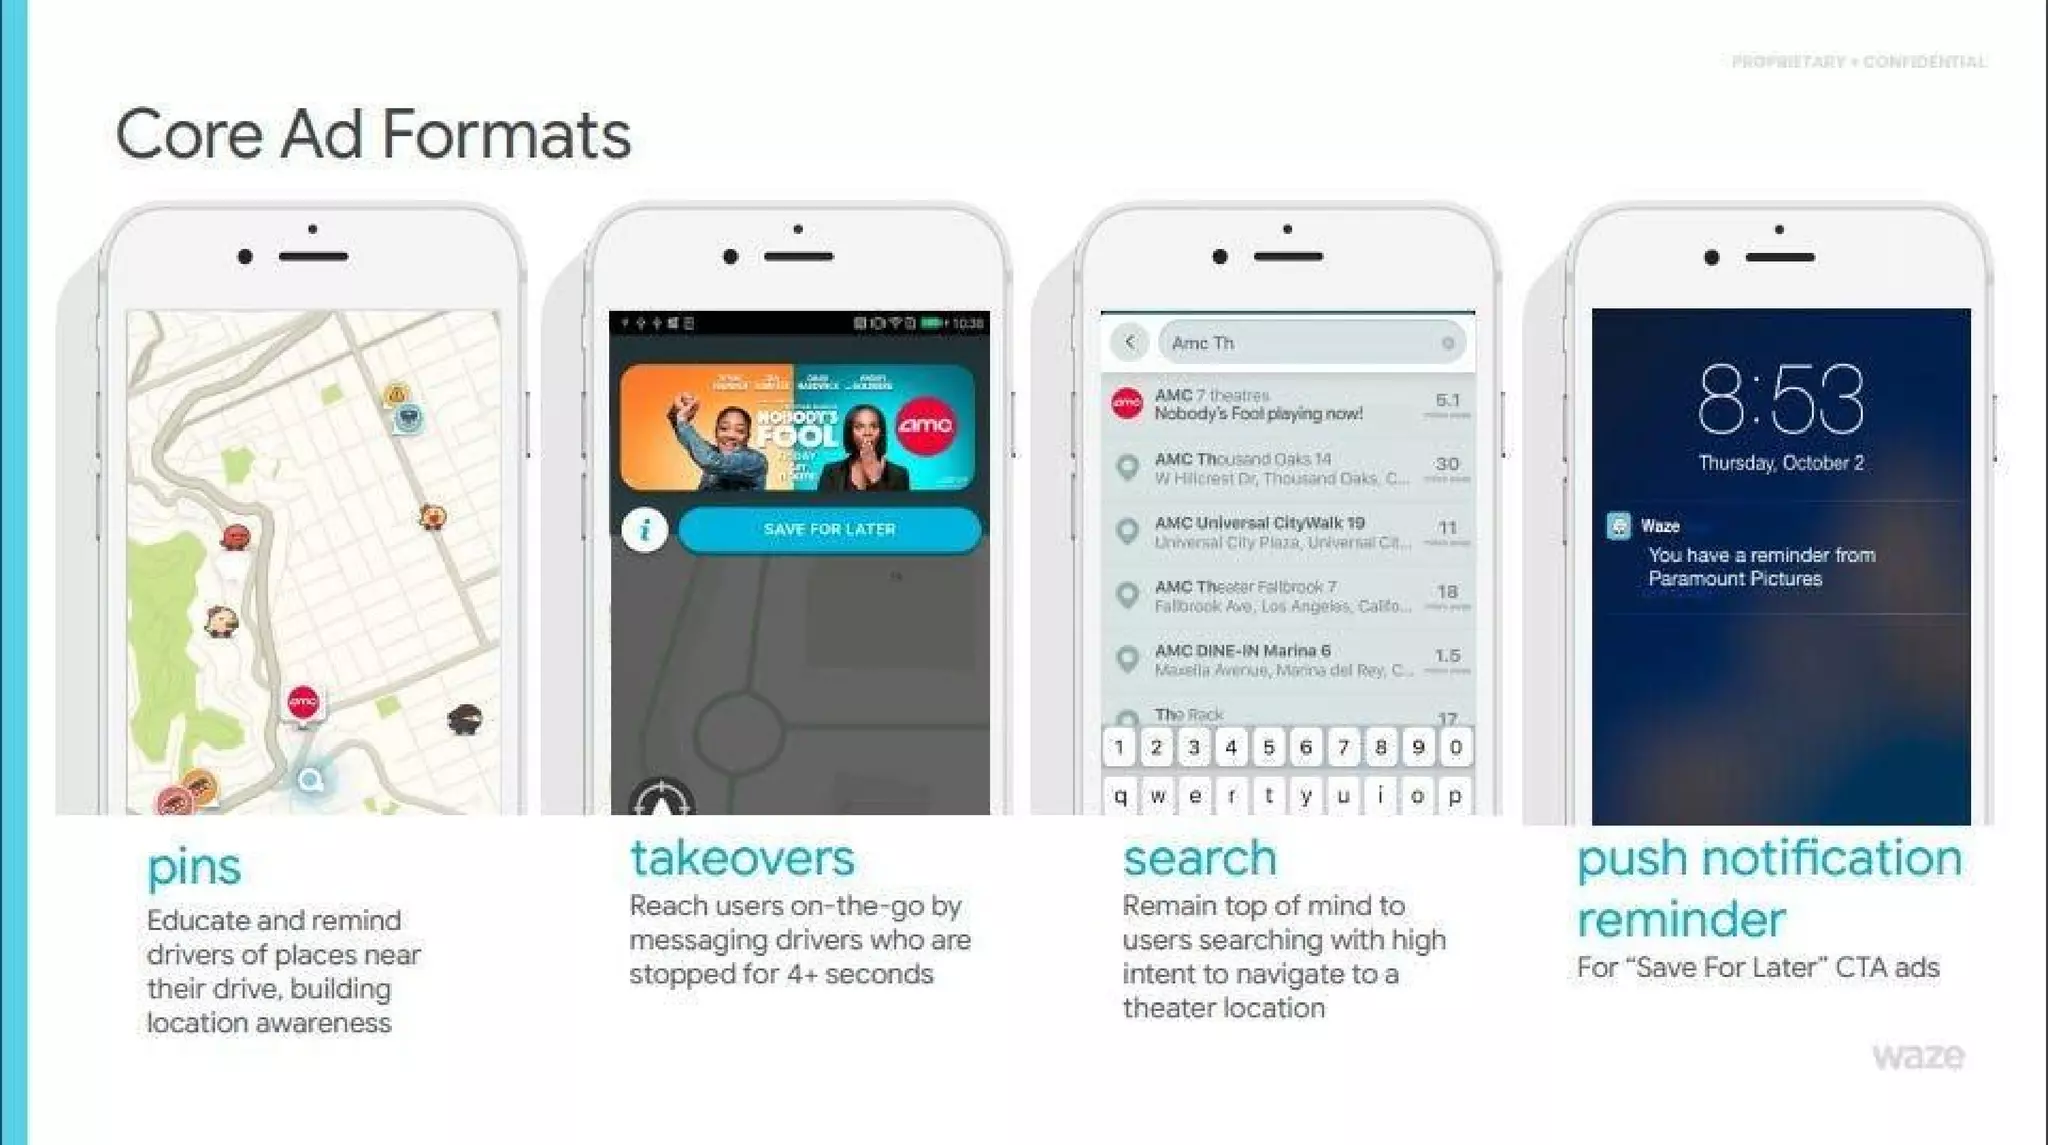
Slide 12 catalogs Waze’s core ad formats — pins, takeovers, search placement, and push reminders — each with a short benefit statement. This is a practical GTM slide: it tells buyers exactly how they can use the product, and ties creative units to user behavior (e.g., takeovers trigger when a user stops for 4+ seconds). Having a concise, productized list of ad formats reduces friction for media planners and simplifies pricing and measurement conversations.

For founders building monetization, this slide shows the importance of productizing ad inventory into repeatable units with clear triggers and CTAs. It also underlines the need to show not just capability but how that capability converts into buyer actions (save, drive, search) — essential for closing pilot campaigns and scaling revenue.

Key Takeaway: Productize inventory into a small set of clearly defined, trigger-based ad formats and pair each with a simple buyer benefit to speed adoption and campaign setup.

Conclusion: Key Lessons

Waze’s deck succeeds by combining hard traction, clear product capabilities, ecosystem positioning, and practical ad formats with concrete use-cases and measurable outcomes. The narrative moves logically from scale to signal to product to monetization and finally to ROI — a progression that simultaneously sells both the user product and the advertising business.

Actionable advice for founders: start your deck with the metrics that matter to your buyer, translate technical advantages into buyer-ready signals, position your product within existing ecosystems to lower adoption barriers, productize your monetization into simple, trigger-based formats, and use real creative examples and measurement claims to close the loop on ROI. These elements turn abstract technology into a compelling, executable commercial story.

Full Deck Analysis

11 sections

Overview

Company: Waze
Round: Various ($67M total raised)
Year: 2010
Outcome: Acquired by Google for $1.3B (2013)
Stage: Growth/Series C-D equivalent


Executive Summary

Waze presents a compelling narrative of transforming crowdsourced navigation data into a proprietary advertising platform. The deck positions Waze not as a GPS app competing with Google Maps, but as a “Digital OOH” (Out-of-Home) platform that bridges physical billboards with mobile advertising through real-time behavioral targeting. With 30M monthly active US users, 37 miles/day average usage, and demonstrated campaigns with Fortune 500 brands (IKEA, Disney), Waze articulates a clear path to monetization through location-based, intent-driven advertising—a thesis that proved prescient given Google’s $1.3B acquisition price and the company’s subsequent integration into Google’s ad ecosystem.


Problem Statement

The deck identifies two distinct problems:

1. Traditional Navigation Gap (Implicit)

  • Existing GPS solutions (Google Maps, TomTom, Garmin) provide static, map-based navigation
  • They lack real-time traffic data and user behavioral insights
  • Slide 1 establishes Waze’s scale: 30M MAU, 37 miles/day, 41 minutes per session—proving deep user engagement beyond basic navigation

2. Out-of-Home (OOH) Advertising Inefficiency (Explicit, Slides 7-14)

  • Slide 8 articulates the core OOH problem: “A billboard is only relevant to those who see it”
  • Traditional OOH lacks:
    • Attribution: No way to measure if billboard exposure drives actual foot traffic or sales
    • Targeting precision: Billboards reach everyone on a highway, not specific audiences
    • Reach extension: Physical billboards have fixed visibility radius
    • Competitive intelligence: No data on competitor customer routes or market share
  • Slide 8 shows OOH metrics gap: average dwell time <3 seconds at 55-56 MPH—insufficient for brand recall

Solution

Waze proposes a three-layer solution:

Layer 1: Data Moat (Slide 2)

Waze captures 8 distinct behavioral signals unavailable to competitors:

  1. Destination — where users are going
  2. Proximity to Store — retail location relevance
  3. Frequency of Visits (Loyalty) — repeat customer identification
  4. Stops + Stop Length — traffic patterns and in-store dwell time
  5. Location — real-time GPS coordinates
  6. Routes & Travel Patterns — commute and habit mapping
  7. Intent (through search) — explicit user intent signals
  8. Demographics/Emotional Context — user segmentation

Key differentiator: “Not just where people are, but where they’re going and how they will get there.”

Layer 2: Multi-Format Ad Platform (Slides 6, 12)

Four core ad formats addressing different moments:

Format Trigger Use Case
Pins Map view Location awareness/discovery
Takeovers Zero-speed (stopped at traffic light) High-impact, full-screen messaging
Search User search intent High-intent navigation
Push Notifications Post-takeover Re-engagement/reminders

Targeting dimensions (Slide 6):

  • Day Parting (time-of-day)
  • Home & Work (location-based)
  • Weather (contextual)
  • Road Tripper (trip type)
  • Destination (location-based)

Layer 3: OOH Integration & Attribution (Slides 7-11)

  • Radius Targeting: Geo-fence around physical billboards to trigger mobile ads
  • Zero-Speed Takeover: Ads shown when drivers stop near billboards
  • Last Mile Insights: Track post-billboard behavior (where customers go after exposure)
  • Competitor Analysis: Identify which roads competitors’ customers drive
  • Dwell Time Measurement: Quantify billboard exposure duration and speed

Market Opportunity

TAM/SAM/SOM Analysis

The deck does not explicitly quantify TAM/SAM/SOM, but provides directional evidence:

Implied TAM: US Digital Advertising Market

  • 30M MAU in US (Slide 1) suggests significant addressable base
  • Positioning as complement to Google Ads ecosystem (Slide 3) implies access to Google’s $100B+ ad business

Implied SAM: Location-Based & OOH Advertising

  • OOH is traditionally a $7-8B annual market (2010 era)
  • Digital location-based advertising was nascent but growing rapidly
  • Waze’s unique “in-car” channel represents new ad inventory category

Implied SOM: Initial Monetization

  • Focus on retail/QSR (McDonald’s, IKEA) and entertainment (Disney)
  • High-intent, location-dependent verticals with proven ROI on location-based marketing
  • Slides 13-14 show real campaigns with major brands, suggesting early revenue traction

Critical gap: Deck does not disclose:

  • Current revenue or ARR
  • Customer acquisition cost (CAC)
  • Lifetime value (LTV)
  • Pricing (CPM, CPC, or flat rates)
  • Revenue per user or ARPU

Business Model

Revenue Streams (Inferred from Slides)

Primary: Advertising

  1. OOH Integration Campaigns (Slides 7-11)
    • Bundled OOH + mobile campaigns
    • Premium pricing for integrated reach extension
    • Example: IKEA billboard + Waze radius targeting
  2. In-App Ad Formats (Slide 12)
    • Takeovers (full-screen, high-impact)
    • Pins (location discovery)
    • Search placements (sponsored listings)
    • Push notifications (re-engagement)
  3. Data & Analytics Services (Slide 8)
    • Competitor analysis (which roads competitors’ customers drive)
    • Last Mile Insights (post-billboard destination tracking)
    • Dwell time & exposure measurement
    • Attribution/lift measurement

Secondary: Potential B2B Services

  • Traffic data licensing (implied by data richness)
  • Route optimization for logistics/delivery

Unit Economics (Not Disclosed)

  • No pricing information provided
  • No CAC, LTV, or payback period metrics
  • No revenue per user or ARPU disclosed
  • Red flag: Lack of unit economics transparency suggests either:
    • Early monetization stage (ads not yet scaled)
    • Competitive sensitivity (pricing not disclosed)
    • Focus on user growth over profitability

Traction & Metrics

User Metrics (Slide 1)

| Metric | Value |
|——–|——-|
| Monthly Active Users (US) | 30M |
| Average Daily Distance | 37 miles |
| Average Session Duration | 41 minutes |

Interpretation:

  • 30M MAU is substantial for 2010 (pre-smartphone saturation)
  • 37 miles/day + 41 min/session indicates high engagement (not casual use)
  • Suggests strong product-market fit in navigation category

Campaign Proof Points (Slides 13-14)

  • IKEA: Real billboard + mobile integration in Frisco, TX
  • Disney/Pixar: Finding Dory movie campaign with building wrap in San Francisco
  • McDonald’s: “Zero Speed Takeover” with $3 Happy Meal promotion (Slide 7)

Interpretation:

  • Fortune 500 brands (IKEA, Disney) validate advertiser demand
  • Real, deployed campaigns (not just concepts) demonstrate product maturity
  • Multi-vertical adoption (retail, entertainment, QSR) shows horizontal scalability

Performance Metrics (Disclosed)

  • 3X navigation lift when drivers exposed to both OOH + Waze (Slide 10)
    • Critical caveat: No baseline, sample size, or methodology disclosed
    • Strongest claim in deck but least substantiated

Metrics NOT Disclosed

  • Revenue or ARR
  • Customer count or retention
  • Ad fill rate or CPM
  • Click-through rates by format
  • Conversion rates (billboard exposure → store visit)
  • User acquisition cost or churn

Competitive Positioning

Competitive Landscape (Implicit)

Direct competitors:

  • Google Maps (static maps, no real-time traffic)
  • TomTom (navigation, no behavioral data)
  • Garmin (GPS devices, no social/crowdsourced data)

Indirect competitors:

  • Google Ads (search, display advertising)
  • Facebook (mobile advertising, targeting)
  • Traditional OOH companies (Clear Channel, Lamar)

Waze’s Differentiation (Slide 2, 3, 5)

Dimension Waze Competitors
Data Source Crowdsourced, real-time user behavior Static maps, historical data
Traffic Intelligence Live user reports + GPS traces Aggregated historical patterns
Behavioral Signals 8 distinct signals (destination, intent, loyalty, etc.) Location only
Ad Channel In-car, high-intent moments Search, display, passive
OOH Integration Radius targeting, attribution, lift measurement No integration
Attribution Post-billboard behavior tracking Impressions only

Key Competitive Advantages

  1. Unique “In-Car” Channel (Slide 3)
    • Only platform reaching users actively navigating
    • Captive audience at traffic lights (Zero-Speed Takeover)
    • High-intent moment (users are mobile, destination-focused)
  2. Proprietary Data Moat (Slide 2)
    • 30M users generating continuous behavioral data
    • 8 distinct signals unavailable to competitors
    • Real-time, not historical
  3. OOH Bridge (Slides 7-11)
    • Only platform connecting physical + digital advertising
    • Solves OOH’s attribution problem
    • Extends OOH reach beyond physical visibility
  4. Measurement & Attribution (Slide 8-10)
    • Competitor analysis (route tracking)
    • Last Mile Insights (post-exposure behavior)
    • Lift measurement (3X navigation lift claim)
    • Dwell time metrics

Team

Critical gap: The deck does not mention the founding team, executives, or board members.

This is a significant omission for a pitch deck, especially for a 2010 Series C/D round. Typical expectations:

  • Founder bios and relevant experience
  • CEO/CTO credentials
  • Key hires (VP Sales, VP Product, etc.)
  • Board composition and investor names

Implication: Either:

  • This is a partial deck (full version likely included team slide)
  • Team was not considered a key differentiator (unlikely)
  • Deck focused entirely on product/market opportunity

Go-to-Market Strategy

Sales Approach (Inferred from Slides)

Direct Sales to Advertisers

  • Target: Large brands with location-dependent businesses
  • Verticals: Retail (IKEA), QSR (McDonald’s), Entertainment (Disney)
  • Sales motion: Integrated OOH + mobile campaigns

OOH Company Partnerships

  • Implied partnership with OOH companies (Clear Channel, Lamar)
  • Waze provides analytics/attribution layer on top of billboard placements
  • Revenue share or licensing model (not specified)

Google Integration (Slide 3)

  • Explicit positioning as complement to Google Ads ecosystem
  • Implies Google partnership or acquisition discussions already underway
  • Suggests go-to-market through Google’s sales channels post-acquisition

Distribution Channels

  • Direct: Waze app (30M MAU)
  • Partnerships: OOH companies, Google
  • Geographic focus: US (all examples are US-based)

Customer Acquisition (Not Disclosed)

  • No CAC metrics
  • No sales cycle length
  • No win rates or deal sizes

The Ask

Critical gap: The deck does not explicitly state the funding ask or use of funds.

Inferred from Context

  • Round: “Various” ($67M total raised across multiple rounds)
  • 2010 timing suggests Series C or D
  • Typical use of funds for growth-stage SaaS/ad tech:
    • Sales & marketing expansion
    • Product development (new ad formats, analytics)
    • International expansion
    • Team hiring

What Should Have Been Included

  • Specific funding amount requested
  • Use of funds breakdown (% to sales, product, operations, etc.)
  • Runway/burn rate
  • Path to profitability or next milestone

Investor Deep Dive

Executive summary, strengths & red flags

Executive Summary

Waze presents a compelling narrative of transforming crowdsourced navigation data into a proprietary advertising platform. The deck positions Waze not as a GPS app competing with Google Maps, but as a **"Digital OOH" (Out-of-Home) platform** that bridges physical billboards with mobile advertising through real-time behavioral targeting. With 30M monthly active US users, 37 miles/day average usage, and demonstrated campaigns with Fortune 500 brands (IKEA, Disney), Waze articulates a clear path to monetization through location-based, intent-driven advertising—a thesis that proved prescient given Google's $1.3B acquisition price and the company's subsequent integration into Google's ad ecosystem.

Key Strengths

6 identified

1

Exceptional Product-Market Fit & User Traction

- 30M MAU, 37 miles/day, 41 min/session (Slide 1)

2

Novel, Defensible Data Moat

- 8 distinct behavioral signals (Slide 2); crowdsourced, real-time data

3

Clear Monetization Path with Real Customer Validation

- Deployed campaigns with IKEA, Disney, McDonald's (Slides 7, 13-14)

4

Strategic Positioning as "Digital OOH"

- Slides 7-11 reframe Waze as OOH complement, not just navigation

5

Multi-Vertical, Horizontal Scalability

- Campaigns across retail (IKEA), QSR (McDonald's), entertainment (Disney)

6

Visual Design & Storytelling Excellence

- Consistent design language, real photos, clear visual hierarchy across all 14 slides

Red Flags & Weaknesses

8 identified

1

Lack of Financial Metrics & Unit Economics

- Revenue, ARR, CAC, LTV, ARPU, pricing

2

Unsubstantiated Key Claims

- "3X navigation lift when exposed to both OOH + Waze" (Slide 10)

3

No Team Information

- Founder bios, executive credentials, board composition

4

Privacy & Regulatory Risks Not Addressed

- Extensive location tracking, radius targeting, competitor route tracking

5

Limited Geographic Scope

- All examples are US-based; 30M MAU metric specifies "United States"

6

Vague OOH Partnership Model

- How does Waze partner with OOH companies? Revenue share? Licensing?

7

No Competitive Response Plan

- Google Maps could easily add traffic data and ads

8

Attribution Causality Not Proven

- Slides 8-10 show correlation (billboard exposure → app interaction) but not causation

More Pitch Decks To Study

Compare structure, fundraising context, and investor-facing story across similar startup decks.