Compare your deck to VTEX

Compare Your Deck

VTEX Pitch Deck (2012)

Ecommerce
Stage: Series A
Raised: $5M
Year: 2012
Slides: 24
Outcome: IPO at $4.6B on NYSE (2021)

Pitch Deck

1 / 24
VTEX pitch deck - The Opening: Clear positioning and brand
Click to expand

Deck Analysis

This deck from VTEX (Series A, 2012) presents a concise, design-forward investor narrative for an enterprise commerce platform that ultimately IPO'd at a $4.6B valuation. It balances brand, traction, technology and go-to-market signals: strong customer logos, rapid revenue and GMV growth, product differentiation (multi-tenant, microservices, APIs), and a marketplace/instore strategy. What makes it notable is how it pairs polished visual storytelling with key metrics and product architecture — communicating both business momentum and technical credibility to enterprise buyers and investors.

The Opening: Clear positioning and brand

The Opening: Clear positioning and brand

The first slide (bright, minimal title slide) sets a strong tone: bold color, simple tagline “Accelerate Commerce Transformation,” and prominent VTEX logo. This opening signals a focused value proposition (commerce transformation) and shows confident design discipline — an immediate cue that the company cares about product and user experience, which resonates with enterprise customers and modern investors.

Founders can learn from the restraint: the opening isn’t cluttered with metrics or long paragraphs; it creates a brand-first frame that the rest of the deck can fill with substance. It primes the audience to view the company as a platform with ambition rather than just a feature set.

Key Takeaway: Lead with a single, memorable positioning statement and consistent visual brand to prime investors for the story that follows.
Traction & credibility: customers and top-line metrics

Traction & credibility: customers and top-line metrics

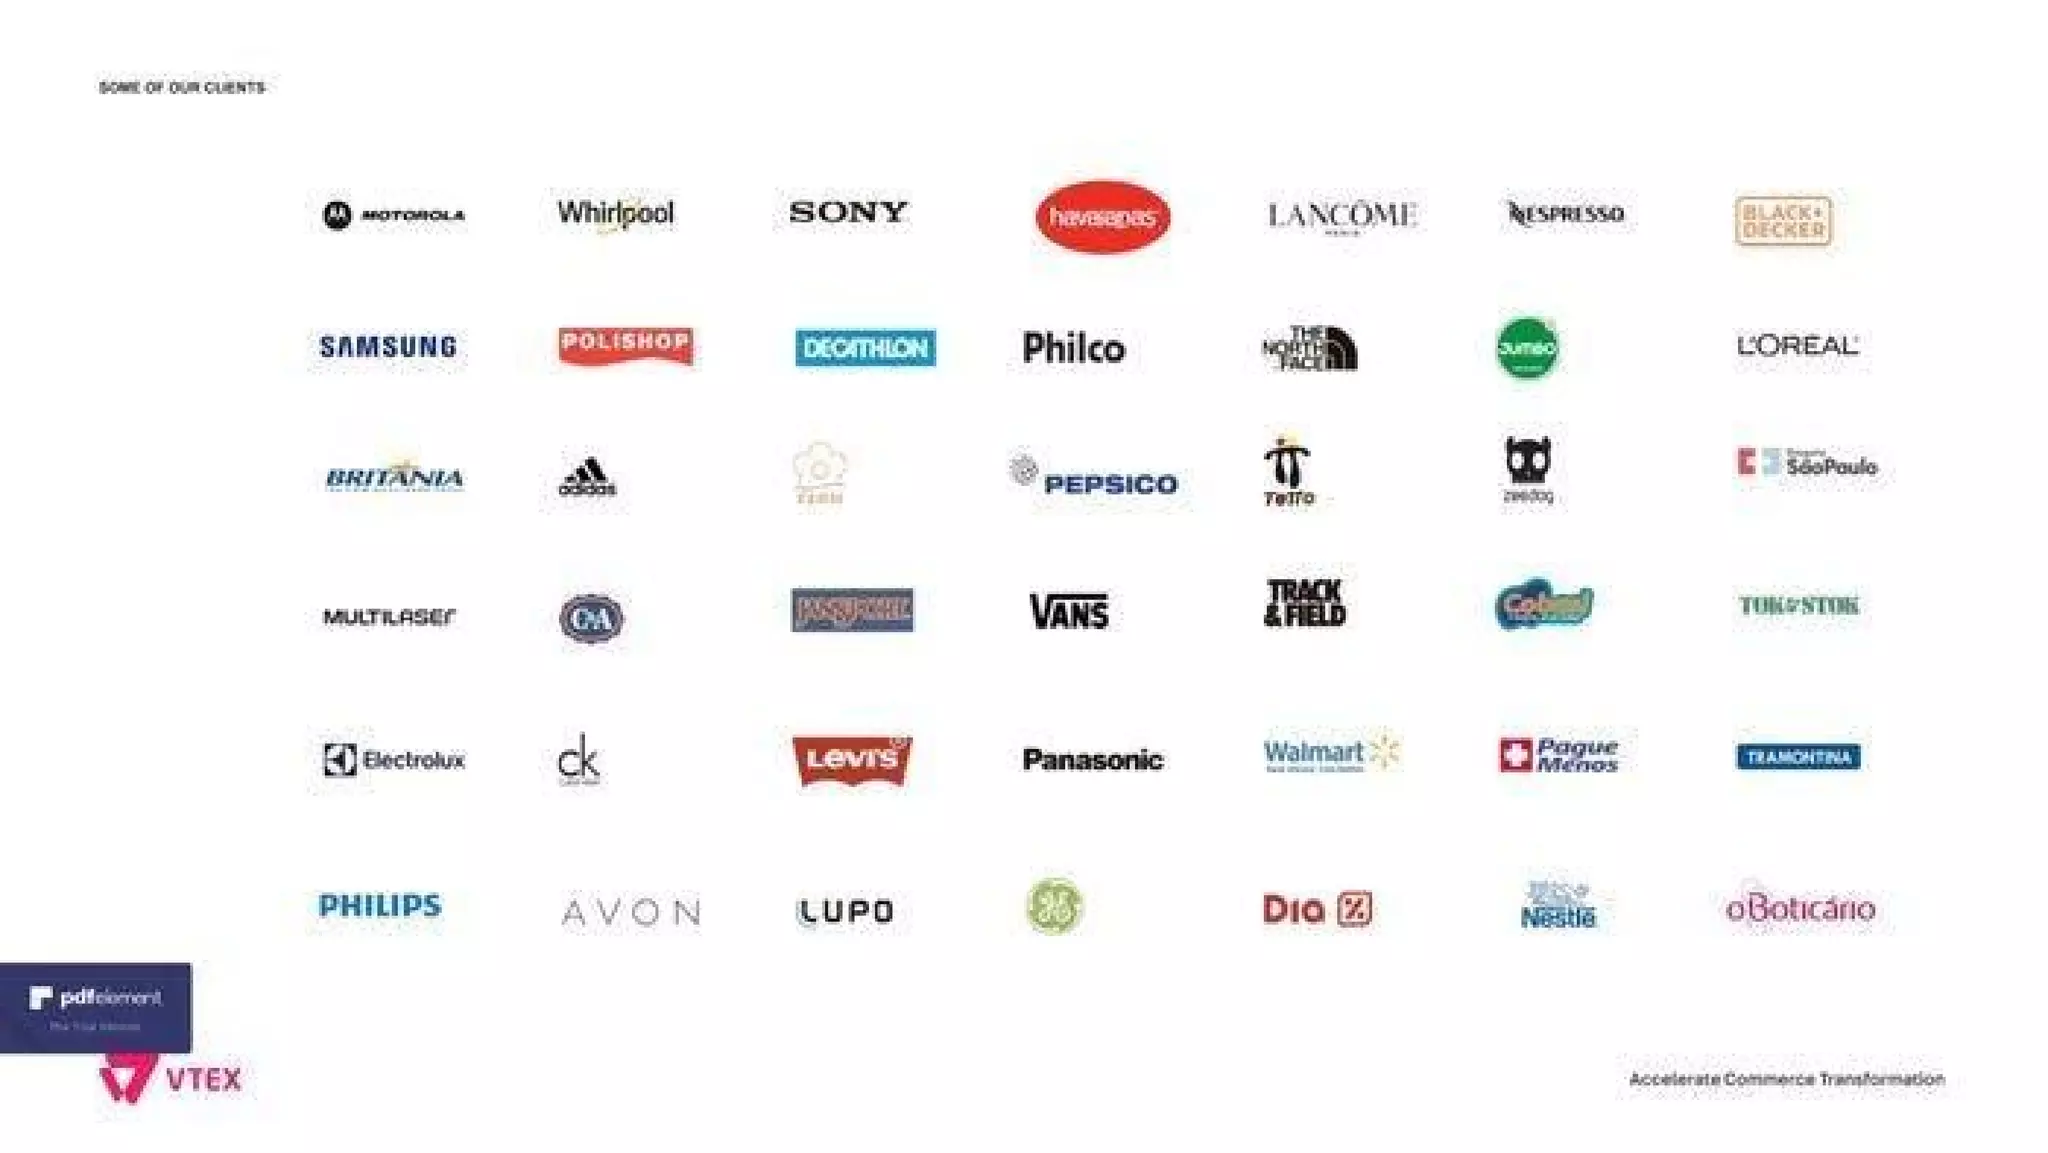
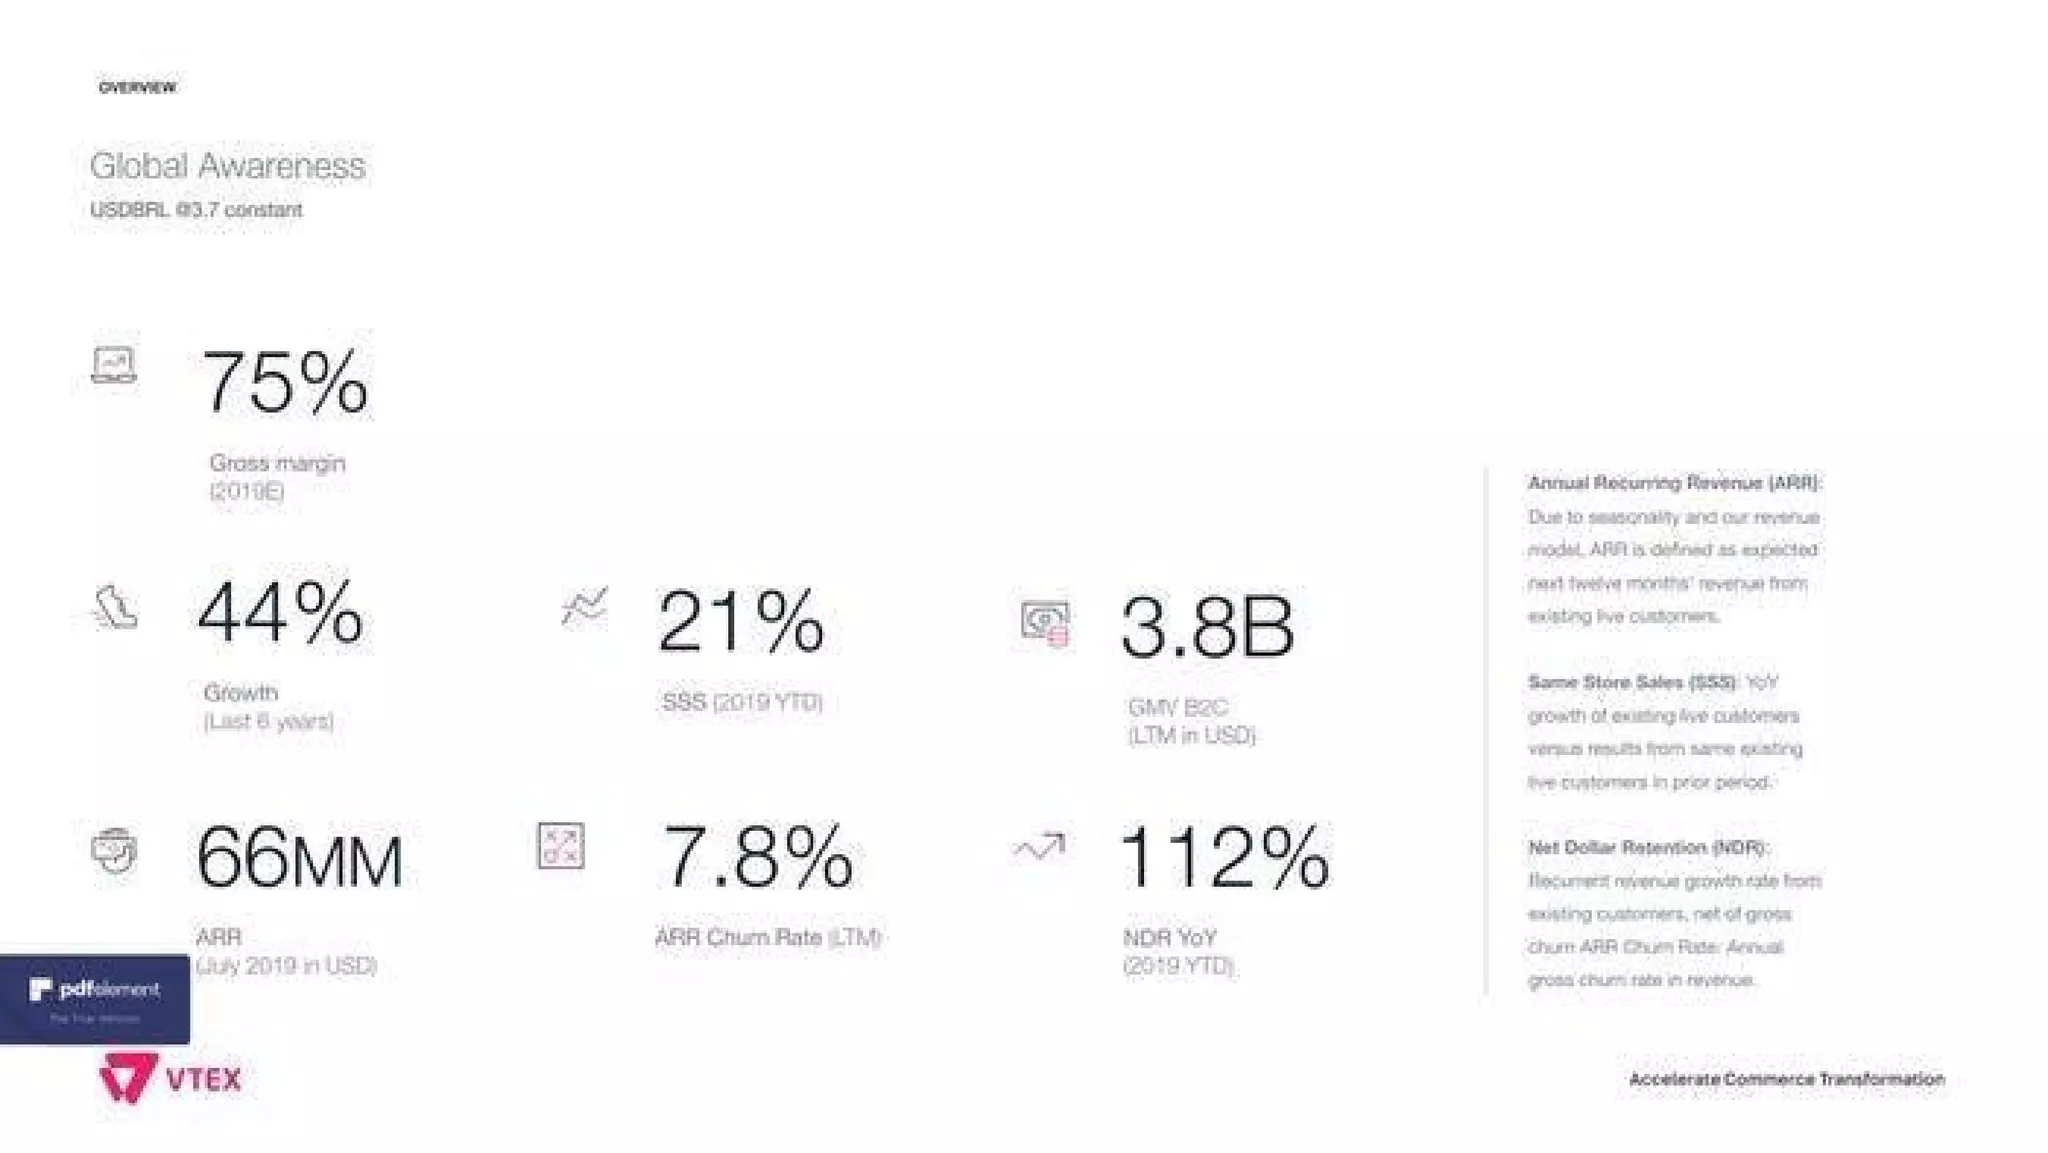
Slides showing customer logos and the ‘Global Awareness’ metrics (slide_02 and slide_03 visuals) give social proof and concrete performance numbers: high gross margins, rapid growth, GMV scale and ARR signals. Crowding the deck early with recognizable enterprise logos (Samsung, Whirlpool, Levi’s, Nestlé, Walmart presence in analyses) demonstrates market validation — critical for enterprise SaaS where referenceability drives sales.

The quantitative slide uses large, legible numbers (e.g., 75% gross margin, 44% CAGR, 3.8B GMV) and simple definitions (ARR, NDR) so investors can assess unit economics and retention quickly. Founders should emulate this approach: show both logos and crisp financial KPIs early, with plain-English definitions to avoid confusion and to let investors rapidly triangulate growth, margins and retention.

Key Takeaway: Combine brand logos with a compact KPI slide that highlights margin, growth, ARR/GMV and retention — make the business's health immediately visible.
Demonstrating growth trajectory: revenue and margin chart

Demonstrating growth trajectory: revenue and margin chart

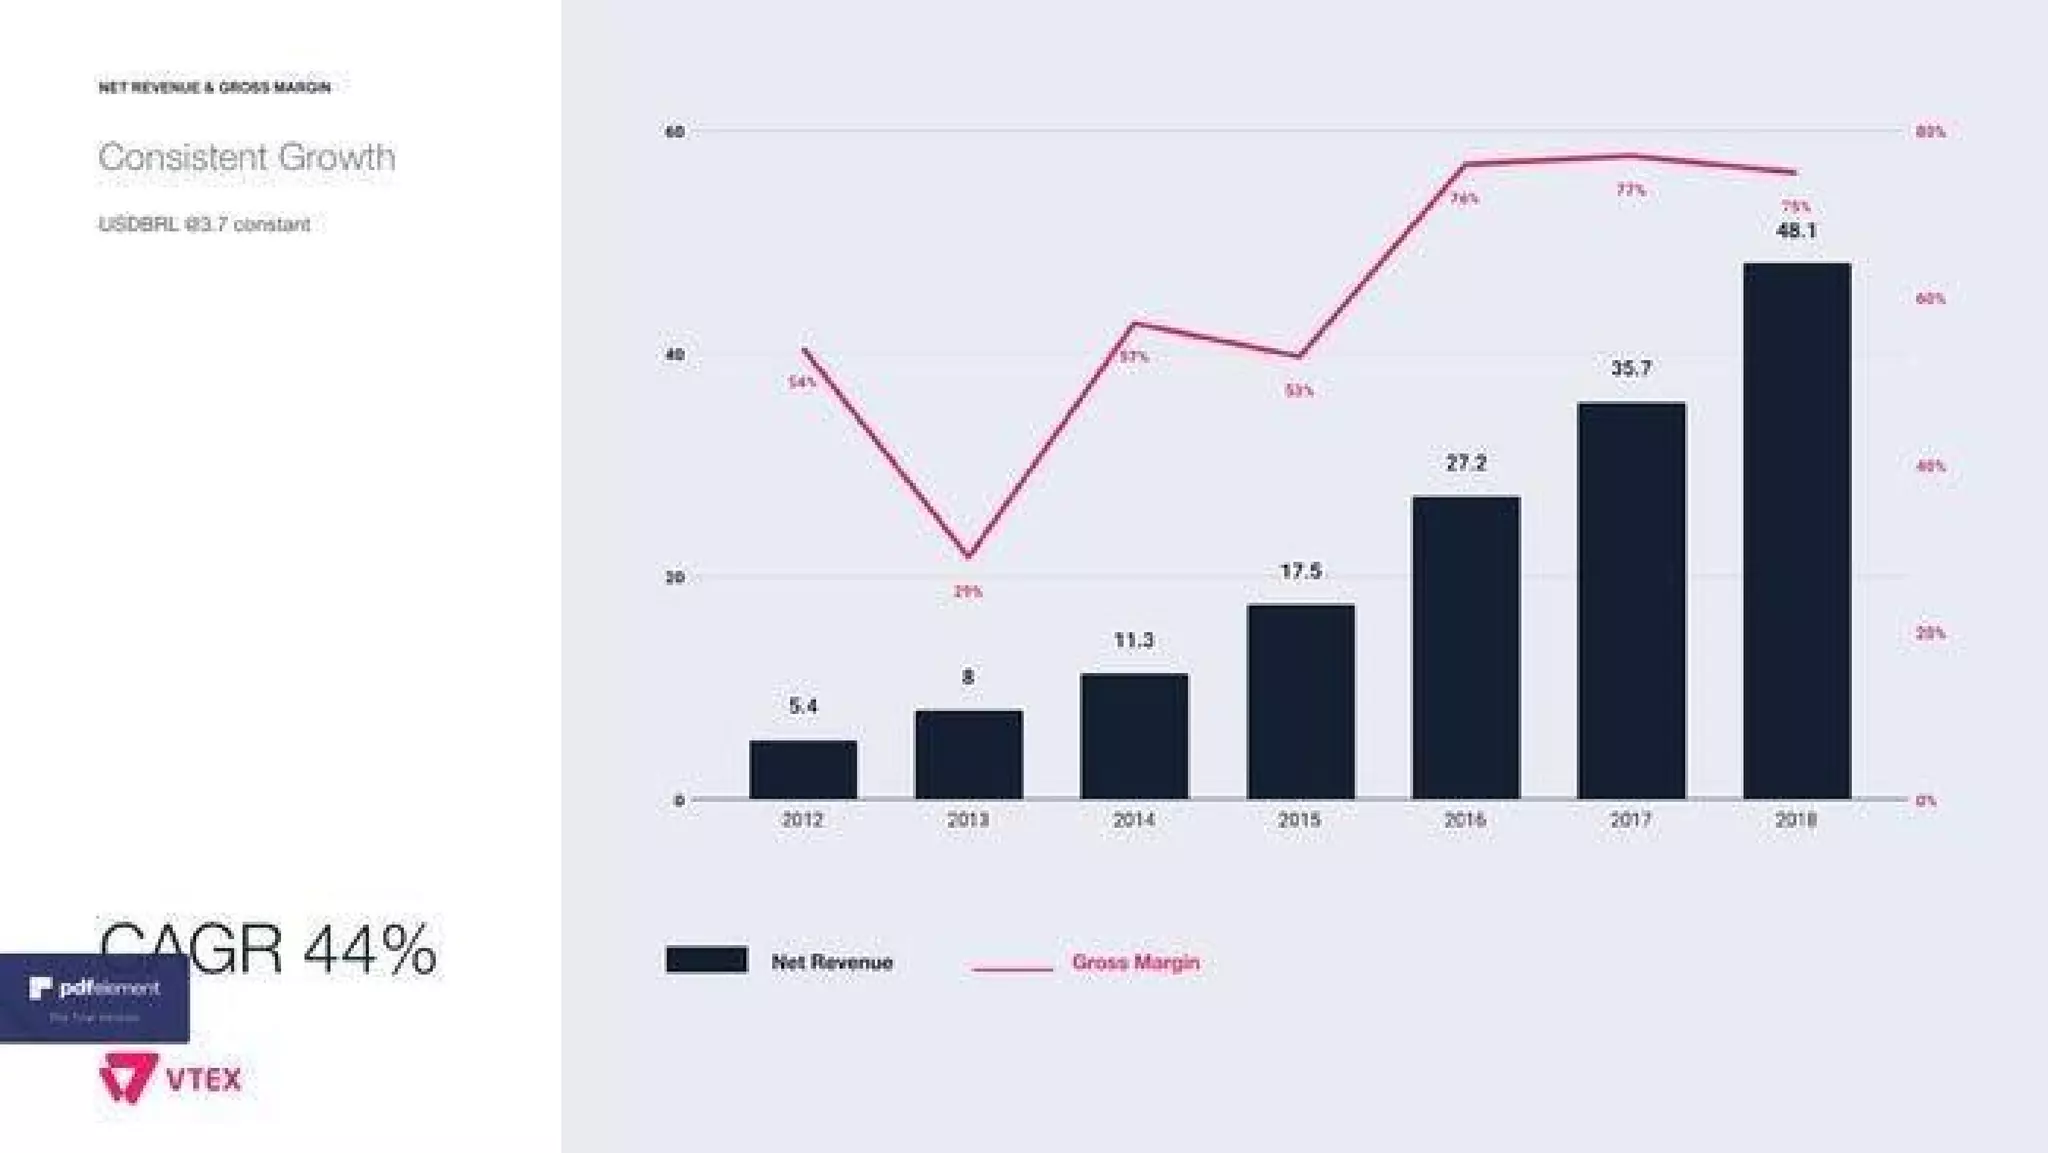
The growth chart (slide_06) shows multi-year net revenue bars with a gross margin line — a classic investor-friendly visualization that demonstrates both scale and unit economics over time. The bars clearly depict a rising net revenue curve (from single digits to tens of millions) while the margin line shows recovery and stability, signaling a business transitioning from investment to efficient growth.

This is effective because it does two jobs: it proves top-line momentum and it reassures investors about margin durability. Founders should present revenue and margin trends together (not in isolation) so investors can see whether growth is being achieved sustainably, and annotate inflection points (product launches, market expansions) where possible.

Key Takeaway: Show revenue and margin together over multiple years to prove sustainable scaling and help investors connect growth to unit economics.
Product & differentiation: engineering-first signals

Product & differentiation: engineering-first signals

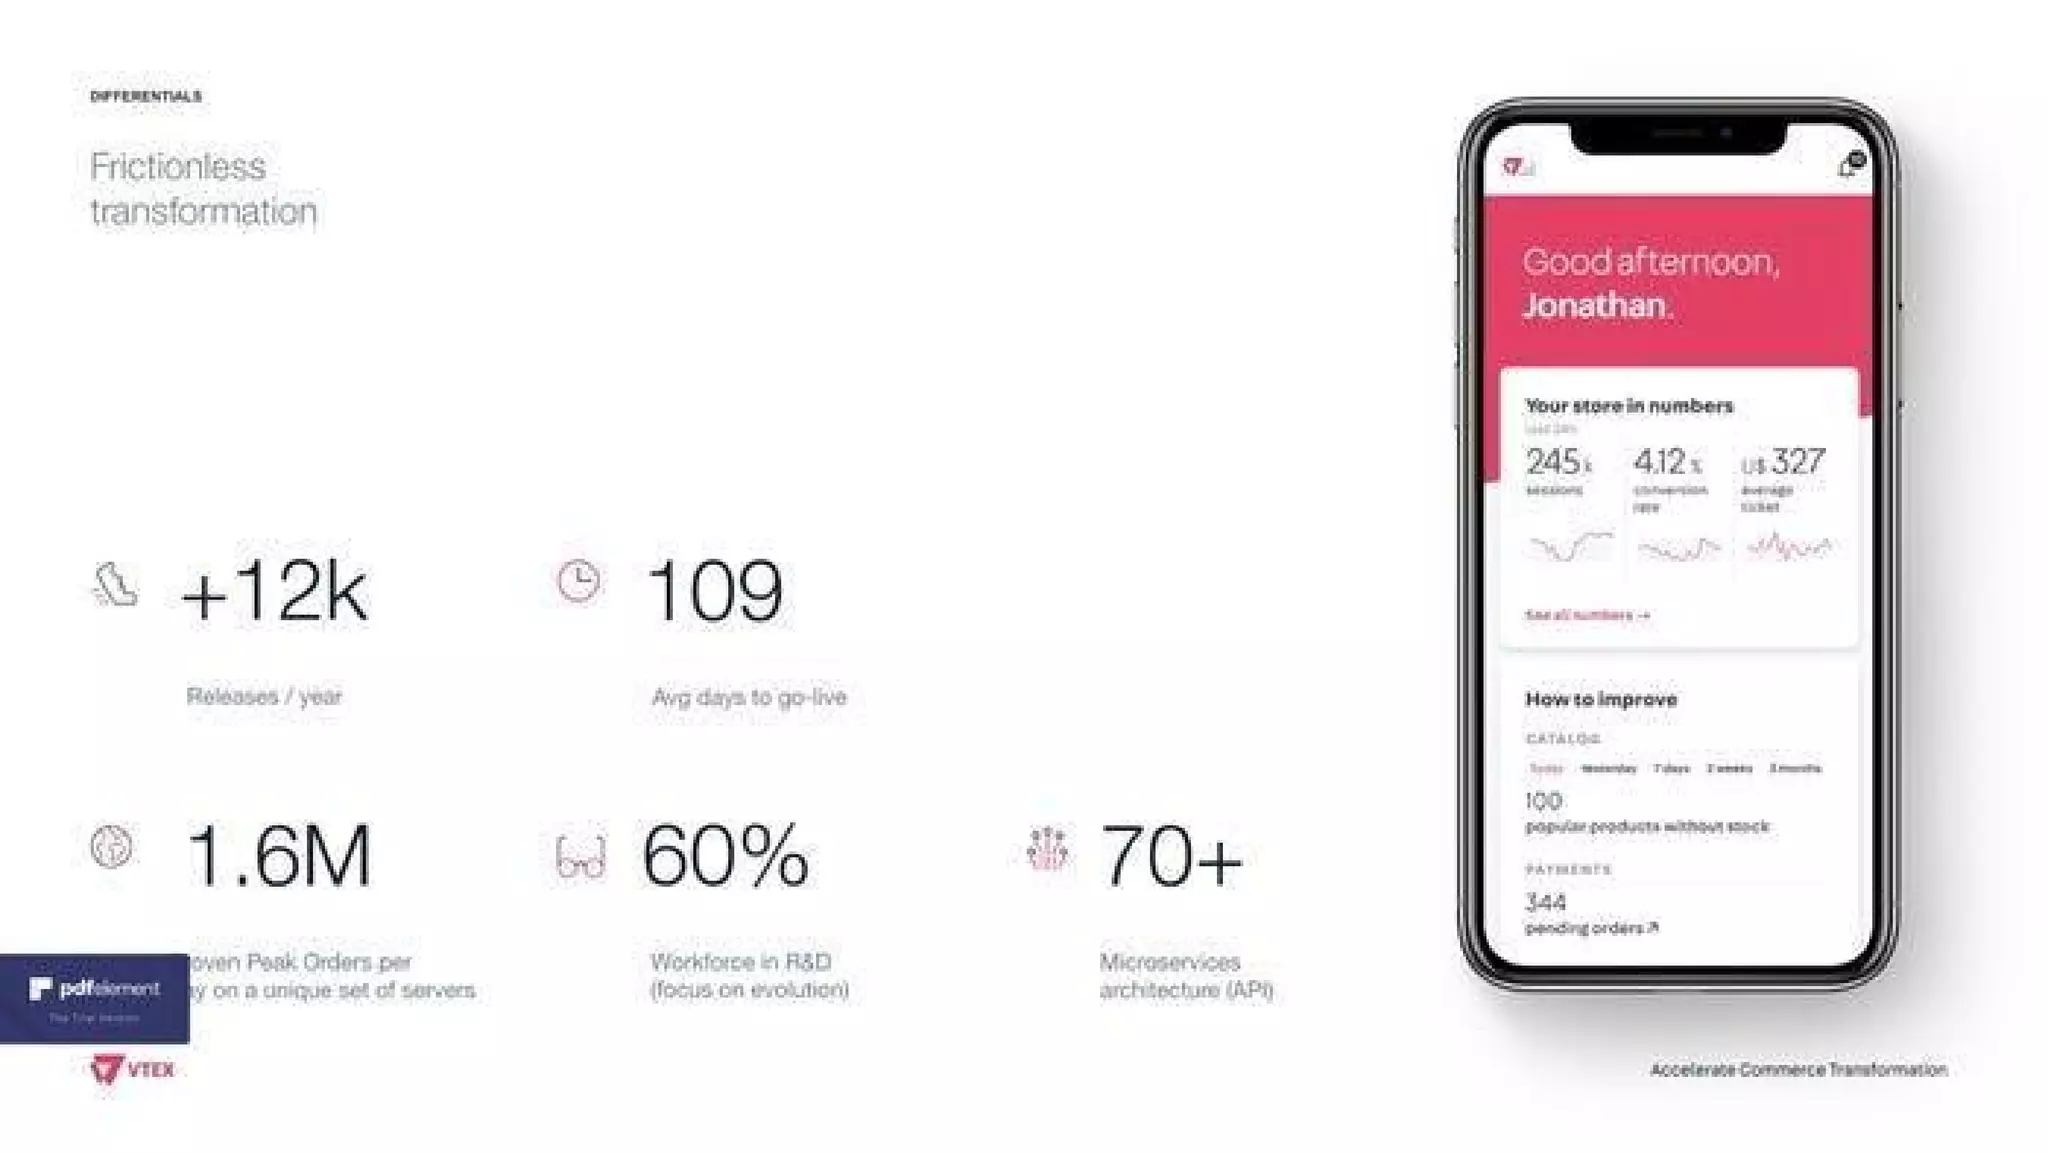
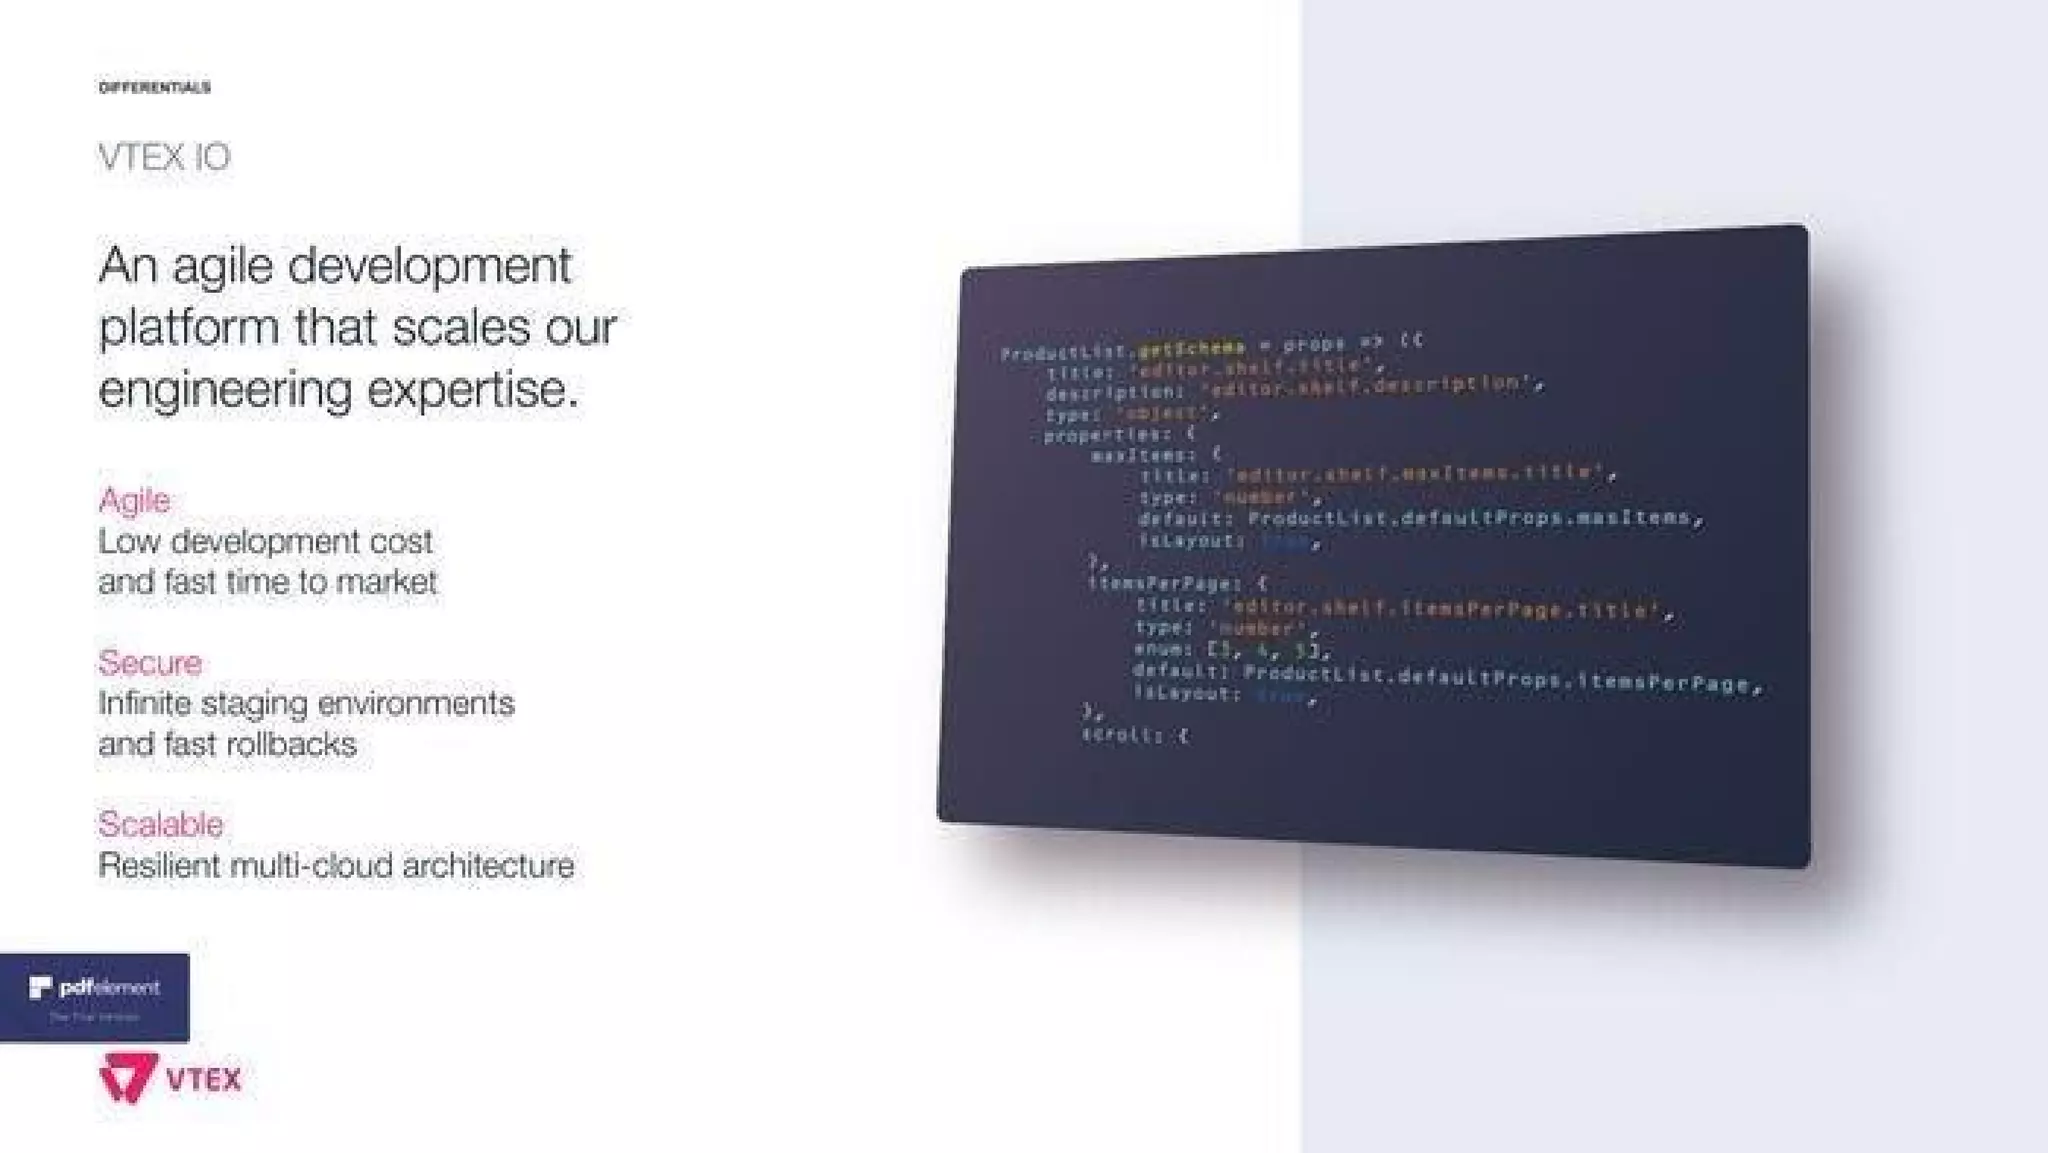
Slides that highlight product differentials (slide_11 and adjacent differentials) emphasize engineering capabilities: frequent releases (+12K/year), average days to go-live (109), peak orders scale, R&D workforce %, and microservices/APIs. These operational KPIs are powerful for technical and enterprise buyers because they quantify reliability, speed of iteration and scalability — all essential for mission-critical commerce platforms.

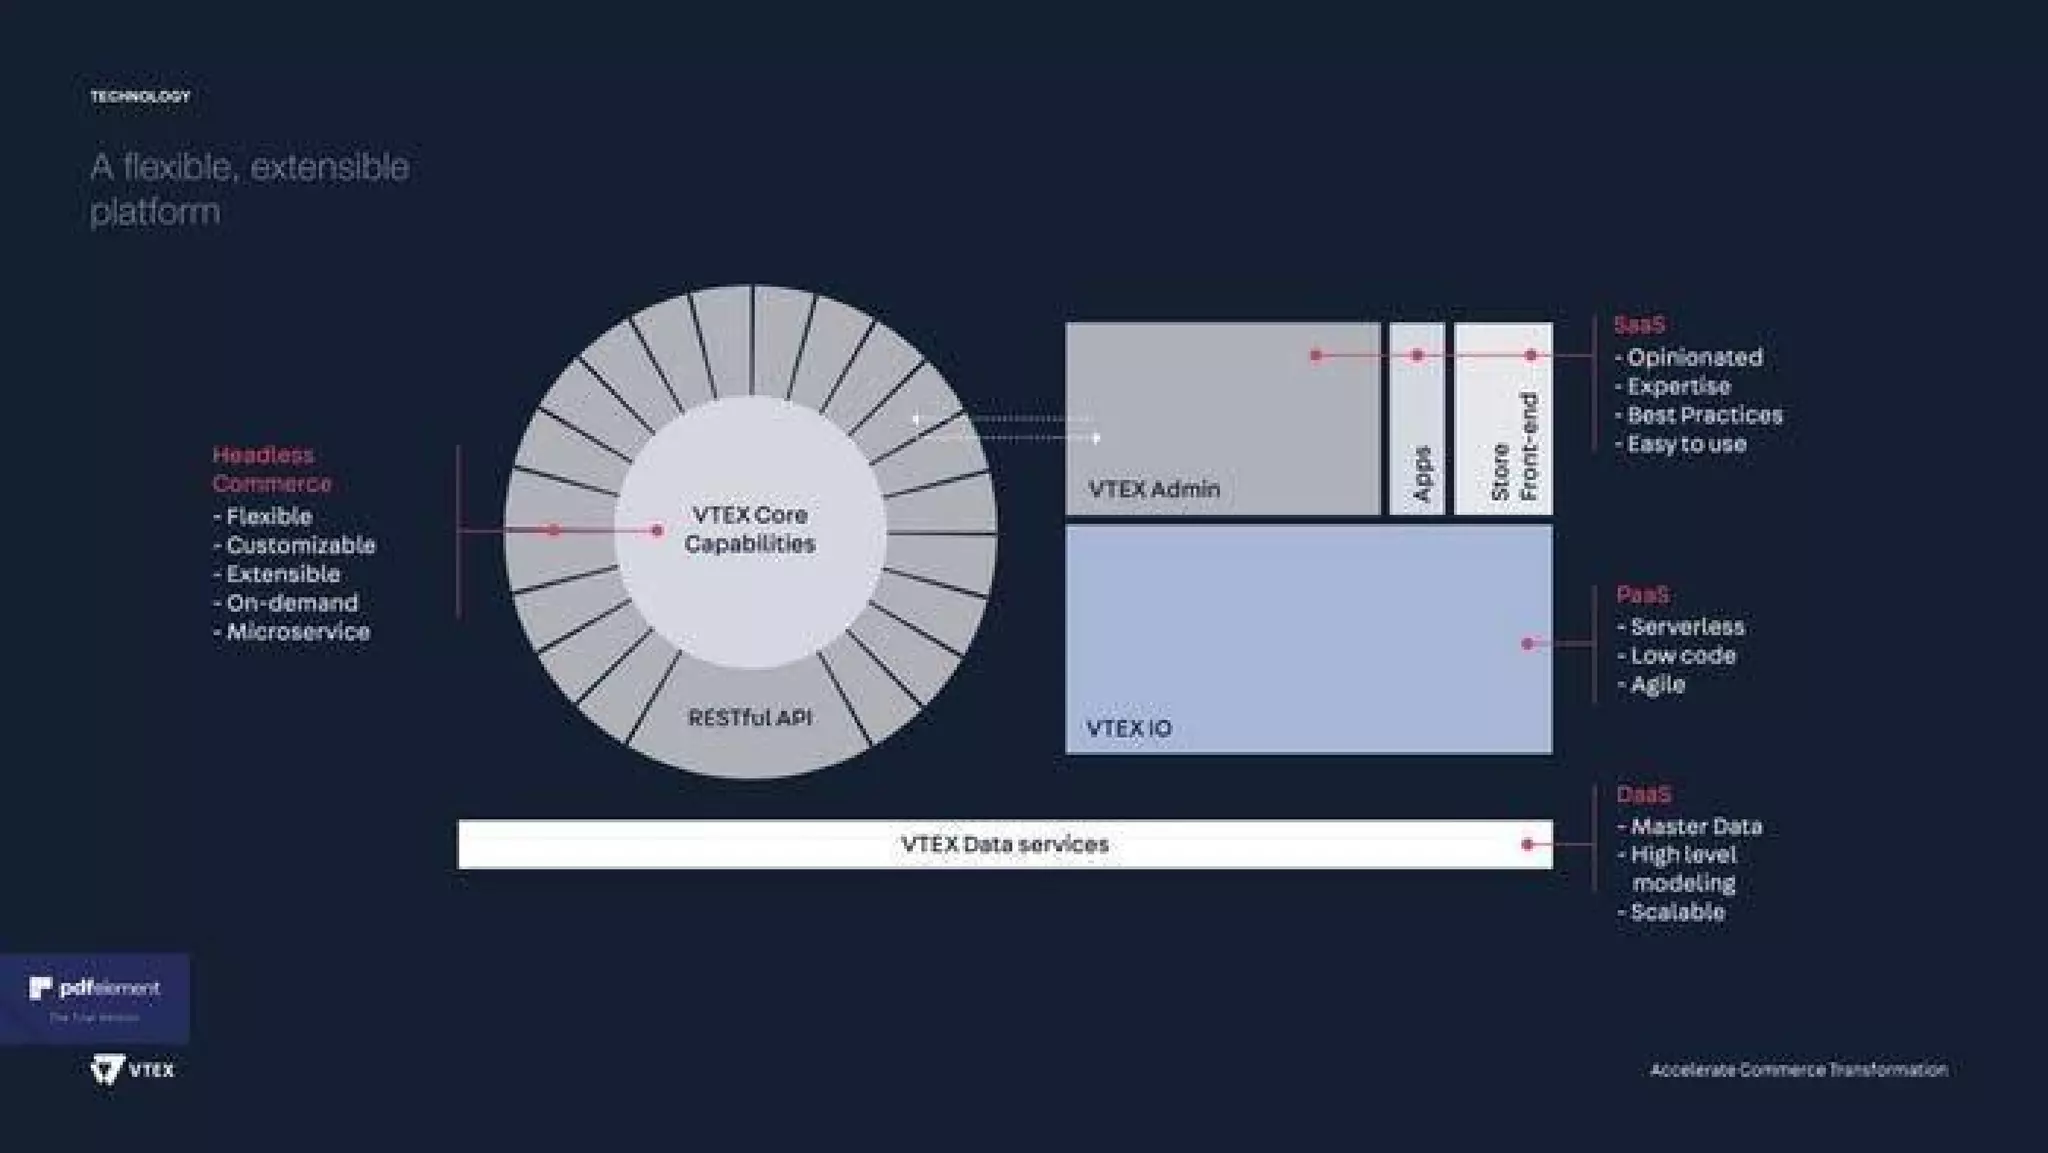
By including technical performance metrics alongside product features (true multi-tenant, headless, RESTful APIs), VTEX shows it can serve large retailers while enabling fast deployments. Founders should surface operational metrics that matter to customers (time-to-live, release cadence, peak throughput) — they help convert skeptical technical buyers and signal product-market fit beyond marketing claims.

Key Takeaway: Use operational metrics (go‑live time, release cadence, peak throughput) to prove your technical platform can meet enterprise scale and speed requirements.
Go-to-market & monetization: transparent pricing and cohort growth

Go-to-market & monetization: transparent pricing and cohort growth

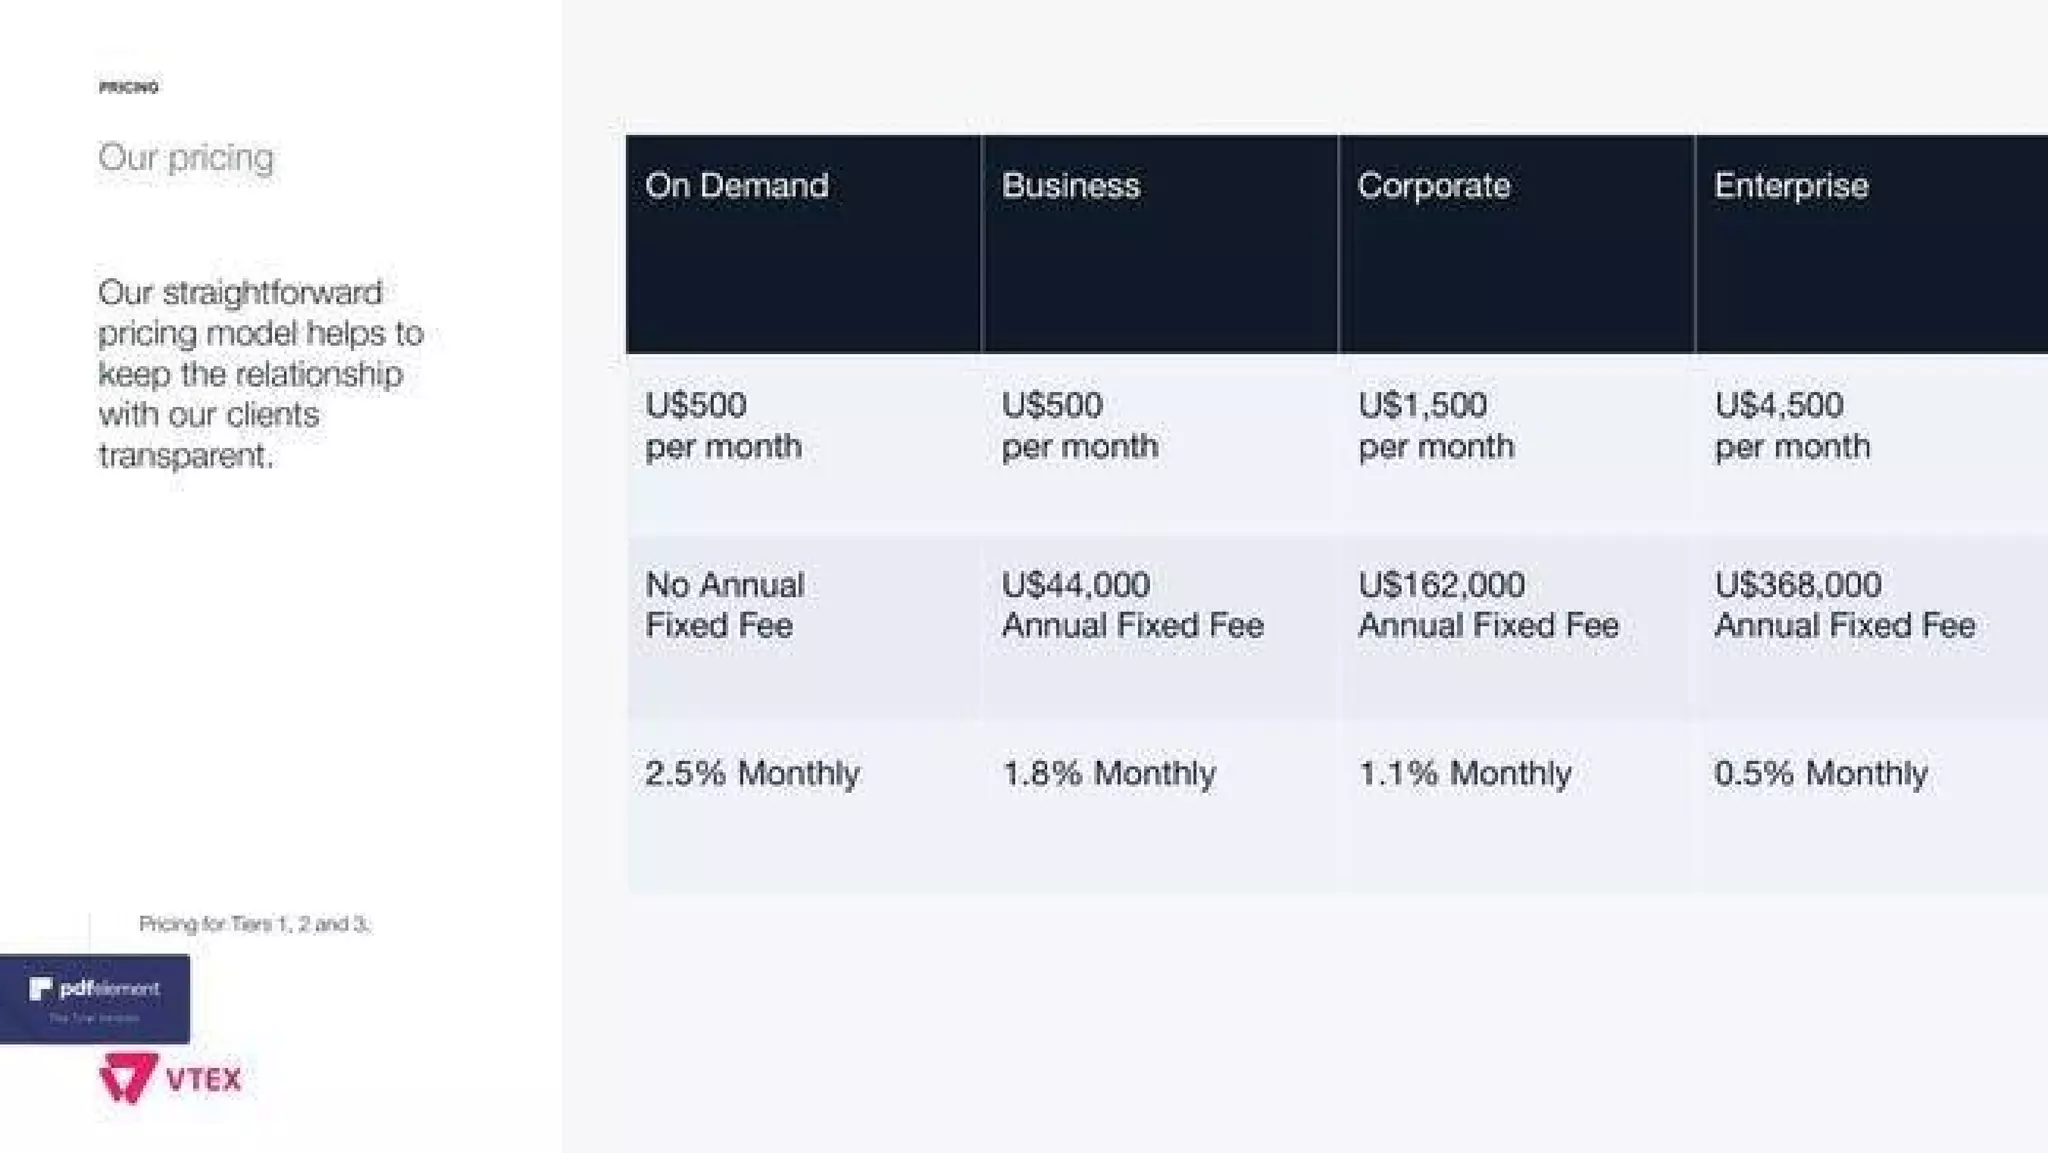
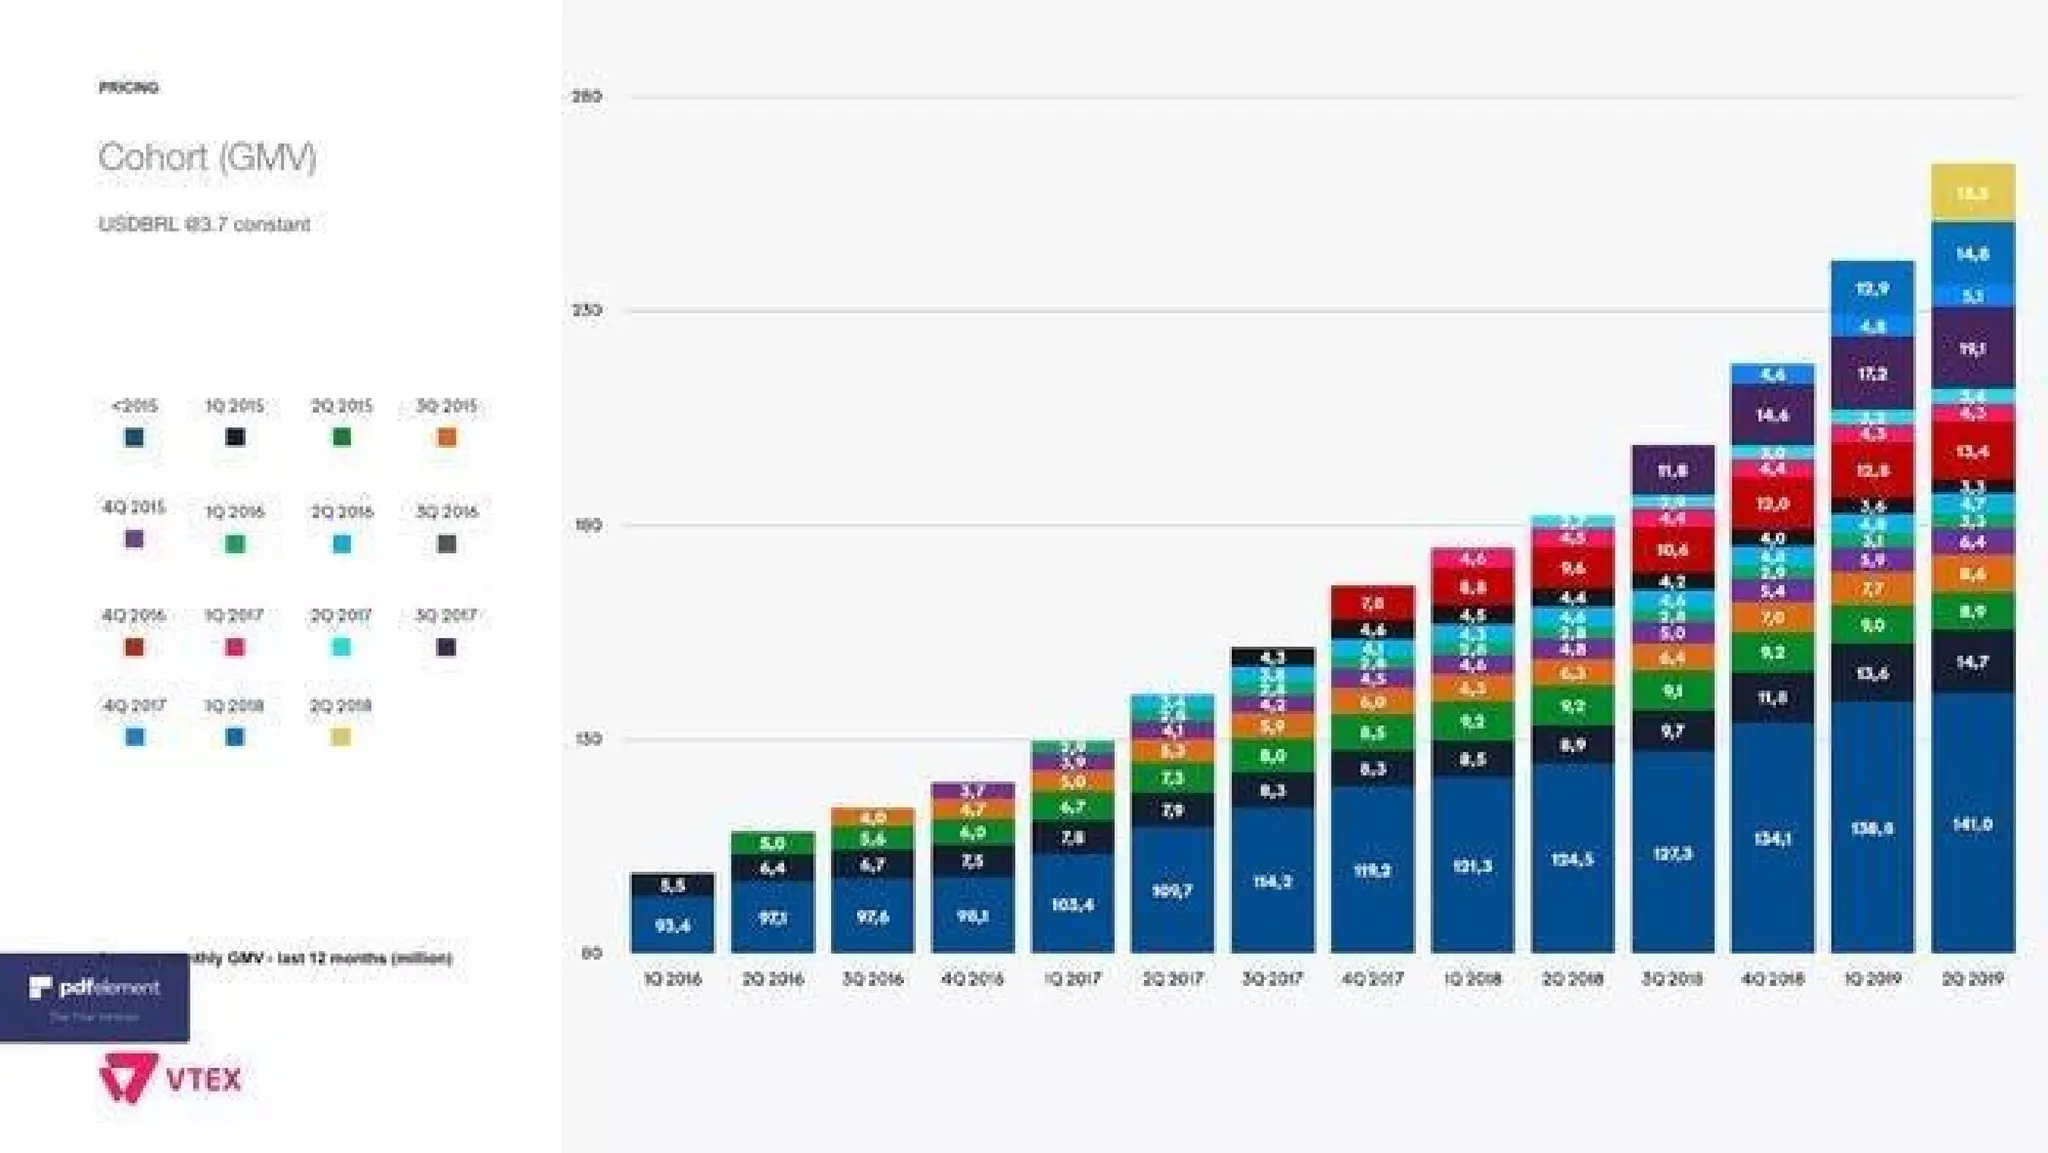
The pricing slide (slide_13) lays out tiered plans and fee structures (On Demand, Business, Corporate, Enterprise) with monthly fees, annual fixed fees and percentage-based charges. That combination clarifies how VTEX aligns pricing to client size and usage, and the cohort/GMV slide (slide_15) shows how customer cohorts build cumulative GMV over time — evidence that pricing captures long-term transaction value.

This dual presentation helps investors understand both short-term ARR mechanics and long-term monetization potential via GMV share or fees. Founders should emulate clear, simple pricing illustrations and pair them with cohort economics to demonstrate how customer lifetime value grows and why the pricing model scales with customer success.

Key Takeaway: Present simple tiered pricing plus cohort GMV charts so investors can see immediate ARR drivers and long-term monetization upside.
Platform architecture & ecosystem: data orchestration and inStore strategy

Platform architecture & ecosystem: data orchestration and inStore strategy

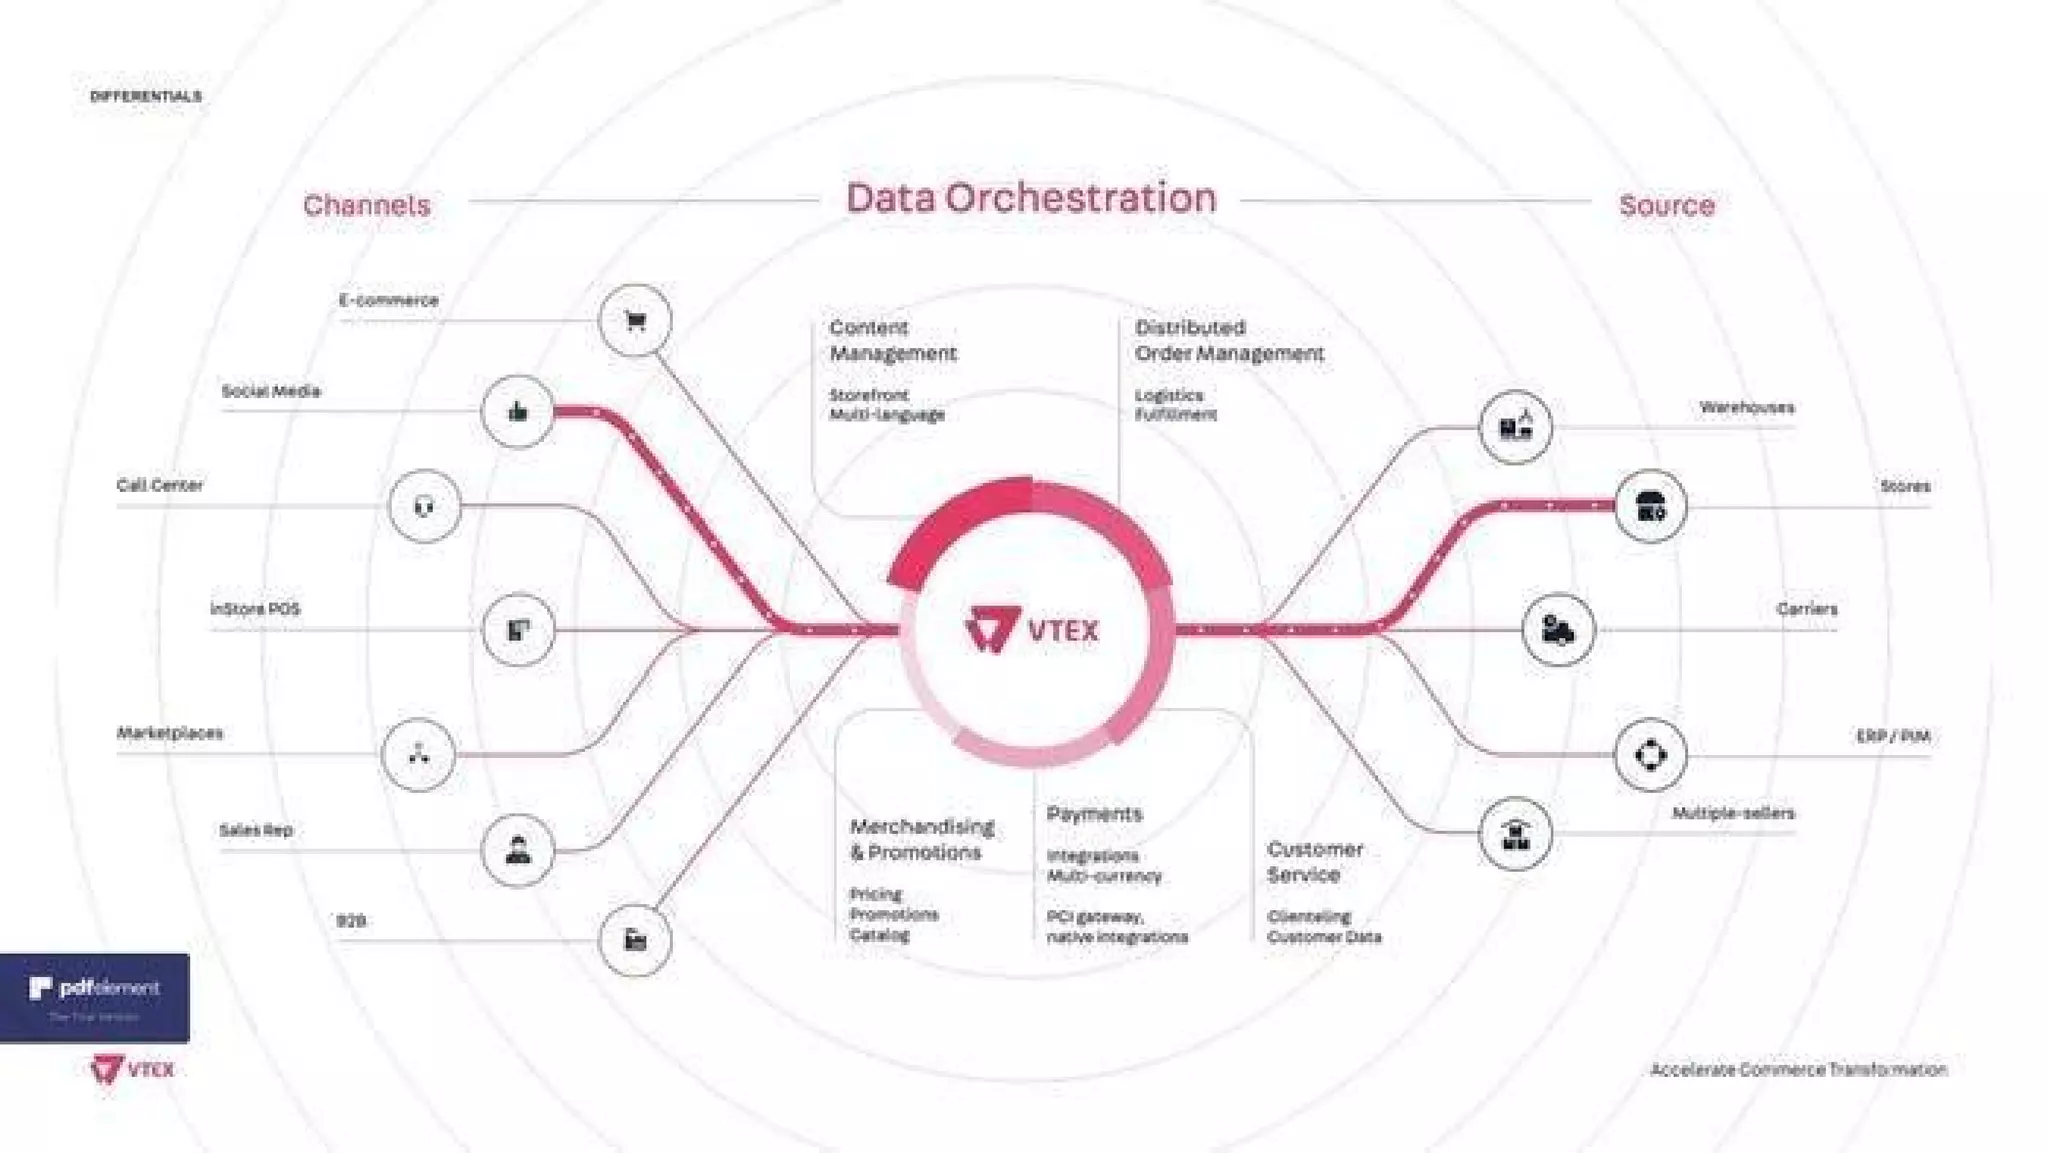
The data orchestration diagram (slide_22) and the inStore/VTEX IO architecture slides show a thoughtful platform strategy: VTEX positions itself as the central orchestration layer between channels (ecommerce, POS, marketplaces) and enterprise sources (ERP, warehouses, carriers). This visual communicates product breadth (catalogs, payments, OMS) and the connective tissue (APIs, microservices) that enables complex omnichannel scenarios.

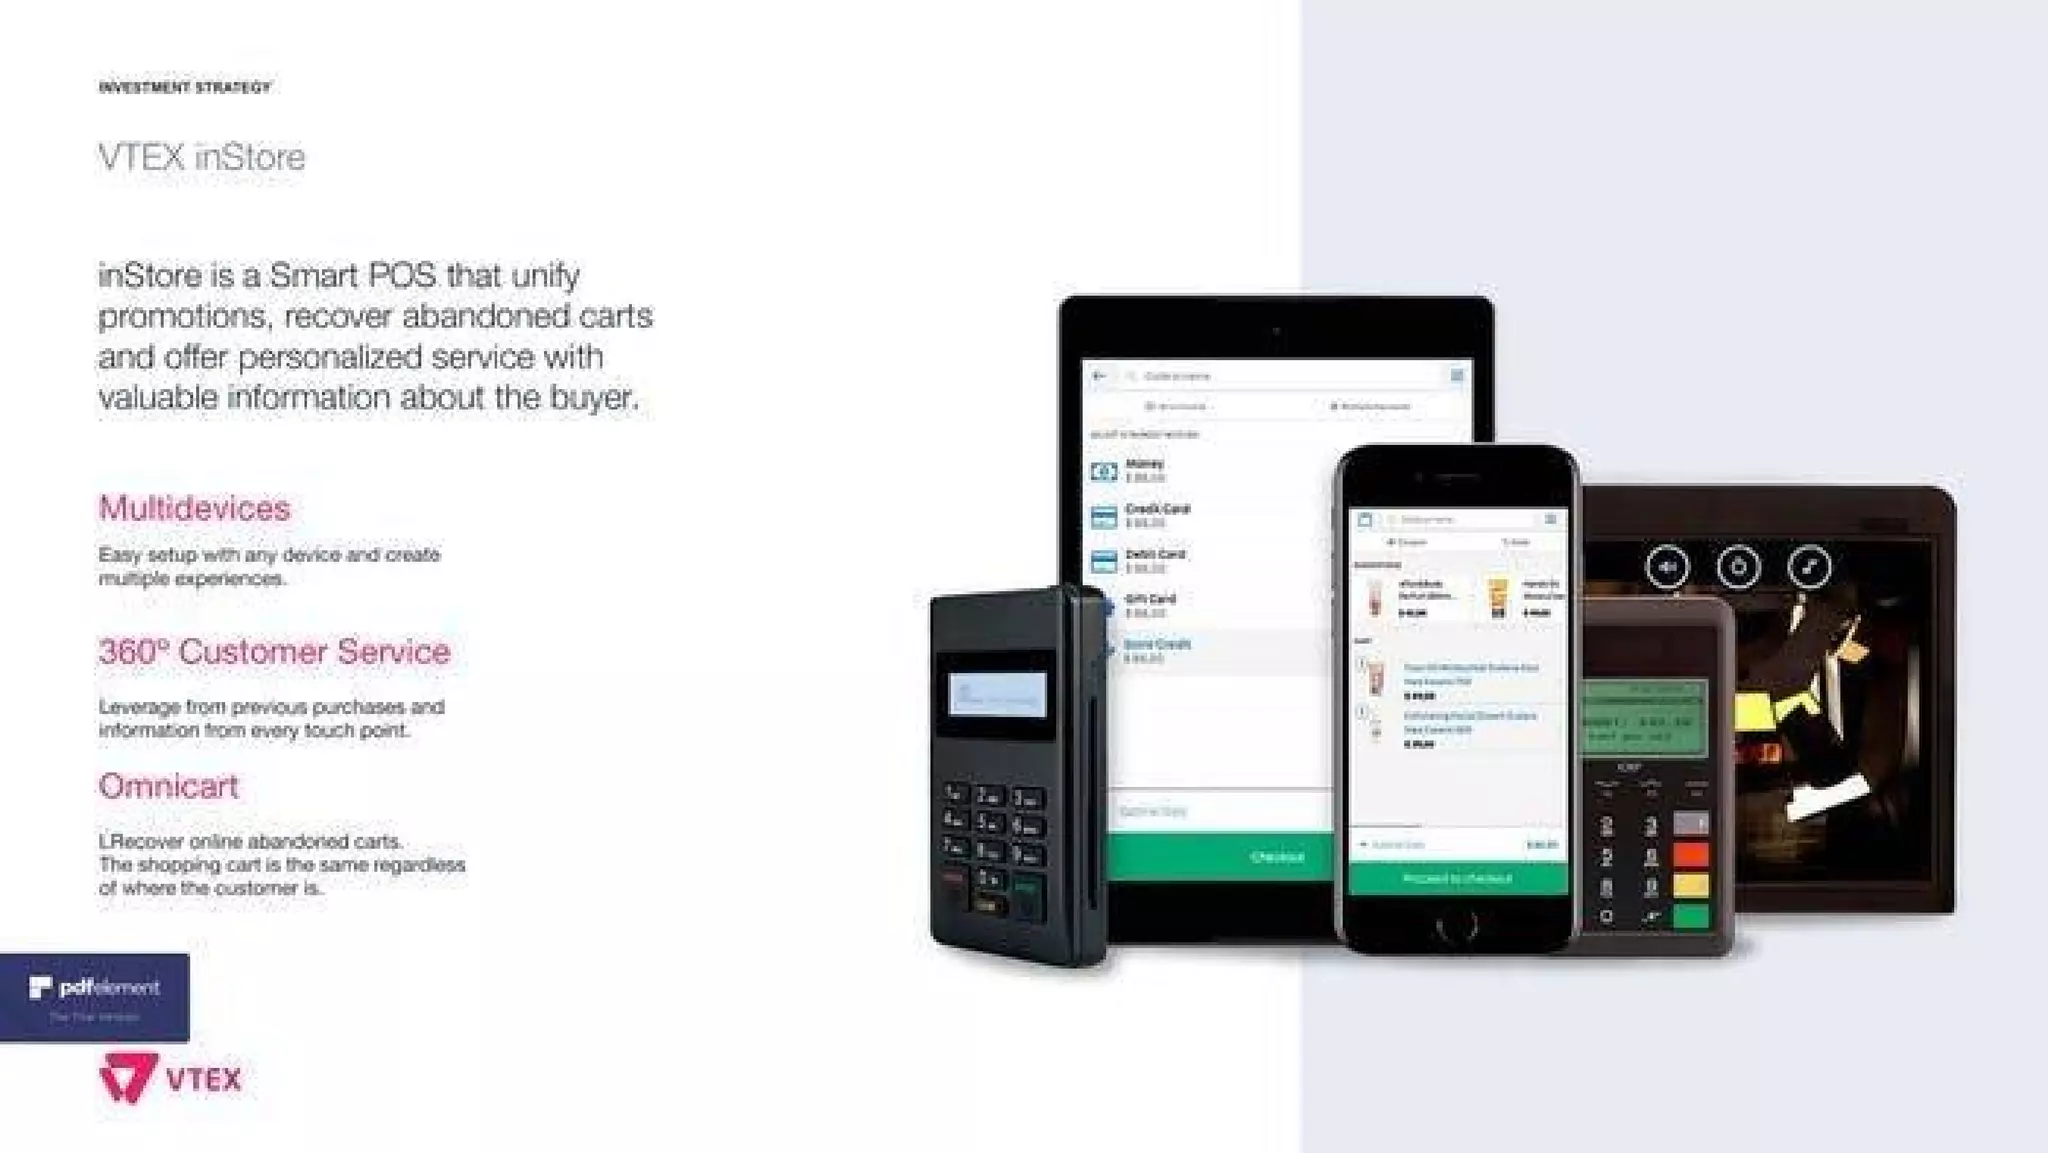
Additionally, the inStore POS and VTEX Day slides (slide_23/24) illustrate execution and community-building: a product that integrates online and offline commerce, plus ecosystem play (annual large conference) that drives partner adoption and brand awareness. Founders should map their platform visually to show how data flows, which components they own, and how ecosystem events or partner programs scale distribution and credibility.

Key Takeaway: Use a system-level diagram to show how your platform orchestrates data across channels and highlight ecosystem plays (POS integration, events) that expand distribution and references.
Community & scale proof: events and customer activation

Community & scale proof: events and customer activation

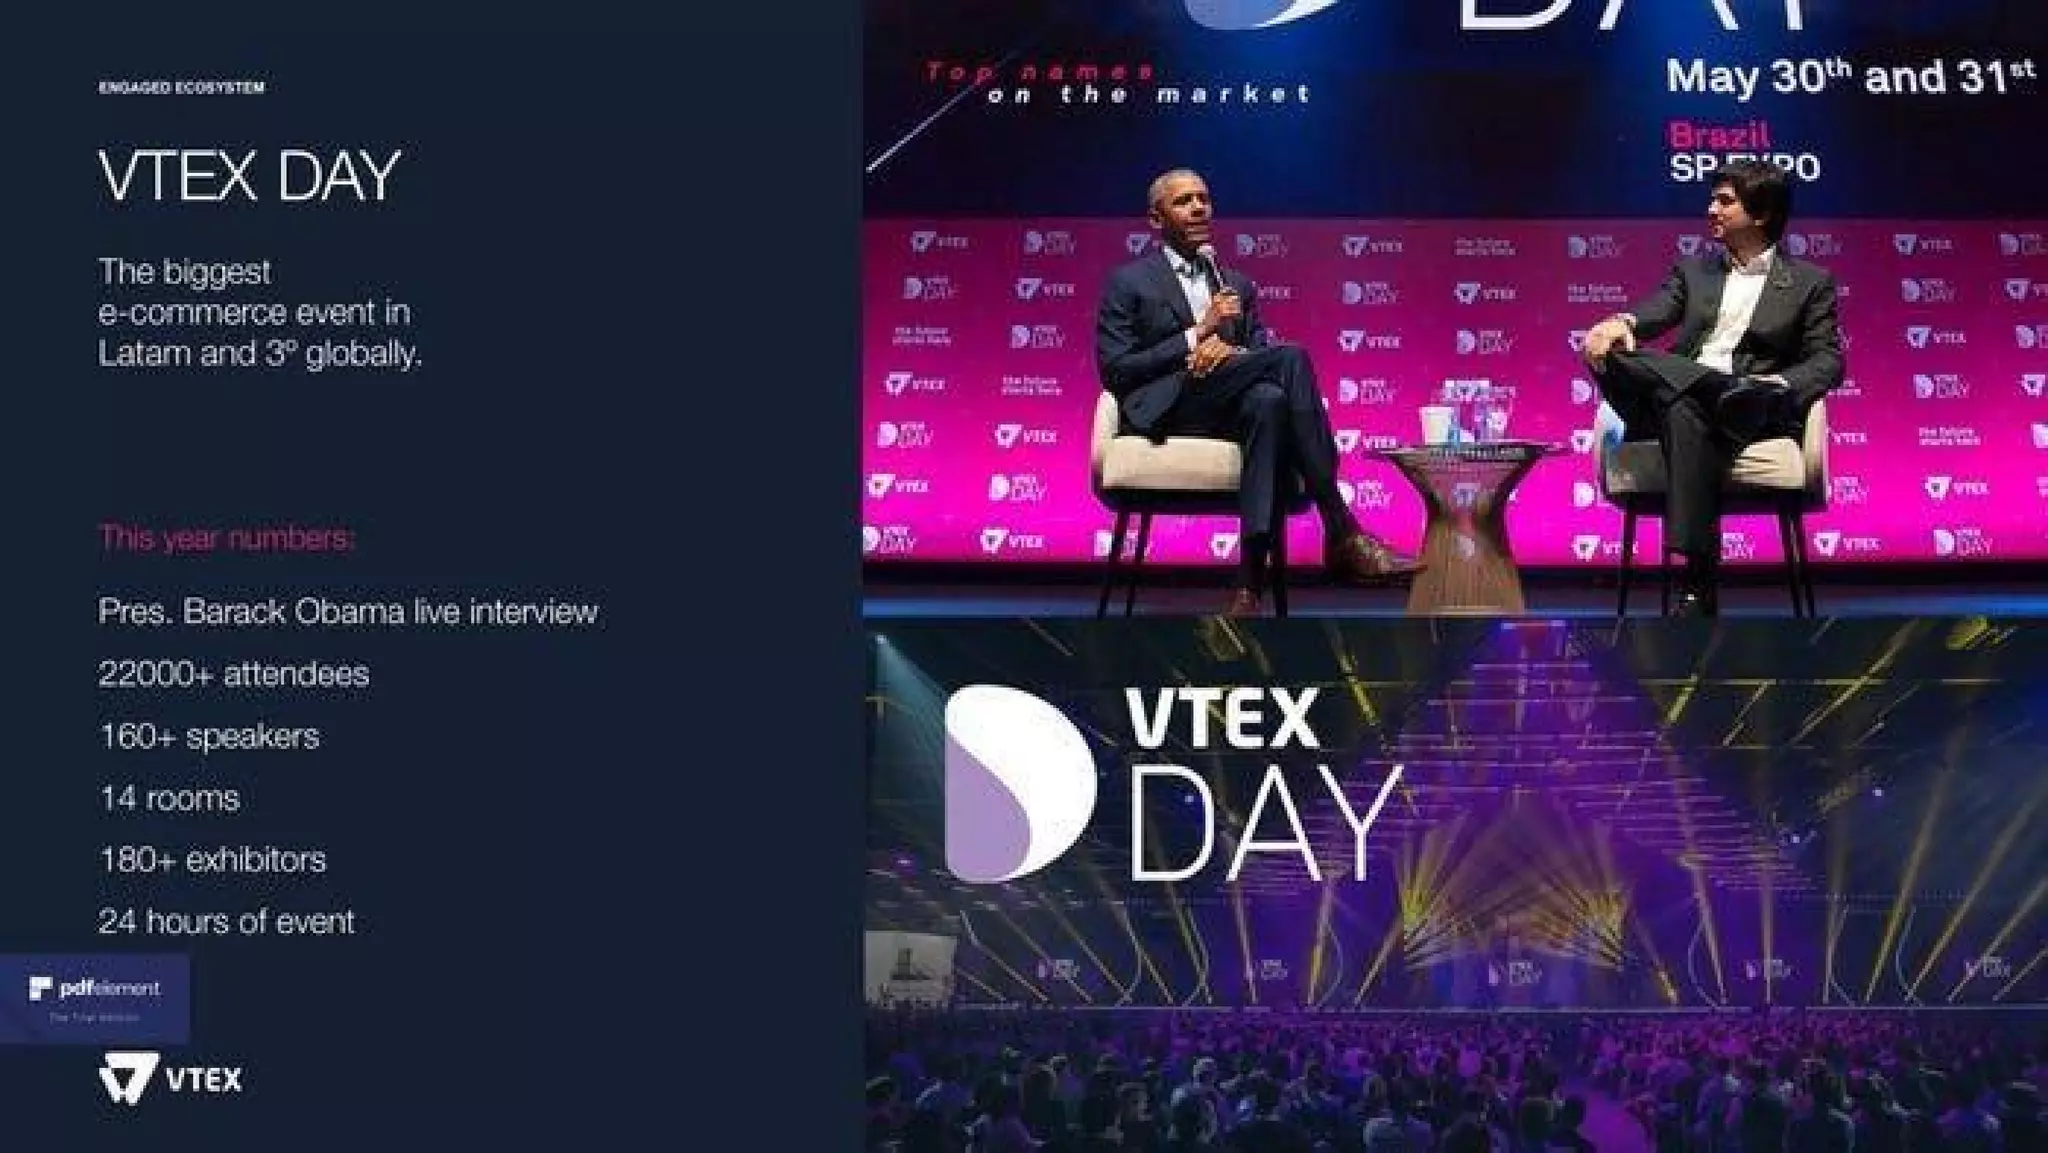
The VTEX Day slide (slide_24) is an example of turning community into a growth engine: it highlights a massive annual conference with thousands of attendees, high-profile speakers and many exhibitors. This both markets the product and builds sticky relationships with partners and customers — a multiplier effect for enterprise sales and developer adoption.

For investors, a recurring flagship event signals a mature go-to-market and a brand capable of generating network effects. Founders should consider strategies to create repeatable community touchpoints (conferences, developer summits, certification programs) because they accelerate sales cycles, provide reference accounts, and create defensibility beyond pure product features.

Key Takeaway: Invest in repeatable community and events to create network effects, accelerate sales cycles, and produce reference customers.

Conclusion: Key Lessons

VTEX’s deck is an exemplar for enterprise SaaS founders: it balances design, social proof, clear KPIs, product architecture and go-to-market mechanics. Strengths include early presentation of logos and metrics, combined revenue + margin storytelling, operational/engineering metrics that reassure technical buyers, and system diagrams that show how the product fits into customers’ ecosystems. The deck also demonstrates the value of community and ecosystem plays for scaling enterprise adoption.

Actionable advice: lead with a crisp positioning and brand; show logos plus compact KPI definitions early; present revenue and margin trends together; surface technical operational metrics that matter to buyers; use system diagrams to explain integrations and data flows; and build repeatable community programs to amplify sales. Together these elements help investors and customers quickly understand market opportunity, product defensibility and the team’s ability to execute at scale.

Full Deck Analysis

11 sections

Overview

Company: VTEX
Round: Series A ($5M)
Year: 2012
Outcome: IPO at $4.6B on NYSE (2021)

Executive Summary

VTEX’s Series A deck (as packaged here) positions the company as an enterprise-grade, multi-tenant commerce platform built for omnichannel, marketplaces and in-store unification. The deck mixes product / technology differentiation (microservices, true SaaS, VTEX IO), strong enterprise traction (global clients and GMV), and clear commercial packaging (tiered pricing + transaction fees). It’s notable because the company scaled from an early growth round to a major public exit — and the deck surfaces the core product and GTM choices that enabled that trajectory.


Problem Statement

How the deck articulates the problem:

  • Fragmented commerce stacks and complex, slow enterprise digital transformations that require many point products (slides 10–12, 16, 21–22).
  • Enterprises need unified channel-agnostic commerce, marketplace integrations, in-store + online unification, and scalable infra for peak demand (slides 11, 12, 16, 22).
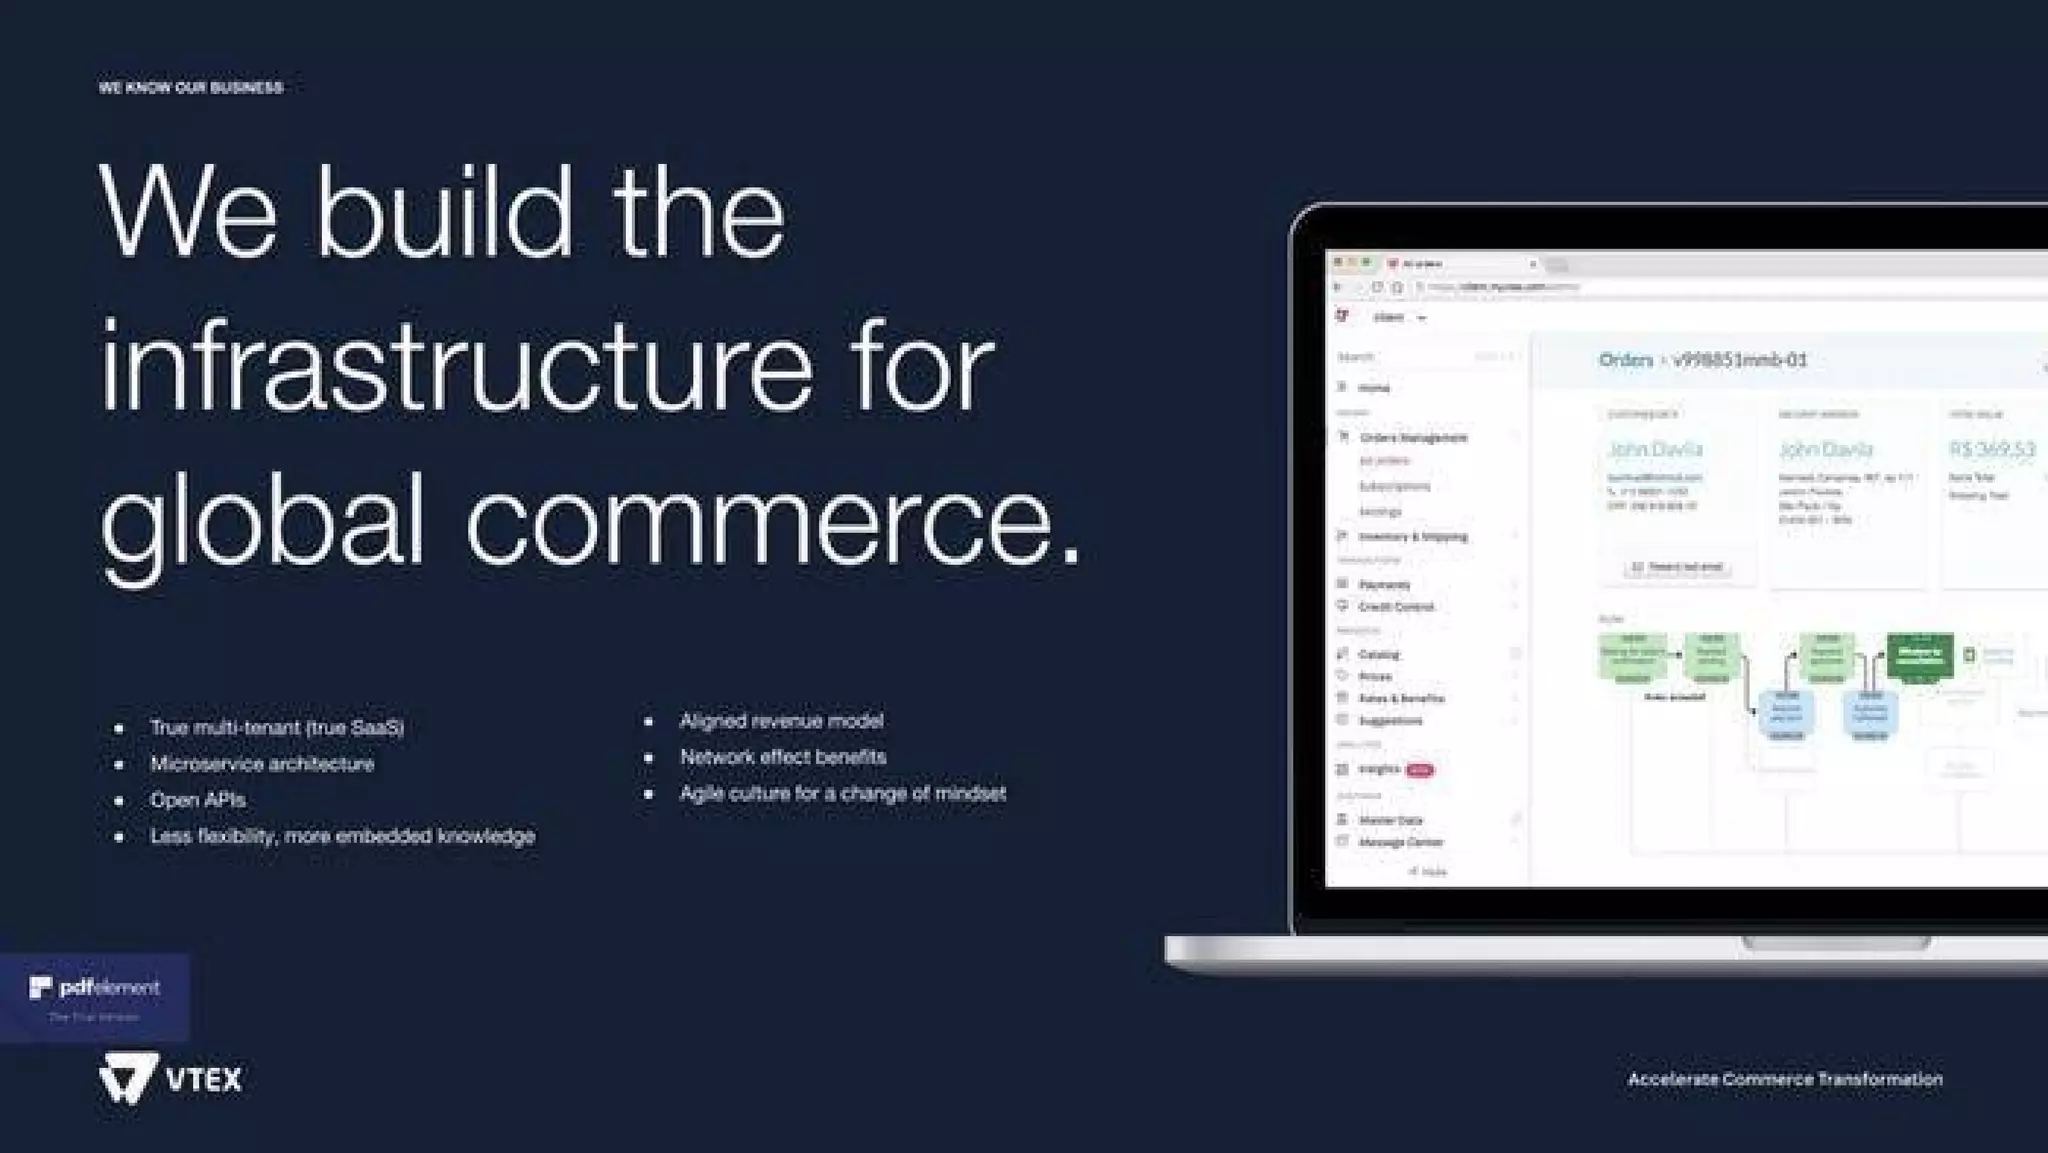
  • The problem framing is presented implicitly across the “Differentials” and “We build the infrastructure for global commerce” slides (11–12, 16). The deck therefore describes the customer pain as complexity + slow time-to-value rather than a single bullet-point “problem” slide.

Referenced slides: 10–12, 16, 21–22.


Solution

How the deck positions the solution:

  • VTEX is presented as a “true multi-tenant” commerce SaaS platform with microservices, open APIs, and a headless-capable architecture (slides 17, 20).
  • Product components: VTEX Core capabilities + RESTful APIs, VTEX Admin, VTEX IO (developer platform), VTEX inStore (POS), marketplace & payments integrations (slides 20–23).
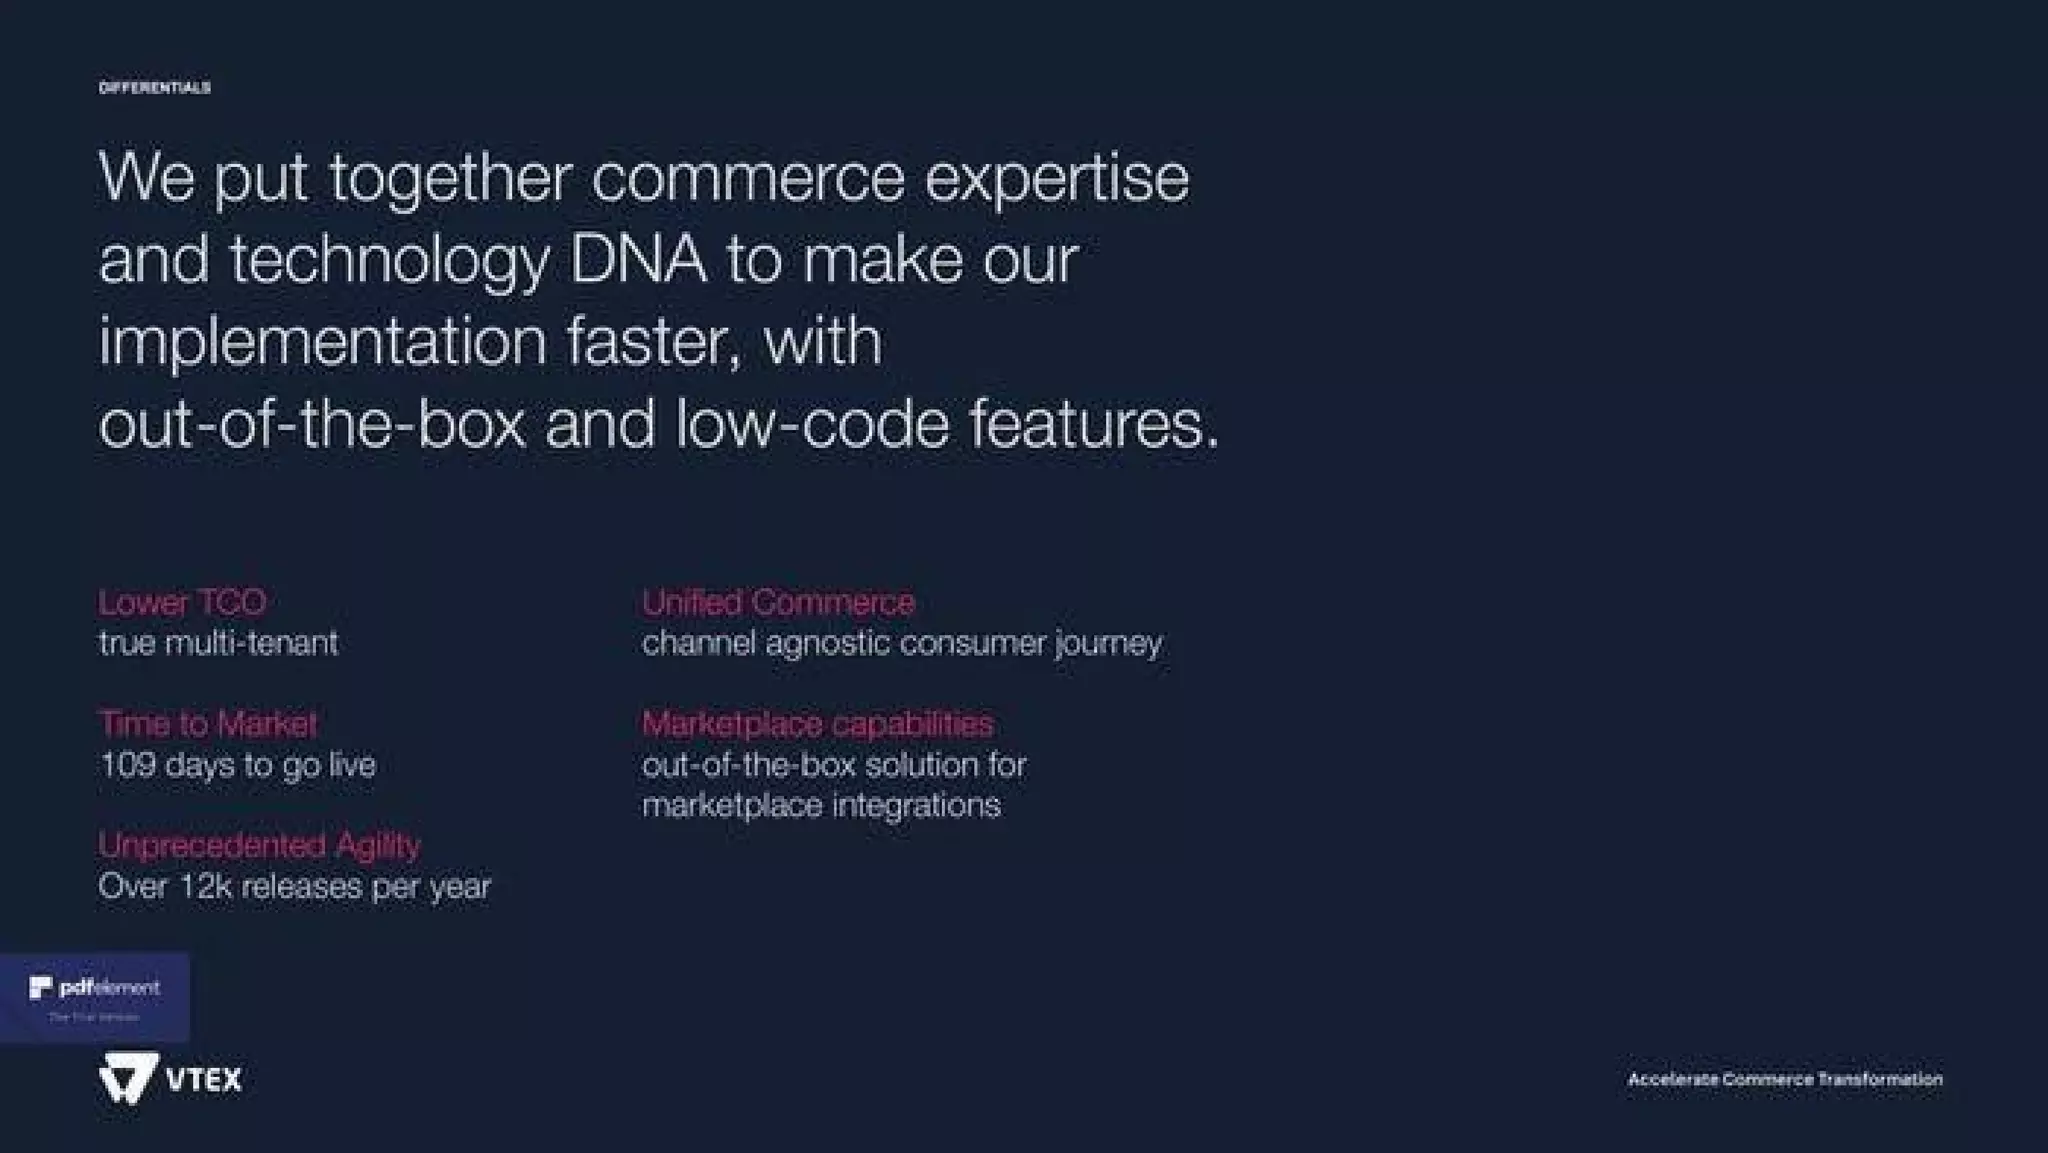
  • Key value propositions: faster time-to-market (109 days), high release cadence (+12k releases/yr), autoscaling for peak events, out-of-the-box marketplace features, and a lower total cost of ownership via multi-tenancy (slides 11, 12, 16, 18–19).

Referenced slides: 11, 12, 16, 17, 18–23.


Market Opportunity

TAM / SAM / SOM analysis (what is shown and implied):

  • The deck does not present a classic TAM / SAM / SOM breakdown. However it shows strong demand indicators:
    • GMV (Gross Merchandise Value) and cohort GMV growth are shown (slide 14) — stacked bar chart of marketplace/merchant GMV rising dramatically (quarterly cohorts). Exact sum not labeled as “TAM” but demonstrates large transactional opportunity.
    • Slide 3 lists “3.8B GMV (LTM in USD)” and “66MM ARR (July 2019 in USD)” — these are business-scale metrics rather than a top-level market sizing, but they imply a large addressable transaction market.
  • Investors must infer a large enterprise commerce market (hundreds of billions worldwide) from client logos (slide 2), global footprint (slide 4) and GMV trajectory (slide 14).

Referenced slides: 2, 3, 4, 14.
What’s missing: explicit TAM / SAM / SOM numbers.


Business Model

Revenue model and unit economics (what the deck shows):

  • Mixed pricing model: per-month subscription tiers + annual fixed fees + transaction / revenue share (slide 13).
    • Example table shown (slide 13): On Demand $500/mo (no annual fixed fee, 2.5% monthly), Business $500/mo (?? likely an alternate packaging), Corporate $1,500/mo (annual fixed fee $162k, 1.1% monthly), Enterprise $4,500/mo (annual fixed fee $368k, 0.5% monthly). (Exact cells on slide should be read directly; the deck shows explicit monthly/annual & transaction fee tiers.)
  • Marketplace enablement and transaction fees (marketplace revenue capture) are a central component of monetization.
  • ARR focus: slide 3 shows 66MM ARR (July 2019) and 7.8% ARR churn (LTM) — implying recurring revenue with manageable churn.
  • Gross margin trends: high gross margin shown (75% listed on slide 3 for 2018).
  • Pricing & model mix indicate SaaS subscription + platform take-rate (hybrid SaaS + revenue share).

Referenced slides: 3, 13.


Traction & Metrics

Growth metrics and proof points (explicit numbers shown in deck):

  • Net revenue growth (bar chart): progress from ~$5.4M (2012) → $8M (2013) → $11.3M (2014) → $17.5M (2015) → $27.2M (2016) → $35.7M (2017) → $48.1M (2018). CAGR reported as 44% (slide 6).
  • Gross margin trends (pink line) show movement from ~54% → dip → rise to ~75% in 2018 (slide 6).
  • Overview metrics (slide 3):
    • 75% gross margin (2018)
    • 44% Growth (last 6 years)
    • 21% SSS (2019 YTD)
    • 3.8B GMV (LTM)
    • 66MM ARR (July 2019)
    • 7.8% ARR Churn Rate (LTM)
    • NDR YoY 112% (2019 YTD)
  • Customer roster includes major enterprise brands (Samsung, Levi’s, L’Oréal, Whirlpool, Walmart, Nestlé, PepsiCo, etc.) — slide 2.
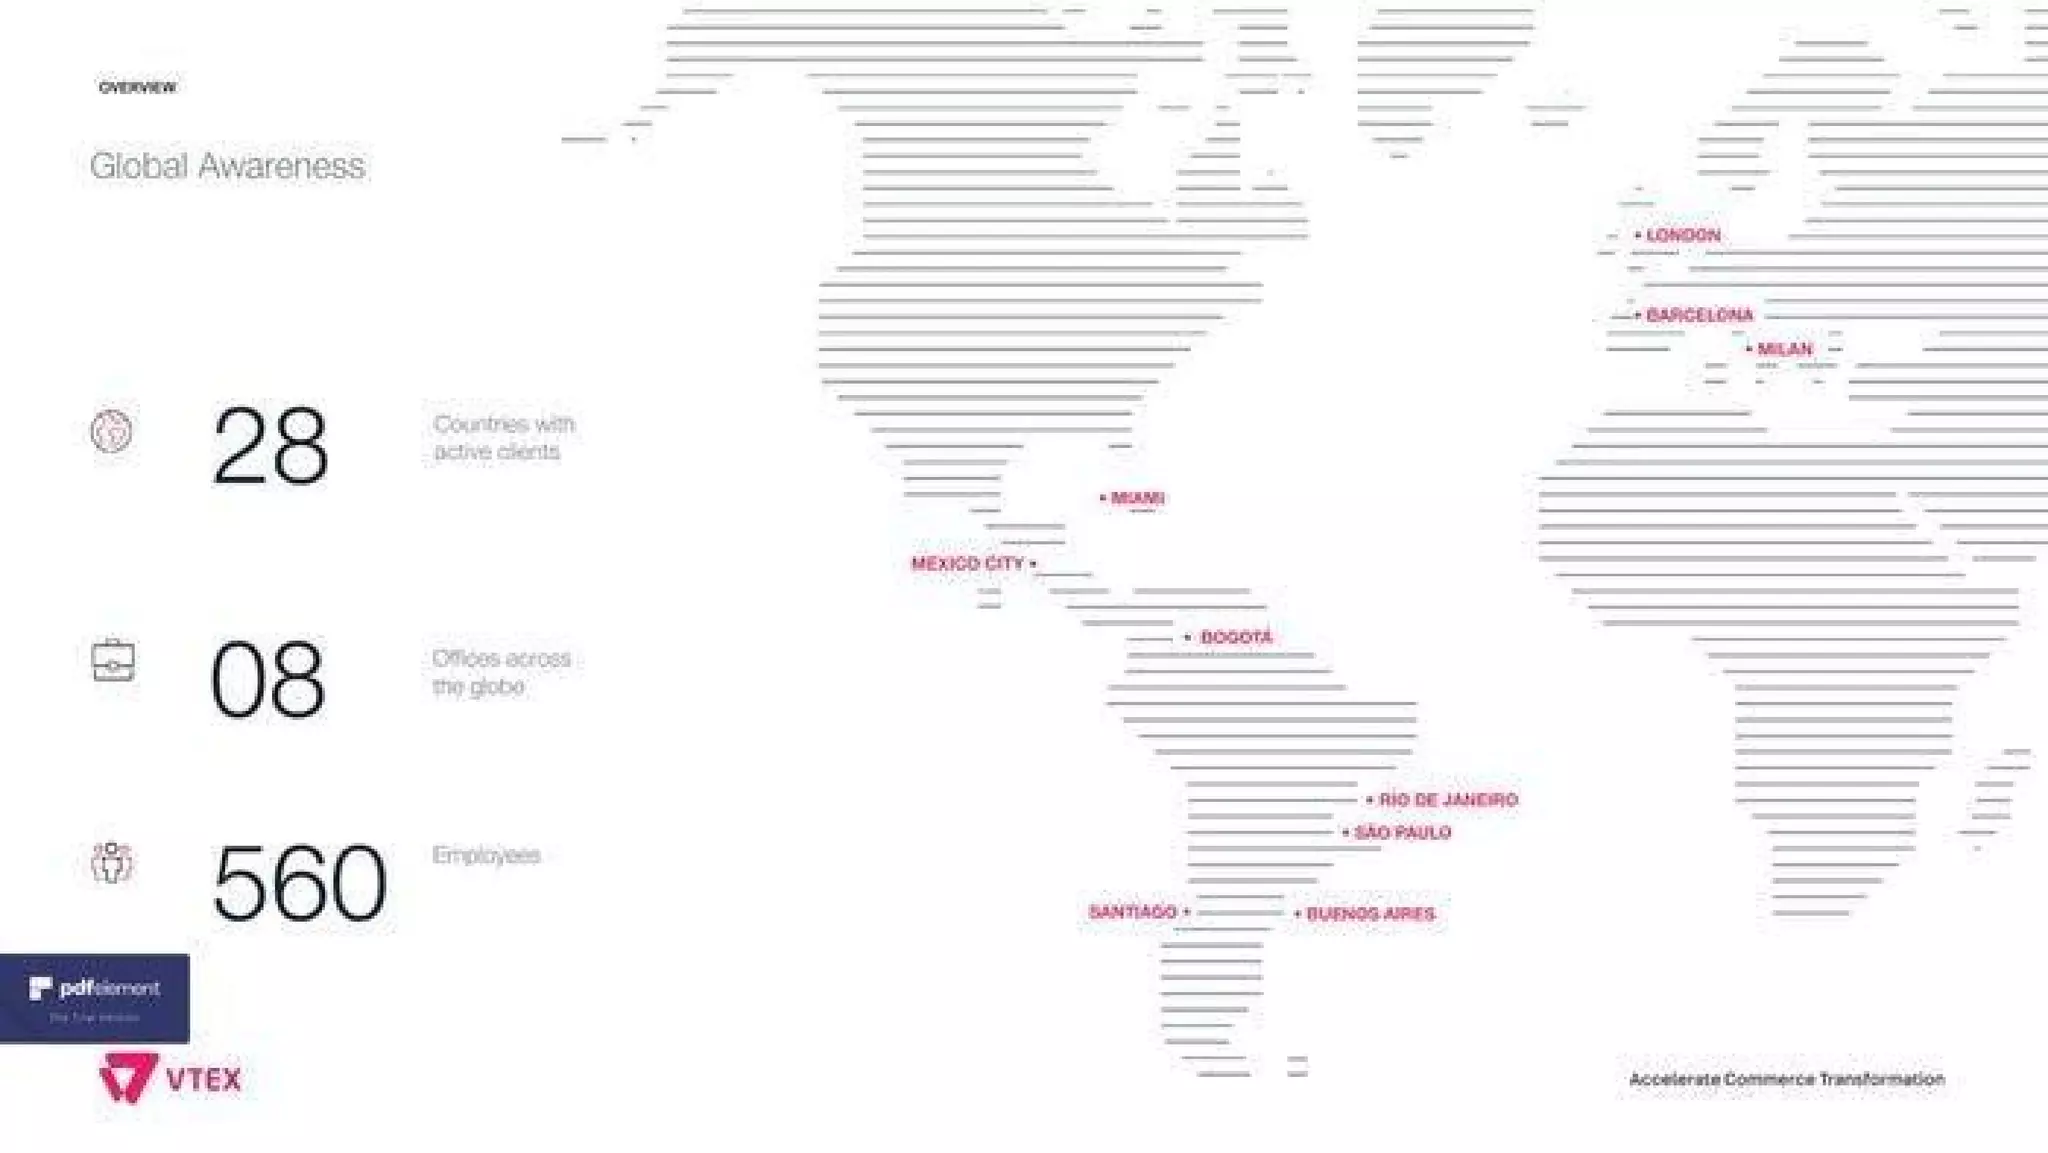
  • Global footprint: 28 countries with active clients, 8 offices, 560 employees (slide 4).
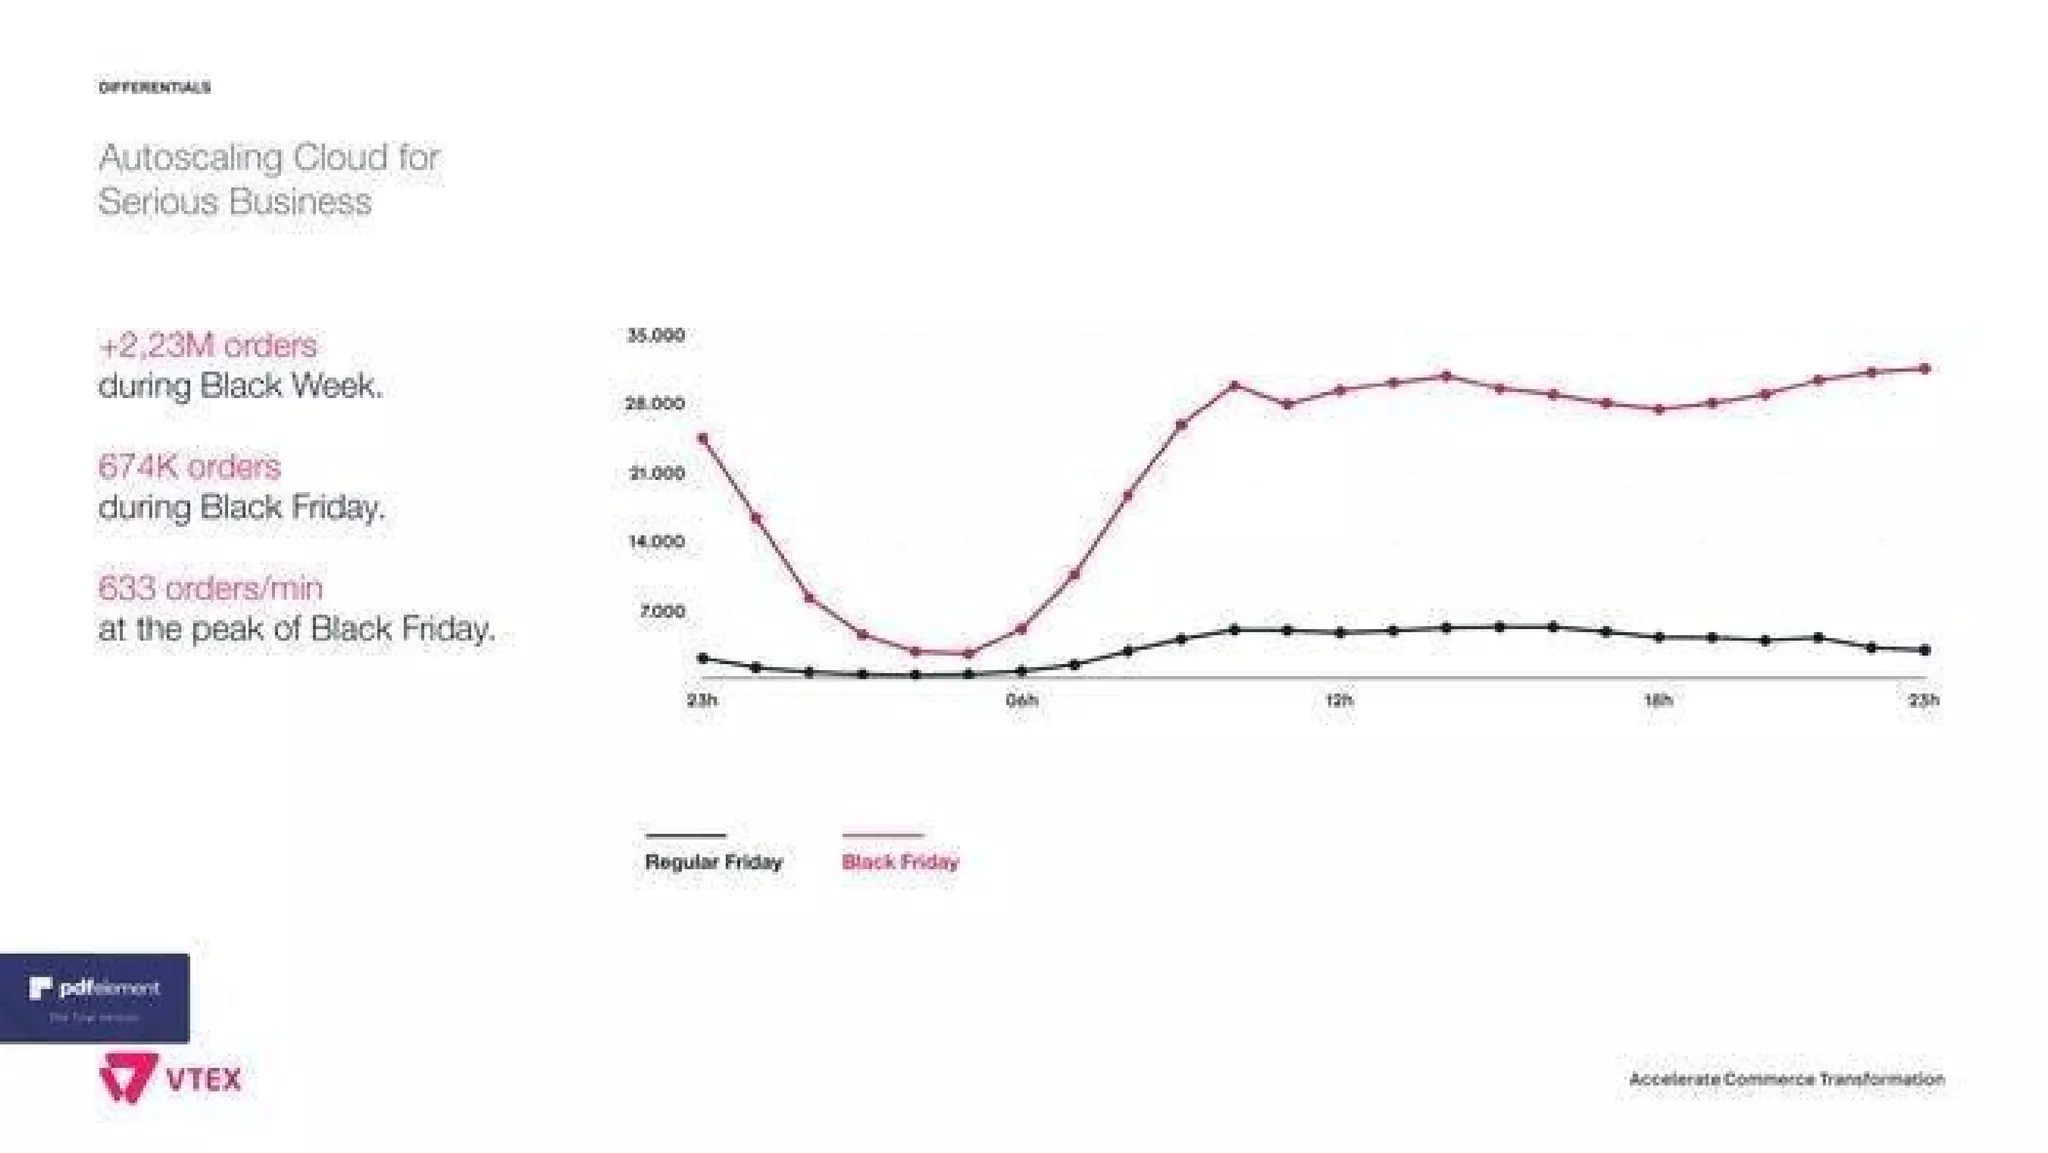
  • Peak capacity benchmarks: 674K orders during Black Friday, +2.23M orders during Black Week, 633 orders/min peak (slide 18).

Referenced slides: 2–4, 6, 14, 18.


Competitive Positioning

How they differentiate:

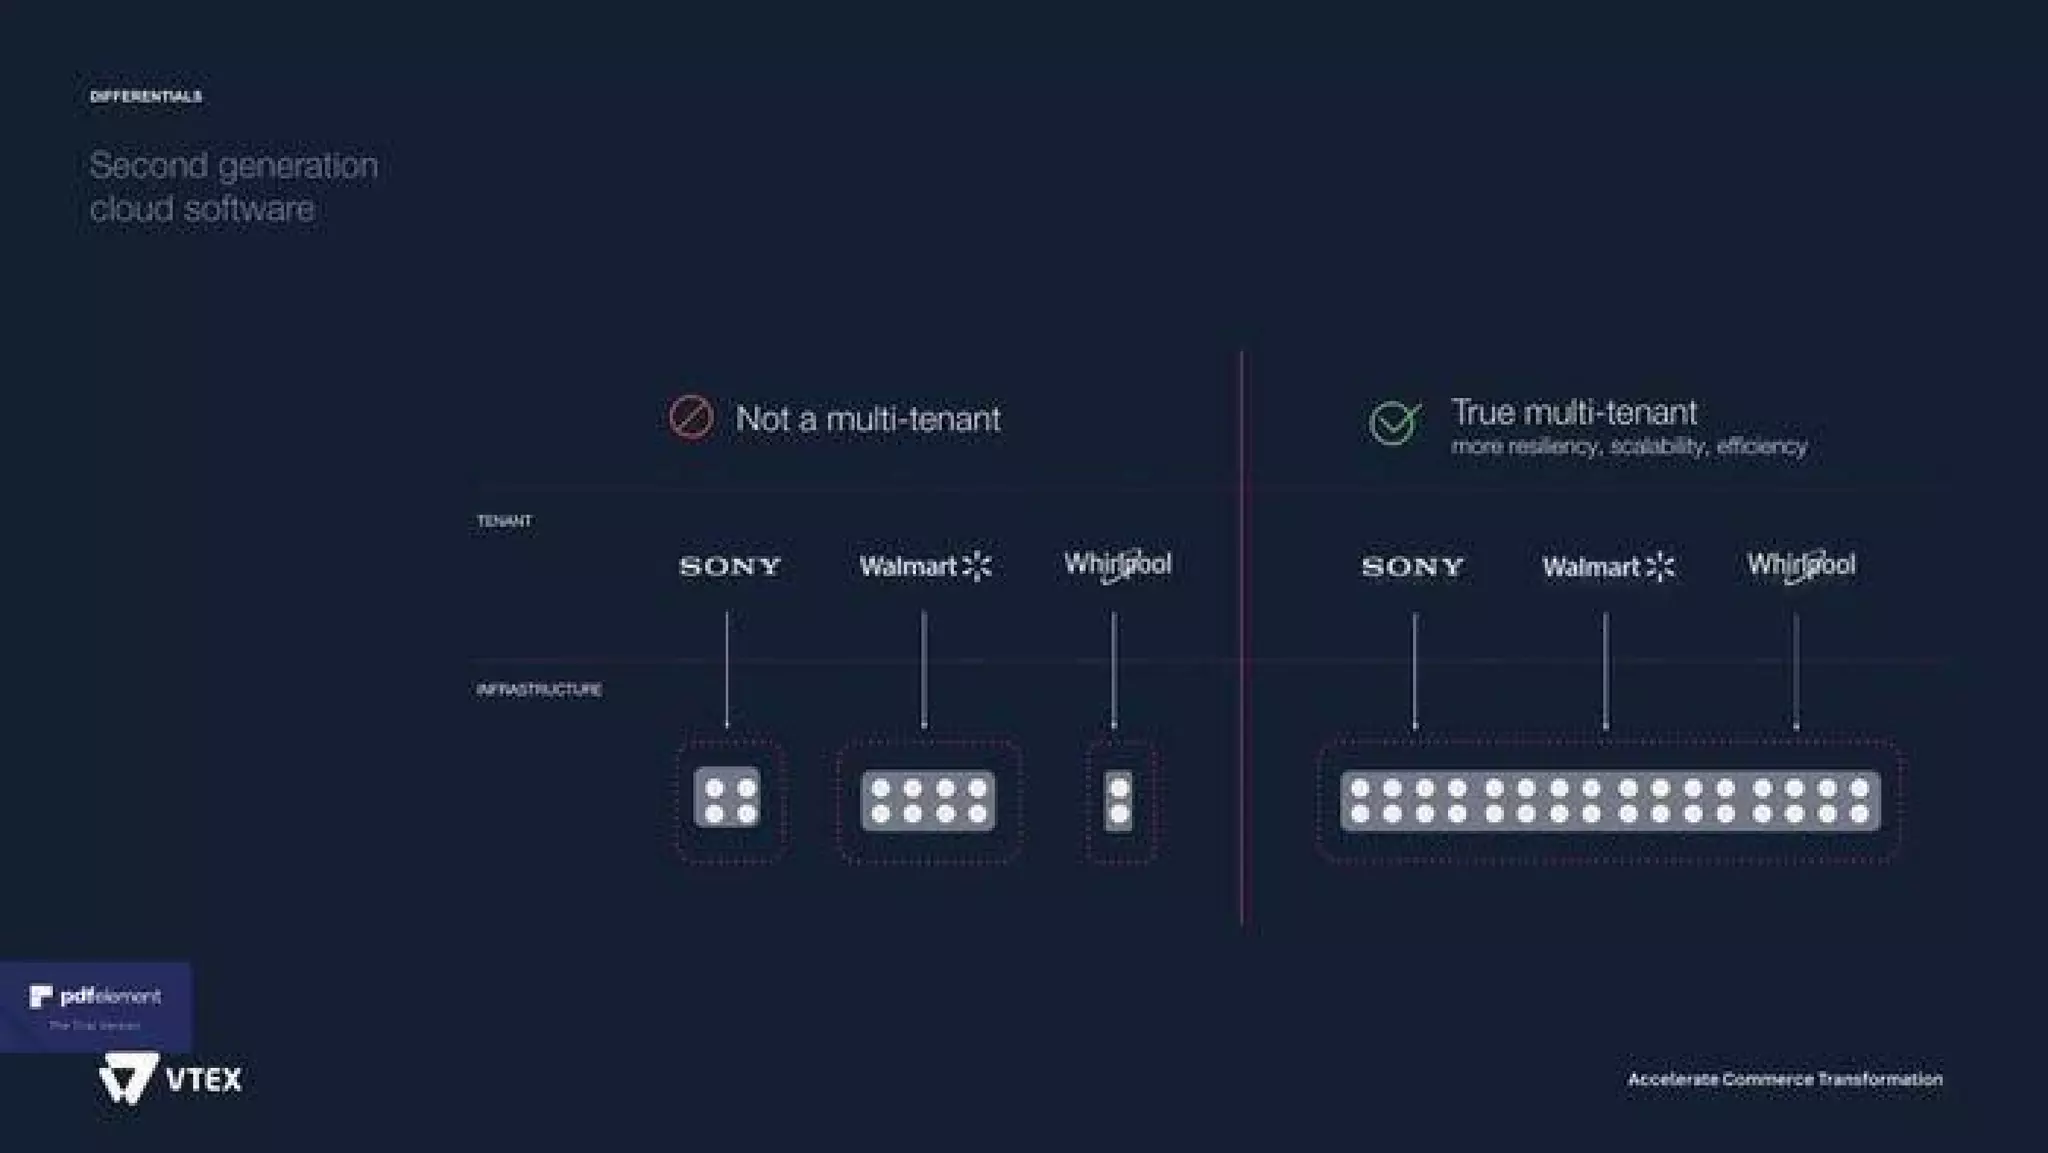
  • Technology: true multi-tenant SaaS + microservices + open APIs + VTEX IO (slides 17, 20). The deck contrasts legacy single-tenant architectures vs VTEX’s shared, efficient model (slide 17).
  • Speed & agility: 109 days average time-to-go-live; 12k releases per year; low-code/out-of-the-box marketplace features (slides 11, 12).
  • Operational proof: autoscaling for Black Friday and documented performance numbers (slide 18).
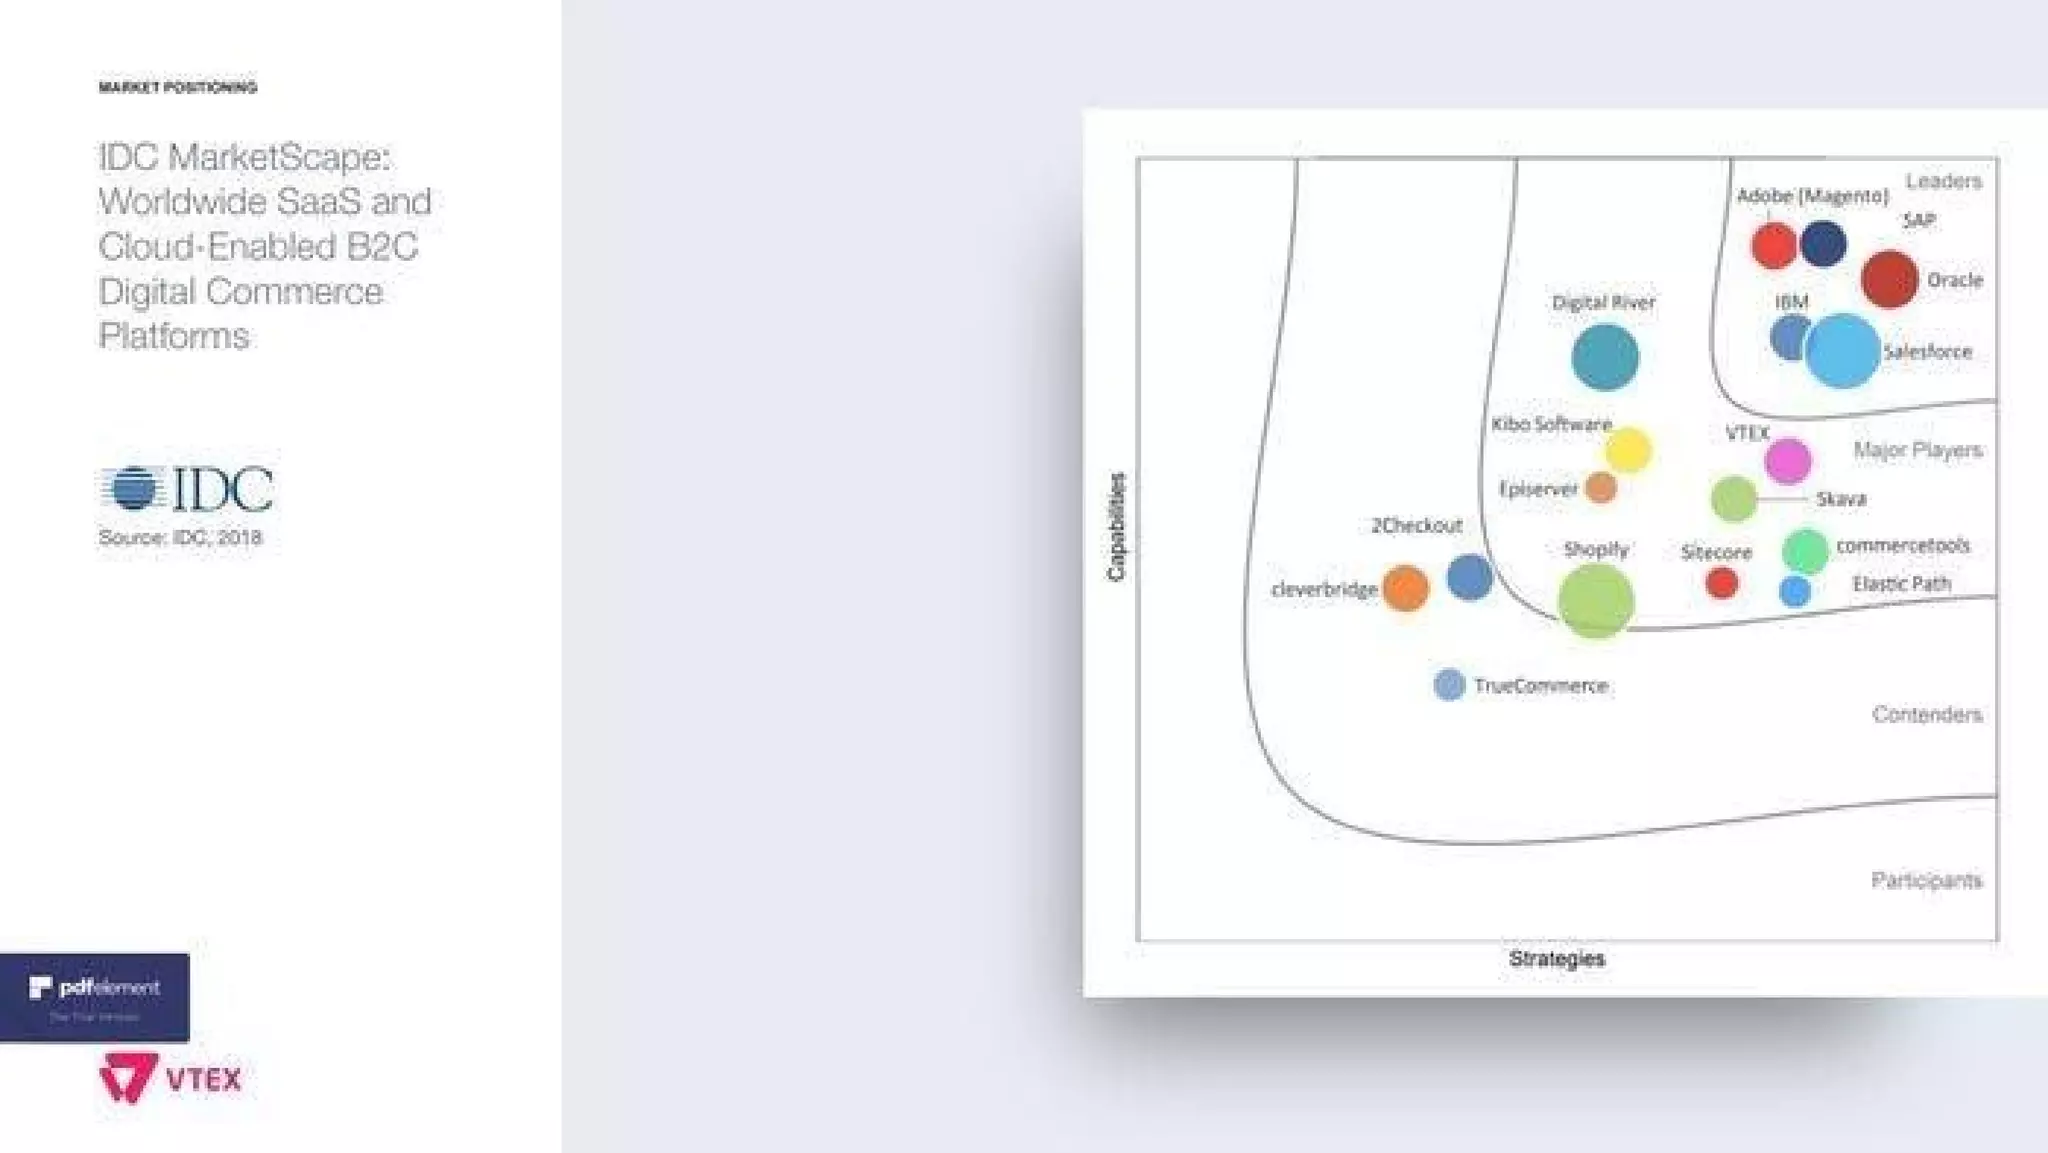
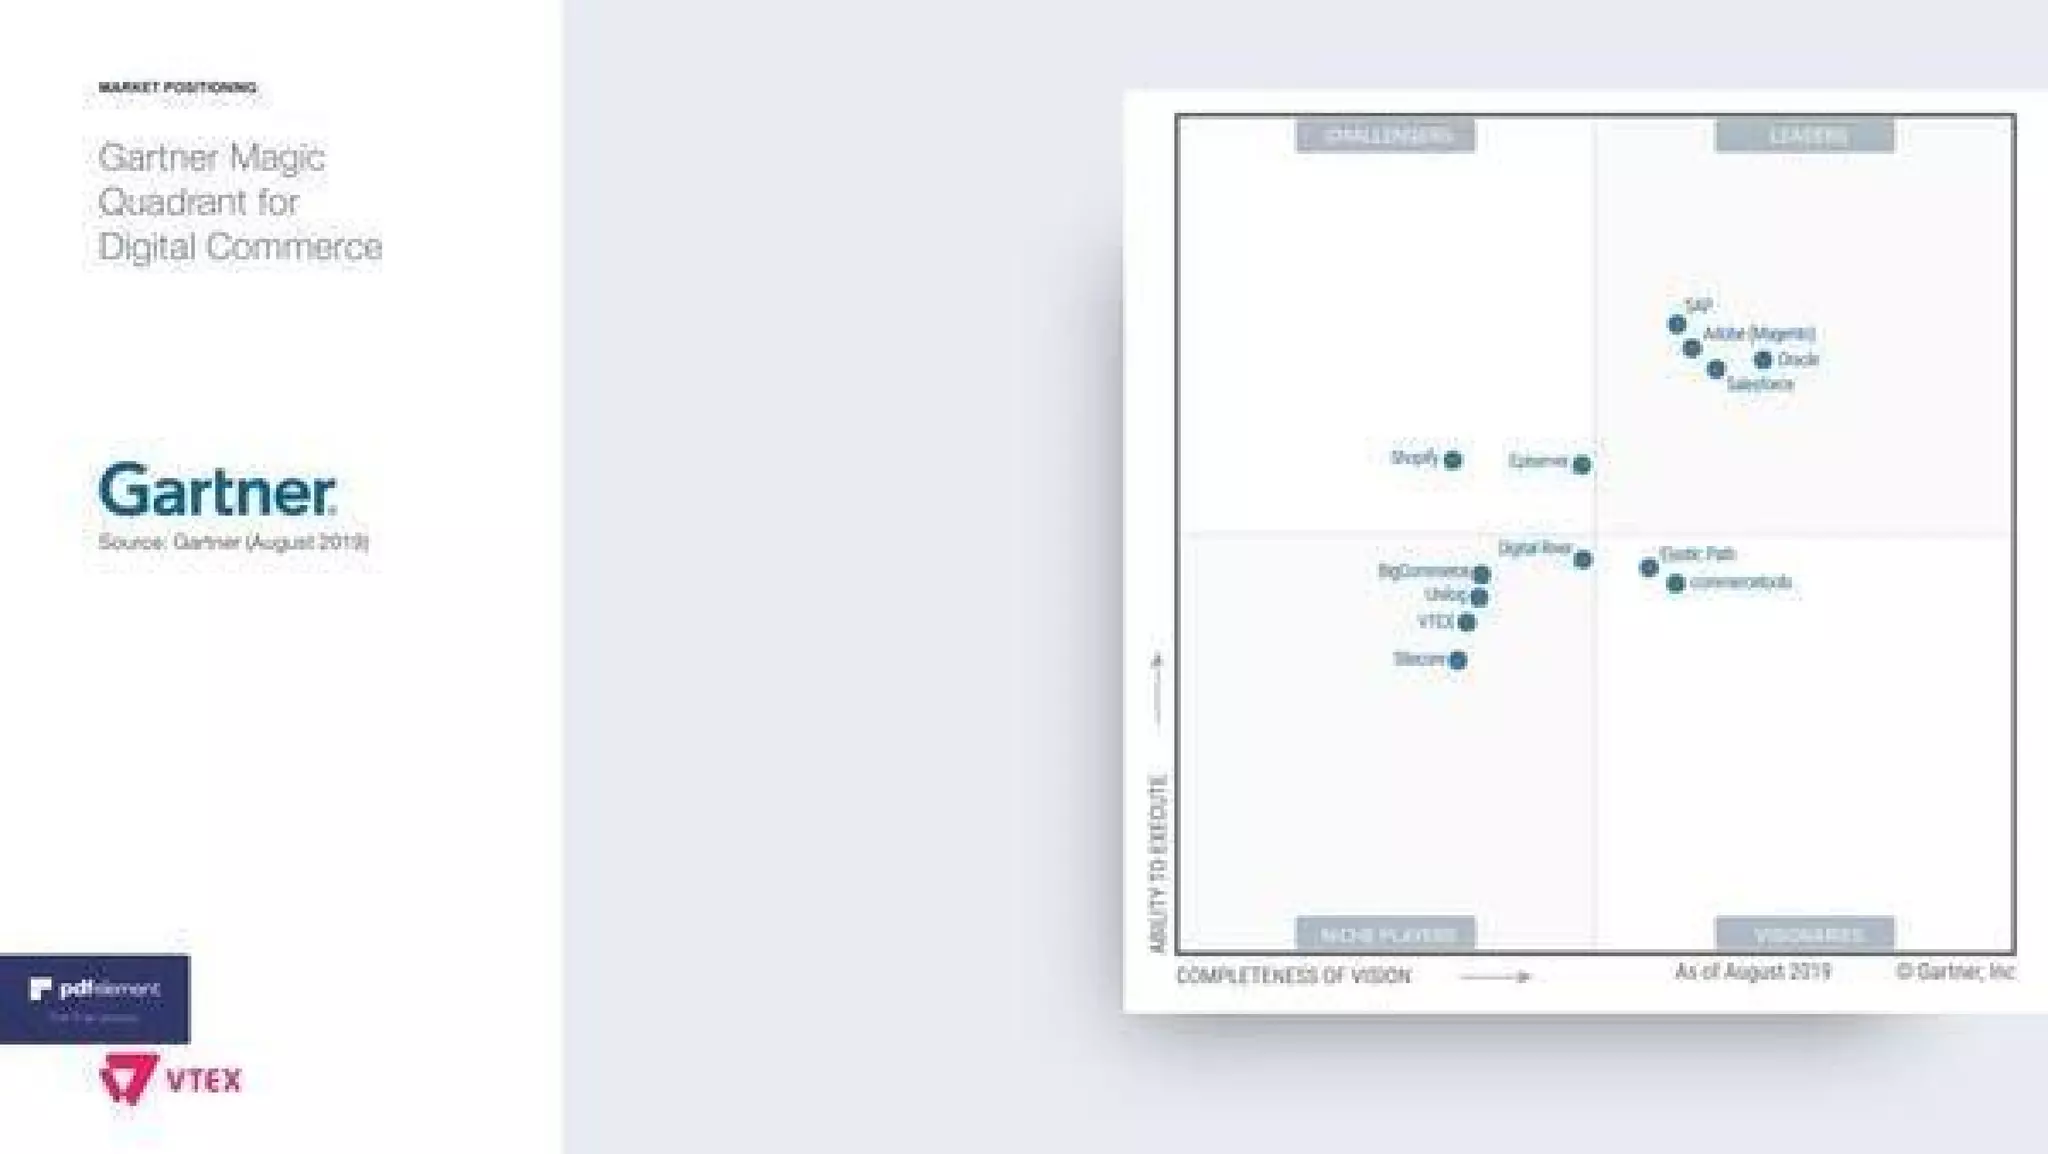
  • Market recognition: placed on IDC and Gartner maps (slides 8–9) positioning VTEX among leaders/major players.
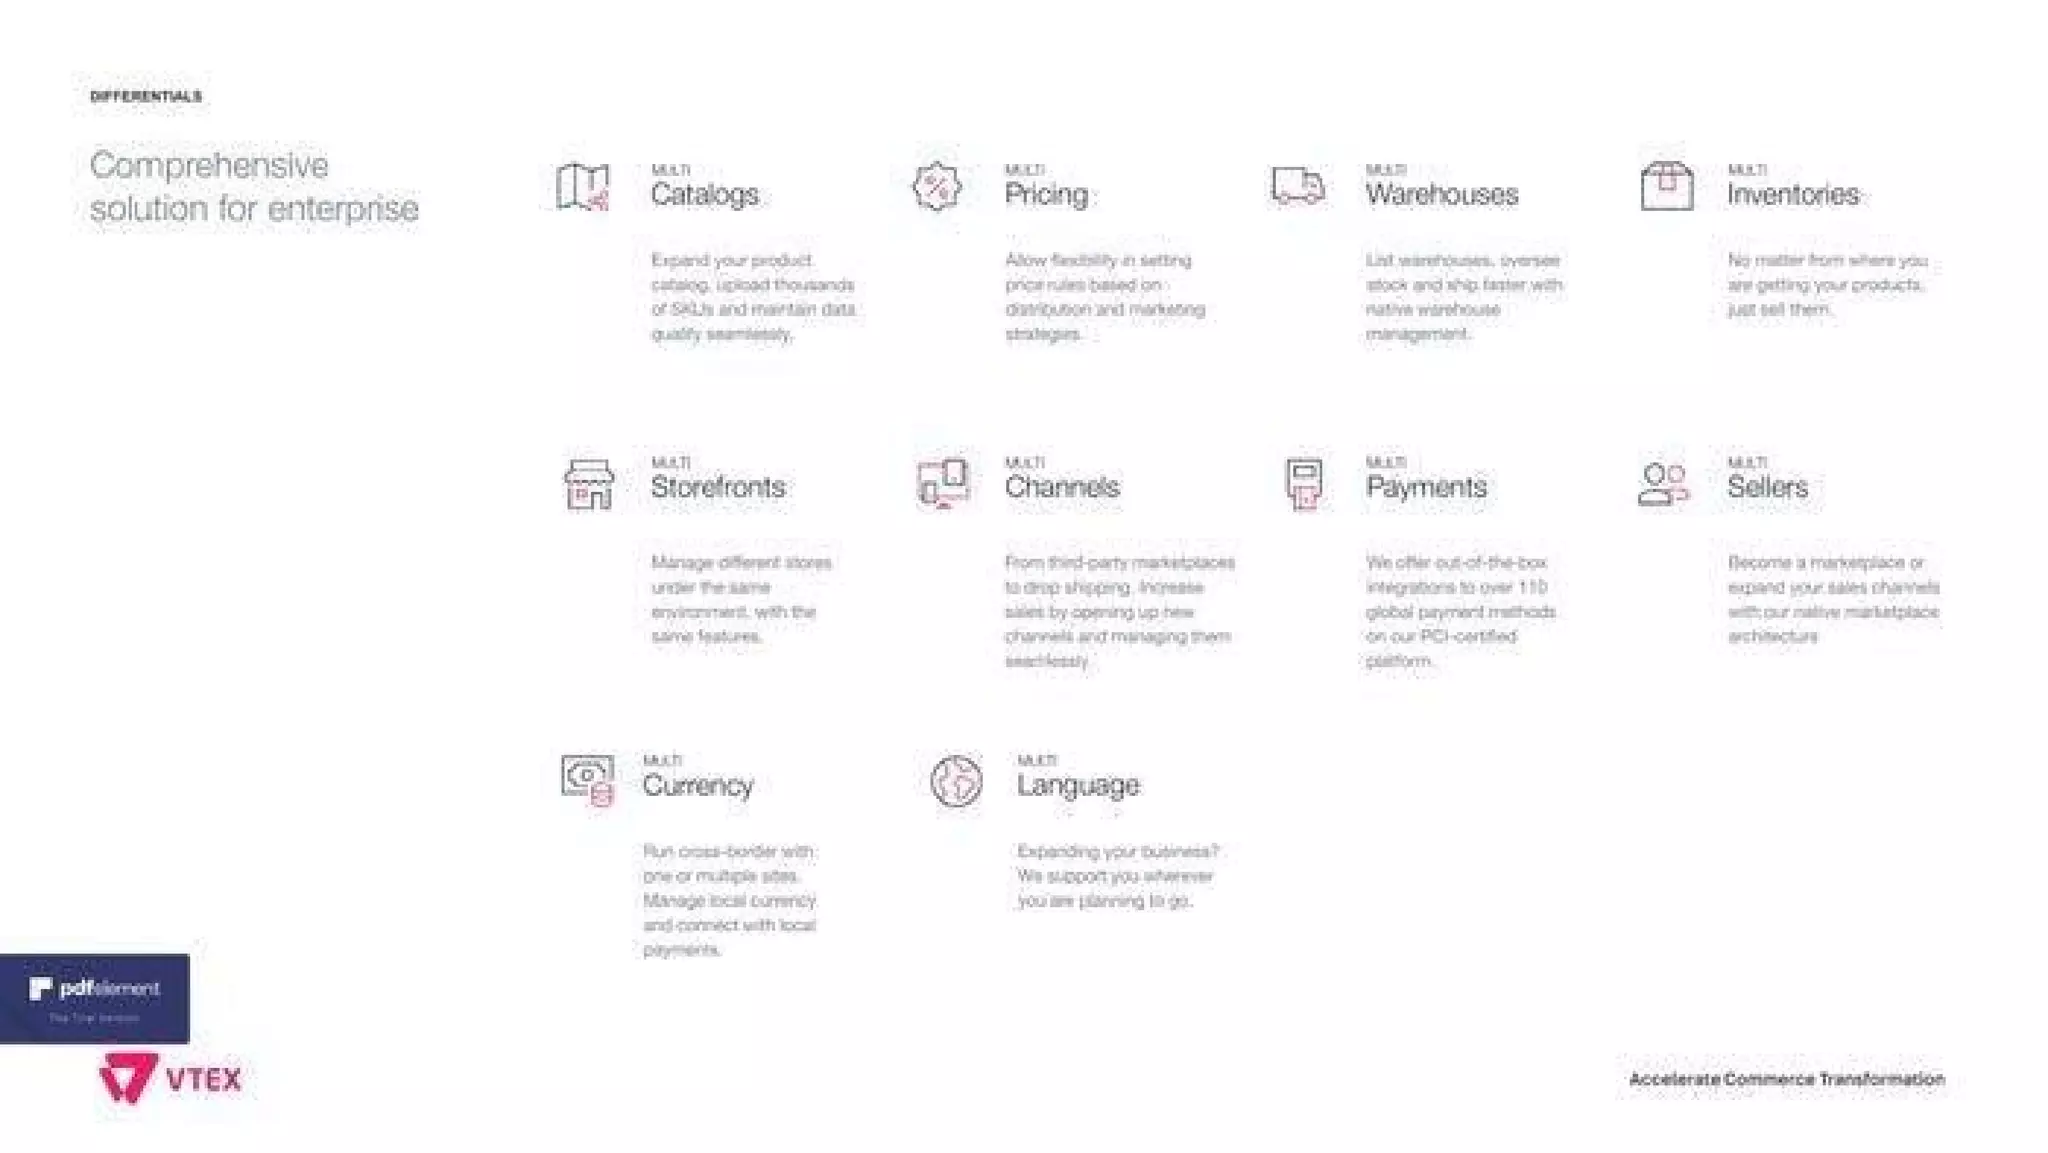
  • Enterprise-ready features: multi-catalog, multi-warehouse, multi-inventory, payments, multi-currency, multi-language (slide 16–17).

Referenced slides: 8–12, 16–20.


Team

Team credentials shown:

  • Founders / co-CEOs: Geraldo Thomaz and Mariano Gomide (slide 5). Short bios indicate engineering backgrounds and leadership of R&D and sales/marketing.
  • Company scale: 560 employees (slide 4), with a large R&D focus (60% workforce in R&D on slide 11).
  • The deck emphasizes engineering strength (VTEX IO, microservices) and commercial leadership in global markets.

Referenced slide: 5 and 4, 11.


Go-to-Market Strategy

Distribution approach (as shown / implied):

  • Enterprise sales for large retailers and brands (client logos, pricing tiers, annual fees) — slide 2 & 13.
  • Marketplace enablement to accelerate marketplace launches (product-led/bundled marketplace capabilities) — slides 11, 12.
  • Global expansion via local offices (8 offices, presence in 28 countries) and events (VTEX Day, slide 23) to create ecosystem/network effects.
  • Channel/product-led elements (VTEX IO developer platform) enable partners and agencies to build stores; in-store POS (VTEX inStore) integrates offline sales to drive platform adoption (slides 20–23).

Referenced slides: 2, 4, 11–13, 20–23.


The Ask

  • Series A raise (historical context): $5M (user-provided).
  • The deck as presented does not include a single-slide detailed use-of-proceeds / capitalization table in the images provided. Implicit uses to expect: product engineering, global expansion, go-to-market scaling (sales & marketing), and platform operations (cloud capacity).
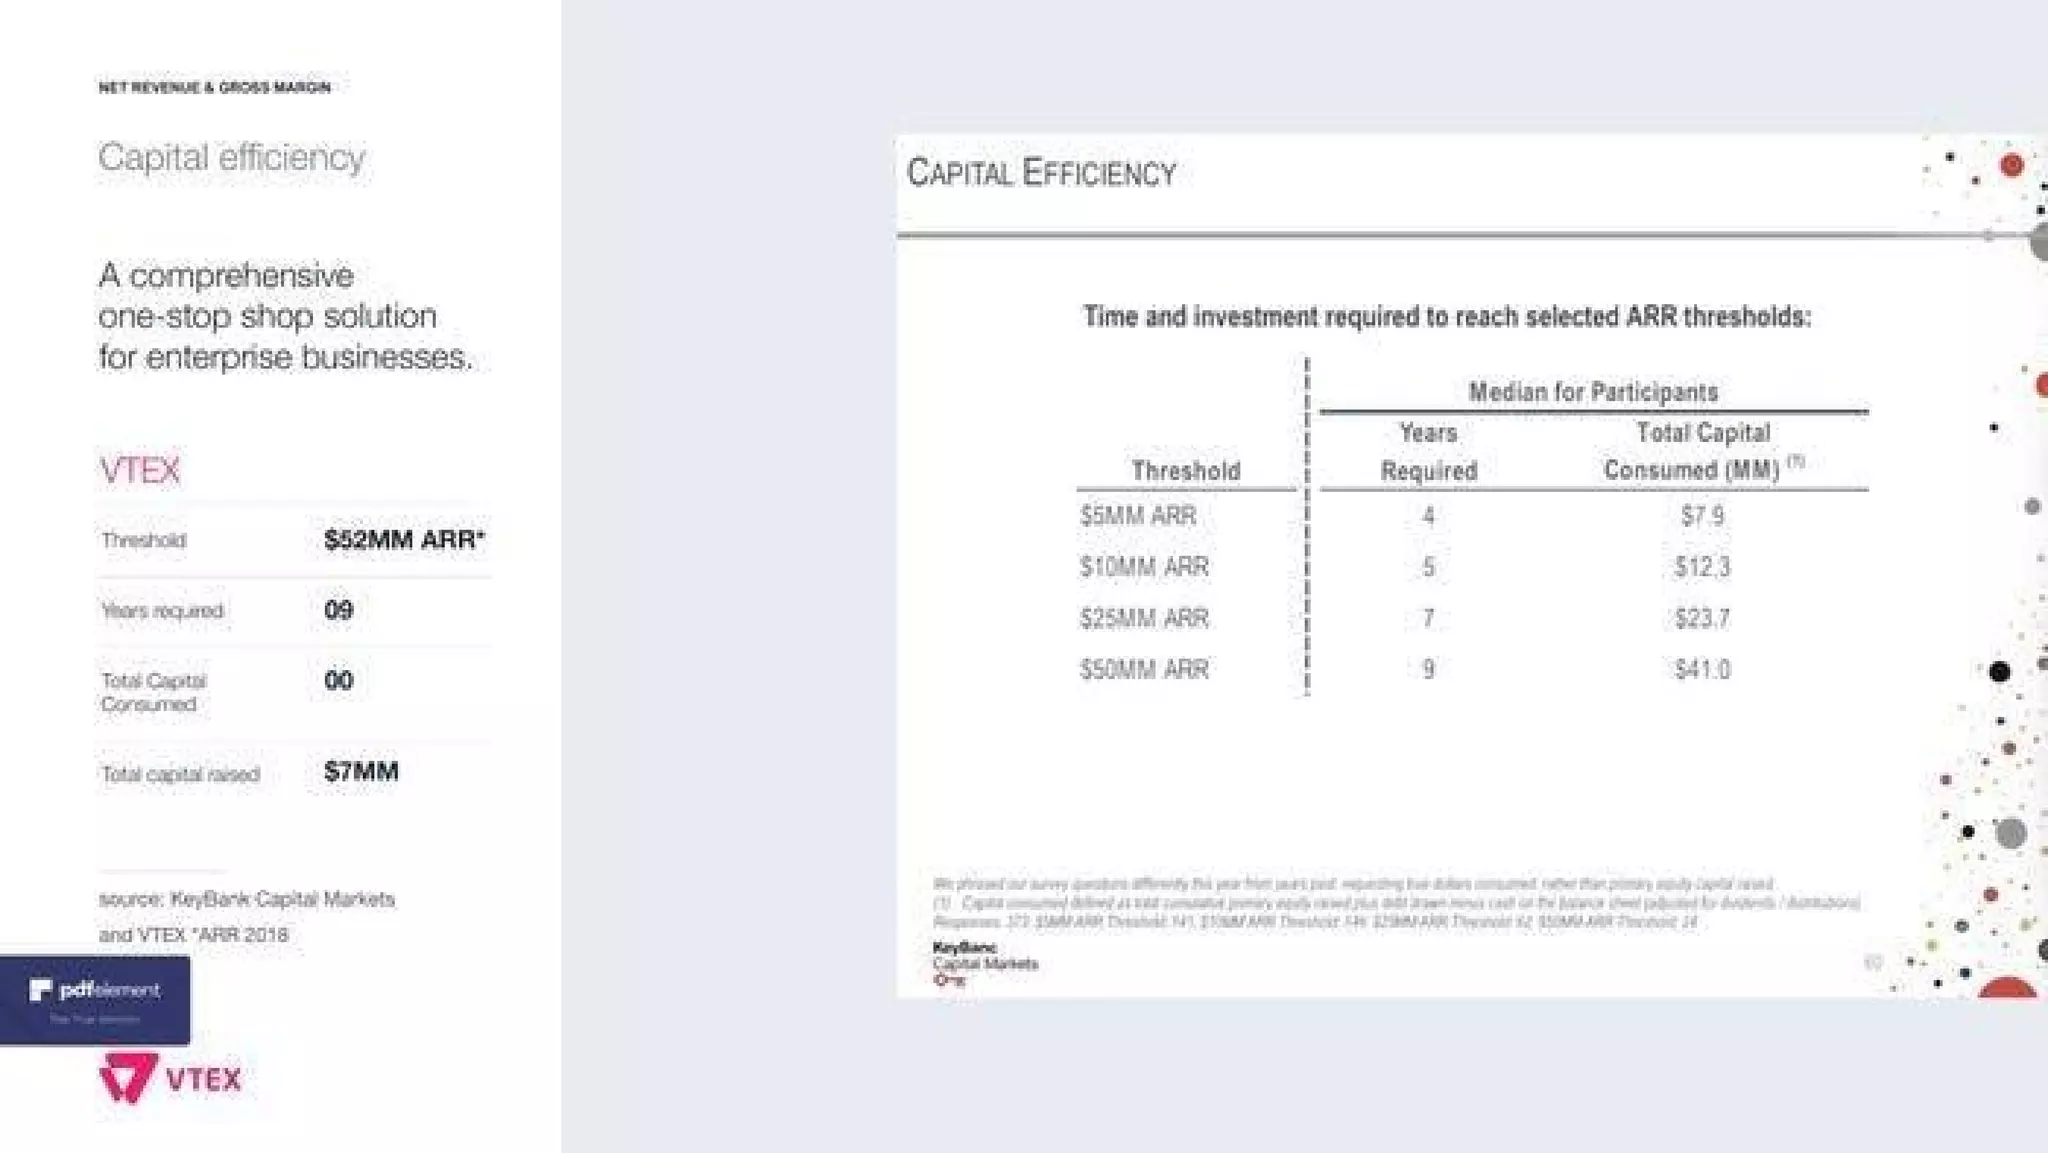
  • One slide (slide 7 “Capital efficiency”) hints at capital requirements vs ARR thresholds but doesn’t break out a specific $5M allocation.

Referenced slides: 7 (capital efficiency) — no explicit use-of-proceeds slide seen.


Investor Deep Dive

Executive summary, strengths & red flags

Executive Summary

VTEX’s Series A deck (as packaged here) positions the company as an enterprise-grade, multi-tenant commerce platform built for omnichannel, marketplaces and in-store unification. The deck mixes product / technology differentiation (microservices, true SaaS, VTEX IO), strong enterprise traction (global clients and GMV), and clear commercial packaging (tiered pricing + transaction fees). It’s notable because the company scaled from an early growth round to a major public exit — and the deck surfaces the core product and GTM choices that enabled that trajectory.

Key Strengths

3 identified

1

Strong, quantifiable traction and scale metrics — revenue growth by year (2012–2018), 66MM ARR, 3.8B GMV and documented peak event performance (slides 6, 3, 14, 18). These de-risk product-market fit for enterprise commerce.

2

Clear technical differentiation for enterprise: true multi-tenant SaaS, microservices, APIs and a developer platform (VTEX IO) that supports scale and faster deployments (slides 17, 20). This directly addresses total cost and operational scaling.

3

Credible customer roster and global footprint — large recognizable customers and international offices (slides 2, 4) provide social proof and network effects for marketplace/partner growth.

Red Flags & Weaknesses

3 identified

1

No explicit TAM / SAM / SOM slide — investors must infer market size from GMV and customer logos (slides 14, 2, 3). For Series A, explicit market sizing scaffolding is expected.

2

Limited unit economics detail and CAC / LTV visibility — while ARR, churn and gross margin are shown (slide 3), the deck lacks a clear CAC, payback period and LTV by segment breakdown that VCs typically use to model returns.

3

Mixed time-horizon data and lack of a single clean “investment case” slide — the deck mixes later-stage metrics (2018/2019 ARR & GMV) with early-stage narrative (Series A ask). There’s no single slide that reconciles past performance, forecast and precise use-of-funds (slide 7 hints at capital efficiency but not specifics).

More Pitch Decks To Study

Compare structure, fundraising context, and investor-facing story across similar startup decks.