Compare your deck to Snyk

Compare Your Deck

Snyk Pitch Deck (2016)

Cybersecurity
Stage: Seed
Raised: $3M
Year: 2016
Slides: 8
Outcome: Valued at $7.4B after Series G (2022)

Pitch Deck

1 / 8
Snyk pitch deck - Brand & Simple Hook: Logo and Tagline
Click to expand

Deck Analysis

This seed-stage pitch deck from Snyk (2016) positions the company as a developer-first web security startup solving the increasing problem of vulnerable third-party code and tooling that doesn’t fit developer workflows. Notable for clear problem framing, concise market sizing, and developer-centric positioning, the deck demonstrates how to communicate a technical security product in plain language and show why timing, team, and a repeatable go-to-market model matter for early-stage cybersecurity startups.

Brand & Simple Hook: Logo and Tagline

Brand & Simple Hook: Logo and Tagline

The opening slide (logo and one-line tagline “Web Security for Developers”) is minimal and highly focused. It immediately signals the company’s identity and target user without distracting detail — a good example of branding that anchors the rest of the deck. The graphic of the incognito figure plus the short phrase gives both emotional resonance (security/attacker imagery) and a crisp value proposition.

Founders can learn from this restraint: start with a memorable visual and a single, precise positioning line. It primes the audience to interpret the subsequent slides through the correct lens (developer-centric security) and avoids early cognitive overload.

Key Takeaway: Lead with a clean brand and one-line positioning that signals who you serve and what you do — it focuses attention for the rest of the deck.
Problem Framing: Developers Must & Will Own Security

Problem Framing: Developers Must & Will Own Security

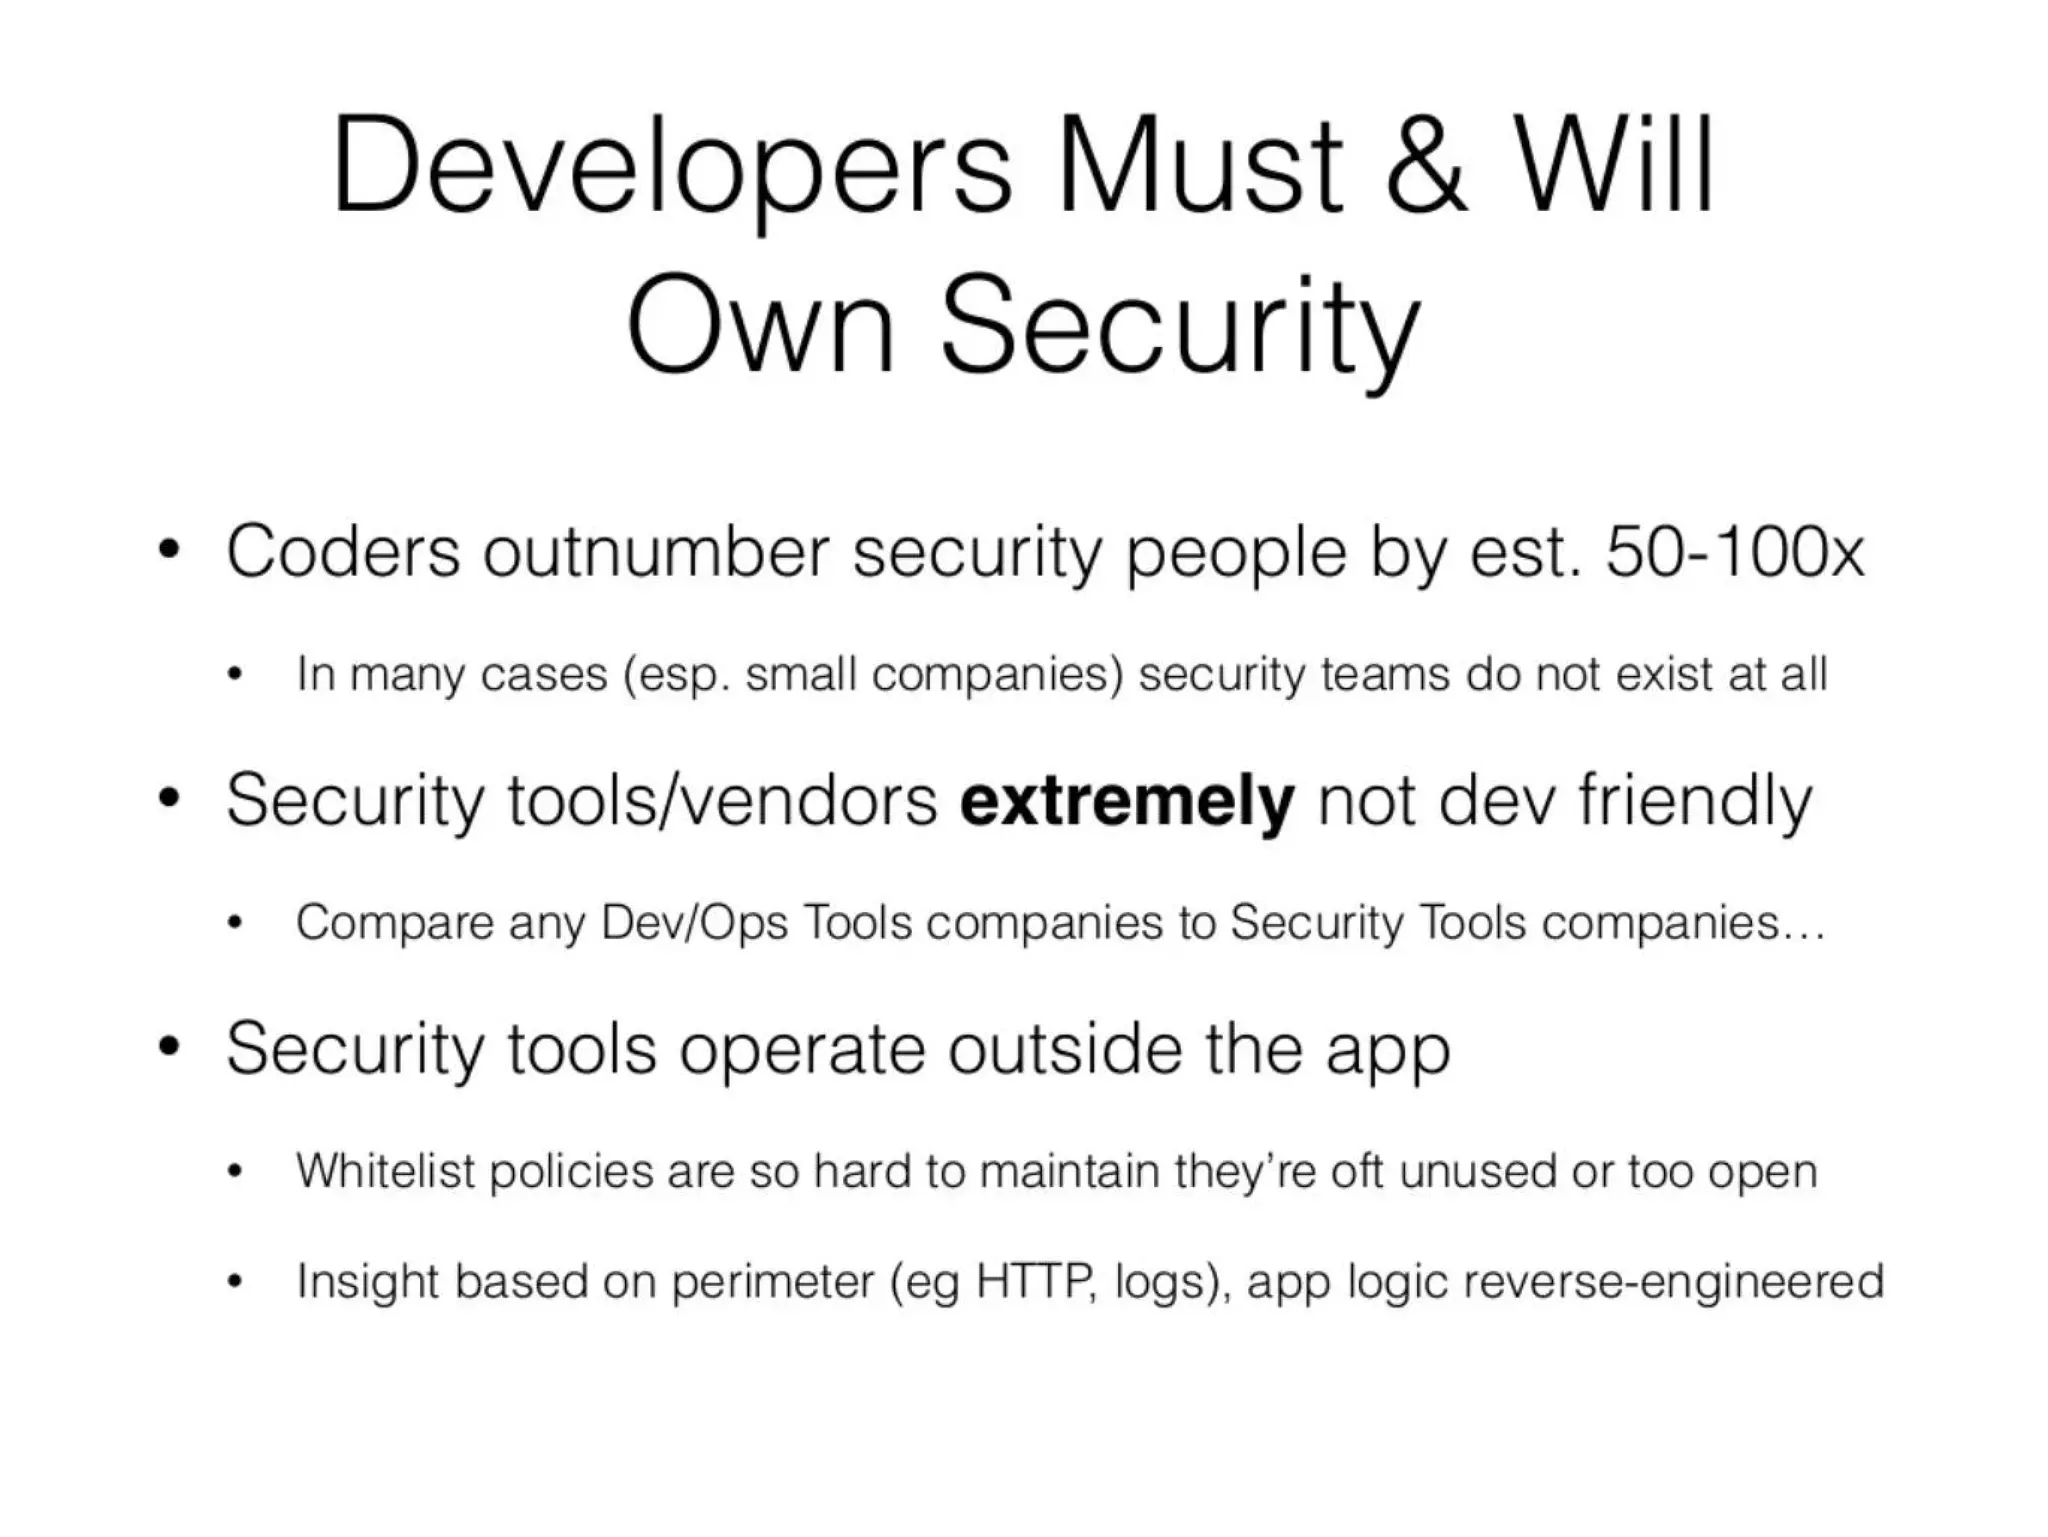
Slide 2 clearly states the thesis: there are far more coders than security people, security tools are unfriendly to developers, and existing security operates outside the app. This triad frames why current solutions fail and why a developer-centric approach is necessary. The slide uses three concise bullets and one-liners beneath them to build a logical argument rather than relying on charts or heavy data.

This is effective because it ties operational reality (developer headcount, tool UX, and where tools live) to product opportunity. Founders should note how the slide blends quantitative-sounding claims ('50-100x') with qualitative observations (tool friendliness) to create urgency and a clear customer persona.

Key Takeaway: Define the problem from the customer’s workflow — show why incumbents are broken and why your target user (developers) will adopt a new approach.
Timing: Why Now

Timing: Why Now

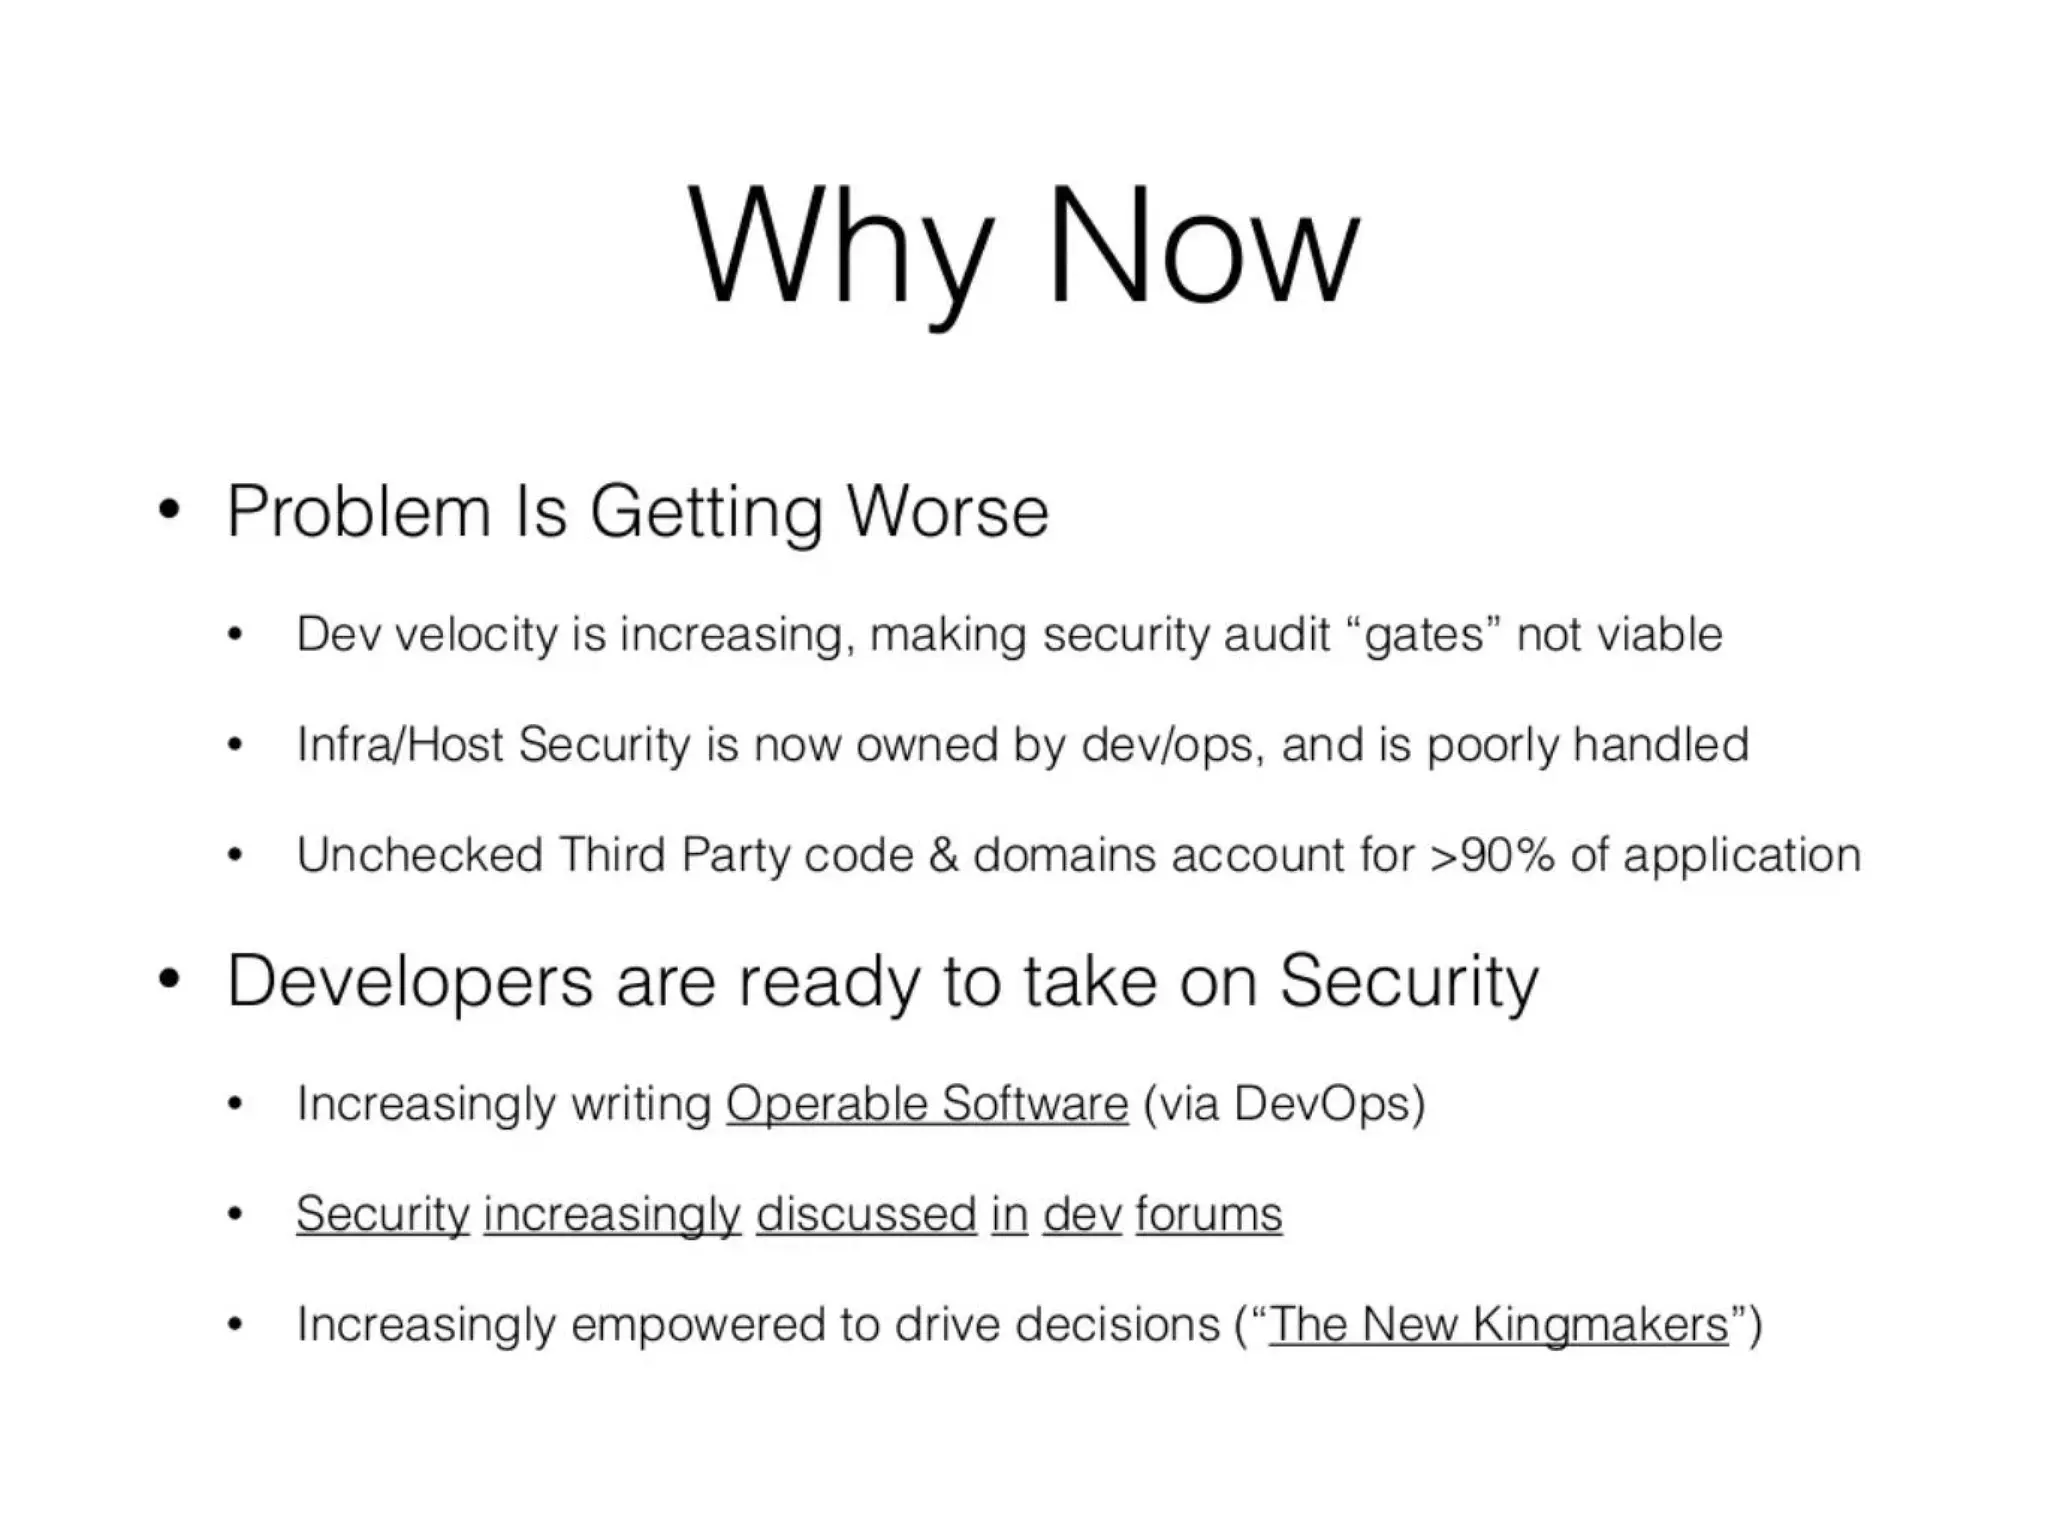
Slide 3 explains market timing: developer velocity, shifting responsibility to DevOps, and third-party code proliferation. It pairs the worsening problem with developer readiness (operable software, dev forums, influence) to argue that conditions are aligned for a new product. The two-part structure (problem worsening + developers ready) is persuasive because it addresses both supply and demand dynamics.

For founders, this slide shows how to combine macro trends with behavioral signals from the target audience. It also demonstrates the value of explaining both negative momentum (risk) and positive adoption signals (opportunity) rather than only one or the other.

Key Takeaway: Use a two-track timing narrative: show both why the problem is getting worse and why users are now willing and able to adopt your solution.
Positioning & GTM: Developer-Oriented Security Tools Company

Positioning & GTM: Developer-Oriented Security Tools Company

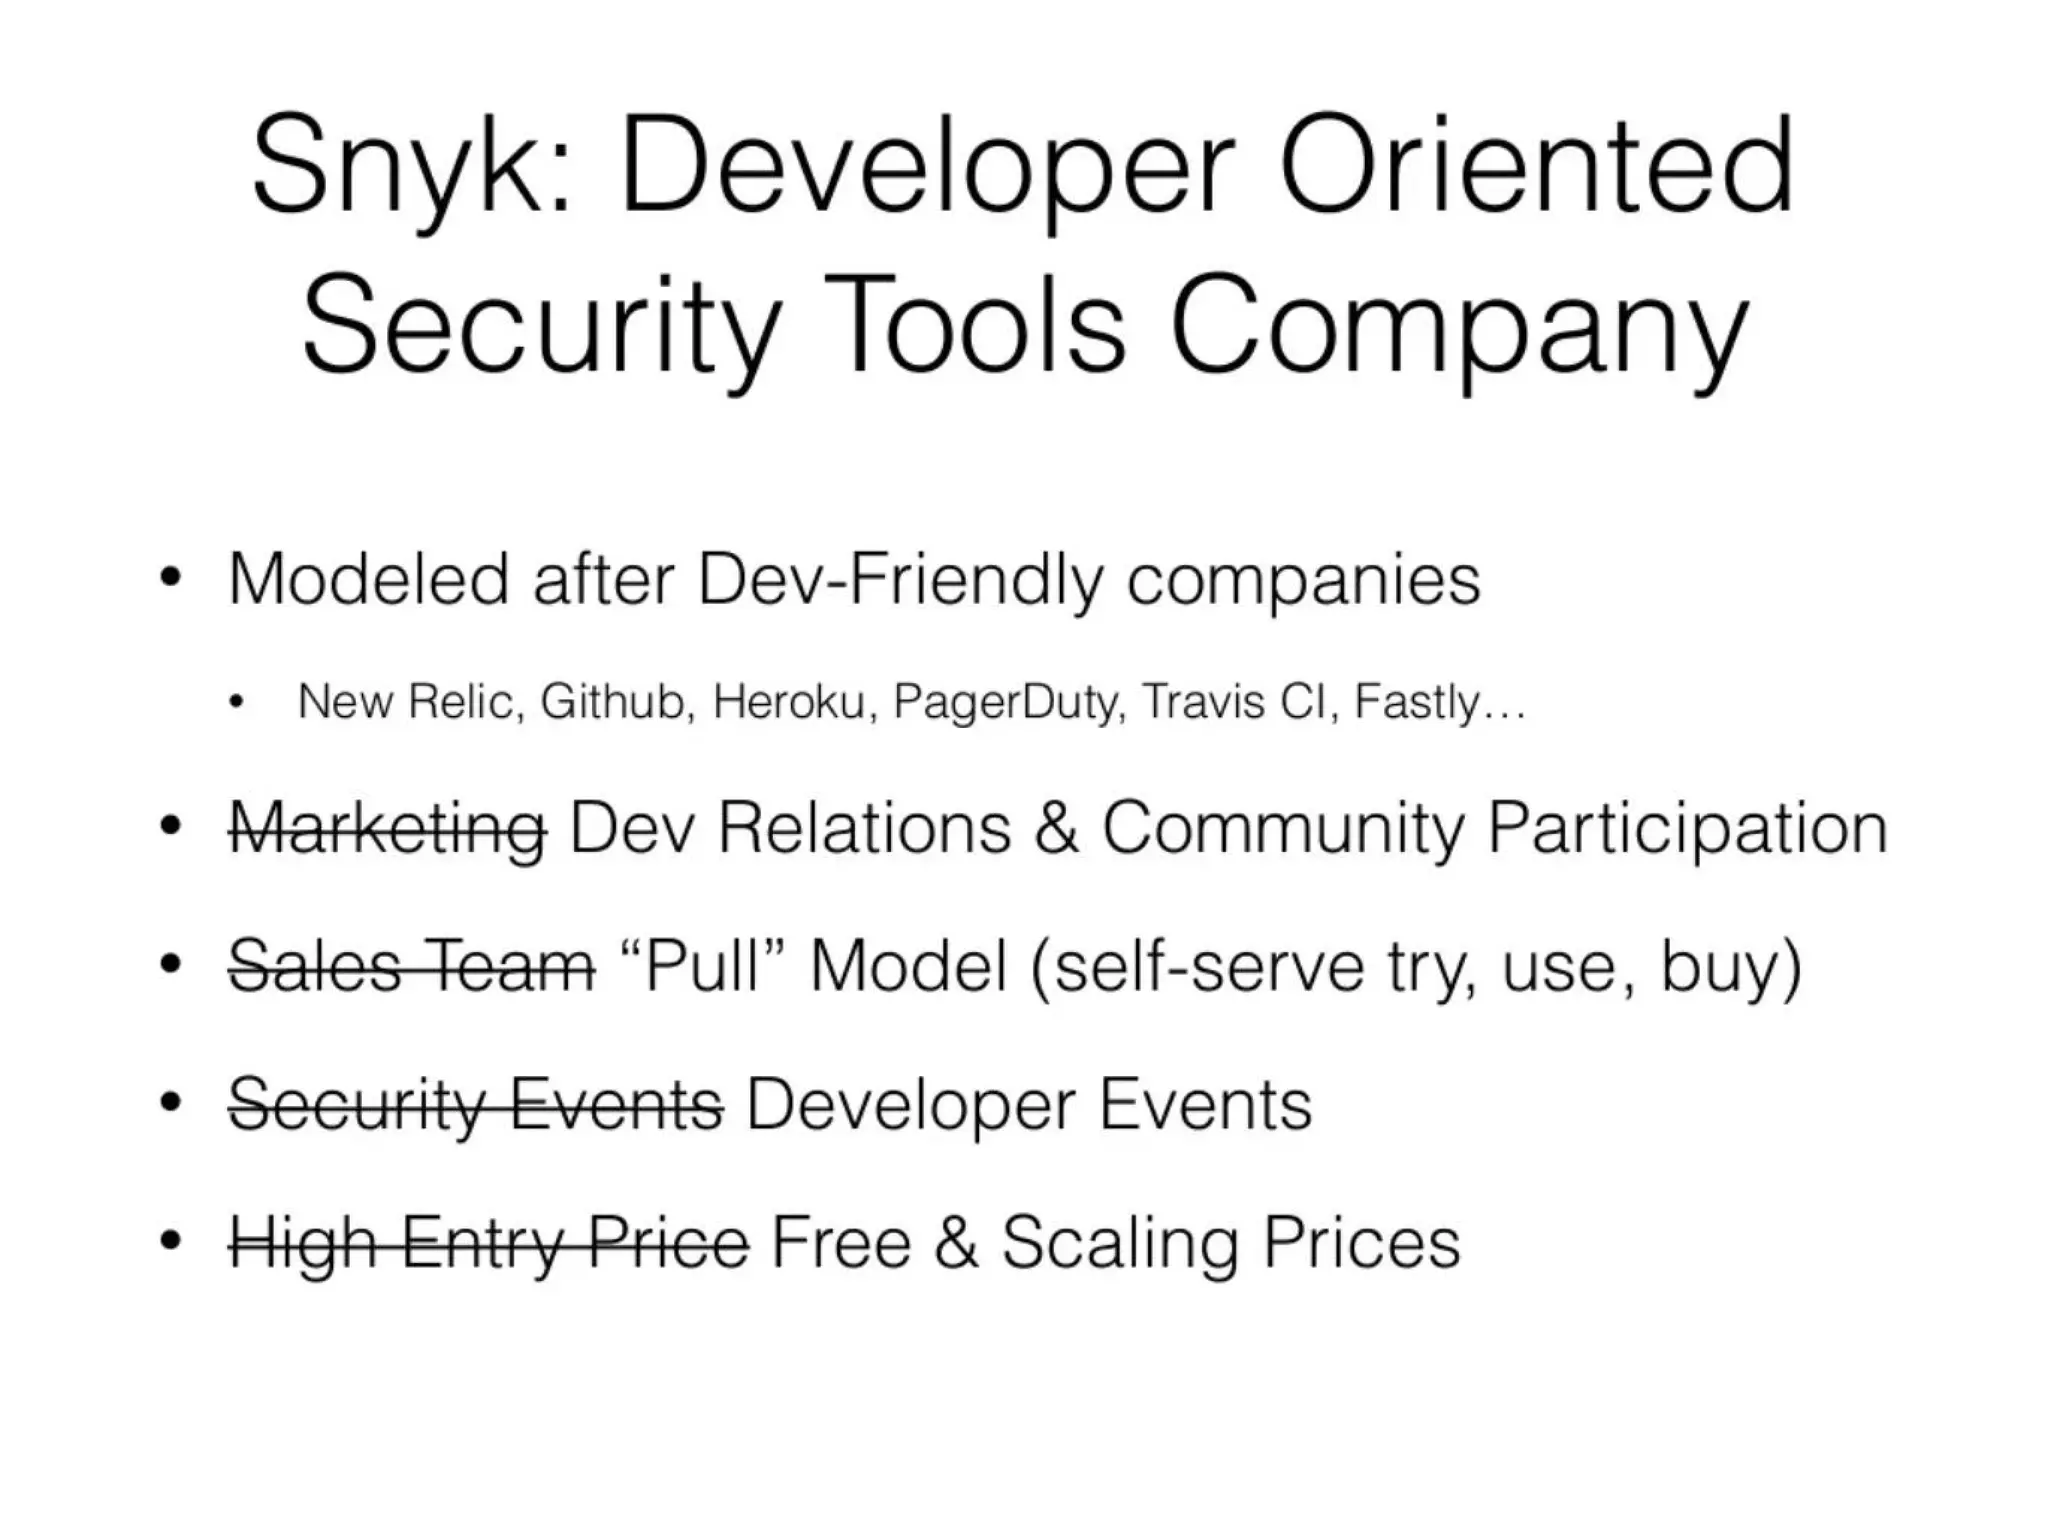
Slide 4 lays out the company’s positioning and go-to-market model: modeled after dev-friendly tools, focus on community/dev relations, pull sales/self-serve, developer events, and pricing that starts free and scales. The slide is effective because it translates the problem and timing into a concrete commercial strategy that aligns with developer buying behavior. Cross-referencing successful developer tools (New Relic, GitHub, Heroku) provides relatable comparables without diluting the unique angle.

Founders should note how the slide connects product design, marketing, and pricing into a consistent narrative: build for developers, get adoption through product-led growth and community, monetize with scalable pricing. This alignment is key to believable traction plans in technical markets.

Key Takeaway: Map product design to a GTM that matches your buyer — for developer tools, prioritize product-led growth, community, and low-friction pricing.
Core Technical Problem: Third-Party Code Risk

Core Technical Problem: Third-Party Code Risk

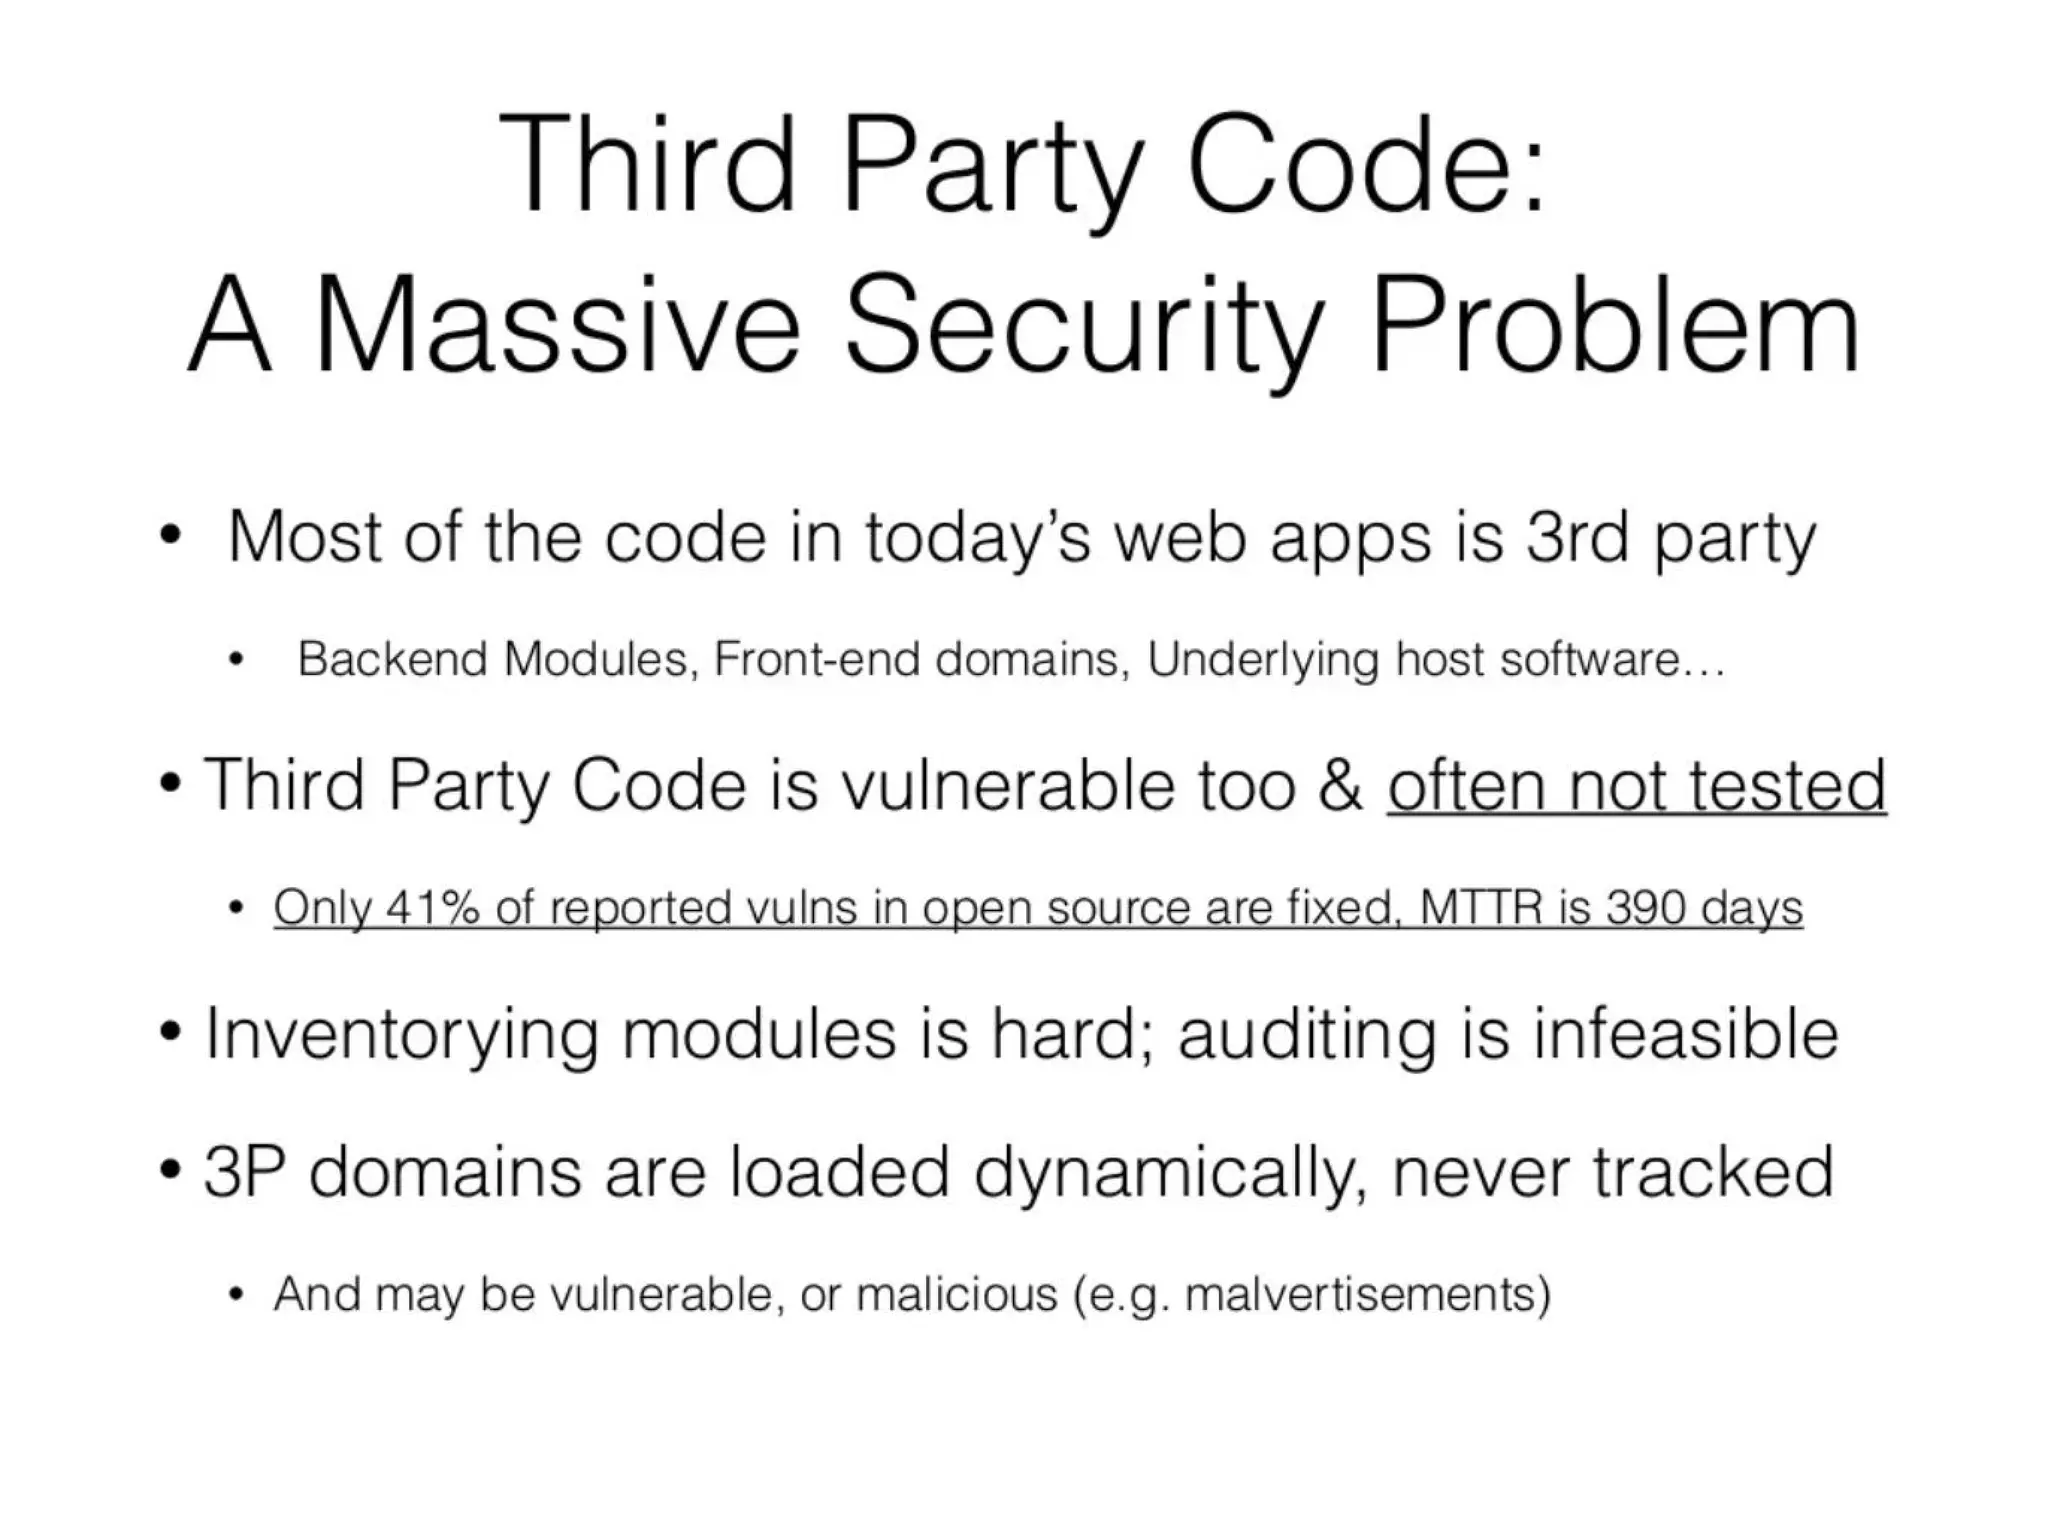
Slide 5 focuses on the technical vulnerability vector Snyk targets: third-party code. It quantifies the scope (most code is third-party), calls out poor testing/fix rates, inventory difficulty, and dynamic loading of 3P domains. The use of a hard statistic (41% fixed, MTTR 390 days) lends credibility and underscores the infeasibility of manual auditing. This moves the discussion from abstract security to a specific, measurable attack surface.

The lesson for founders is to frame your product around a decisive, solvable sub-problem within a large category. Demonstrating domain expertise with crisp facts and operational pain points (inventorying, dynamic domains) makes the use case tangible to technical buyers and investors.

Key Takeaway: Anchor your solution to a specific, measurable problem slice within a larger market — use concrete metrics to show scope and urgency.
Market Sizing & Comparables

Market Sizing & Comparables

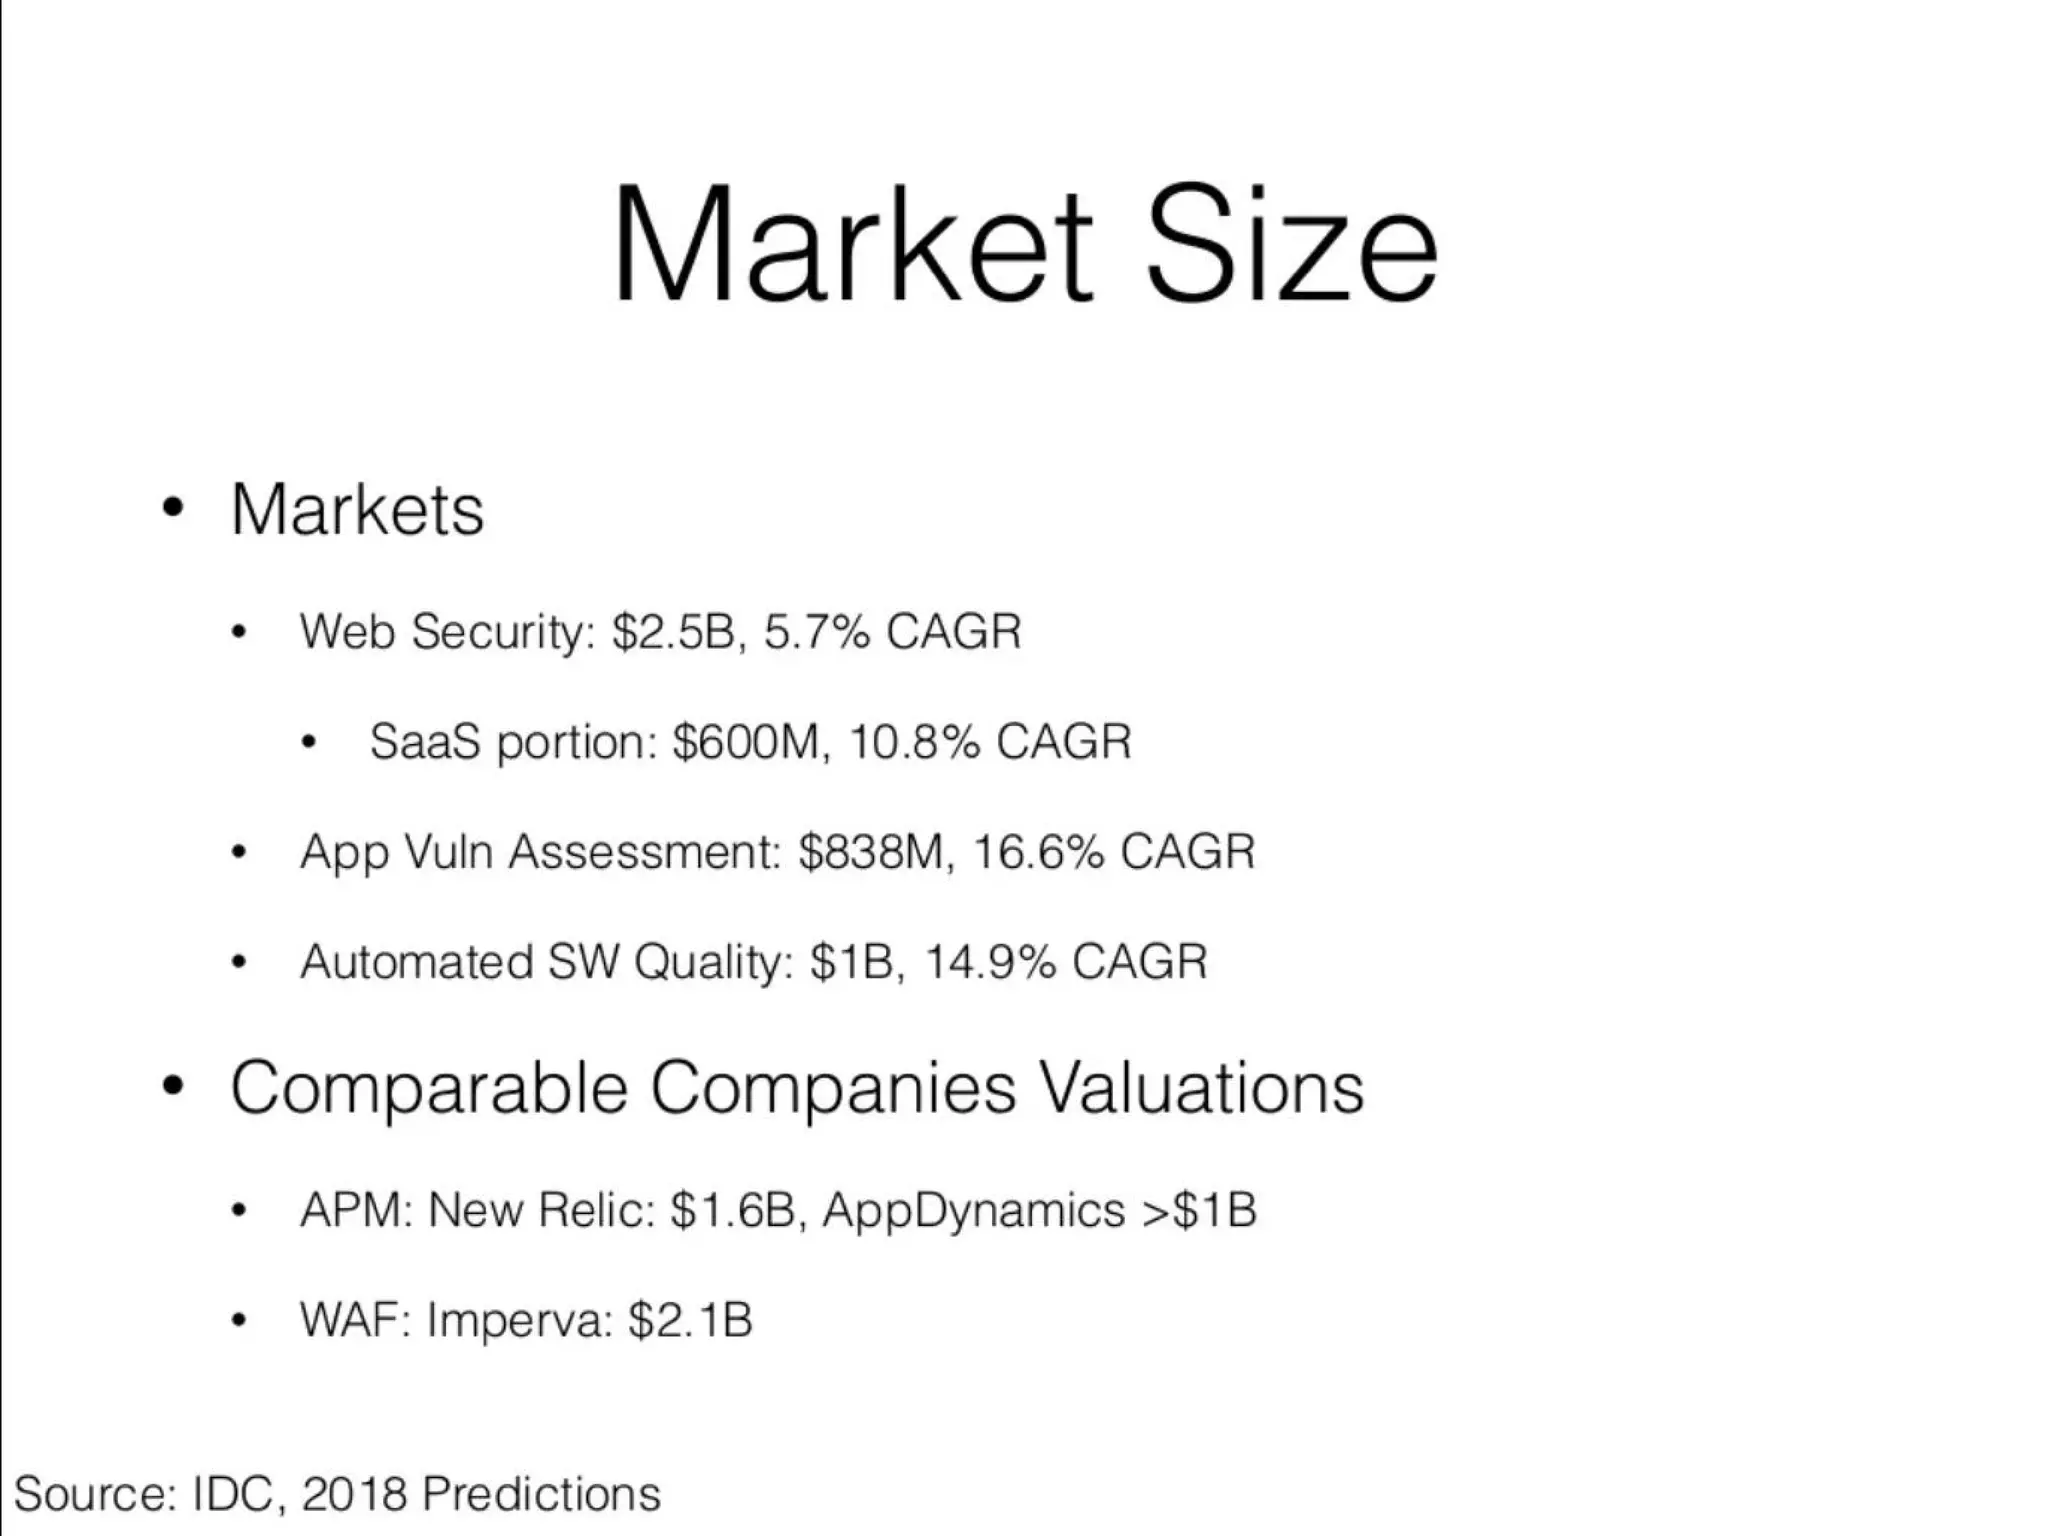
Slide 7 presents market sizes for web security, SaaS portion, app vulnerability assessment, and software quality, plus comparable company valuations (New Relic, AppDynamics, Imperva). The slide is plain but covers the essentials: total addressable market segments, growth rates, and relevant comparables to justify investor upside. The use of established names as comparables helps investors map valuation potential to familiar outcomes.

Founders should ensure market slides balance realism with opportunity: show believable segment sizes, growth, and clear comparables that validate potential multiples. Avoid overoptimistic TAMs — this slide succeeds by citing IDC and breaking the market into relevant subcomponents.

Key Takeaway: Provide a segmented, sourced market map and clear comparables so investors can realistically model upside and exit potential.

Conclusion: Key Lessons

Snyk’s seed deck is a strong example of how to sell a technical cybersecurity product: start with a tight brand and positioning, clearly articulate an acute customer problem, explain why timing favors adoption, and show a GTM built to match developer behavior. The deck pairs technical credibility (third-party code metrics) with practical business thinking (product-led growth, pricing, comparables).

Actionable advice for founders: be concise and audience-focused — define the specific problem you solve, demonstrate timing and customer readiness, align product design to a realistic GTM, and support claims with sourced facts or comparables. Finally, keep slides low-noise and let a few high-quality data points and a coherent narrative carry the case to investors.

Full Deck Analysis

11 sections

Overview

Company: Snyk
Round: Seed ($3M)
Year: 2016
Outcome: Valued at $7.4B after Series G (2022)

Executive Summary

Snyk’s 2016 seed deck is a tightly focused, developer-centric pitch that frames application security as a developer problem (not a pure security-team problem) and positions a lightweight, self-serve SaaS product to monitor and prevent vulnerabilities — especially in third‑party code. The deck is notable for clear market sizing, a crisp go‑to‑market (developer-first, freemium/self-serve) play and strong technical founding team credentials, while leaving traction, unit economics and some product details sparse.

Problem Statement

How the deck articulates the problem (referenced slides):

  • Developers vastly outnumber security specialists and in many companies security teams don’t exist (Slide 2). This implies security must be owned by developers.
  • Existing security tools are “extremely not dev friendly” and generally operate outside the app, producing brittle whitelist policies and perimeter-only insight (Slide 2).
  • The problem is worsening: faster dev velocity, infra/host security moving to devops and unchecked 3rd‑party code/domains composing >90% of apps (Slide 3).
  • Third‑party code is a massive vector: most app code is third‑party, many open-source vulnerabilities are not fixed (only 41% fixed; MTTR 390 days), inventorying modules is hard and 3P domains are dynamically loaded and untracked (Slide 5).

Solution

How the deck positions the solution:

  • A developer-oriented security offering: tools and platform designed for developers (Slide 4).
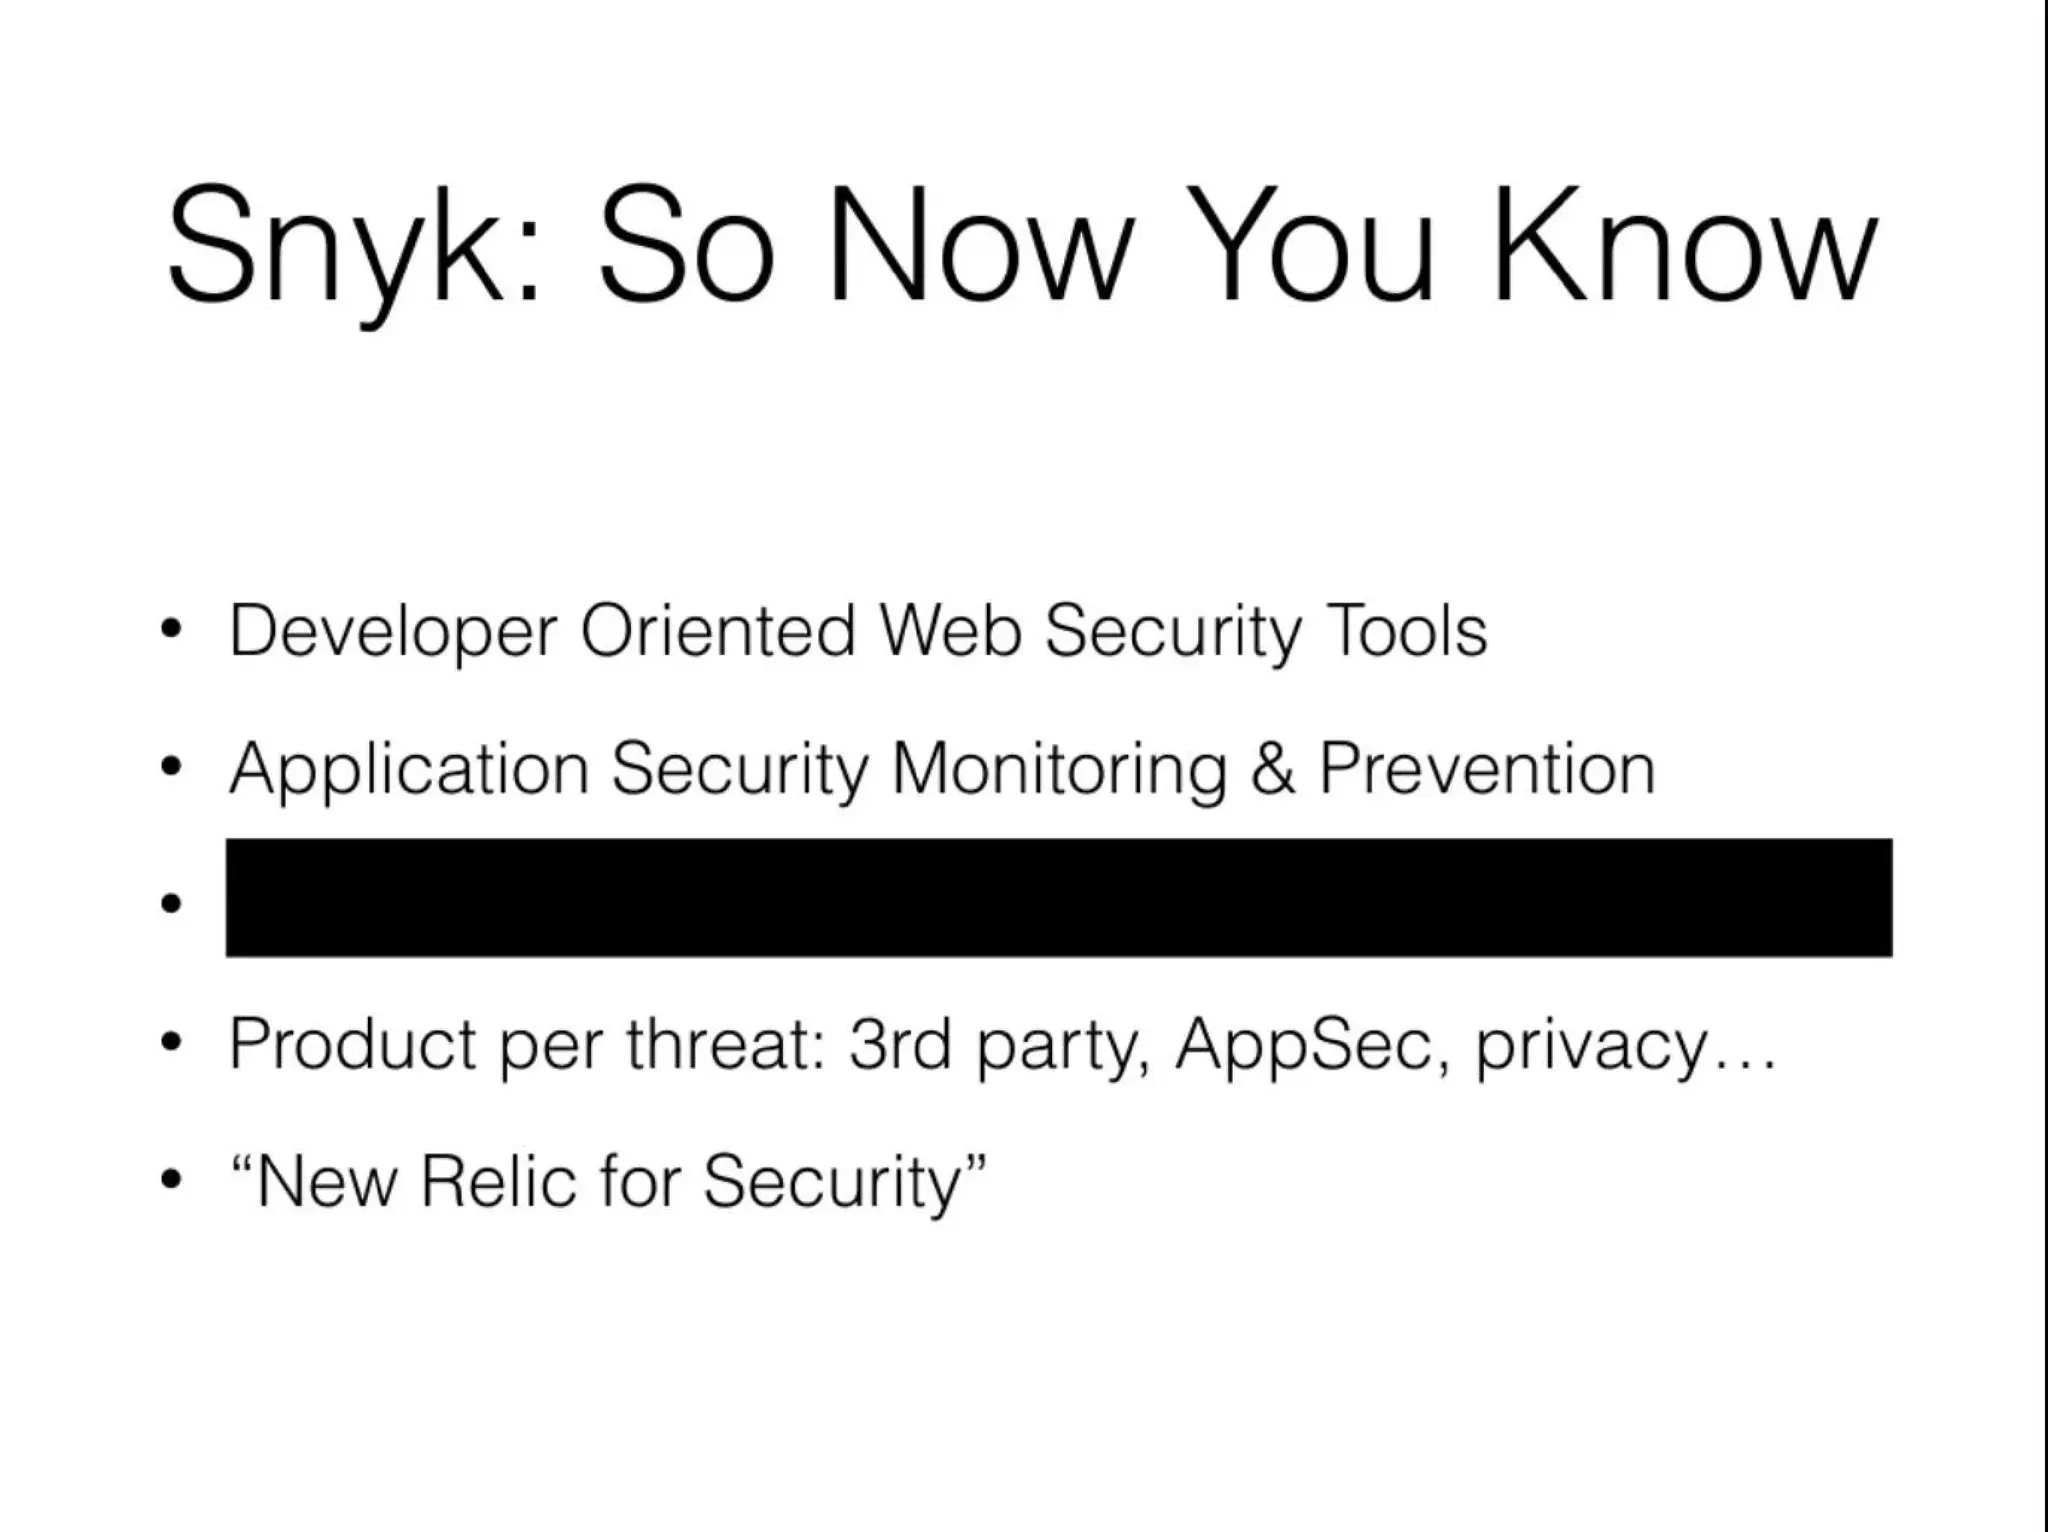
  • Product goals stated: developer-oriented web security tools, application security monitoring & prevention; positioning as “New Relic for Security” (Slide 8).
  • GTM and product design favor self-serve, free entry and scaling prices to remove friction for developers (Slide 4 & Slide 8).
  • Focus on addressing third‑party risk and runtime/app-level prevention (inferred from Slide 5 + Slide 8).

Market Opportunity

TAM/SAM/SOM details present in the deck (Slide 7):

  • Web Security market: $2.5B, 5.7% CAGR
    • SaaS portion: $600M, 10.8% CAGR
  • Application Vulnerability Assessment: $838M, 16.6% CAGR
  • Automated Software Quality: $1B, 14.9% CAGR
  • Comparable public/private company valuations used as benchmarks: New Relic $1.6B, AppDynamics >$1B, Imperva $2.1B
  • Source cited: IDC, 2018 Predictions

(The deck provides sector/subsector sizing but does not break down Snyk’s SAM or SOM explicitly.)

Business Model

  • SaaS subscription model with freemium / free entry and scaling pricing (Slide 4: “Free & Scaling Prices”).
  • Sales model: “pull” self-service model — try, use, buy (Slide 4).
  • Emphasis on developer acquisition via dev relations, community and events (Slide 4).
  • Unit economics (ARPU, LTV, CAC, churn) are not provided in the slides.

Traction & Metrics

  • The deck contains problem-validation metrics (e.g., security industry stats), but no company revenue, user, growth or customer logos are shown.
  • Specific industry stat shown: “Only 41% of reported vulns in open source are fixed, MTTR is 390 days” (Slide 5) — used to underline the size/urgency of the problem.
  • No ARR, monthly active developers, customers, retention, conversion or channel metrics are disclosed.

Competitive Positioning

  • Differentiation: developer-first UX and GTM vs traditional security vendors (Slide 4). Explicit comparisons to developer-friendly tools (New Relic, Github, Heroku, PagerDuty, Travis CI, Fastly).
  • Focus on building community, developer relations and enabling self-serve adoption rather than traditional enterprise sales (Slide 4).
  • Product positioning claim: “New Relic for Security” — implying instrumentation + monitoring + analytics for security (Slide 8).
  • Competitors (WAFs, AppSec vendors) implied but no competitive matrix or direct feature comparisons provided.

Team

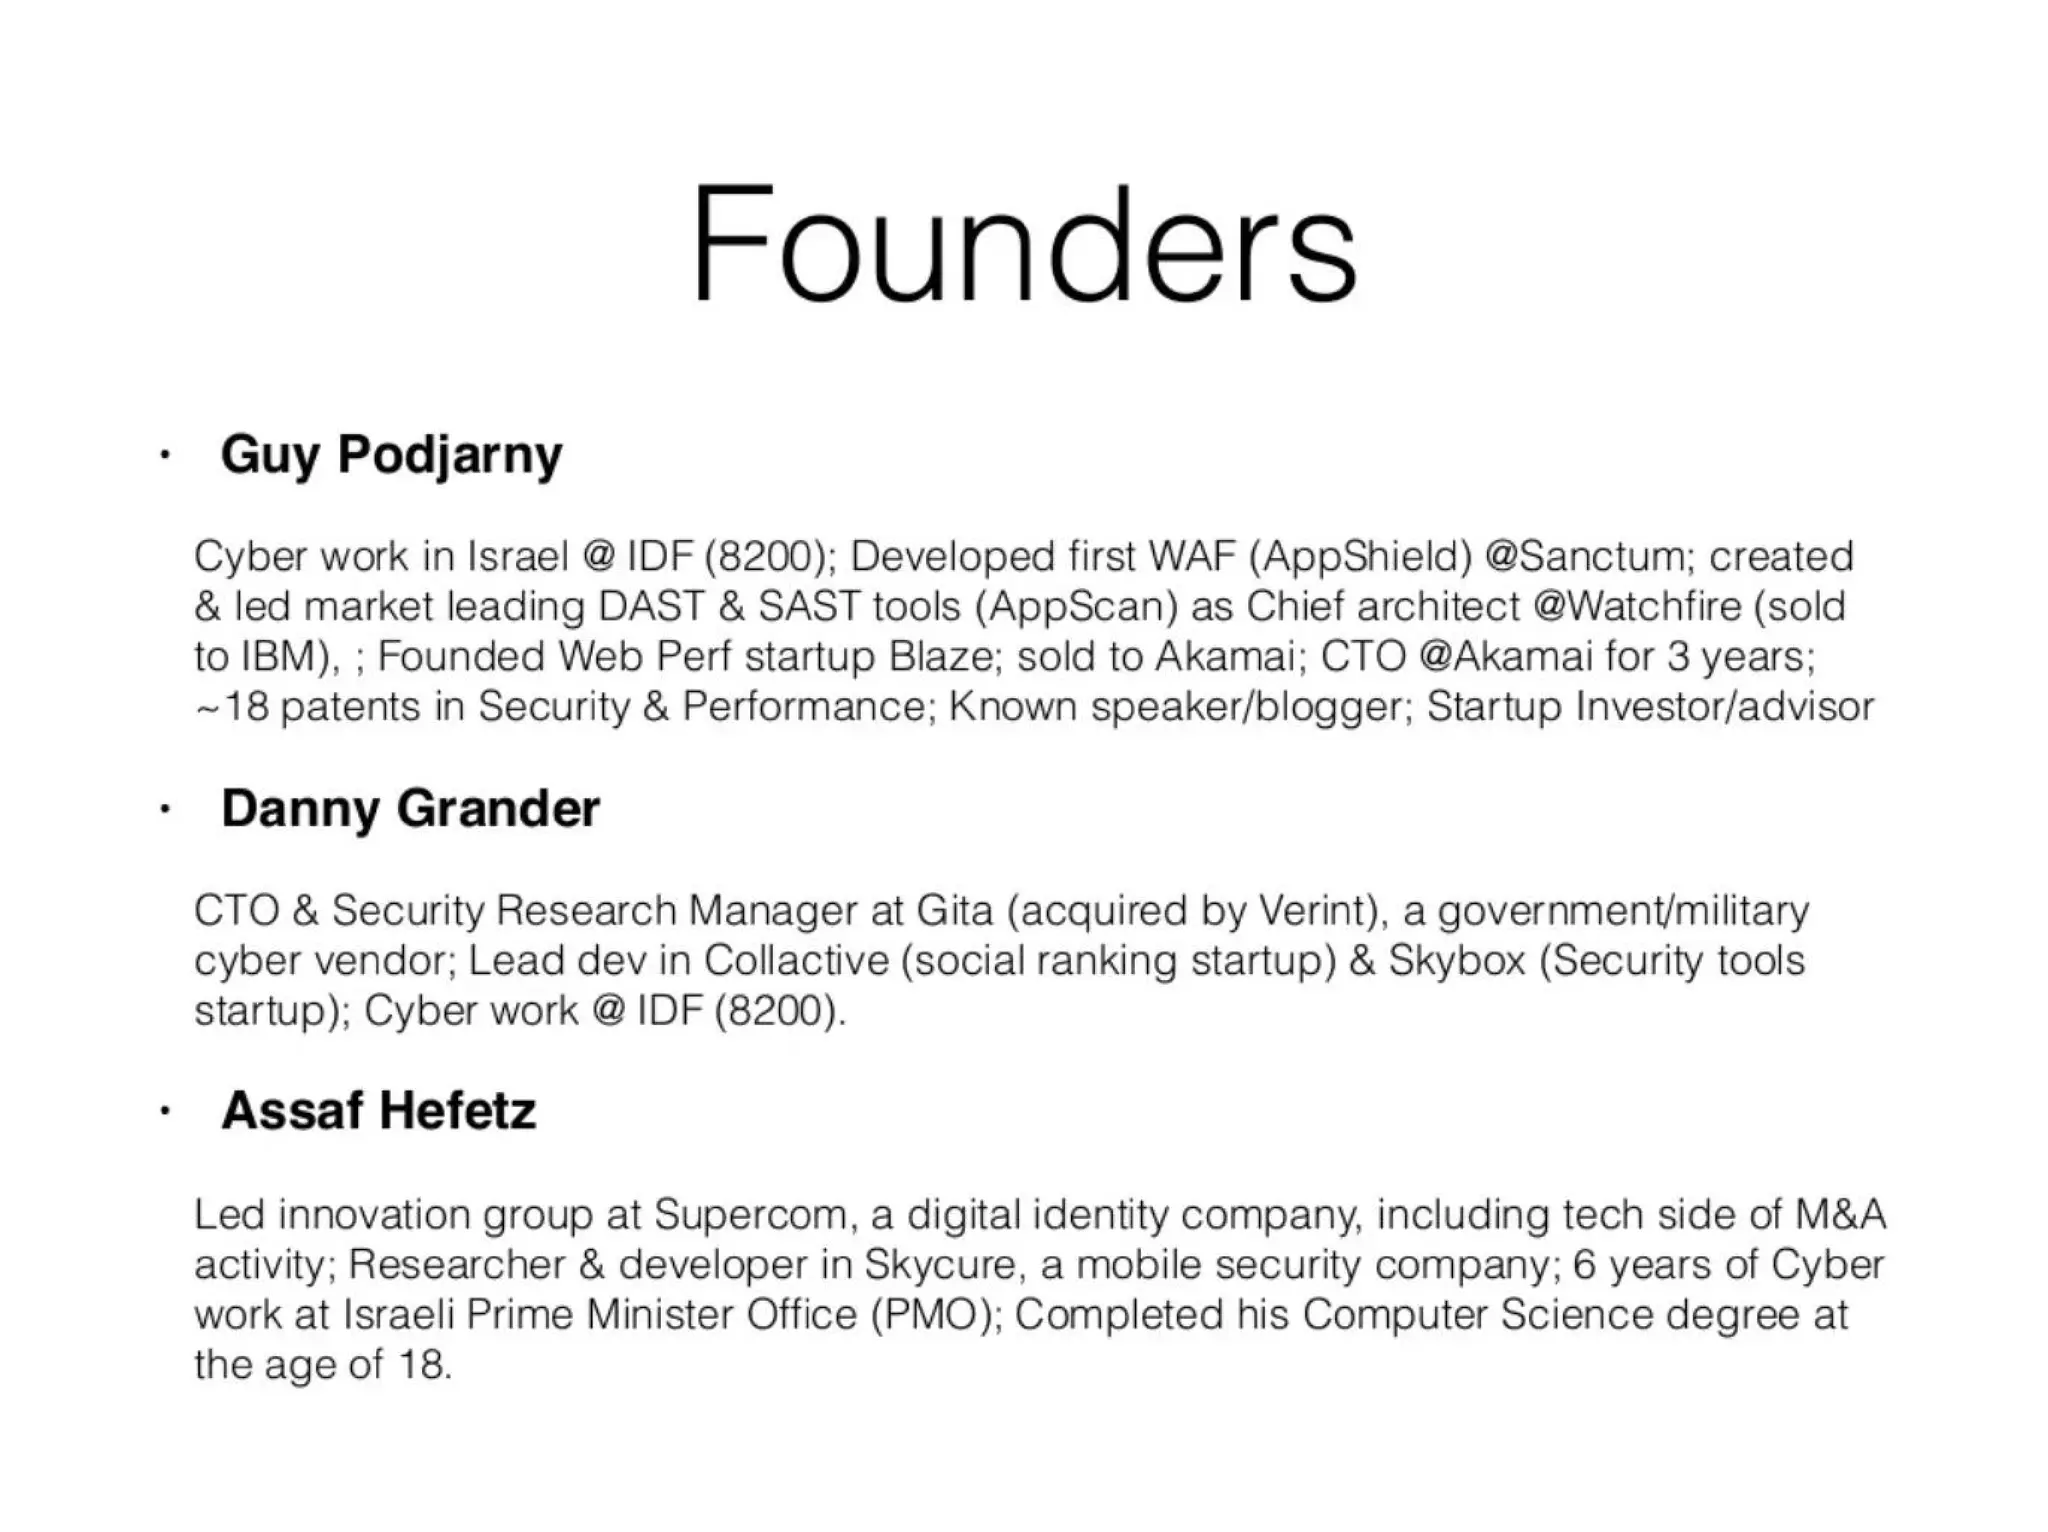
Founders listed with concise credibility blurbs (Slide 6):

  • Guy Podjarny — product/security entrepreneur/architect background: WAF/AppShield, DAST/SAST experience (AppScan / Watchfire -> IBM), web perf startup sold to Akamai; CTO at Akamai; security & performance patents; known speaker/blogger.
  • Danny Grander — CTO & security research manager experience at security/defense vendors, lead dev experience at startups and IDF cyber unit background.
  • Assaf Hefetz — led innovation at digital identity company, mobile security experience, cyber work at Israeli PMO, early CS degree.
    Overall: strong technical/security credentials, military/IDF cyber background and founding experience relevant to product.

Go-to-Market Strategy

  • Developer-focused GTM: community, developer relations, events, and content (Slide 4).
  • Sales model: self-serve “pull” (try → use → buy) to minimize sales friction and scale with developers (Slide 4).
  • Pricing: Free entry + scalable paid tiers to convert teams as they grow (Slide 4).
  • Messaging: target developer painpoints (3rd‑party libs, dev velocity) and position as monitoring & prevention tool integrated into dev workflows (Slide 8).

The Ask

  • The deck was used during a Seed round; the company raised $3M at Seed in 2016 (known outcome).
  • The slides do not clearly enumerate specific use-of‑funds or a detailed financial ask on the visible slides (Slide 8 has a partially redacted/black bar bullet so the explicit fundraising line may be absent or redacted in the shared images).

Investor Deep Dive

Executive summary, strengths & red flags

Executive Summary

Snyk’s 2016 seed deck is a tightly focused, developer-centric pitch that frames application security as a developer problem (not a pure security-team problem) and positions a lightweight, self-serve SaaS product to monitor and prevent vulnerabilities — especially in third‑party code. The deck is notable for clear market sizing, a crisp go‑to‑market (developer-first, freemium/self-serve) play and strong technical founding team credentials, while leaving traction, unit economics and some product details sparse.

Key Strengths

3 identified

1

Clear problem framing tied to developer reality — The deck makes a simple, convincing behavioral argument: developers must own security because there aren’t enough security specialists and existing tools are not dev-friendly (Slides 2–3).

2

Credible, relevant founding team — Founders’ security/engineering track record (WAF, AppScan, Akamai, IDF cyber units) gives strong product-market fit credibility (Slide 6).

3

Practical, low-friction GTM & monetization approach — Self‑serve/freemium model and developer-community play are well aligned with the target buyer and product positioning (Slide 4).

Red Flags & Weaknesses

3 identified

1

No traction metrics shown — The deck omits ARR, user counts, conversion rates, pilot customer names or growth trends; investors at Seed typically want at least proof of developer adoption or pilots.

2

Lack of product detail and roadmap — No screenshots, demos, architecture diagram or technical differentiators are shown; one bullet is blacked out on the final slide (Slide 8), suggesting missing detail.

3

Missing unit economics & use-of-funds — No CAC/LTV estimates, burn plan, or breakdown of how the raise will be used; this would complicate early diligence.

More Pitch Decks To Study

Compare structure, fundraising context, and investor-facing story across similar startup decks.