Compare your deck to Shopify

Compare Your Deck

Shopify Pitch Deck (2013)

SaaS
Stage: Investor Deck
Raised: $122.3M total
Year: 2013
Slides: 27
Outcome: IPO, valued at $100B+

Pitch Deck

1 / 27
Shopify pitch deck - Opening & Proof of Traction
Click to expand

Deck Analysis

This investor deck from Shopify (circa 2013) presents a crisp, product-led SaaS story: a simple, scalable commerce platform aimed at small and growing merchants, anchored by clear traction metrics, an expanding partner ecosystem, and accelerating revenue/G MV growth. What makes this deck notable is how it blends storytelling (founder origin/store example), market sizing, business model clarity, network effects (apps/themes/partners), and strong financial charts — all with consistent visual design. The result is an investor-ready narrative showing both adoption and monetization momentum, with a repeatable playbook founders can learn from.

Opening & Proof of Traction

Opening & Proof of Traction

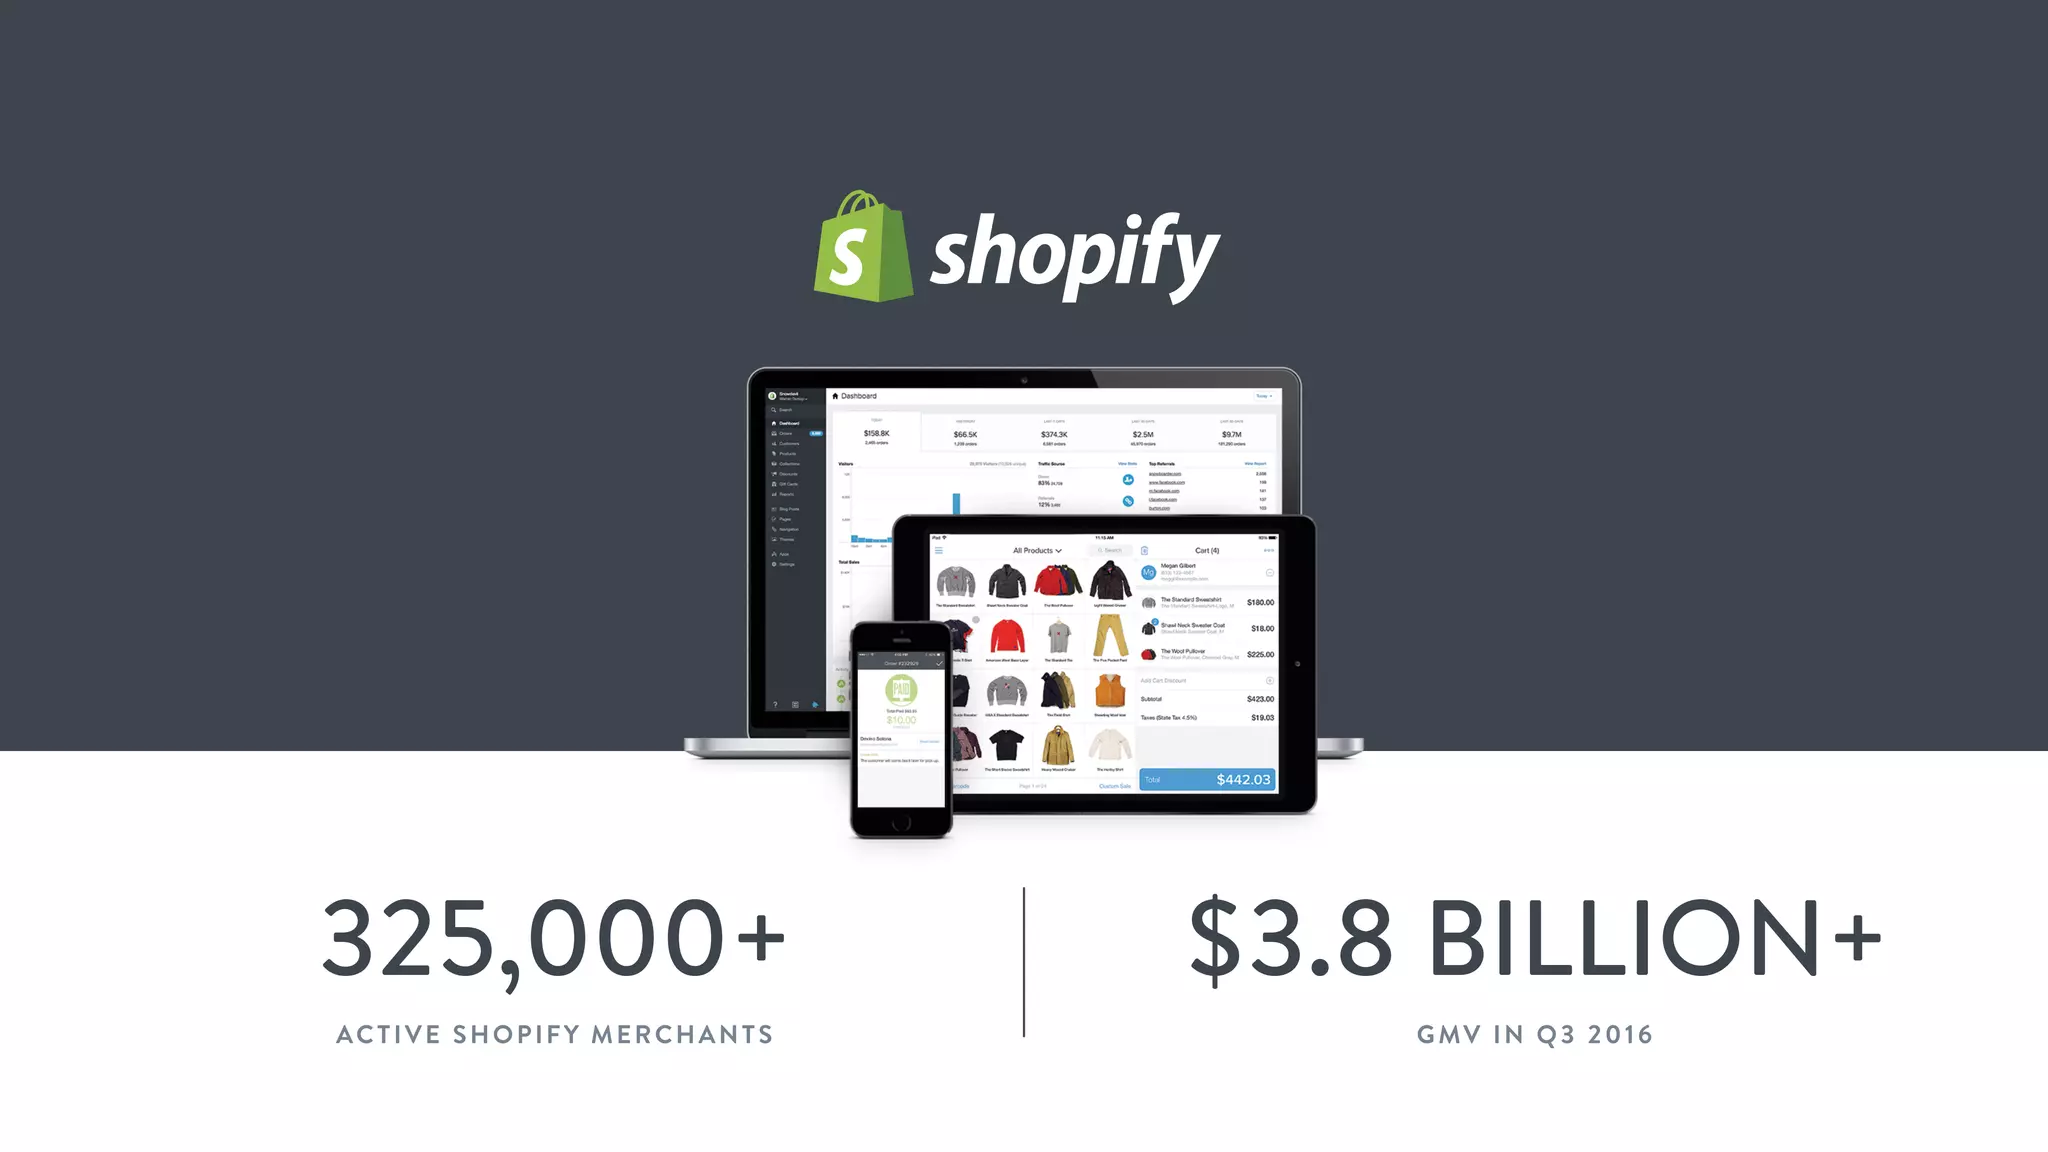
The first slide (branding + headline metrics) leads with the Shopify logo and immediately surfaces two high-impact stats: 325,000+ active merchants and $3.8B+ GMV in Q3 2016. This is classic social-proof-first framing: before diving into product details, the deck demonstrates market validation and scale. It signals to investors that the company has already achieved meaningful usage and a large economic flywheel, shifting the conversation from speculative product/market fit to scaling and monetization.

Visually the slide is restrained and professional — large numbers, large whitespace, and an aspirational product shot. Founders can learn to front-load the most compelling evidence of traction (user counts, GMV/revenue milestones) so investors immediately understand where the business sits in its lifecycle. The use of concrete, verifiable metrics builds credibility and primes the audience for deeper metrics later in the deck.
Key Takeaway: Lead with the single most compelling metric (or two) that prove demand; use large, clear typography and a product image to make an immediate credibility statement.
Customer Story & Product Context (Store Origin)

Customer Story & Product Context (Store Origin)

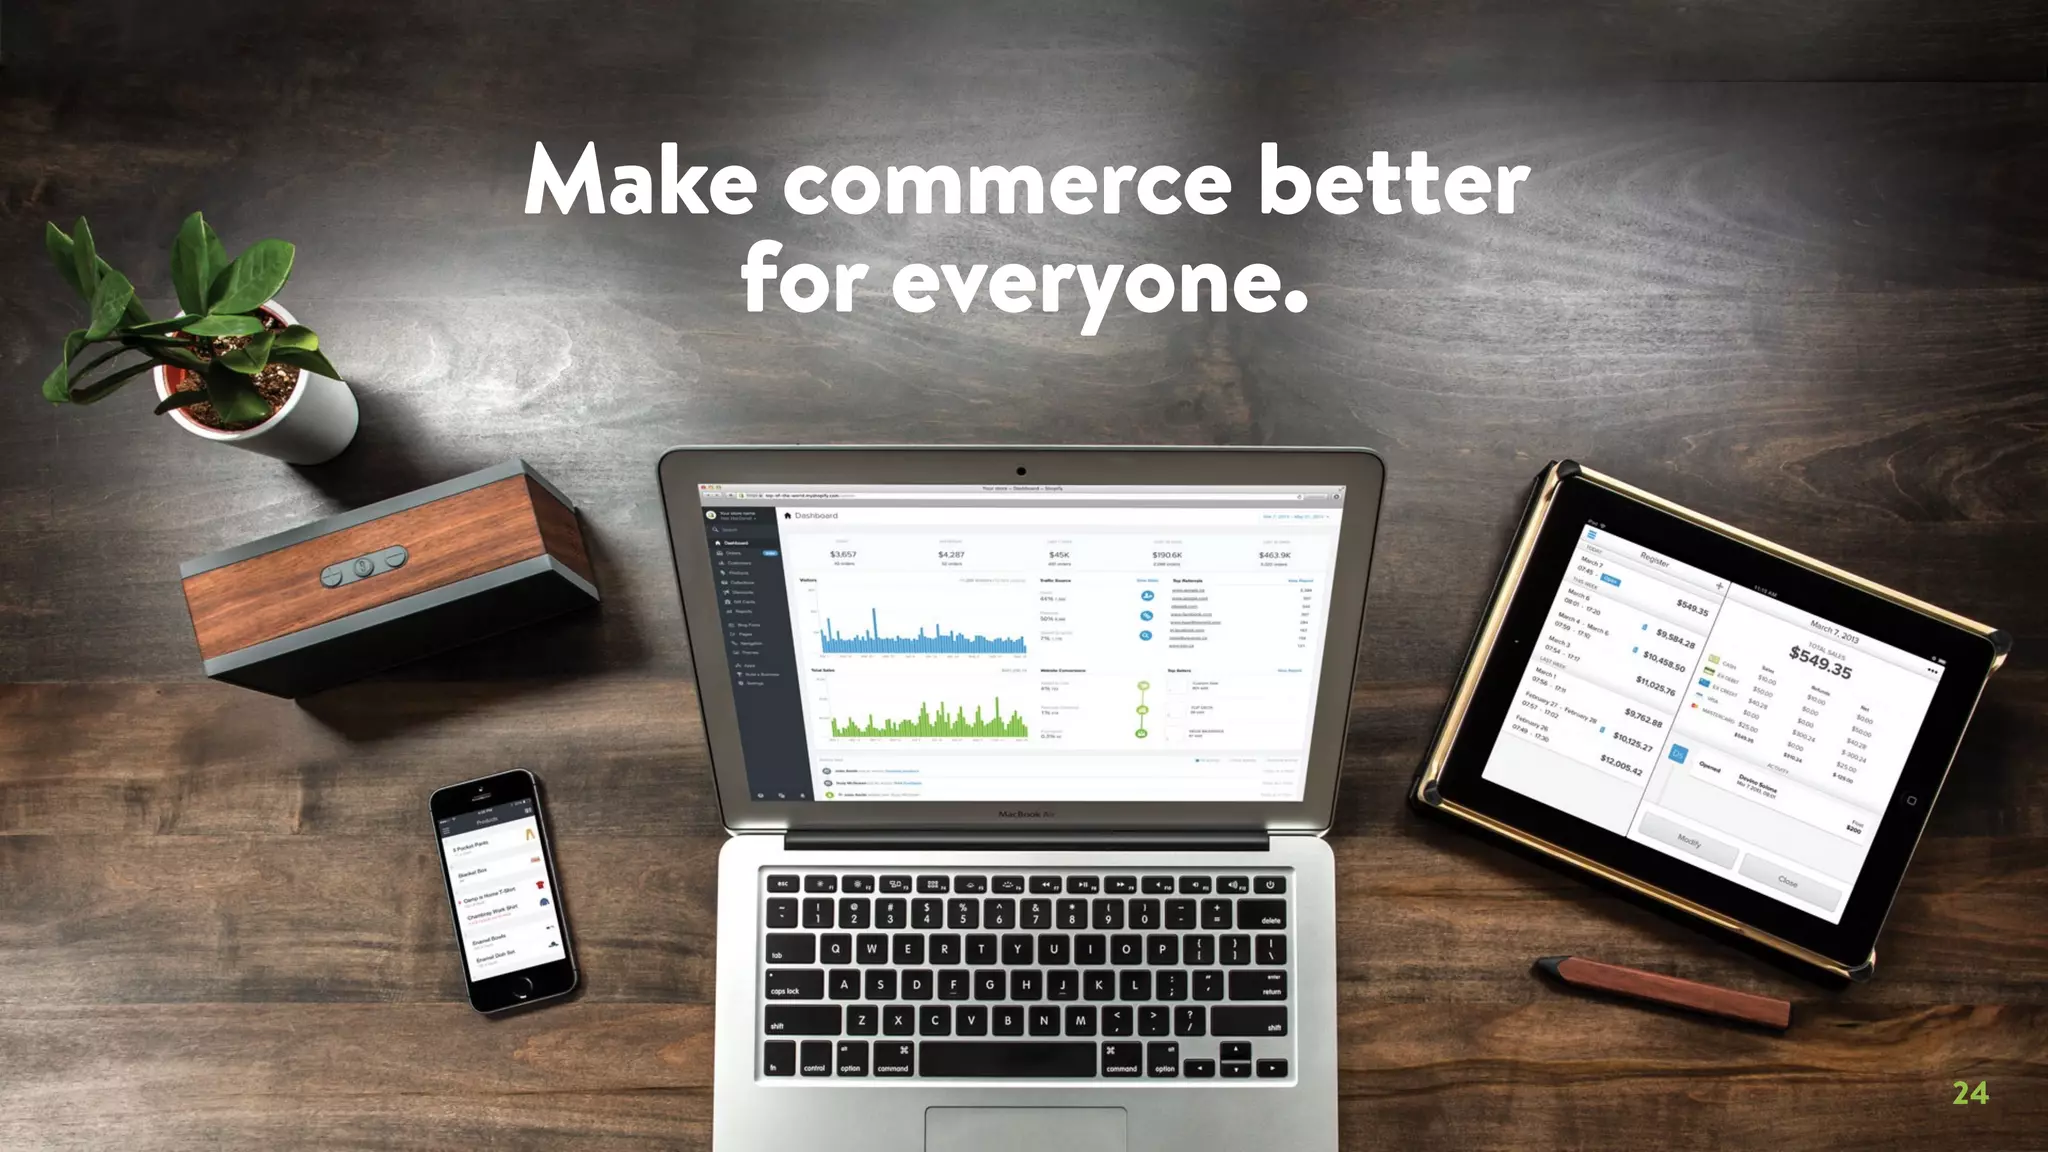
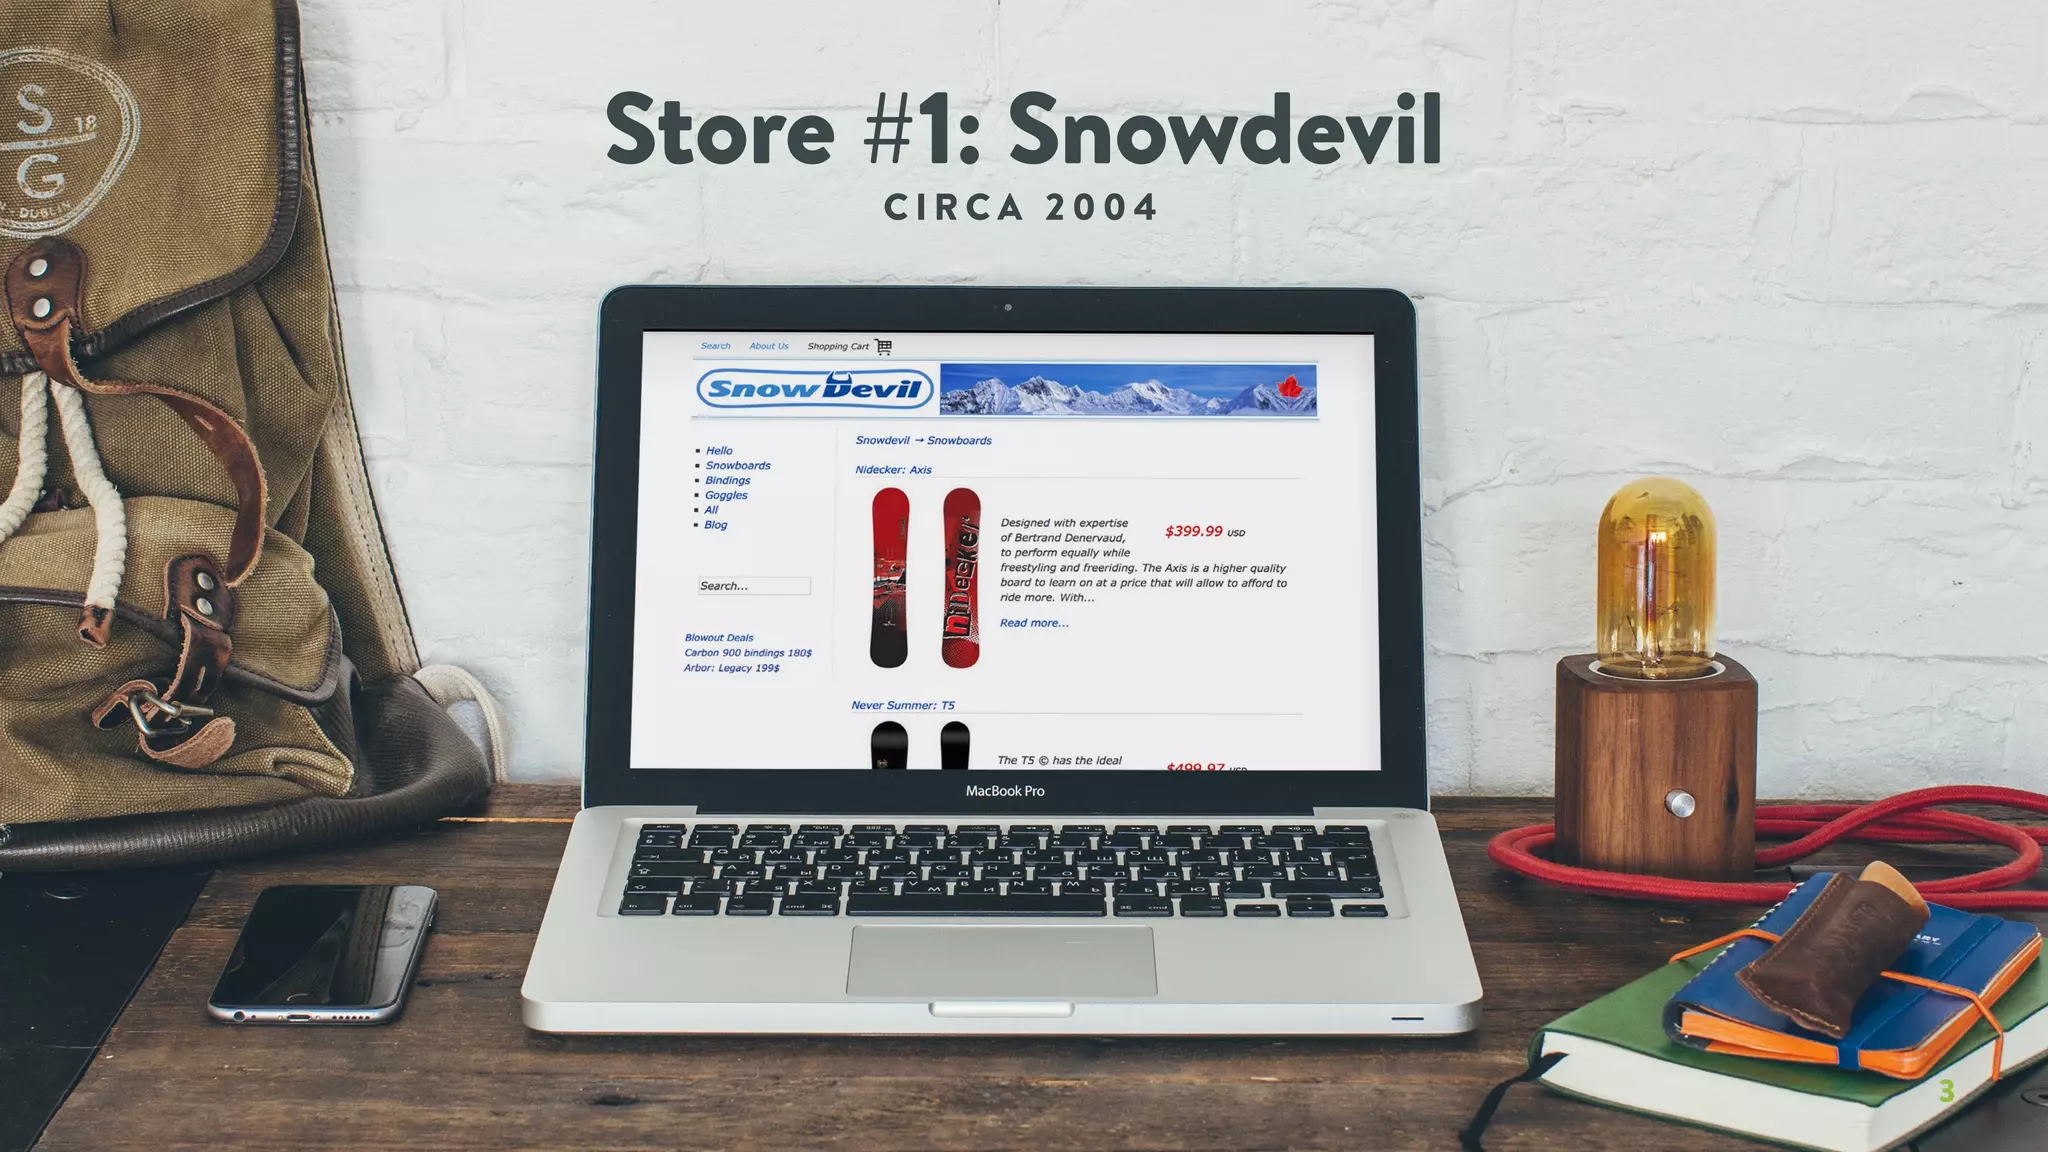
Early in the deck Shopify uses a nostalgic customer example (Store #1: Snowdevil) paired with a lifestyle photo of a laptop on a desk. This humanizes the product and shows the real-world problem being solved: enabling independent merchants to sell online. The narrative technique — showing a concrete early customer/website — converts abstraction into a relatable entrepreneurial use case, which helps investors understand the target user and the product’s role in their workflow.

Founders should note the power of a short origin or use-case slide: it clarifies the customer archetype and demonstrates product-market fit without heavy technical detail. Instead of lengthy feature lists, this slide uses imagery and a concise label to show who benefits and why. It’s a particularly effective approach when you’re selling tools for small businesses or consumer-facing SMBs where empathy and context matter.

Key Takeaway: Quickly humanize your product with one concrete customer story or archetype to show who benefits and why — pictures and a one-line caption beat long feature lists.
Platform & Omnichannel Positioning

Platform & Omnichannel Positioning

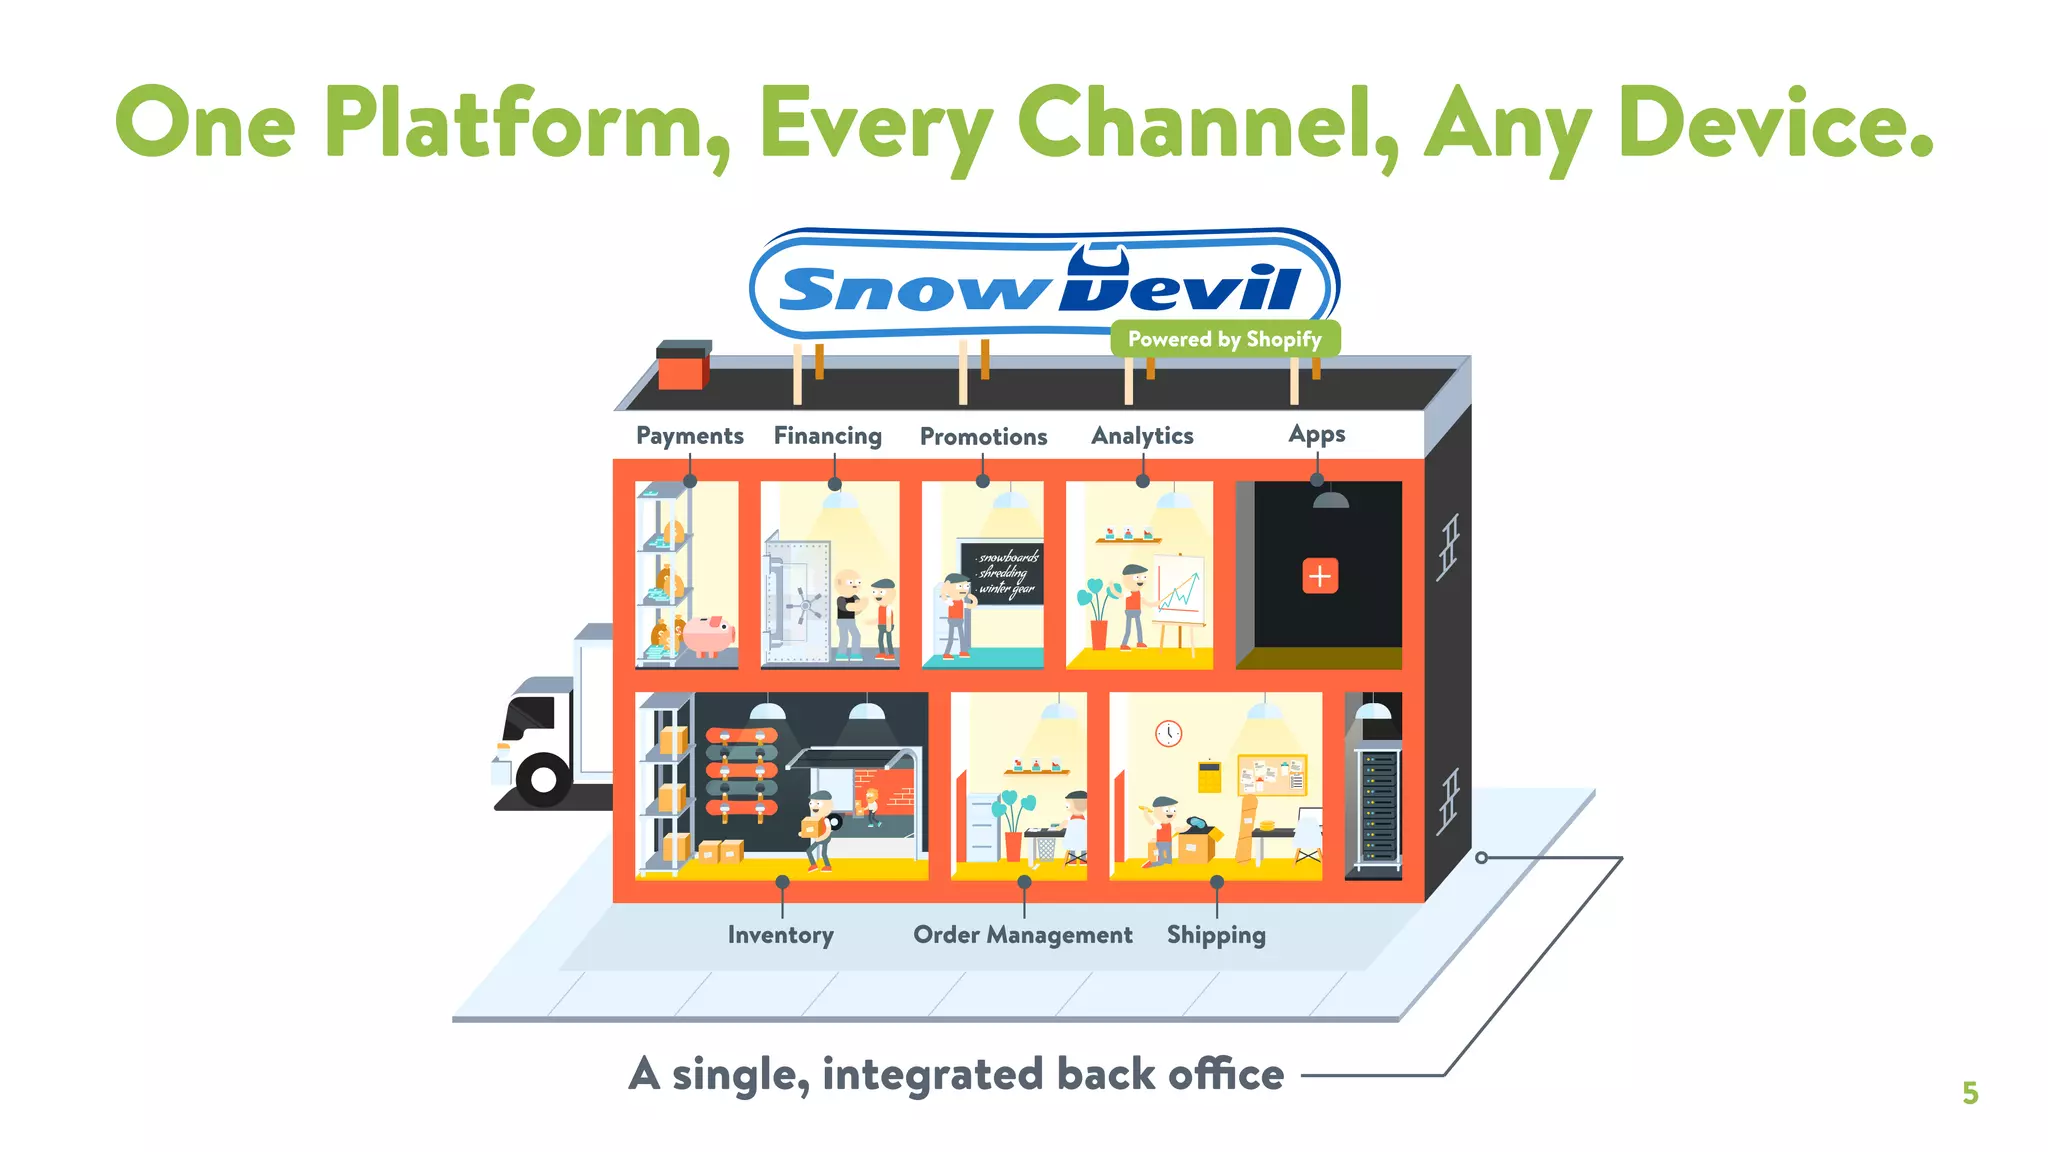
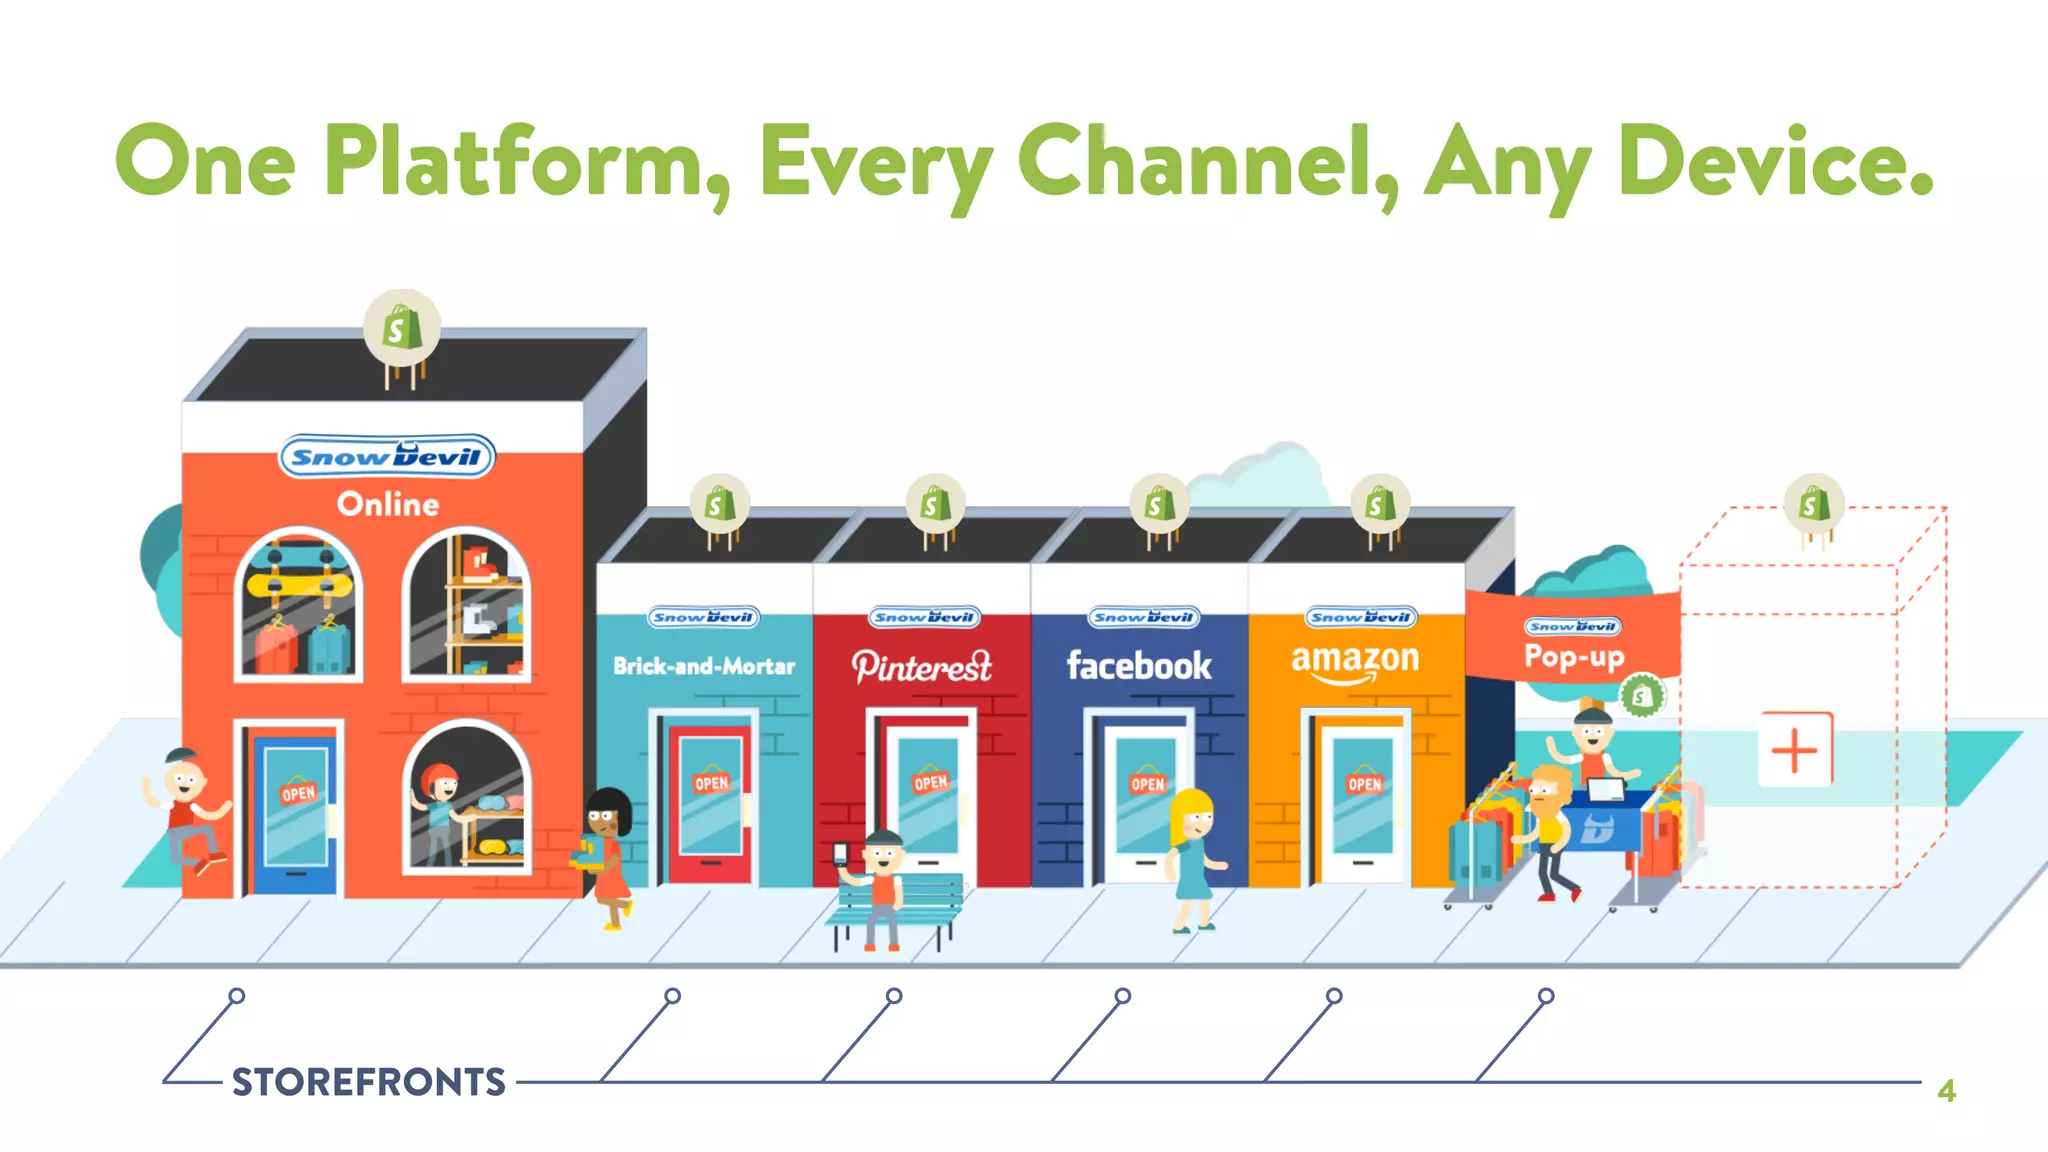
Slides that declare 'One Platform, Every Channel, Any Device' and show storefronts (brick-and-mortar, Pinterest, Facebook, Amazon, pop-up) communicate Shopify’s strategic position: not just a website builder but a single backend powering many sales channels. The colorful storefront illustration makes a complex multi-channel product easy to grasp and highlights the core value prop: unify sales, inventory, and fulfillment across channels.

This framing teaches founders the importance of positioning: identify the universal problem your product solves (fragmented sales channels and backend complexity) and depict the ecosystem clearly. The visual metaphor of storefronts is particularly effective because it maps digital channels to a physical, familiar concept — making the technical benefit accessible to non-technical investors and merchant buyers alike.

Key Takeaway: Use a simple visual metaphor to show how your product removes complexity across channels — make the ecosystem tangible so investors can quickly grasp the strategic value.
Market Segments & Pricing Ladder

Market Segments & Pricing Ladder

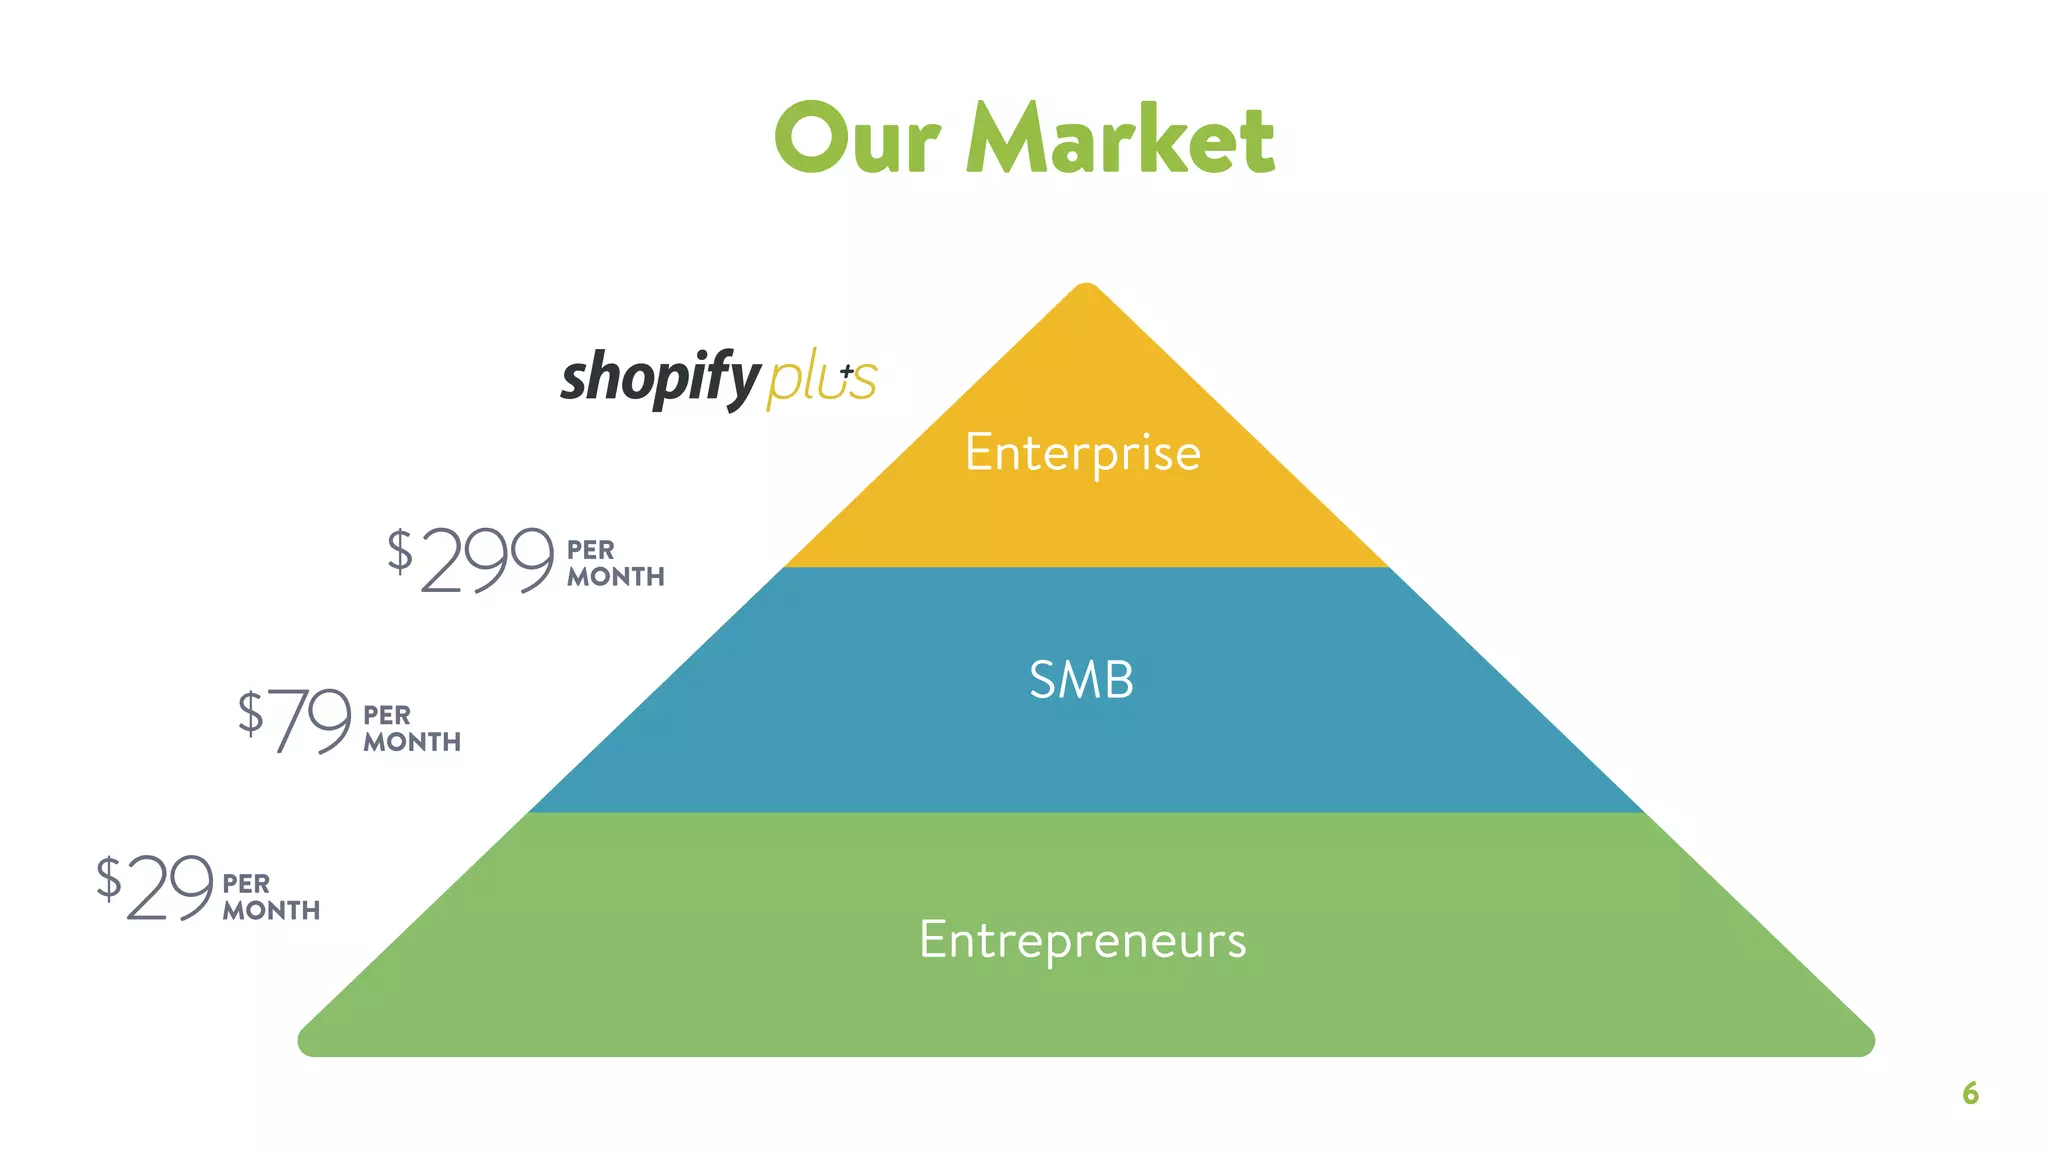
The market pyramid (Entrepreneurs / SMB / Enterprise) with price points ($29 / $79 / $299) succinctly communicates Shopify’s go-to-market segmentation and revenue model. It signals a broad funnel: large base of entrepreneurs, rising ARPU for established SMBs, and customized enterprise offerings. This slide clarifies how the company captures value at multiple levels and hints at a clear upgrade path for customers as they grow.

For founders, this is an essential lesson in linking pricing to customer segmentation — show not just TAM but how you expect customers to climb your value ladder. Simultaneously presenting price points and market layers helps investors model ARR/MRR growth and churn assumptions, so be explicit and simple about tiers and who each tier serves.

Key Takeaway: Map pricing tiers directly to customer segments and show the upgrade path — investors need to see how customers progress and how ARPU increases across segments.
Ecosystem & Strategic Partnerships

Ecosystem & Strategic Partnerships

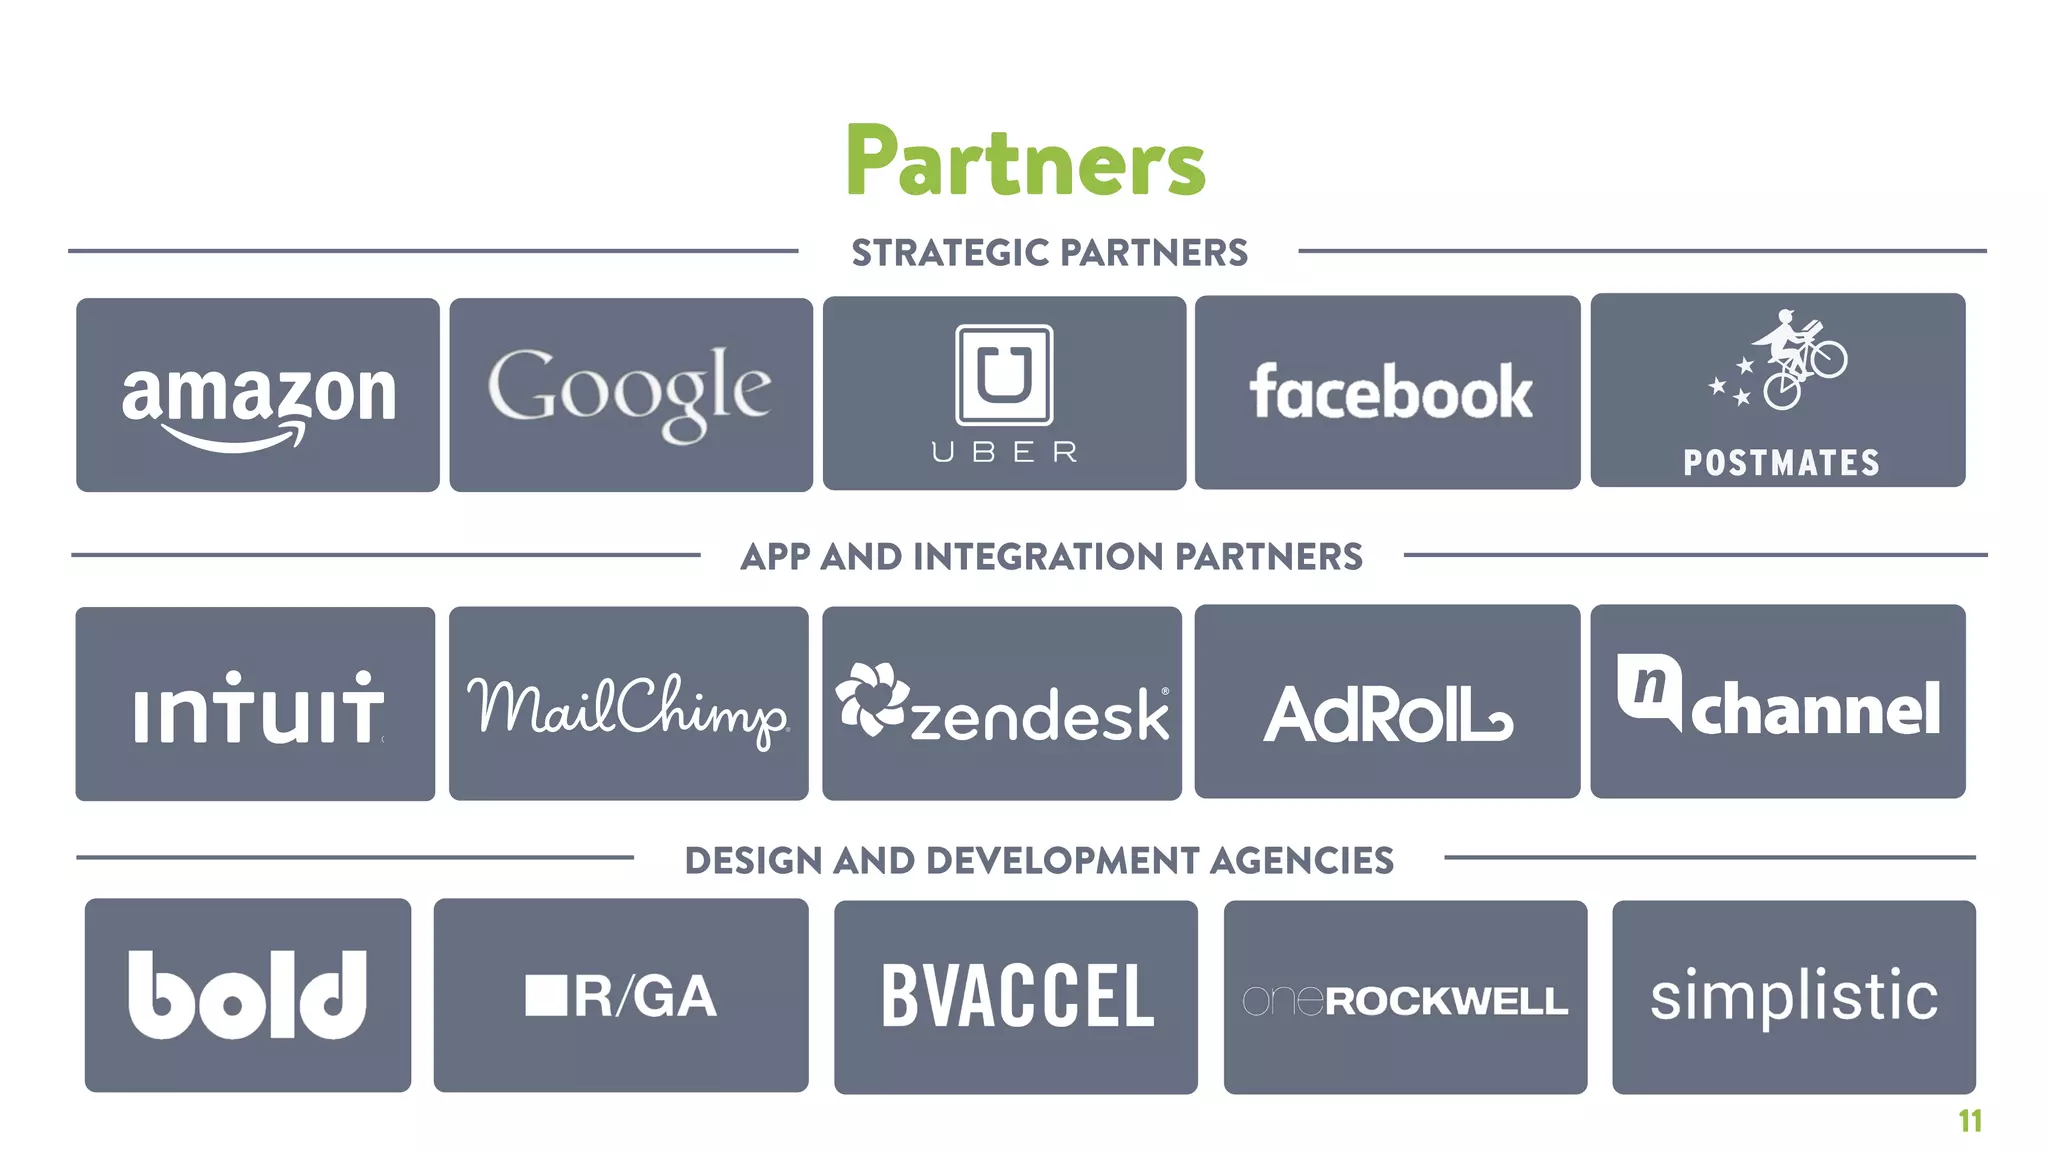
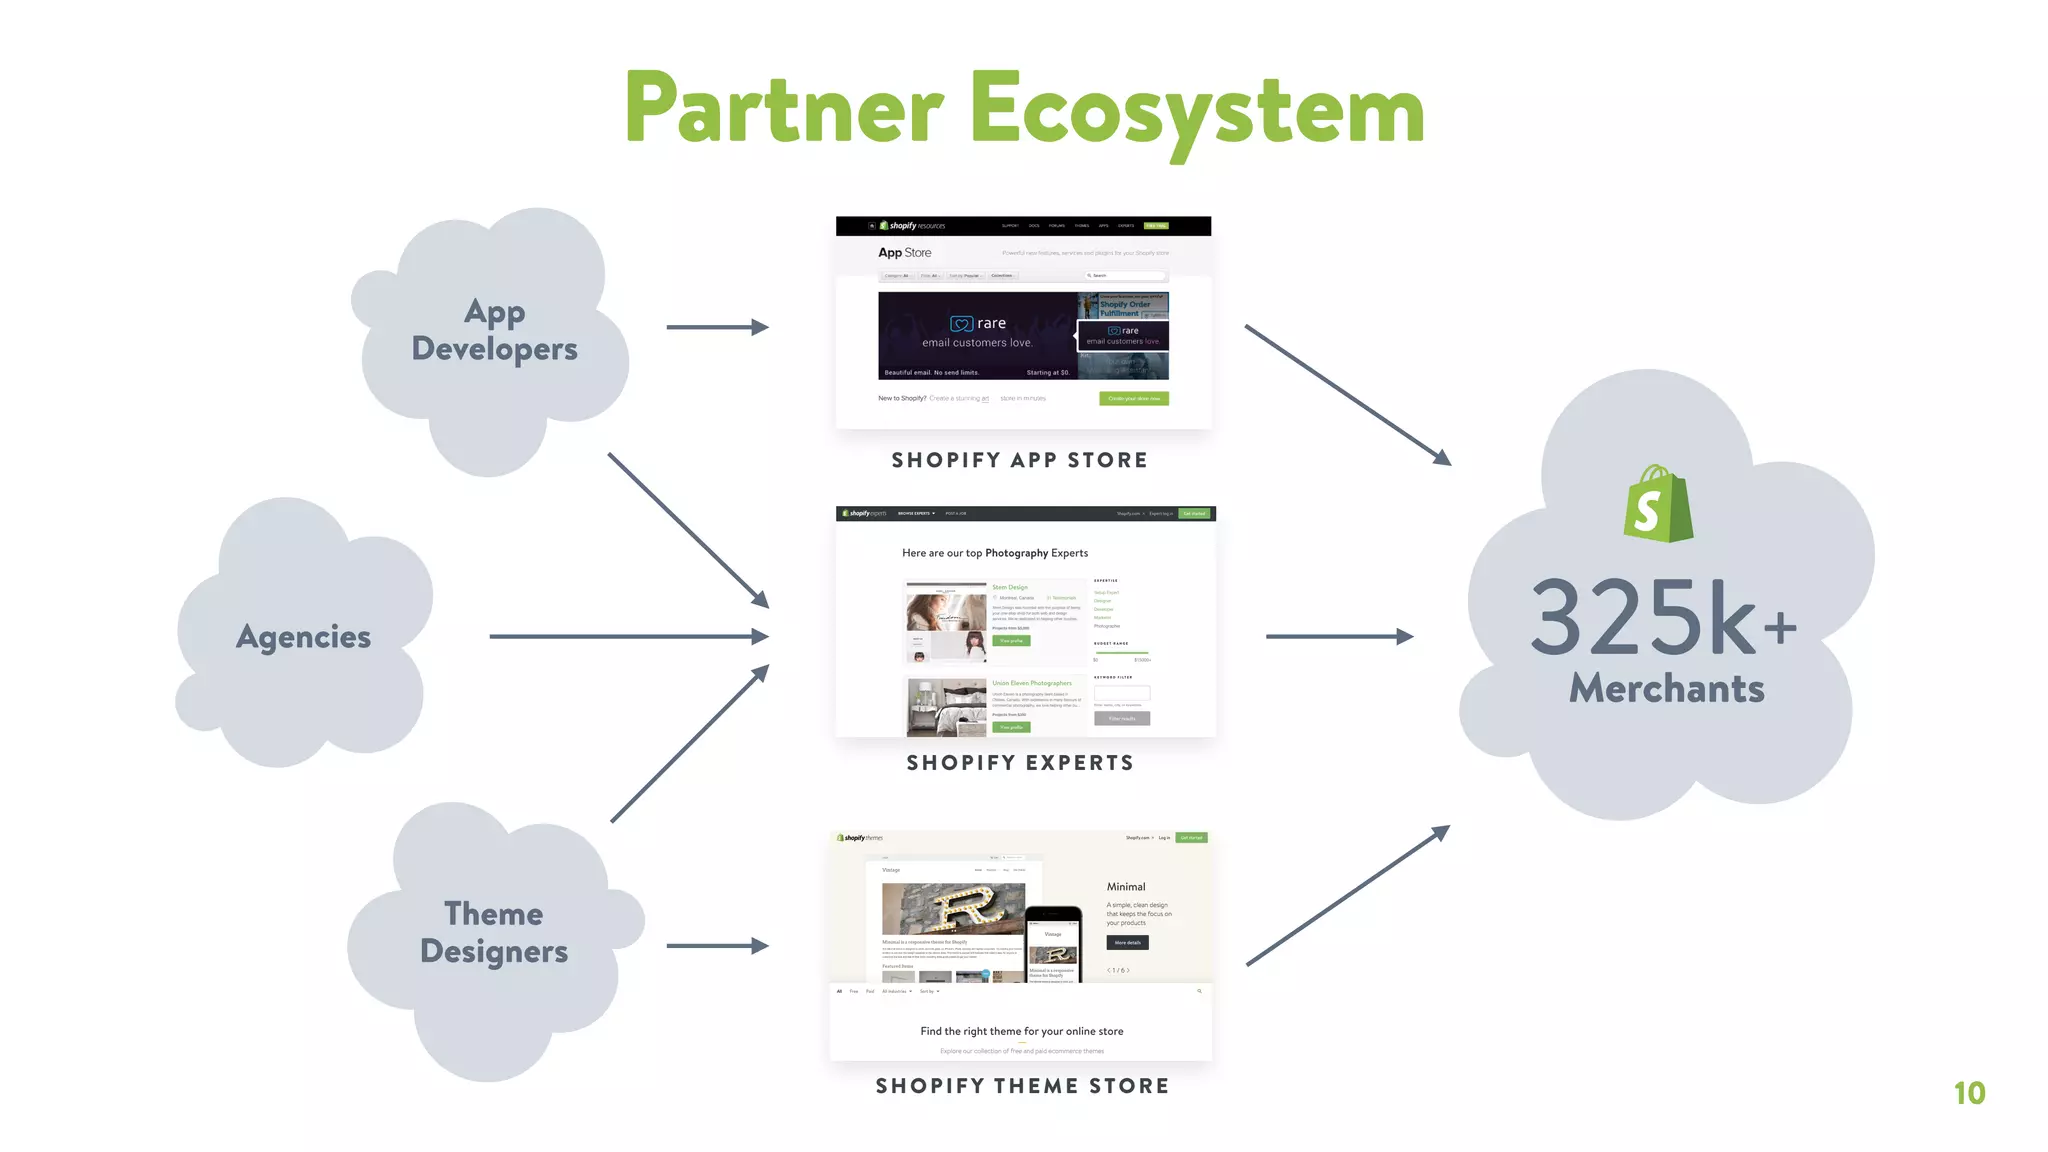
Multiple slides emphasize Shopify’s partner ecosystem: apps, themes, agencies, and strategic partners like Amazon, Google, Facebook, and Uber. The partner ecosystem slide shows feeds from app developers, theme designers and experts into a merchant pool of 325k+ stores. Another slide lists logo-level strategic partners and integration partners. This combination demonstrates a two-sided network effect — partners build for the platform and merchants benefit, creating stickiness and distribution.

Founders should prioritize proving ecosystem dynamics early if their product benefits from third-party integration (marketplaces, APIs, plugins). Highlight not only who your partners are but how they contribute to growth (distribution, feature breadth, trust). Logos are powerful social proof; pairing them with a diagram of flows (partners → product → merchants) makes the mechanism clear to investors.

Key Takeaway: Show how third parties (apps, themes, strategic partners) create distribution and stickiness — use logos plus a simple flow diagram to explain the network effect.
Traction & Financial Momentum (Revenue, MRR, GMV)

Traction & Financial Momentum (Revenue, MRR, GMV)

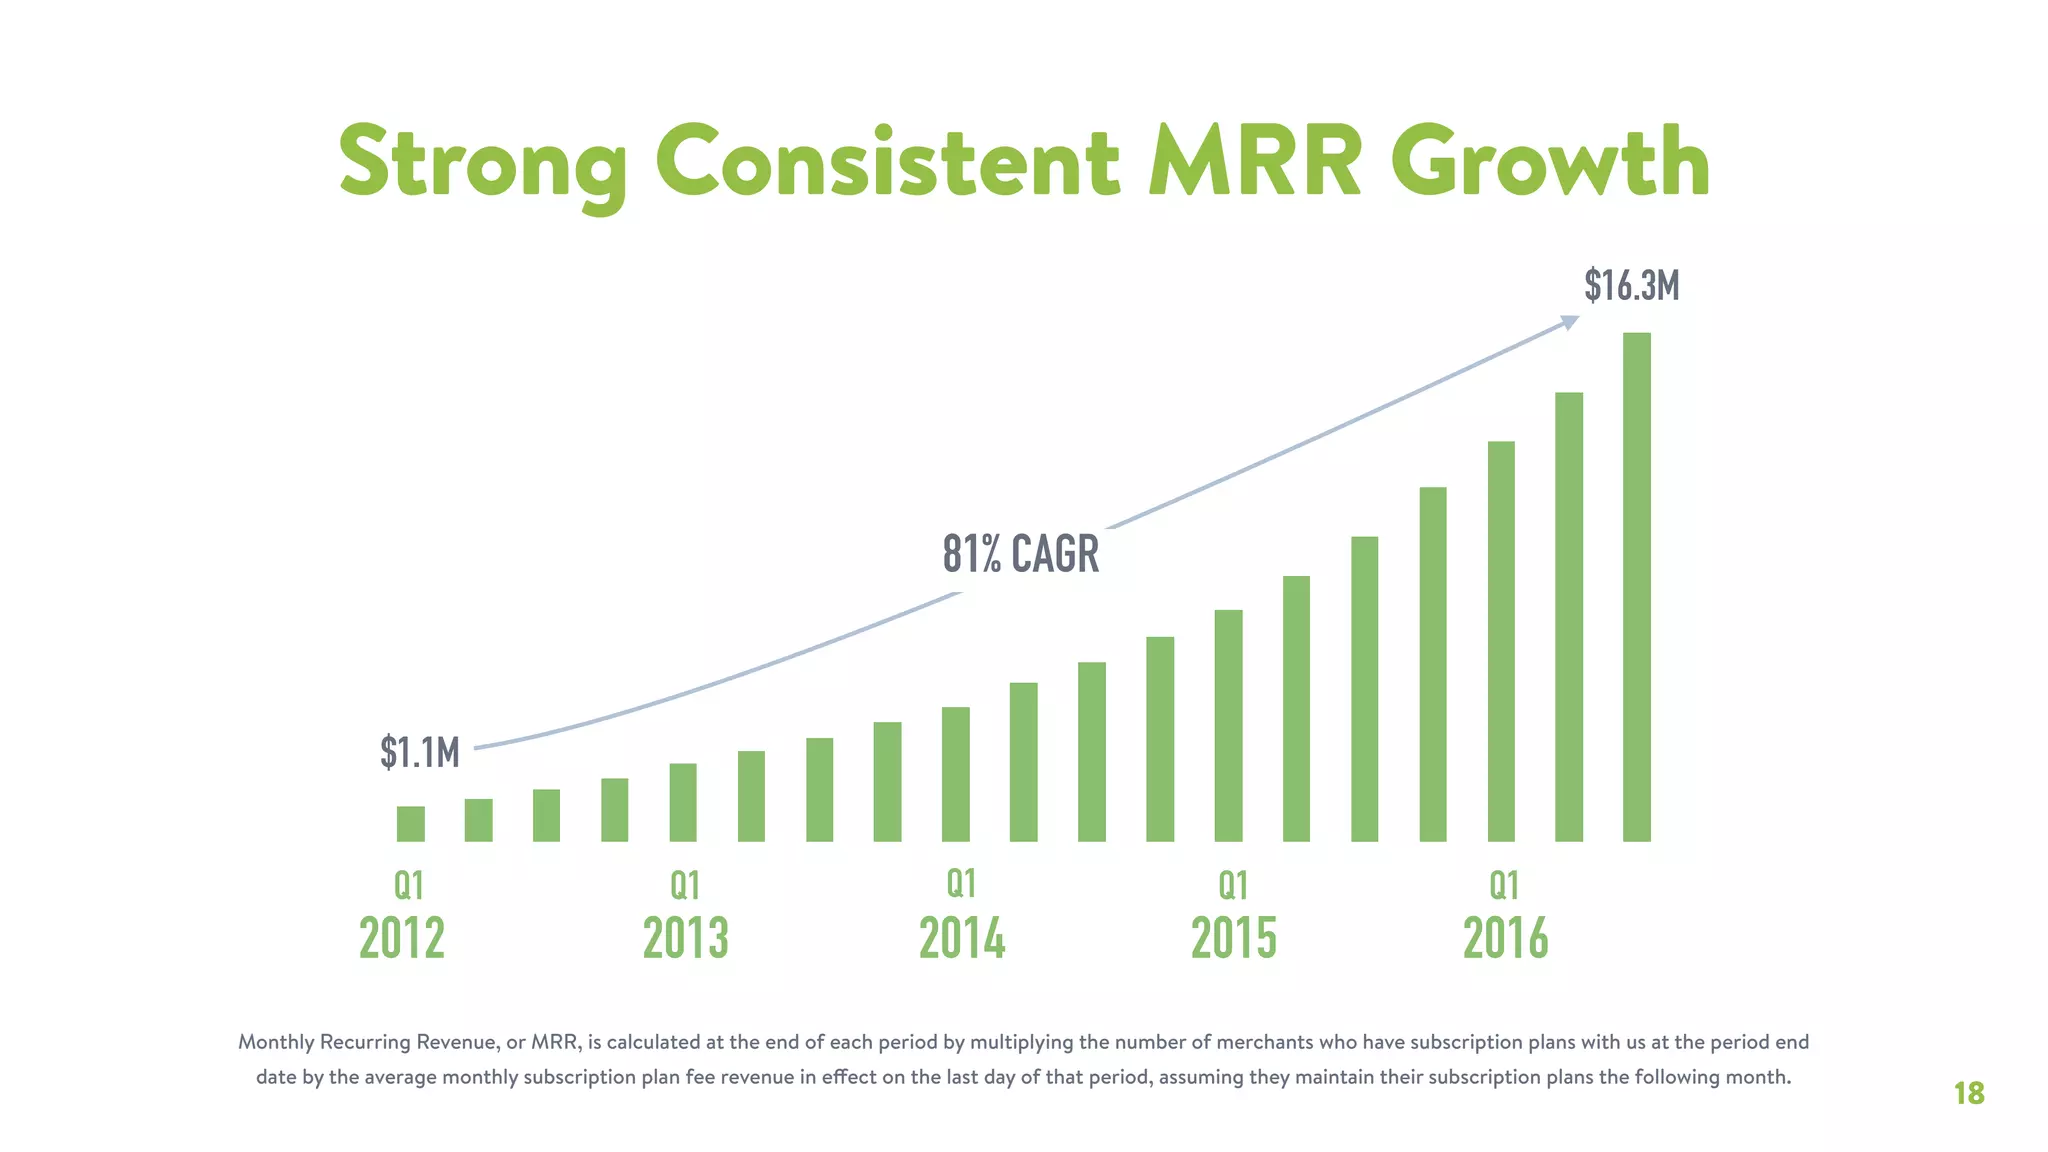
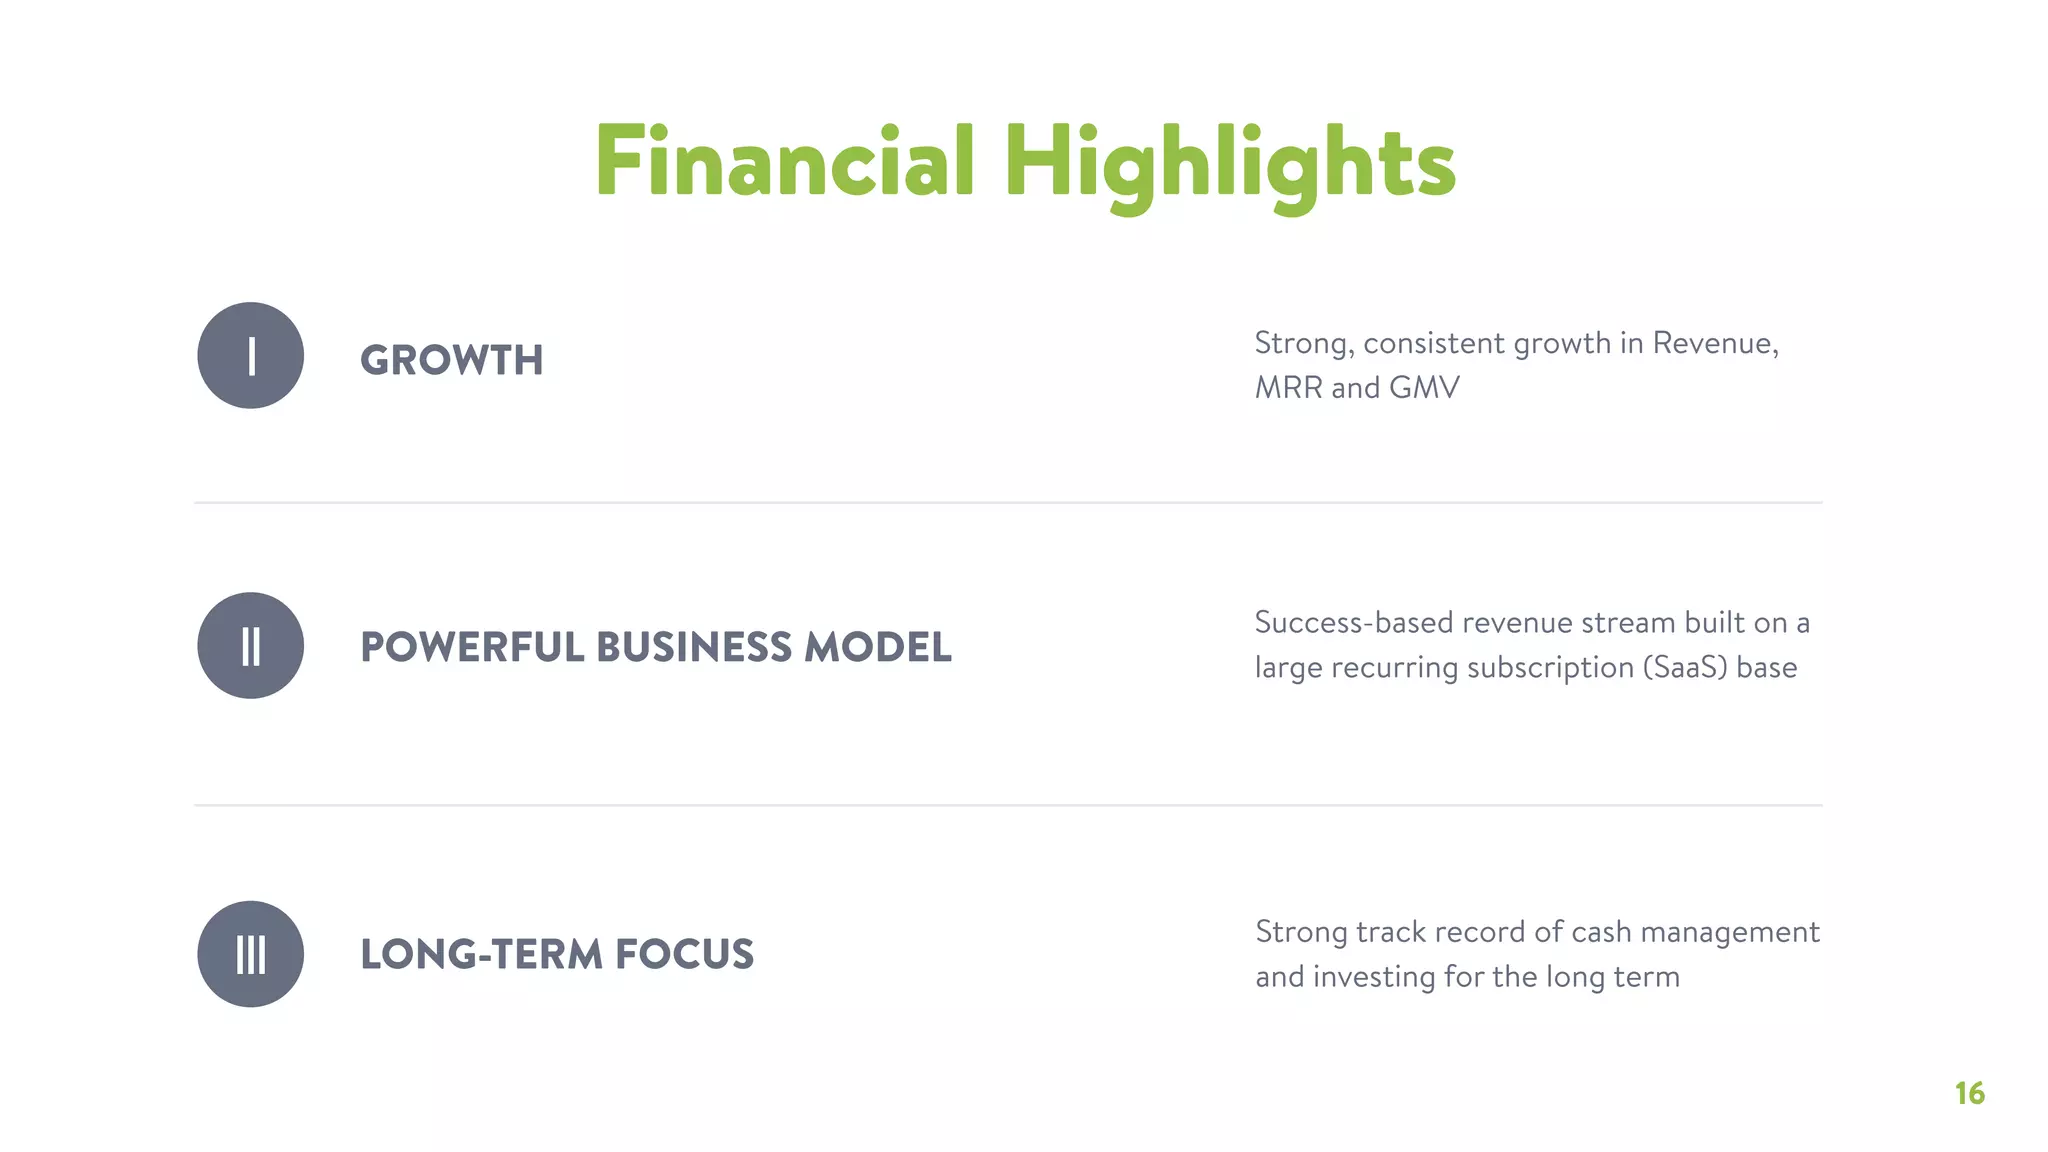
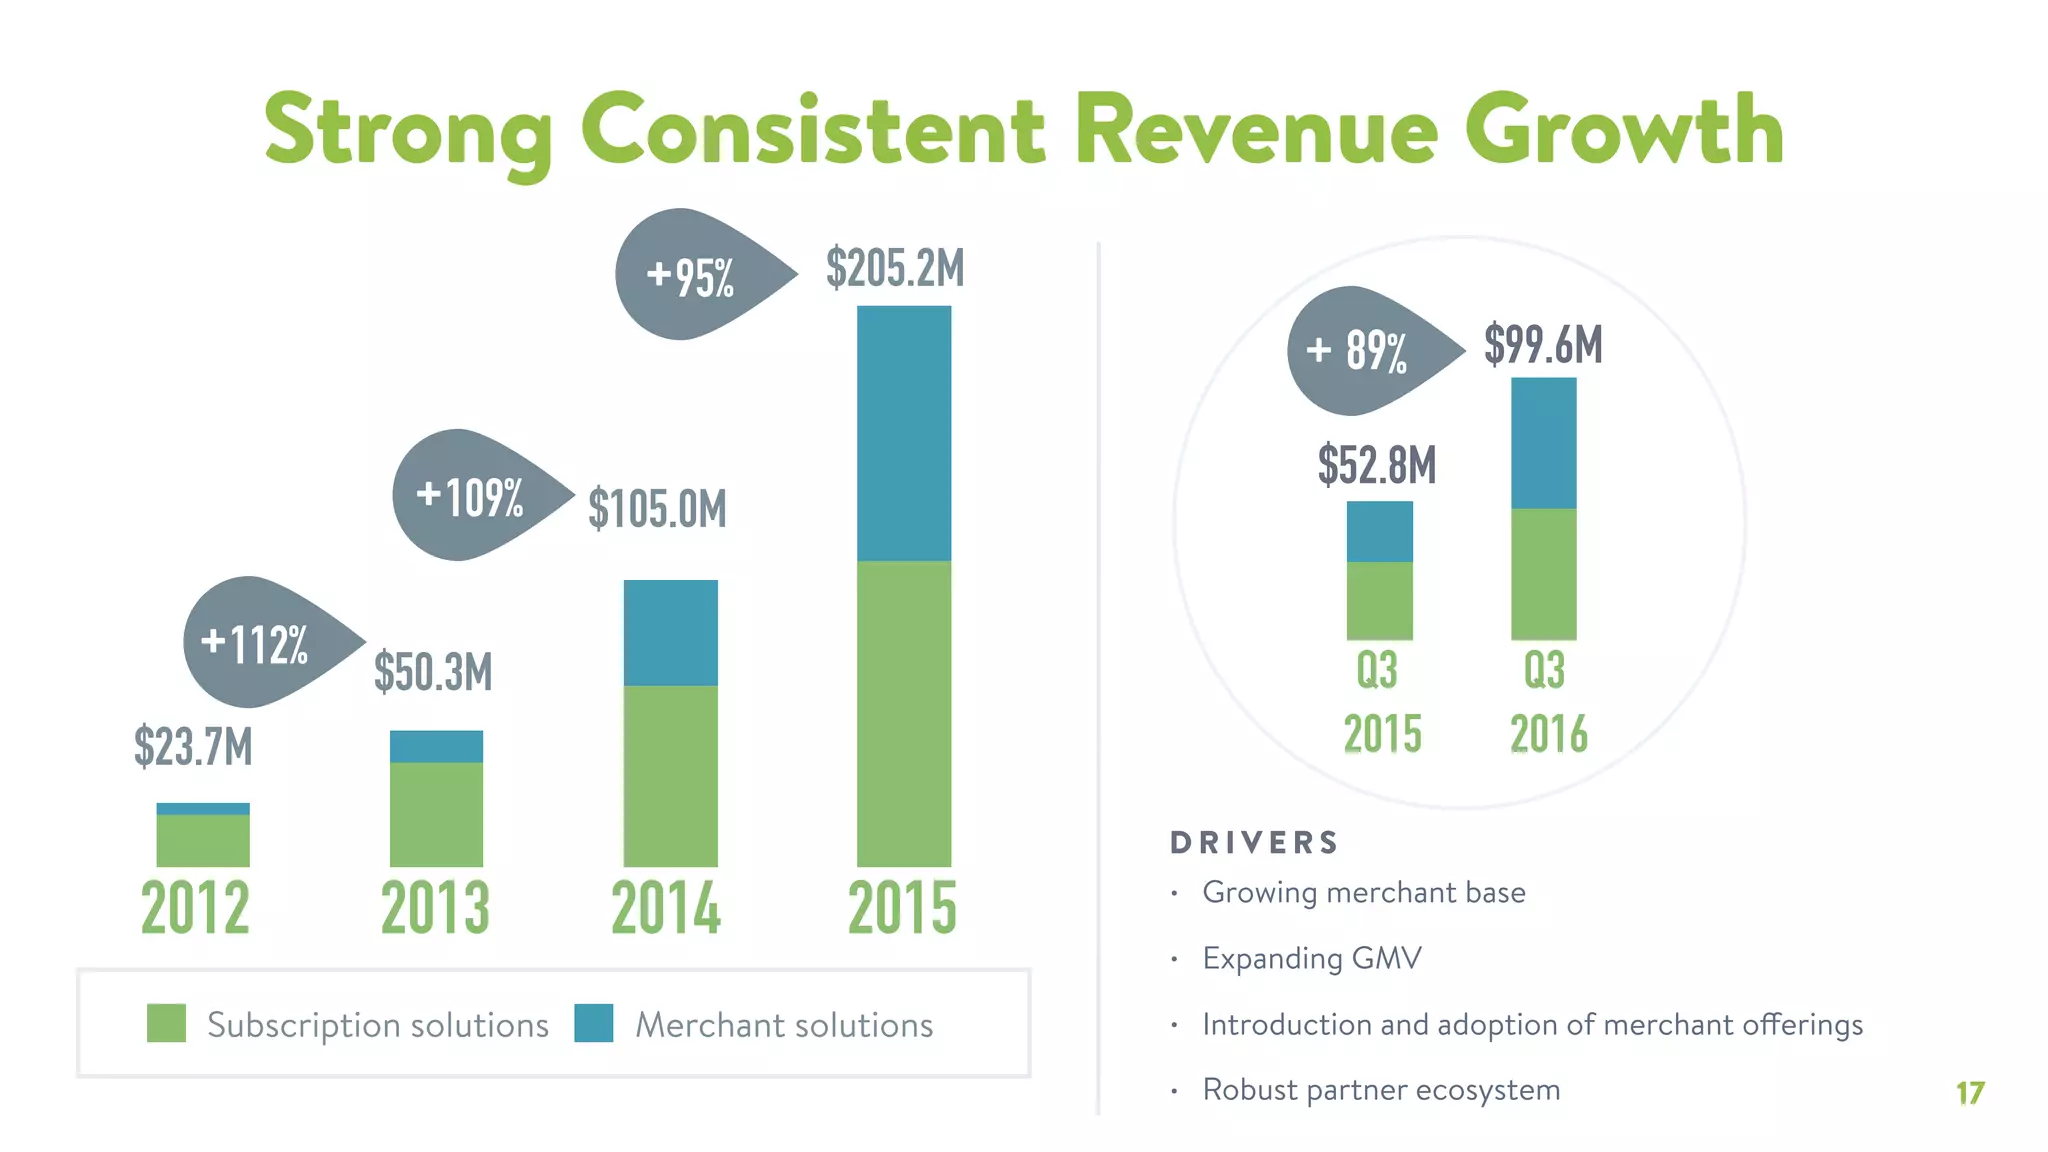
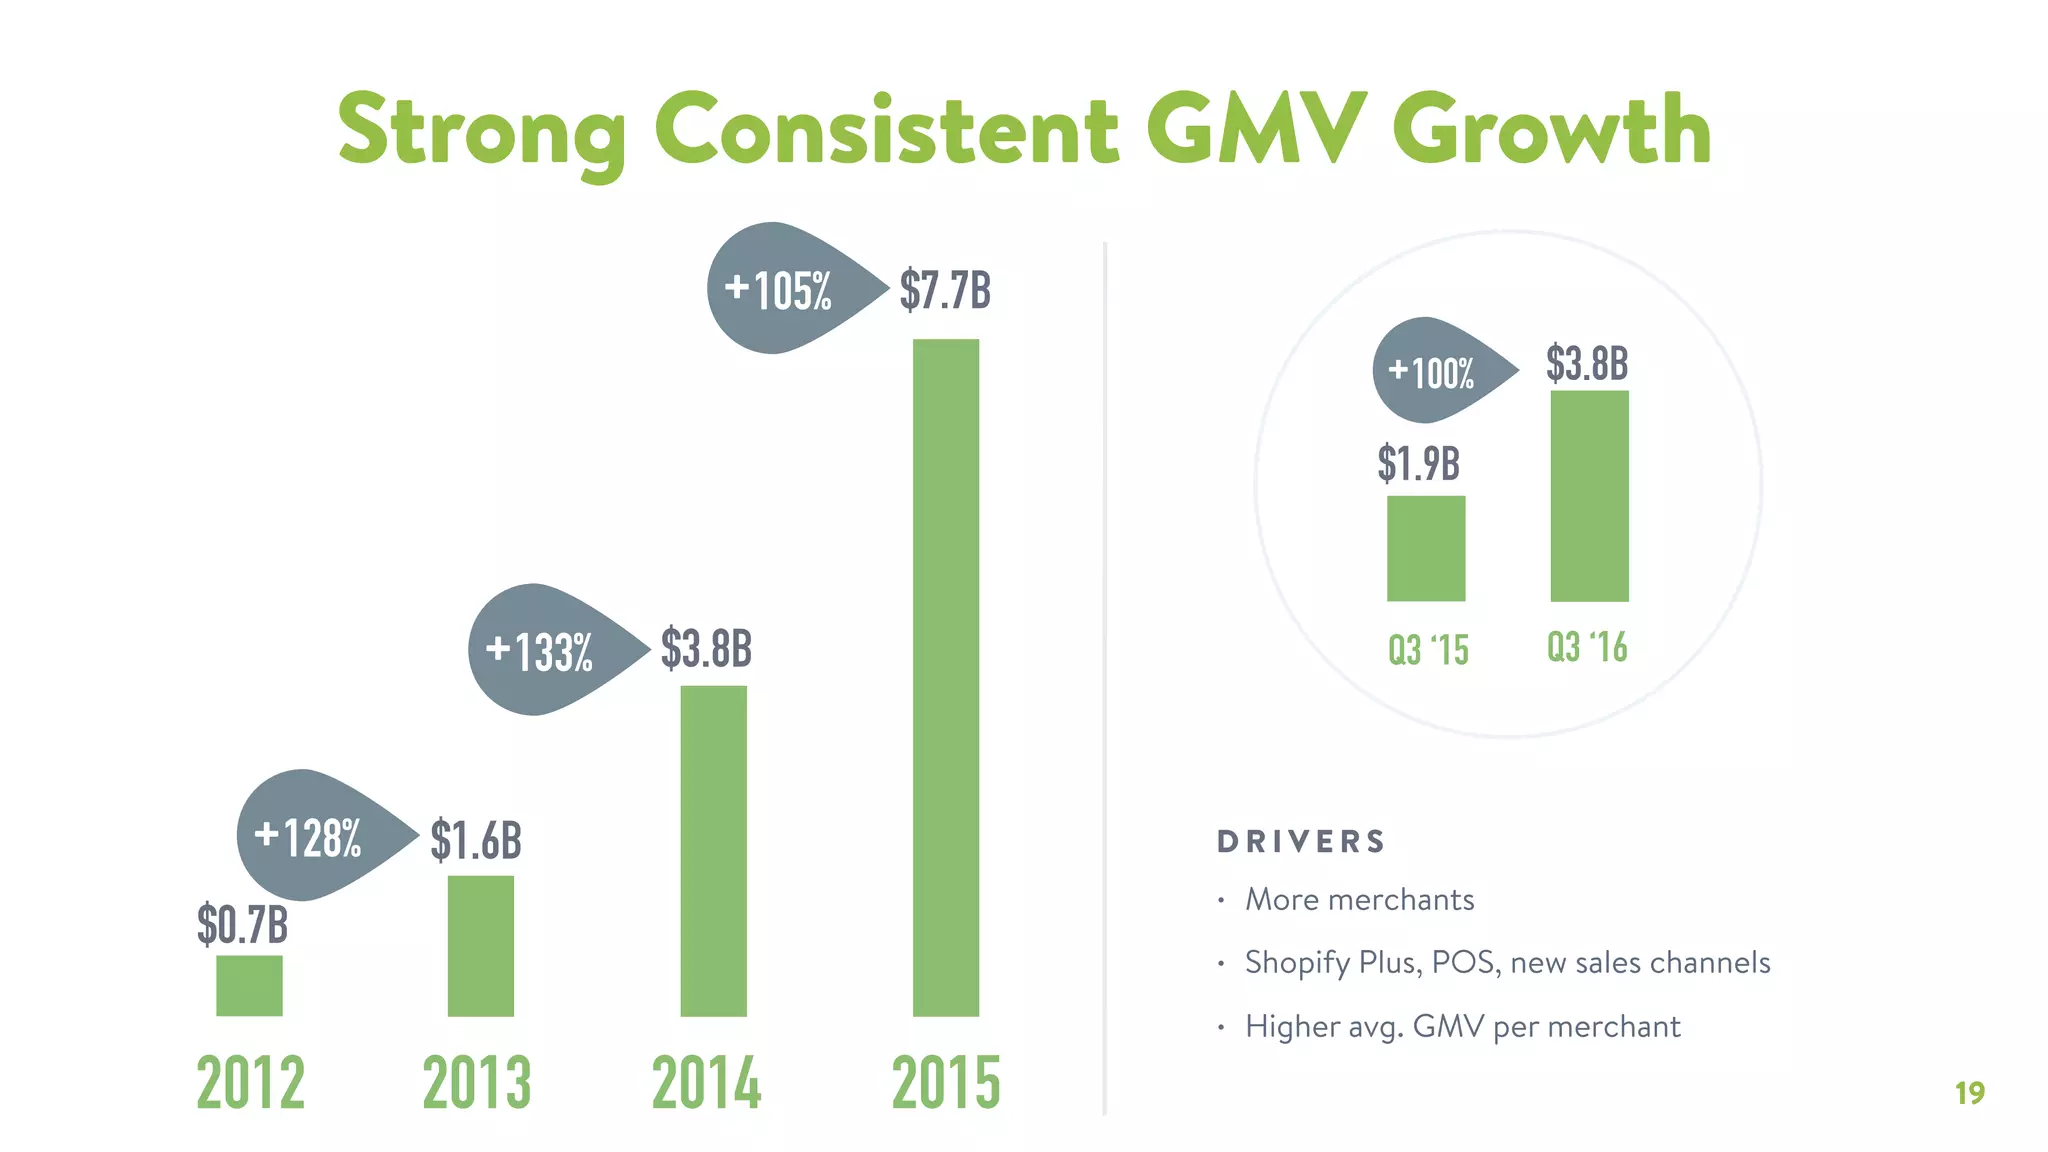
Shopify devotes several slides to concrete financial momentum: multi‑year revenue bars, MRR growth with CAGR highlighted, and GMV expansion from $0.7B to $7.7B over a few years. These are not just raw numbers — the charts call out year-over-year % growth and separate subscription vs merchant solutions revenue, enabling investors to see both recurring base and success-based monetization. The visual clarity (stacked bars, labeled percentages) allows quick modeling of unit economics and growth drivers.

Founders must learn to present growth in multiple complementary metrics (MRR, revenue, GMV) and to separate revenue streams so investors can assess scalability and margins. Highlighting CAGR and YoY growth percentages contextualizes the story: high growth plus predictable recurring revenue is far more compelling than one-off spikes. Also, annotate drivers (growing merchant base, new channels, Shopify Plus) so the deck links strategy to results.

Key Takeaway: Present multiple growth metrics (MRR, revenue, GMV) with clear segmentation and percent growth callouts — connect the metrics to specific growth drivers to make results actionable for investors.
Operating Leverage & Investment Roadmap

Operating Leverage & Investment Roadmap

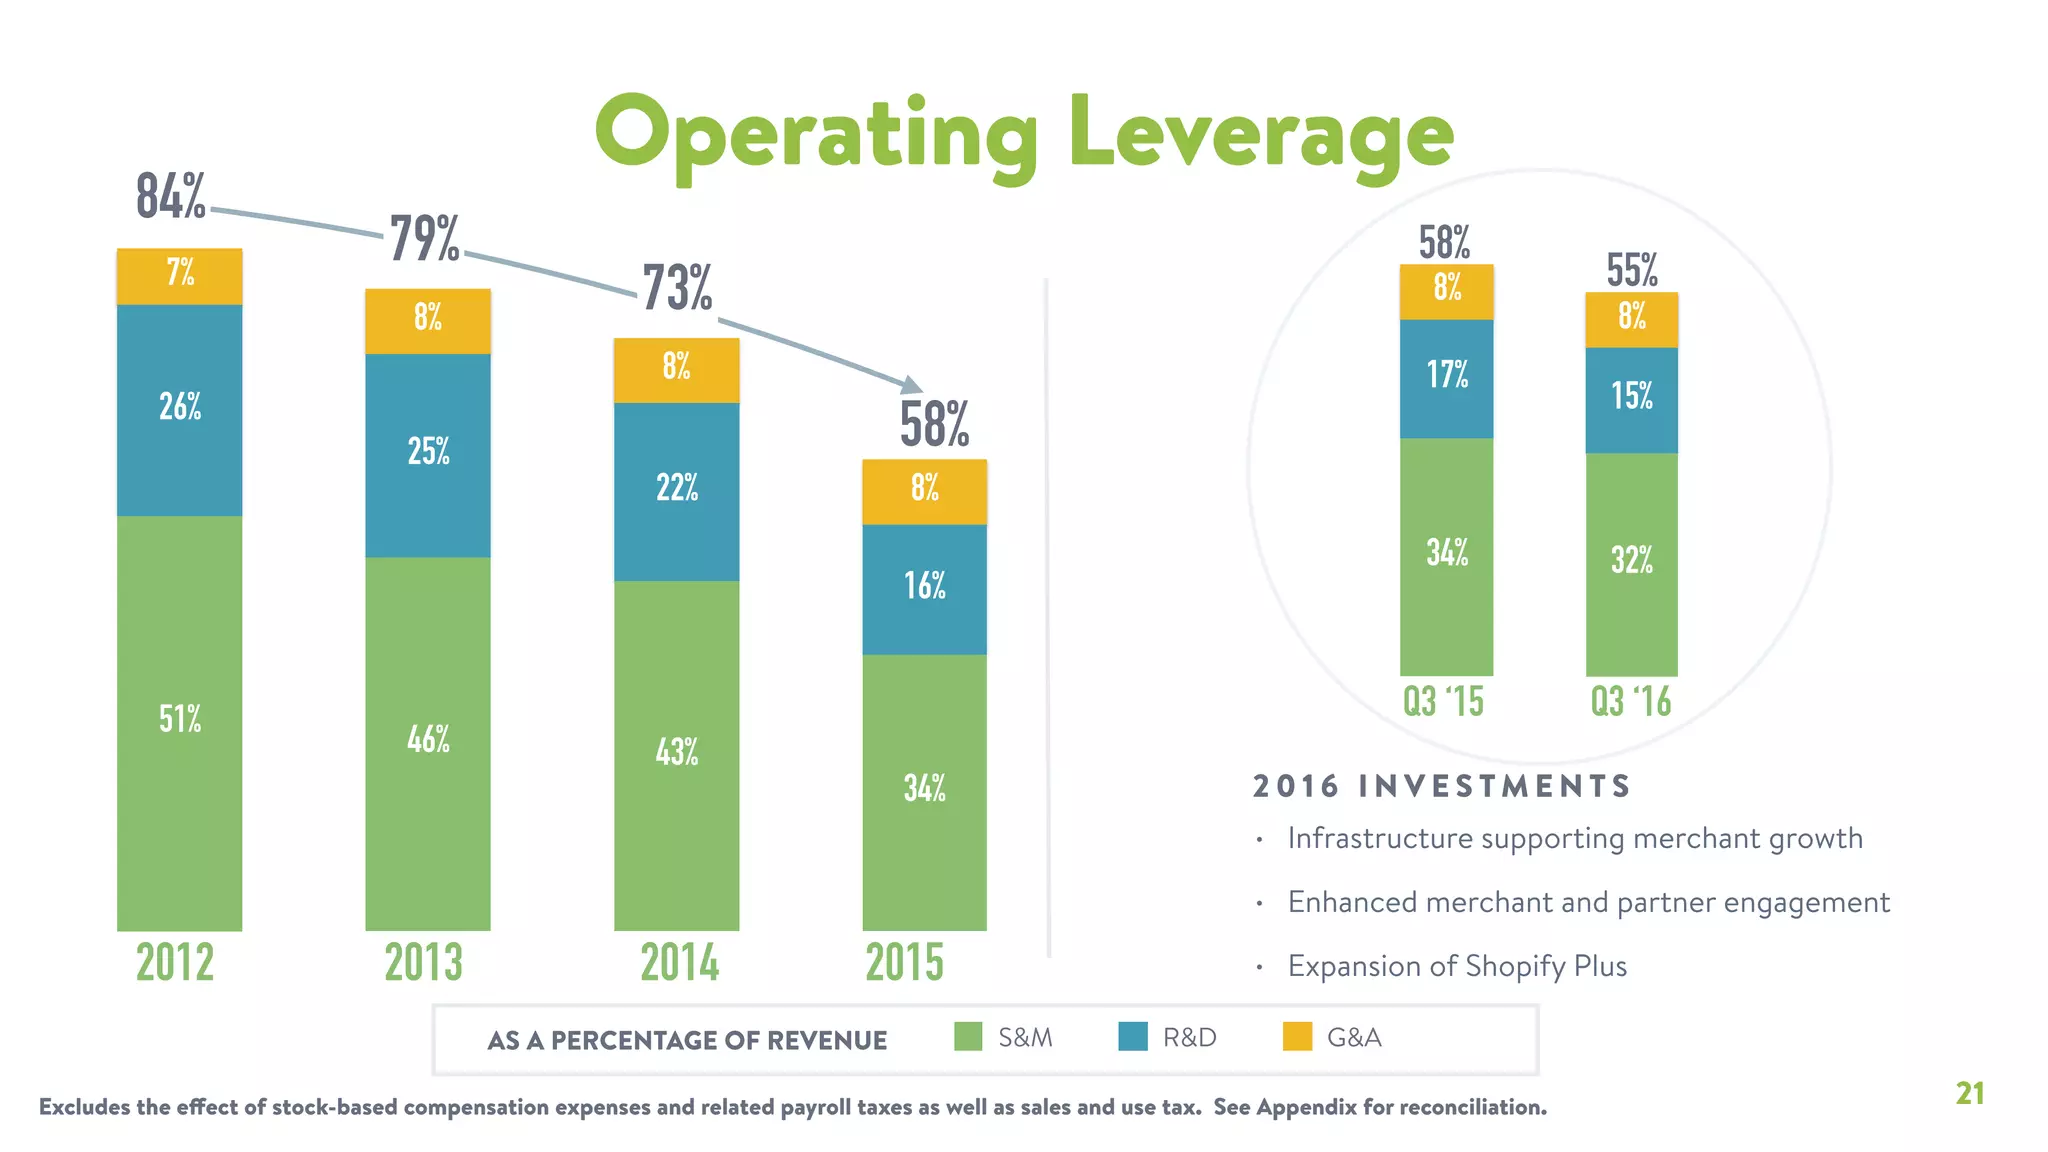
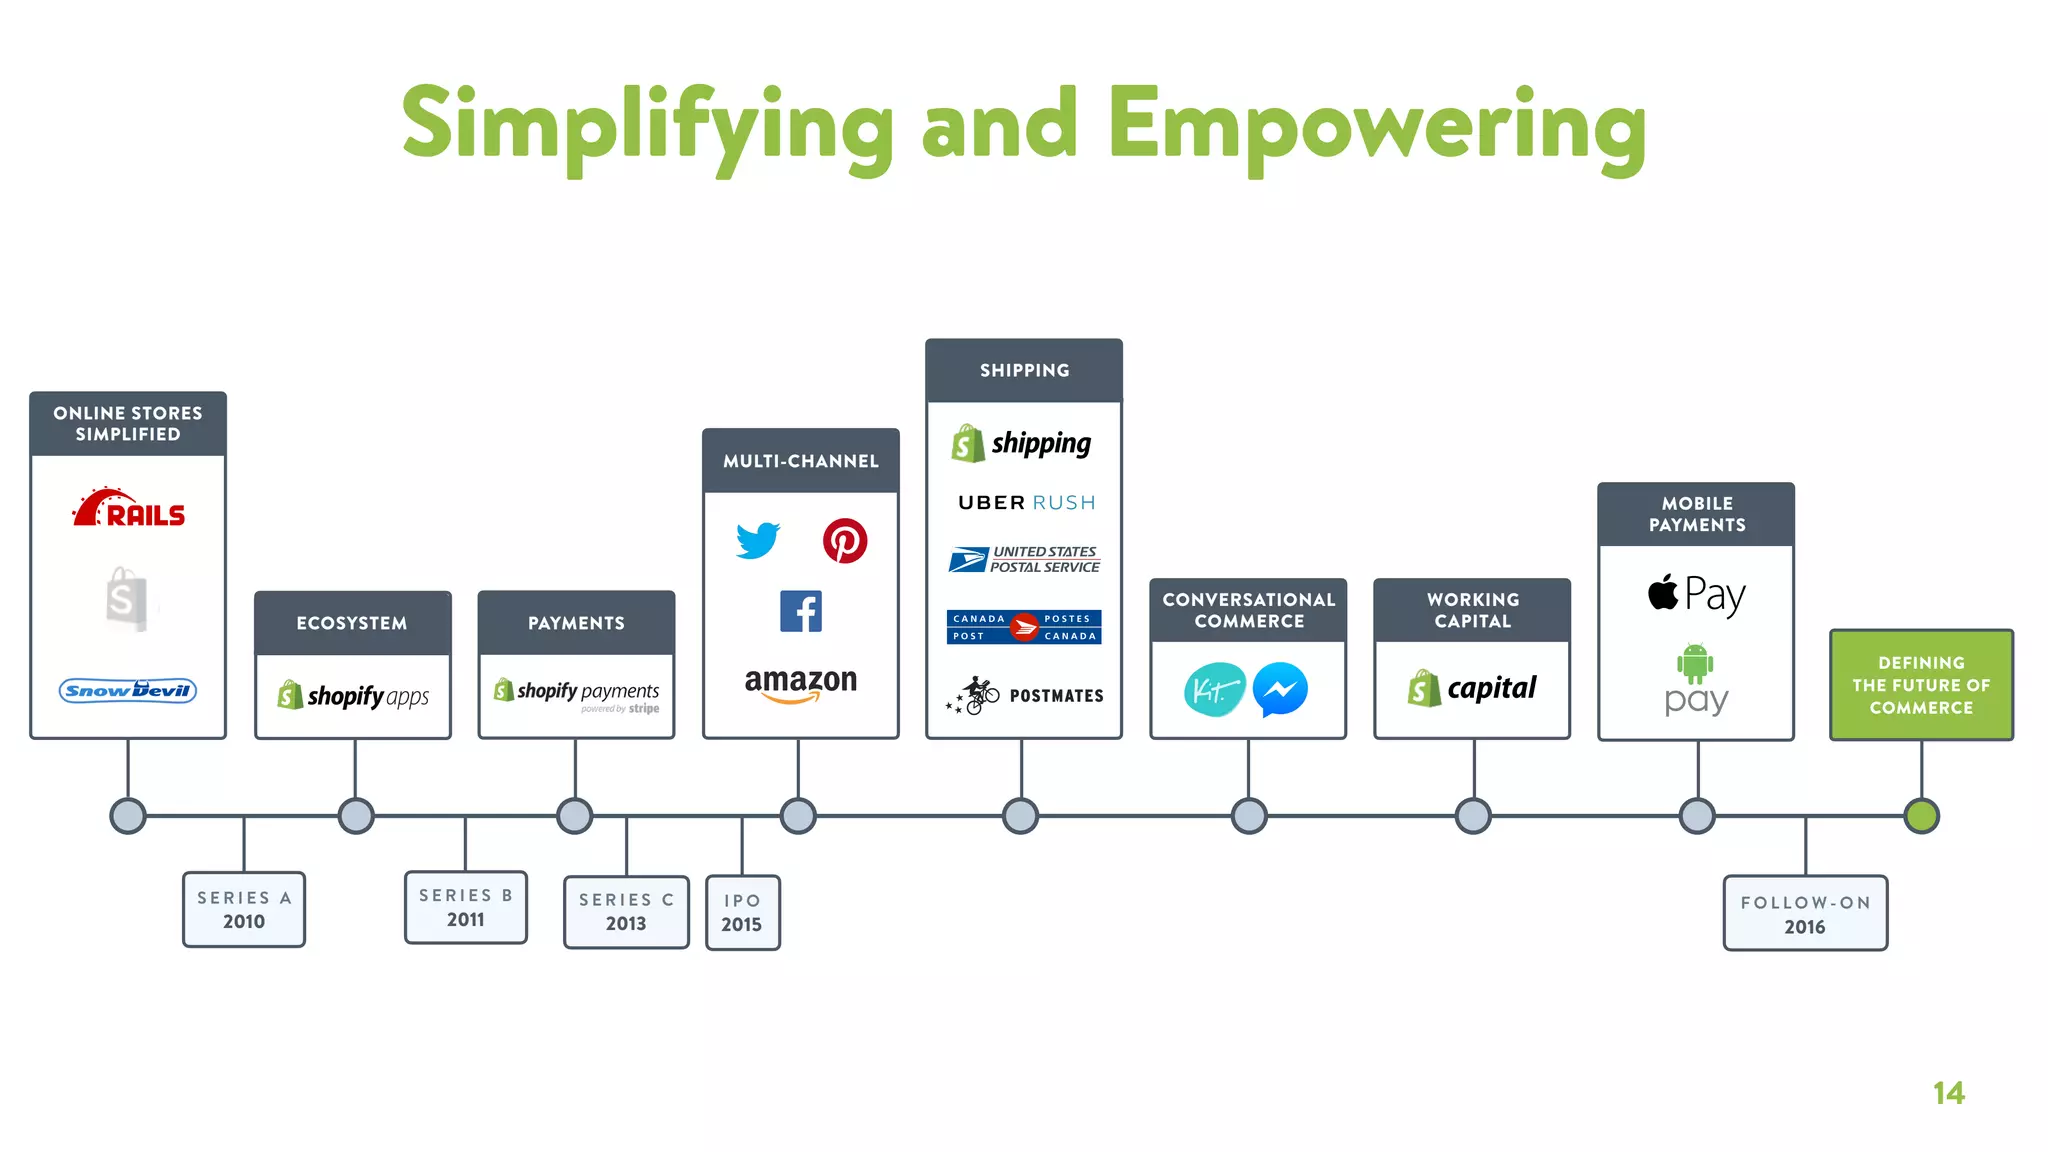
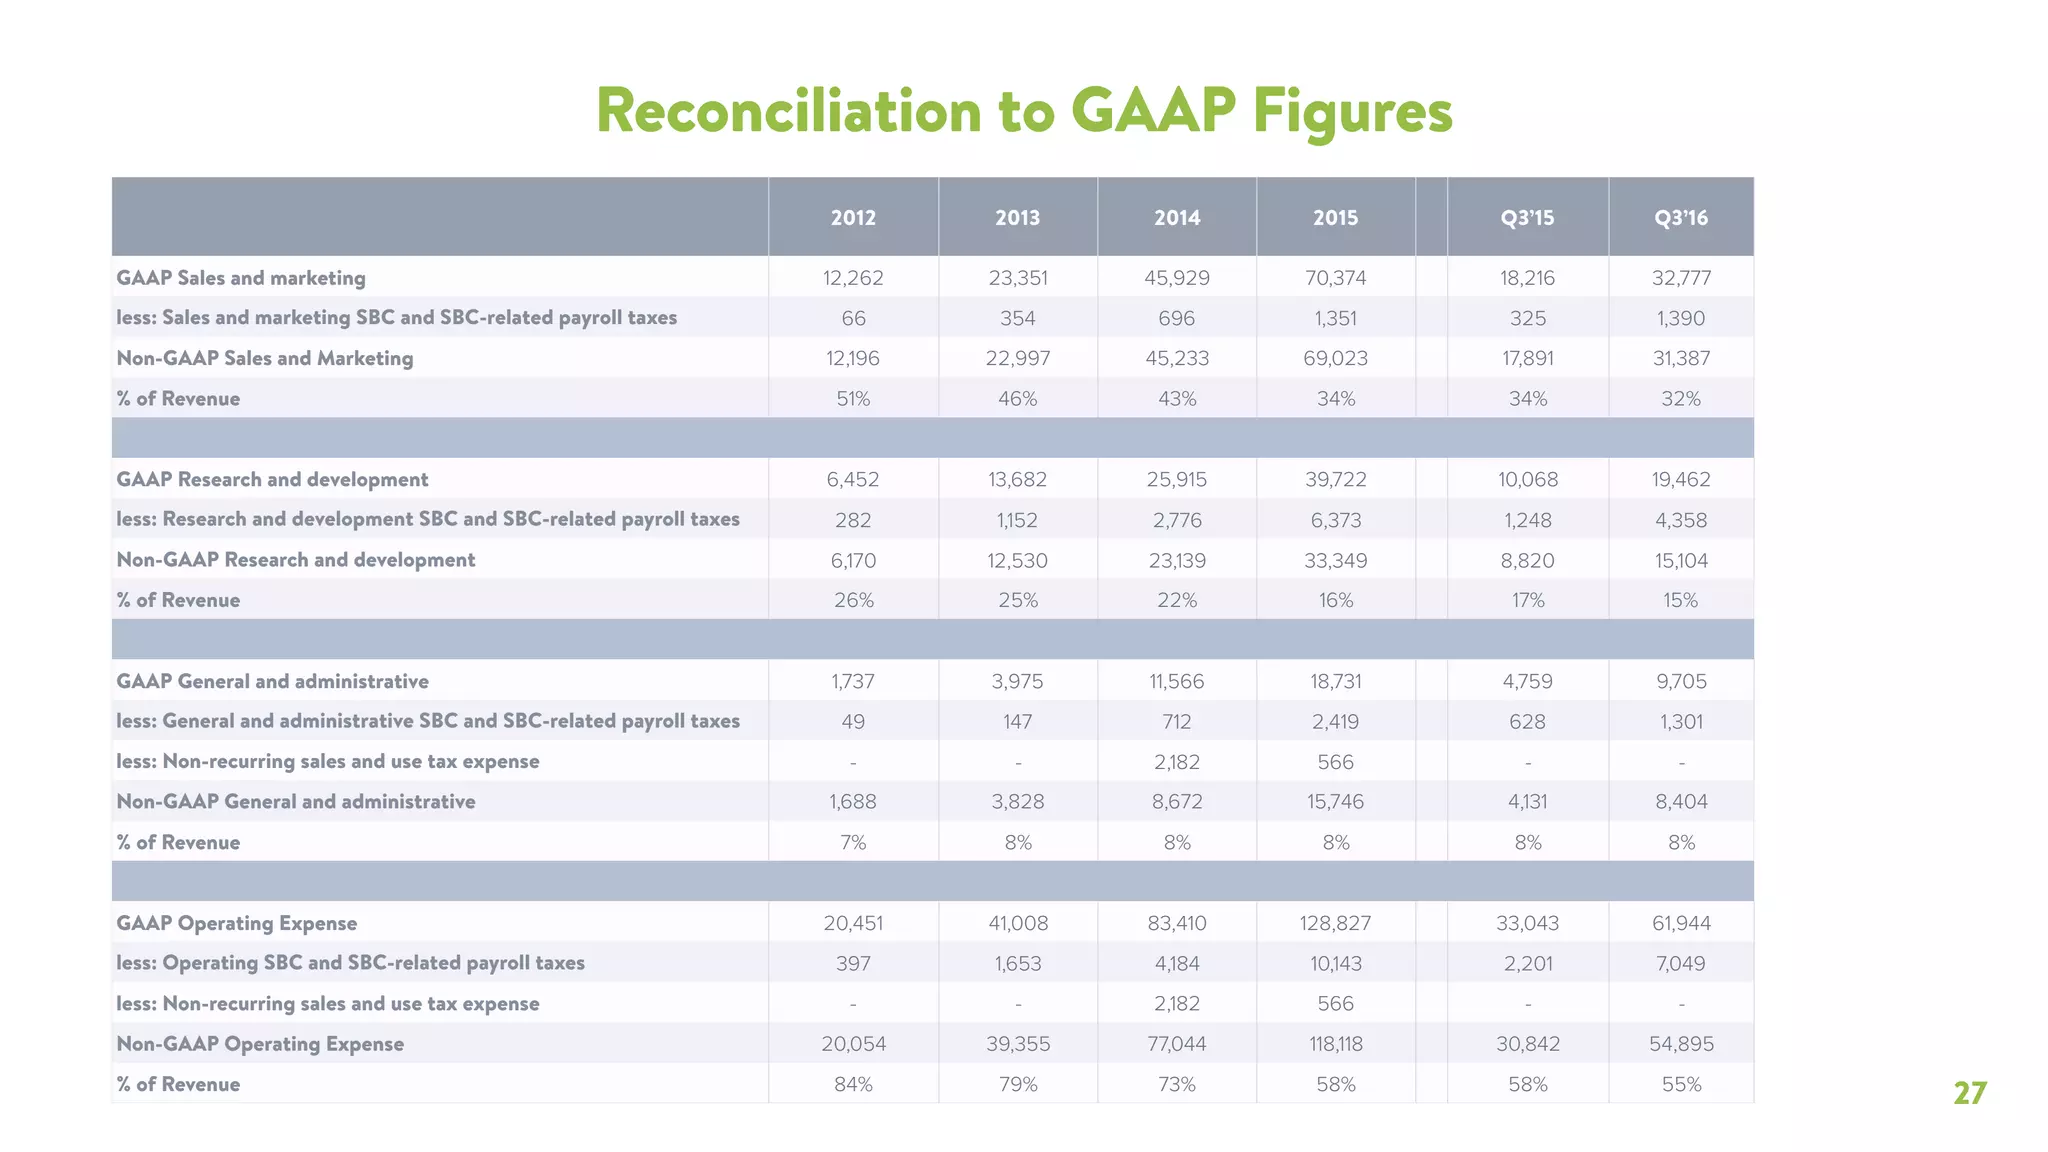
The operating leverage slide shows expense categories as a percentage of revenue over time (S&M, R&D, G&A) with a clear trend toward improved leverage. The timeline slide (Simplifying and Empowering) maps product launches, financing rounds, and strategic initiatives (payments, shipping, working capital, mobile payments) to illustrate how product investments enabled new monetization. Together these slides demonstrate disciplined reinvestment: heavy early investment to build features/partners, then improving leverage as revenue scales.

For founders, this is a reminder that investors look for both growth and capital efficiency. Presenting spend as % of revenue and showing a roadmap of product initiatives tied to future monetization helps justify current investment levels and shows a plan to drive operating improvements. Use timelines to show how past investments unlocked new revenue lines and how future investments will compound growth.

Key Takeaway: Show expense trends as a percentage of revenue and tie past/future investments to specific new revenue streams — this reassures investors that growth is being converted into durable operating leverage.
Investment Highlights & Vision

Investment Highlights & Vision

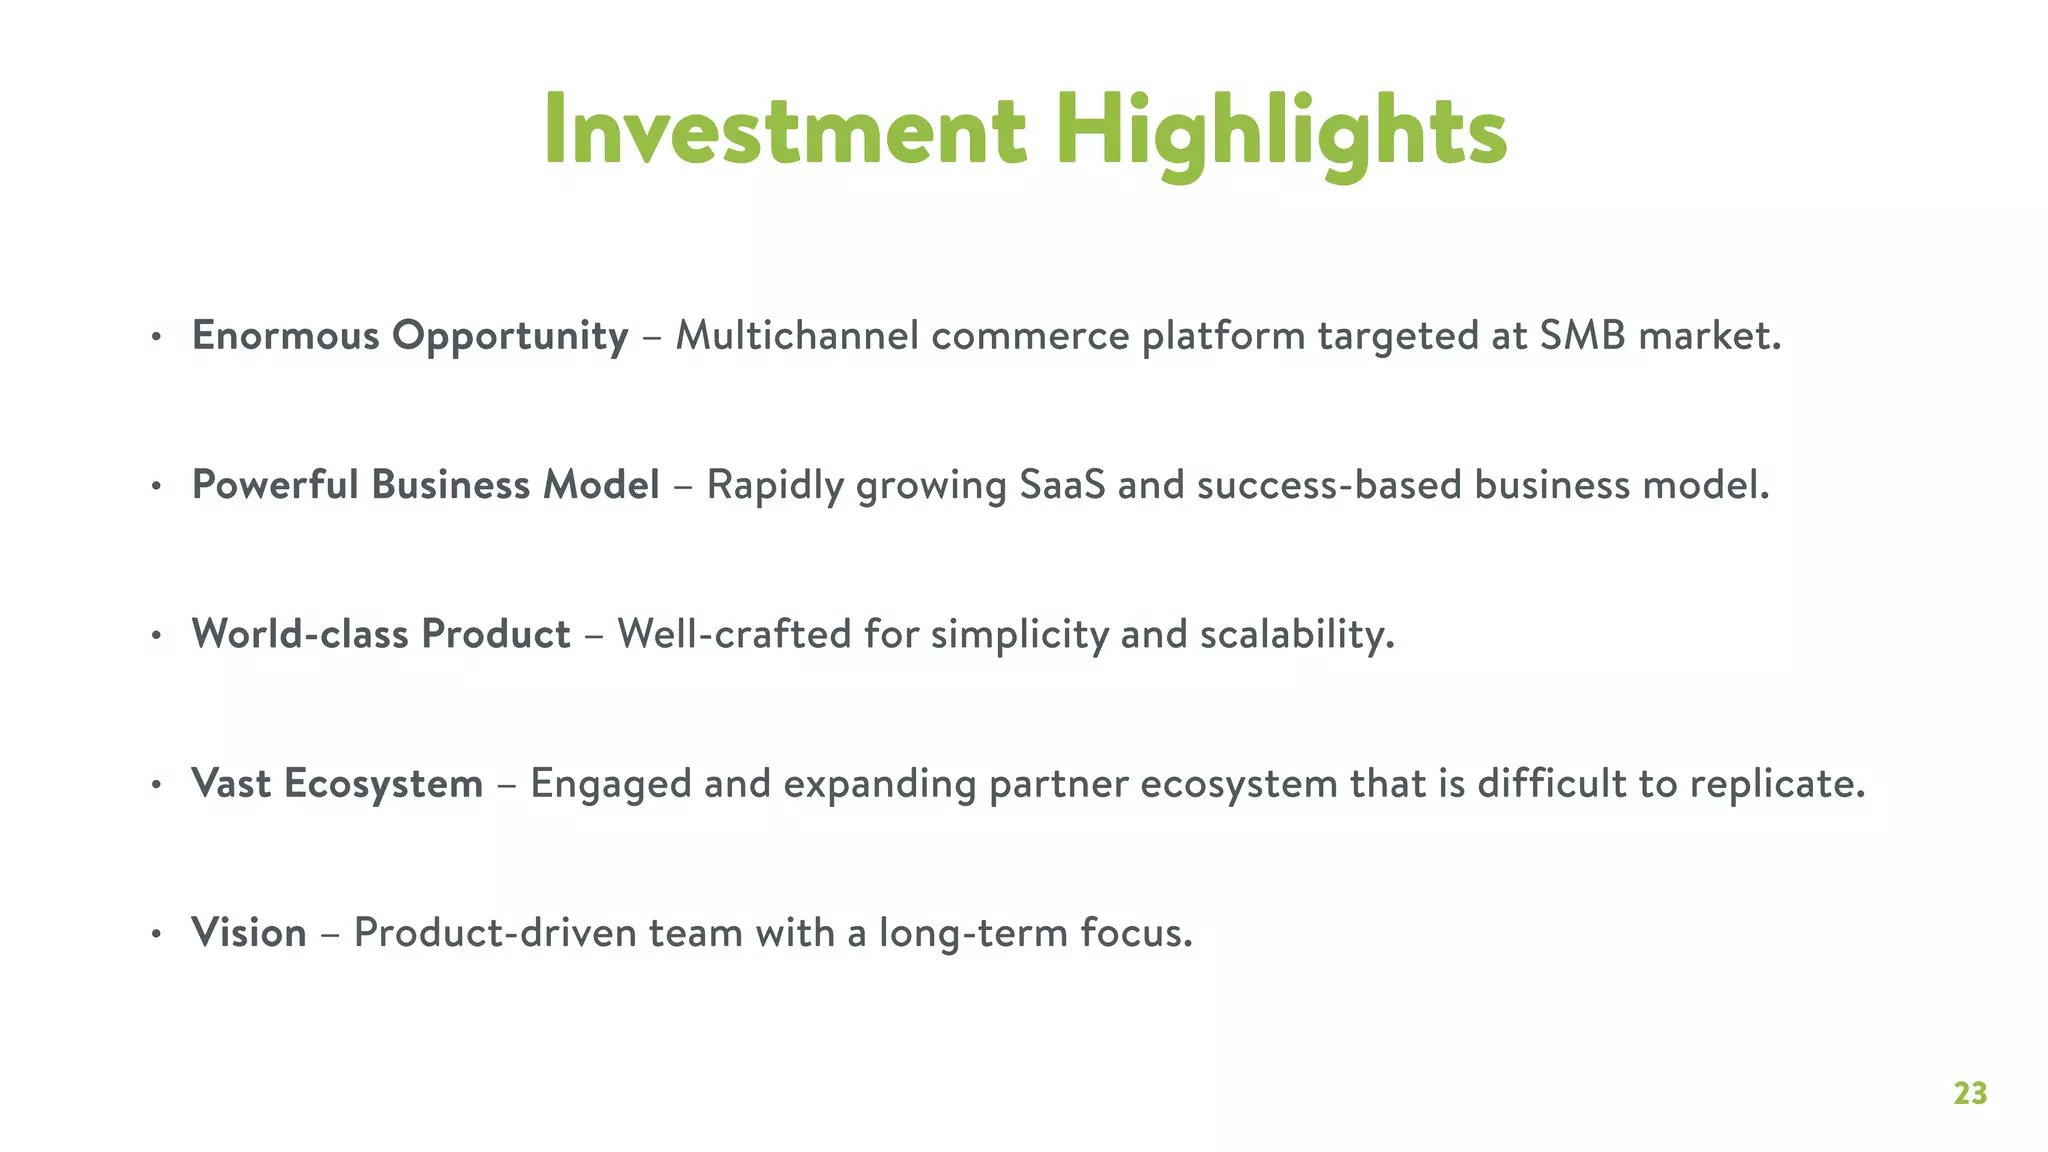
The deck closes by recapping the investment thesis: enormous opportunity, powerful SaaS + success-based model, world-class product, vast ecosystem, and long-term vision. This section crystallizes why Shopify is investible beyond the numbers — product quality, defensibility via ecosystem, and a founder/team narrative. It’s concise, investor-focused, and revisits the most important selling points to leave a strong final impression.

Founders should emulate this by ending decks with a tight bulleted summary that blends data and strategy: restate the market opportunity, defensible advantages, monetization model, and the team’s long-term orientation. A confident, succinct close reduces ambiguity and makes it easy for investors to remember the core thesis when evaluating your company.

Key Takeaway: Finish with a concise investment thesis that ties opportunity, moat, monetization, and team together — make it easy for investors to recall your core reasons to invest.

Conclusion: Key Lessons

Shopify’s investor deck is a masterclass in combining product storytelling, market sizing, partner/network effects, and clean financial evidence. Strengths include front-loading compelling traction metrics, using simple visuals and metaphors to explain a complex multi-channel product, explicitly mapping pricing to customer segments, and demonstrating both growth and improving operating leverage. The deck consistently ties strategy to measurable outcomes, which reduces investor friction.

Actionable advice for founders: open with the single most persuasive metric; humanize your product with a concrete customer example; use simple metaphors and diagrams to explain ecosystem value; present segmented revenue and growth metrics (MRR, GMV, ARPU) with clear drivers; and close with a tight investment thesis linking opportunity, moat, monetization, and team. Above all, make every slide answer the investor’s question: why now, why you, and how will this scale profitably?

Full Deck Analysis

12 sections

Overview

Company: Shopify
Stage: Investor Deck (IPO Roadshow)
Total Raised: $122.3M (cumulative through 2013)
Year: 2013 (Presentation dated November 2016)
Outcome: IPO May 2015 at $17/share; valued at $100B+ by 2021


Executive Summary

Shopify’s 2013 investor deck (updated for 2016 IPO roadshow) presents a comprehensive narrative of a platform company that has evolved from a simple e-commerce store builder into a comprehensive commerce operating system. The deck demonstrates exceptional growth (95-133% YoY revenue growth, 81% MRR CAGR), a powerful recurring revenue model approaching profitability, and a defensible ecosystem of partners and integrations. The pitch successfully positions Shopify as the “default choice” for SMB commerce, with massive TAM expansion opportunities through geographic expansion, product diversification, and omnichannel capabilities. The deck’s strength lies in its data-driven approach, clear visual storytelling, and balanced narrative between growth metrics and operating leverage—making a compelling case for why Shopify deserves a premium valuation despite not yet being profitable.


Problem Statement

The Implicit Problem (Slides 1-5):

The deck doesn’t explicitly state a problem; instead, it assumes the audience understands the pain points of merchants trying to sell online:

  1. Complexity of e-commerce setup: Building an online store required technical expertise, expensive infrastructure, and integration of multiple disparate tools
  2. Fragmentation across channels: Merchants needed separate solutions for online stores, brick-and-mortar, social commerce, and marketplaces
  3. Lack of integrated back office: Inventory, order management, and shipping were disconnected, creating operational friction
  4. Merchant education gap: Entrepreneurs lacked guidance on how to start and scale online businesses

How the deck articulates this:

  • Slide 3 (Snowdevil case study) shows a 2004 merchant using basic e-commerce—implying the problem existed for over a decade
  • Slide 4-5 (Storefronts) visualizes the fragmentation problem: merchants managing separate storefronts across channels
  • Slide 12 (Merchant education) acknowledges that merchants need support beyond just software

Notably absent: The deck doesn’t compare Shopify’s solution to competitors (BigCommerce, WooCommerce, Magento) or explain why existing solutions were inadequate. This is a weakness—sophisticated investors want to understand competitive context.


Solution

Core Positioning: “One Platform, Every Channel, Any Device”

Shopify positions itself as a comprehensive commerce operating system that solves fragmentation through:

1. Unified Platform Architecture (Slides 4-5)

  • Single dashboard managing all sales channels (online, brick-and-mortar, social, marketplace, pop-up)
  • Integrated back office handling inventory, order management, and shipping
  • Multi-device support (desktop, tablet, mobile) enabling merchants to manage stores anywhere

2. Extensible Ecosystem (Slides 10-11)

  • App Store with third-party developers building solutions
  • Expert Directory connecting merchants with agencies and consultants
  • Theme Store providing design templates
  • Strategic Partnerships with payment processors, shipping providers, and platforms (Amazon, Facebook, Pinterest)

3. Merchant Success Focus (Slide 12)

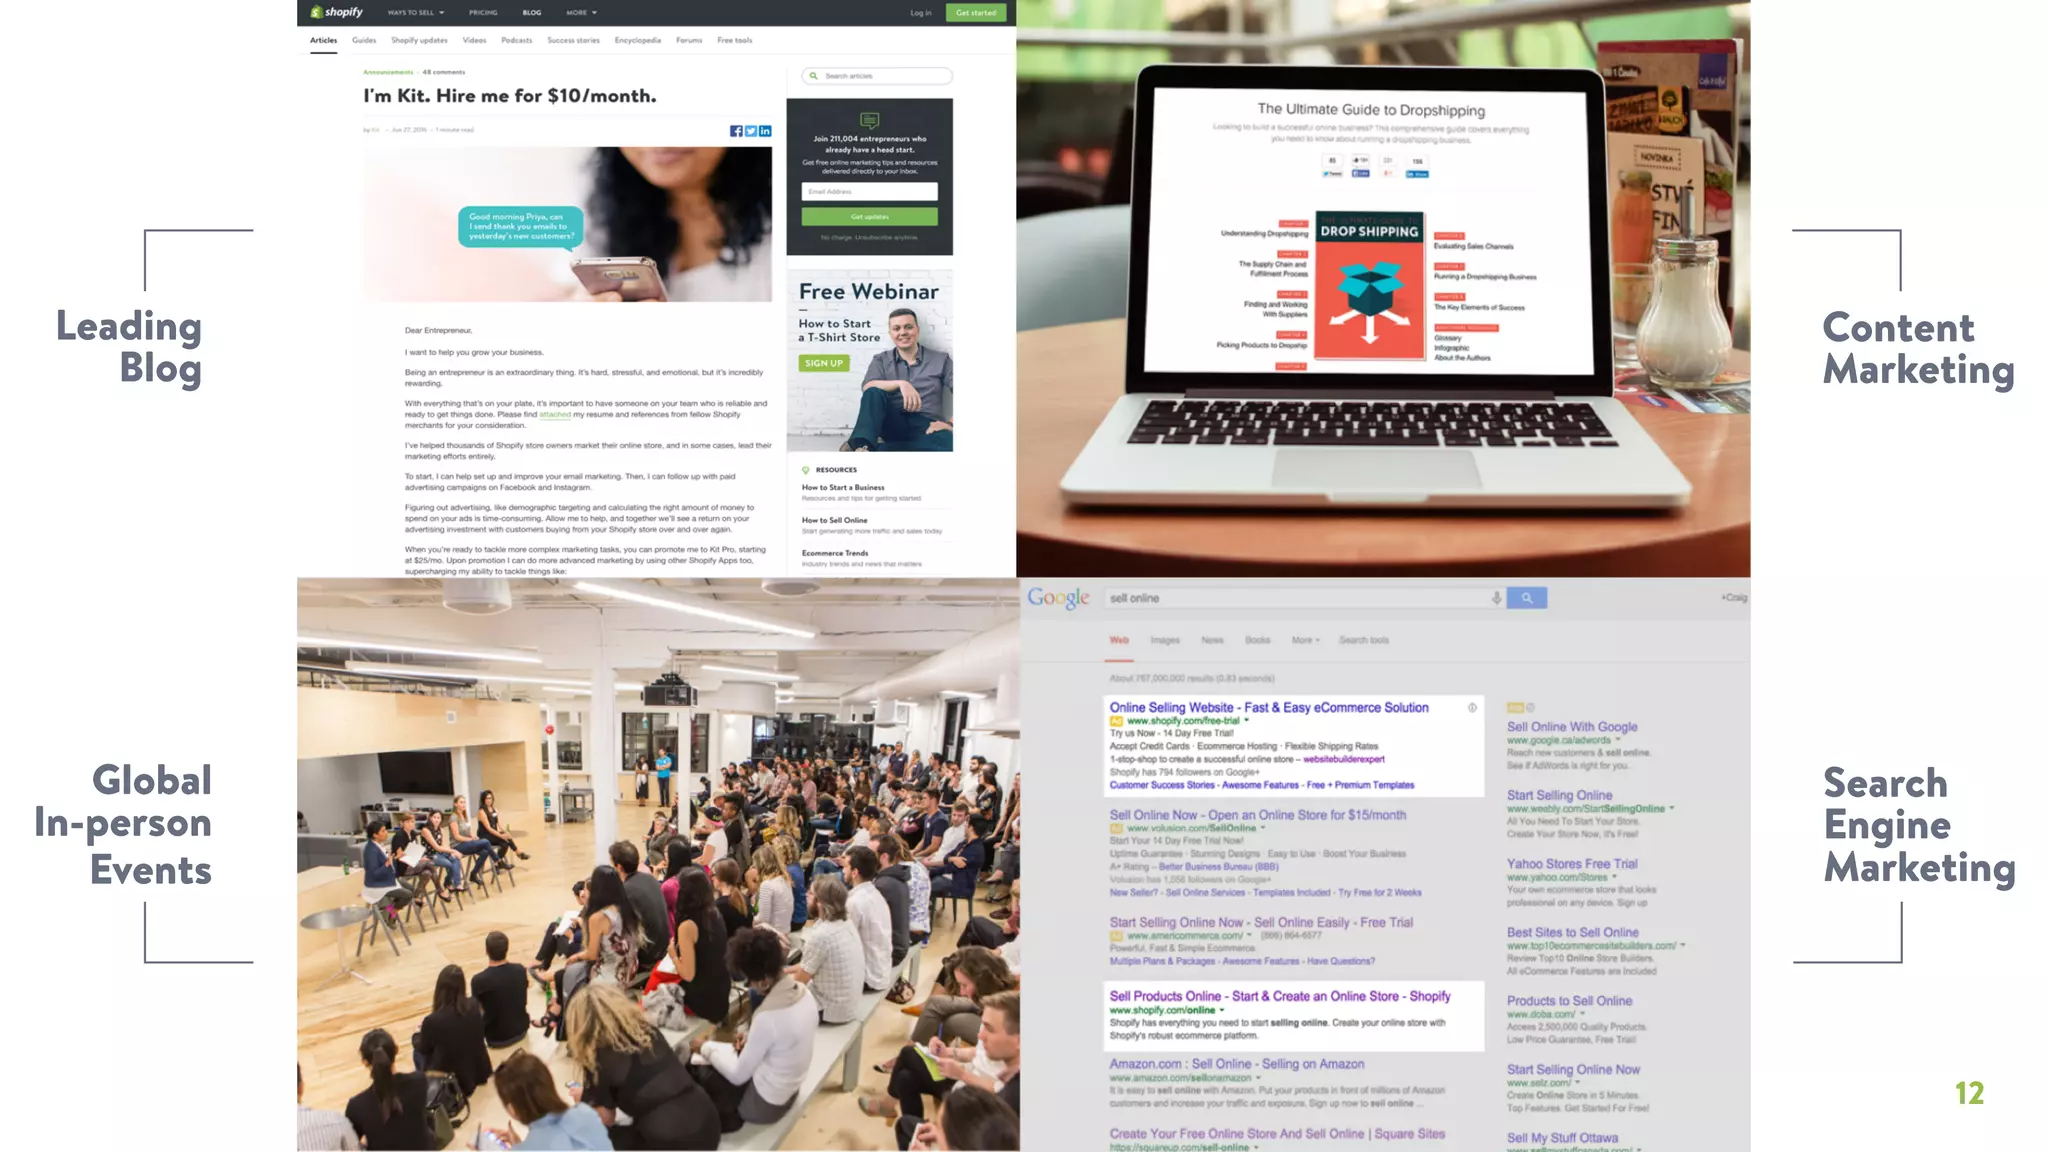
  • Leading blog with educational content
  • Free webinars on starting and scaling businesses
  • In-person events building community
  • SEM/content marketing driving awareness

4. Financial Services Integration (Slide 14)

  • Shopify Payments for payment processing
  • Shopify Capital for merchant financing
  • Conversational Commerce (Kit) for AI-powered assistance
  • Shipping integrations (Uber Rush, USPS, Canada Post)

5. Enterprise Capabilities (Slide 9)

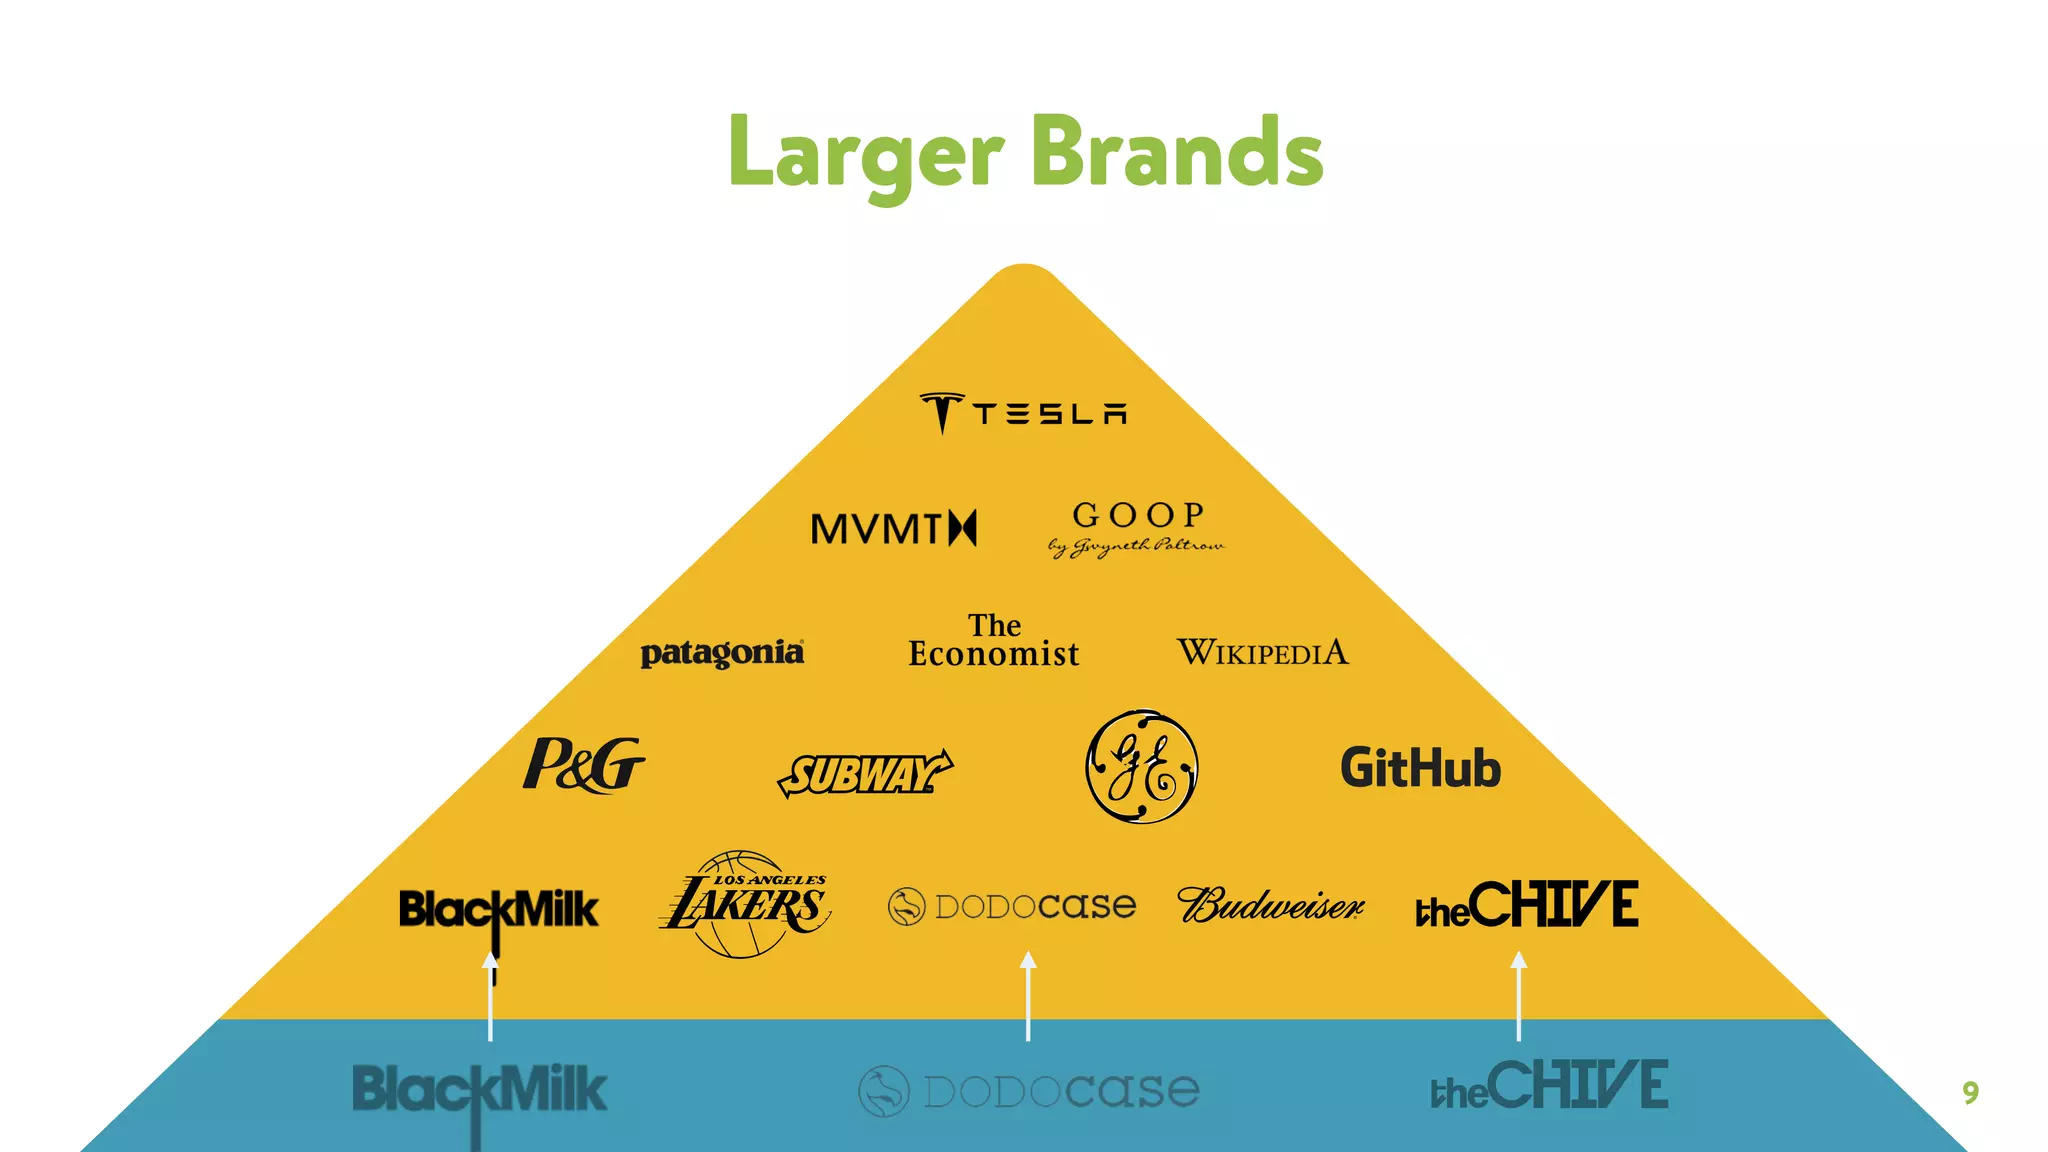
  • Shopify Plus for large brands (Tesla, P&G, GE, Patagonia)
  • POS systems for brick-and-mortar integration
  • Advanced customization for enterprise needs

Key Insight: Shopify’s solution evolved from a simple store builder (2010) to a platform company (2016), moving up the value chain from subscription fees to transaction-based revenue (payments, shipping, apps, capital).


Market Opportunity

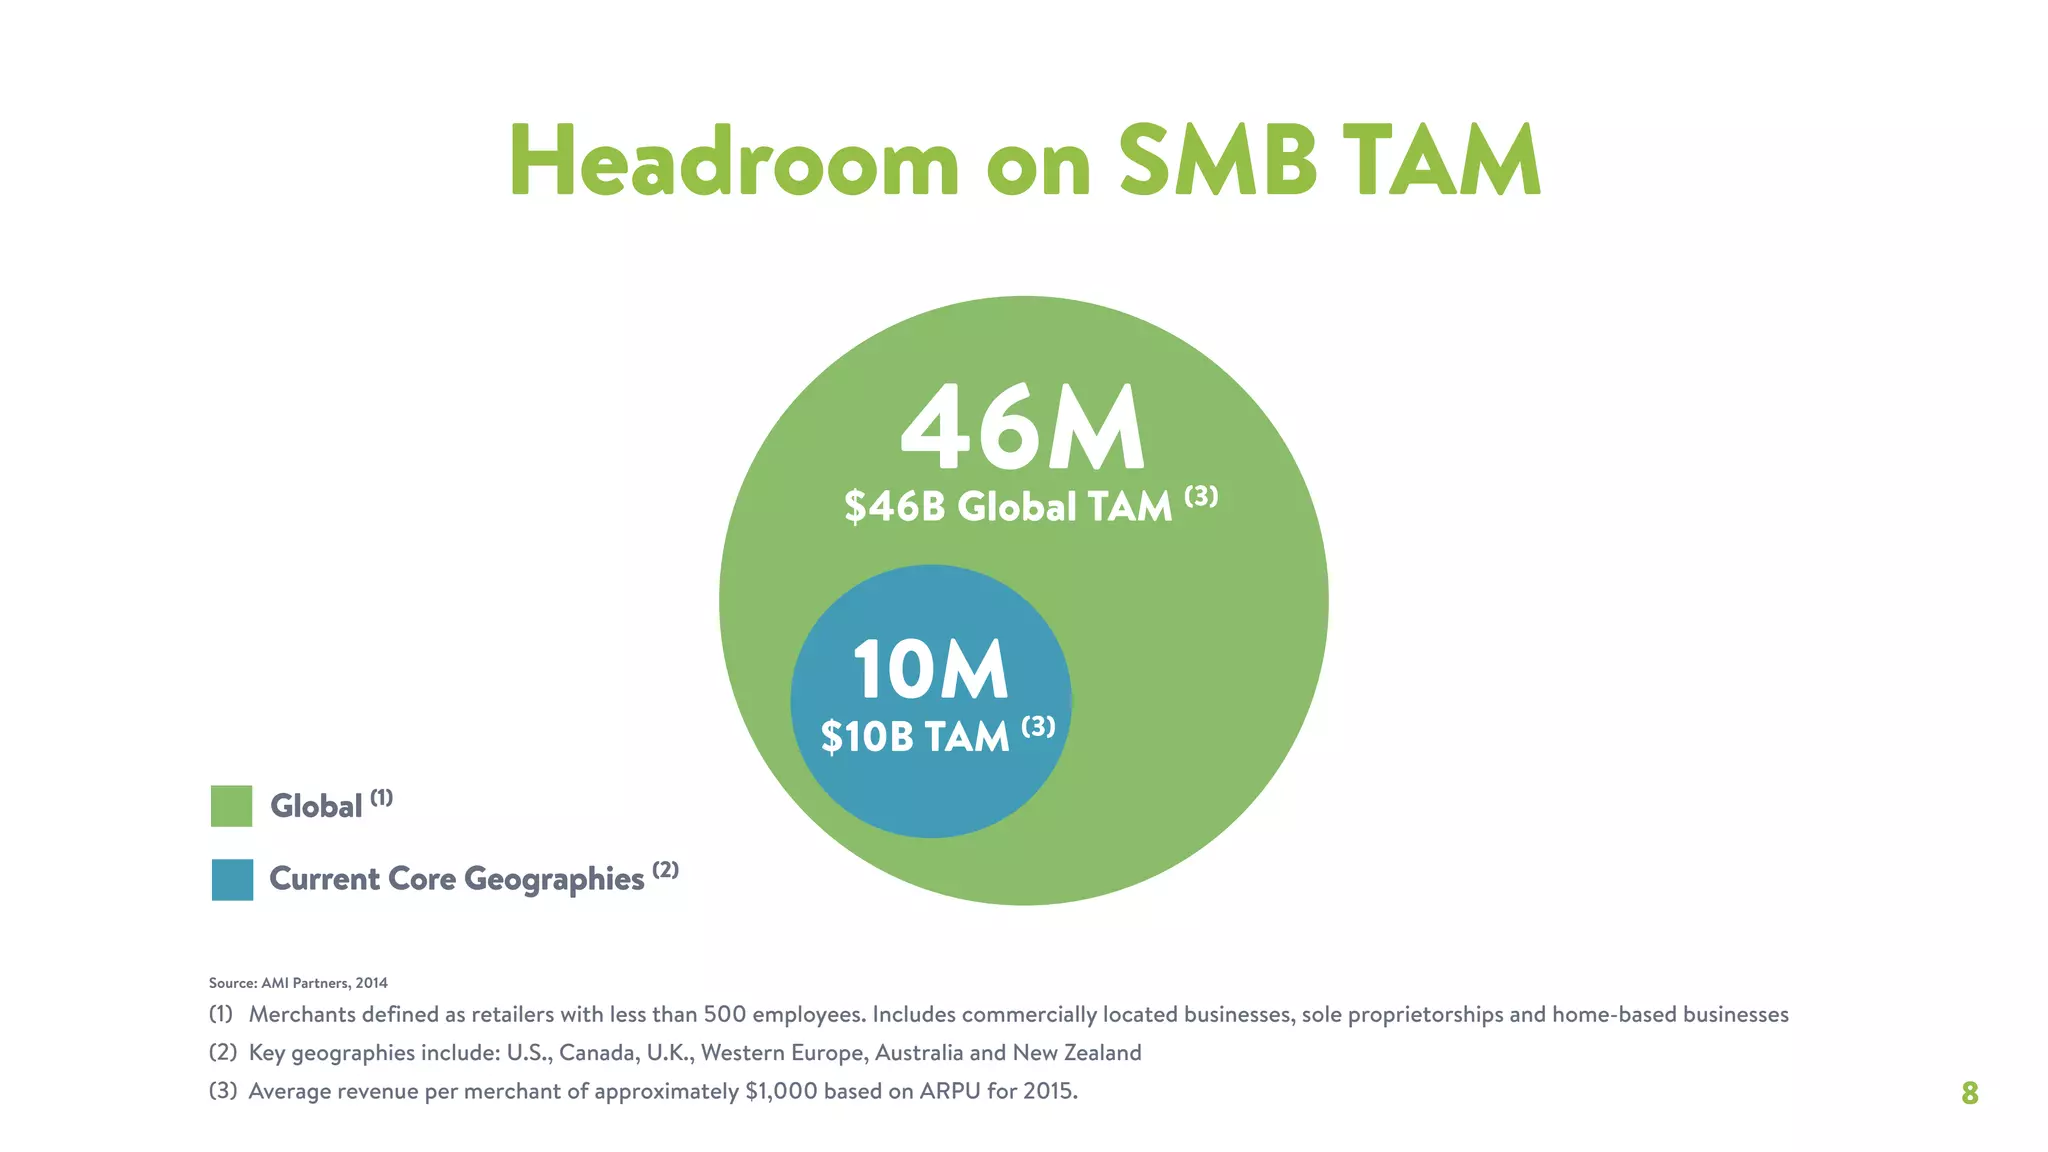
Total Addressable Market (TAM) - Slide 8

Global SMB Market:

  • 46 million merchants (defined as retailers with <500 employees, including home-based businesses)
  • $46 billion TAM (based on ~$1,000 average revenue per merchant)

Current Core Geographies:

  • 10 million merchants in key markets (US, Canada, UK, Western Europe, Australia, New Zealand)
  • $10 billion TAM in core markets

Current Penetration:

  • 325,000 merchants (Slide 1) = 0.7% of global TAM
  • 140x growth opportunity from current merchant base to global TAM

Market Dynamics

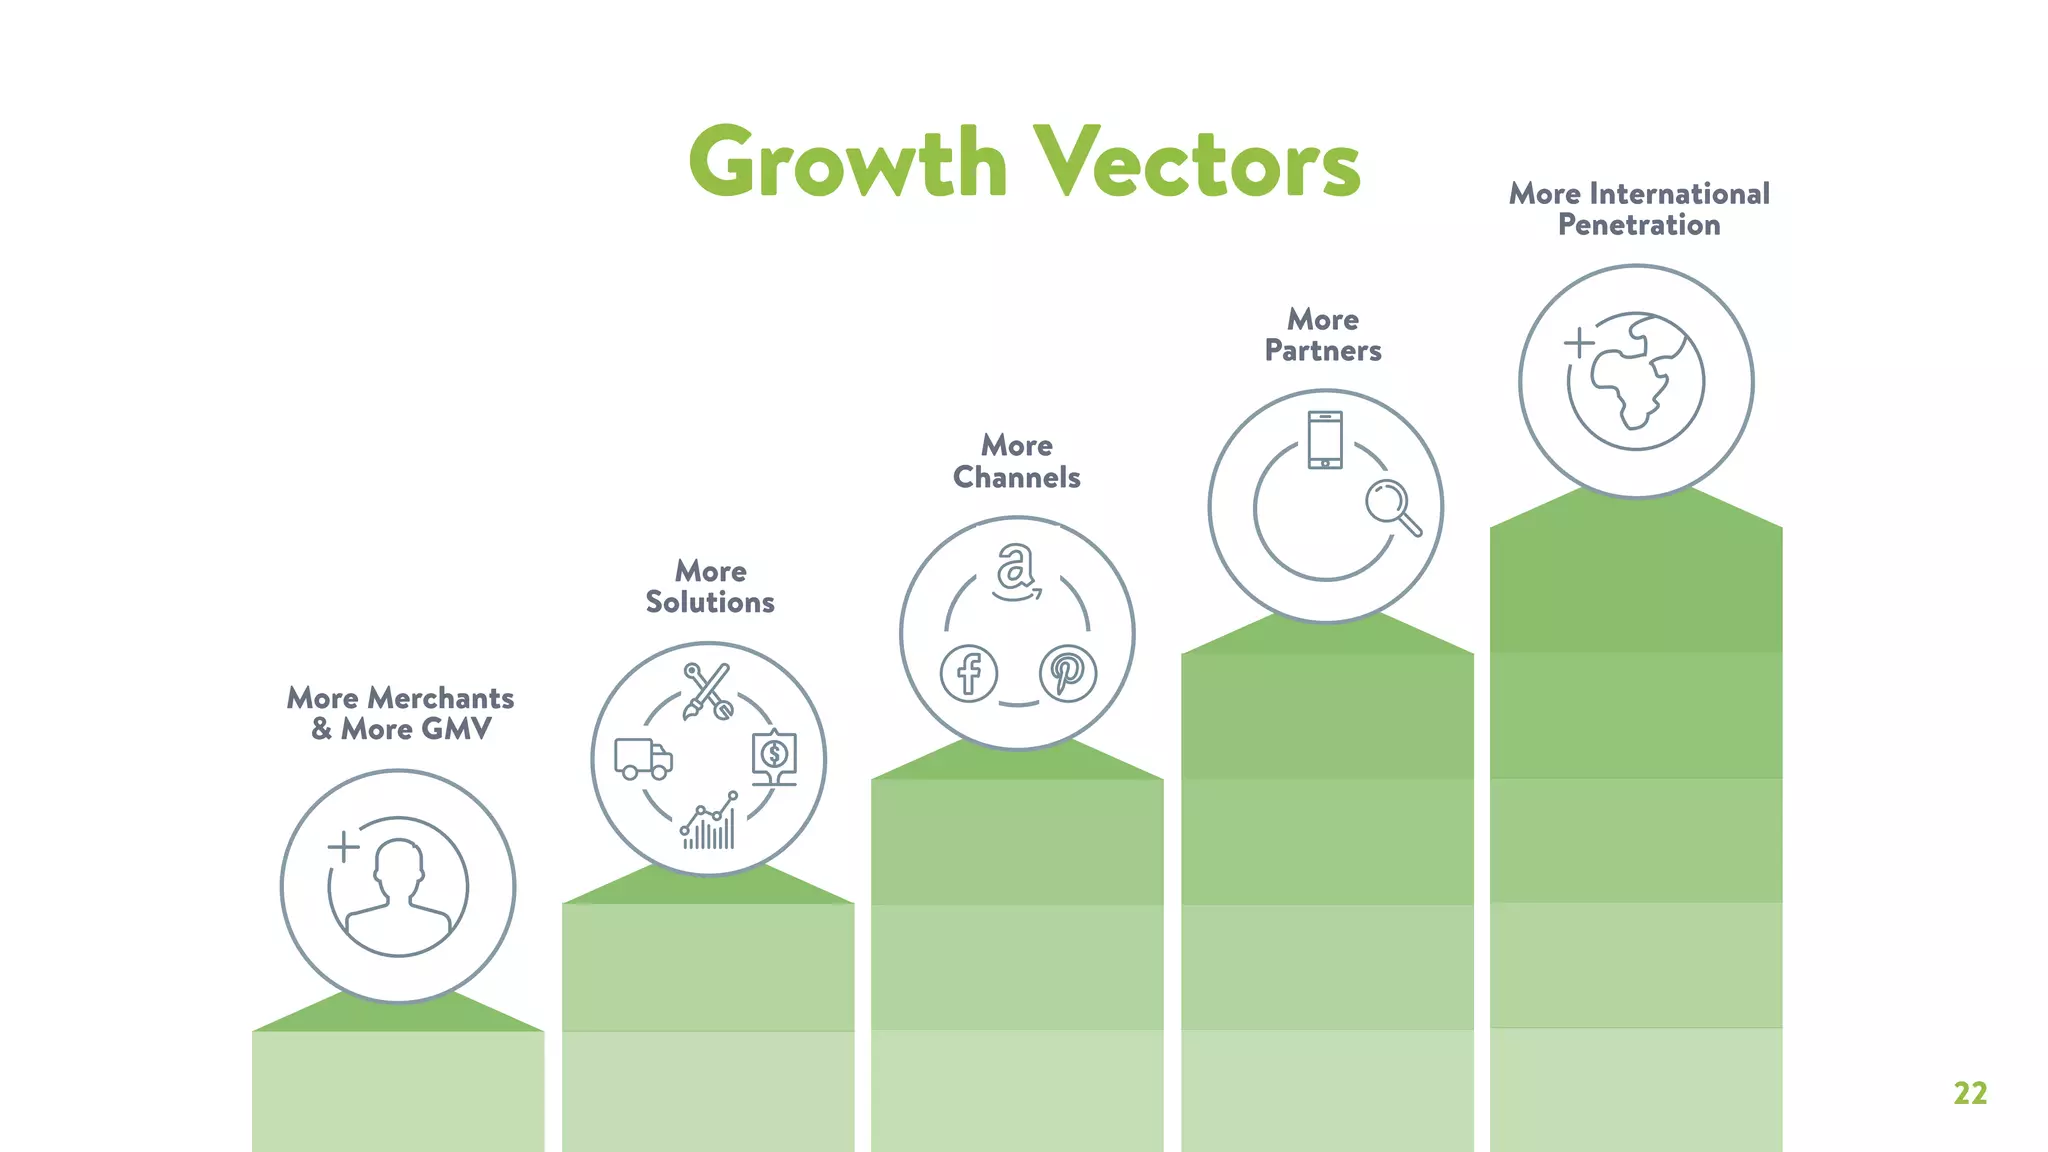
TAM Expansion Vectors (Slide 22):

  1. More Merchants & GMV - Core market growth
  2. More Solutions - Payments, shipping, capital, analytics
  3. More Channels - Omnichannel expansion
  4. More Partners - Ecosystem growth
  5. More International - Geographic expansion

Market Validation:

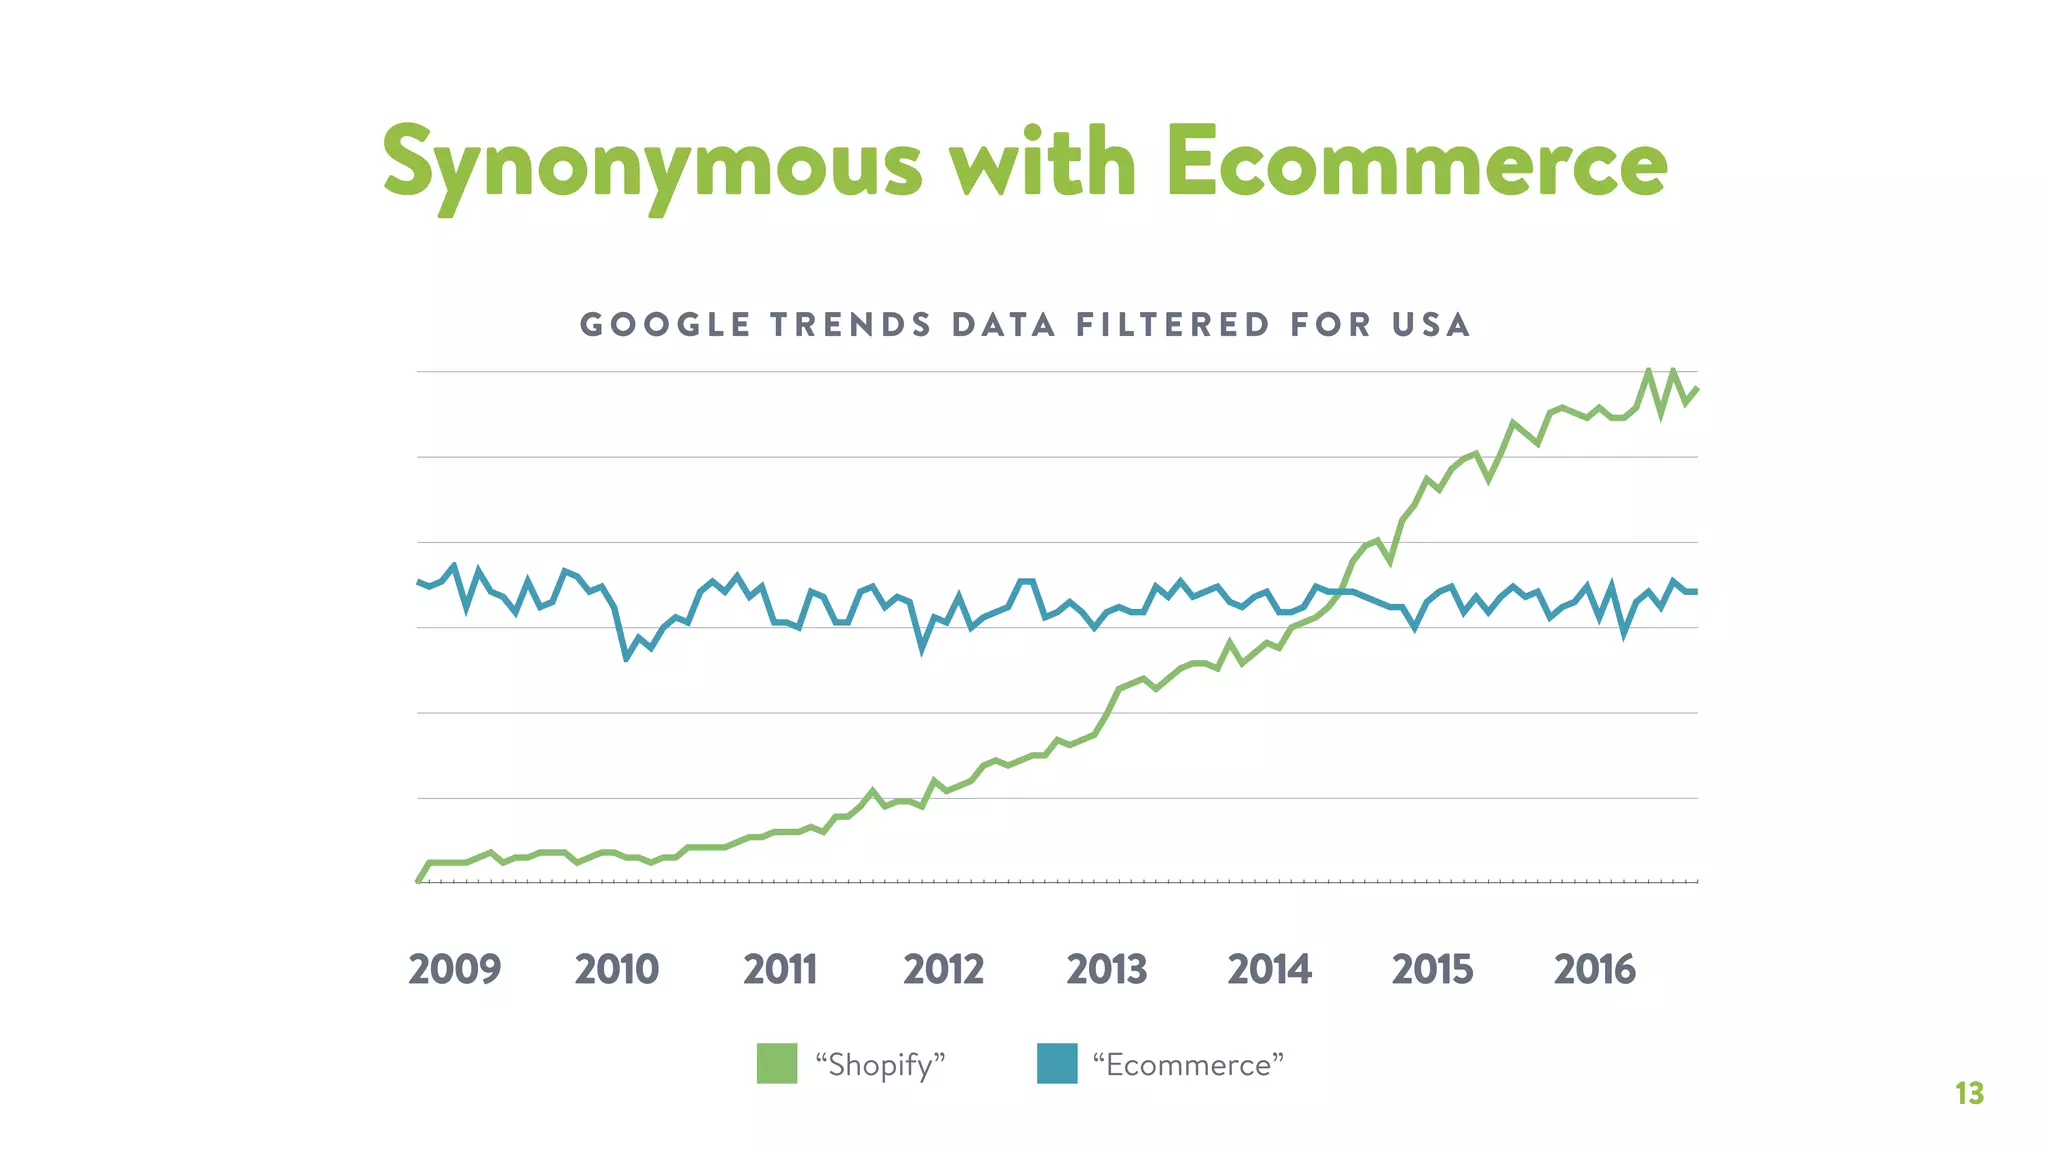
  • Google Trends (Slide 13): “Shopify” search volume growing 81% CAGR (2009-2016) while “ecommerce” searches flat
  • GMV Growth (Slide 19): $7.7B GMV in 2015 (100-133% YoY growth) shows merchants are using platform for real commerce
  • Enterprise Adoption (Slide 9): Major brands (Tesla, P&G, GE, Patagonia, Lakers) validate platform for large merchants

Market Size Benchmarks

Metric Value Implication
Global SMB TAM $46B Massive addressable market
Core Geography TAM $10B Conservative starting point
Current Penetration 0.7% Enormous headroom for growth
Implied ARPU $23.7K Healthy merchant productivity
Implied Take Rate 2.7% Conservative monetization

Business Model

Revenue Streams (Slide 17)

Dual Revenue Model:

  1. Subscription Solutions (Green - Recurring)
    • Pricing tiers (Slide 6):
      • Entrepreneurs: $29/month
      • SMB: $79/month
      • Enterprise (Shopify Plus): $299/month
    • MRR Growth: $1.1M (Q1 2012) → $16.3M (Q1 2016) = 81% CAGR
    • Predictable, recurring revenue - core SaaS metric
  2. Merchant Solutions (Teal - Transaction-Based)
    • Payments (Shopify Payments)
    • Shipping (Shopify Shipping, carrier integrations)
    • Apps (App Store revenue share)
    • Capital (Shopify Capital lending)
    • Growing faster than subscription - merchant solutions revenue accelerating

Unit Economics

Revenue Per Merchant:

  • Implied ARPU: $23.7K annually ($7.7B GMV ÷ 325K merchants)
  • Subscription ARPU: ~$50/month average = $600/year
  • Merchant solutions ARPU: ~$23.1K/year (implied from GMV take rate)
  • Total ARPU: ~$23.7K/year

Take Rate:

  • 2015: $205.2M revenue ÷ $7.7B GMV = 2.7% take rate
  • Declining over time - suggests Shopify taking lower % to gain market share or merchant solutions growing slower than subscription

Profitability Path (Slides 20-21)

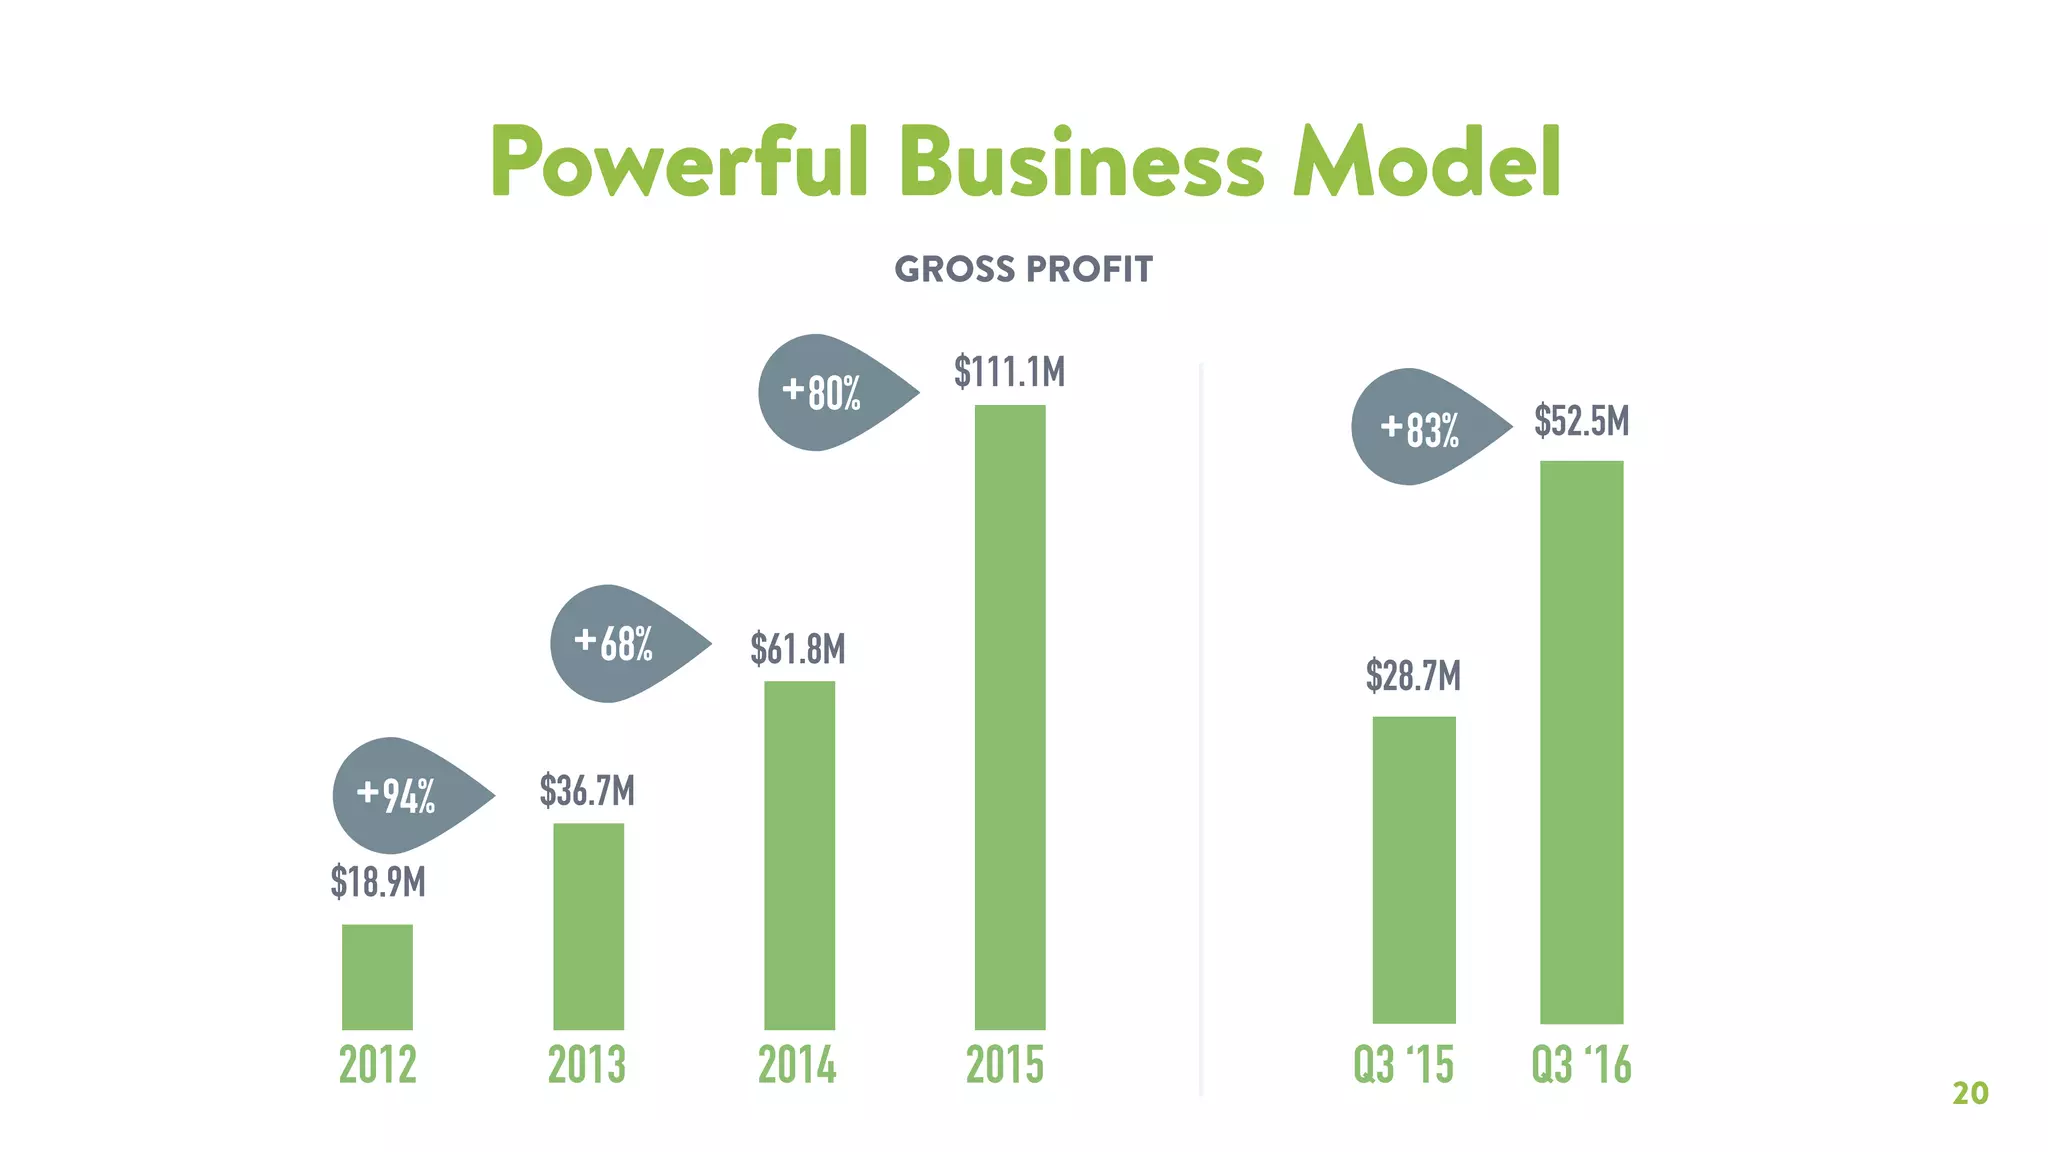
Gross Profit:

  • 2015: $111.1M = 54% gross margin
  • Trend: Declining from 80% (2012) to 54% (2015)
  • Cause: Payment processing costs increasing as transaction volume grows

Operating Leverage:

  • OpEx as % of Revenue: 84% (2012) → 58% (2015) → 55% (Q3 2016)
  • S&M efficiency: 51% → 32% of revenue (strong improvement)
  • R&D efficiency: 26% → 15% of revenue
  • G&A efficiency: 7% → 8% of revenue (stable)

Profitability Status:

  • GAAP Operating Loss: ~9% of revenue (2015)
  • Non-GAAP Operating Loss: ~4% of revenue (2015)
  • Q3 2016: Near breakeven on non-GAAP basis (55% OpEx vs. 53% gross margin)

Stock-Based Compensation Impact (Slide 27):

  • 2015: $10.1M SBC = 5% of revenue
  • Q3 2016: $7.0M SBC = 7% of revenue
  • Implication: True GAAP profitability worse than non-GAAP by 5-7 percentage points

Traction & Metrics

Growth Metrics

Metric 2012 2013 2014 2015 Q3’16 Growth Rate
Revenue $23.7M $50.3M $105.0M $205.2M $99.6M 95-112% YoY
MRR $1.1M - - - $16.3M 81% CAGR
GMV $0.7B $1.6B $3.8B $7.7B $3.8B 100-133% YoY
Merchants - - - - 325K+ -
Gross Profit $18.9M $36.7M $61.8M $111.1M $52.5M 68-94% YoY
Gross Margin 80% 73% 59% 54% 53% Declining

Key Proof Points

  1. Merchant Traction:
    • 325,000+ active merchants (Slide 1)
    • $3.8B GMV in Q3 2016 (Slide 1)
    • Enterprise customers: Tesla, P&G, GE, Patagonia, Lakers (Slide 9)
  2. Revenue Growth:
    • 4-year revenue CAGR: ~95% (2012-2015)
    • Consistent growth: 95-112% YoY (no deceleration)
    • Q3 2016 shows 89% growth (post-IPO momentum)
  3. MRR Quality:
    • 81% CAGR demonstrates recurring revenue strength
    • Quarterly growth consistent (no churn spikes)
    • $16.3M MRR annualizes to ~$195.6M (vs. $205.2M actual revenue, suggesting merchant solutions are ~$10M/quarter)
  4. Operating Leverage:
    • OpEx declining from 84% to 55% of revenue
    • S&M efficiency improving (51% → 32% of revenue)
    • Approaching profitability (55% OpEx vs. 54% gross margin)
  5. Brand Momentum:
    • Google Trends: “Shopify” searches growing 81% CAGR vs. flat “ecommerce” searches
    • Positioned as “synonymous with ecommerce” (Slide 13)
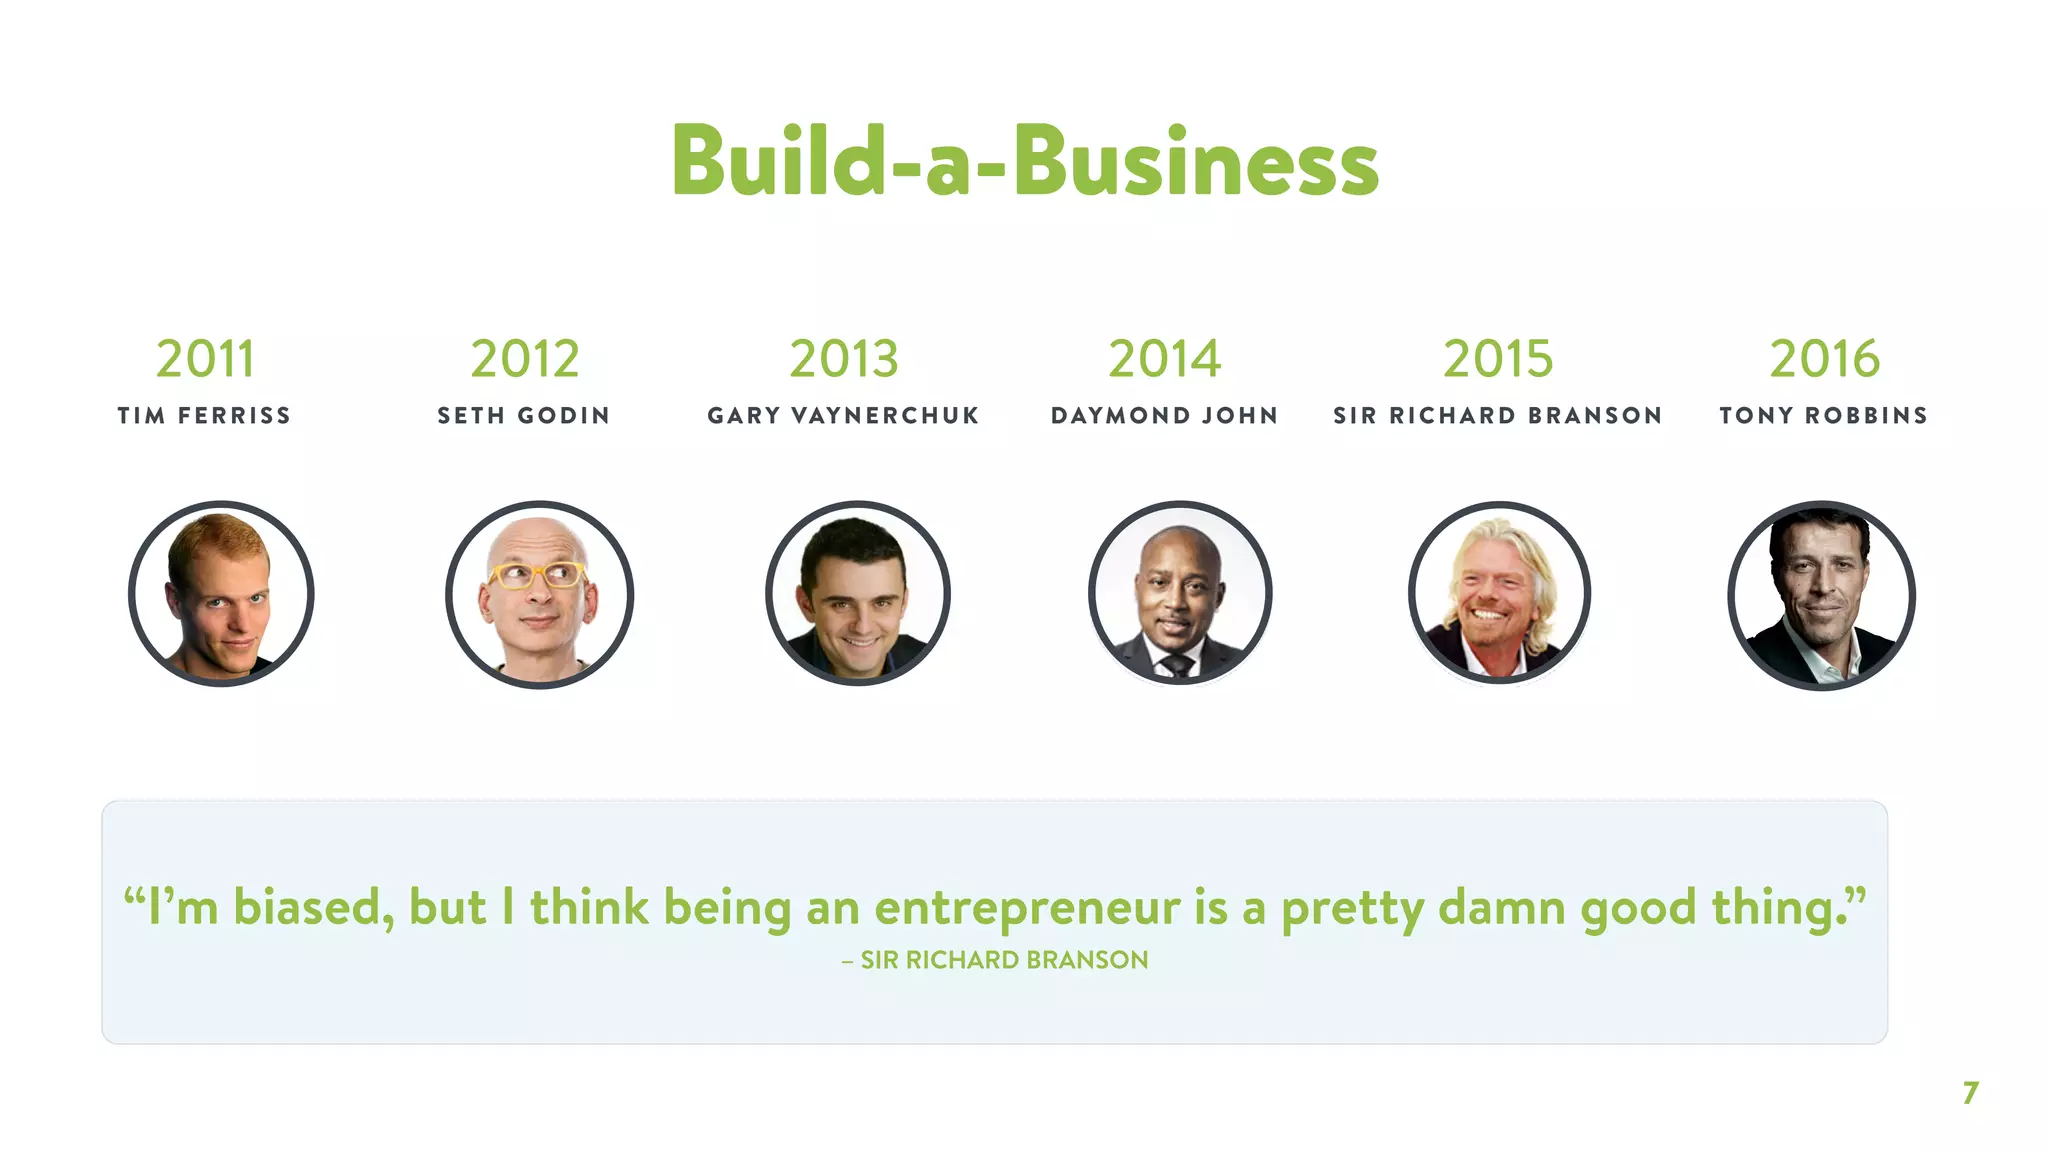
    • Advisory board: Tim Ferriss, Seth Godin, Gary Vaynerchuk, Daymond John, Richard Branson, Tony Robbins (Slide 7)

Merchant Success Indicators

  • Snowdevil case study (Slide 3): Operating since 2004, still active on Shopify
  • Omnichannel adoption (Slide 4): Merchants using multiple channels (online, brick-and-mortar, social, marketplace)
  • GMV growth outpacing merchant growth: Suggests existing merchants expanding sales (not just new signups)

Competitive Positioning

Critical Gap: The deck does not explicitly address competitors. This is a significant weakness for a 2016 IPO roadshow.

Implied Competitive Advantages (Inferred from Deck)

  1. Simplicity & Ease of Use (Slide 24)
    • “World-class Product – Well-crafted for simplicity and scalability”
    • Multi-device interface (Slide 24) suggests better UX than competitors
    • No evidence provided; claim is unsubstantiated
  2. Ecosystem Defensibility (Slide 23)
    • “Vast Ecosystem – Engaged and expanding partner ecosystem that is difficult to replicate”
    • 15+ strategic/integration/agency partners shown (Slide 11)
    • App Store, Theme Store, Expert Directory (Slide 10)
    • Weakness: Ecosystem size not quantified; unclear if “vast” vs. competitors
  3. Omnichannel Capabilities (Slides 4-5)
    • “One Platform, Every Channel, Any Device”
    • Integrations with Amazon, Facebook, Pinterest, Uber, USPS, Canada Post
    • Weakness: Competitors (BigCommerce, WooCommerce) likely have similar integrations
  4. Financial Services Integration (Slide 14)
    • Shopify Payments, Shopify Capital, conversational commerce
    • Moving up value chain beyond subscription
    • Weakness: Competitors could build similar offerings
  5. Merchant Success Focus (Slide 12)
    • Blog, webinars, events, SEM
    • “Build-a-Business” advisor program (Slide 7)
    • Strength: Differentiated go-to-market approach
  6. Brand Strength (Slide 13)
    • Google Trends showing Shopify searches growing 81% CAGR
    • Positioned as “synonymous with ecommerce”
    • Strength: Brand momentum is real competitive advantage

Missing Competitive Analysis

The deck does not address:

  • BigCommerce (direct competitor, also SaaS)
  • WooCommerce (open-source, free alternative)
  • Magento (enterprise alternative)
  • Amazon (marketplace alternative)
  • eBay (marketplace alternative)
  • Custom solutions (large merchants building proprietary systems)

Investor Implication: Sophisticated investors will ask: “Why should merchants choose Shopify over WooCommerce (free) or BigCommerce (similar features)?” The deck doesn’t answer this question directly.


Team

Critical Gap: The deck does not include management team bios or credentials. This is a major omission for an investor pitch.

Implied Team Strength

  1. Founder Credibility (Inferred)
    • Shopify founded in 2006 (10 years of operating history by 2016)
    • Successfully raised $122.3M+ through Series A, B, C, and IPO
    • Suggests experienced founders and investors
  2. Advisory Board (Slide 7)
    • Tim Ferriss (2011) - Author, entrepreneur, investor
    • Seth Godin (2012) - Marketing thought leader
    • Gary Vaynerchuk (2013) - Entrepreneur, media personality
    • Daymond John (2014) - Shark Tank investor, FUBU founder
    • Sir Richard Branson (2015) - Virgin Group founder
    • Tony Robbins (2016) - Life coach, entrepreneur
    • Implication: Strong advisory board suggests credible founders and vision
  3. Product-Driven Culture (Slide 23)
    • “Vision – Product-driven team with a long-term focus”
    • Slide 14 shows consistent product evolution (2010-2016)
    • Implication: Team prioritizes product quality over short-term metrics

Missing Information

  • CEO/founder names and bios
  • Executive team composition
  • Board of directors
  • Key hires and organizational structure
  • Employee count (implied: 100s based on office photos, but not stated)

Investor Red Flag: Sophisticated investors will want to know:

  • Who is the CEO? (Tobi Lütke, but not mentioned in deck)
  • What’s the management team’s track record?
  • Is there succession planning?
  • What’s the organizational structure?

Go-to-Market Strategy

Merchant Acquisition Channels (Slide 12)

  1. Content Marketing (Leading Blog)
    • Educational content: “I’m Kit. Hire me for $10/month”
    • Targets entrepreneurs searching for e-commerce solutions
    • Builds brand authority and SEO
  2. Webinars & Education
    • Free webinars: “How to Start a T-Shirt Business”
    • Guides: Dropshipping, Starting a Business, Selling Online
    • Lead generation for sales funnel
  3. In-Person Events
    • Global conferences and meetups
    • Community building and network effects
    • High-touch engagement with merchants
  4. Search Engine Marketing (SEM)
    • Google Ads targeting keywords: “sell online,” “ecommerce,” “start selling online”
    • Paid acquisition to drive merchant signups
    • Complements organic content strategy

Partner Ecosystem (Slides 10-11)

  1. App Developers
    • Build apps on Shopify platform
    • Distribute through App Store
    • Revenue share model incentivizes development
  2. Agencies
    • Design and development services
    • Listed in Shopify Experts directory
    • Drive merchant adoption and customization
  3. Theme Designers
    • Create templates in Theme Store
    • Revenue share model
    • Lower barrier to entry for merchants
  4. Strategic Partners
    • Amazon, Google, Facebook, Uber, Postmates
    • Payment processors, shipping providers
    • Integrations expand platform capabilities

Pricing Strategy (Slide 6)

  • Freemium approach: $29/month entry point is low friction
  • Tiered pricing: $29 (Entrepreneurs) → $79 (SMB) → $299 (Enterprise)
  • Upsell path: Merchants start small, expand to higher tiers
  • Transaction-based revenue: Shopify Payments, shipping, apps create additional monetization

Geographic Expansion

  • Current focus: US, Canada, UK, Western Europe, Australia, New Zealand
  • Future expansion: International markets (Asia, Latin America, emerging markets)
  • Localization: Payment methods, regulations, language support required

The Ask

Critical Gap: The deck does not explicitly state the investment ask or use of proceeds. This is unusual for an investor pitch.

Inferred Ask (Based on Context)

Given that this is a 2016 IPO roadshow (not a traditional fundraising pitch), the “ask” is implicit:

IPO Roadshow Context:

  • Shopify went public May 2015 at $17/share
  • This deck is dated November 2016 (post-IPO)
  • Likely used for investor relations or secondary offering roadshow

Implied Use of Proceeds (From Slide 21)

2016 Investment Priorities:

  1. Infrastructure supporting merchant growth
    • Data centers, CDN, payment processing infrastructure
    • Support for scaling to millions of merchants
  2. Enhanced merchant and partner engagement
    • Expanded education programs (blog, webinars, events)
    • Partner support and enablement
    • Community building
  3. Expansion of Shopify Plus
    • Enterprise product development
    • Sales and support for large merchants
    • Competitive response to BigCommerce enterprise offerings

Historical Funding (Slide 14)

  • Series A (2010): $122.3M total (implied)
  • Series B (2011): Unnamed amount
  • Series C (2013): Unnamed amount
  • IPO (2015): $131M raised at $17/share

Key Takeaways

What Shopify Did Right

  1. Data-driven narrative: Every claim backed by specific numbers (revenue, growth rates, merchant count)
  2. Visual storytelling: Mix of charts, photography, and illustrations makes complex ideas accessible
  3. Multiple growth vectors: Shows multiple paths to expansion (merchants, solutions, channels, partners, geography)
  4. Operating leverage: Demonstrates path to profitability through OpEx discipline
  5. Ecosystem focus: Recognizes that platform companies need partners to scale
  6. Merchant success: Invests in customer education and support, not just product
  7. Long-term vision: Shows 6-year product evolution (Slide 14) demonstrating strategic thinking

What Shopify Could Improve

  1. Competitive analysis: No mention of BigCommerce, WooCommerce, or other competitors
  2. Management team: Missing founder/CEO bios and executive team credentials
  3. Unit economics: No CAC, LTV, or payback period metrics
  4. Risk factors: No discussion of competitive threats, execution risks, or market risks
  5. Use of proceeds: Doesn’t explicitly state what capital will be used for
  6. Profitability timeline: Doesn’t project when company will be profitable
  7. Merchant concentration: No data on revenue concentration or churn risk

Lessons for Your Pitch Deck

  1. Lead with traction: Start with impressive metrics (growth, users, revenue) to establish credibility
  2. Show operating leverage: Demonstrate path to profitability through improving unit economics
  3. Quantify everything: Avoid vague claims; back up assertions with specific numbers
  4. Tell a story: Don’t just present data; connect it to a coherent narrative
  5. Address competition: Acknowledge competitors and explain why customers choose you
  6. Show team credibility: Include founder/CEO bios and executive team credentials
  7. Prepare appendix: Have detailed financials, risk factors, and FAQ ready for investor questions
  8. Design matters: Invest in professional design; consistent visual language builds credibility
  9. Know your numbers: Be prepared to explain every metric and defend assumptions
  10. Practice your pitch: Rehearse the narrative; be ready for tough questions on profitability, competition, and execution

Investor Deep Dive

Executive summary, strengths & red flags

Executive Summary

Shopify's 2013 investor deck (updated for 2016 IPO roadshow) presents a comprehensive narrative of a platform company that has evolved from a simple e-commerce store builder into a comprehensive commerce operating system. The deck demonstrates exceptional growth (95-133% YoY revenue growth, 81% MRR CAGR), a powerful recurring revenue model approaching profitability, and a defensible ecosystem of partners and integrations. The pitch successfully positions Shopify as the "default choice" for SMB commerce, with massive TAM expansion opportunities through geographic expansion, product diversification, and omnichannel capabilities. The deck's strength lies in its data-driven approach, clear visual storytelling, and balanced narrative between growth metrics and operating leverage—making a compelling case for why Shopify deserves a premium valuation despite not yet being profitable.

More Pitch Decks To Study

Compare structure, fundraising context, and investor-facing story across similar startup decks.