Compare your deck to Postmates

Compare Your Deck

Postmates Pitch Deck (2011)

Logistics
Stage: Series A
Raised: $750K
Year: 2011
Slides: 13
Outcome: Acquired by Uber for $2.65B (2020)

Pitch Deck

1 / 13
Postmates pitch deck - The Opening: Clear brand and mission
Click to expand

Deck Analysis

This 2011 Series A pitch deck from Postmates presents a concise, founder-led story for a local on-demand courier marketplace. It combines bold branding, a clear pain demonstration, unit economics comparisons, market sizing and early traction to argue the case for building a real-time logistics platform. The deck is notable for how it balances evocative imagery with concrete numbers and defensible go-to-market steps — a format that helped the company secure seed funding and ultimately scale to a major exit.

The Opening: Clear brand and mission

The Opening: Clear brand and mission

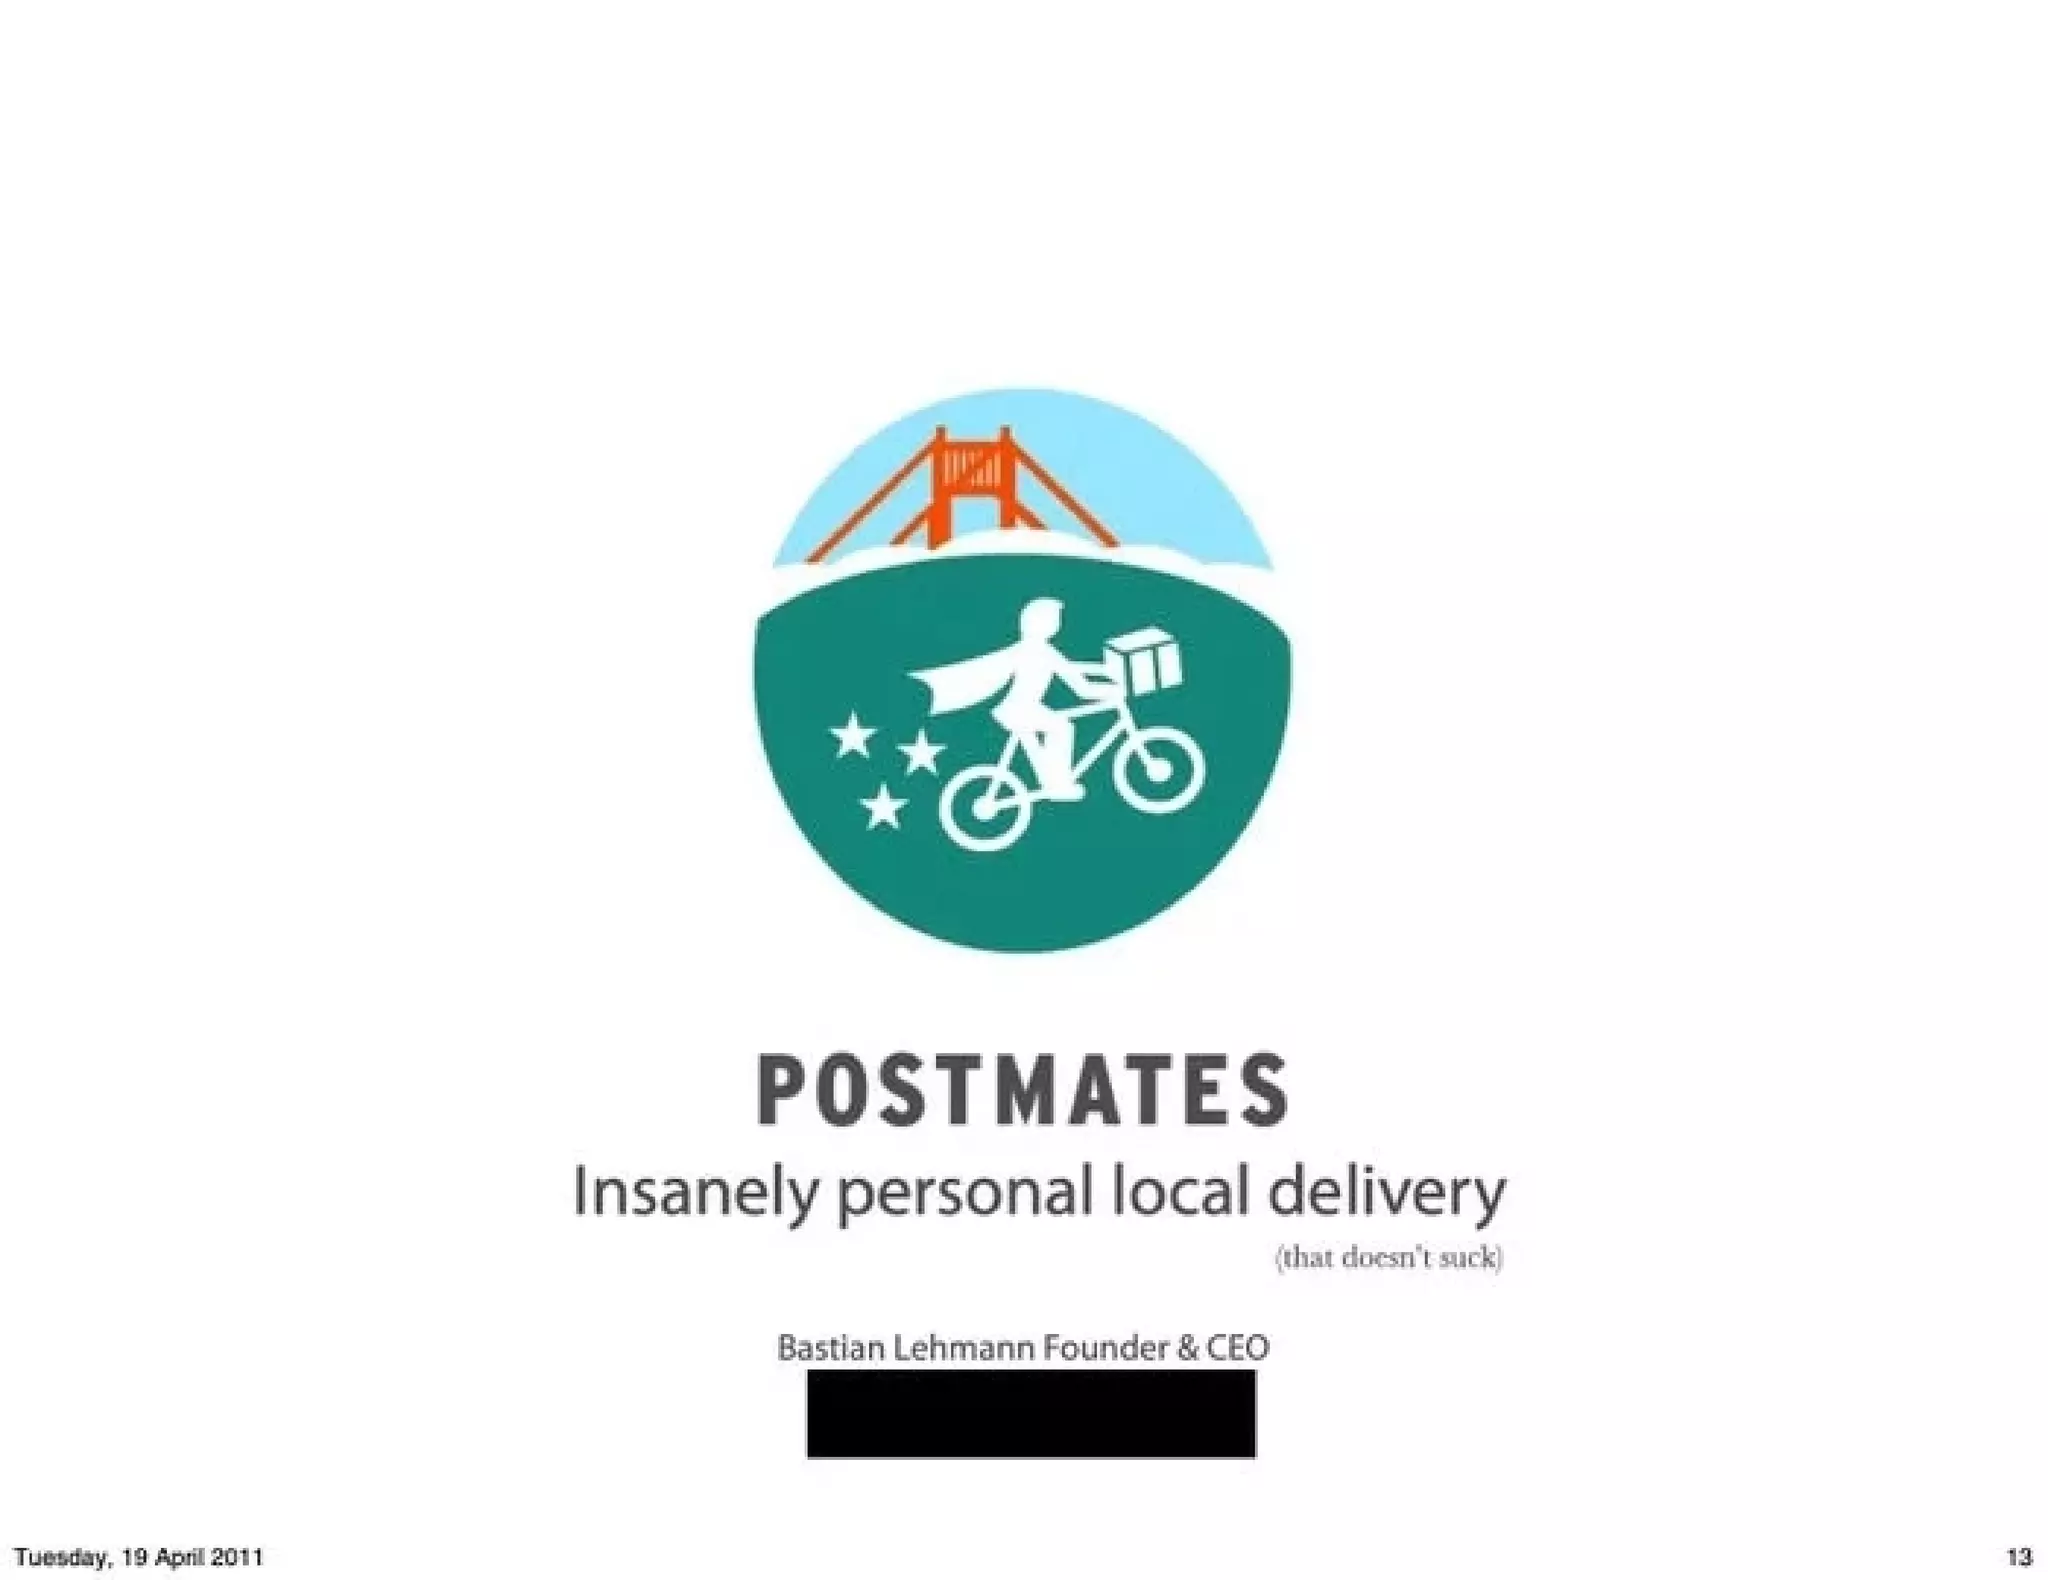
The cover (slide 1) uses a distinctive logo and the tagline 'Insanely personal local delivery (that doesn't suck)' to position Postmates as both modern and customer-focused. The visual is clean and memorable, and the tagline communicates the core promise — local delivery that's personalized and better than the status quo.

This slide is effective because it instantly sets tone without overwhelming detail. Founders can learn to lead with a tight brand promise that encapsulates product differentiation and emotional appeal, then use subsequent slides to fill in the specifics.

Key Takeaway: Open with a strong, memorable brand promise that frames the rest of your deck and signals the problem you're solving.
Team & credibility: short, relevant bios

Team & credibility: short, relevant bios

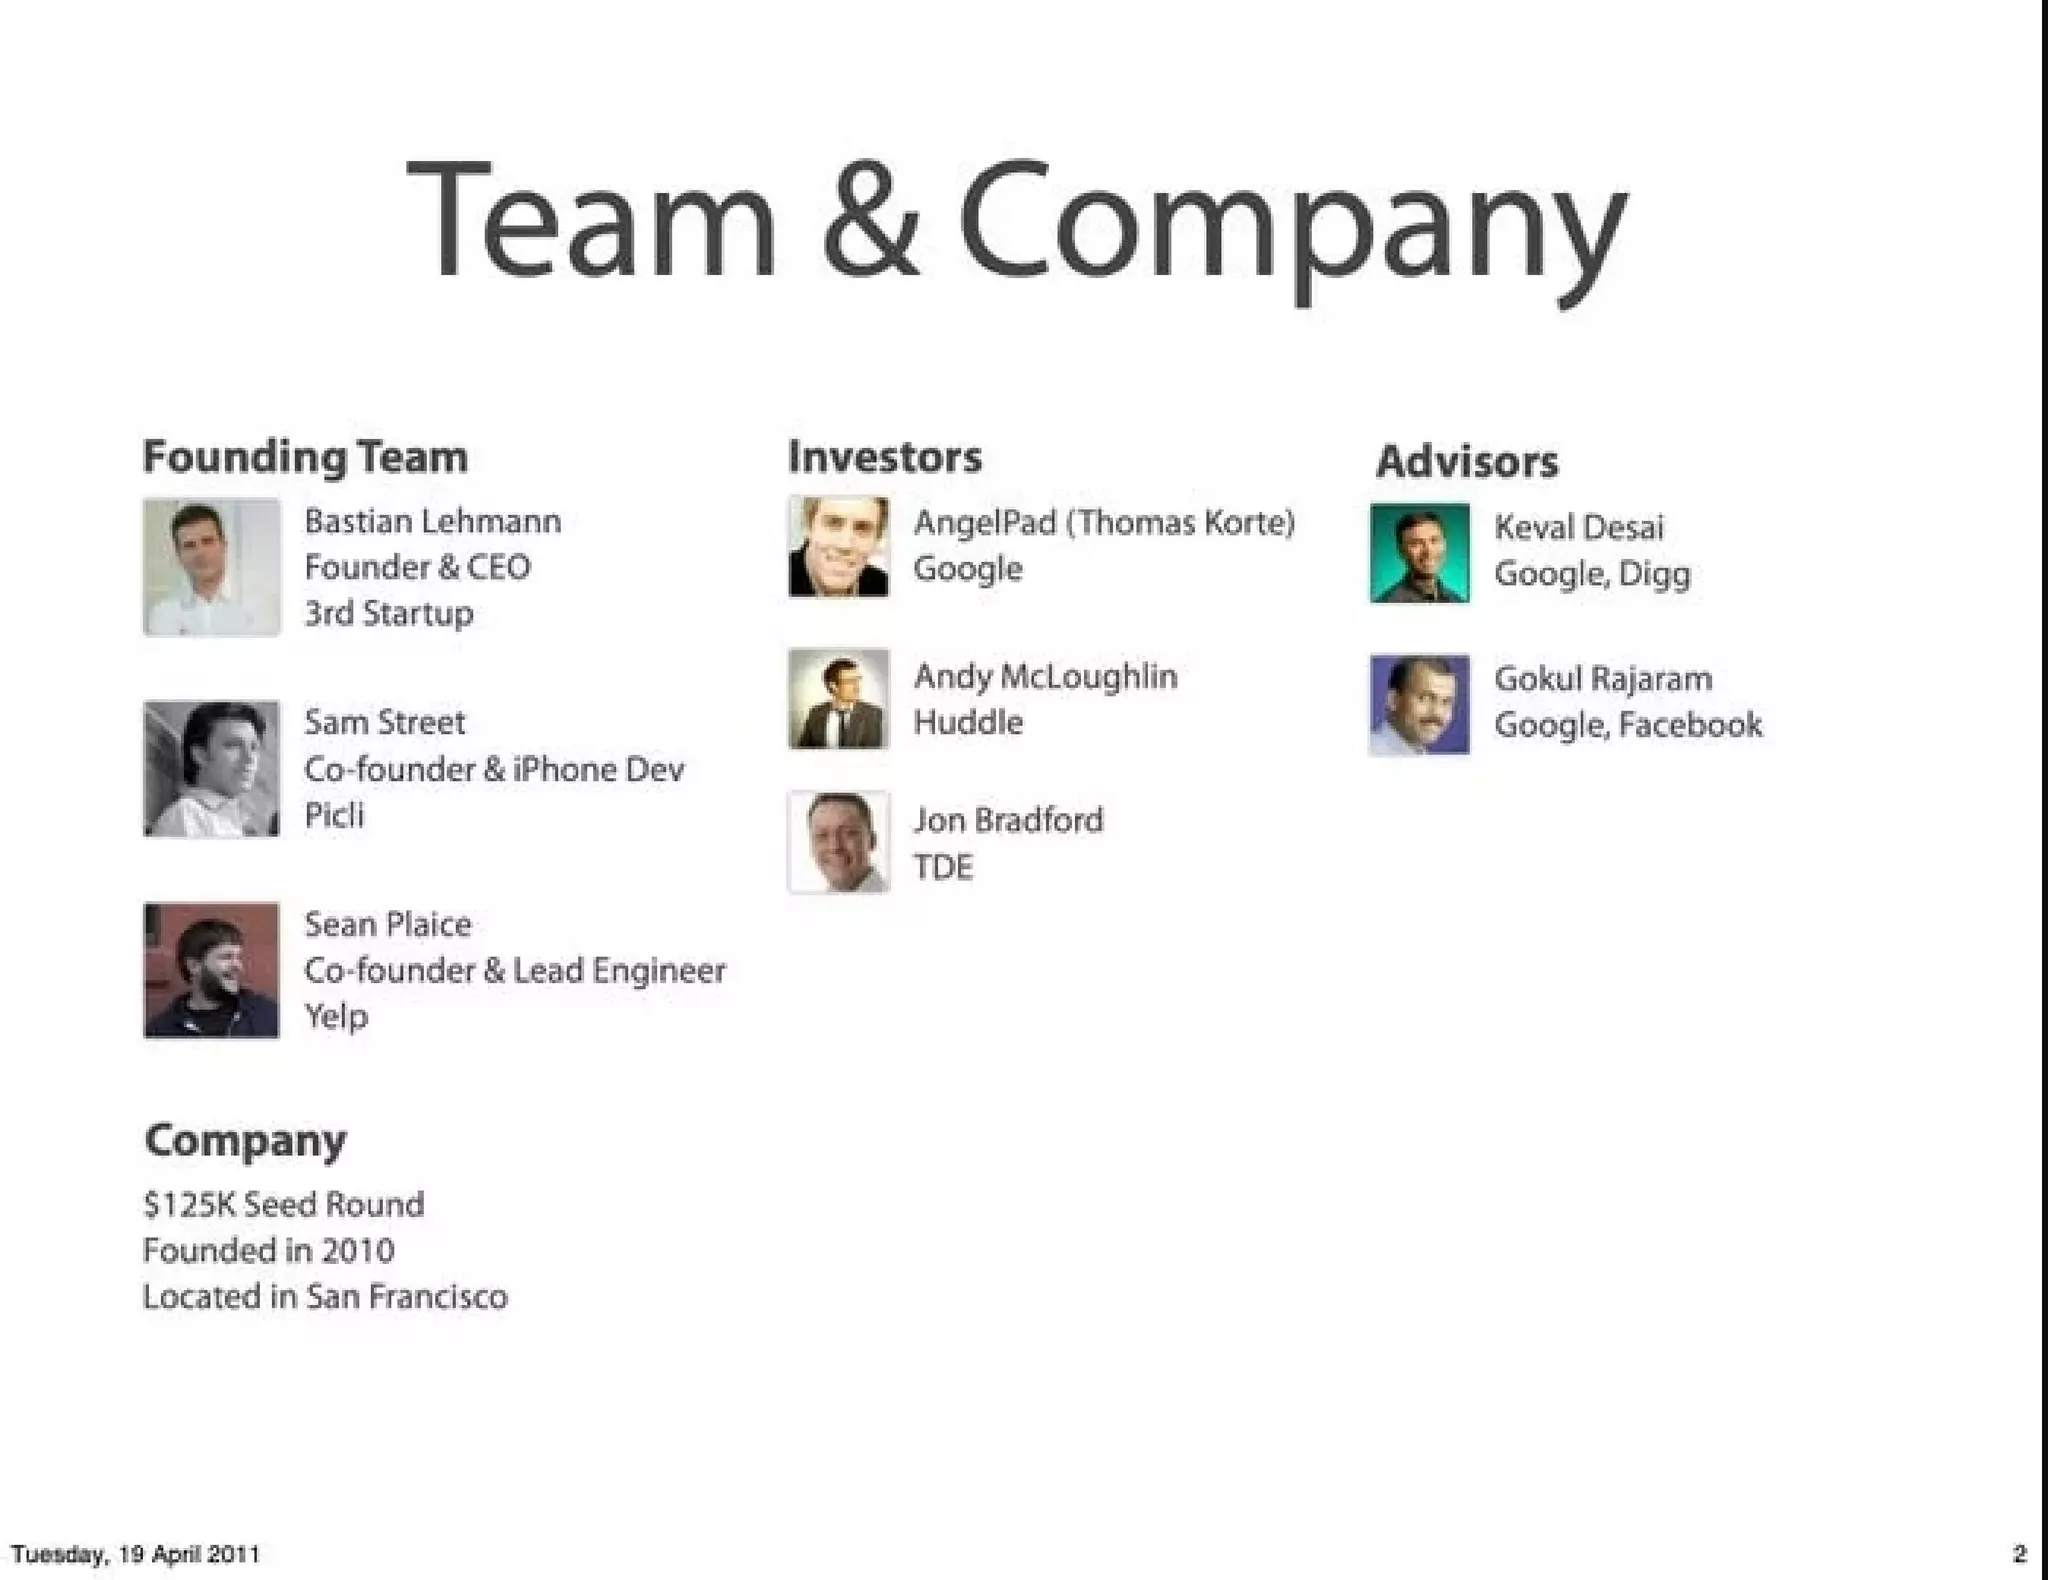
The Team & Company slide (slide 2) lays out founders, their roles, prior experience and key advisors/investors. It highlights operational credibility (co-founders with startup and engineering backgrounds) and external validation via advisors with relevant domain and tech expertise.

This is effective because it doesn't bury names in text — it pairs photos with concise lines that show fit for the problem. For founders, the lesson is to present a compact team slide that demonstrates relevant skills, prior wins and third-party validation rather than long resumes.

Key Takeaway: Show team fit quickly: photos, titles, one-line relevant background, and a few advisors or investors to signal traction and credibility.
Problem: visual storytelling with a single image

Problem: visual storytelling with a single image

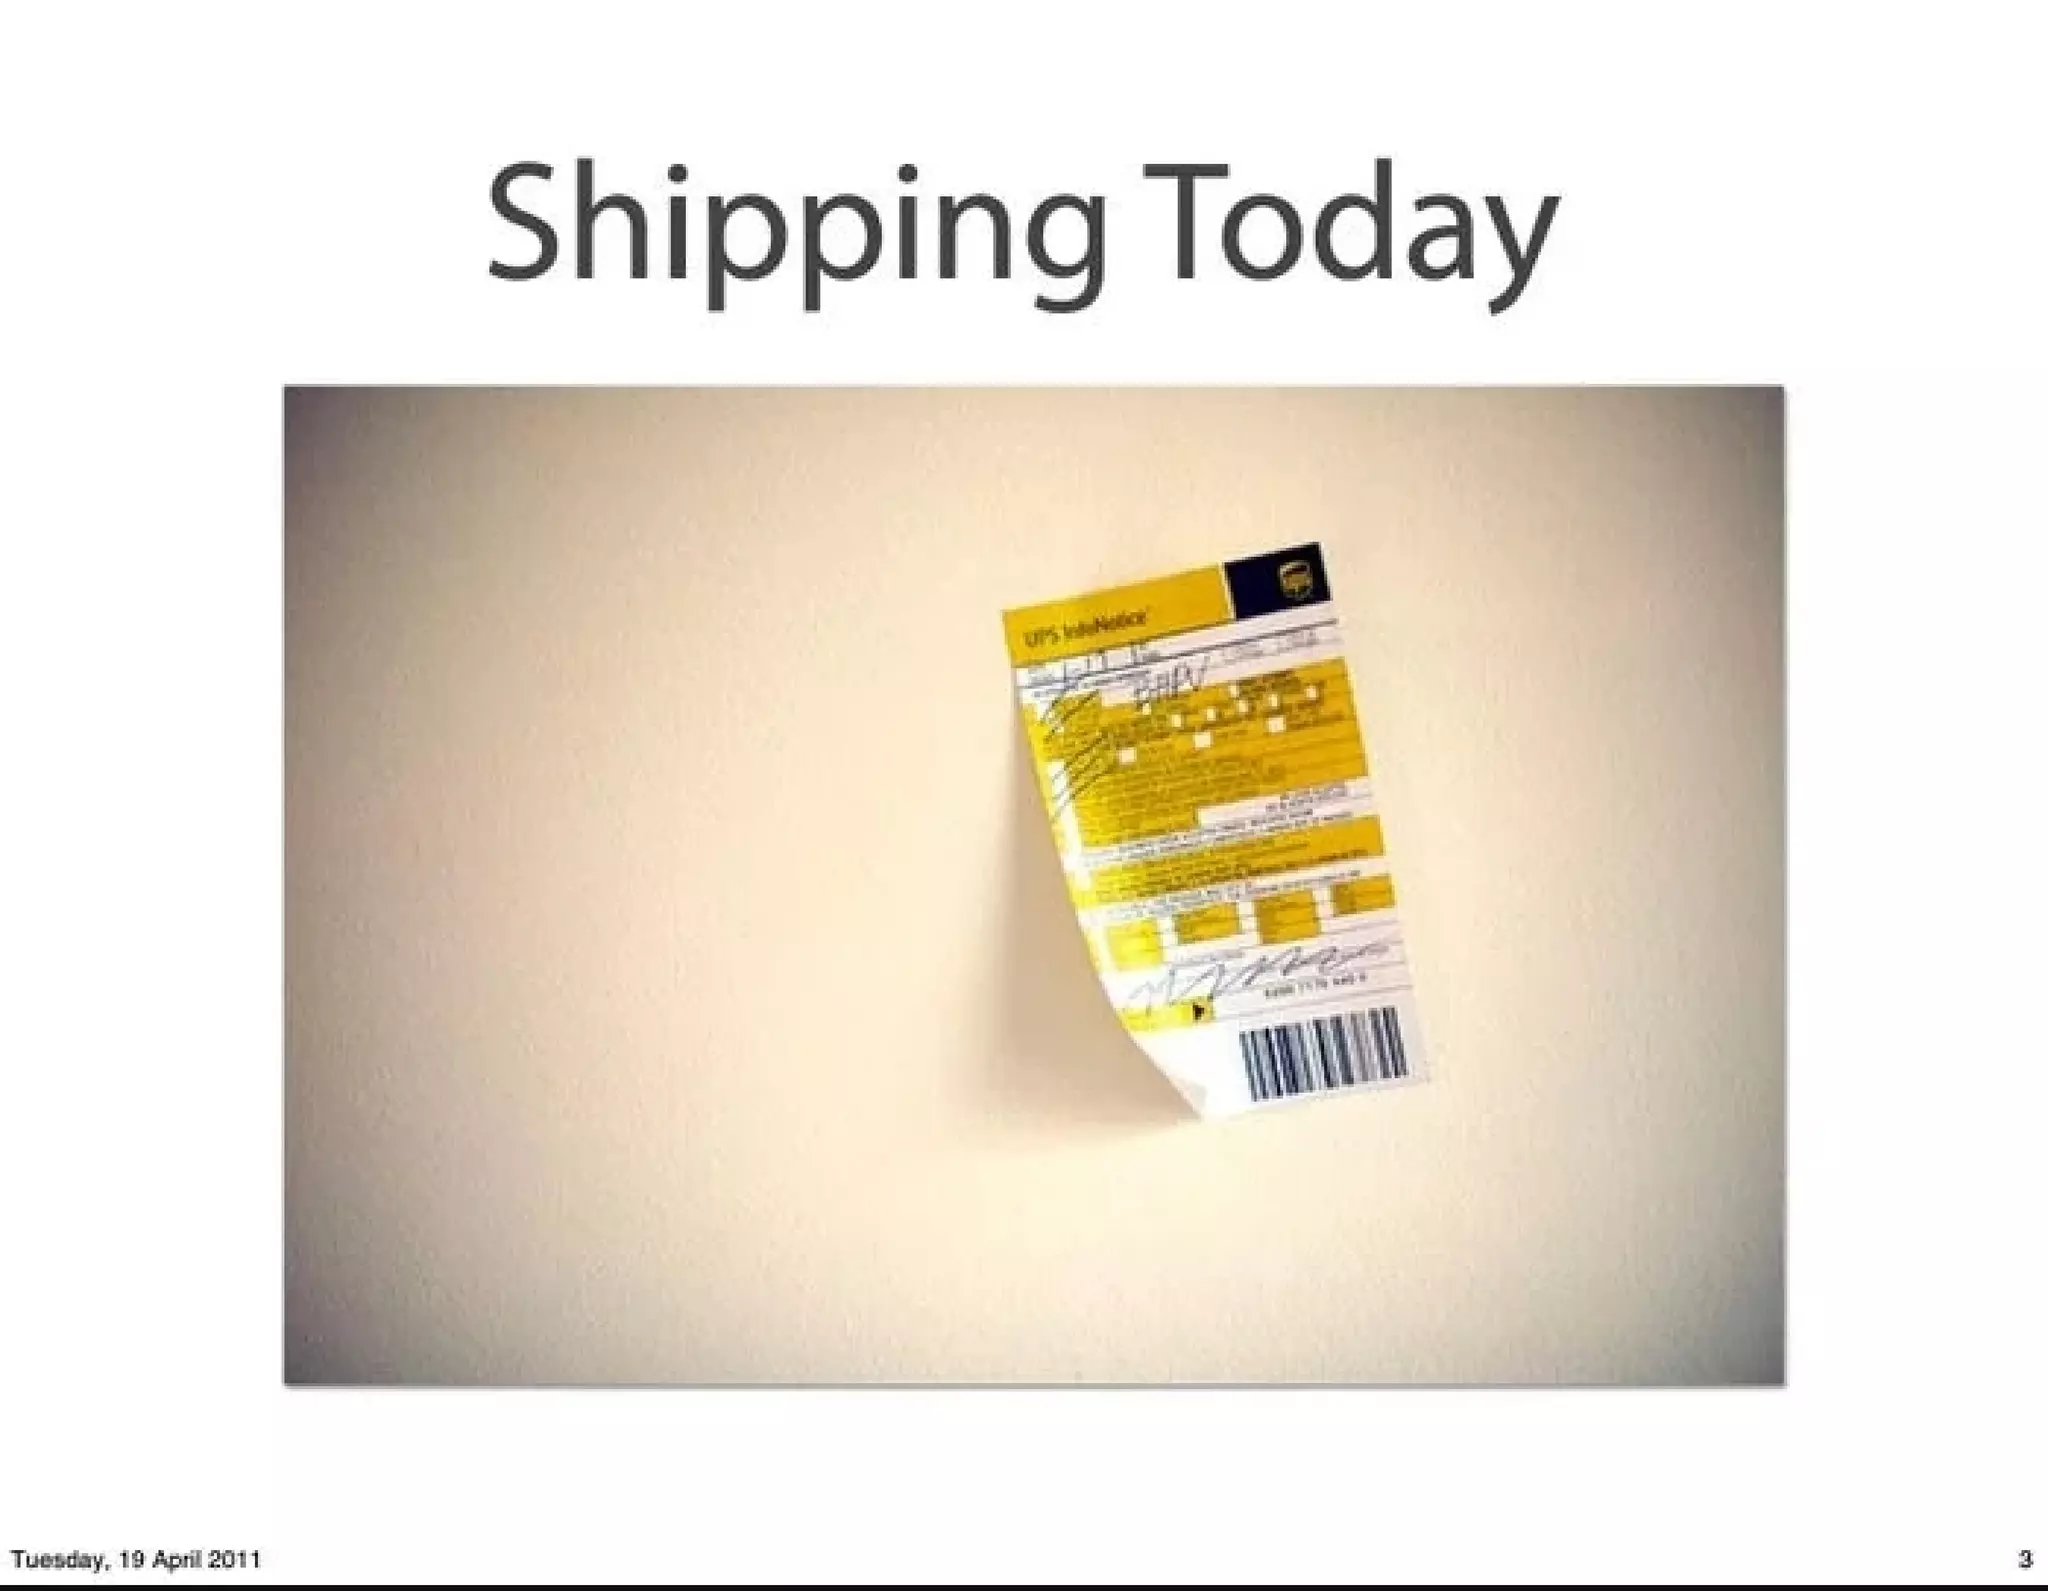
The 'Shipping Today' slide (slide 3) uses a single evocative photo of a missed-delivery slip to summarize the customer pain — deliveries are unreliable, inconvenient and cause friction. There's no long paragraph explaining the problem; the image does the heavy lifting and primes the audience for the solution to follow.

This approach is powerful because investors grasp the pain instantly without numerics. Founders should remember that a strong visual or one-sentence problem statement can be more persuasive than a lengthy list of complaints — use imagery to create an emotional connection before presenting data.

Key Takeaway: Use one strong image or micro-story to make the pain point visceral before diving into metrics and solution details.
Value proposition: quantified competitive comparison

Value proposition: quantified competitive comparison

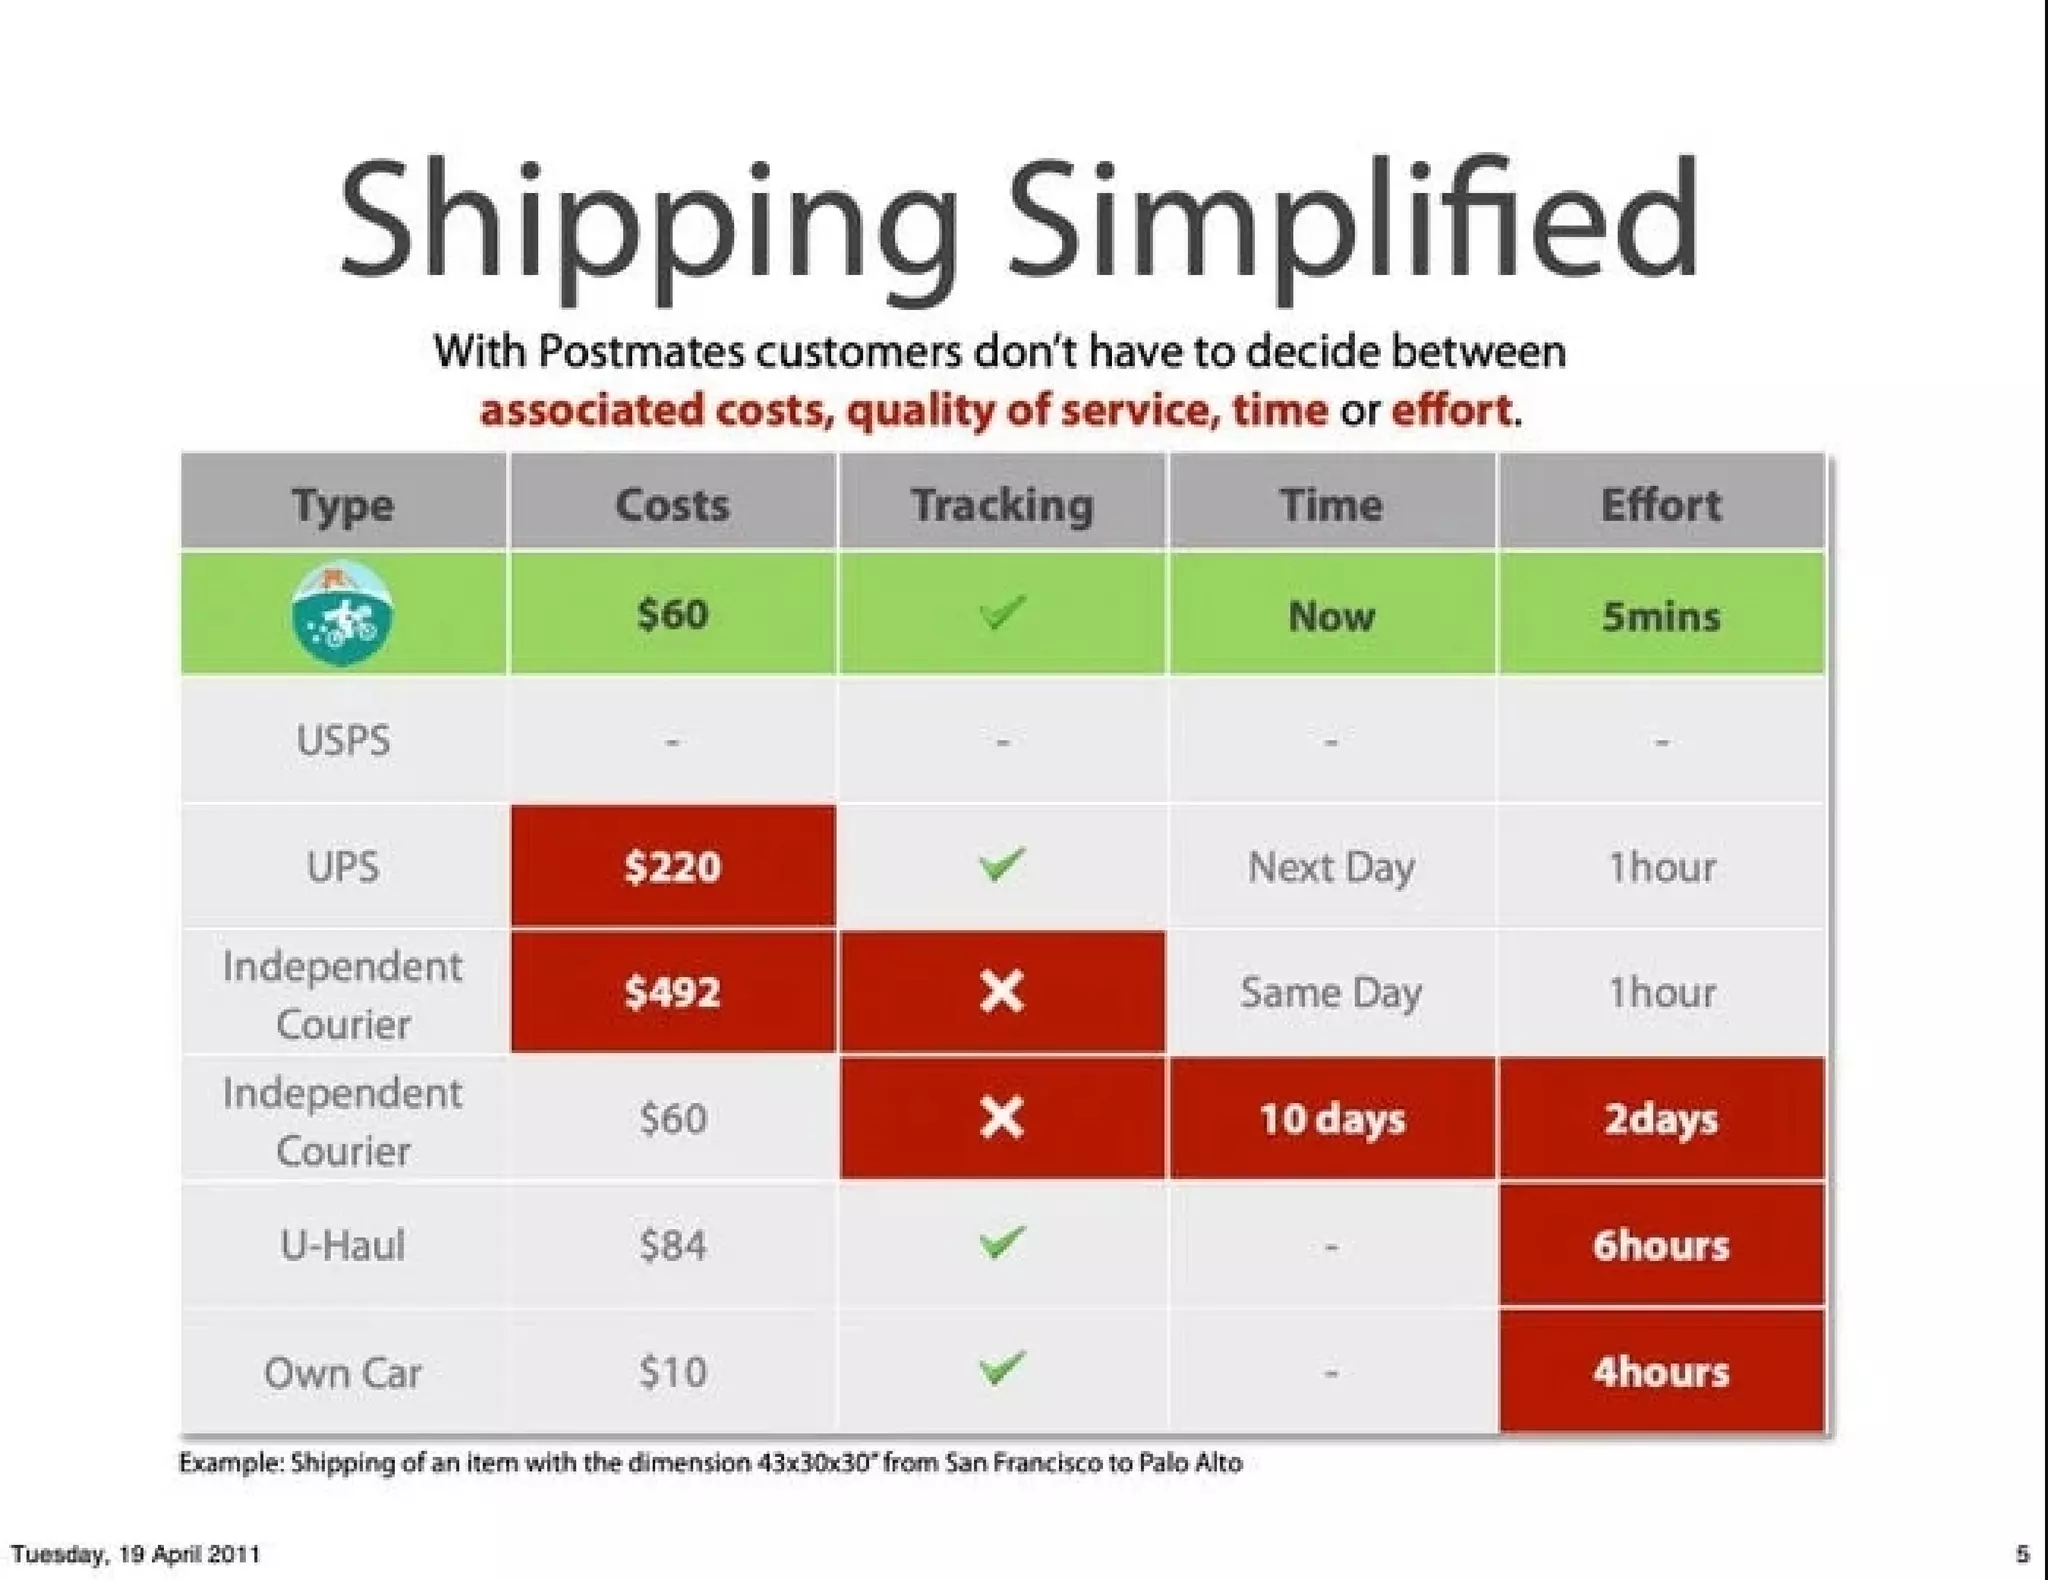
The 'Shipping Simplified' comparison table (slide 5) turns the product promise into concrete advantages — cost, tracking, time, and effort — and compares Postmates to USPS, UPS, independent couriers, U-Haul and driving yourself. The table highlights where Postmates wins (now, low effort, tracking) and uses example shipping dimensions to ground the numbers.

This slide is effective because it translates high-level claims into a side-by-side, easy-to-scan format that shows real economic and convenience benefits. Founders should quantify their claims with one or two credible customer scenarios and pick the axes (cost, speed, effort) that matter most to customers so the advantage is obvious.

Key Takeaway: Make your competitive advantage tangible: pick a realistic use case and show side-by-side metrics that prove your value in minutes.
Market: size and fragmentation as strategic opportunity

Market: size and fragmentation as strategic opportunity

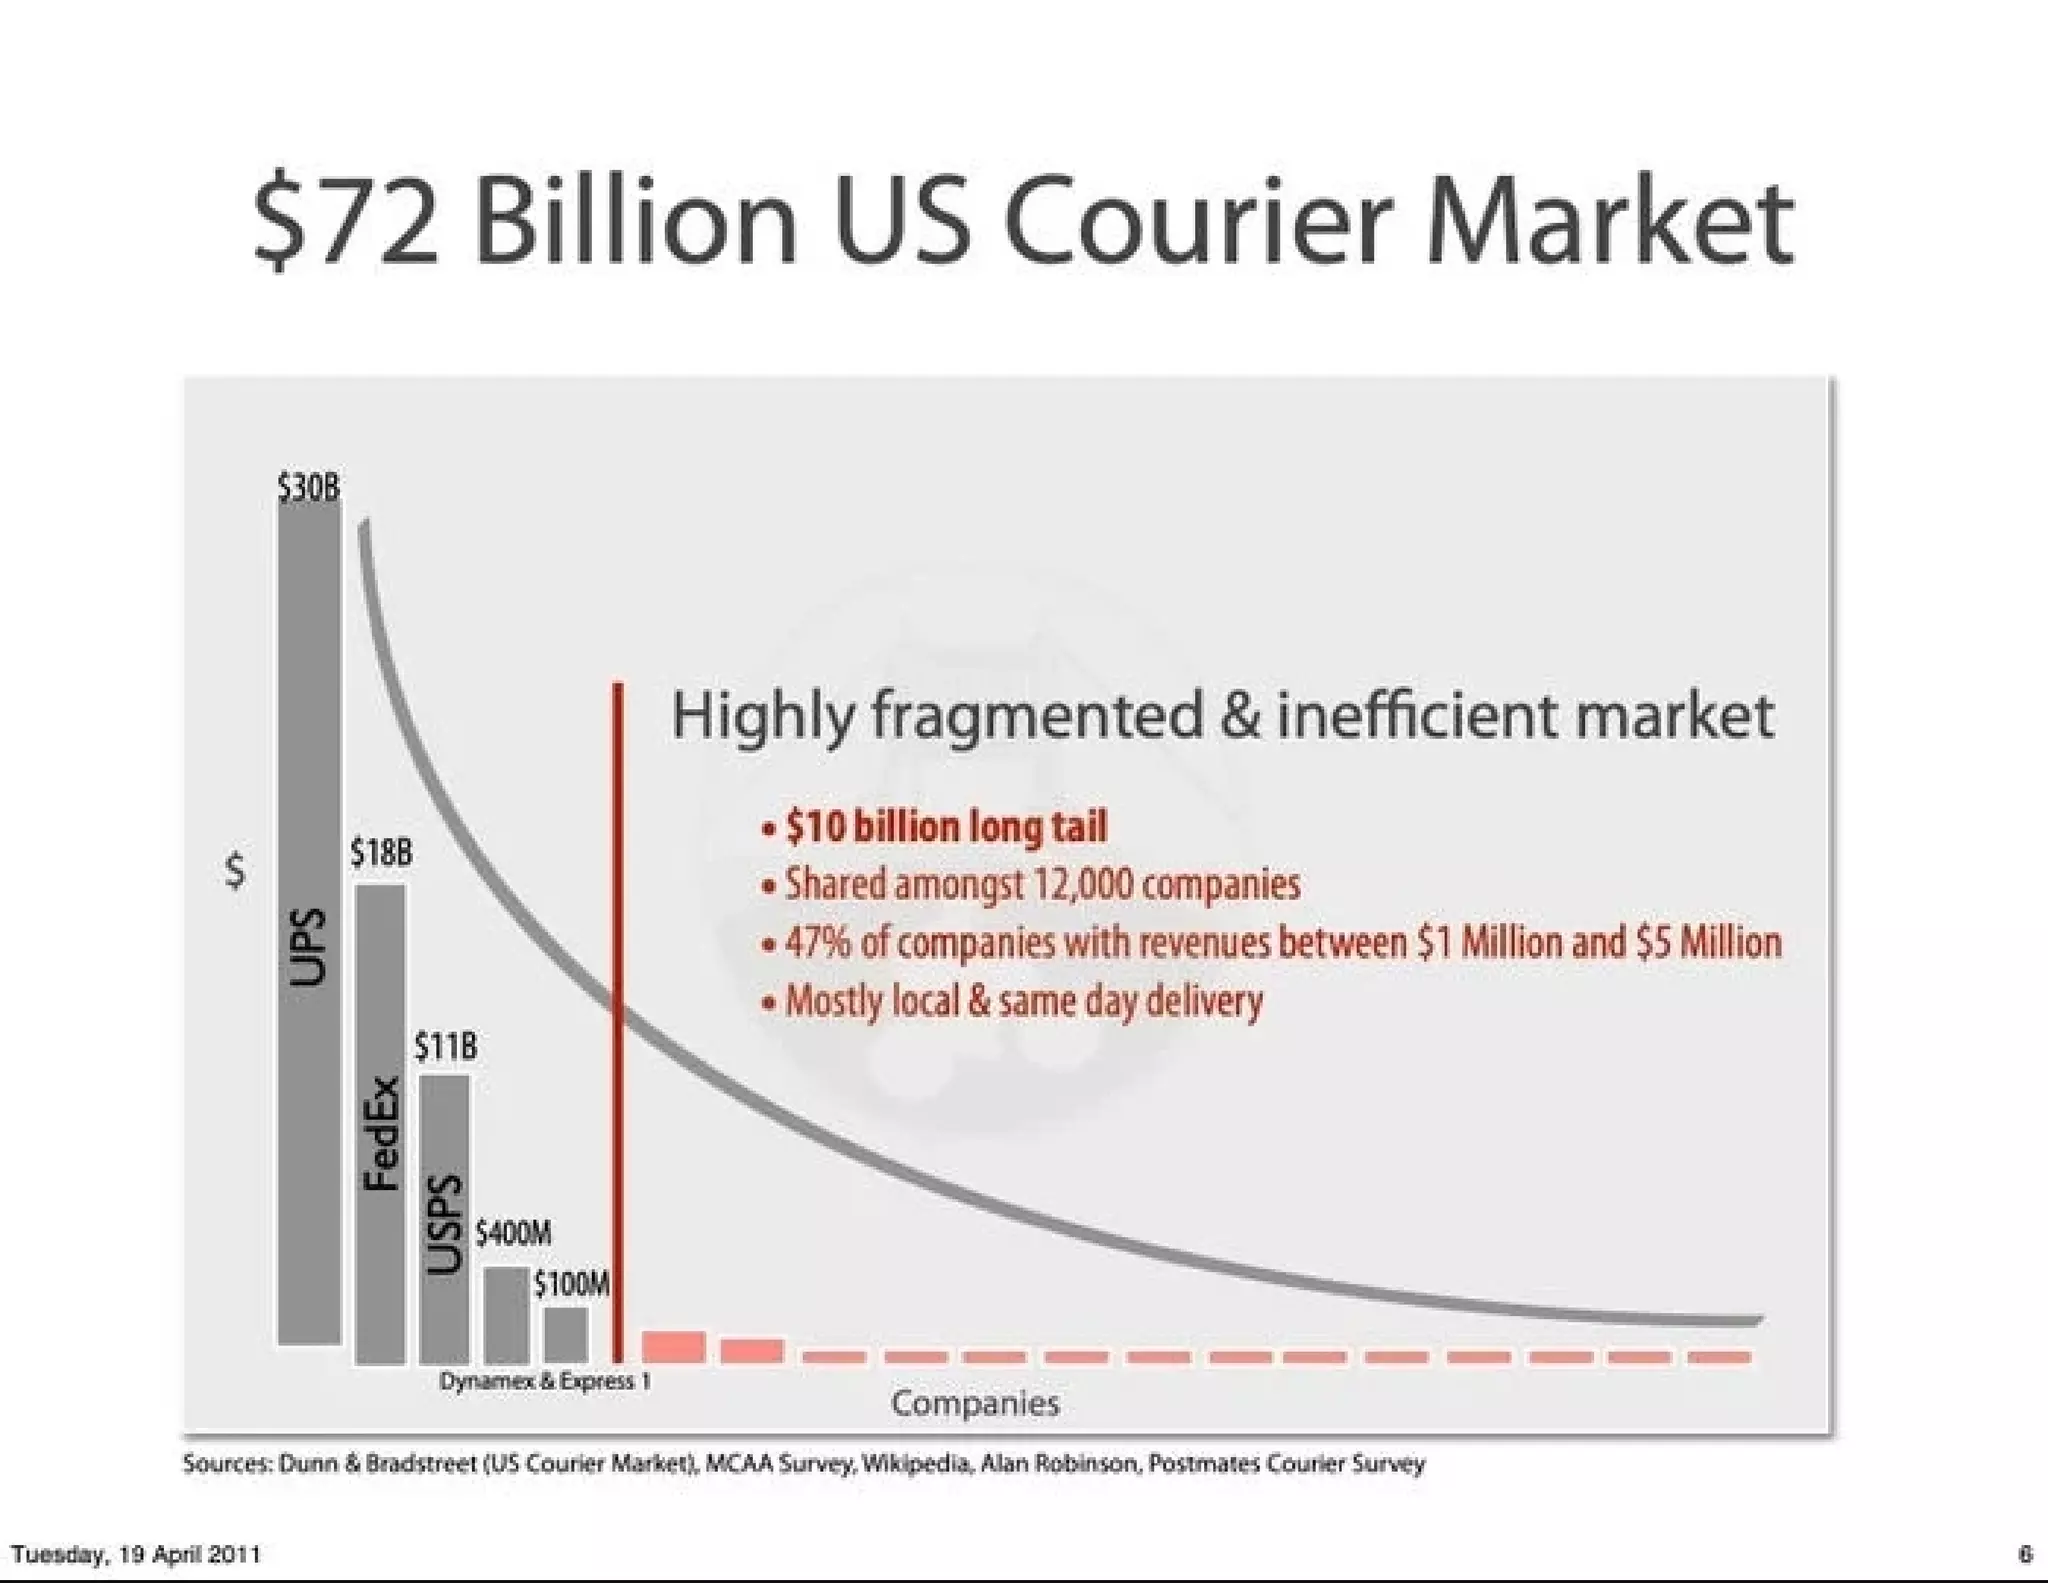
The '72 Billion US Courier Market' slide (slide 6) combines TAM with a fragmentation/long-tail visualization to show both scale and the strategic opening. It calls out a $10B long tail shared among thousands of small players and emphasizes local, same-day delivery as the underserved niche.

This is useful because it couples a large headline number with a defensible go-to-market angle: the long tail of local couriers who lack modern infrastructure. Founders should emulate this by presenting a credible TAM and also showing structural market inefficiencies that their product exploits, not just a big number.

Key Takeaway: Pair a headline TAM with evidence of market fragmentation or inefficiency to show why you can capture a meaningful slice.
Traction: early operational milestones

Traction: early operational milestones

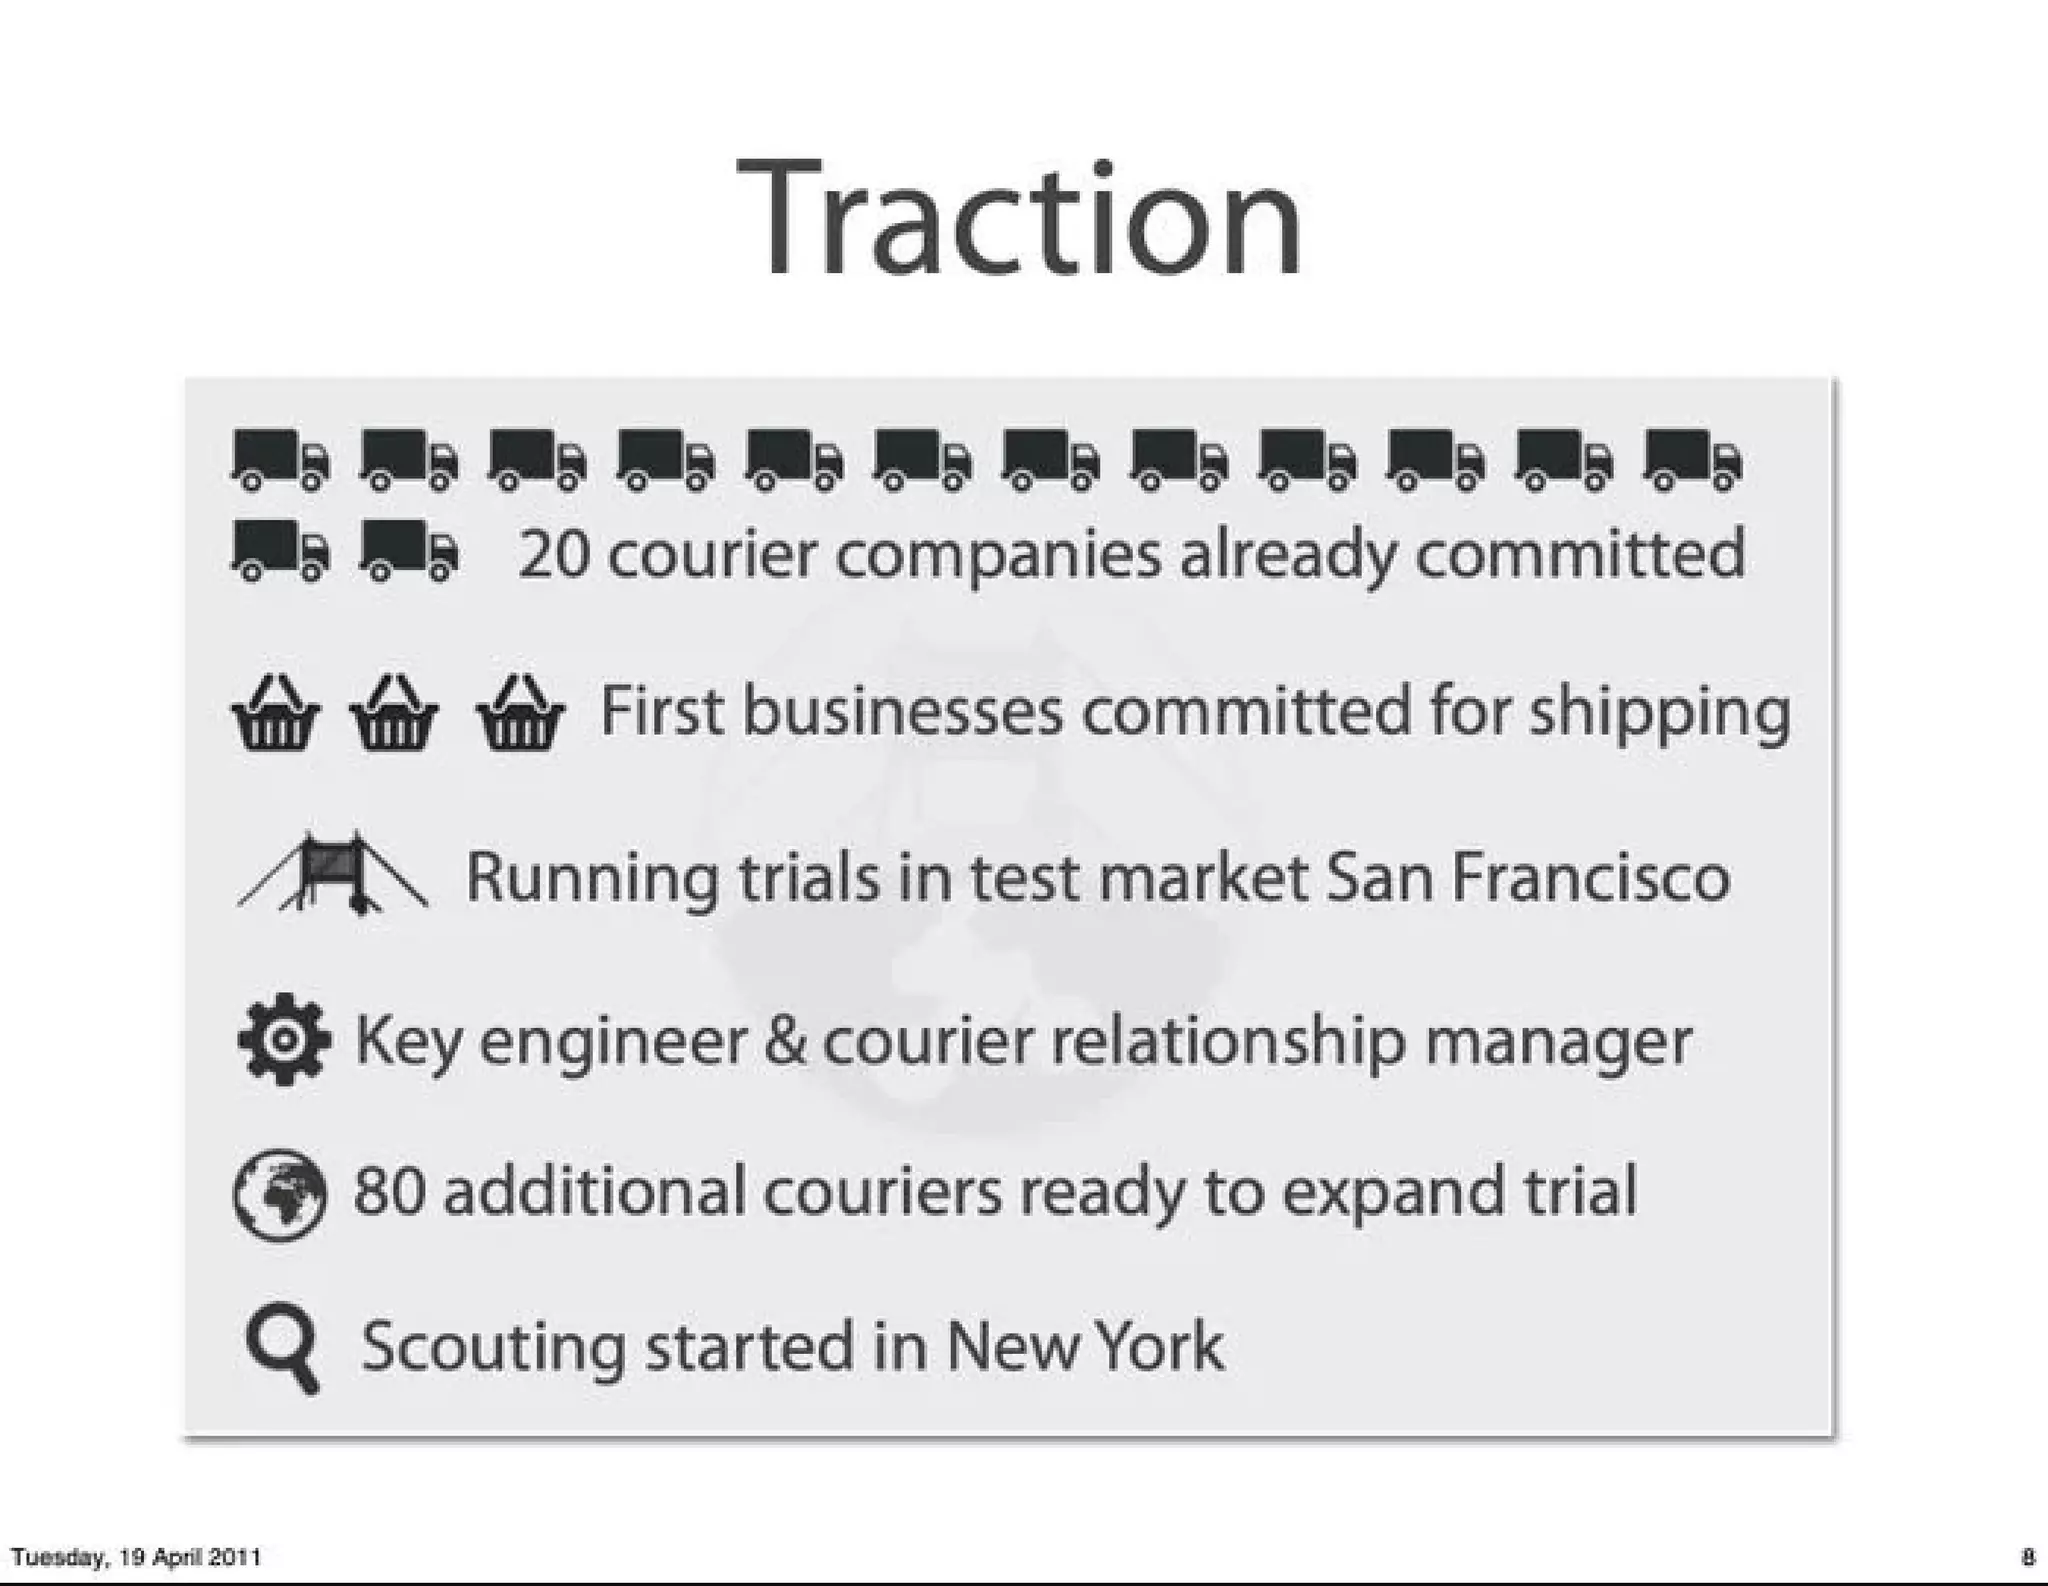
The 'Traction' slide (slide 9) lists concrete early wins: 20 courier companies committed, initial businesses signed up, trials in San Francisco, and 80 additional couriers ready to expand. The slide uses icons and short bullets to show operational progress rather than lofty projections.

This is effective because it demonstrates real-world execution and the mechanics of rollout. For founders, the lesson is to present traction as operational milestones — partners committed, pilots running, and capacity to expand — which is often more convincing than projected revenue curves.

Key Takeaway: Frame traction as concrete operational steps (partners, pilots, committed capacity) that prove repeatability and expandability.
Business model: clear monetization and platform vision

Business model: clear monetization and platform vision

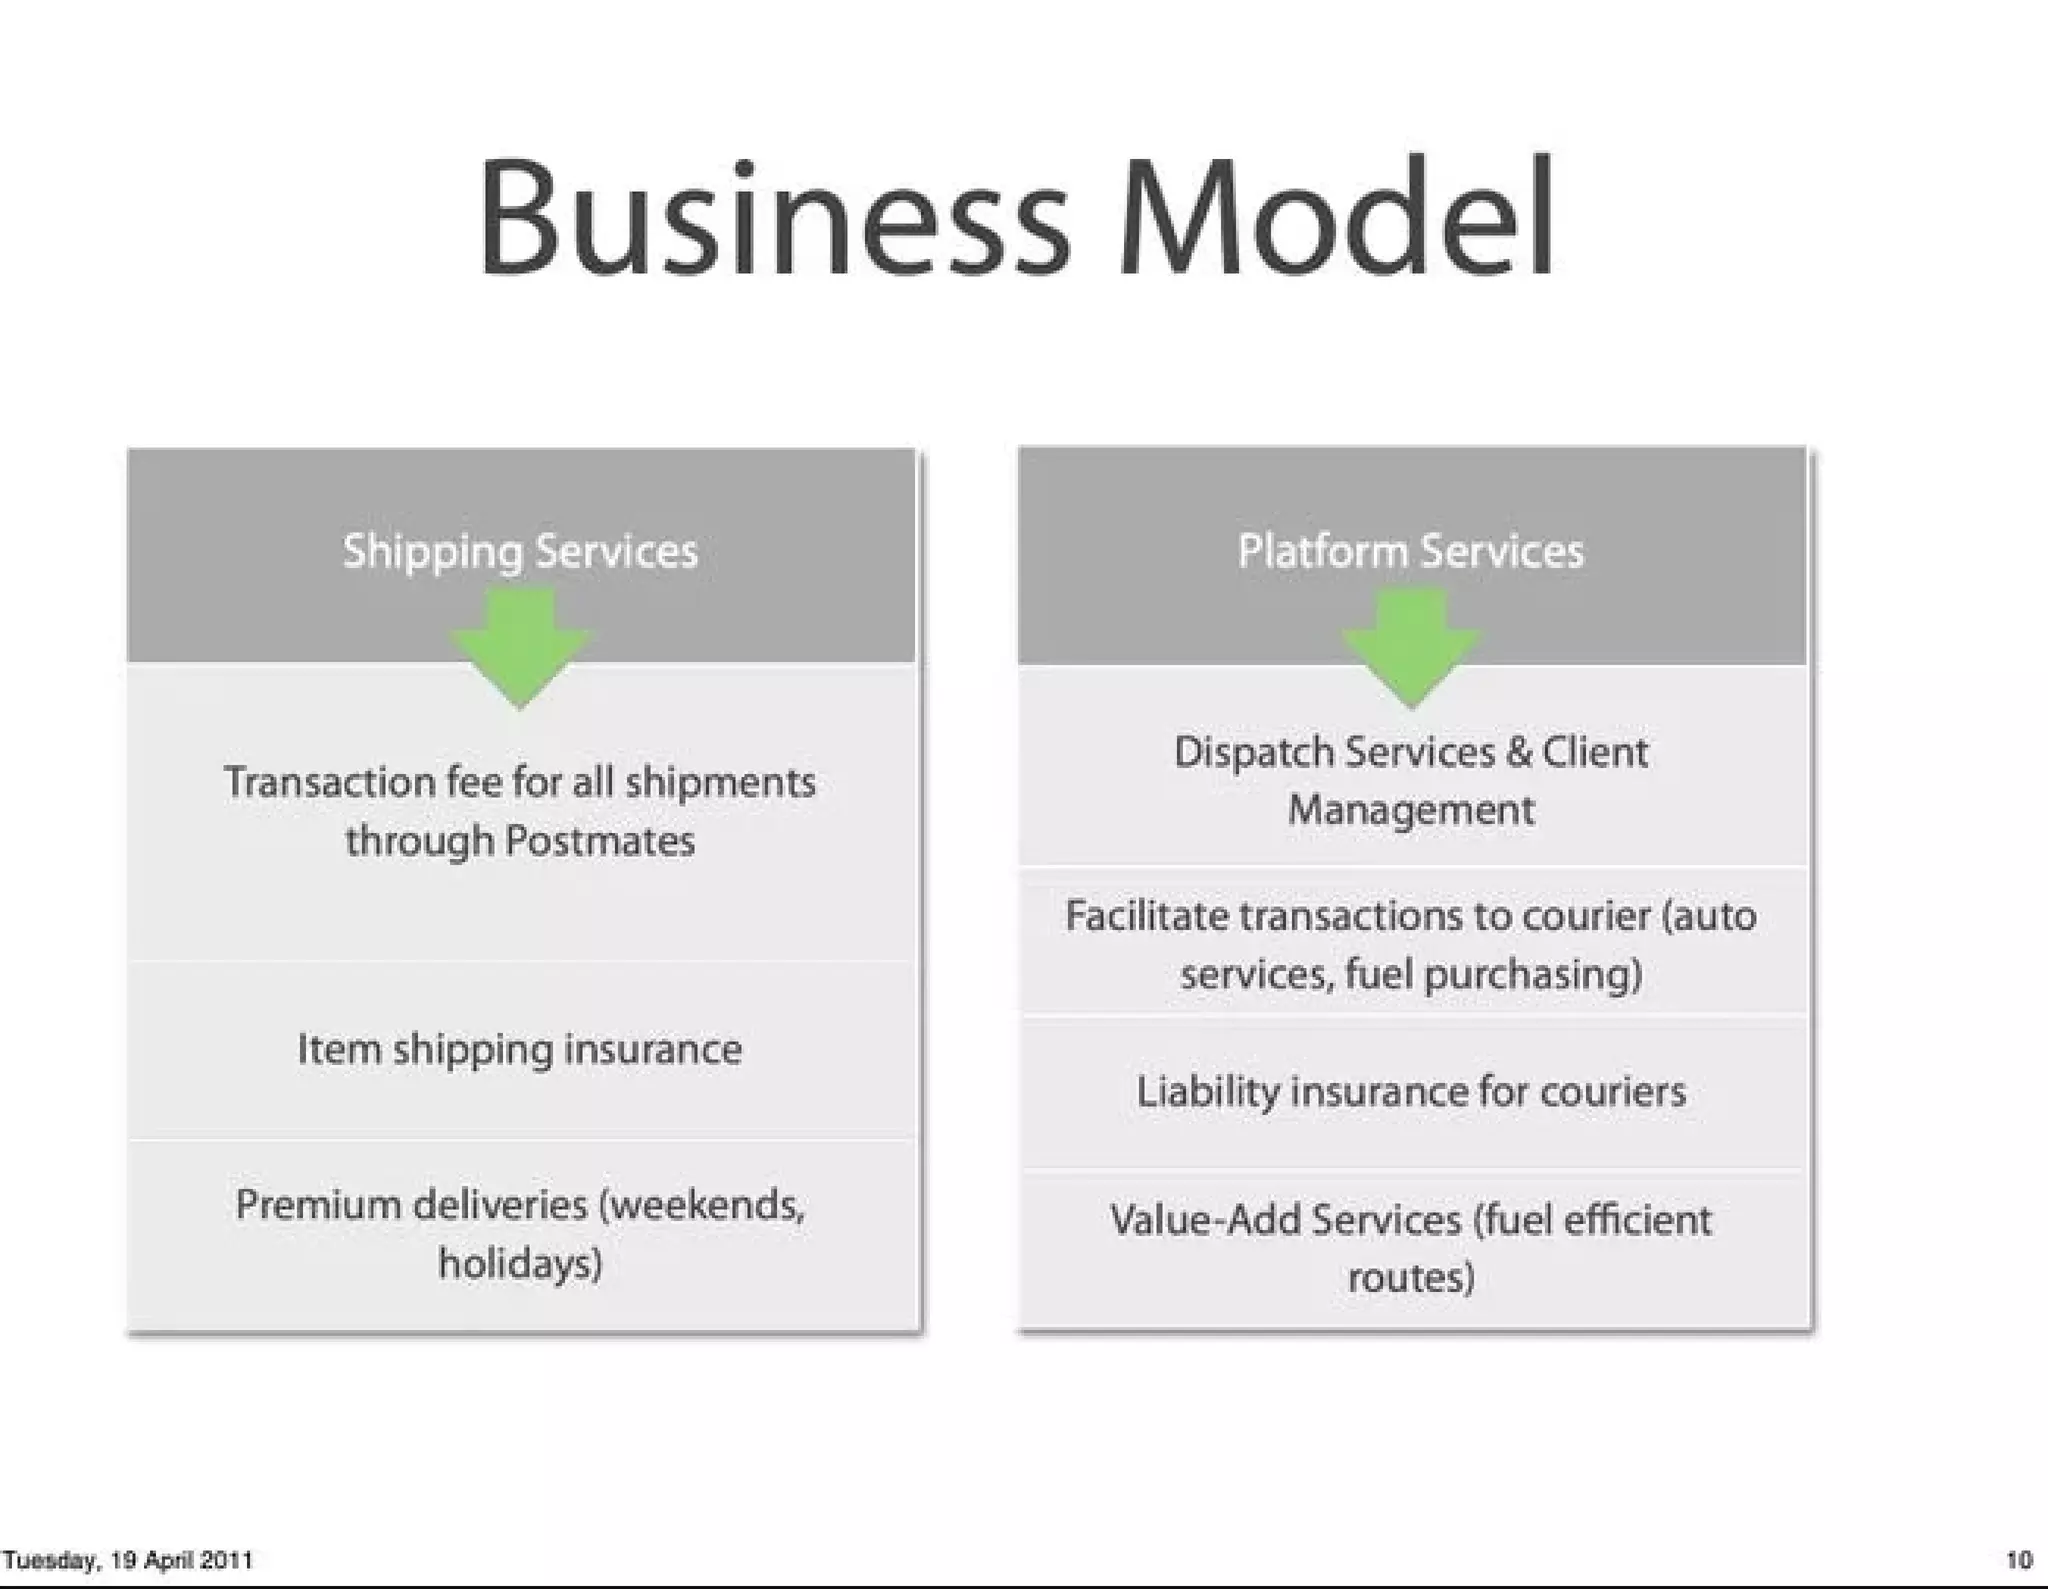
The Business Model slide (slide 10) separates Shipping Services and Platform Services, listing revenue opportunities like transaction fees, insurance, premium deliveries, dispatch and value-add services. It signals a two-sided approach: immediate transaction revenue plus platform services to deepen monetization with couriers and businesses.

This dual-layer framing is effective because it avoids over-reliance on a single revenue line and shows how the product can progressively increase wallet share. Founders should clearly map how customers and supply partners pay, and show a path from single transactions to recurring or higher-margin services offered through a platform.

Key Takeaway: Show both immediate monetization and longer-term platform services so investors see an expanding revenue roadmap, not a one-off fee model.

Conclusion: Key Lessons

Postmates' deck is a compact example of how to balance emotion, evidence and execution. Strengths include a bold opening brand promise, a visceral problem image, a quantified competitive matrix, a credible market narrative that highlights fragmentation, and traction presented as operational commitments. The deck also clearly maps monetization and platform strategy, which together tell a cohesive story from customer pain to scalable business.

Actionable advice for founders: lead with a tight brand and problem narrative, use one or two realistic scenarios to quantify your advantage, pair TAM with market structure (fragmentation/inefficiency), present traction as concrete operational milestones, and outline both short-term revenues and a longer-term platform path. Keep slides visual, minimize dense text, and make it easy for investors to see why the team can execute the plan.

Full Deck Analysis

11 sections

Overview

Company: Postmates
Round: Series A ($750K)
Year: 2011
Outcome: Acquired by Uber for $2.65B (2020)


Executive Summary

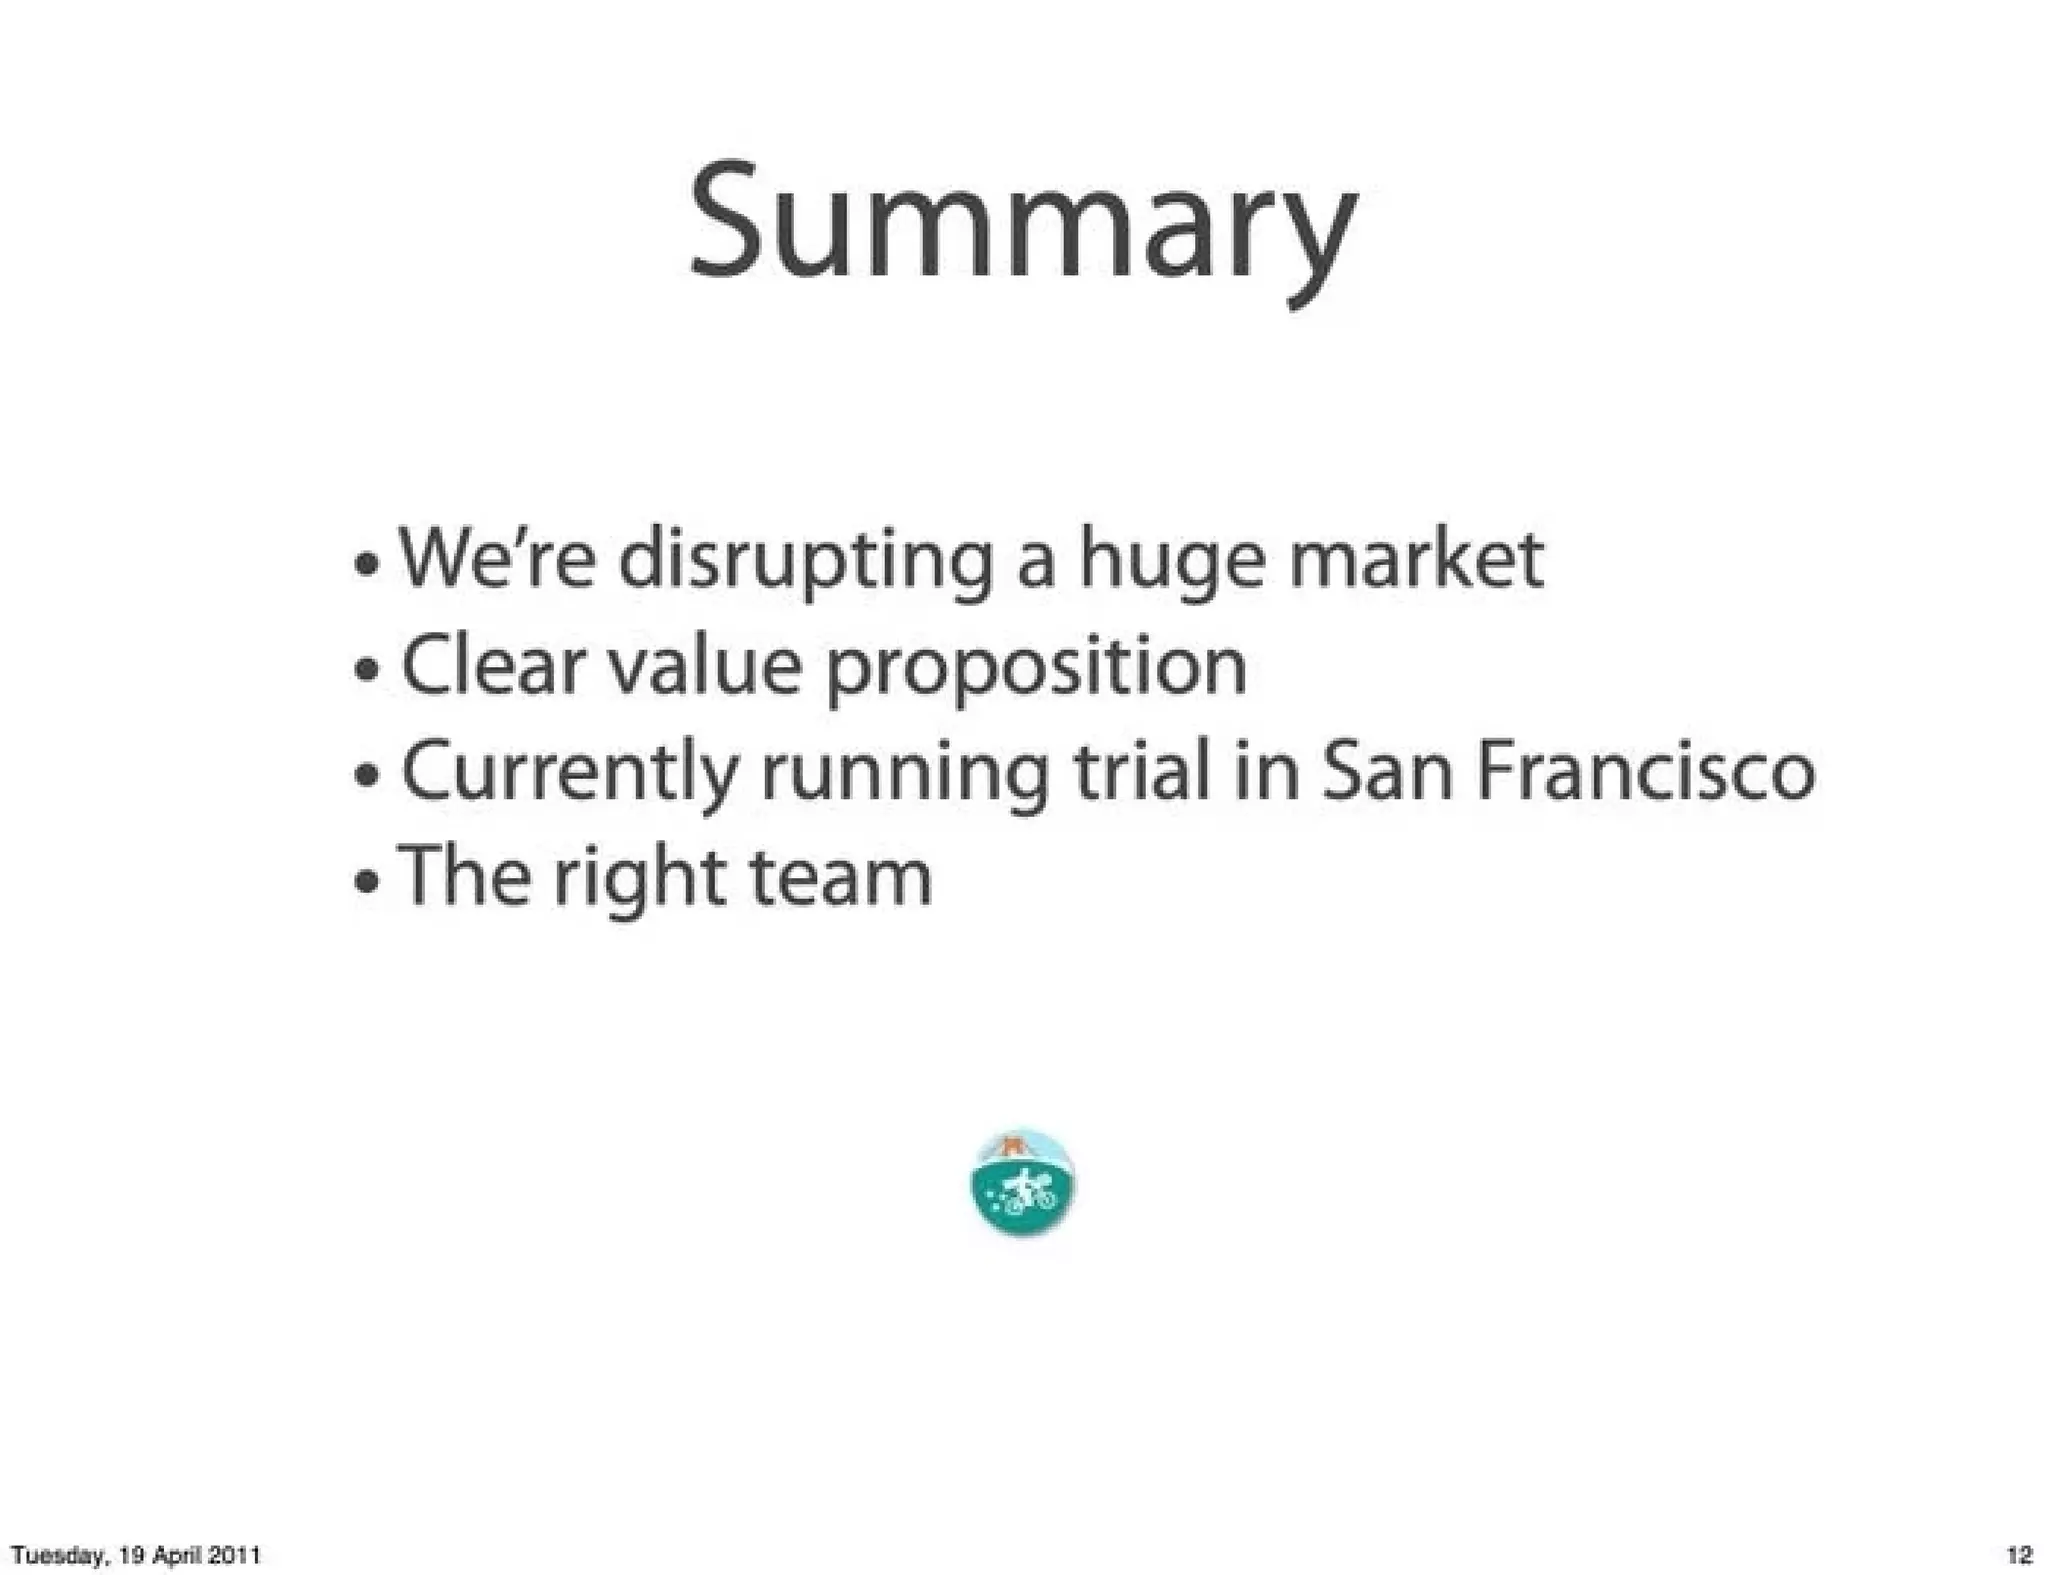
This 13‑slide Series A deck (Apr 2011) tells a tight story: a large, fragmented same‑day local delivery market is inefficient and Postmates has built a real‑time logistics platform and marketplace to solve it. The deck is notable for a clear market sizing claim ($72B US courier market), early operational traction (courier commitments & trials in SF), and a technically credible team and stack — despite minimal financial/unit economics disclosed.


Problem Statement

How the deck articulates the problem:

  • Slide 3 (“Shipping Today”) uses a single image (missed delivery slip) to convey the customer pain: traditional couriers are inconvenient and often fail for local/same‑day needs.
  • Slide 5 (“Shipping Simplified”) explicitly compares alternatives (USPS/UPS/independent couriers/U‑Haul/own car) and highlights tradeoffs in cost, tracking, time and effort — positioning existing options as either expensive, slow, or high effort. This table makes the operational problem tangible.

Solution

How the deck positions the solution:

  • Postmates is presented as a real‑time, on‑demand local delivery platform that provides immediate deliveries with tracking and low effort for customers (Slide 5).
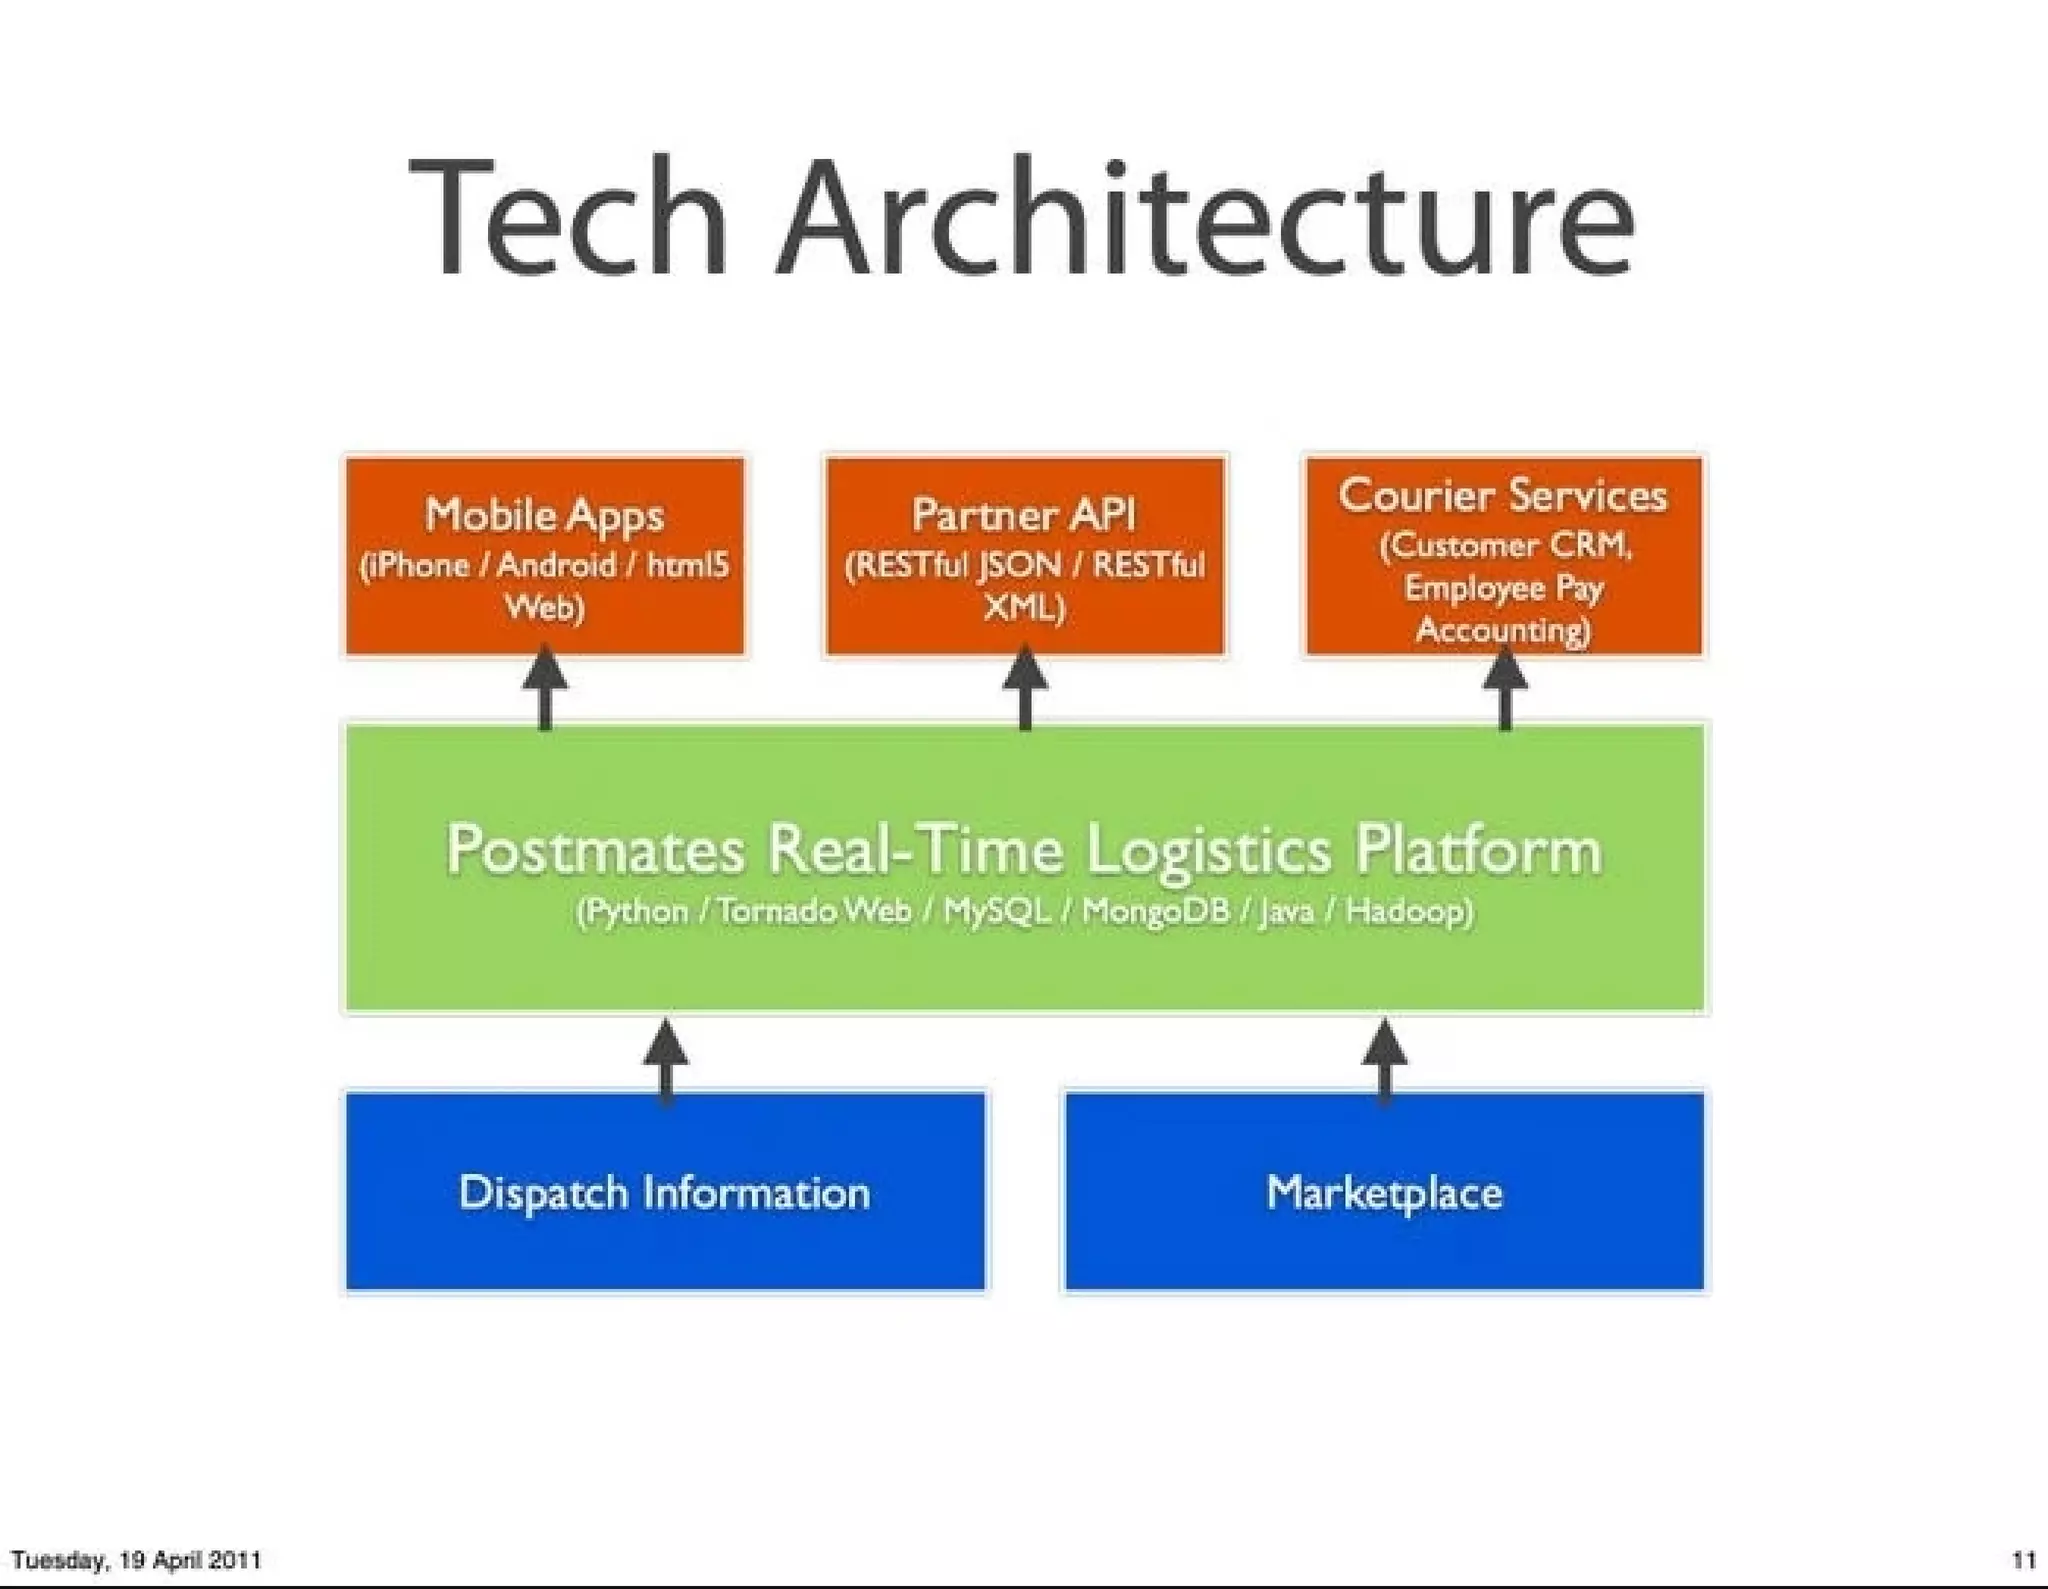
  • The product is a marketplace + dispatch platform (Slides 10–11): mobile apps + Partner API + courier operations fed by a central “Postmates Real‑Time Logistics Platform” (tech stack listed on Slide 11).
  • Value props include convenience (“Now”, 5 mins effort on Slide 5), coverage for local same‑day deliveries, dispatch & client management, insurance and premium delivery options (Slide 10).

Market Opportunity

TAM / SAM / SOM (as presented)

  • Slide 6 headline: “$72 Billion US Courier Market.”
  • Breakdown shown (Slide 6): major incumbents by revenue: UPS ($30B), FedEx ($18B), USPS ($11B), smaller players $400M / $100M; the deck calls out a “$10 billion long tail” opportunity (SME/local couriers).
  • Additional market characteristics (Slide 6): shared among ~12,000 companies; 47% of companies have revenues between $1M–$5M; mostly local & same‑day deliveries.
  • No explicit SAM/SOM split in dollars beyond the $10B long tail callout. The deck focuses on the opportunity within local / same‑day deliveries (long tail).

Business Model

Revenue model and unit economics (as presented)

  • Primary revenue: transaction fee on all shipments booked through Postmates (Slide 10).
  • Additional revenue / monetizable services: item shipping insurance, premium delivery pricing (weekends/holidays), platform services (dispatch & client management), facilitated purchases for couriers (auto/fuel services), liability insurance, value‑add route optimization (Slide 10).
  • No detailed unit economics shown (no ticket average, take‑rate %, CAC, margin per delivery, or LTV). Slide 5 shows illustrative pricing comparisons (example row: Postmates $60 for the sample shipment), but the deck does not disclose realized ARPU or margins.

Traction & Metrics

Growth metrics and proof points (explicit numbers in deck)

  • “20 courier companies already committed” (Slide 8).
  • “First businesses committed for shipping” and “Running trials in test market San Francisco” (Slide 8).
  • “80 additional couriers ready to expand trial” and “Scouting started in New York” (Slide 8).
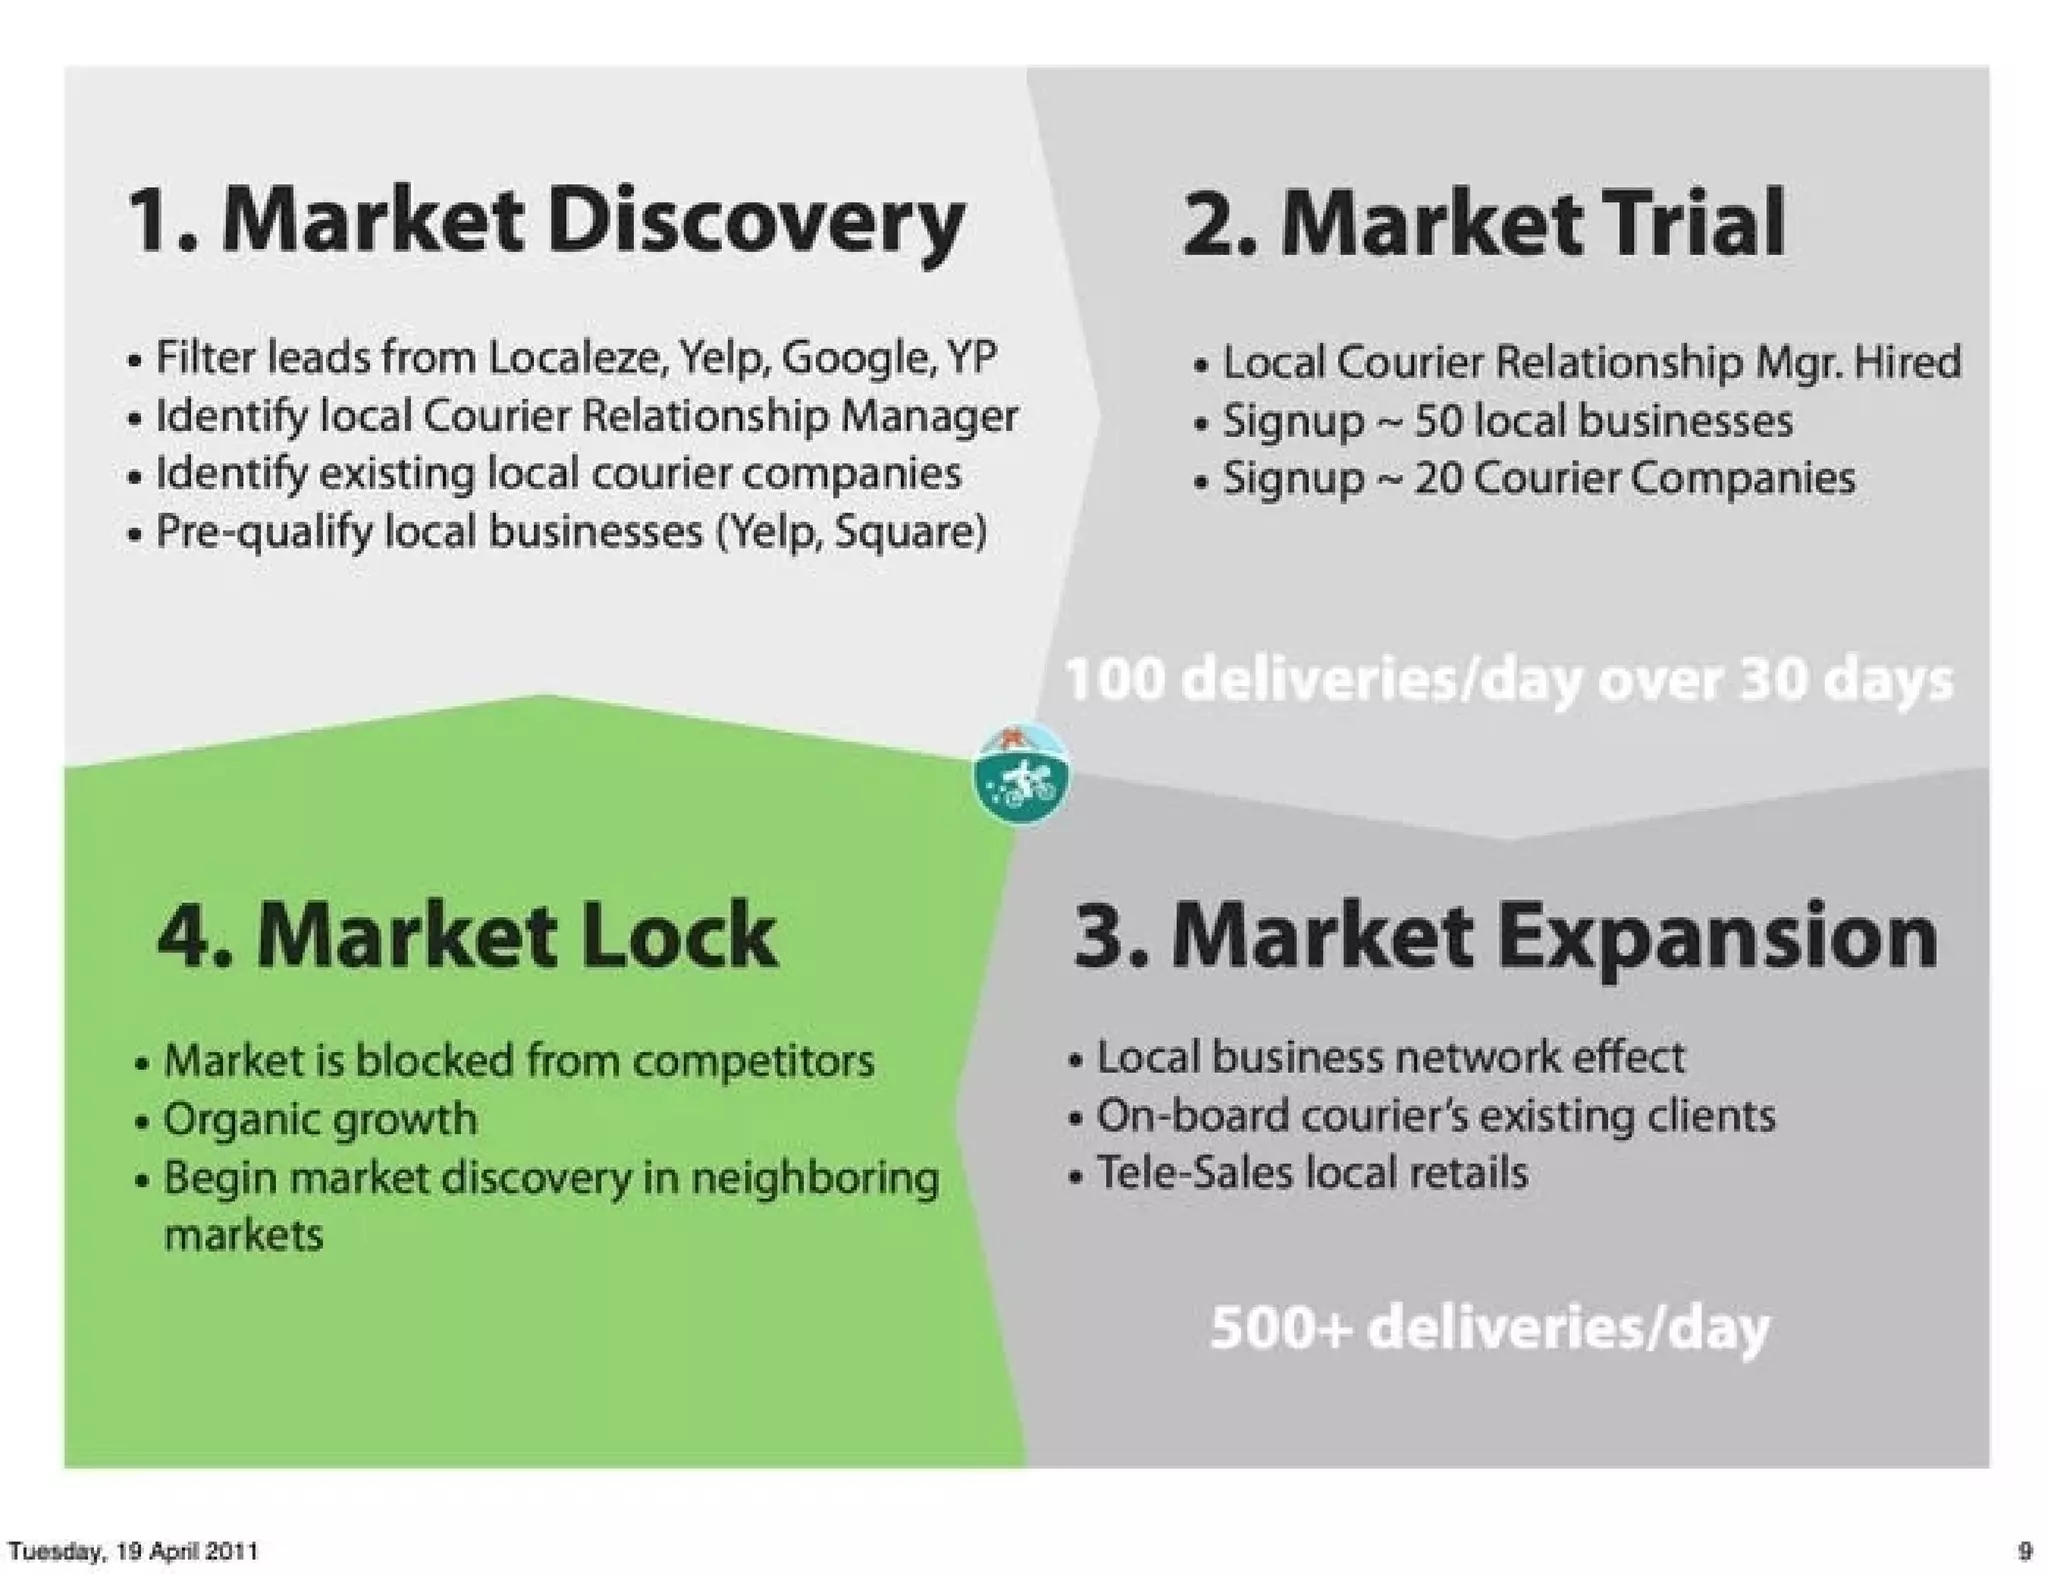
  • Market trial targets (Slide 9): signup ~50 local businesses, signup ~20 courier companies, goal ~100 deliveries/day over 30 days in trial → then scale to 500+ deliveries/day in expansion phase.
  • No published revenue, ARR, gross margin, or concrete daily deliveries achieved — only commitments and target/goal numbers.

Competitive Positioning

How they differentiate:

  • Focus on local same‑day, on‑demand deliveries (long tail) where incumbents are weak or expensive (Slide 5 & 6).
  • Platform approach: aggregation of local couriers + dispatch + real‑time tracking (Slide 11) vs. single courier companies.
  • Emphasis on developer‑facing interfaces (mobile apps + Partner API) enabling integrations and scale (Slide 11).
  • Positioning vs incumbents: cheaper/faster than same‑day independent couriers and more convenient than UPS/USPS for local needs (Slide 5).

Team

Team credentials (Slide 2):

  • Bastian Lehmann — Founder & CEO (noted as his 3rd startup).
  • Sam Street — Co‑founder & iPhone developer (Picli).
  • Sean Plaice — Co‑founder & Lead Engineer (Yelp).
  • Advisors / early investors include AngelPad (Thomas Korte), Google, Andy McLoughlin, Jon Bradford; advisors Keval Desai (Google, Digg), Gokul Rajaram (Google, Facebook).
  • Company background: $125K seed round prior, founded 2010, based in San Francisco (Slide 2).

Go-to-Market Strategy

Distribution approach (Slide 9 and others):

  • Four‑step approach: Market Discovery → Market Trial → Market Expansion → Market Lock (Slide 9).
    • Discovery: filter leads from Localeze, Yelp, Google, YP; pre‑qualify businesses.
    • Trial: hire a local courier relationship manager; onboard ~50 businesses and ~20 couriers; target 100 deliveries/day for 30 days.
    • Expansion: leverage local business network effects and onboard couriers’ existing clients to reach 500+ deliveries/day.
    • Lock: block market from competitors and replicate in neighboring markets.
  • Operational GTM emphasized: local courier relationships and business signups over pure online user acquisition (Slides 8–9).

The Ask

  • Round: Series A for $750K (user context). The deck itself does not show an explicit slide titled “The Ask” nor a detailed use‑of‑funds breakdown. Earlier seed funding shown: $125K seed (Slide 2).

Investor Deep Dive

Executive summary, strengths & red flags

Executive Summary

This 13‑slide Series A deck (Apr 2011) tells a tight story: a large, fragmented same‑day local delivery market is inefficient and Postmates has built a real‑time logistics platform and marketplace to solve it. The deck is notable for a clear market sizing claim ($72B US courier market), early operational traction (courier commitments & trials in SF), and a technically credible team and stack — despite minimal financial/unit economics disclosed.

Key Strengths

3 identified

1

Clear and relatable problem framing with a vivid visual (Slide 3) and a simple comparative table showing customer benefit (Slide 5). This makes the need obvious to investors.

2

Large, well‑quantified market opportunity with a focused angle (Slide 6: $72B TAM; $10B long tail). The deck calls out fragmentation and the long tail which is playbookable.

3

Early operational traction and a pragmatic GTM plan (Slides 8–9): courier commitments, SF trials, concrete delivery targets and a phased scaling plan — demonstrates founders are testing the model in market.

Red Flags & Weaknesses

3 identified

1

Lack of unit economics and financials — no revenue, burn rate, CAC, take rate, margins or projections are presented. Investors cannot gauge profitability or capital efficiency from this deck.

2

Traction is qualitative/commitment‑based, not results‑based — the deck shows committed couriers and target delivery volumes (100/day -> 500+/day) but does not show achieved deliveries, revenue, or retention metrics.

3

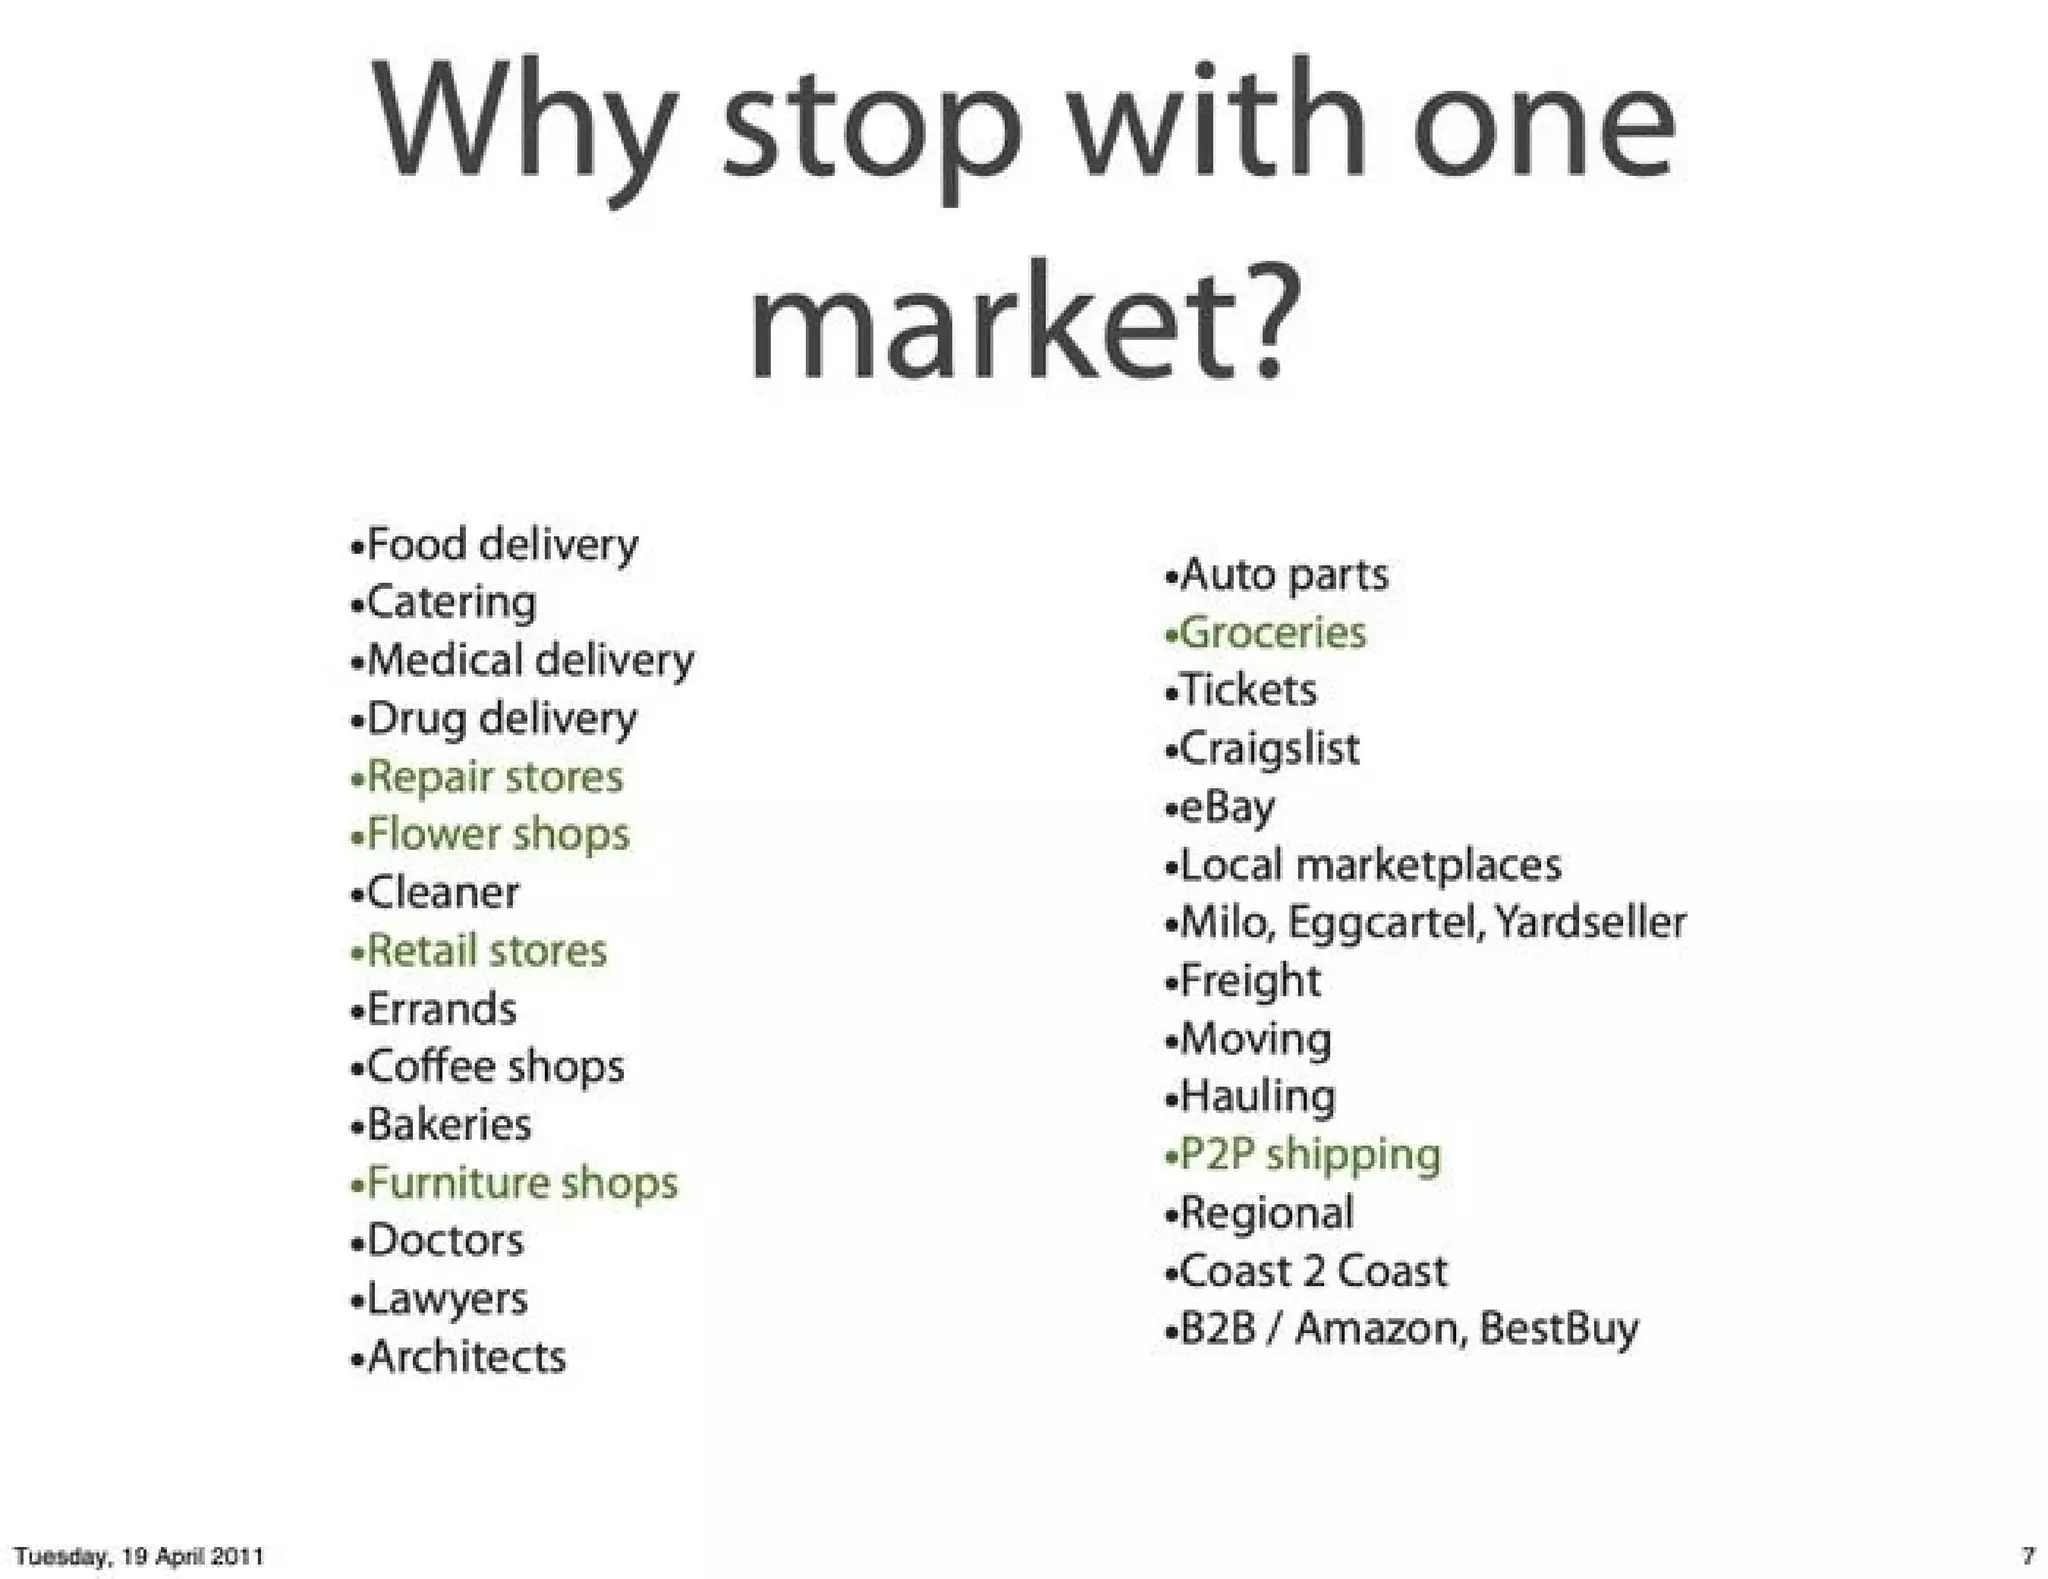
Operational & regulatory risks not addressed — no detailed plan for quality control, insurance exposure, courier onboarding standards, or legal/regulatory constraints (e.g., medical/drug delivery, liability), despite listing risky verticals (Slide 7).

More Pitch Decks To Study

Compare structure, fundraising context, and investor-facing story across similar startup decks.