Compare your deck to Pipefy

Compare Your Deck

Pipefy Pitch Deck (2015)

SaaS
Stage: Series A
Raised: $200K
Year: 2015
Slides: 9
Outcome: Valued at $1.1B after Series C (2022)

Pitch Deck

1 / 9
Pipefy pitch deck - The Opening: Clear brand and positioning
Click to expand

Deck Analysis

This pitch deck from Pipefy (Series A, 2015) presents a focused, product-first case for a SaaS workflow platform that promises to be the "easy button" for processes across departments. The slides balance simple branding, clear use-case examples (CRMs, Helpdesk, Task Management), customer-facing assets (templates) and early traction metrics to build credibility. What makes it notable is the combination of a clean visual identity, tangible product demos (template marketplace + in-app screenshots) and a concise growth slide — an effective pattern for early-stage SaaS fundraising.

The Opening: Clear brand and positioning

The Opening: Clear brand and positioning

The first slide (logo and tagline) is minimal and strong: a recognizable mark and a single, memorable positioning line — "The easy button for processes and workflows." That immediately communicates value without jargon and sets expectations for the rest of the deck. The slide uses whitespace and hierarchy well, signaling discipline and focus, traits investors expect from founding teams.

Founders can learn the power of a single, crisp positioning statement up front. If you can distill your product into one short, benefit-oriented phrase and present it with confident, uncluttered design, you prime the audience to interpret subsequent slides through that lens.

Key Takeaway: Lead with a simple, benefit-focused tagline and clean branding to frame the rest of your narrative.
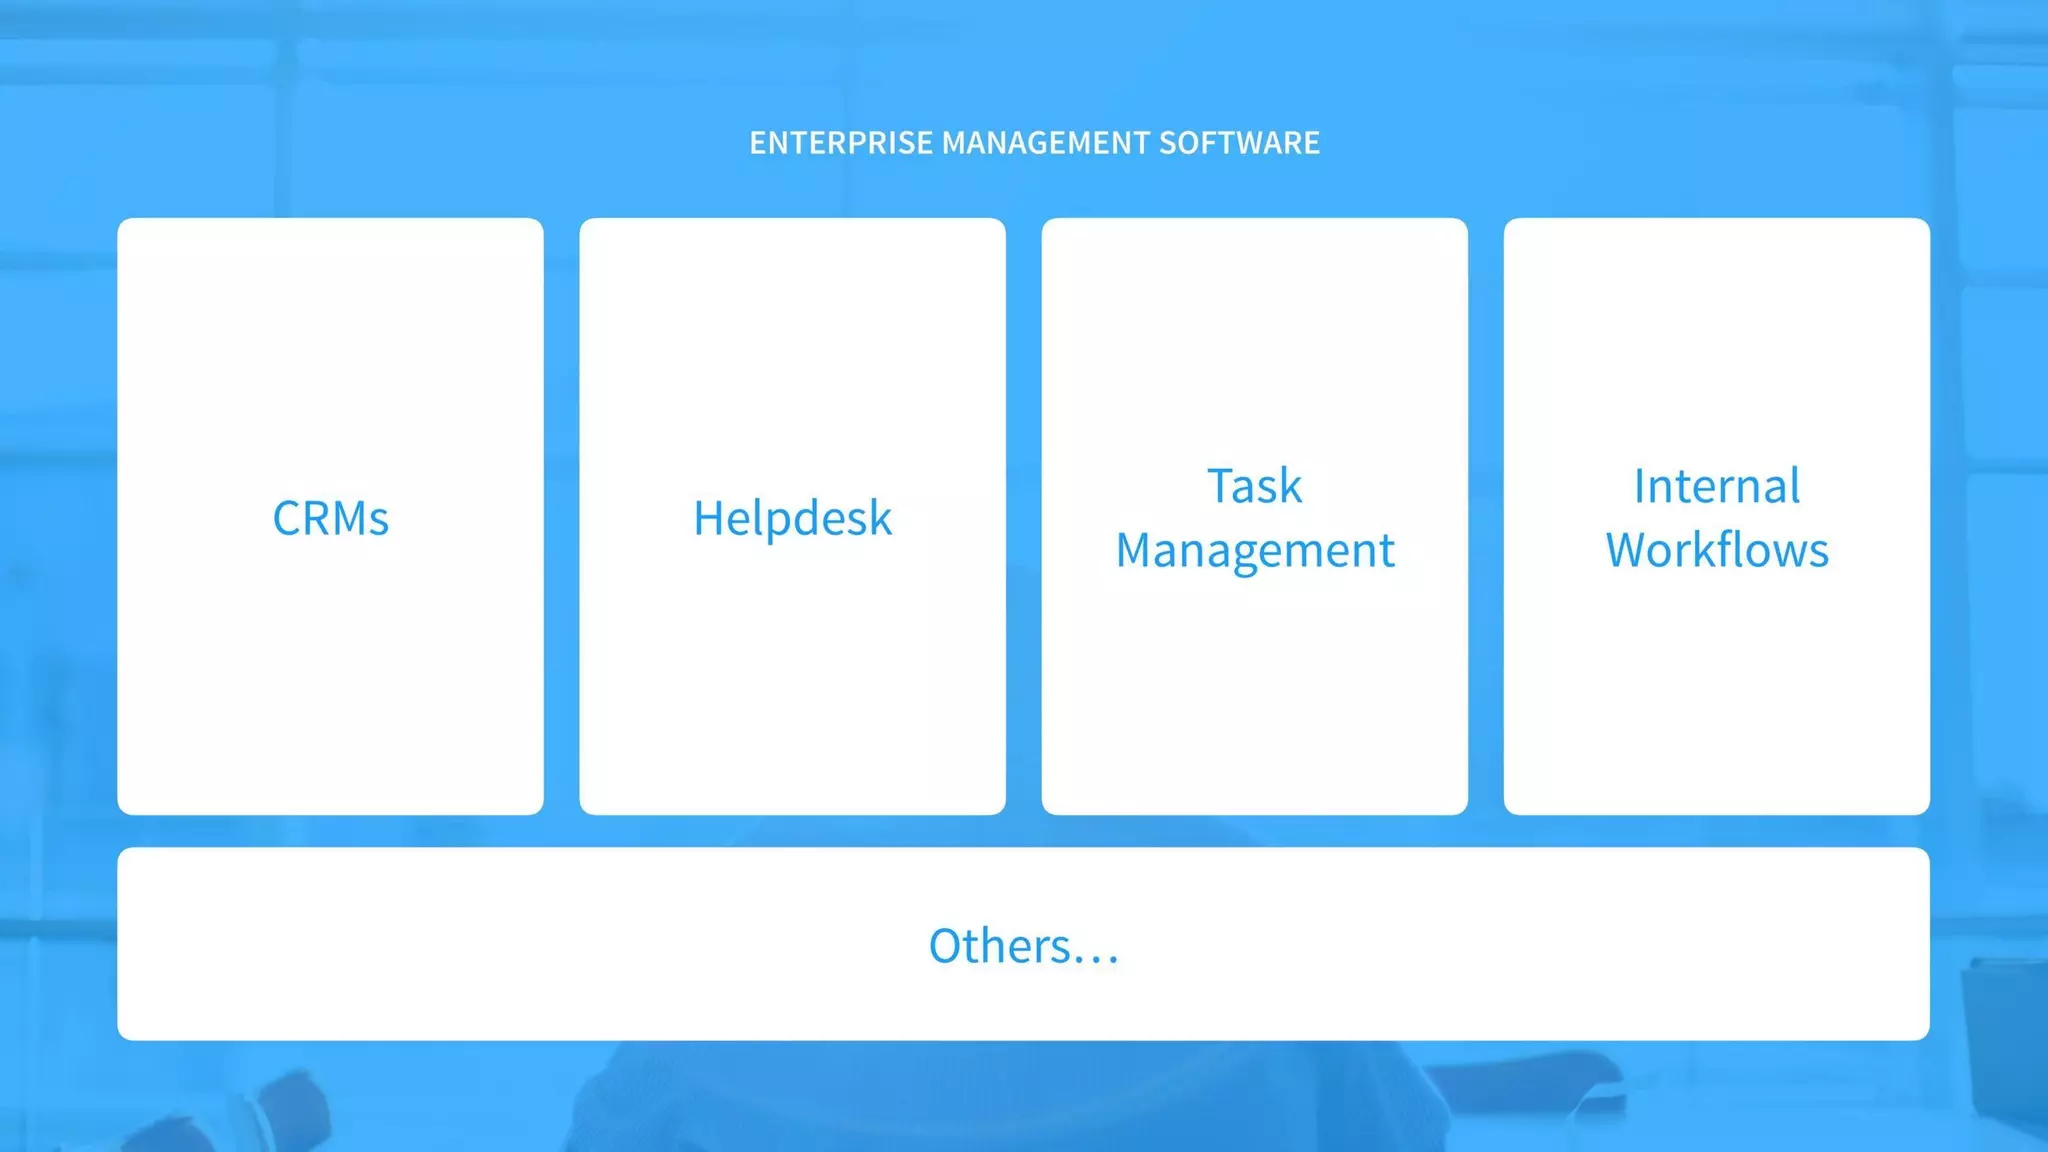
Market & use-case framing: show breadth and focus

Market & use-case framing: show breadth and focus

Slide 2 lists enterprise management categories — CRMs, Helpdesk, Task Management, Internal Workflows — visually laid out like tiles. This communicates two things simultaneously: breadth (the product is relevant across multiple enterprise functions) and specificity (these are concrete, familiar pain areas). Using large, readable labels helps investors quickly see the TAM and plausible entry points.

This structure is effective because it bridges product capability and market segmentation without heavy text: each tile is a mental anchor that can be referenced later when discussing templates, customers or go-to-market. Founders should emulate the approach of mapping your core product to a few concrete, well-known enterprise problems early in the deck.

Key Takeaway: Map your product to a small set of clear, recognizable enterprise use cases to communicate market fit and go-to-market focus.
Pain articulated through persona & costs

Pain articulated through persona & costs

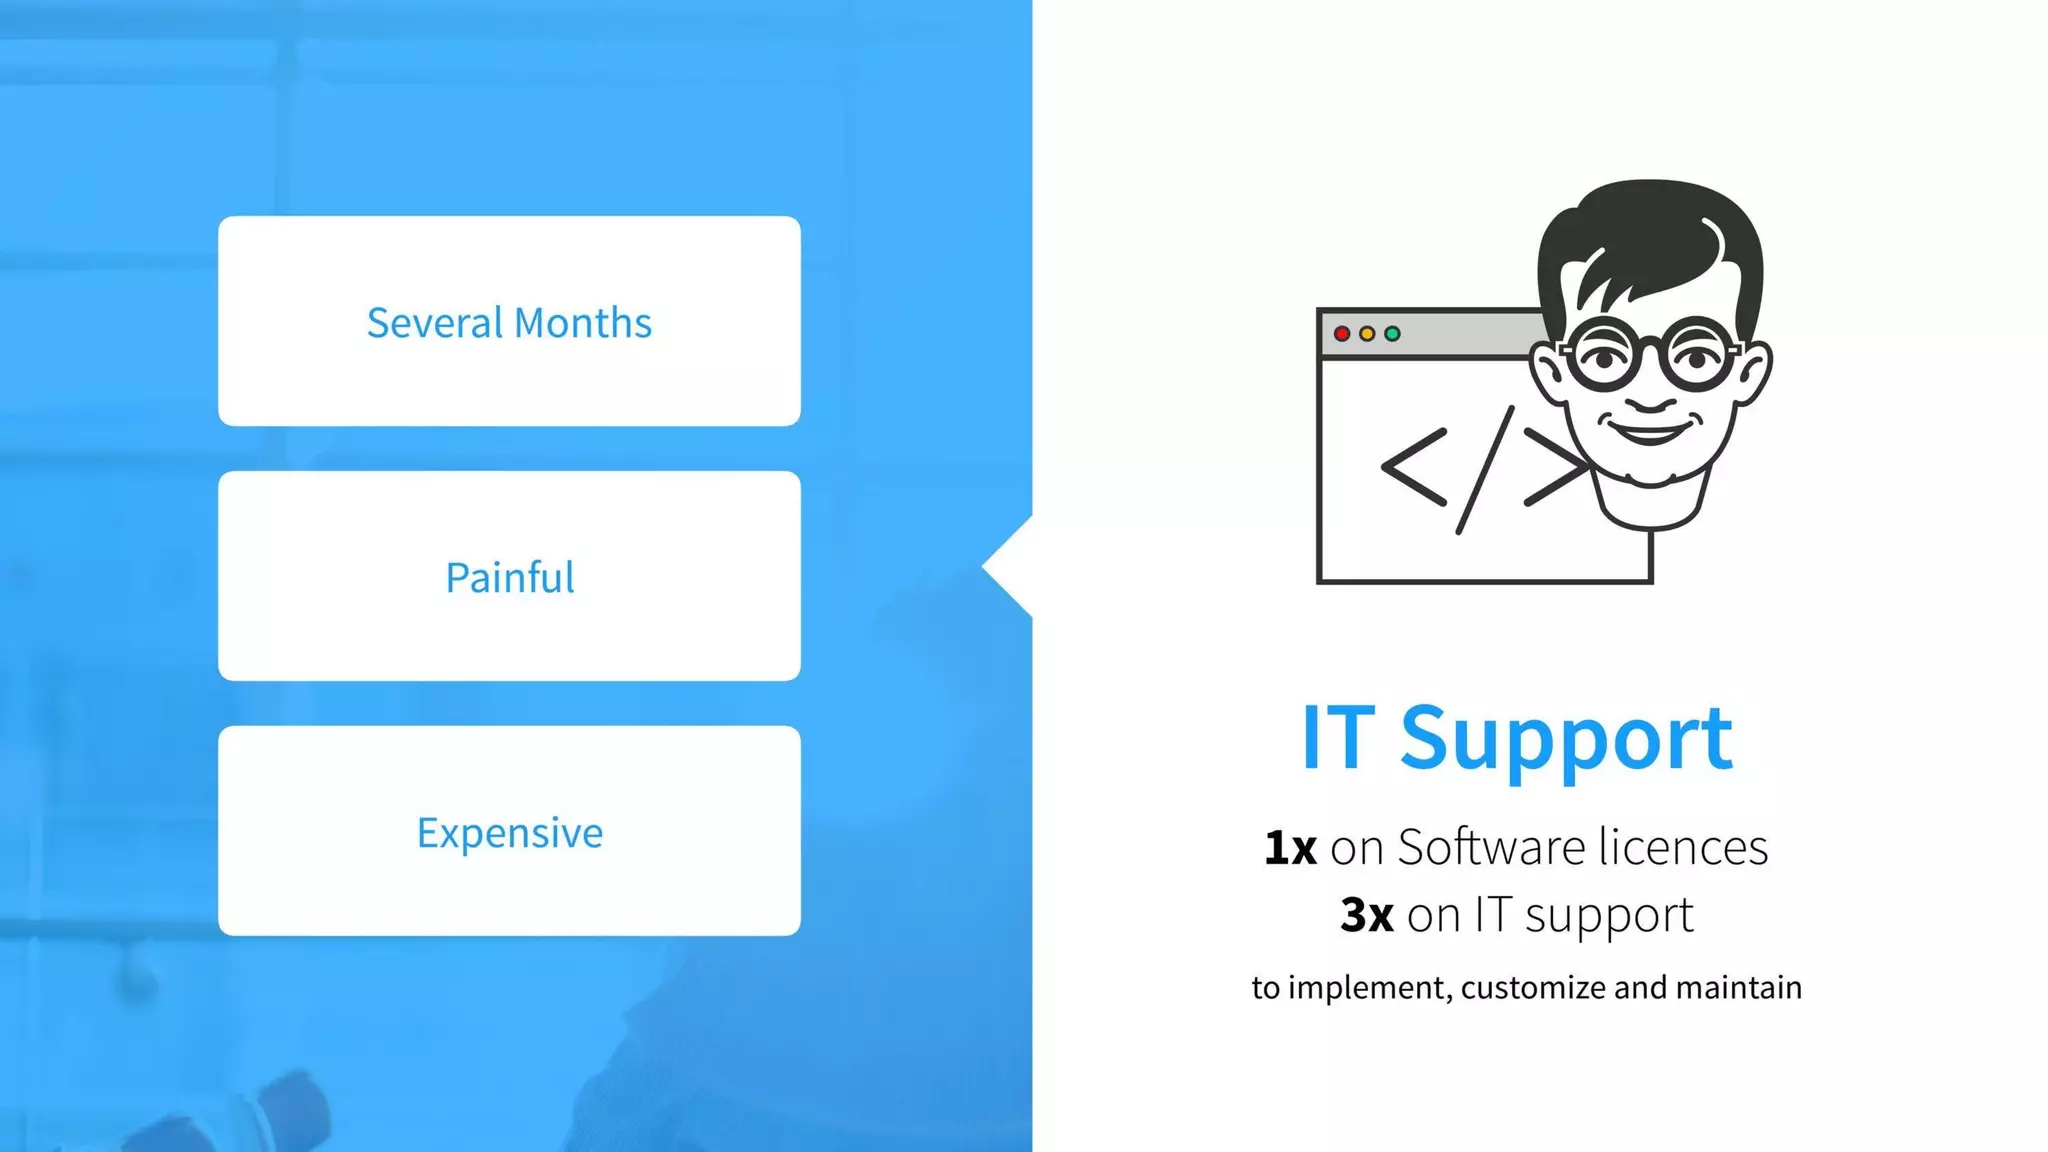
Slide 3 contrasts the left column of pain descriptors ("Several Months," "Painful," "Expensive") with an "IT Support" persona and a succinct cost claim (1x on software licences, 3x on IT support). This is an effective move: it turns abstract product value into a measurable business problem (implementation/customization costs). Pairing a persona graphic with quantitative multipliers makes the case tangible for investors who care about unit economics and cost savings.

Founders should adopt this template: identify who currently bears the pain, summarize the pain briefly, and quantify consequences using simple multipliers or percentages. That combination (persona + pain + metric) makes the problem credible and sets up your solution as economically justified.

Key Takeaway: Use a persona + short pain phrases + simple metrics to make the problem concrete and economically compelling.
Productized solutions: template marketplace as adoption lever

Productized solutions: template marketplace as adoption lever

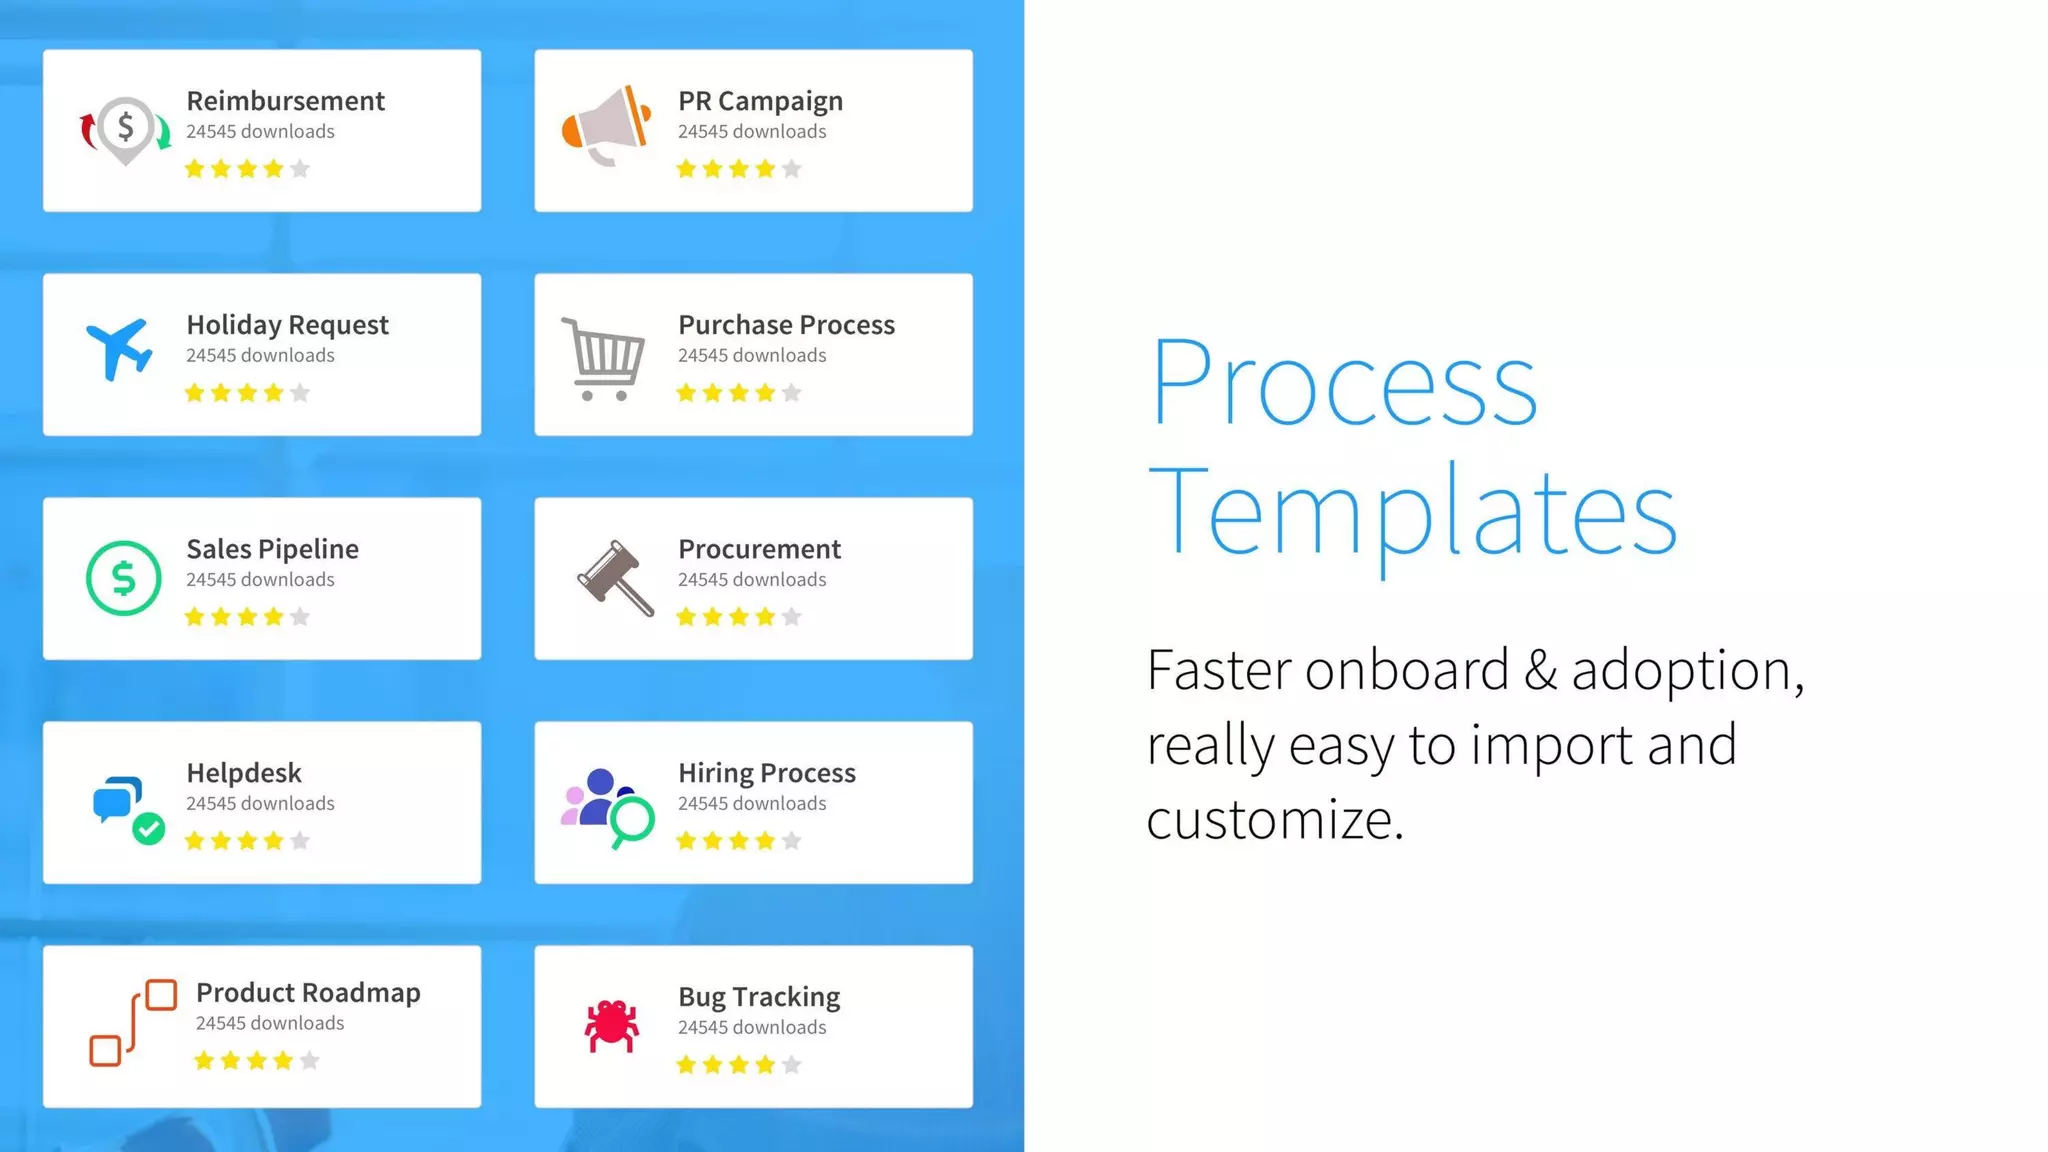
Slide 5 highlights "Process Templates" with a left-side visual grid of template cards (Reimbursement, Holiday Request, Sales Pipeline, etc.) and right-side copy that emphasizes faster onboarding and easy customization. This is a strong GTM signal: productizing common processes into importable templates lowers activation friction and improves viral adoption inside enterprises. Templates are both a product feature and a distribution mechanic because they make the value immediate for new users.

For founders, this demonstrates how thoughtful product design can amplify go-to-market: packaging workflows as templates reduces time-to-value, supports self-service growth, and creates a marketplace-like catalog that can be iterated on. When possible, show real examples of the templates customers use — it turns an abstract product capability into a concrete customer benefit.

Key Takeaway: Productize repeatable workflows (templates) to reduce activation time and create a self-service adoption channel.
Product demo + call-to-action: reducing buyer friction

Product demo + call-to-action: reducing buyer friction

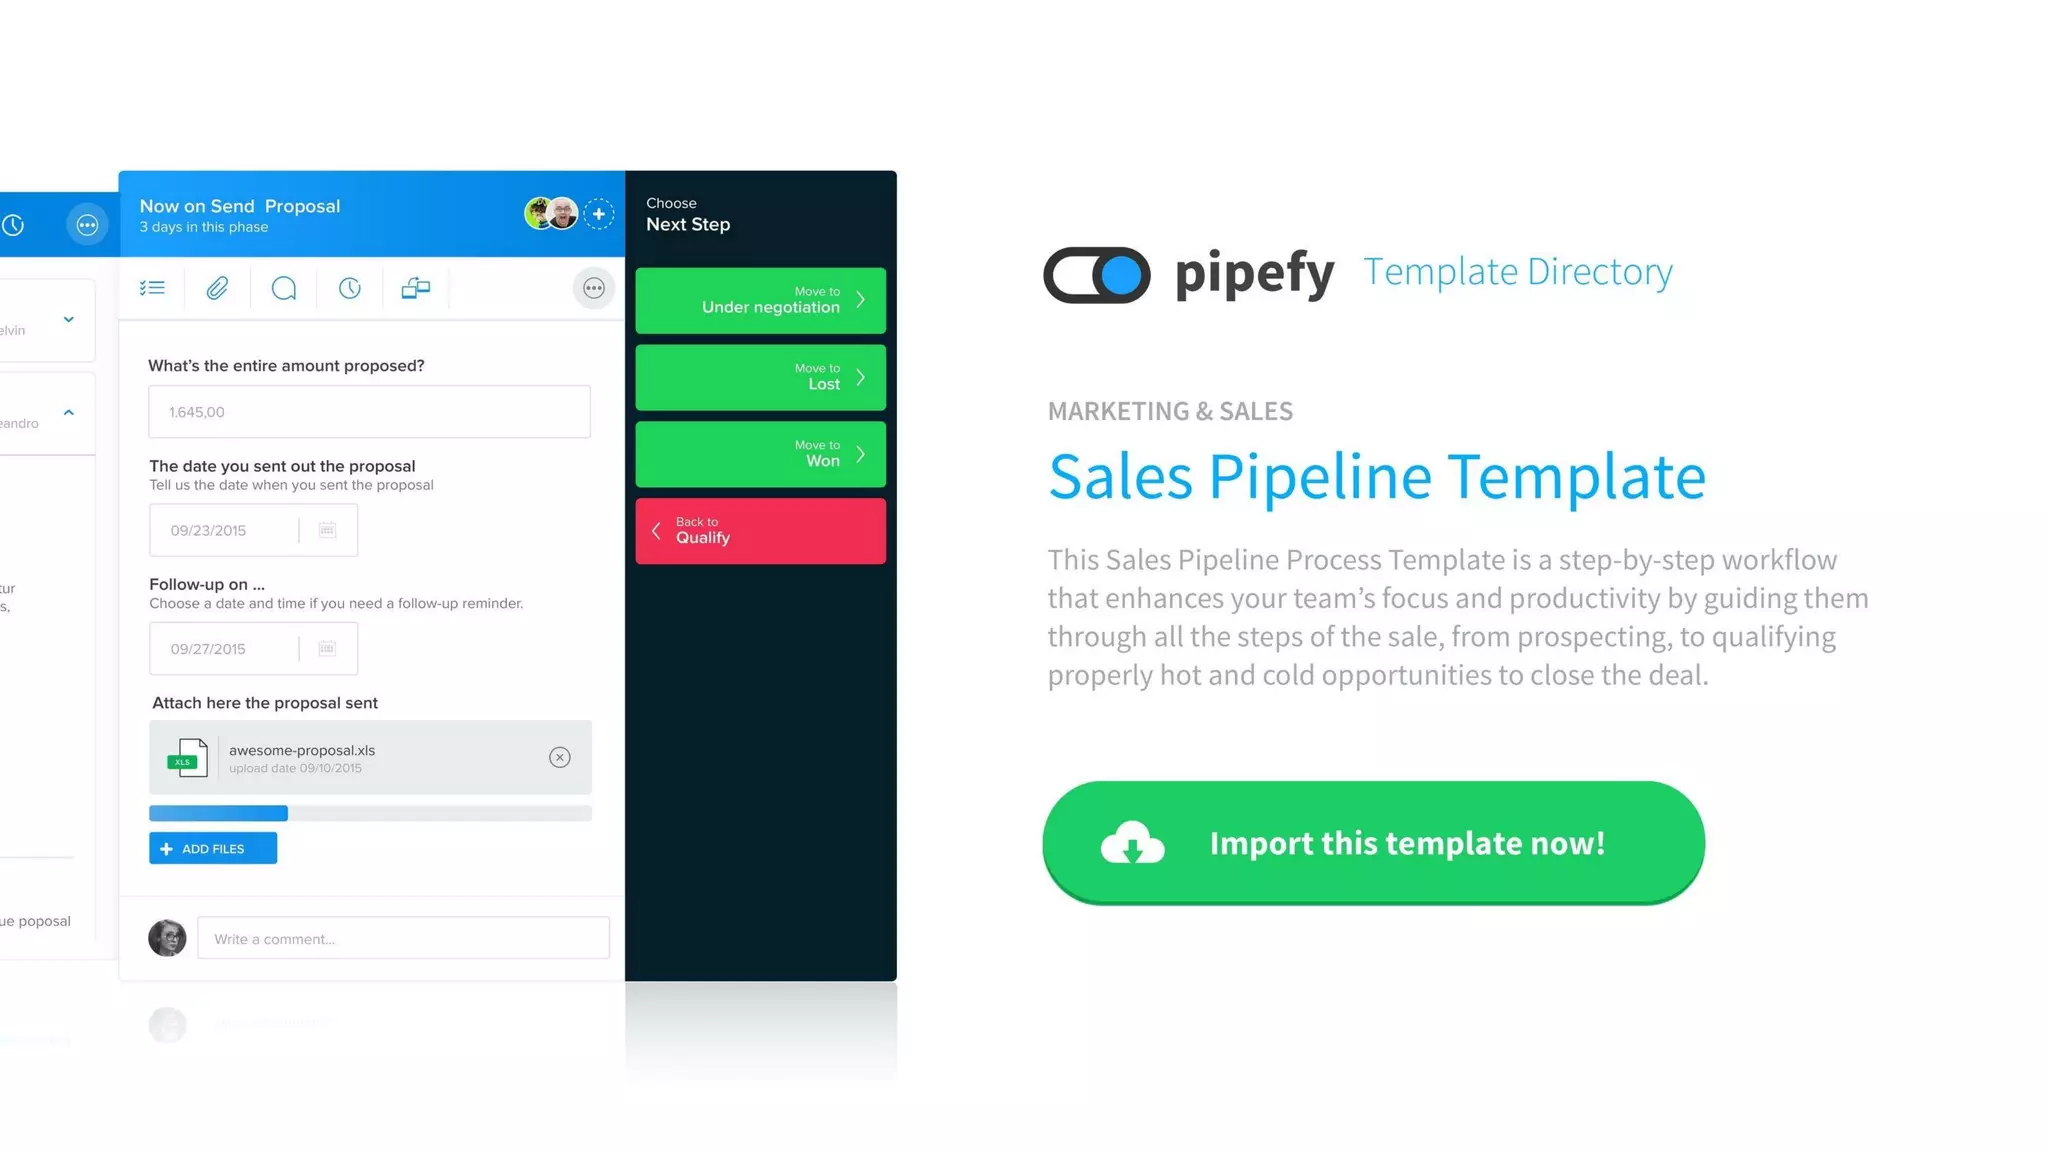
Slide 6 pairs an in-app UI screenshot with a clear call-to-action: "Import this template now!" and the label "Sales Pipeline Template." Showing the product UI alongside a simple action communicates usability and immediacy — it reassures investors that the product is real, polished, and built for doing (not just promising). The right-side copy explains the template's purpose in a customer-focused way, which is important for demonstrating product-market fit.

Founders should include at least one slide that feels like a product walk-through or CTA: a clear screenshot, a short explanation of a typical workflow, and an explicit action users can take. This converts conceptual claims about ease-of-use into observable evidence and can be a strong complement to traction metrics.

Key Takeaway: Include a short product demo or in-app screenshot with a clear CTA to show usability and reduce buyer/investor skepticism.
Traction & logos: concise growth storytelling

Traction & logos: concise growth storytelling

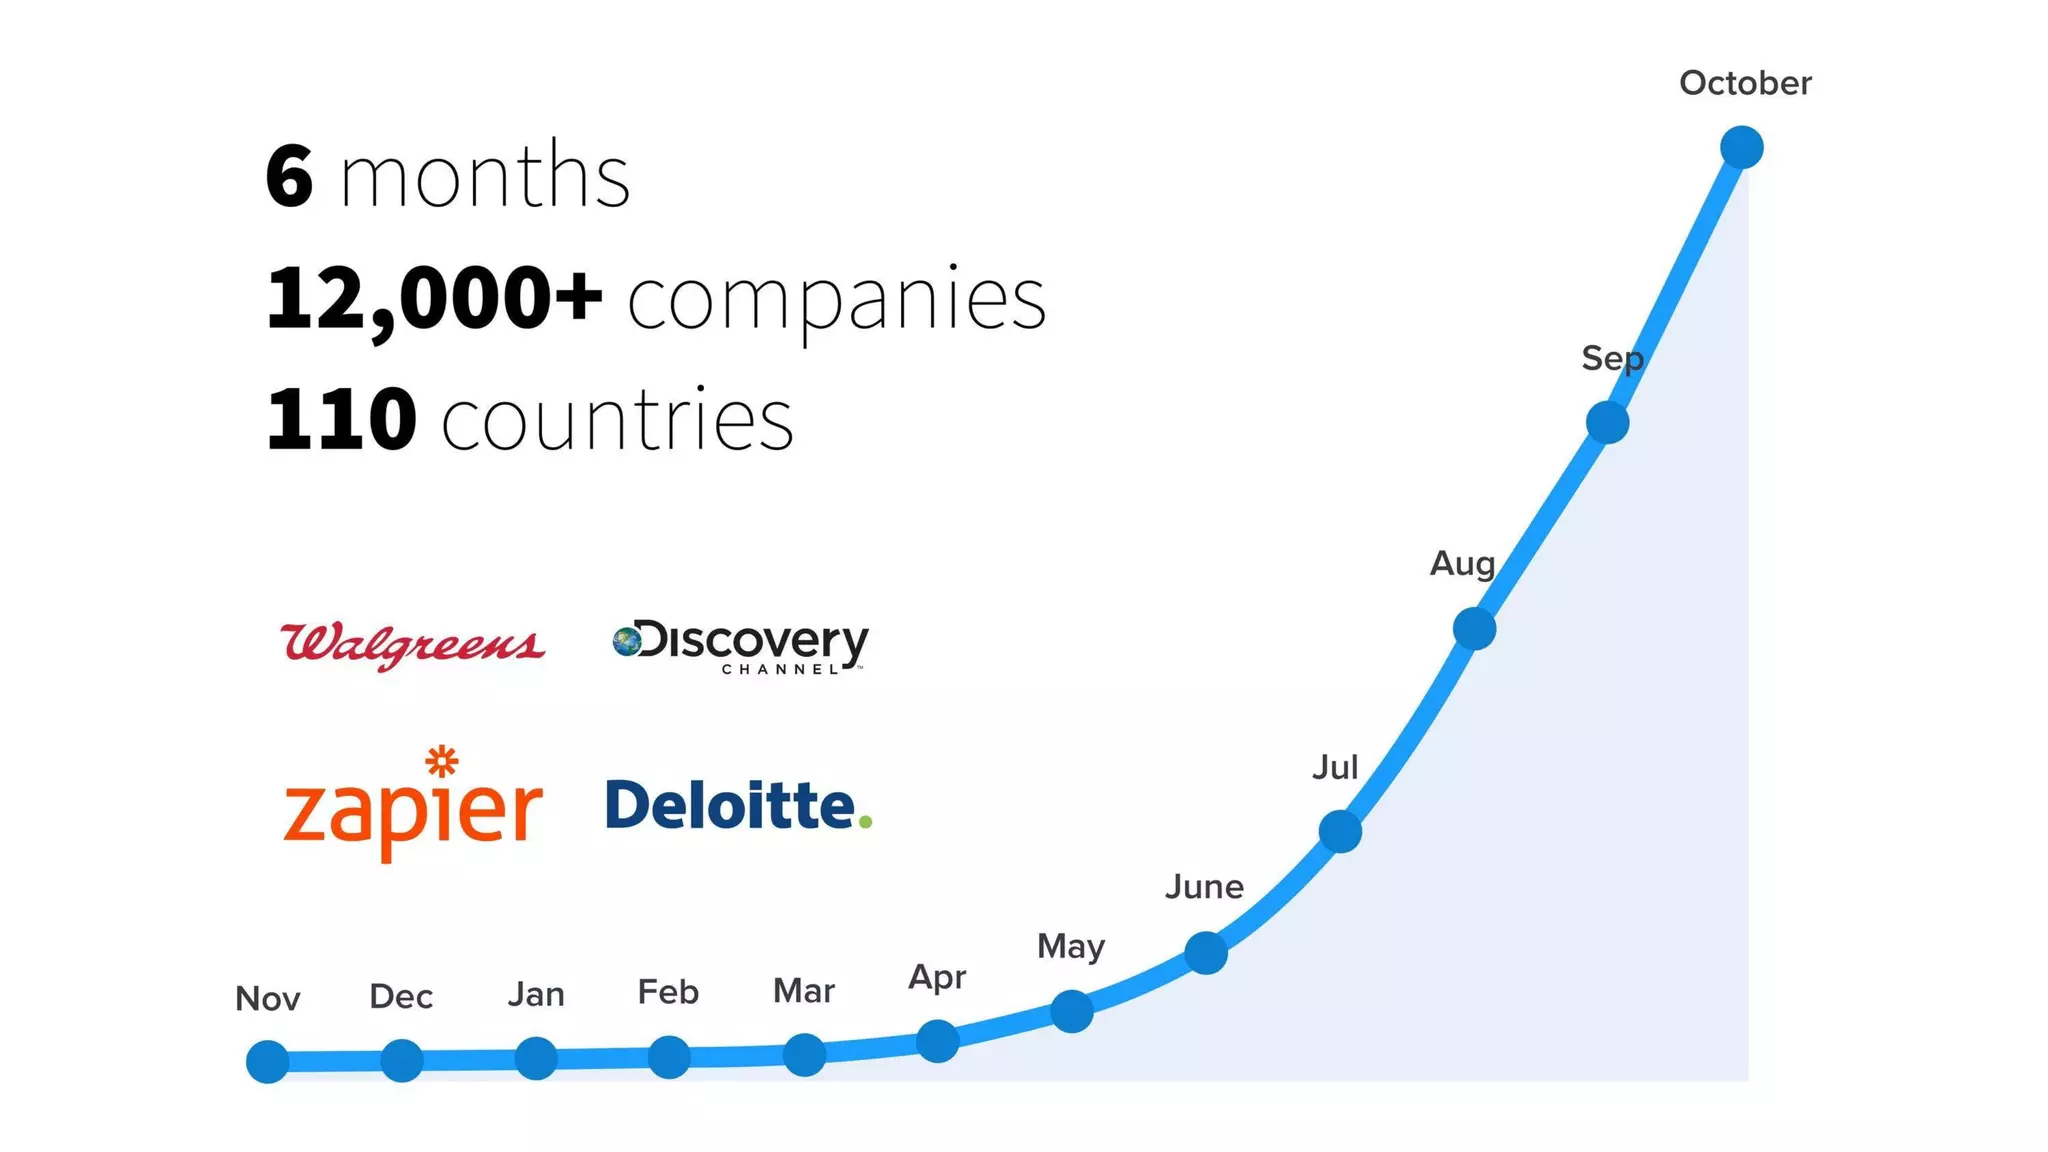
Slide 7 presents fast growth metrics (6 months, 12,000+ companies, 110 countries) alongside an ascending monthly-chart and recognizable customer/integration logos (Walgreens, Discovery, Zapier, Deloitte). This is classic, high-impact traction evidence: raw numbers paired with visual momentum and social proof. The timeline graph communicates velocity, while logos provide credibility and signal enterprise viability.

The slide works because it’s simple and layered — a viewer can immediately read the headline metrics, then scan the graph for growth shape, and finally absorb logos as validation. Founders should emulate this layering: lead with headline metrics, add a simple visual of growth (line or bars), and sprinkle trusted logos to increase credibility.

Key Takeaway: Combine headline metrics, a simple growth chart, and a few trusted logos to convey rapid traction and social proof efficiently.

Conclusion: Key Lessons

Pipefy's Series A deck is a strong example of product-led SaaS storytelling: it opens with a concise brand promise, maps the product to clear enterprise use cases, quantifies pain for a specific persona, demonstrates product depth via templates and in-app screenshots, and closes with crisp traction metrics and logos. The deck uses visual hierarchy, minimal text, and concrete examples to move the investor from problem to product to proof quickly.

Actionable advice for founders: (1) lead with a single, benefit-driven positioning line; (2) show specific use cases and personas early; (3) quantify the pain in simple, relatable metrics; (4) demonstrate the product (screenshots, templates, CTAs) to lower skepticism; and (5) present headline traction plus a simple growth chart and logos for credibility. Keep slides focused, visually clean, and oriented toward immediacy — make it trivial for investors to understand the problem, the solution, and the evidence in under a minute per slide.

Full Deck Analysis

11 sections

Overview

Company: Pipefy
Round: Series A ($200K)
Year: 2015
Outcome: Valued at $1.1B after Series C (2022)

Executive Summary

This 9‑slide Series A deck presents Pipefy as a no‑code/process orchestration SaaS that removes heavy IT dependency for internal workflows by offering ready‑to‑import process templates and a simple UI. The deck is notable for extremely crisp product positioning, very early high‑velocity traction (12,000+ companies in 6 months), and a founder team with relevant enterprise systems experience.

Problem Statement

How the deck articulates the problem:

  • Slide 3 clearly frames enterprise software rollouts as slow and costly: three short statements on the left read “Several Months,” “Painful,” and “Expensive.”
  • The same slide quantifies the IT burden on the right: “IT Support — 1x on Software licences, 3x on IT support to implement, customize and maintain.”
  • Slide 2 reinforces the domain: many enterprise functions (CRMs, Helpdesk, Task Management, Internal Workflows) need better, lighter tooling.
    Overall: the problem is that businesses need workflow/process solutions but traditional options require lengthy, expensive IT‑heavy implementations.

Solution

How the deck positions the solution:

  • Positioning/tagline (Slide 1 & 4): “The easy button for processes and workflows.” Simple, memorable positioning for a no‑code/process platform.
  • Product approach (Slides 5–6): a Template Directory with many ready templates (Reimbursement, Holiday Request, Sales Pipeline, Helpdesk, Hiring, Bug Tracking, etc.) and an “Import this template now!” CTA — implying fast, self‑serve adoption.
  • Product UI (Slide 6): screenshot of the workflow interface, showing steps/actions and an easy next‑step workflow, highlighting low friction customization.

Market Opportunity

TAM/SAM/SOM analysis — what the deck shows and what is missing:

  • The deck does not provide explicit TAM, SAM, or SOM numeric estimates.
  • Indirect signals of market breadth:
    • Slide 2 lists multiple vertical use‑cases (CRMs, Helpdesk, Task Management, Internal Workflows) implying a broad enterprise process market.
    • Slide 7 shows reach: “12,000+ companies” across “110 countries” in “6 months” — strong demand signal across geographies and use cases.
      Takeaway: Market sizing is implied via product scope and early adoption, but no formal TAM/SAM/SOM is provided.

Business Model

Revenue model and unit economics (what’s shown and inferred):

  • The deck does not show explicit pricing, ARR/MRR, churn, LTV, CAC, or unit economics.
  • Implied model: SaaS subscription (cloud product with templates), self‑serve onboarding + enterprise adoption (logos shown). Potential additional revenue from enterprise licenses or managed implementation, but not specified.
  • No explicit monetization or pricing details on slides.

Traction & Metrics

Growth metrics and proof points with specific numbers:

  • Slide 7 (headline traction): in 6 months Pipefy reached “12,000+ companies” in “110 countries”.
  • Slide 7 includes recognizable customer logos: Walgreens, Discovery Channel, Zapier, Deloitte — used to imply enterprise/customer validation.
  • Template tiles (Slide 5) show “24545 downloads” (repeated across templates) — suggests strong template adoption/download counts (note: this number looks like a placeholder or repeated stat).
  • Growth chart on Slide 7 shows a steep acceleration from May → Oct, indicating viral/compound adoption over months.
    What’s missing: financial metrics (MRR/ARR), conversion rates, engagement/retention/usage stats.

Competitive Positioning

How they differentiate:

  • Simplicity and speed: “easy button” + importable templates for fast onboarding (Slides 1, 5, 6).
  • Reduces IT dependency and implementation time/cost (Slide 3’s “1x license / 3x IT support” problem statement).
  • Template marketplace / directory acts as both product and distribution channel (Slides 5–6).
  • Visual, product‑led growth approach contrasts with traditional enterprise ERP/BPM implementations.

Team

Team credentials shown on slides:

  • Slide 8 lists founders:
    • Alessio Silva Alionço — labeled as having a “Previous Successful Exit” (and appears as CEO on Slide 9 with contact).
    • Leandro Johann — “+20 years on ERP & BPM & CRM (Microsoft + Salesforce + TOTVS)” — deep domain expertise in enterprise systems.
  • Team presentation is concise and emphasizes relevant experience and a prior exit.

Go-to-Market Strategy

Distribution approach as shown or implied:

  • Product‑led growth: template directory with “Import this template now!” (Slide 6) implies self‑serve onboarding and viral distribution through templates.
  • Marketplace/templates as acquisition hook (Slide 5 shows many templates and download counts).
  • Enterprise logos (Slide 7) imply inbound enterprise customer acquisition and/or sales to larger accounts, but no explicit GTM playbook or sales motion described.

The Ask

What they were raising and use of funds:

  • Round: Series A, amount shown in context provided: $200K.
  • The deck does not present a slide breaking down use of funds or runway allocation (no line items for hiring, engineering, marketing, sales, etc.).

Investor Deep Dive

Executive summary, strengths & red flags

Executive Summary

This 9‑slide Series A deck presents Pipefy as a no‑code/process orchestration SaaS that removes heavy IT dependency for internal workflows by offering ready‑to‑import process templates and a simple UI. The deck is notable for extremely crisp product positioning, very early high‑velocity traction (12,000+ companies in 6 months), and a founder team with relevant enterprise systems experience.

Key Strengths

3 identified

1

Clear, memorable positioning — “The easy button for processes and workflows” (Slides 1 & 4). The tagline immediately conveys value and differentiator.

2

Exceptional early traction — “12,000+ companies” in “6 months” across “110 countries” plus household logos (Slide 7) is a compelling validation signal for investors.

3

Strong founder credentials for an enterprise workflow product — a prior exit and deep ERP/CRM/BPM experience (Slides 8–9) increase investor confidence in execution.

Red Flags & Weaknesses

3 identified

1

No financials or unit economics — missing MRR/ARR, CAC, LTV, gross margin, churn or runway. Investors would want these before committing.

2

No explicit market sizing (TAM/SAM/SOM) or go‑to‑market KPIs — the deck shows adoption but does not connect to a quantifiable market opportunity or clear TAM assumptions.

3

Ambiguities in metrics and customer validation — numbers like “24545 downloads” are repeated across templates (Slide 5) and may look like placeholders; customer logos are shown with no context (contract size, use case, or references).

More Pitch Decks To Study

Compare structure, fundraising context, and investor-facing story across similar startup decks.