Compare your deck to Pendo

Compare Your Deck

Pendo Pitch Deck (2015)

SaaS
Stage: Series A
Raised: $11M
Year: 2015
Slides: 24
Outcome: Valued at $2.6B (2021)

Pitch Deck

1 / 24
Pendo pitch deck - The Opening: Clear brand and purpose
Click to expand

Deck Analysis

This pitch deck from Pendo (Series A, 2015) presents a concise, product-led SaaS story: capture user behavior inside web apps, deliver contextual guidance and feedback, and convert that signal into product and revenue growth. The deck pairs a clear market thesis (digital transformation + subscription economy) with product screenshots, customer examples, and early growth metrics. What makes it notable is the consistent thread from data capture to actionable product experience — a simple technical hook (a small JS snippet) that enables multiple value drivers (analytics, guides, feedback) and a GTM that leans on product-qualified leads.

The Opening: Clear brand and purpose

The Opening: Clear brand and purpose

The cover slide (bold Pendo branding and the title “Pendo Overview”) establishes a confident identity and sets the tone for a product-focused deck. It’s visually strong, instantly communicates the company name, and positions the deck as an investor presentation (Series B label on the cover in this version), which signals maturity and progress.

Key Takeaway: Start with a clear, branded cover that states what you are and the purpose of the deck — it builds immediate credibility.
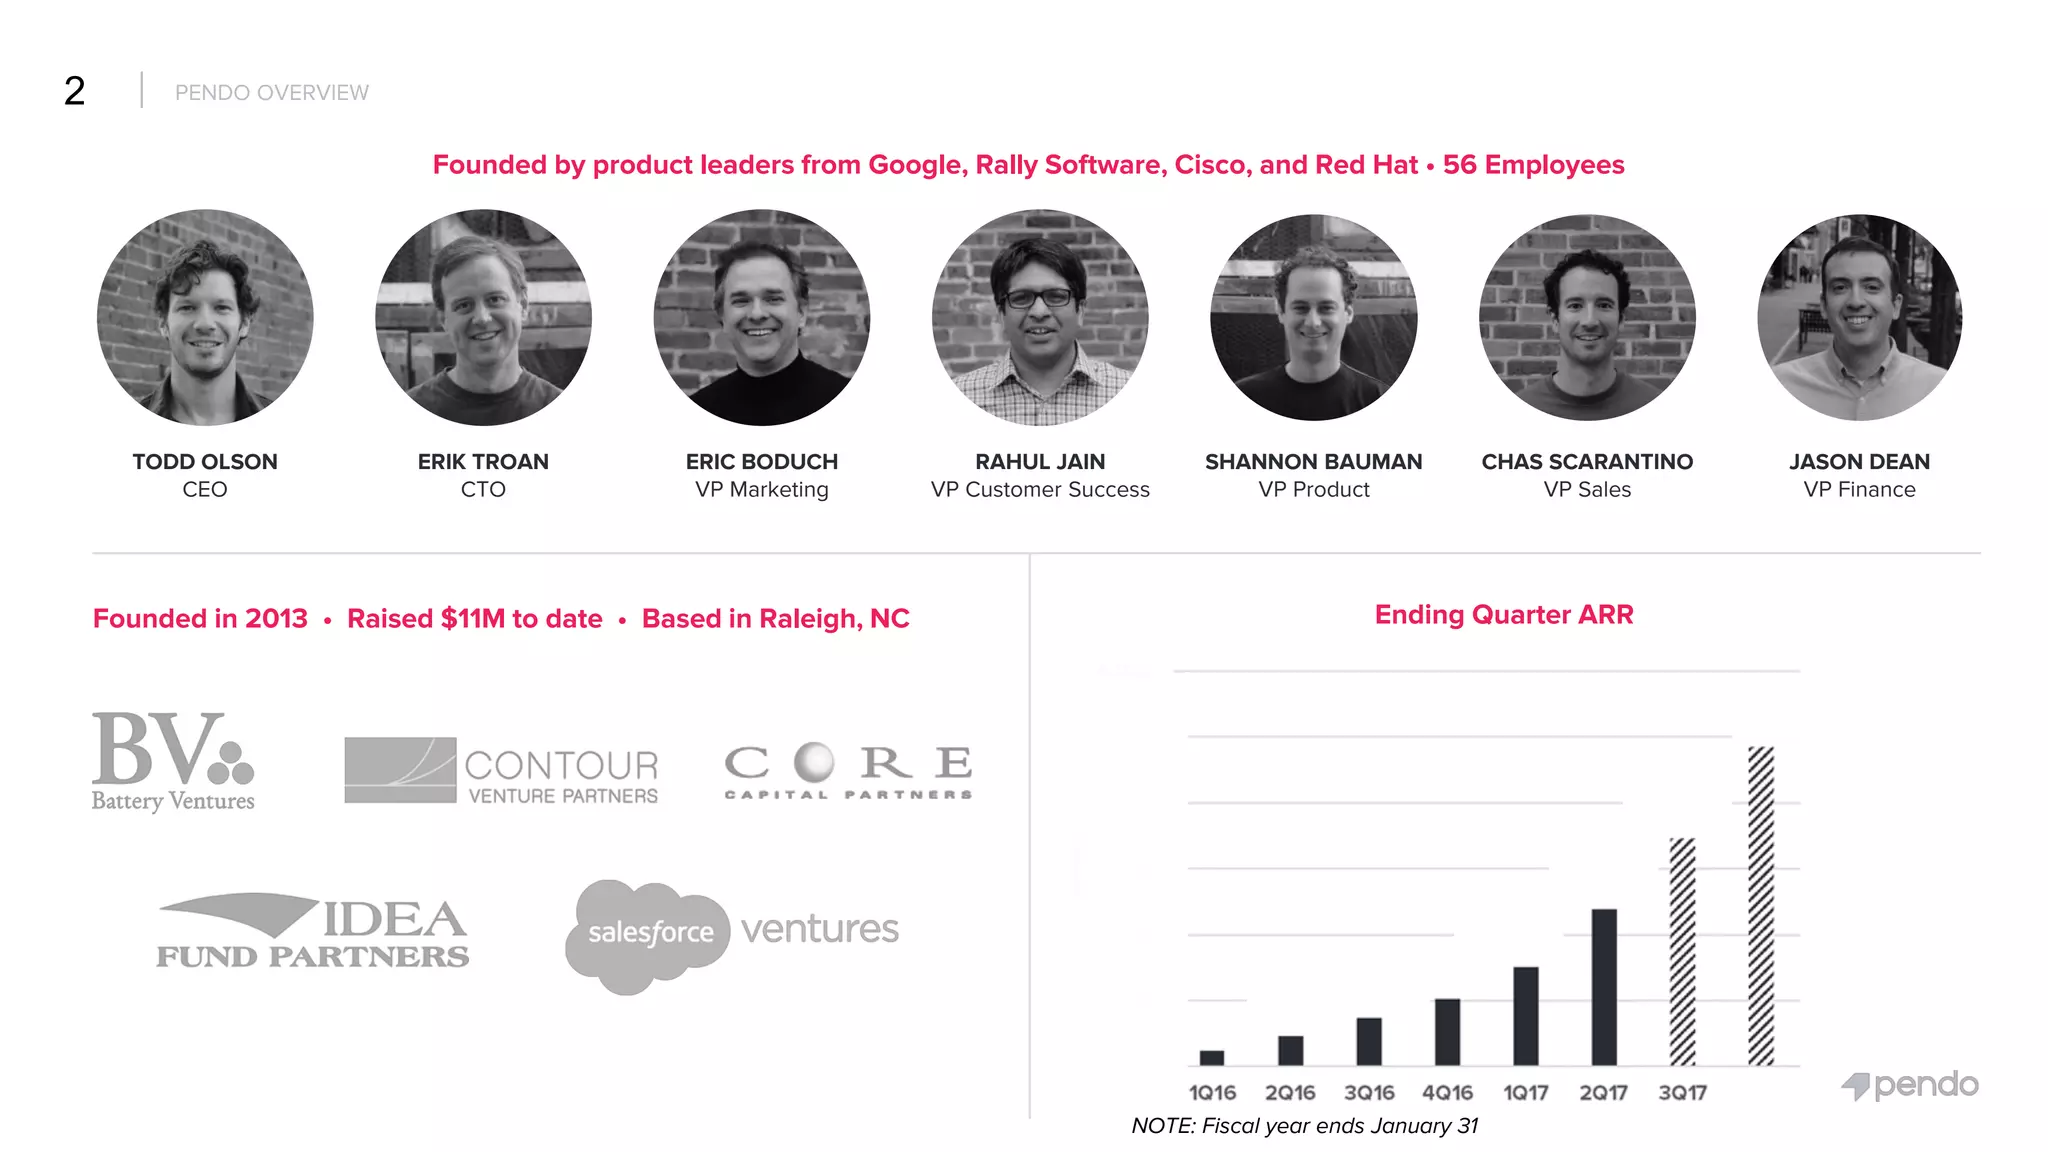
Team & Traction: Credibility through founders and early metrics

Team & Traction: Credibility through founders and early metrics

Slide 2 combines founder portraits, titles, investor logos, and a simple ARR growth chart — a compact way to convey people, capital, and momentum. Highlighting founders from credible companies (Google, Cisco, Red Hat) plus known investors reduces risk perception for investors and shows the team can execute. The slide also succinctly notes employee count and fundraising to date, anchoring the ask in context.

Key Takeaway: Use one slide to show founders’ pedigree, investor support, and a simple traction visual — it accelerates investor trust and frames the rest of the narrative.
Market Thesis: Explain the macro trend you're exploiting

Market Thesis: Explain the macro trend you're exploiting

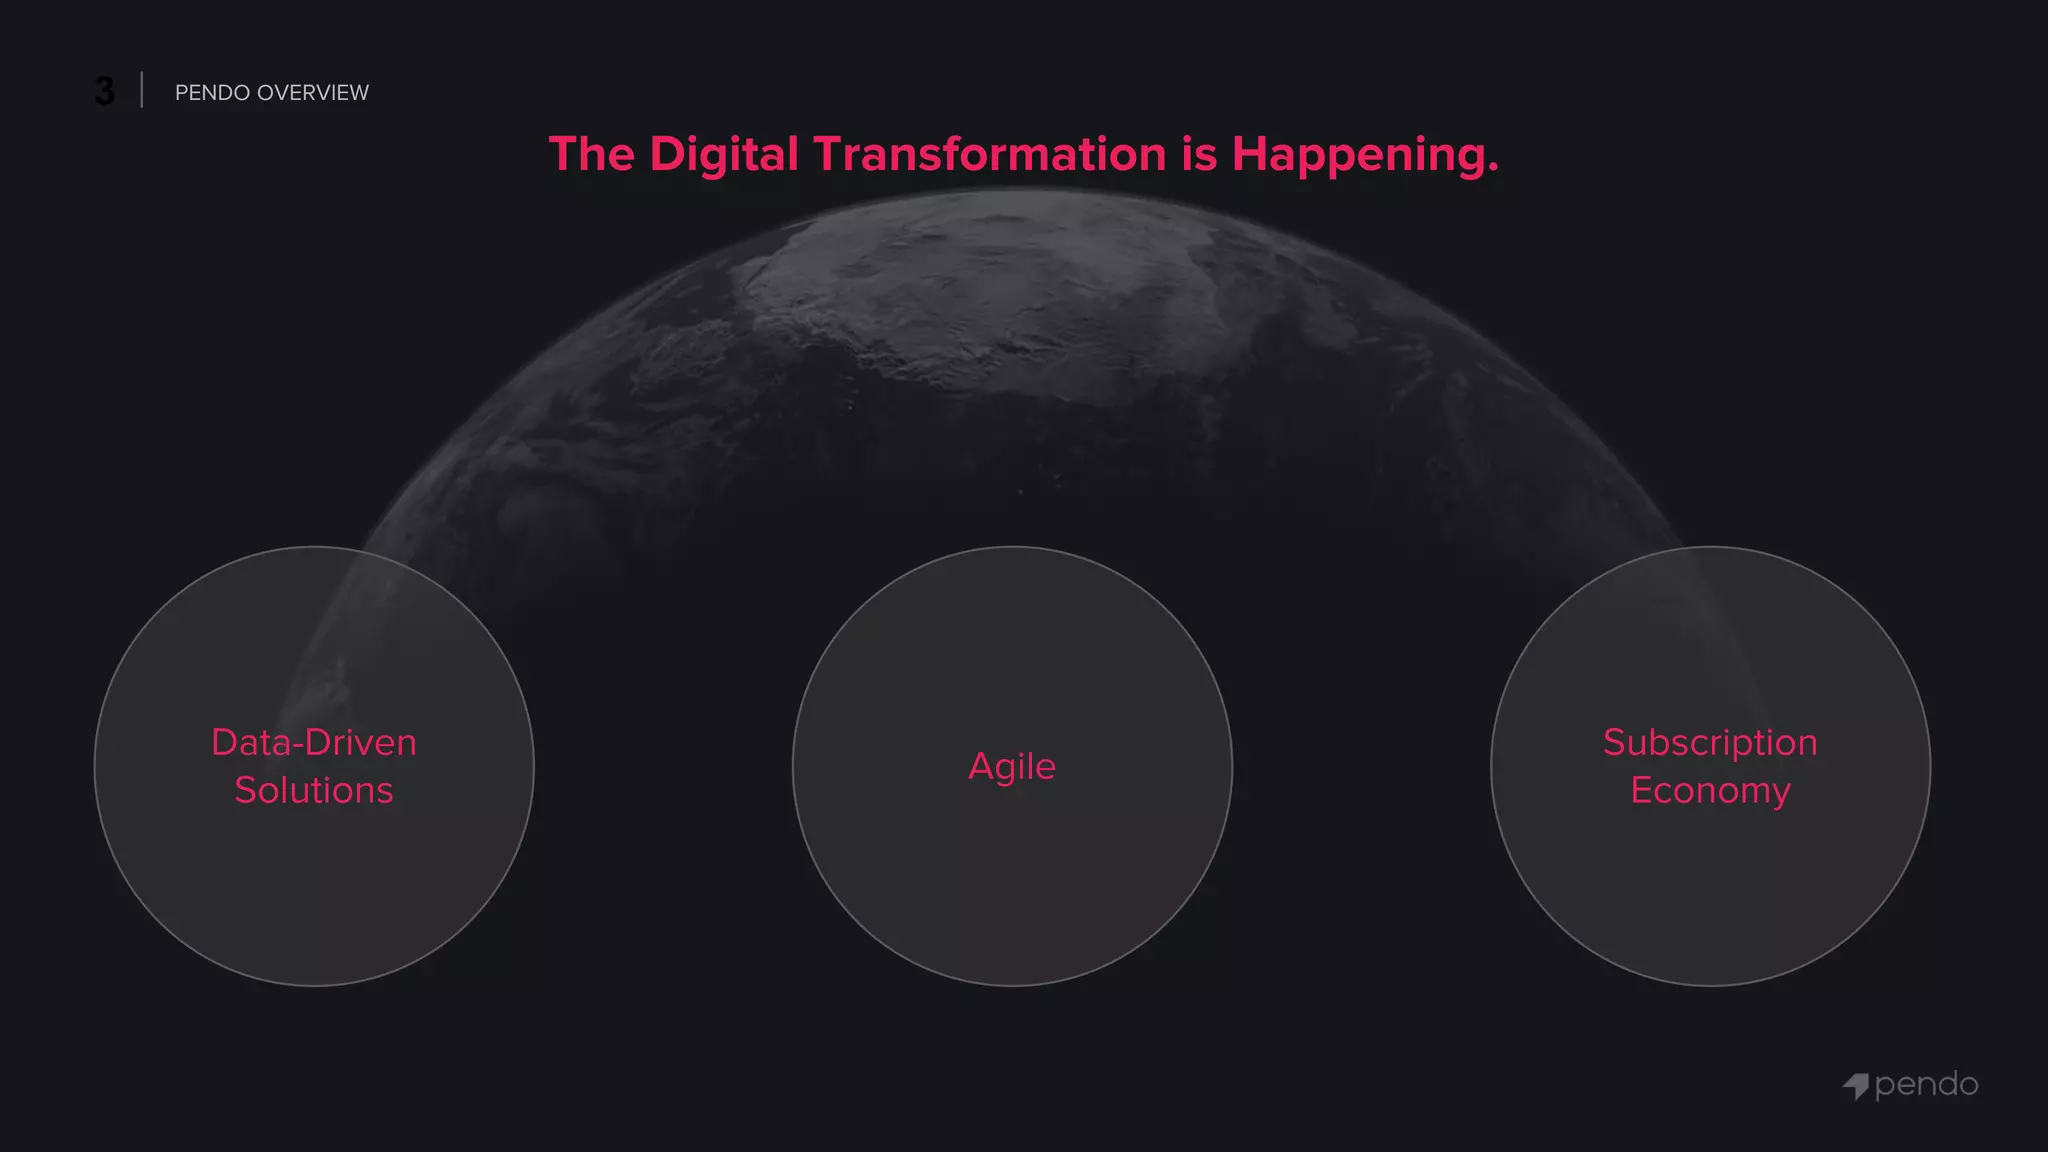
Slide 3 articulates the core market drivers: data-driven solutions, agile development, and the subscription economy. This is a concise and effective framing — it ties product-level benefits to larger industry shifts, making the opportunity easier to quantify and defend. The visual of the globe and three circles keeps the message high-level while still specific enough to be meaningful.

Key Takeaway: Connect your product to 2–3 clear macro trends so investors can quickly see why demand will scale.
Product: Clear positioning and examples of value

Product: Clear positioning and examples of value

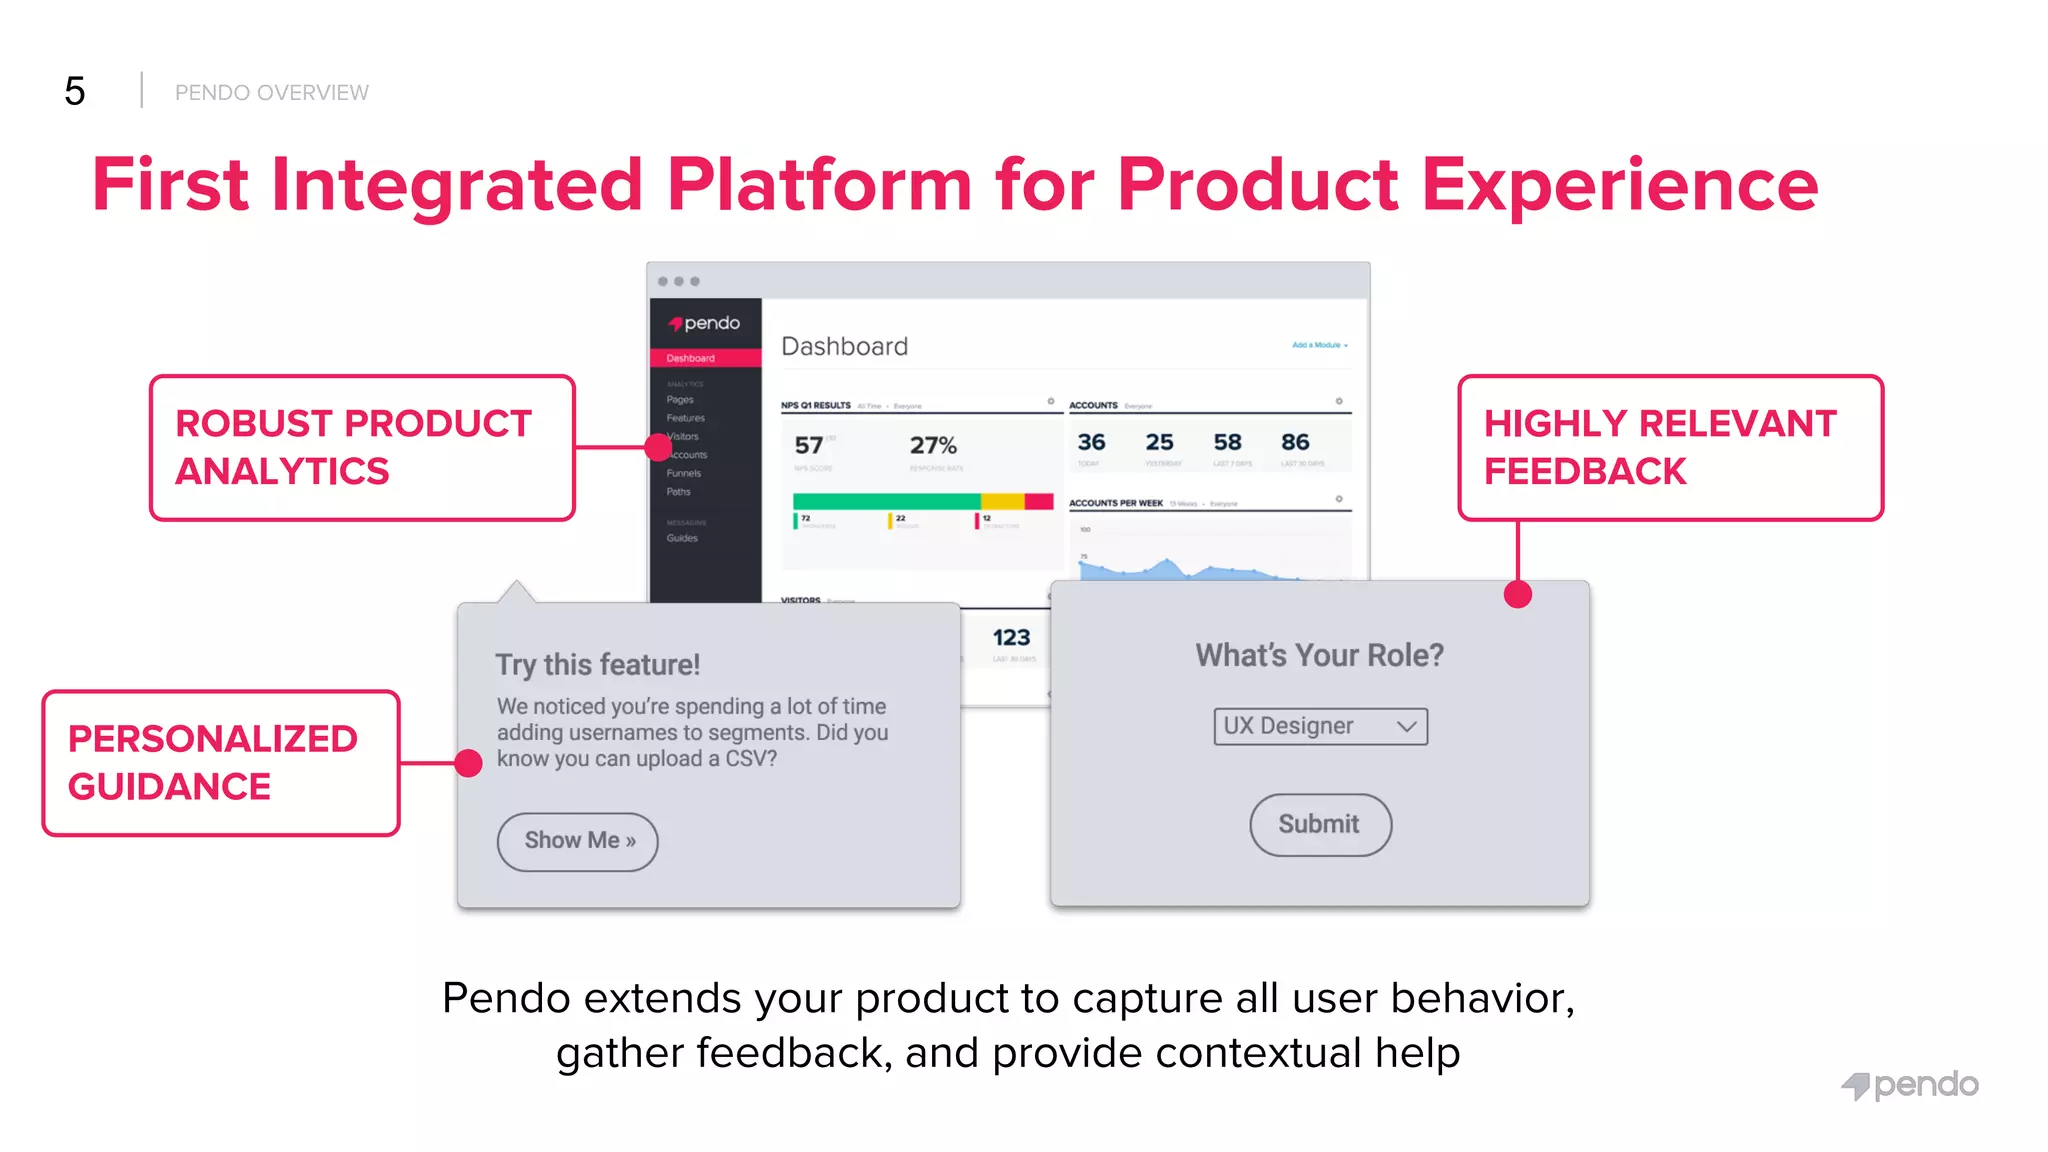
Slide 5 outlines Pendo’s product in a single frame: analytics, personalized guidance, and relevant feedback. The combination of a dashboard screenshot with in-app modal examples makes the offering tangible — investors can see the UI and immediately understand how the product sits in the customer stack. The copy is benefit-first and succinct: it explains how Pendo captures behavior and then uses it to inform and engage users without heavy engineering effort.

Key Takeaway: Demonstrate product value through a mix of UI screenshots and short benefit-driven captions — show how features translate into customer outcomes.
Data-first Foundation: How the product technically delivers value

Data-first Foundation: How the product technically delivers value

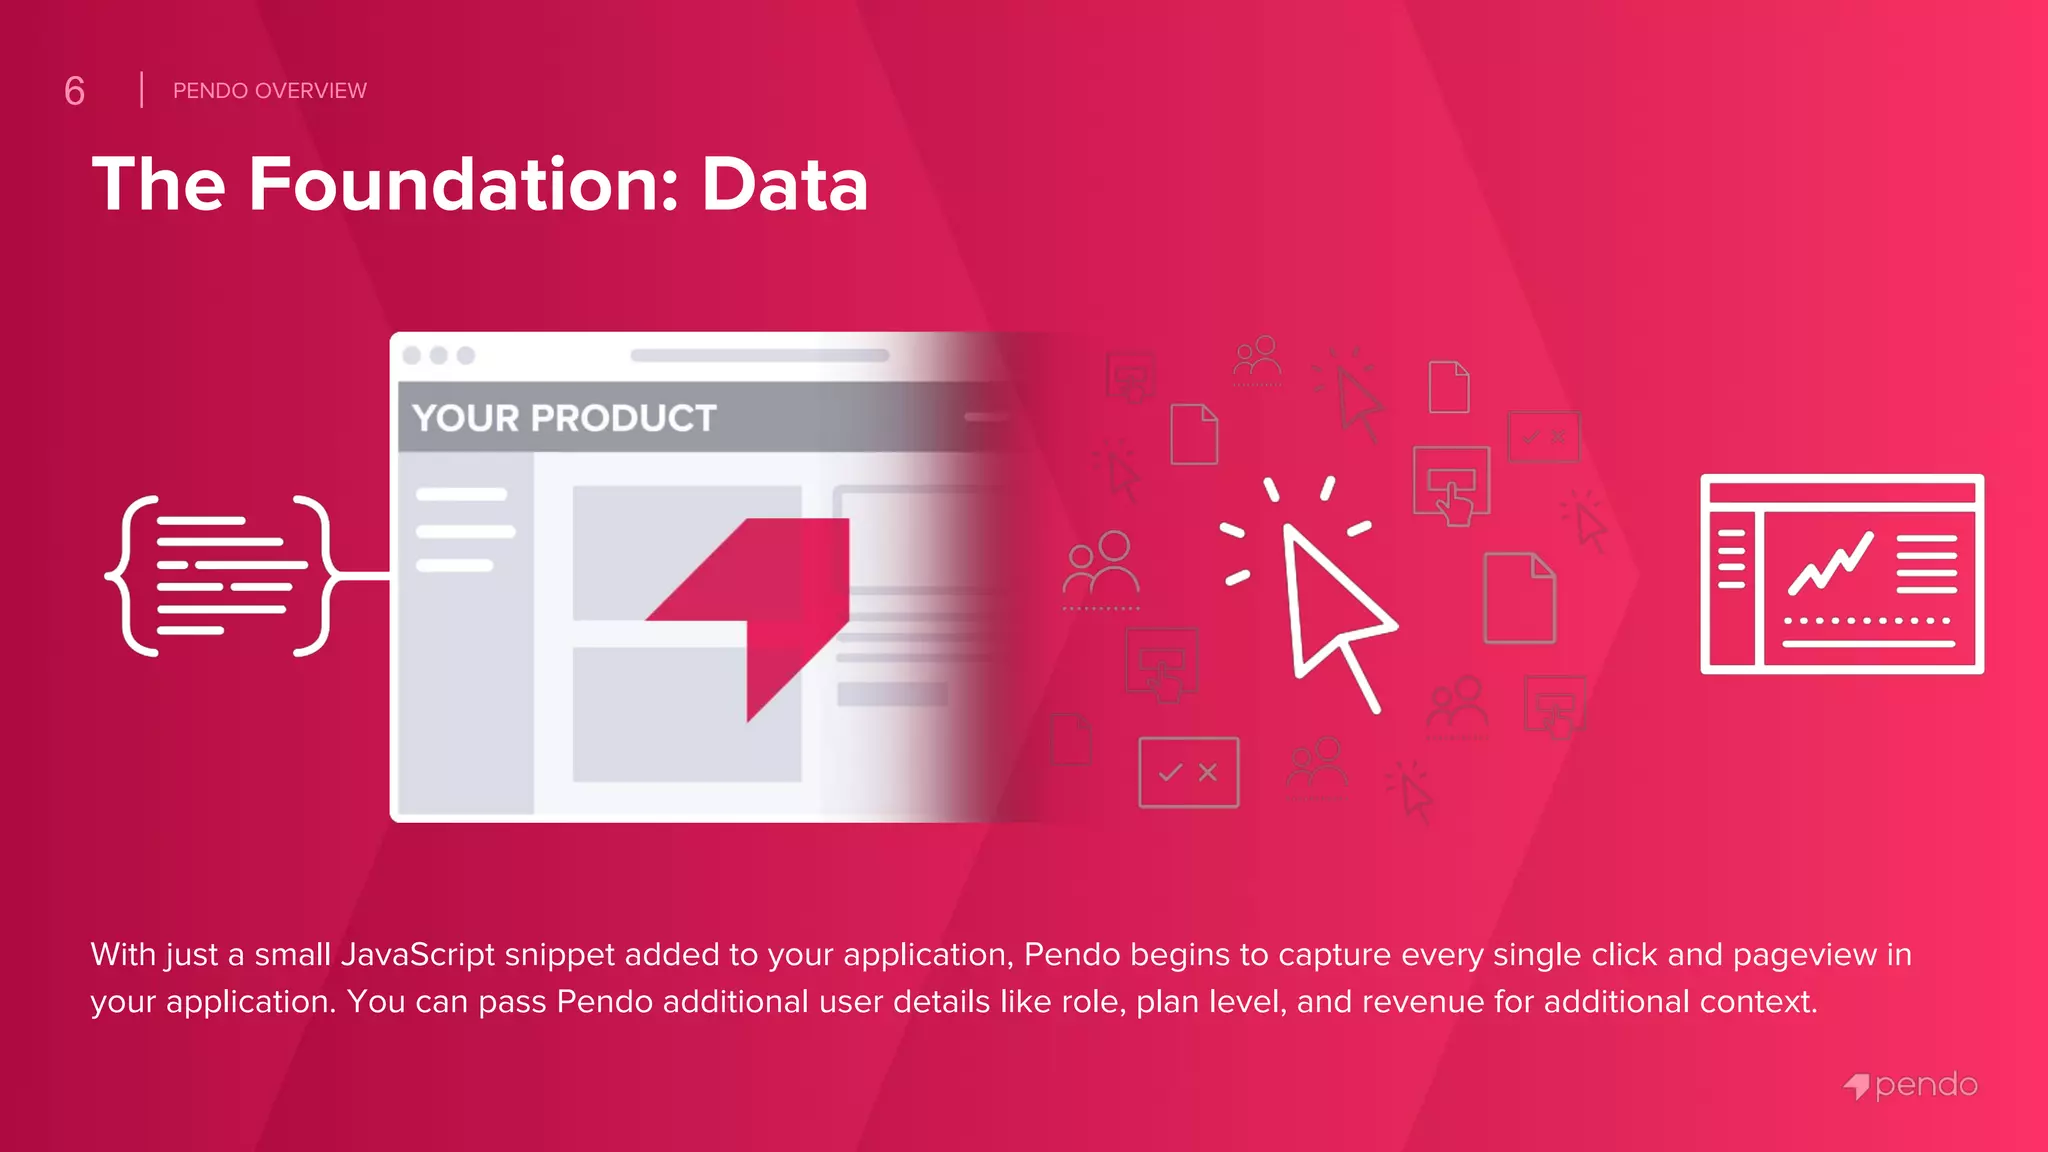
Slide 6 explains the core technical hook (a small JavaScript snippet) that powers data collection and downstream features. This is critical for a product like Pendo — it reassures buyers and investors that the data capture approach is lightweight, scalable, and extensible (e.g., you can pass role/plan/revenue for better segmentation). The slide balances technical detail with business implications (better analytics, tailored guidance), which is exactly what enterprise buyers and investors want to see.

Key Takeaway: Explain the simple technical integration that underpins your product and show how it unlocks business-level benefits — keep the explanation accessible to non-engineers.
GTM & Metrics: ARR growth and capacity signals

GTM & Metrics: ARR growth and capacity signals

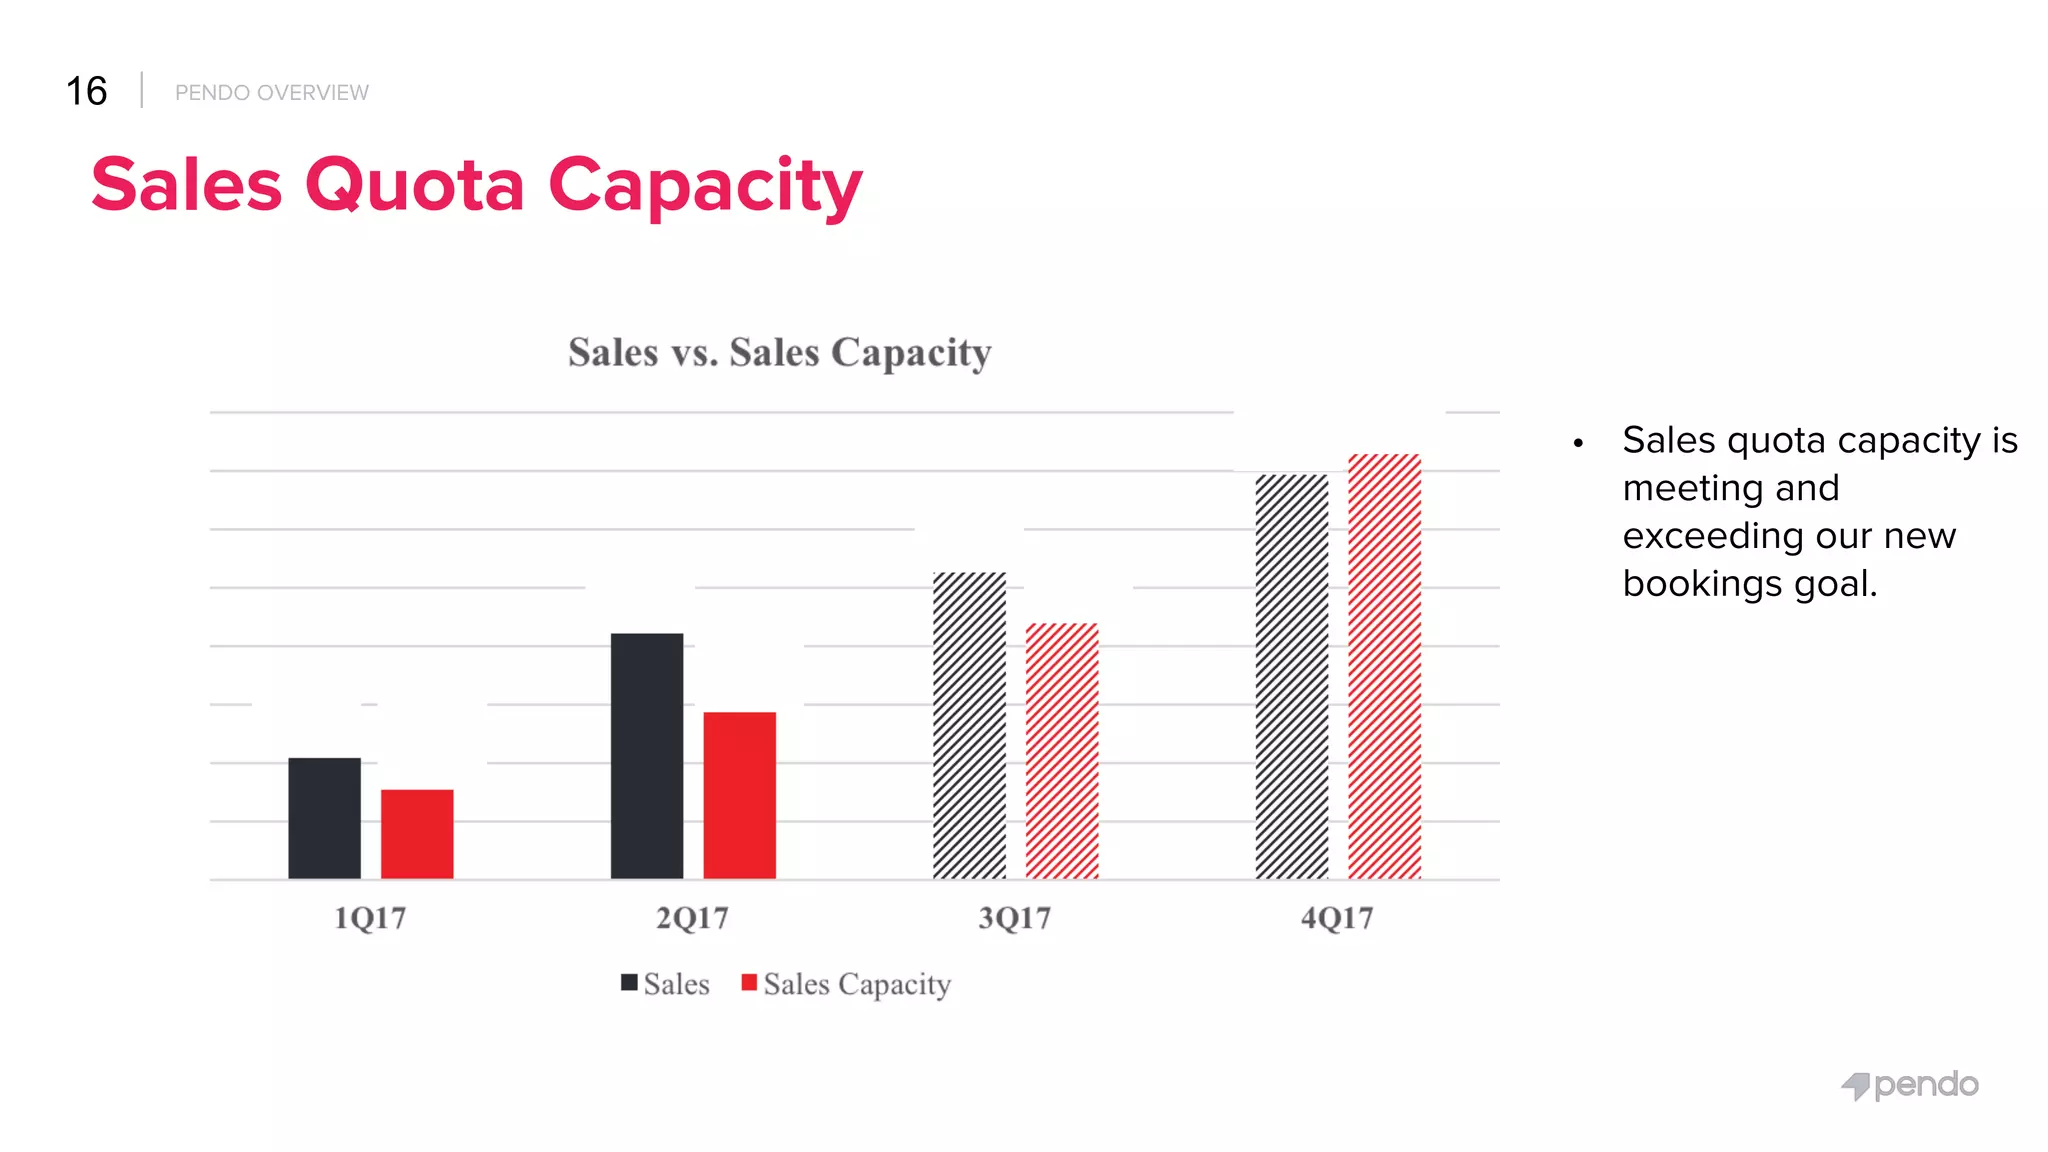
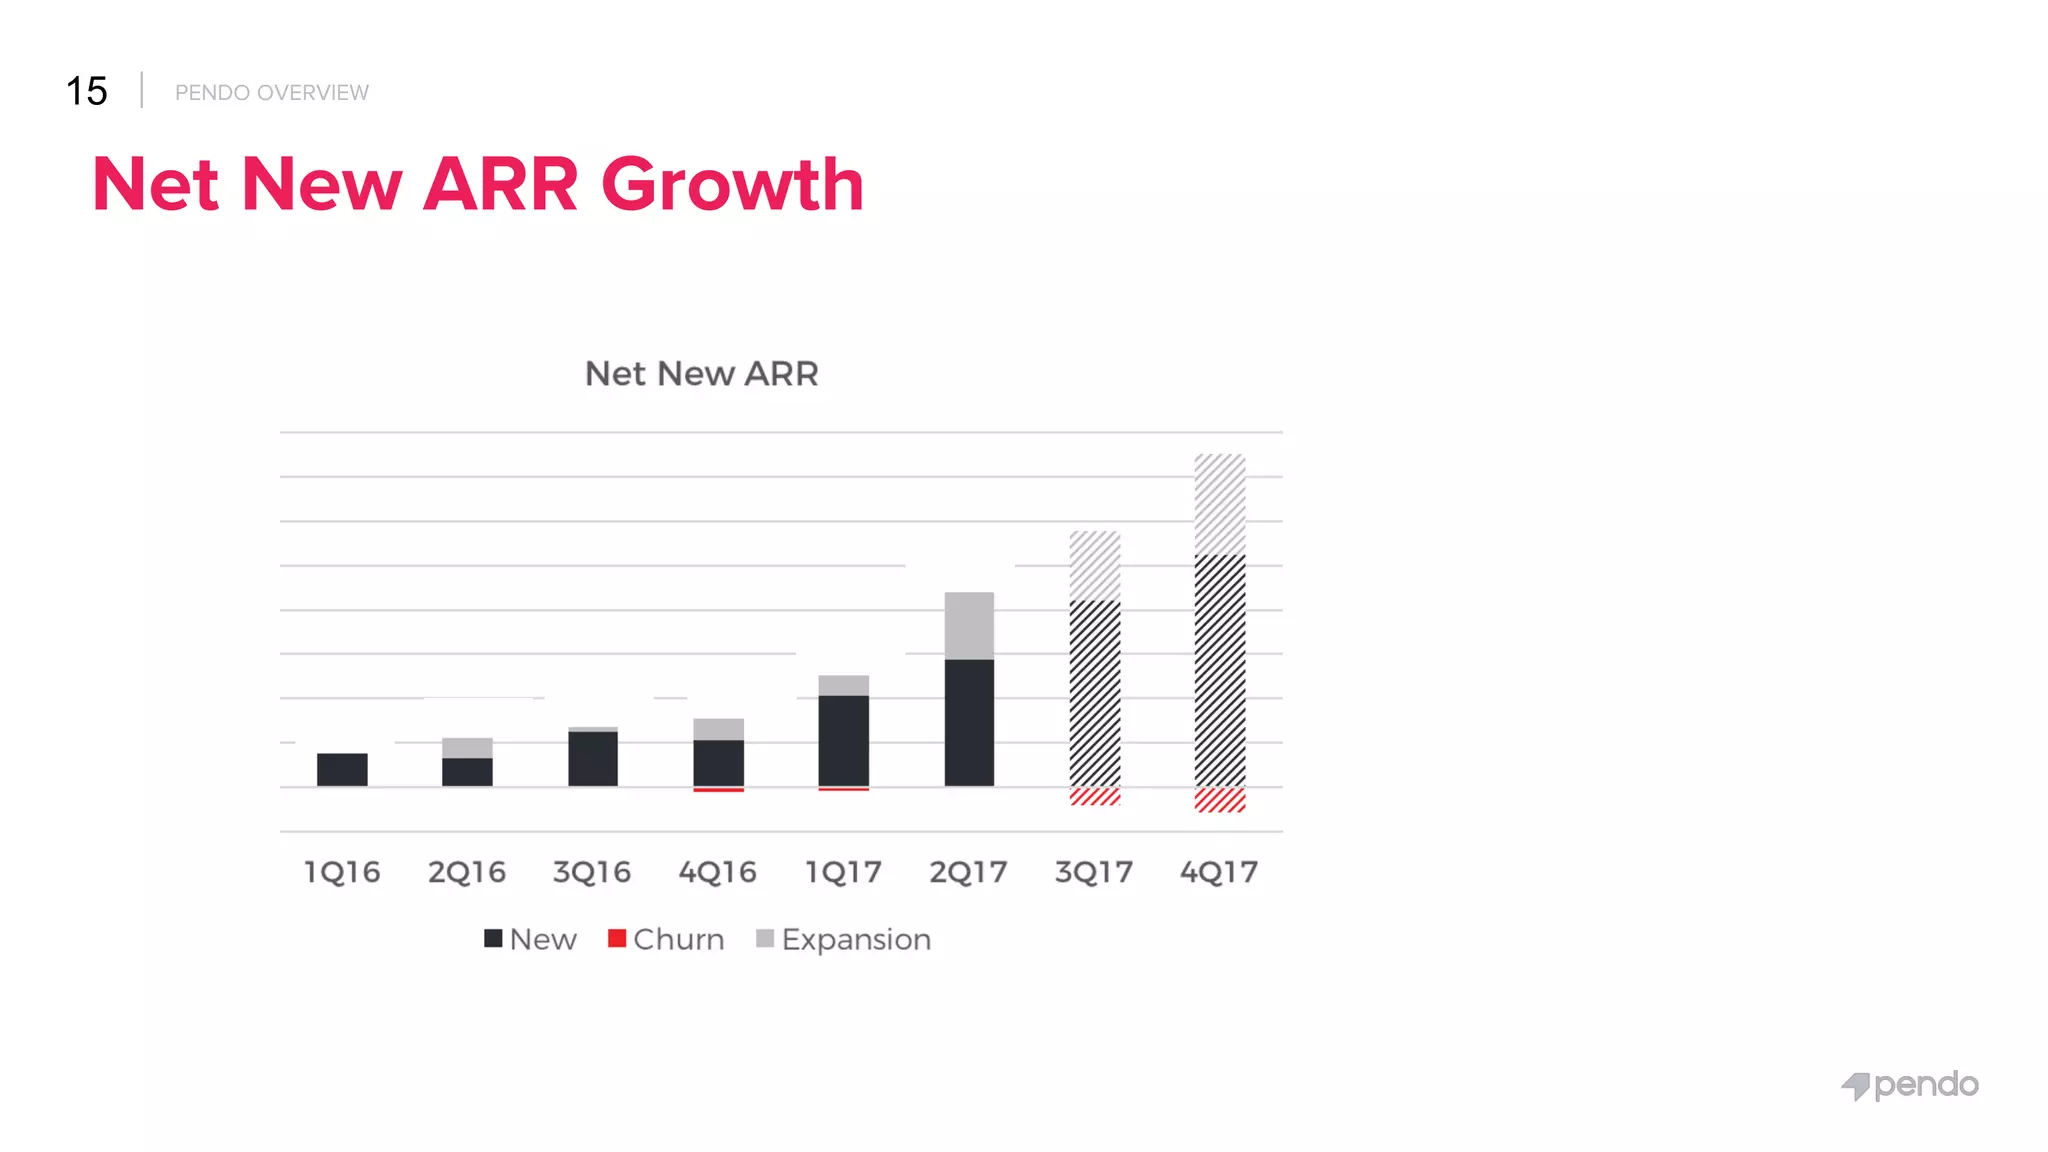
Slide 15 (Net New ARR Growth) visualizes quarterly ARR composition (new, churn, expansion) and projects future quarters. This is a strong way to demonstrate not just raw growth but the quality of that growth — expansion bars and churn context matter. Nearby sales-capacity slides (e.g., Sales Quota Capacity) show the company’s ability to scale the GTM function, which reassures investors that growth can continue as headcount and processes ramp.

Key Takeaway: Show ARR broken into components (new, churn, expansion) and pair it with sales capacity indicators to prove both demand and your ability to scale sales.
Customer Evidence: Case studies and references

Customer Evidence: Case studies and references

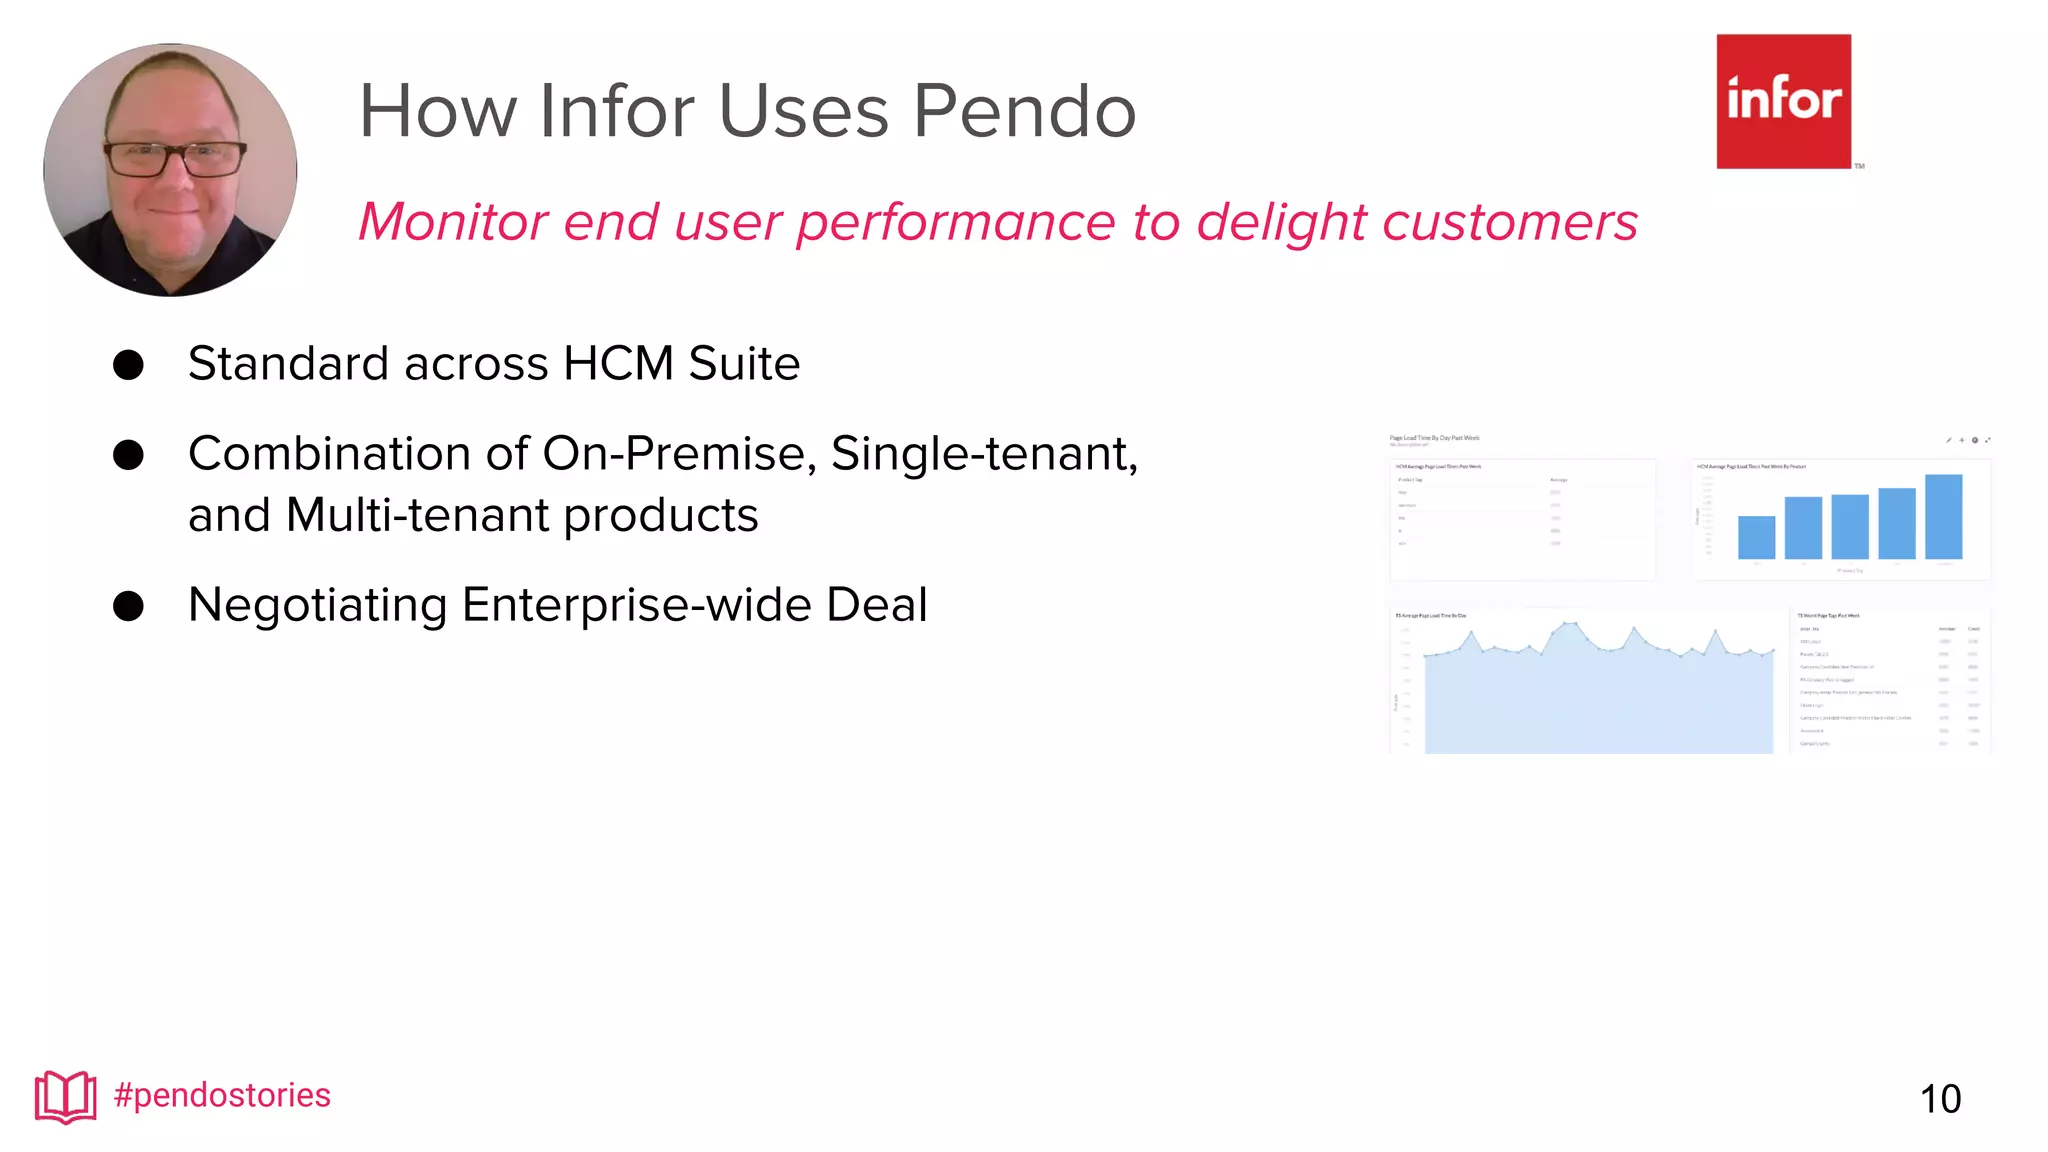
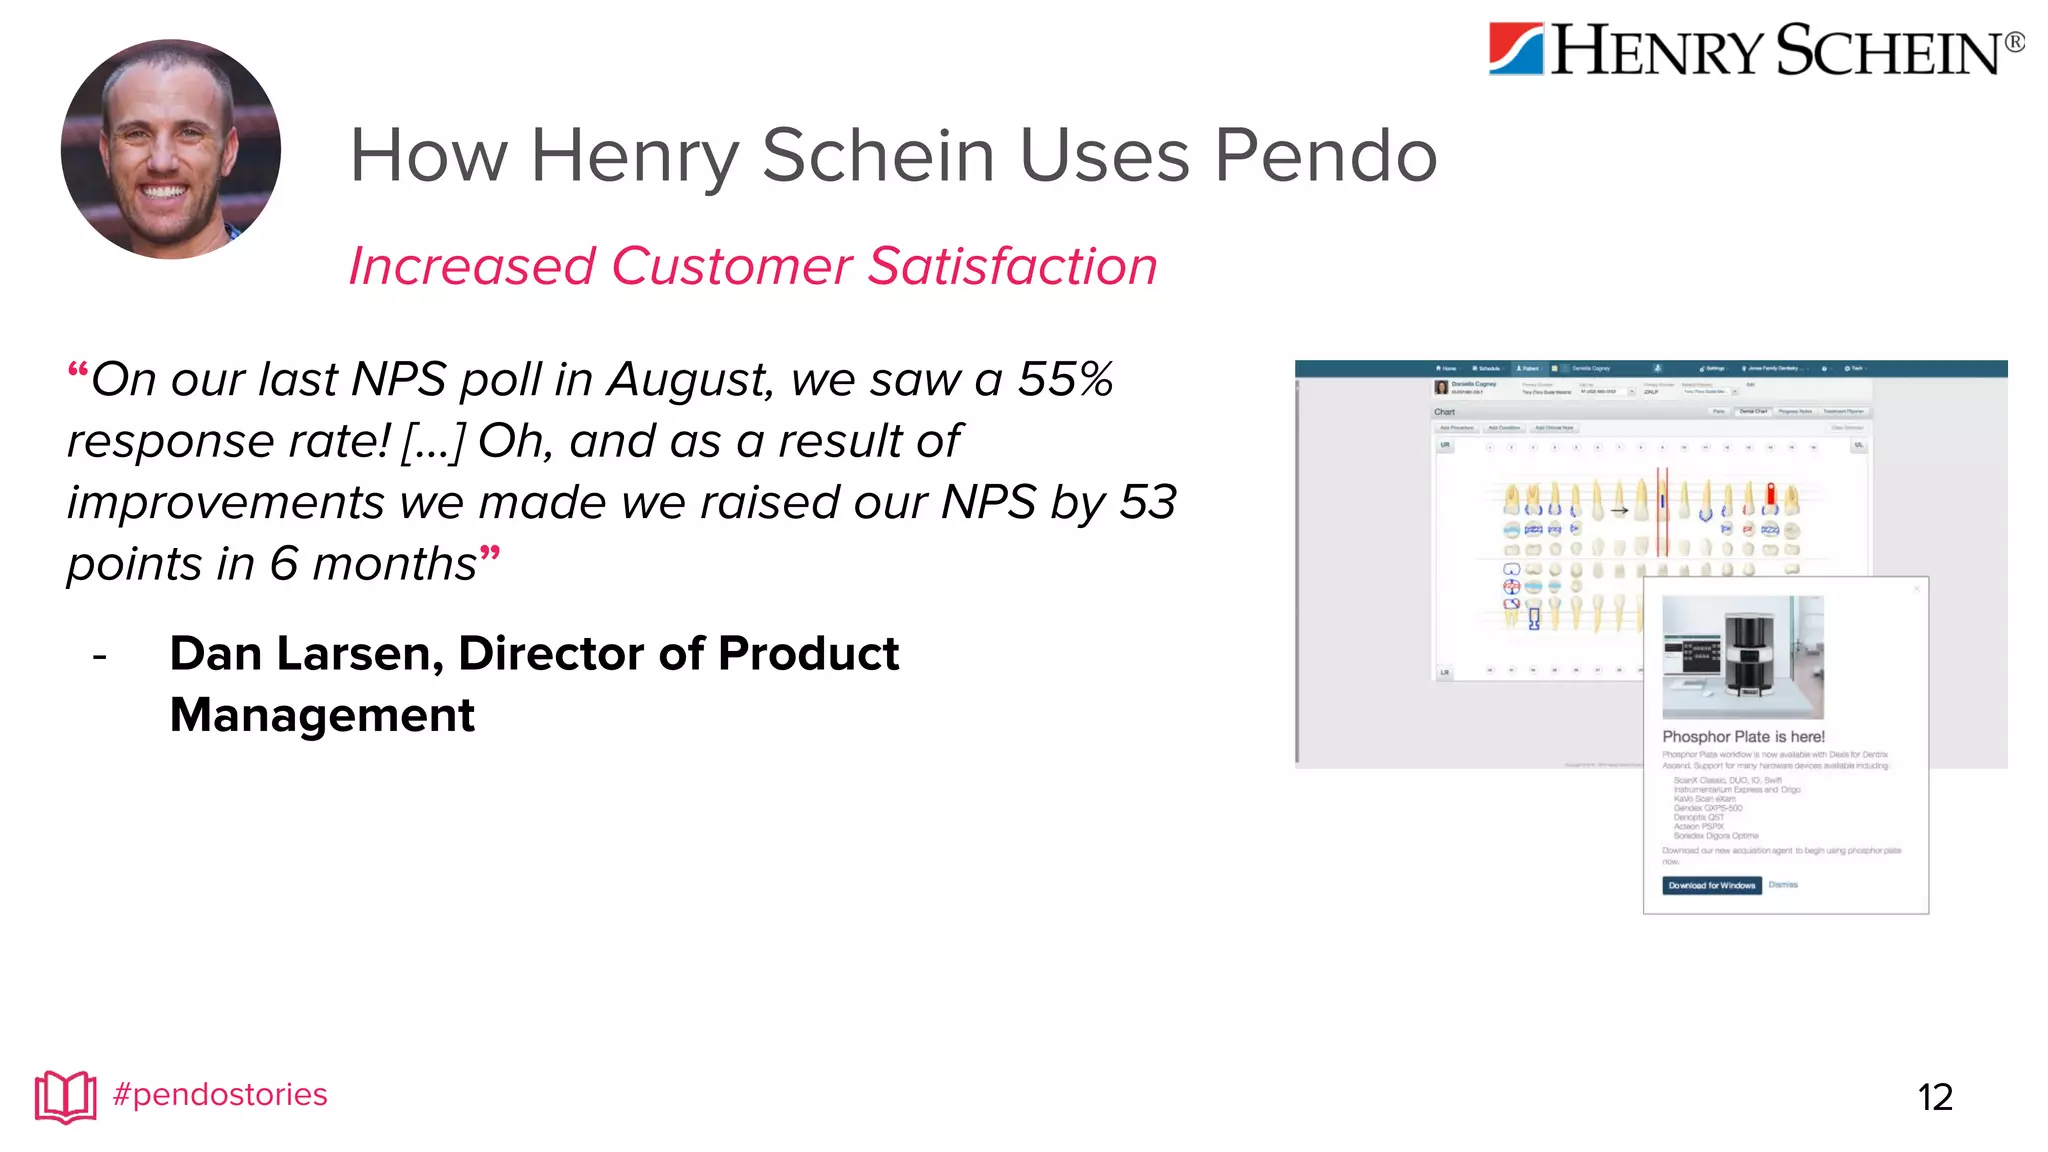
Slide 10 highlights a named customer (Infor) and specific ways they use Pendo: standardization across suites, on-prem + multi-tenant deployments, and enterprise negotiation. Short bullets and a customer screenshot make the use case concrete. Follow-up slides in the deck with additional customer quotes (Henry Schein) and a slide listing other customers further reinforce product-market fit and referenceability.

Key Takeaway: Use short, specific customer slides — one per reference — that highlight the problem solved, deployment scope, and measurable outcome to build credibility.
Fundraising Ask & Plan: Clear ask and use of proceeds

Fundraising Ask & Plan: Clear ask and use of proceeds

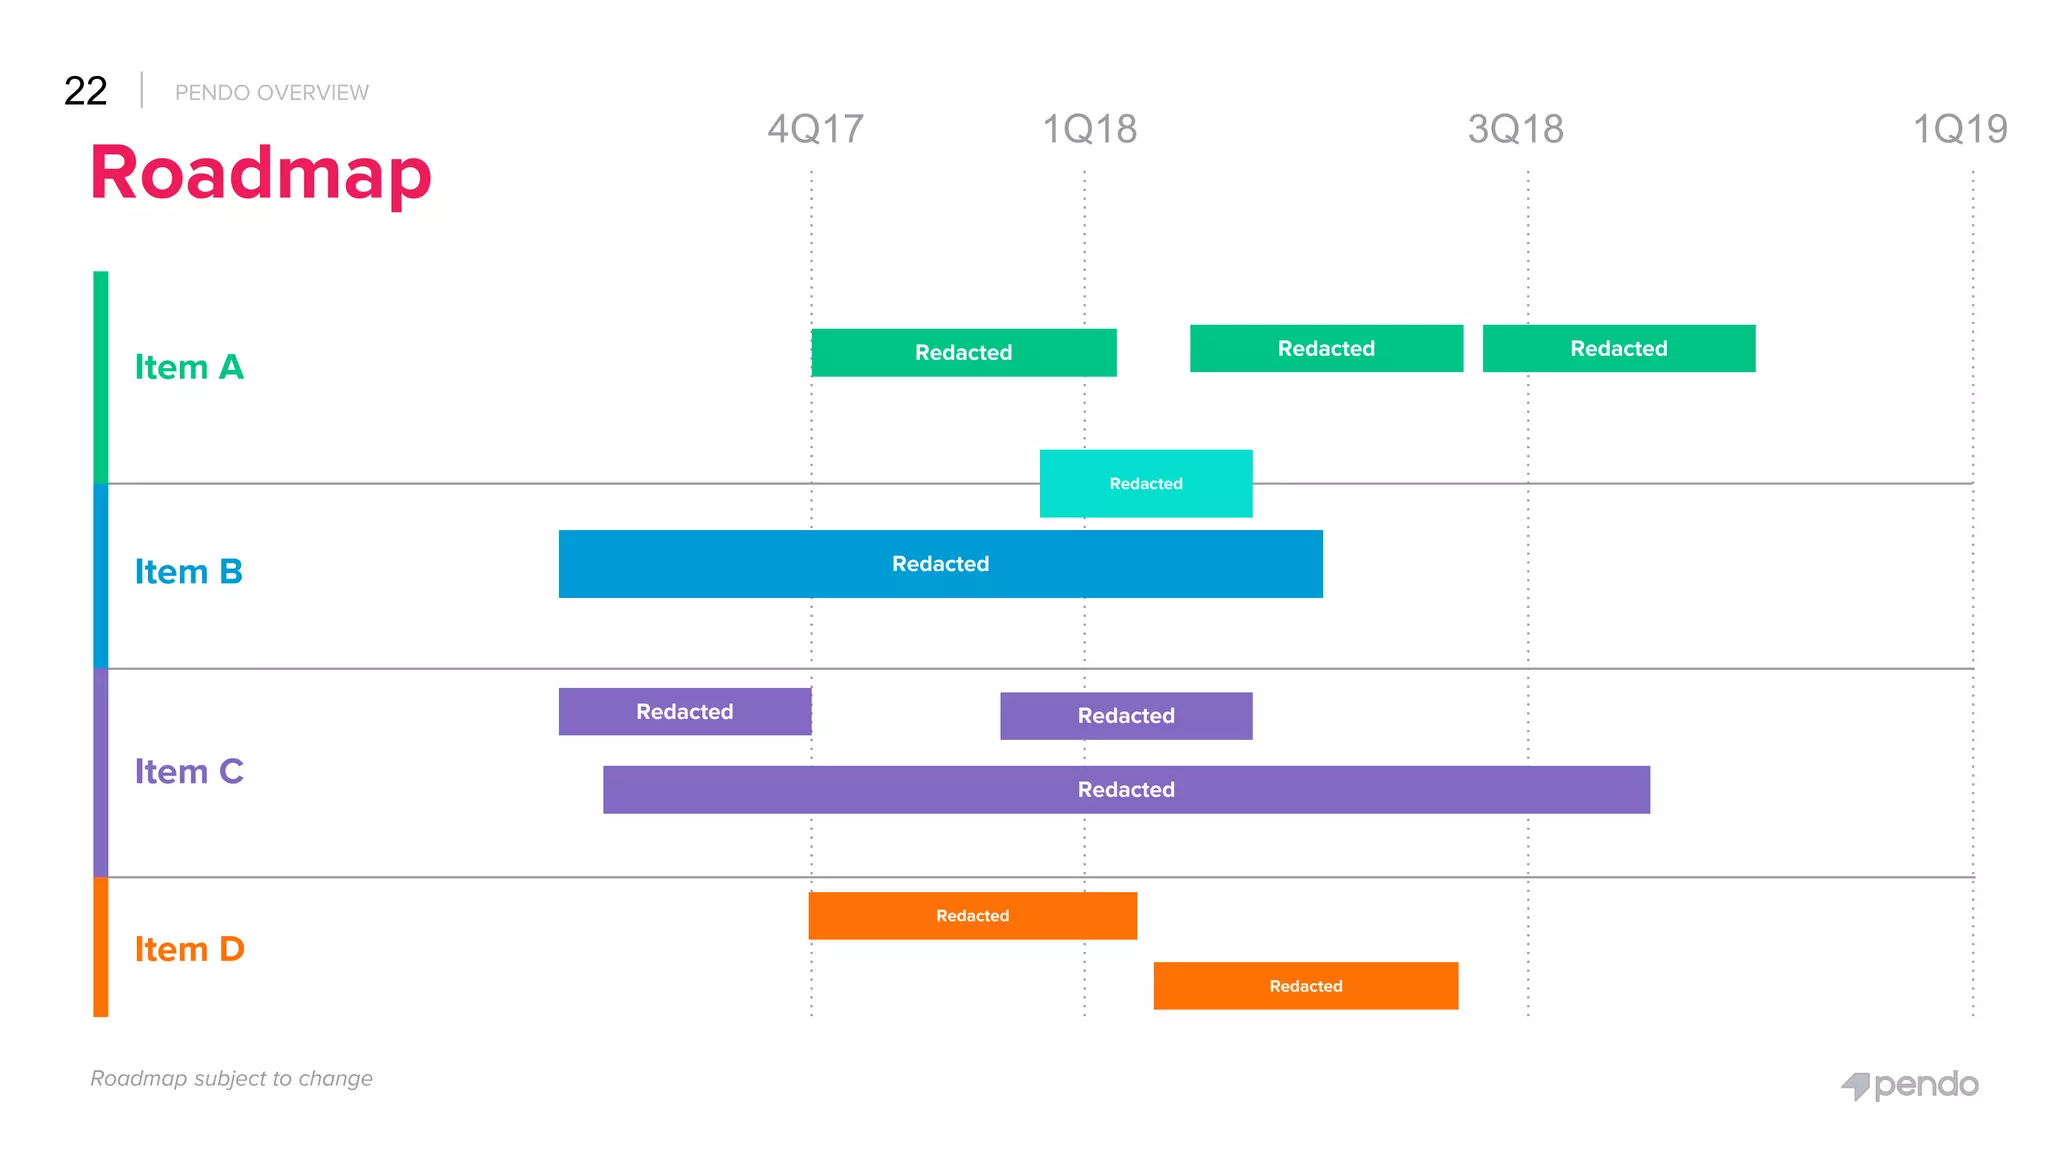
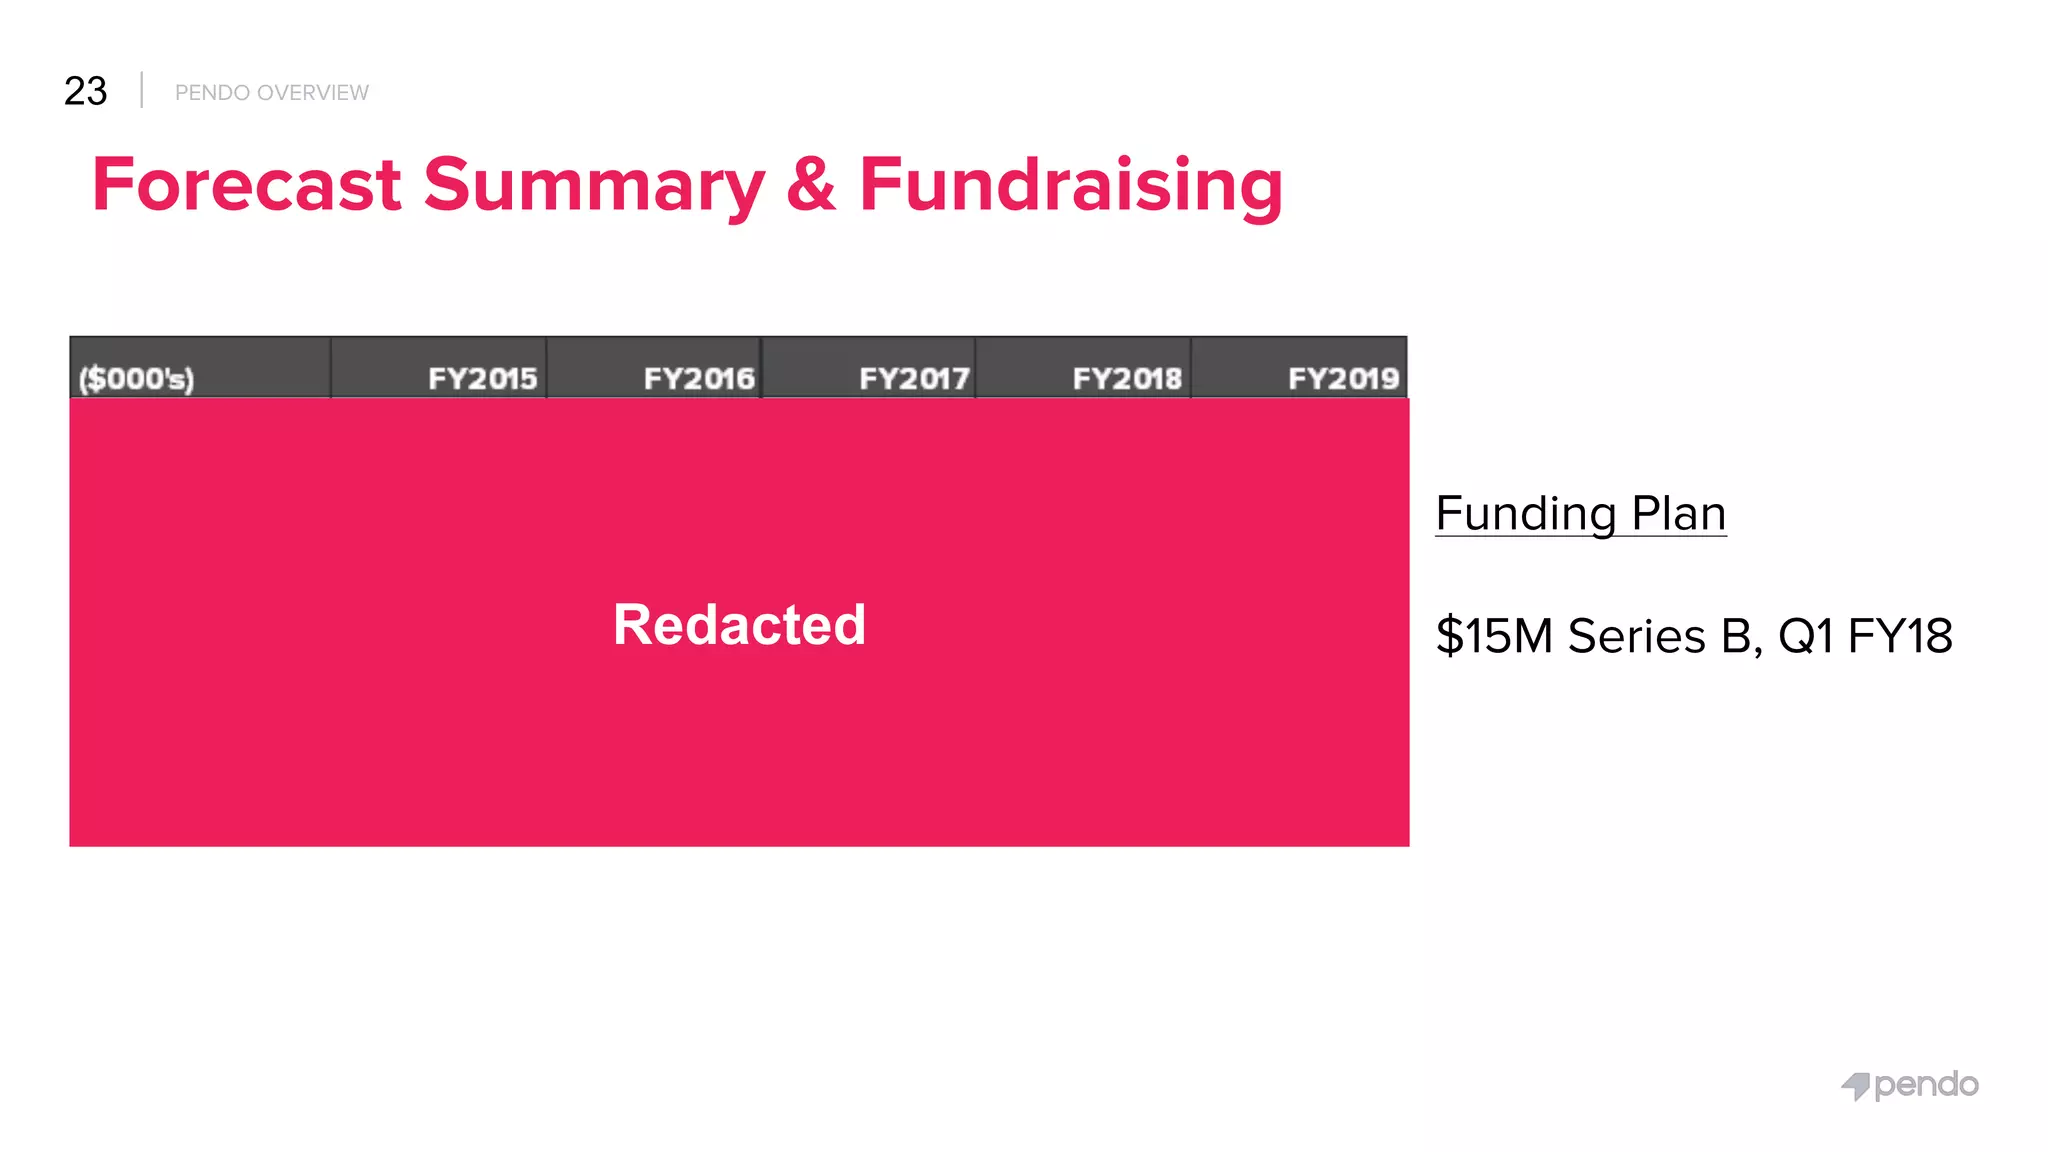
Slide 23 presents a fundraising plan (“$15M Series B, Q1 FY18”) alongside forecast visuals and redacted financials. The clearest decks state the ask and how it maps to milestones (hiring, GTM, product roadmap). While the deck keeps some numbers redacted here, it still pairs the funding need with a timeline and roadmap elsewhere in the deck, which is important for investor diligence and alignment on expectations.

Key Takeaway: State the funding amount, target timing, and link the ask to specific milestones in the roadmap so investors see the return path.

Conclusion: Key Lessons

Pendo’s deck is effective because it tells a cohesive story: a simple technical integration enables powerful product experiences, which drive measurable growth and expansion in a subscription market. Strengths include a succinct market thesis, tangible product examples, customer proof points, and ARR metrics that break down growth quality. For founders, the actionable advice is to: 1) connect product mechanics to business outcomes early, 2) show one-sentence customer proof and a visual of the UI, 3) present ARR and compositional metrics (new vs. expansion vs. churn) rather than only headline revenue, and 4) pair the fundraising ask with concrete milestones on the roadmap. These elements reduce perceived risk and make it straightforward for investors to evaluate your opportunity.

Full Deck Analysis

11 sections

Overview

Company: Pendo
Round: Series A (document notes $11M raised to date)
Year: 2015 (deck / investor presentation materials)
Outcome: Valued at $2.6B (2021)


Executive Summary

Pendo presents itself as an integrated “product experience” platform that captures product usage data, delivers in-app guidance, and collects contextual feedback to help product, UX and customer-success teams drive adoption and retention. The deck emphasizes rapid ARR growth, improving average deal size, expanding enterprise wins, and a strong founding team from Google/Rally/Cisco/Red Hat — all classic signals for software investors. The deck is notable for clear product positioning (analytics + in-app guidance + feedback), concrete user-role adoption data, and early evidence of unit-economics improvements (higher ASPs and move-up-market).


Problem Statement

  • Users expect consumer-like experiences in enterprise software but enterprise apps often remain clunky and hard to adopt (Slide 4).
  • Product/UX teams lack an integrated way to (1) observe all user interactions, (2) deliver contextual guidance, and (3) get vetted user feedback within the app — teams therefore use multiple disparate tools (Slides 3–5).
  • The deck frames the problem as both a user-experience gap and a business problem for SaaS vendors (trial conversion, churn, support cost, upsell), showing that modern product organizations need in-product analytics + messaging to meet these demands (Slides 3, 4, 5).

Solution

  • Pendo positions itself as the “First Integrated Platform for Product Experience” — combining robust product analytics, personalized guidance (in-app messages & tours), and in-app feedback collection (Slide 5).
  • Technical approach: small JavaScript snippet capturing every click and pageview, plus ability to pass user metadata (role, plan, revenue) for segmentation and context (Slide 6).
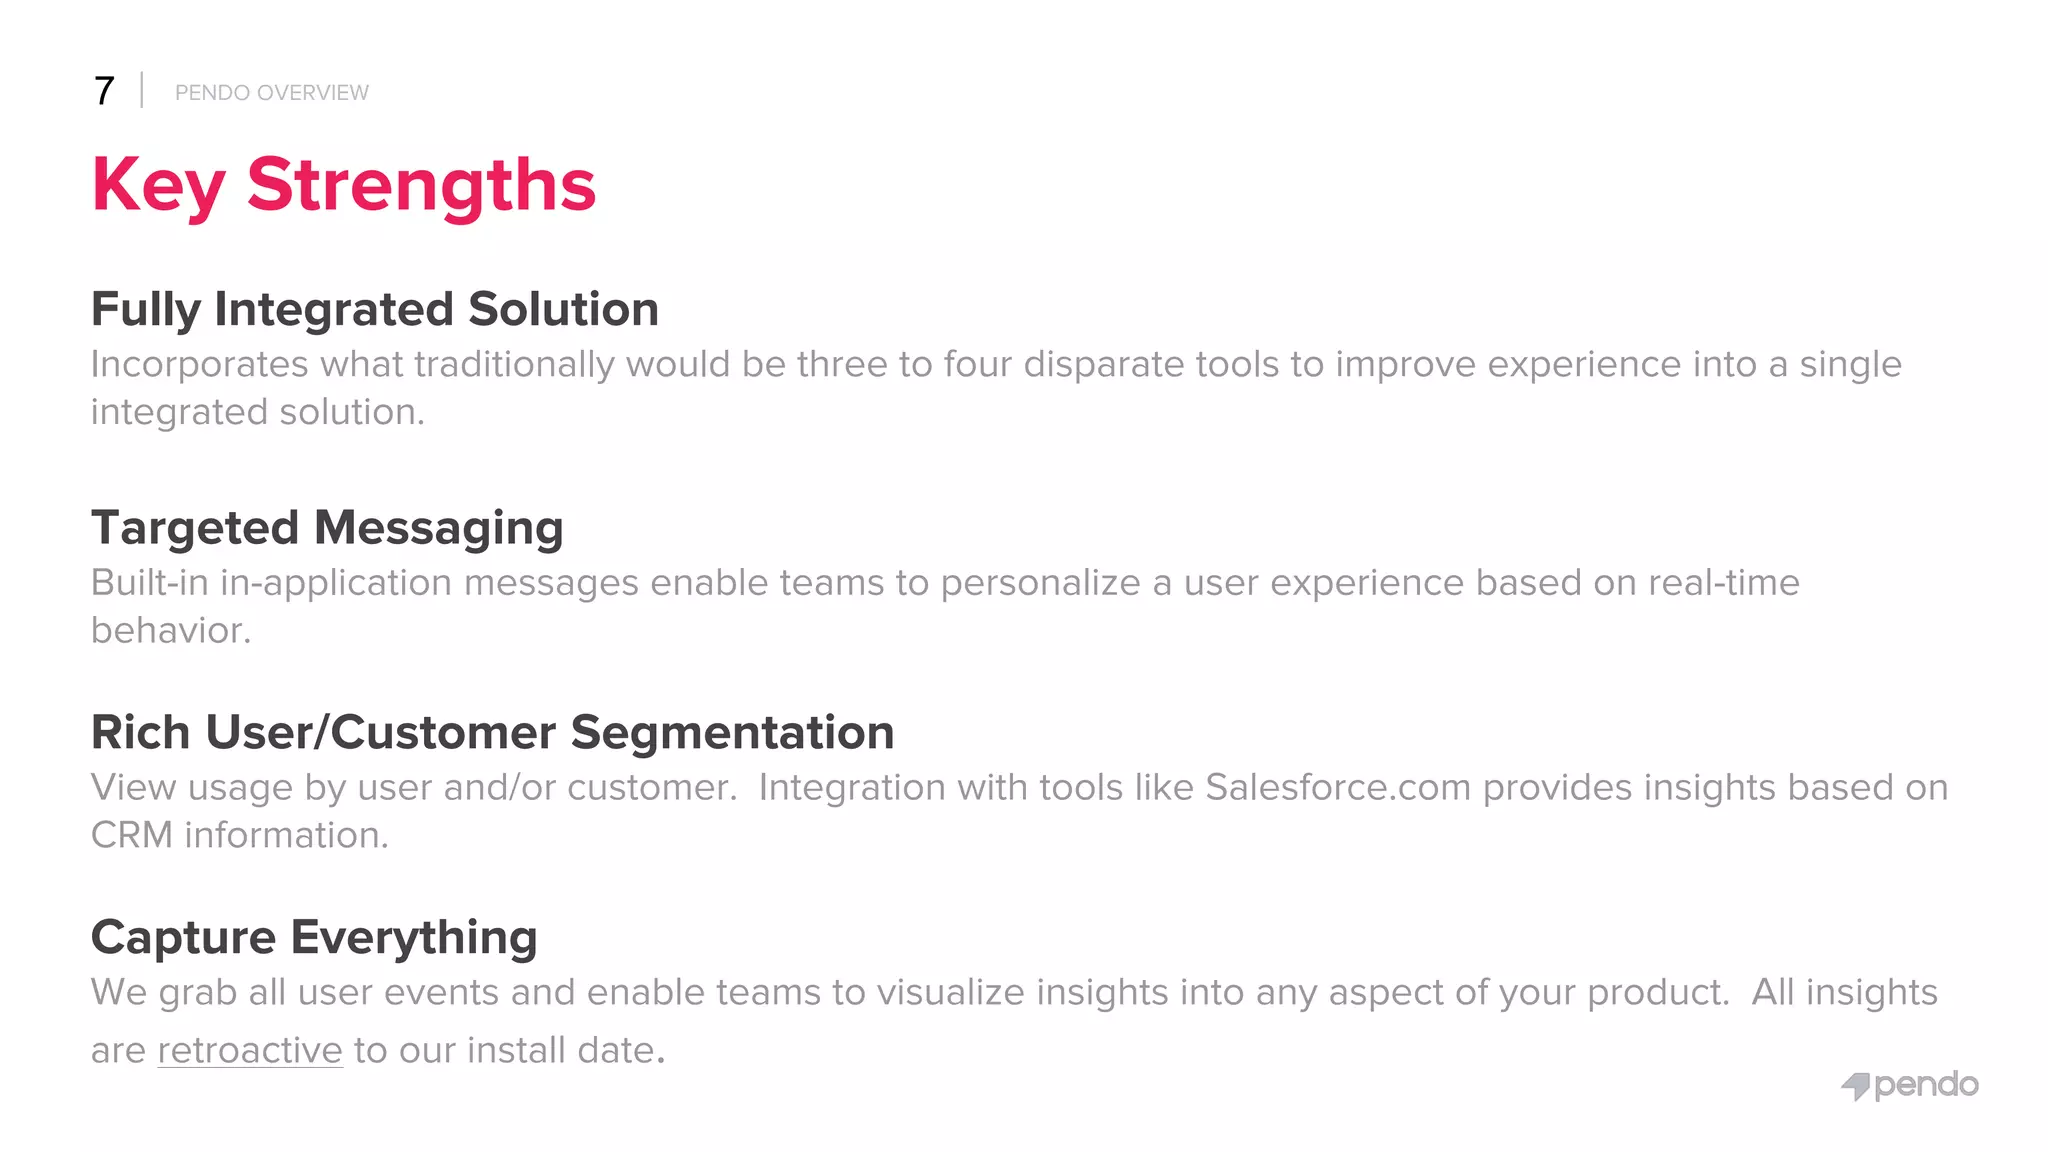
  • Value props emphasized: targeted messaging, rich user/customer segmentation, capture everything retroactively to install date (Slide 7).

Market Opportunity

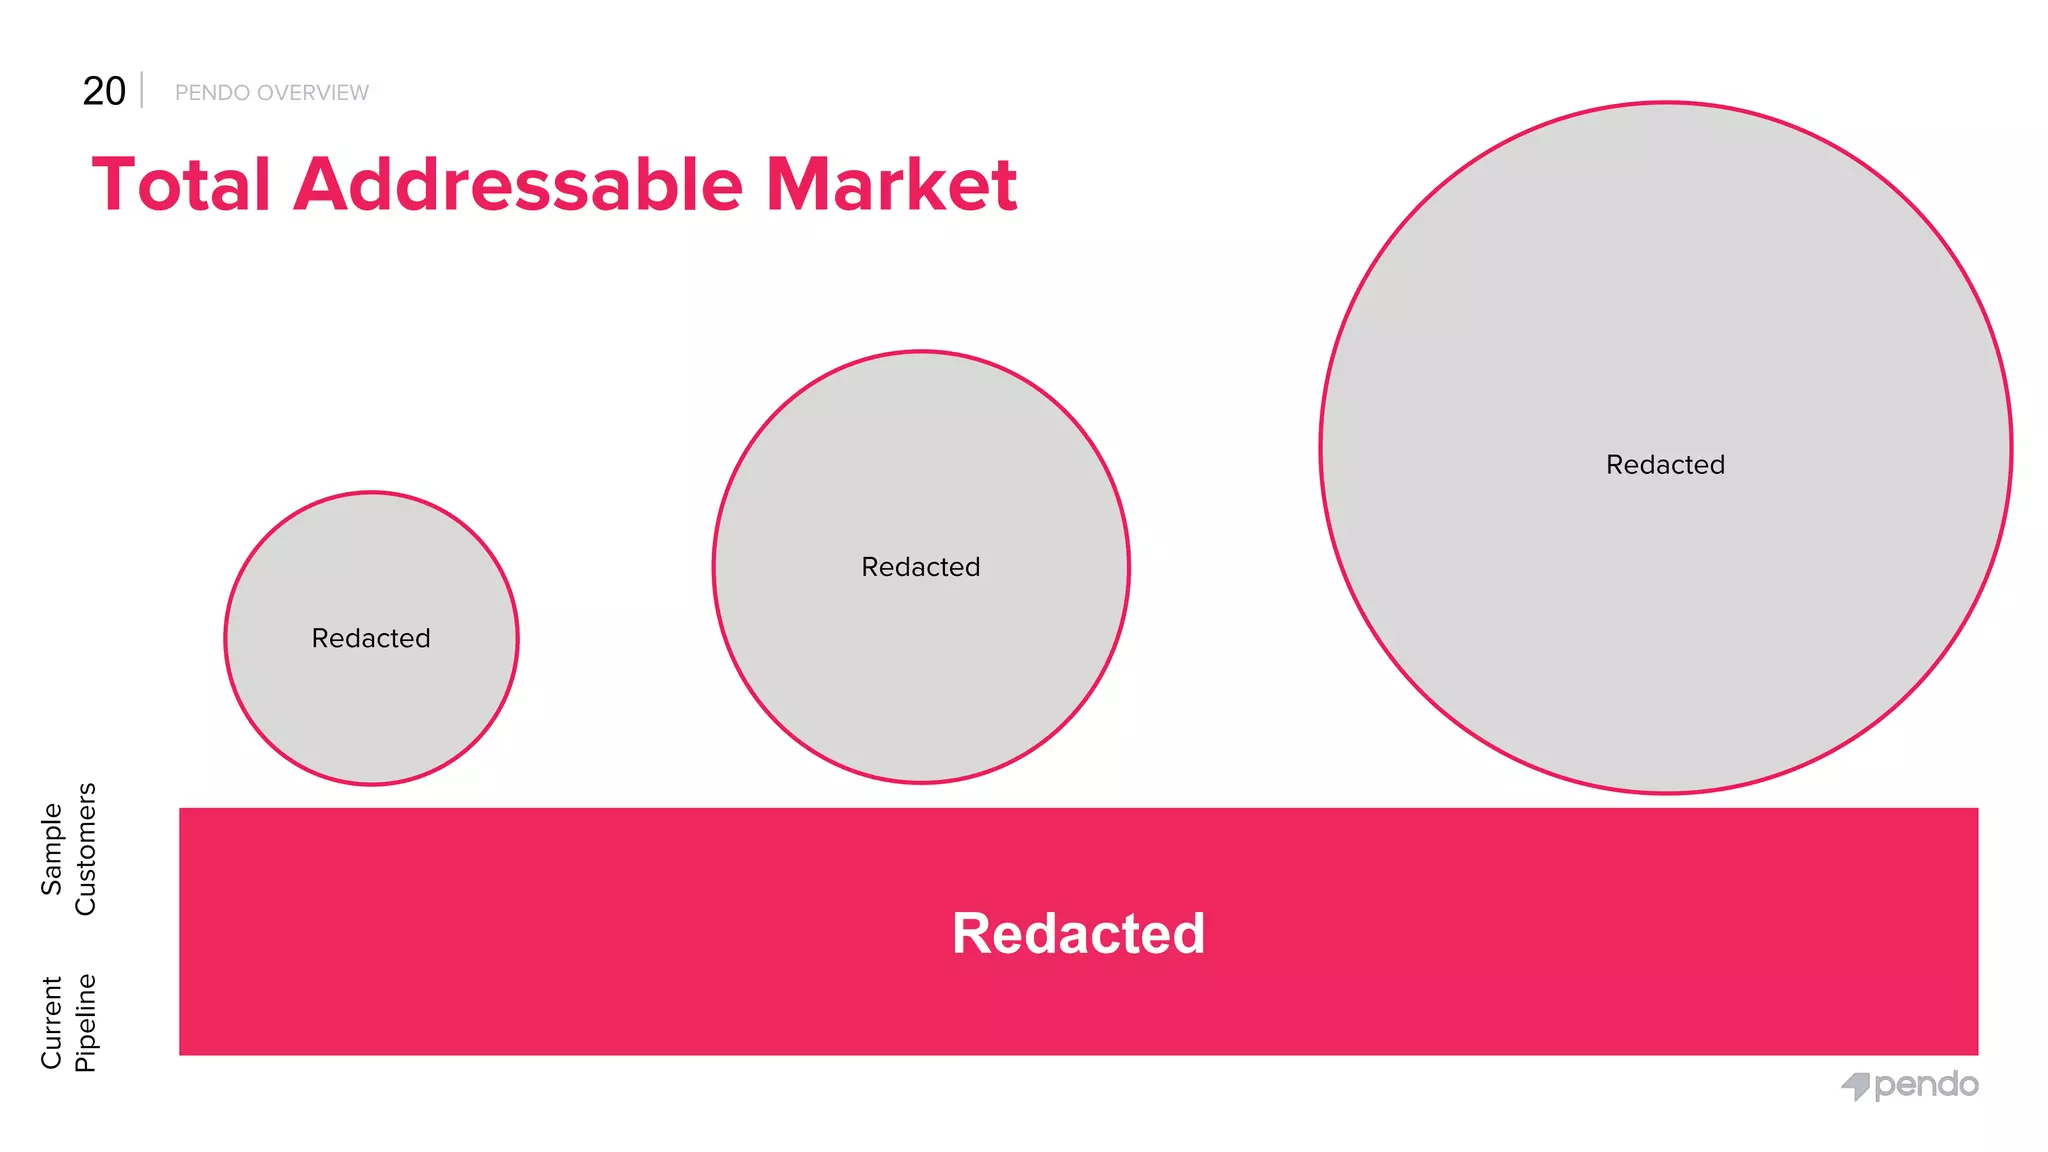
  • The deck contains TAM/SAM/SOM visuals, but the numerical market sizing is redacted in the shared slides (Slide 20). Large visual bubbles imply a multi-segment market (sample customers / current pipeline / addressable markets) but exact figures are not visible.
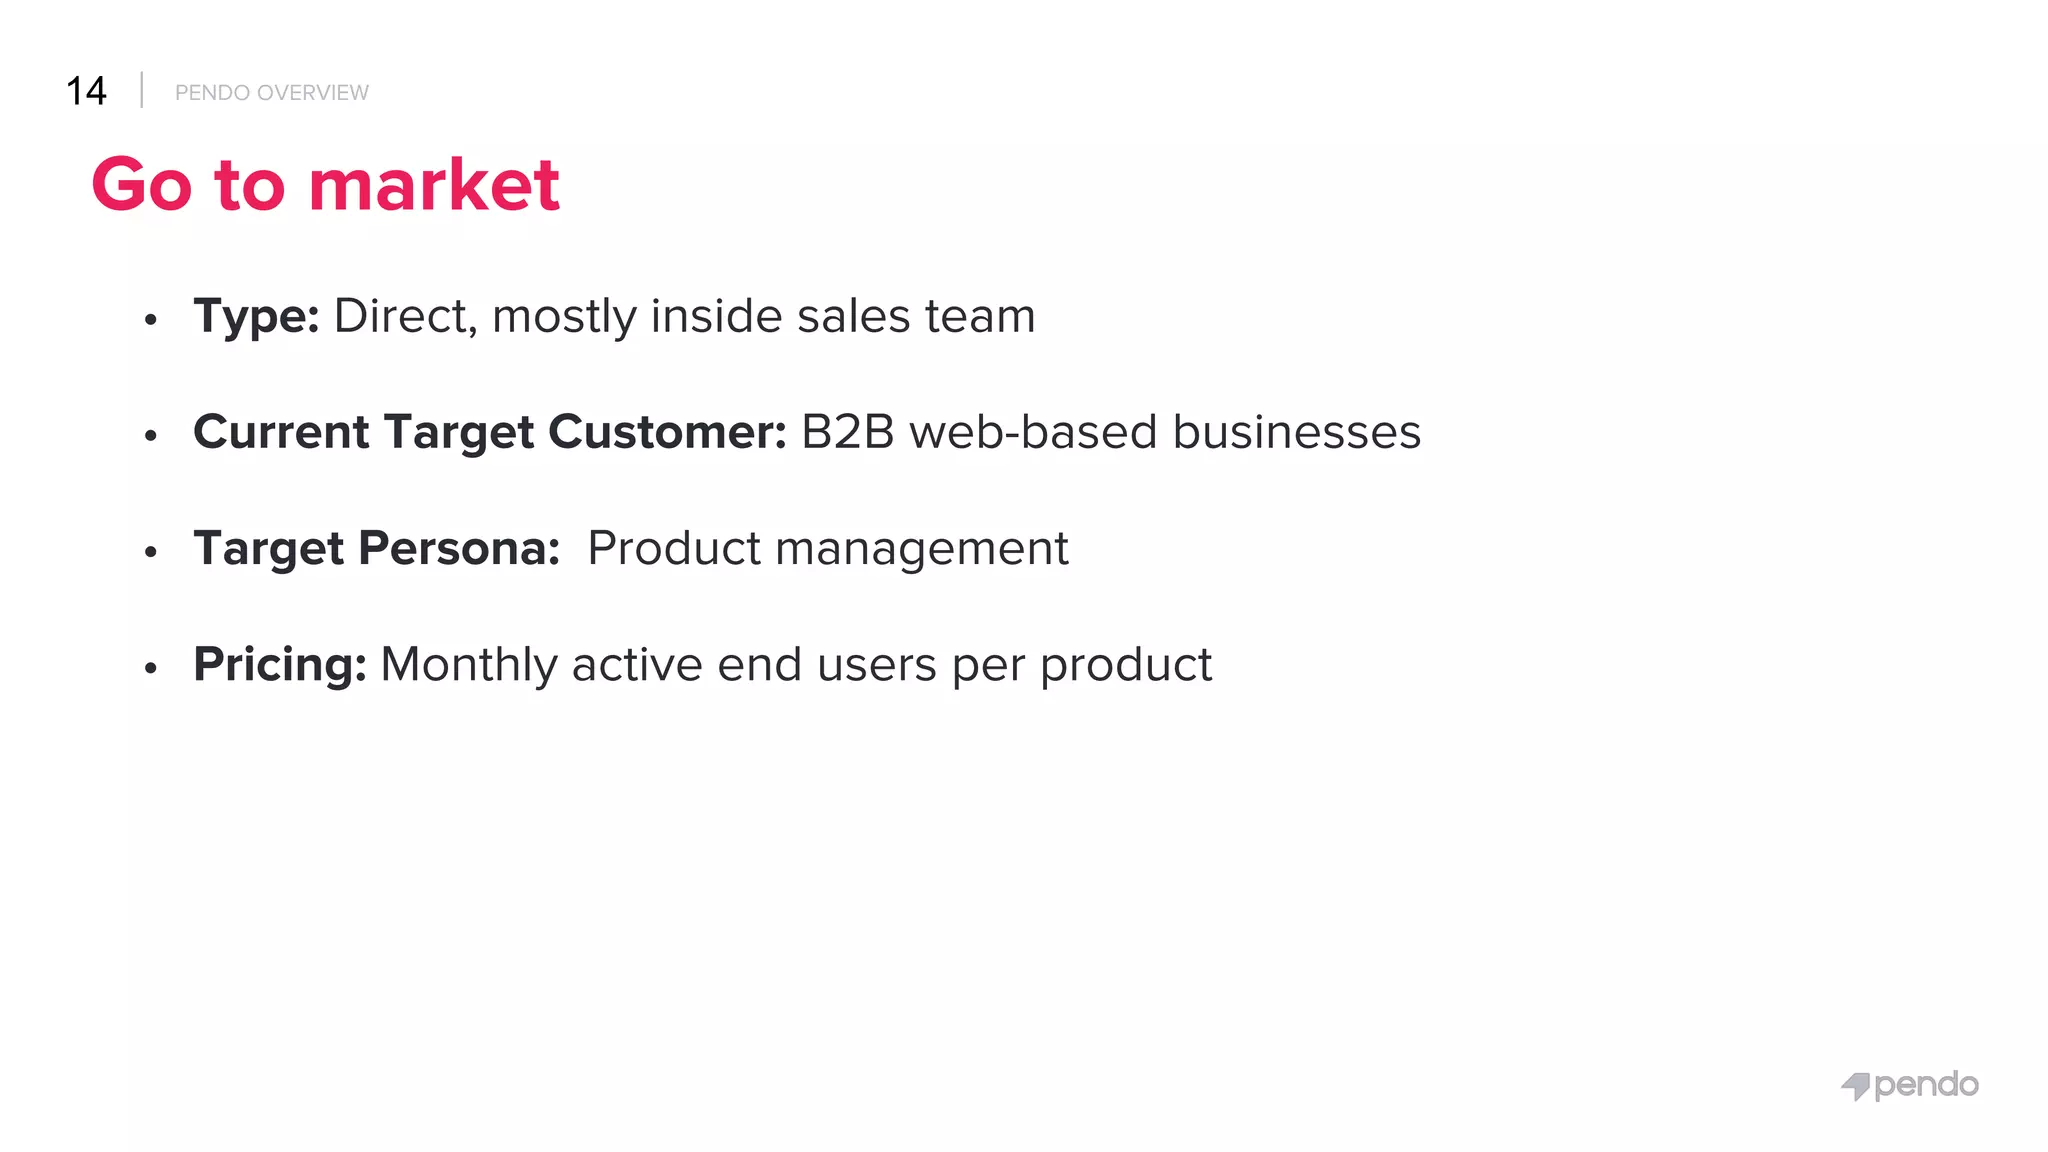
  • Slide 14 (Go to Market) clarifies target customer: B2B web-based businesses, target persona Product Management. This positions Pendo at the nexus of product-led growth trends and the growing market of SaaS product teams.

(Note: the deck visually emphasizes a large total addressable market, but specific dollar amounts are redacted or not legible in the provided images.)


Business Model

  • Pricing model: monthly active end users per product (Slide 14).
  • GTM revenue motion: direct sales, mostly inside sales team (Slide 14).
  • Revenue sources implied: new seat-based / user-based subscriptions, expansion (upsell) to existing customers — expansion is shown as a component of Net New ARR (Slide 15).
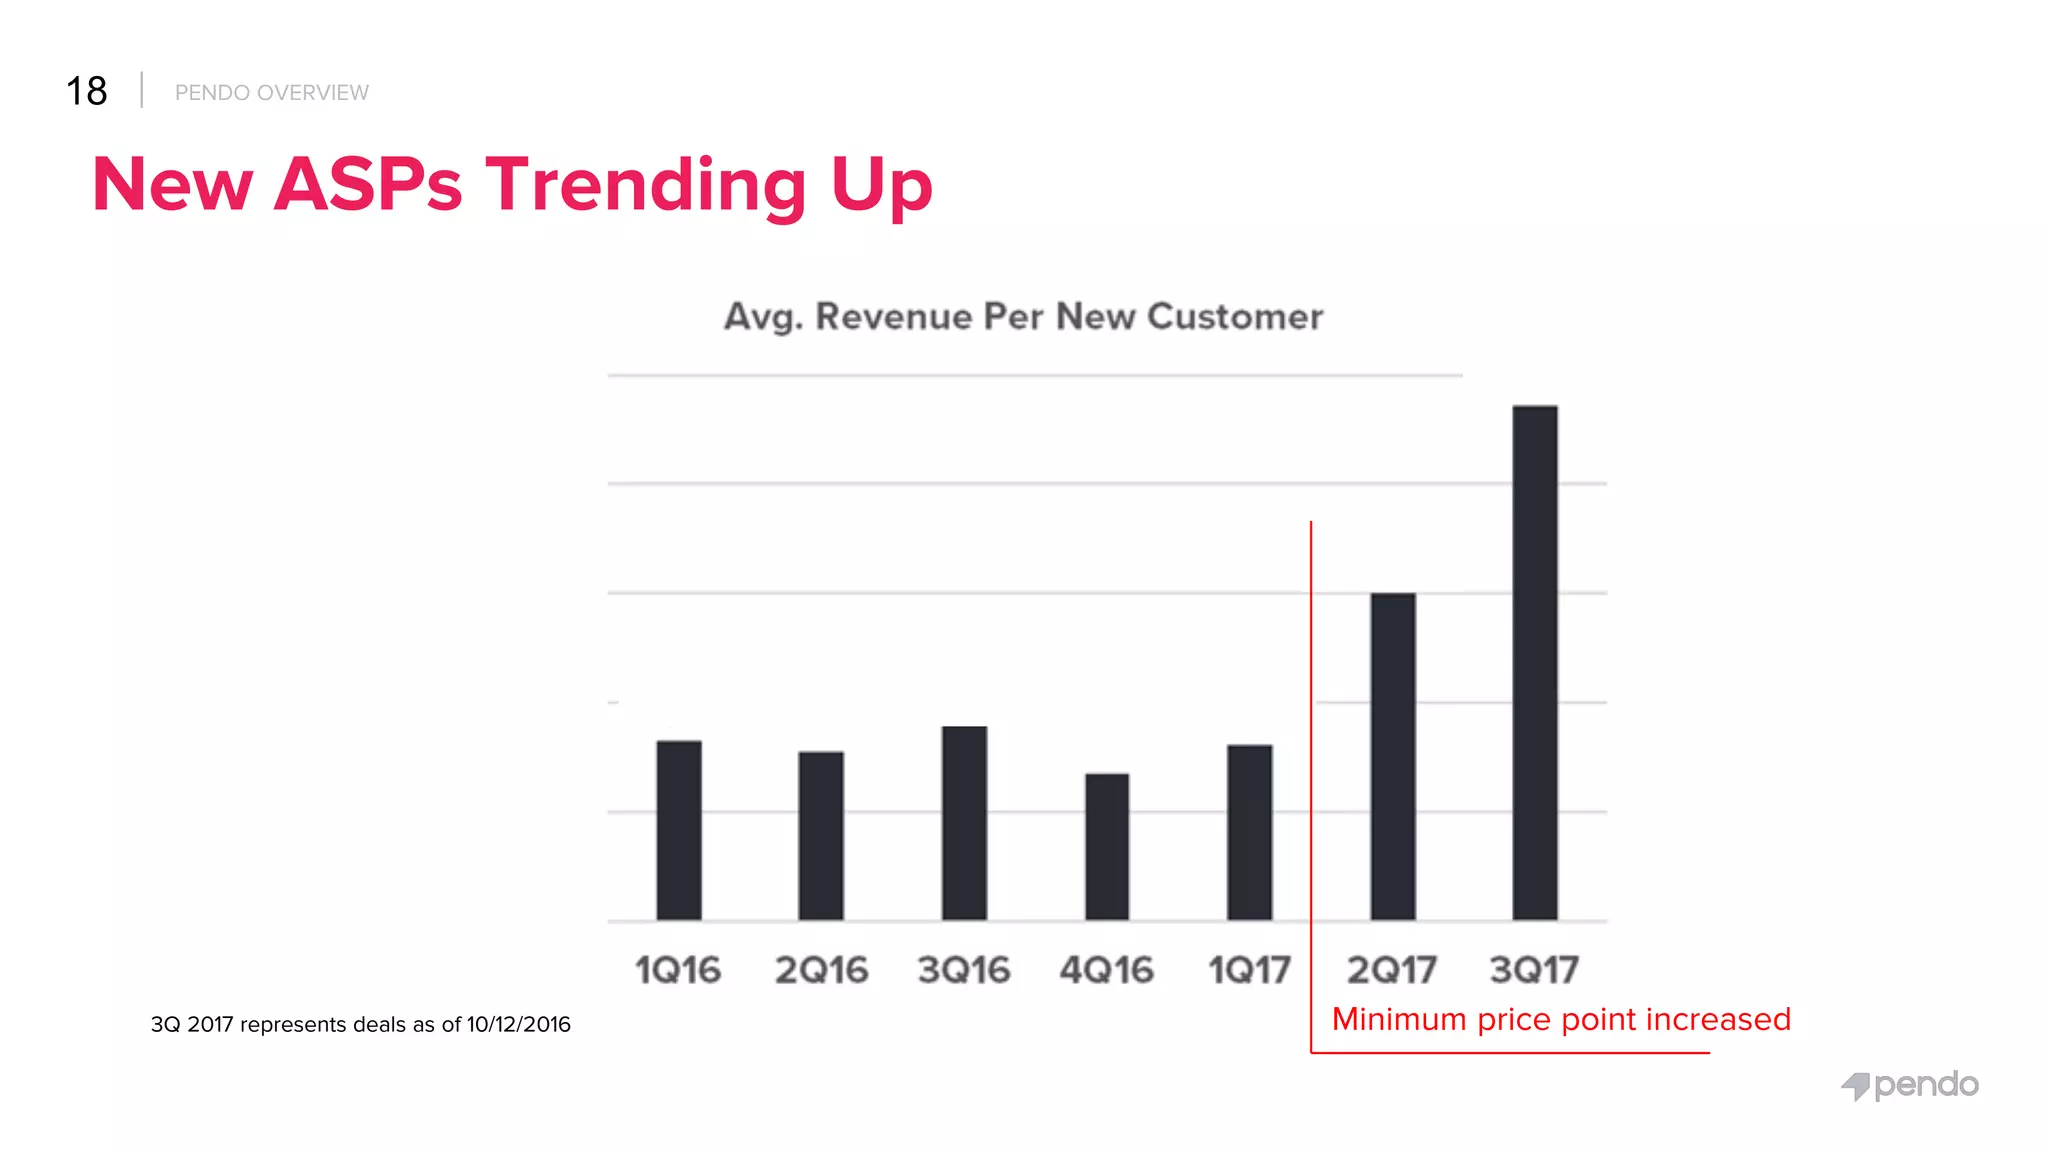
  • Unit concept: average revenue per new customer (ASP) shown rising over time (Slide 18), implying ability to increase price or sell larger packages.

Traction & Metrics

The deck provides multiple traction signals and growth charts (exact numeric detail is partially redacted/graphical):

  • Company history & size: founded 2013; “56 employees” called out on Slide 2; “raised $11M to date” (Slide 2).
  • ARR / Net New ARR growth: visual charts show steady quarter-over-quarter net new ARR growth from 1Q16 → projected 4Q17 with meaningful jump in mid‑2017 (Slides 2, 15). The presentation calls out new / churn / expansion breakdowns in stacked bars (Slide 15).
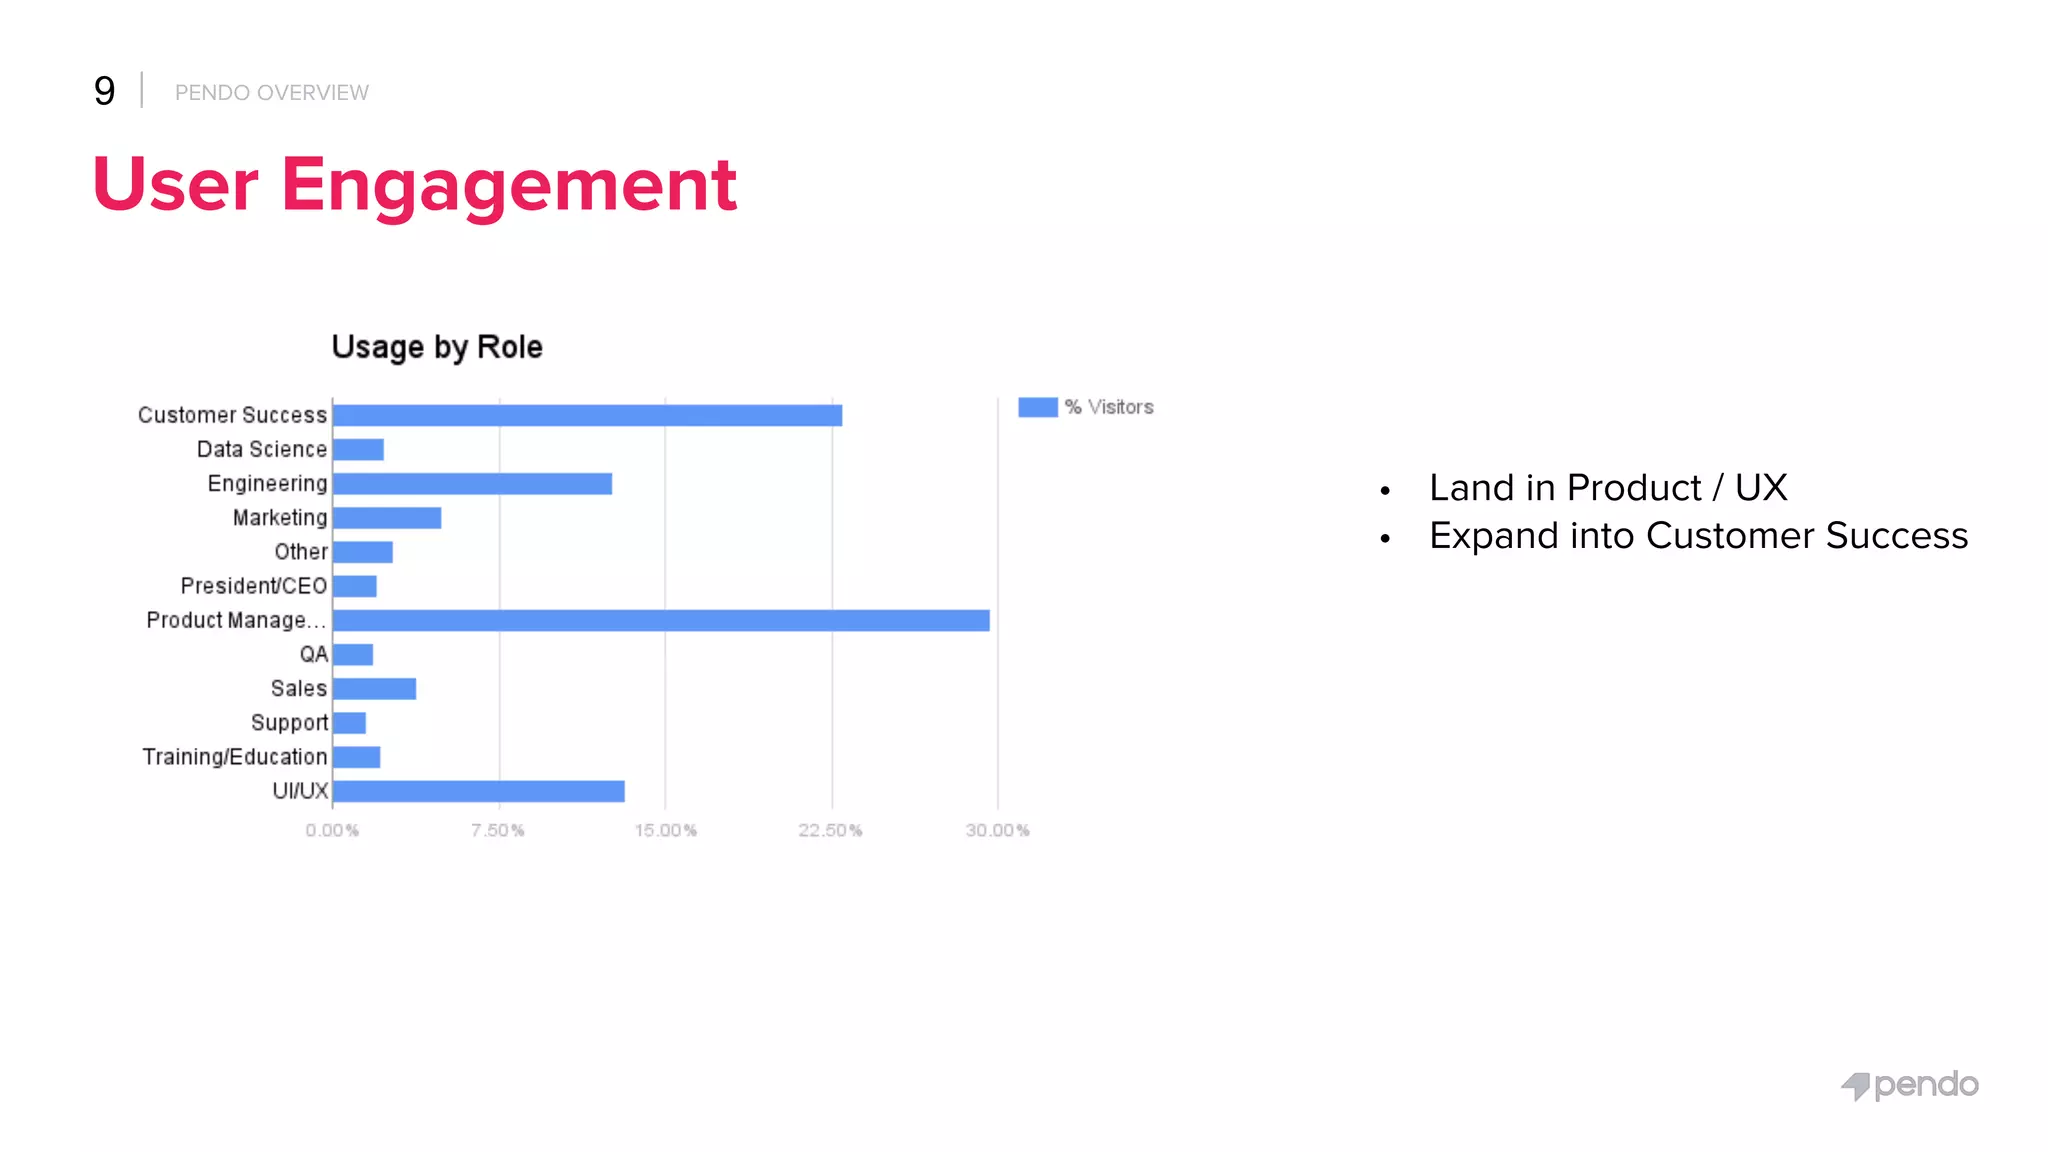
  • User adoption by role: Product Management (~30%), Customer Success (~22%), UI/UX (~~13%), Engineering (~12%), Marketing & others smaller — shows product lands in Product/UX and expands into Customer Success (Slide 9).
  • ASP / Deal size: Average Revenue Per New Customer trending up with a notable step-up starting 2Q17/3Q17 tied to a minimum price increase (Slide 18).
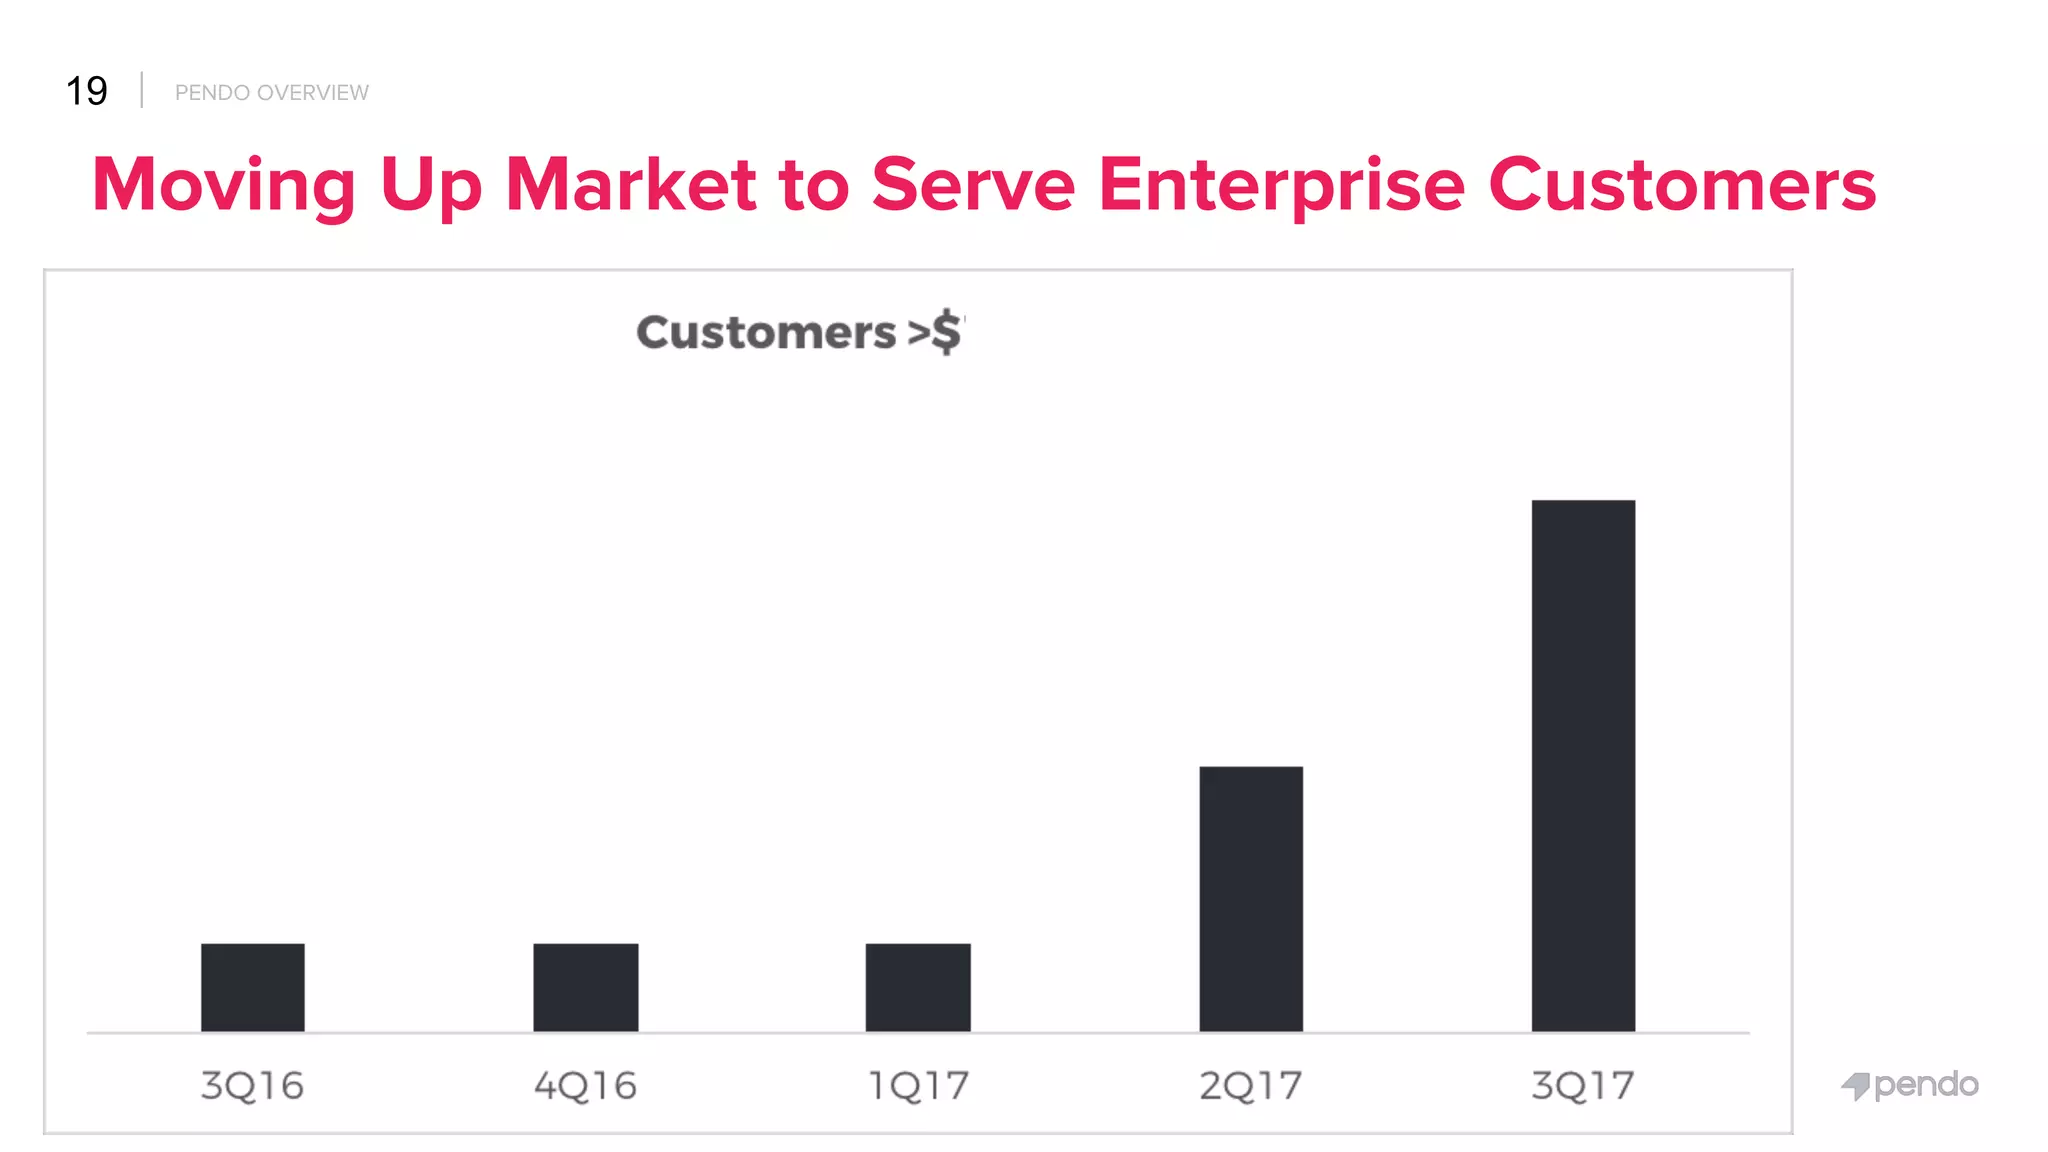
  • Move up‑market: number of customers above a higher revenue threshold grows (Slide 19), indicating success selling larger deals / enterprise expansion.
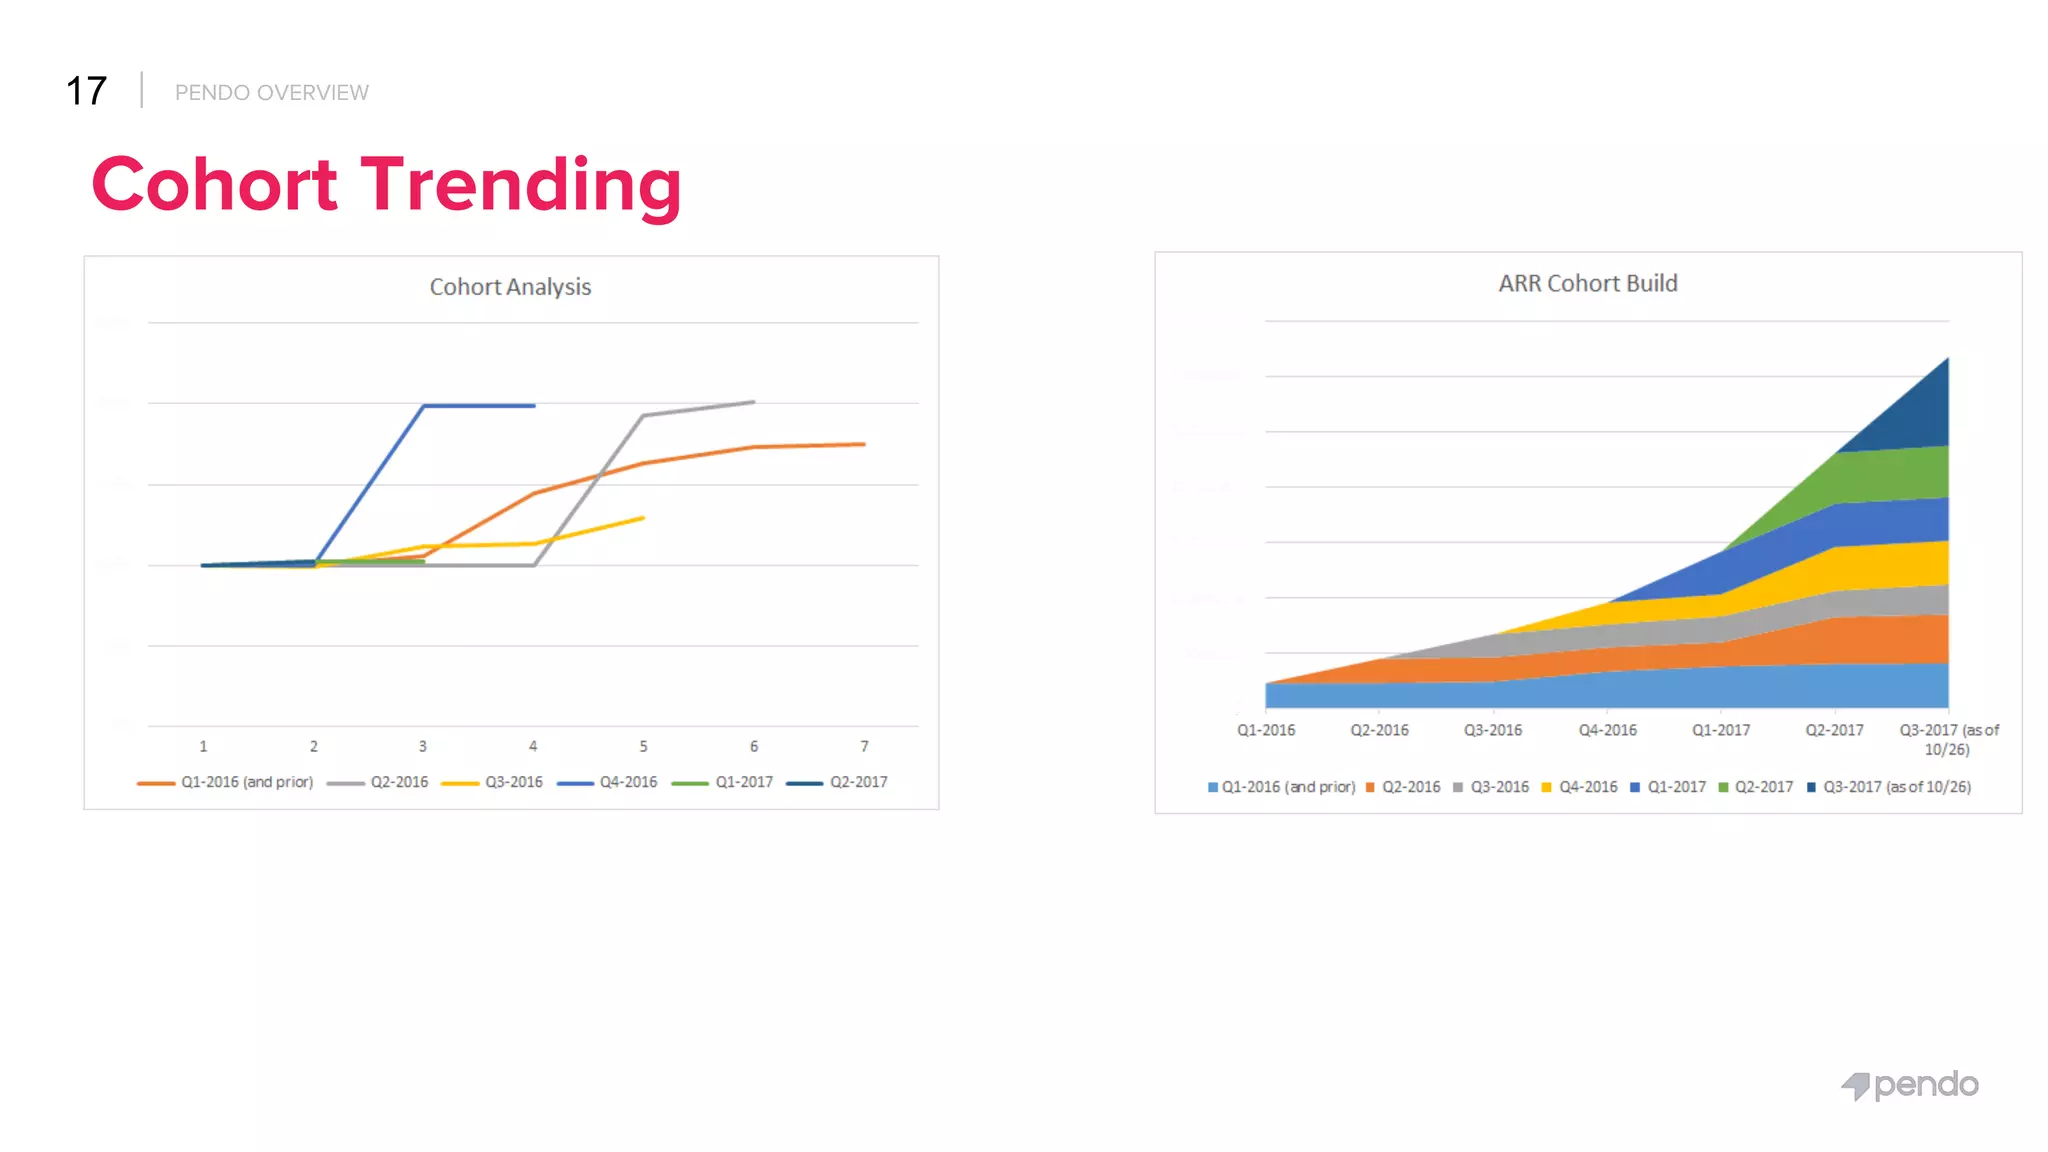
  • Cohort analysis and ARR cohort build visuals indicate improving retention and increasing ARR build from cohorts over time (Slide 17).
  • Sales capacity: Sales quota capacity and ramp charts indicate sales productivity scaling (Slide 16).

These visuals collectively show healthy growth dynamics (new bookings + expansion + rising ASP), though exact dollar figures are not legible in the provided images.


Competitive Positioning

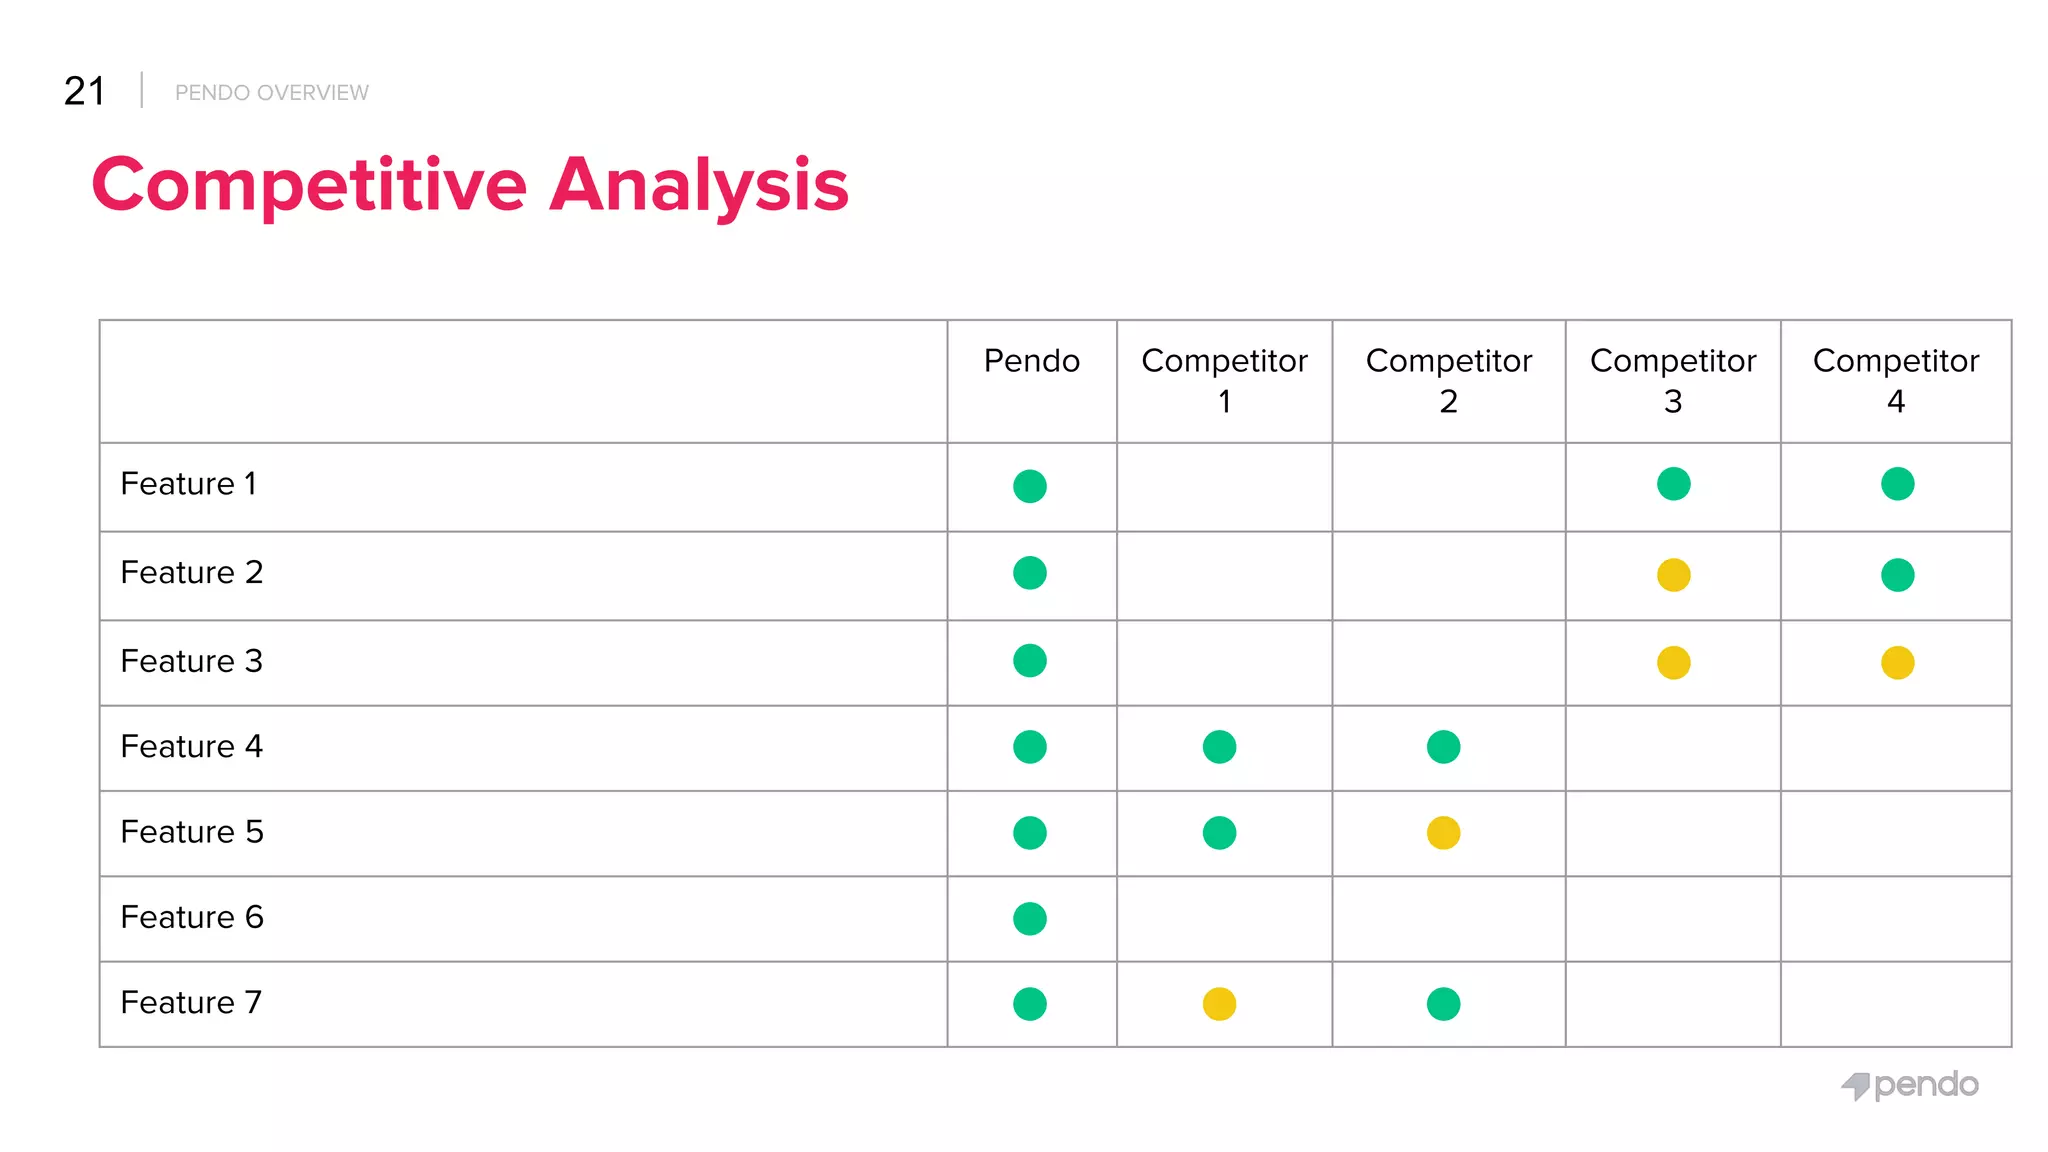
  • Competitive matrix (Slide 21) portrays Pendo as feature-complete across multiple product capabilities (green indicators), with competitors having gaps (some yellow/orange).
  • Differentiators emphasized:
    • Integrated approach: replaces 3–4 disparate tools with a single product experience platform (Slide 7).
    • Data-first capture (full clickstream + metadata) enabling both analytics and targeted in-app guidance (Slides 5–6).
    • Targets product/UX decision makers first (Slide 14), enabling organic in-company expansion (Slide 9 usage distribution).
  • Messaging positions Pendo between analytics vendors, in-app messaging tools, and user-feedback tools — combining those capabilities as the defensible product advantage.

Team

  • Founding/executive team shown with photos and prior company experience from Google, Rally Software, Cisco, Red Hat (Slide 2). Titles shown include CEO, CTO, VP Product, VP Marketing, VP Customer Success, VP Sales, VP Finance.
  • Company size shown ~56 employees (Slide 2). Emphasis on product-leader backgrounds and relevant domain experience.

Go-to-Market Strategy

  • Primary GTM: direct sales, mostly inside sales (Slide 14).
  • Target segments: B2B web-based businesses, initial target persona Product Management / UX teams (Slide 14).
  • Expansion play: land in product/UX teams and expand into Customer Success and other functions (Slide 9).
  • Pricing: monthly active end users per product encourages adoption and scale within customers (Slide 14).
  • Sales enablement: Evidence of sales quota capacity ramping, and sales capacity meeting/exceeding bookings goals (Slide 16).

The Ask

  • The deck indicates capital history and future plans: “Raised $11M to date” (Slide 2). Slide 23 references a Funding Plan of “$15M Series B, Q1 FY18” — so the deck appears prepared for a later-stage fundraising conversation as well.
  • For the Series A context provided by you: the company raised $11M (Series A). Within the deck itself the explicit active ask for Series A is not shown; the deck signals future Series B target of $15M (Slide 23).

Investor Deep Dive

Executive summary, strengths & red flags

Executive Summary

Pendo presents itself as an integrated "product experience" platform that captures product usage data, delivers in-app guidance, and collects contextual feedback to help product, UX and customer-success teams drive adoption and retention. The deck emphasizes rapid ARR growth, improving average deal size, expanding enterprise wins, and a strong founding team from Google/Rally/Cisco/Red Hat — all classic signals for software investors. The deck is notable for clear product positioning (analytics + in-app guidance + feedback), concrete user-role adoption data, and early evidence of unit-economics improvements (higher ASPs and move-up-market).

Key Strengths

3 identified

1

Clear, differentiated product positioning — analytics + in-app guidance + feedback in one product (Slides 5–7). This is a compelling value prop for product-led SaaS companies.

2

Early evidence of strong unit economics and move-up-market — rising ASPs, expanding enterprise customers and positive cohort behavior (Slides 17–19). Those are exactly the signals investors want to see pre‑scale.

3

GTM and adoption data aligned with product adoption playbook — landing in Product/UX and expanding to Customer Success is consistent and supported by usage-by-role data (Slide 9), suggesting organic expansion mechanics.

Red Flags & Weaknesses

3 identified

1

Hard-market sizing transparency — TAM/SAM/SOM visuals exist but numerical details are redacted/not legible (Slide 20). Lack of explicit numeric TAM weakens the market opportunity narrative.

2

Missing explicit unit-economics and customer economics detail — CAC, LTV, payback period, churn rates and ARPA by cohort are not clearly quantified in the visible slides (some cohort visuals exist but raw metrics are absent). Investors wanting granular economics will ask follow-ups (Slides 15, 17 show trends but not numbers).

3

Several redacted or unclear slides — customer lists, specific market numbers and some financials are redacted or not visible (Slides 13, 20, 23). This reduces credibility in a public or shared deck and forces Q&A for basics.

More Pitch Decks To Study

Compare structure, fundraising context, and investor-facing story across similar startup decks.