Compare your deck to Palantir

Compare Your Deck

Palantir Pitch Deck (2010)

SaaS
Stage: Various
Raised: Multiple
Year: 2010
Slides: 17
Outcome: IPO at $22B valuation

Pitch Deck

1 / 17
Palantir pitch deck - The Opening: Brand and Focus
Click to expand

Deck Analysis

This deck presents Palantir as an enterprise SaaS company that solves large-scale data integration and analytics problems for government and commercial customers. It combines a clear problem statement, product differentiation (Gotham and Foundry), financial trajectory, business-model explanation and competitive positioning to justify a growth story that eventually led to an IPO. Notable elements are the focus on product-led expansion, a pilot-to-scale sales motion, and visual emphasis on revenue momentum and unit economics — all framed to convince investors that heavy upfront investment in pilots turns into high contribution margins over time.

The Opening: Brand and Focus

The Opening: Brand and Focus

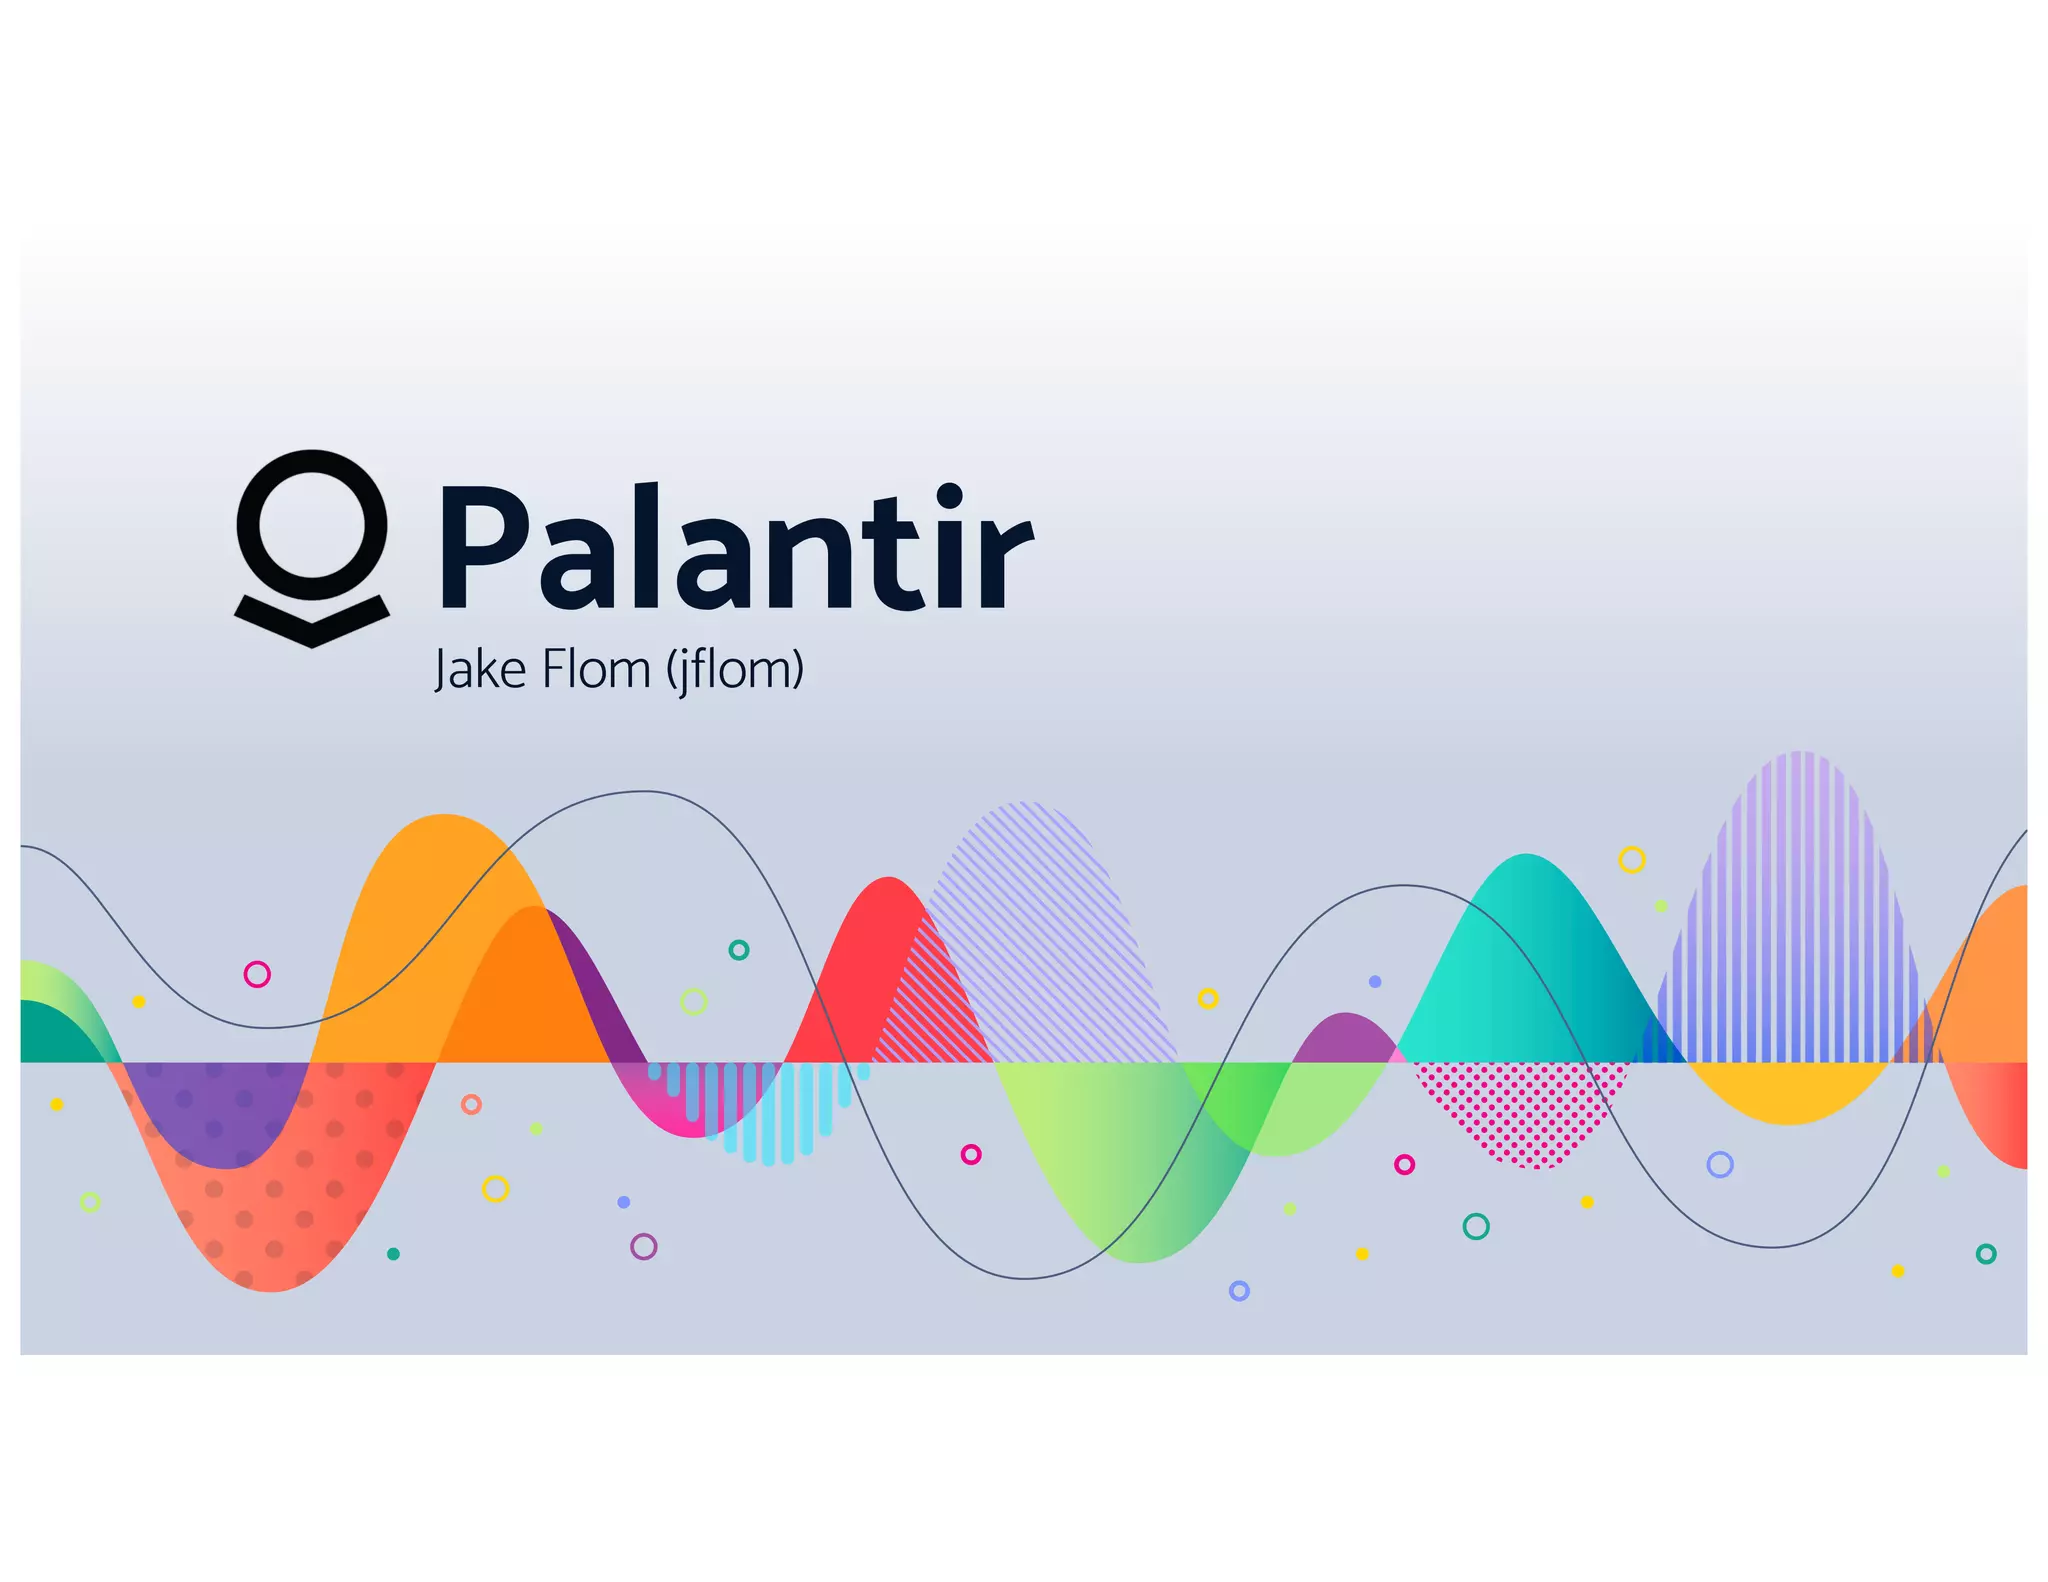
Slide 1 establishes the company brand cleanly: a simple logo, the Palantir name and presenter attribution. The large, uncluttered visual and ample negative space make the slide feel professional and sets expectations for a structured presentation. Using a single, high-quality opening slide helps create a first impression of polish and confidence—important for signaling credibility to investors.

Founders can learn how a restrained opening slide primes an audience. Keep identity, speaker and role visible but don’t overload the first frame with metrics or details; let subsequent slides tell the story. The design choice to be visually appealing without verbose text signals discipline and prepares the listener for a focused pitch.

Key Takeaway: Start with a clean, branded cover that signals professionalism and prepares the audience for a concise, structured narrative.
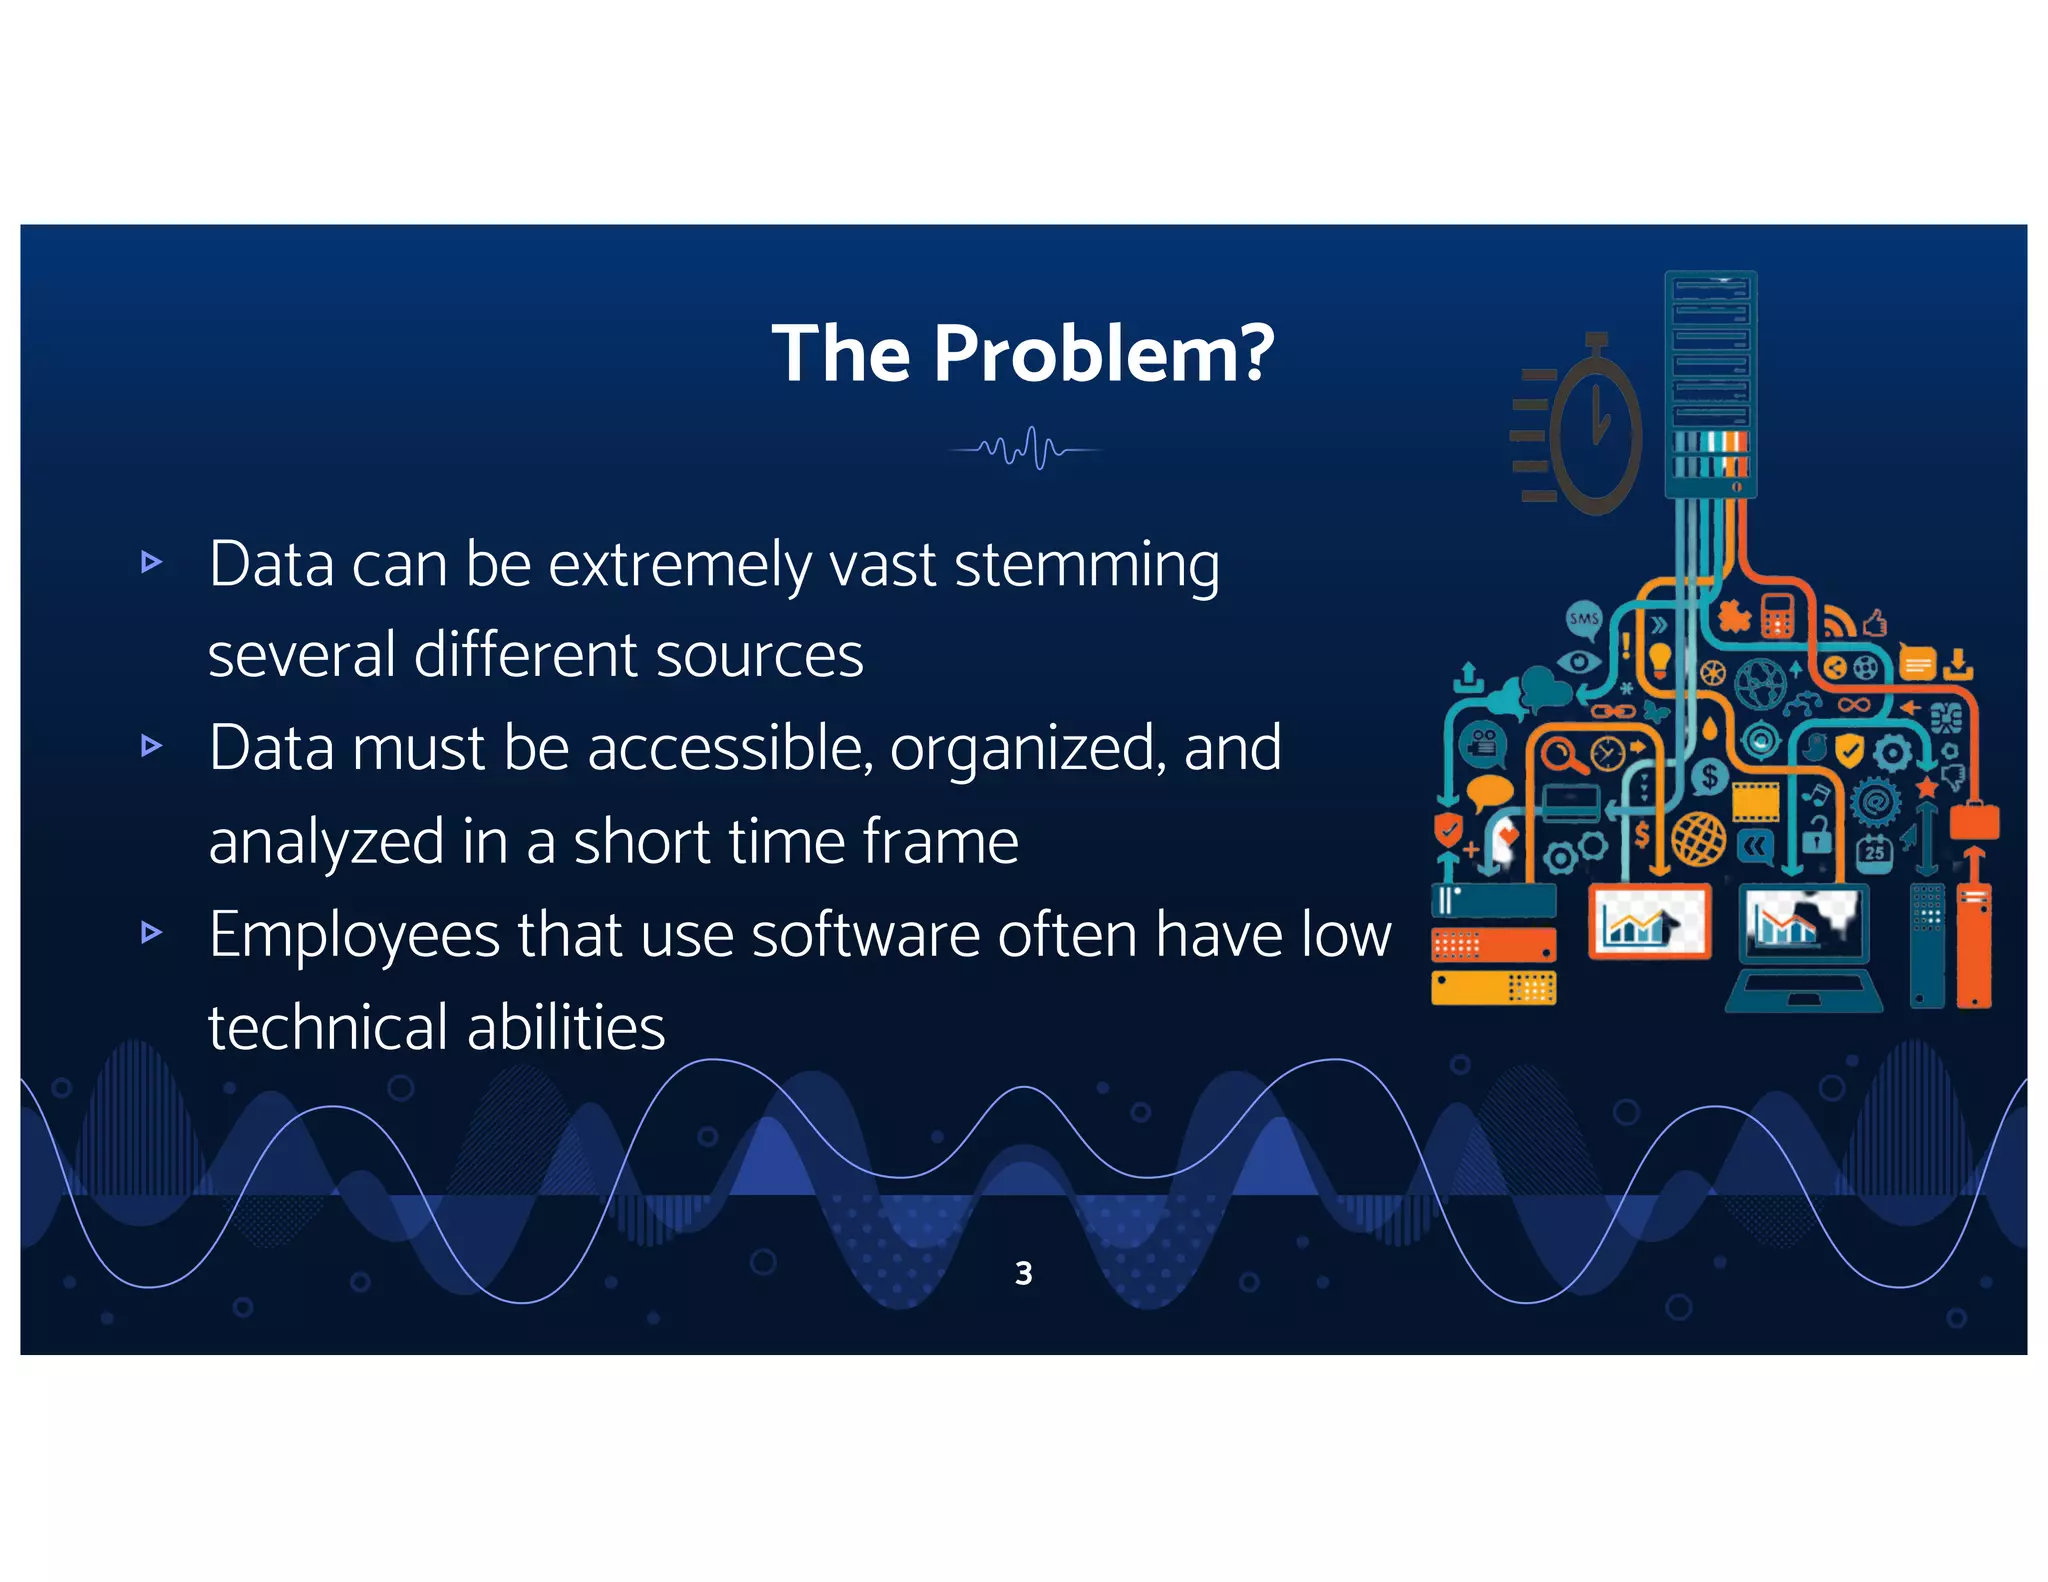
Framing the Problem: Data Complexity & User Limitations

Framing the Problem: Data Complexity & User Limitations

Slide 3 frames the market opportunity in plain language: data is vast, fragmented across sources, time-sensitive, and end-users often lack technical skills. The slide blends three succinct bullets with a supporting data pipeline illustration — these two elements together make the problem both relatable and concrete. This approach helps investors quickly understand the pain point and why a platform solution is necessary.

For founders, the lesson is to articulate both the scale of the problem and the human friction (non-technical users) that prevents simple fixes from working. Pairing a short, well-crafted set of bullets with a visual metaphor (pipes, servers, dashboards) communicates both technical depth and user-centric value, which appeals to both technical and non-technical stakeholders.

Key Takeaway: Define the problem crisply and pair it with a simple visual to show why existing tools don’t solve the real, human-facing friction.
Product Differentiation: Gotham vs. Foundry

Product Differentiation: Gotham vs. Foundry

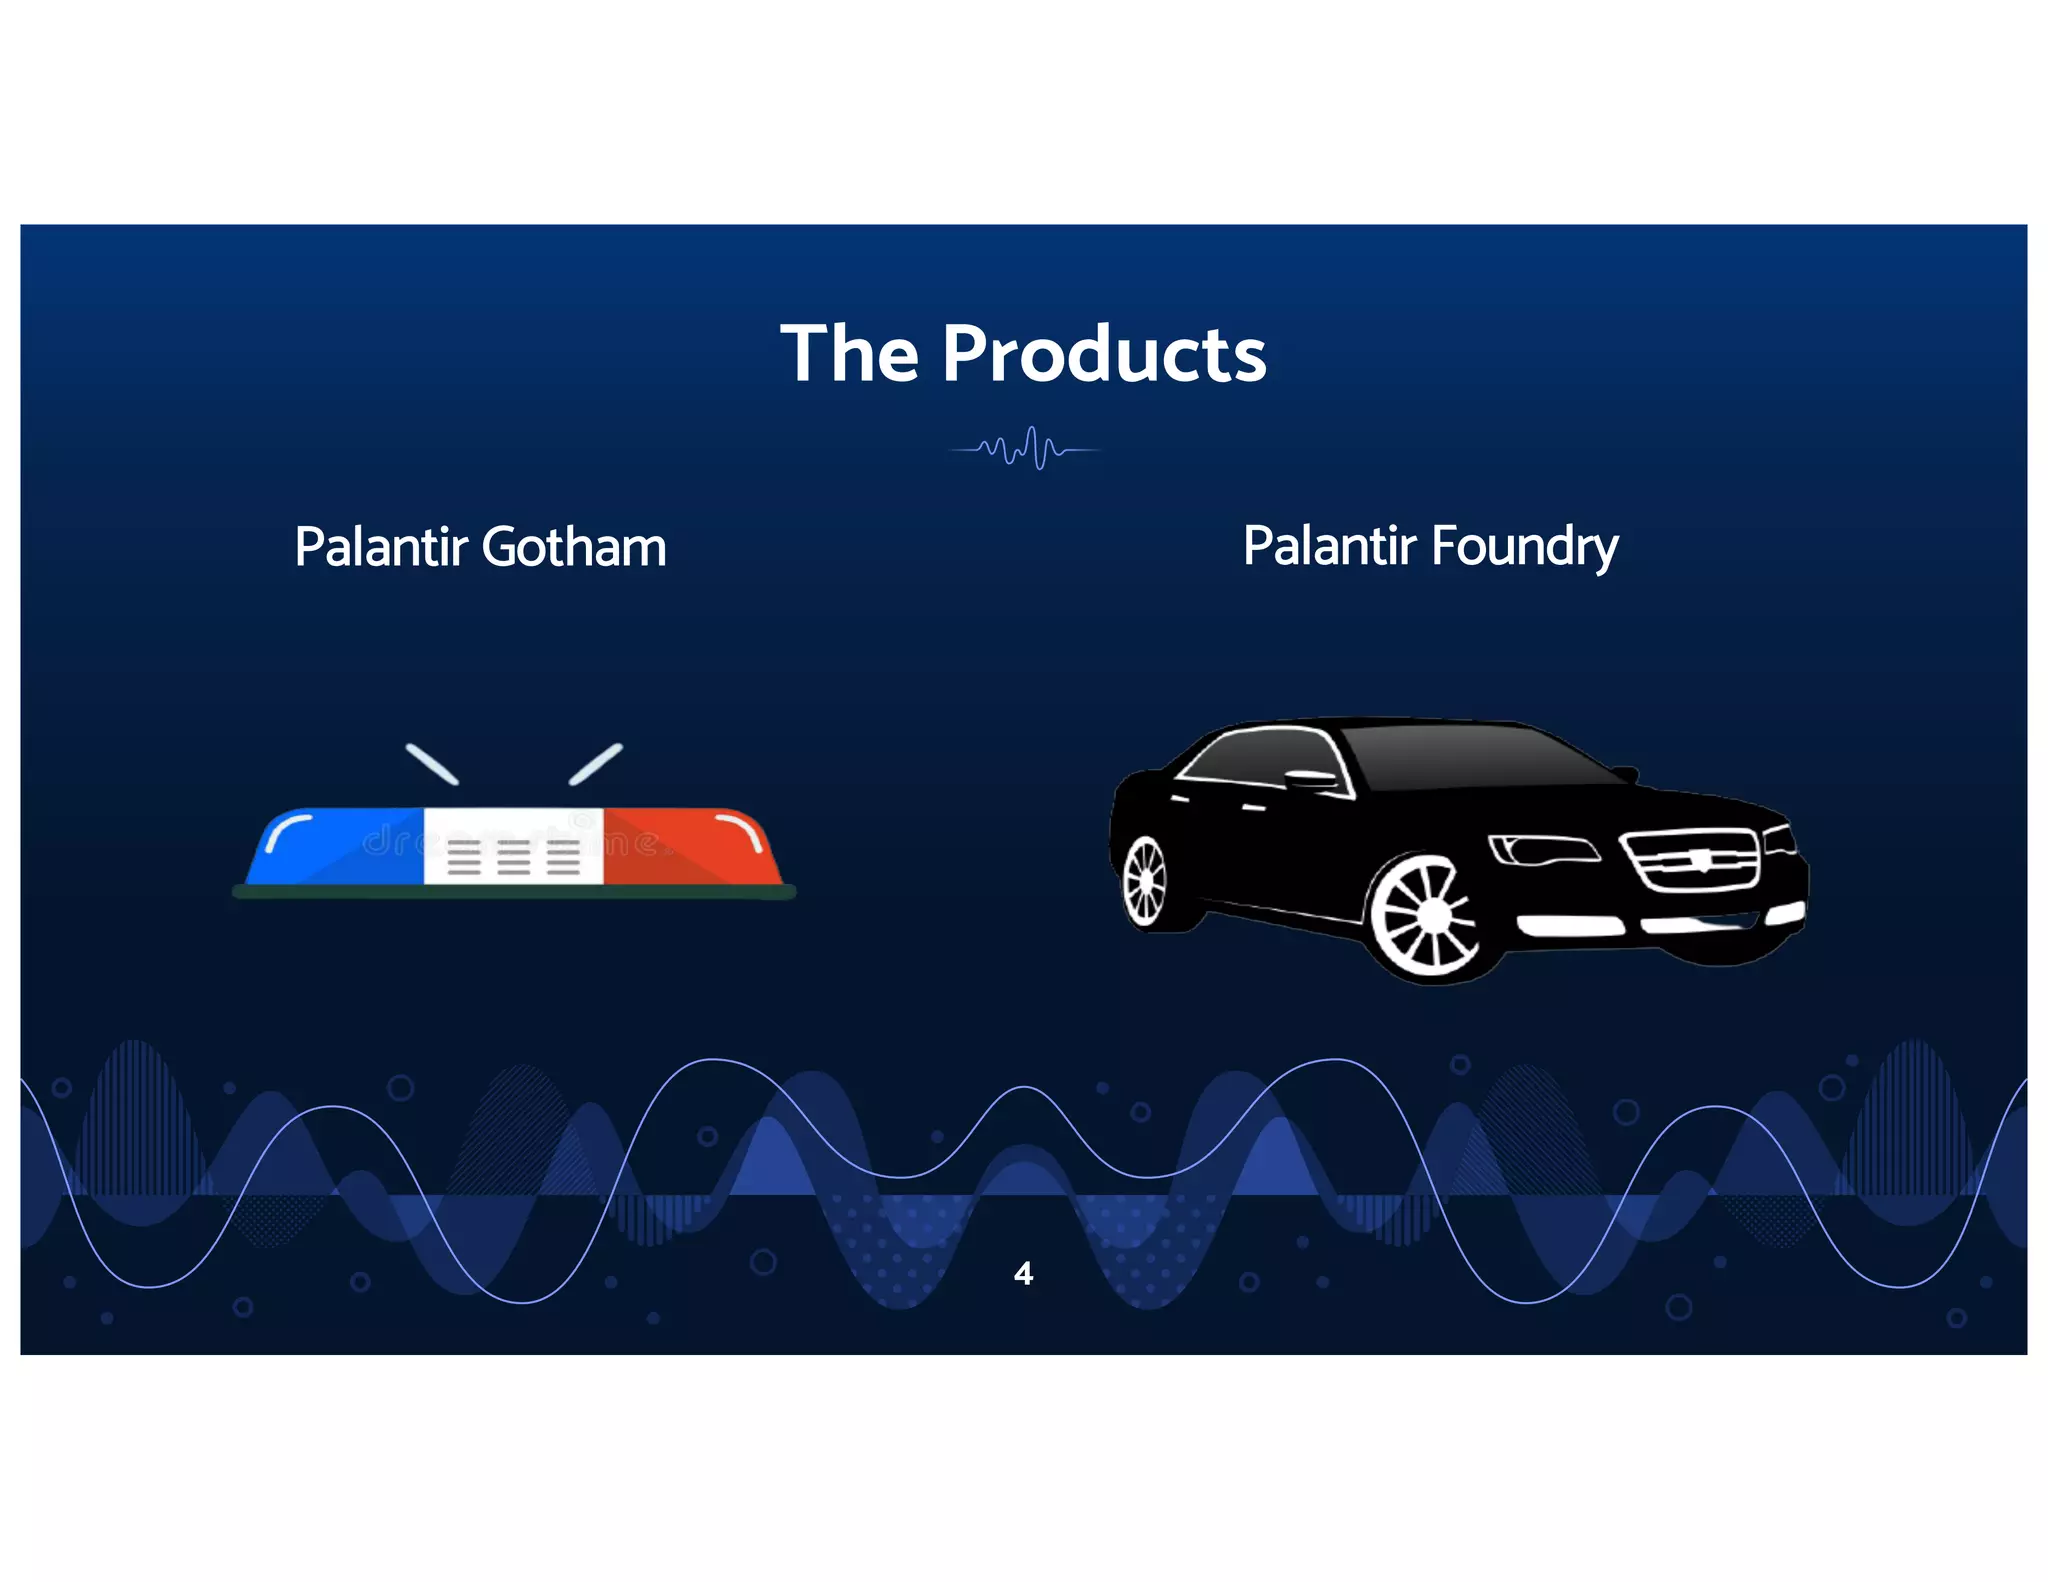
Slide 4 highlights the company’s product split—Gotham for government and Foundry for commercial—using straightforward labels and icons (police siren, car). This communicates that Palantir addresses distinct vertical needs while implying shared underlying technology. The visual shorthand is effective because it quickly tells investors there are multiple addressable markets and distinct go-to-market motions.

Founders should note the value of naming and positioning products clearly. If you serve different customer types with the same tech, present the split early and succinctly: it helps investors map revenue diversification and risk. Small, well-chosen icons can replace paragraphs of text and make product-market fit immediately legible.

Key Takeaway: If you have distinct product lines for different customer segments, label them clearly and use concise visuals to show market breadth without overexplaining.
Financial Snapshot: Revenue Growth vs. Profitability

Financial Snapshot: Revenue Growth vs. Profitability

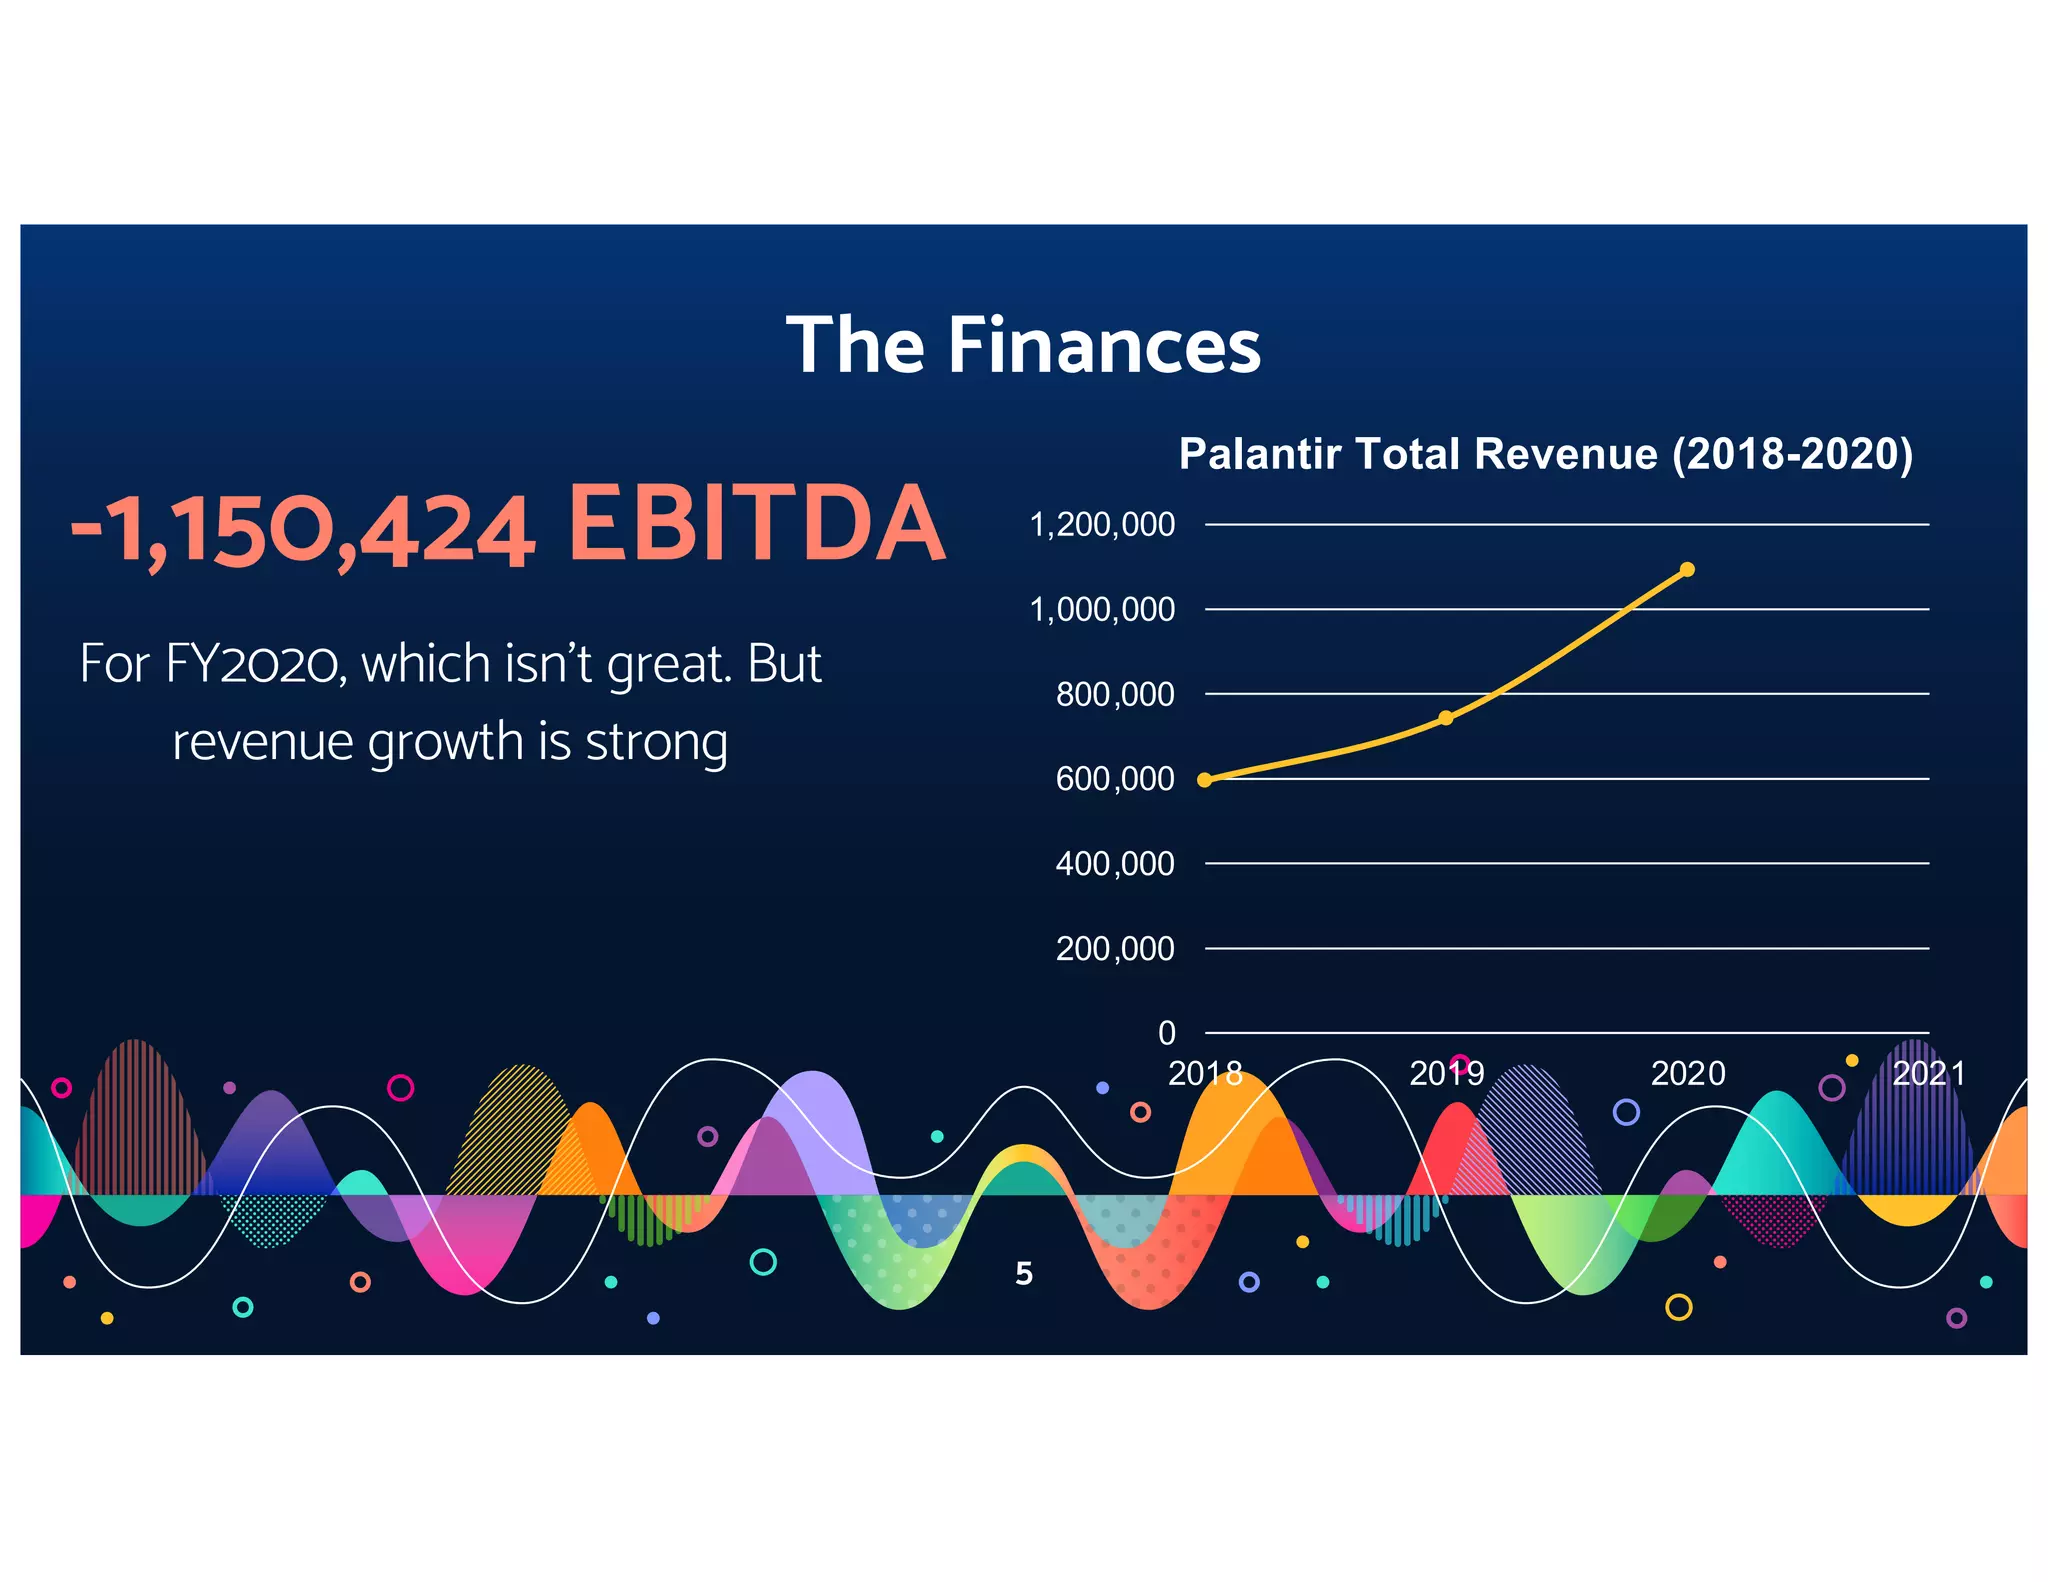
Slide 5 juxtaposes a large negative EBITDA number with a revenue growth chart. The honesty about FY2020 EBITDA being negative is counterbalanced by a clear revenue curve showing strong upward momentum — a narrative investors often accept for high-growth enterprise SaaS. The design emphasizes growth while not hiding losses, which builds trust and frames the business as scaling into profitability over time.

The lesson for founders: be transparent about current unit economics but contextualize them with growth metrics and a path to improved margins. Present both the problem (losses) and the upside (revenue acceleration) on one slide so investors can make a balanced judgment quickly.

Key Takeaway: Show losses honestly but pair them with convincing growth charts and narrative to signal a credible path to positive economics.
Market Reaction / Momentum: Stock Performance Visual

Market Reaction / Momentum: Stock Performance Visual

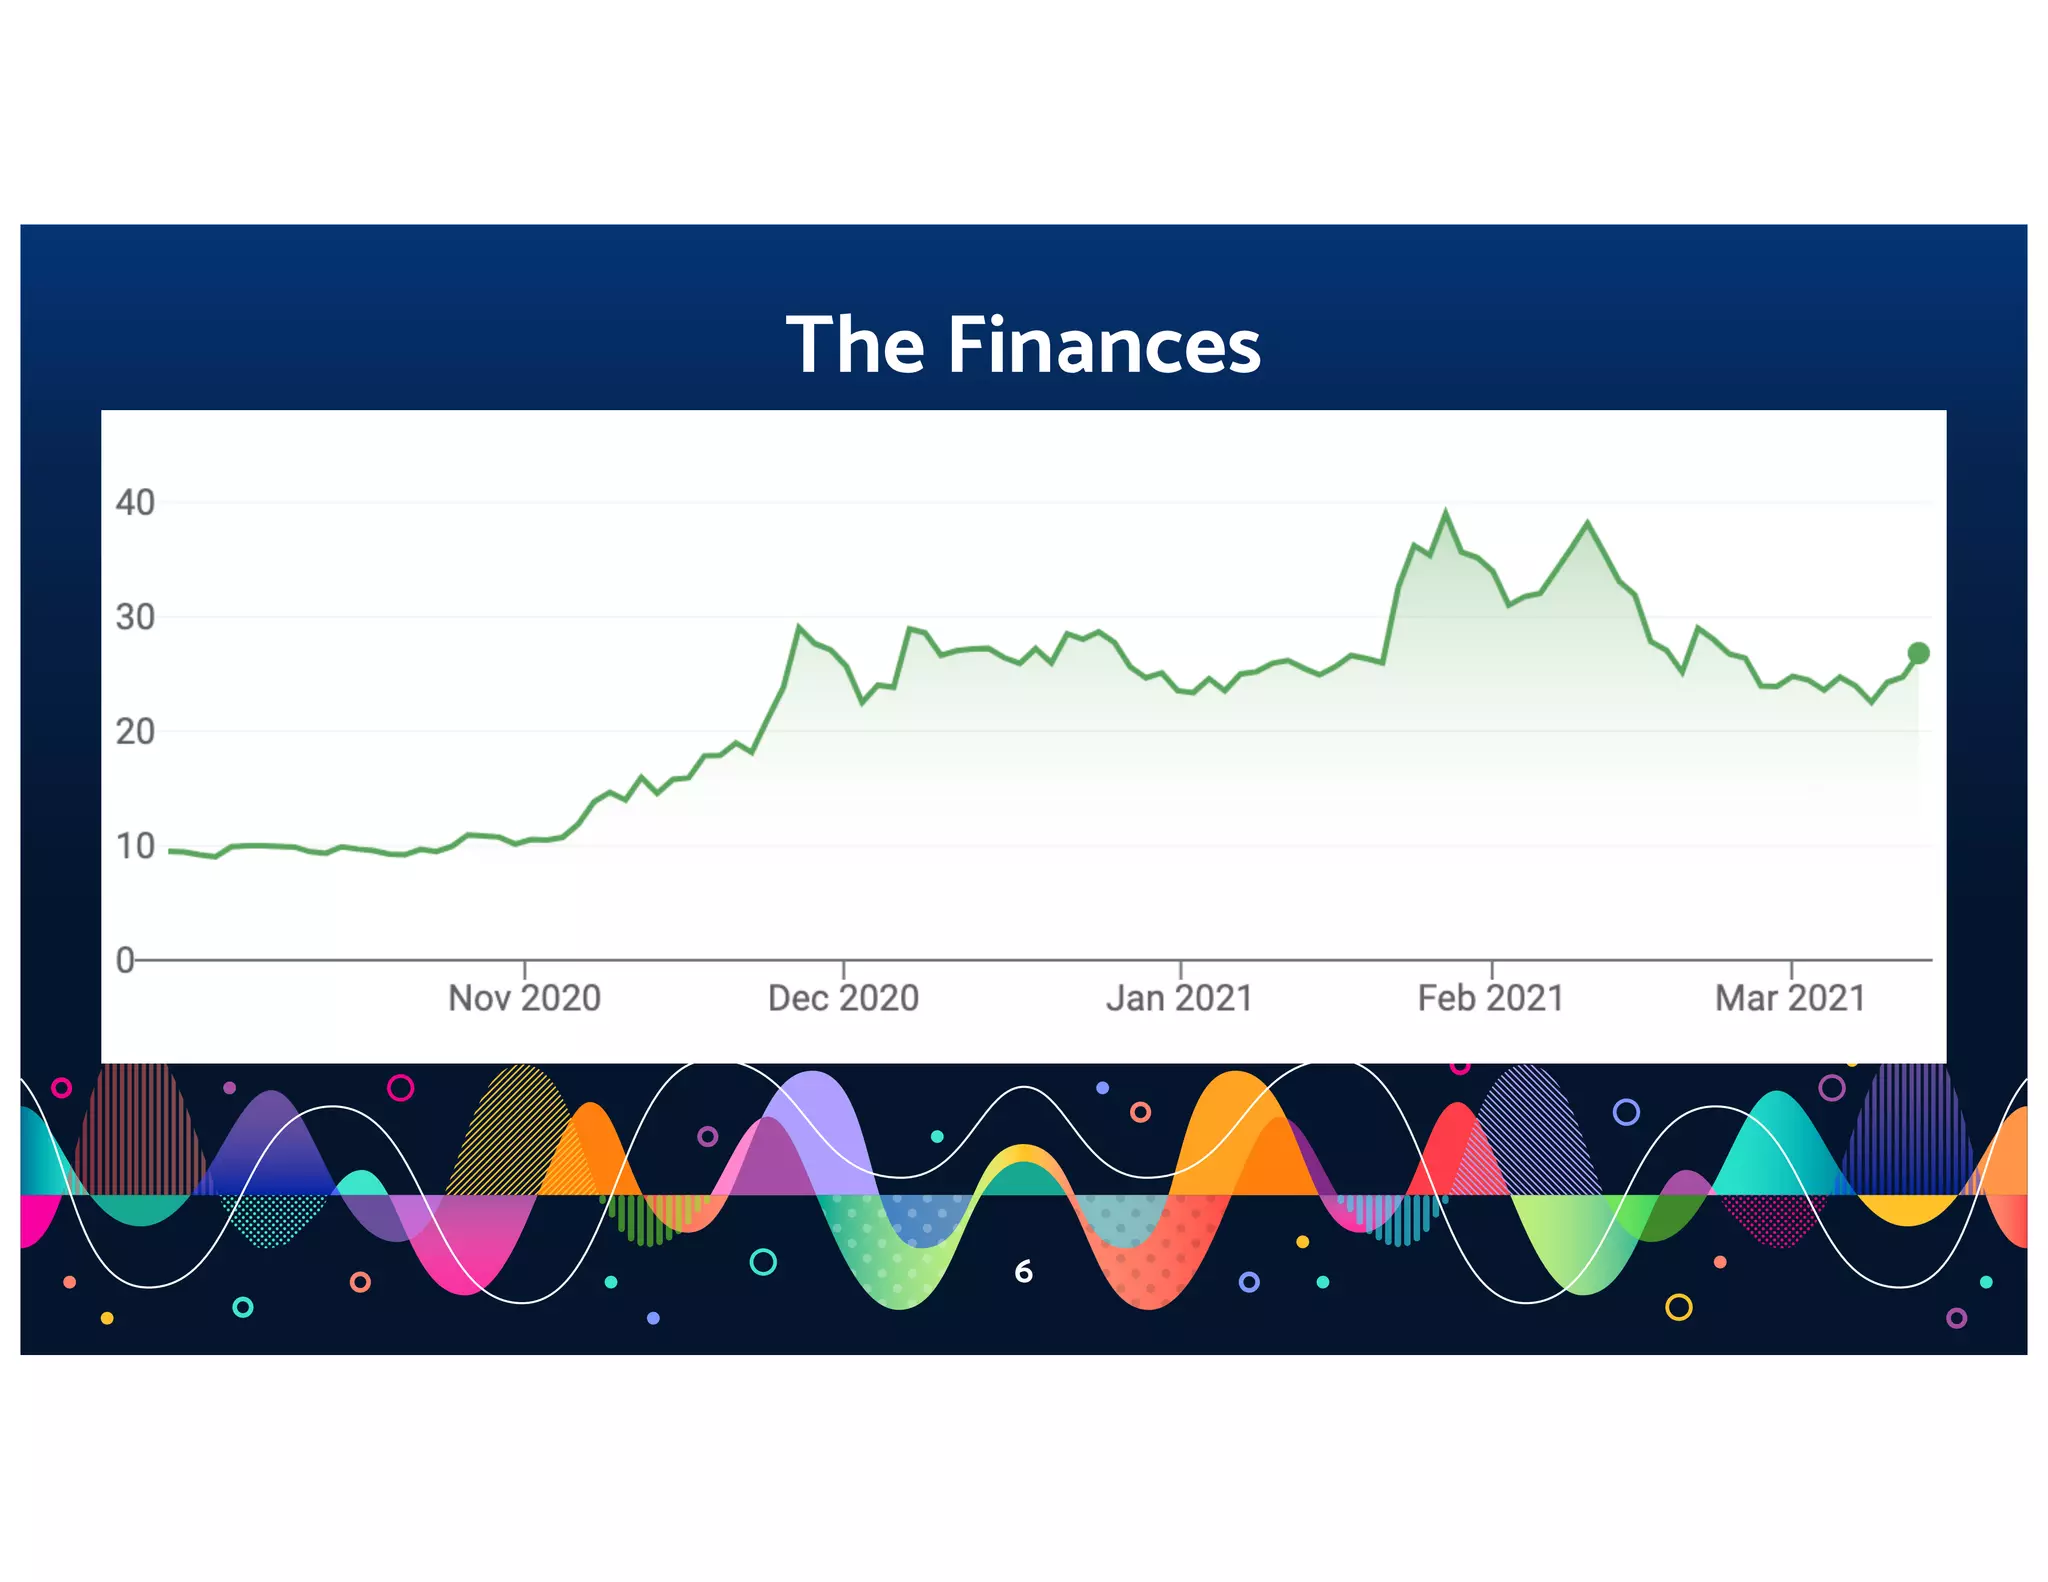
Slide 6 presents a stock-price/time chart that demonstrates market enthusiasm and momentum following public listing, using a simple line area chart. Including market performance is a validation signal — it tells potential investors and partners that the public markets have recognized value, reinforcing the narrative of strong demand. The choice to include a price chart is a strategic credibility play for later-stage audiences.

For other founders, this shows how third-party validation (customer logos, analyst coverage, or stock performance) can be leveraged to strengthen the story. Use such slides carefully: they work best when the numbers are supportive and you can explain the drivers behind the movement (e.g., product launches, contracts).

Key Takeaway: Use market or third-party validation charts to credibly signal demand and momentum, but be ready to explain the drivers behind the movement.
Business Model: From Pilot Costs to Scale Economics

Business Model: From Pilot Costs to Scale Economics

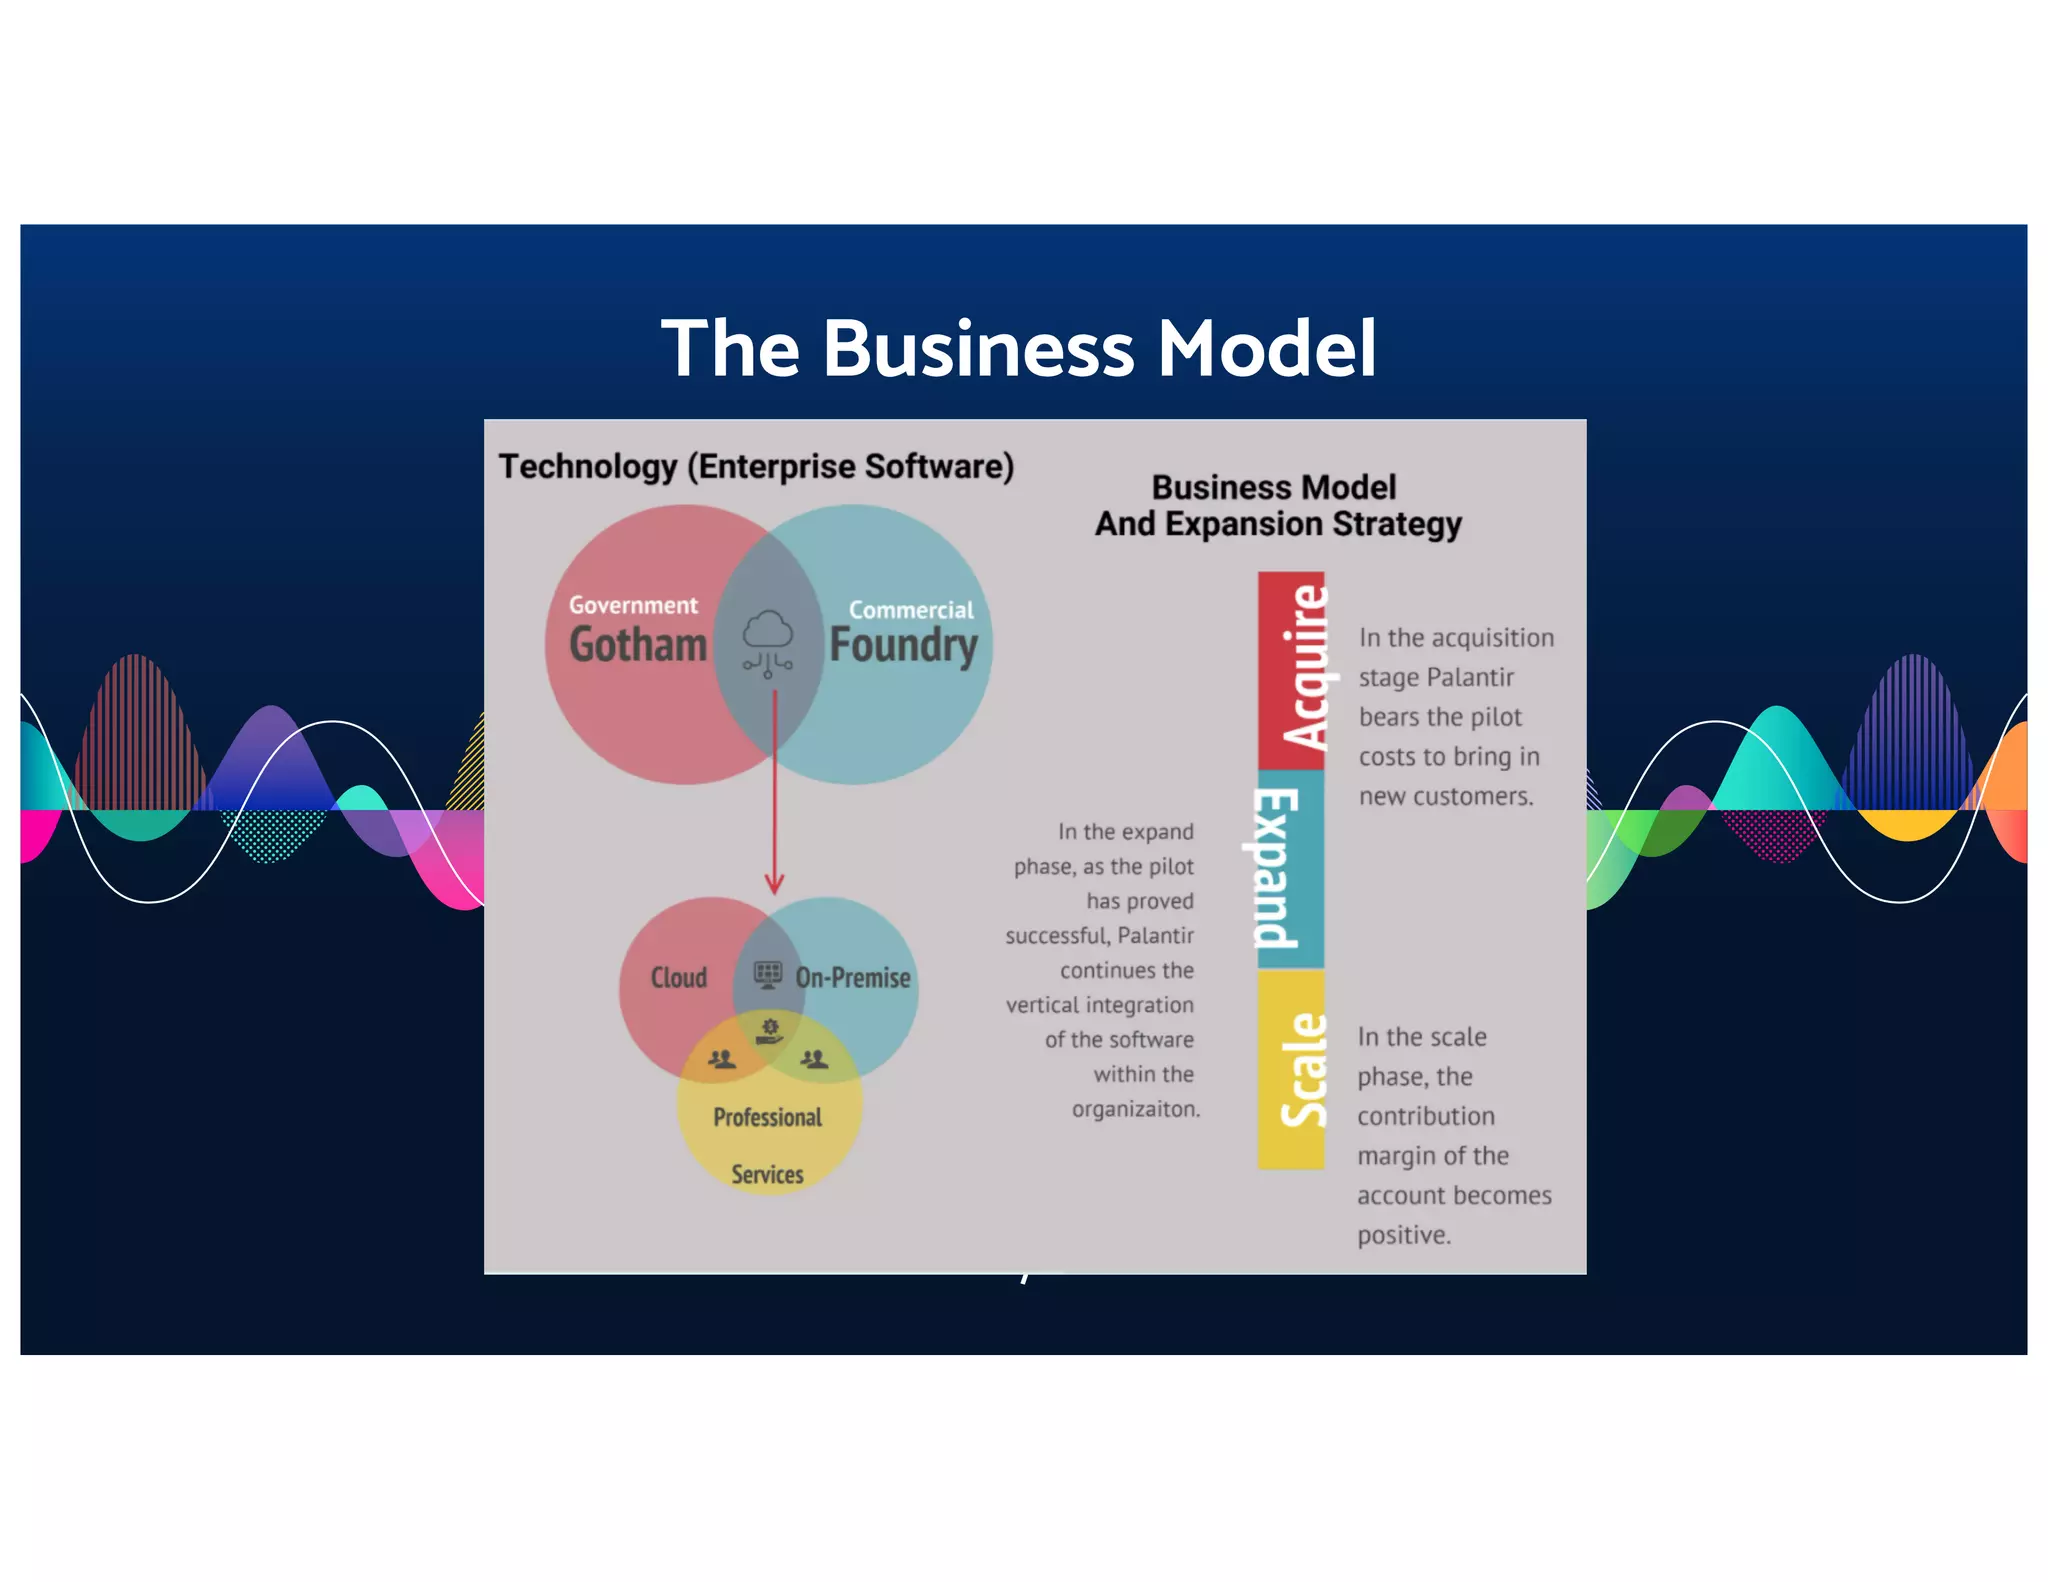
Slide 7 (and slide 8 content in the deck) explains Palantir’s acquisition-expand-scale model: Palantir bears initial pilot costs to demonstrate value, then expands and ultimately achieves positive contribution margins. The visual Venn and the acquisition/expand/scale vertical bar create a clear lifecycle picture of how customer economics change over time. This is a compelling way to justify large upfront CAC because it links pilot investment directly to durable account-level economics.

Founders should emulate this transparency: outline the customer journey, show why pilots are necessary, and quantify how unit economics improve as the product is adopted. A clear pilot-to-scale narrative reduces investor concern over high early spending and reframes it as an intentional investment to create defensible, high-margin accounts.

Key Takeaway: If your GTM requires heavy upfront pilot costs, map the customer lifecycle visually and show how economics improve as accounts scale to justify the initial investment.
Team & Differentiation: Leadership and Secret Sauce

Team & Differentiation: Leadership and Secret Sauce

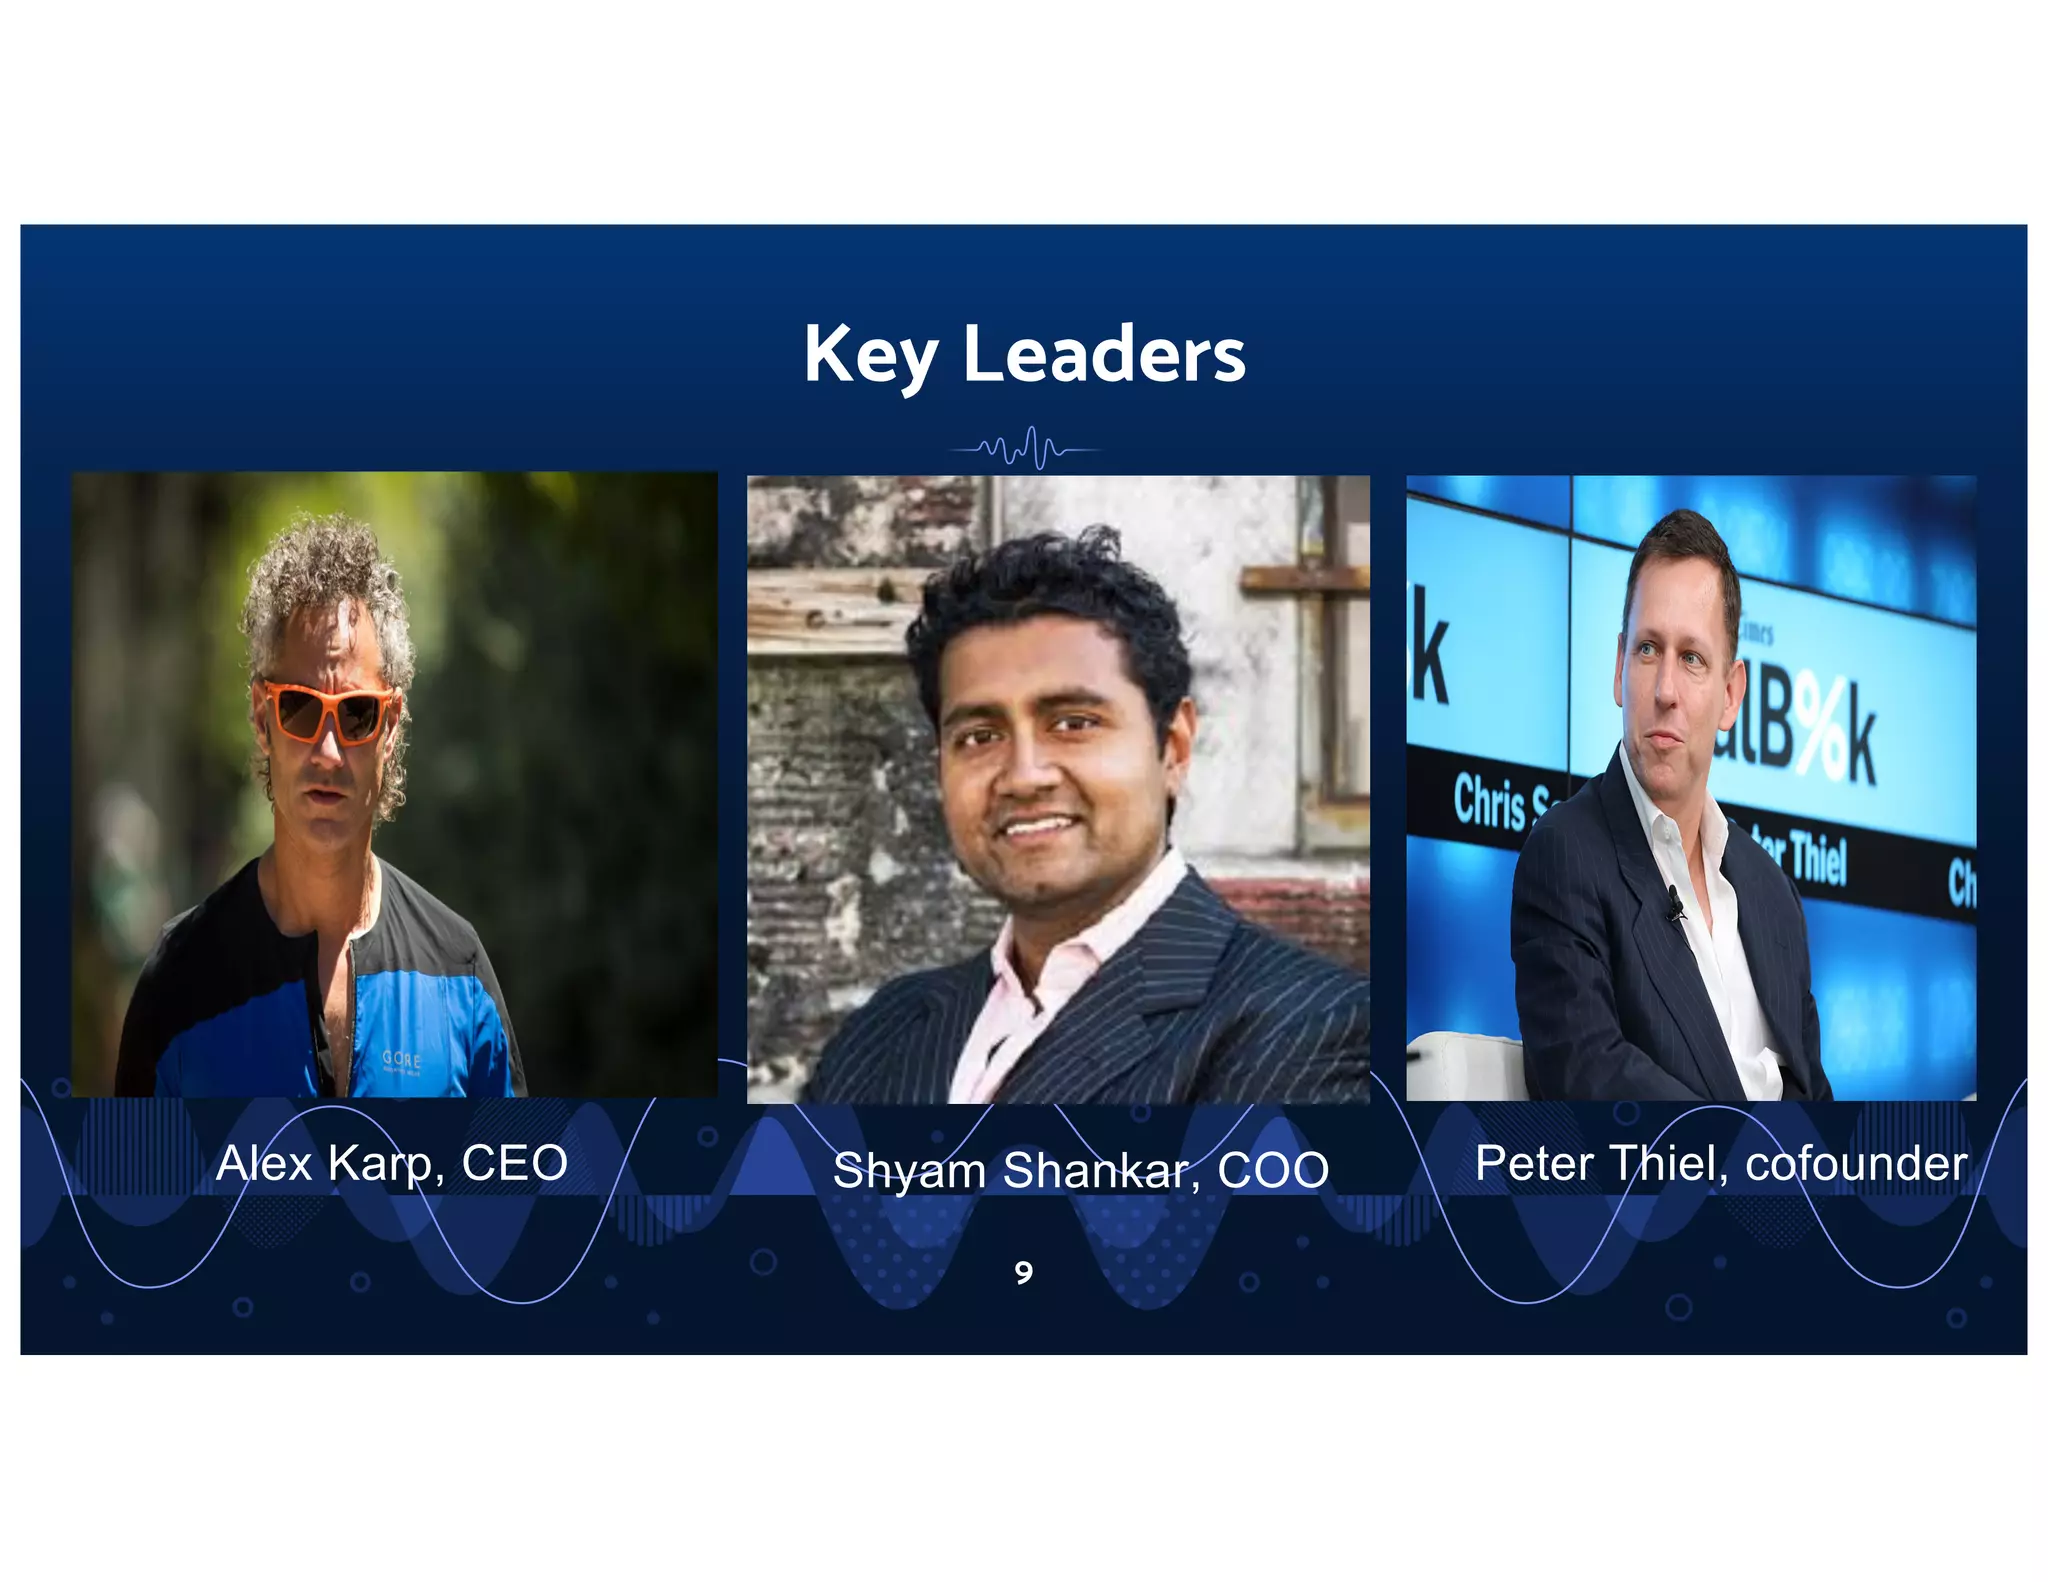
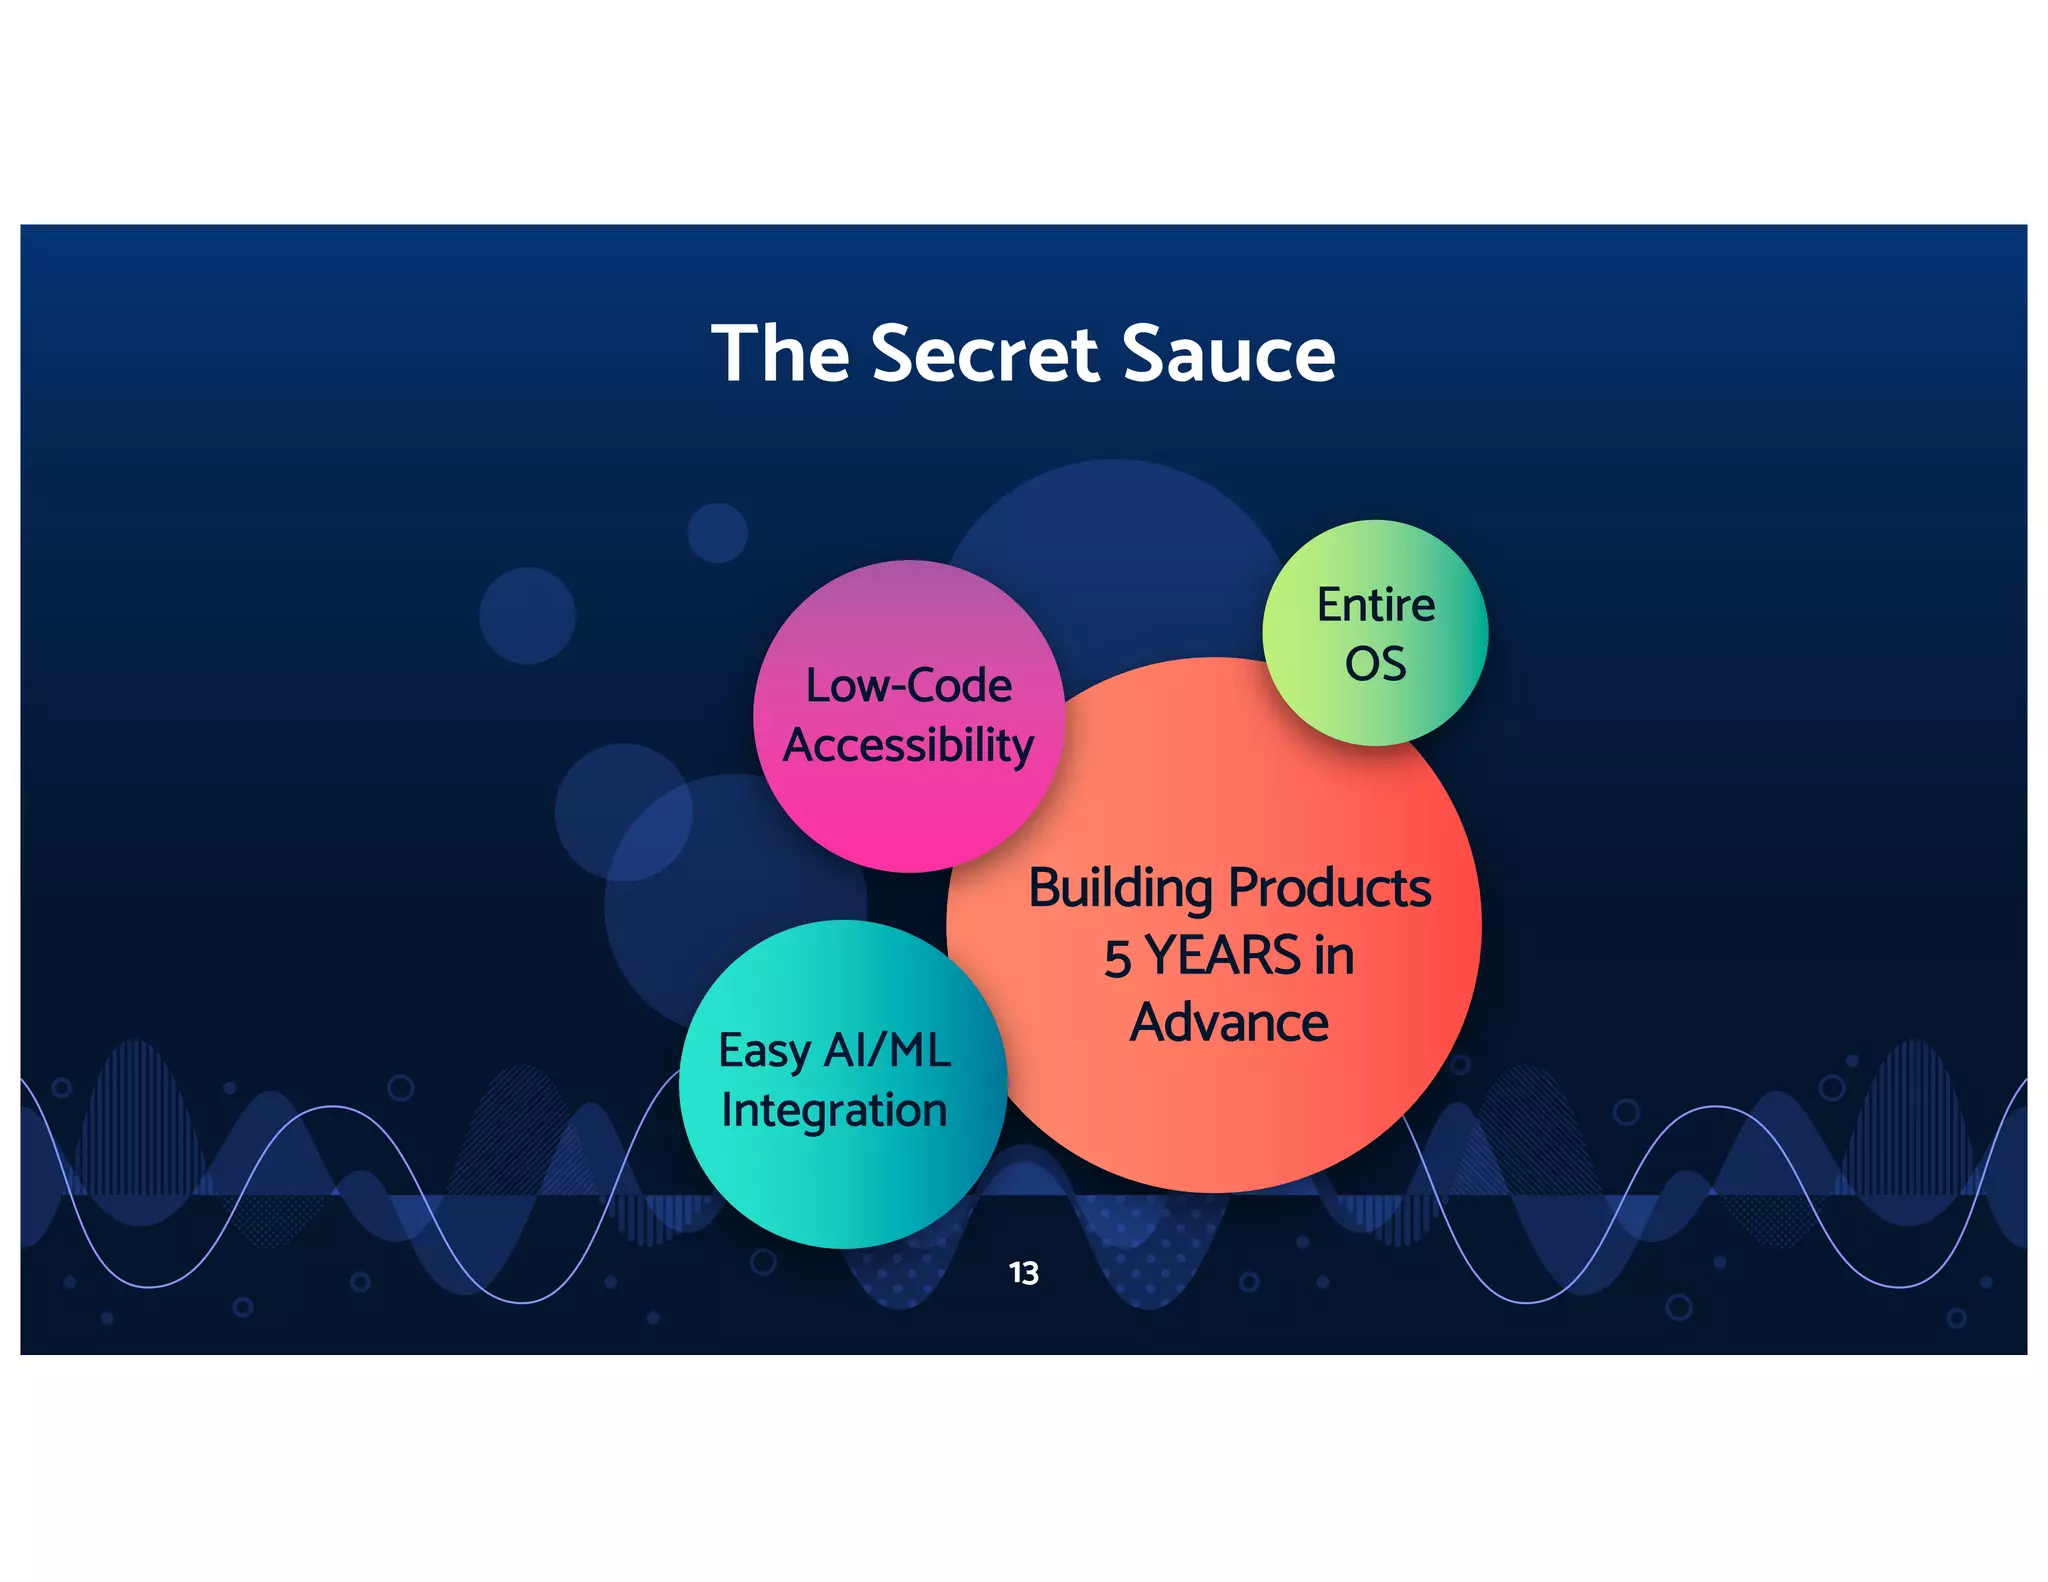
Slide 9 presents key leaders (CEO, COO, cofounder) giving the deck a human face and signaling leadership depth; slide 13 (The Secret Sauce) articulates product advantages like low-code accessibility, integrated AI/ML, and building products years ahead. Together they connect experienced leadership to defensible technical differentiation. Emphasizing both team credentials and concrete product advantages addresses two central investor concerns: execution risk and defensibility.

Founders should explicitly link people to product strategy: show who will execute the technical roadmap and why the team’s background reduces execution risk. Also, codify your unique advantages (technical stack, data moat, operational playbook) into a short “secret sauce” slide so investors can quickly understand what’s not easily copied.

Key Takeaway: Combine leadership signals with a succinct 'secret sauce' summary that ties team capabilities to defensible product advantages.

Conclusion: Key Lessons

This deck succeeds by balancing honesty and ambition: it admits near-term losses while showcasing rapid revenue growth, explains why heavy upfront investment is strategic (pilot → expand → scale), and pairs product differentiation with credible leadership. Visual clarity (simple opening, problem statement, product split, lifecycle visuals and financial charts) drives a coherent narrative that supports Palantir’s valuation and IPO trajectory. For founders building enterprise SaaS raises, actionable advice is: (1) define the customer problem crisply and show why simple tools won’t work; (2) map the customer economics over time to justify early spending; (3) present transparent financials paired with growth evidence; (4) articulate a concise, defensible 'secret sauce'; and (5) use simple, high-quality visuals to make a professional first impression. Following these principles helps turn complex technical stories into investable narratives.

Full Deck Analysis

12 sections

Overview

Company: Palantir Technologies
Round: Various (Multiple funding rounds)
Year: 2010
Outcome: IPO at $22B valuation (August 25, 2020)
Presenter: Jake Flom (jflom)

Executive Summary

This 2010 pitch deck presents Palantir as a comprehensive data integration and analytics platform with dual products targeting government (Gotham) and commercial (Foundry) markets. The deck is notable for its bold, design-forward presentation style combined with transparent acknowledgment of reputational challenges (ICE, NSA ties). Despite negative EBITDA of -$1.15M in FY2020, the company demonstrates strong revenue growth (from ~$600K in 2018 to ~$1.1M in 2020) and dramatic margin expansion (14% to 55% contribution margin over 18 months), validating its Acquire → Expand → Scale business model. The deck’s success in securing an IPO at a $22B valuation despite public controversy suggests that strong unit economics and government/enterprise traction can overcome reputational headwinds.

Problem Statement

**Slides 3 “The Problem?”**

The deck articulates three interconnected enterprise data challenges:

  1. Data Volume & Fragmentation: “Data can be extremely vast stemming several different sources”
    • Enterprises struggle with siloed, heterogeneous data systems
    • No unified view across operational systems
  2. Speed & Accessibility Constraints: “Data must be accessible, organized, and analyzed in a short time frame”
    • Decision-makers need rapid insights
    • Current tools require weeks/months for analysis
  3. User Technical Skill Gap: “Employees that use software often have low technical abilities”
    • Business users lack SQL/coding skills
    • Analytics tools require specialized data engineers
    • Bottleneck: dependency on technical talent

Problem Validation: The deck doesn’t provide quantitative validation (survey data, TAM analysis, customer pain point research). The problems are generic enough to apply to many enterprise software categories, limiting differentiation at this stage.

Solution

**Slides 4, 7, 13 “The Products,” “The Business Model,” “The Secret Sauce”**

Palantir positions itself as a comprehensive data OS with two product lines:

Product Architecture

Palantir Gotham (Government/Law Enforcement)

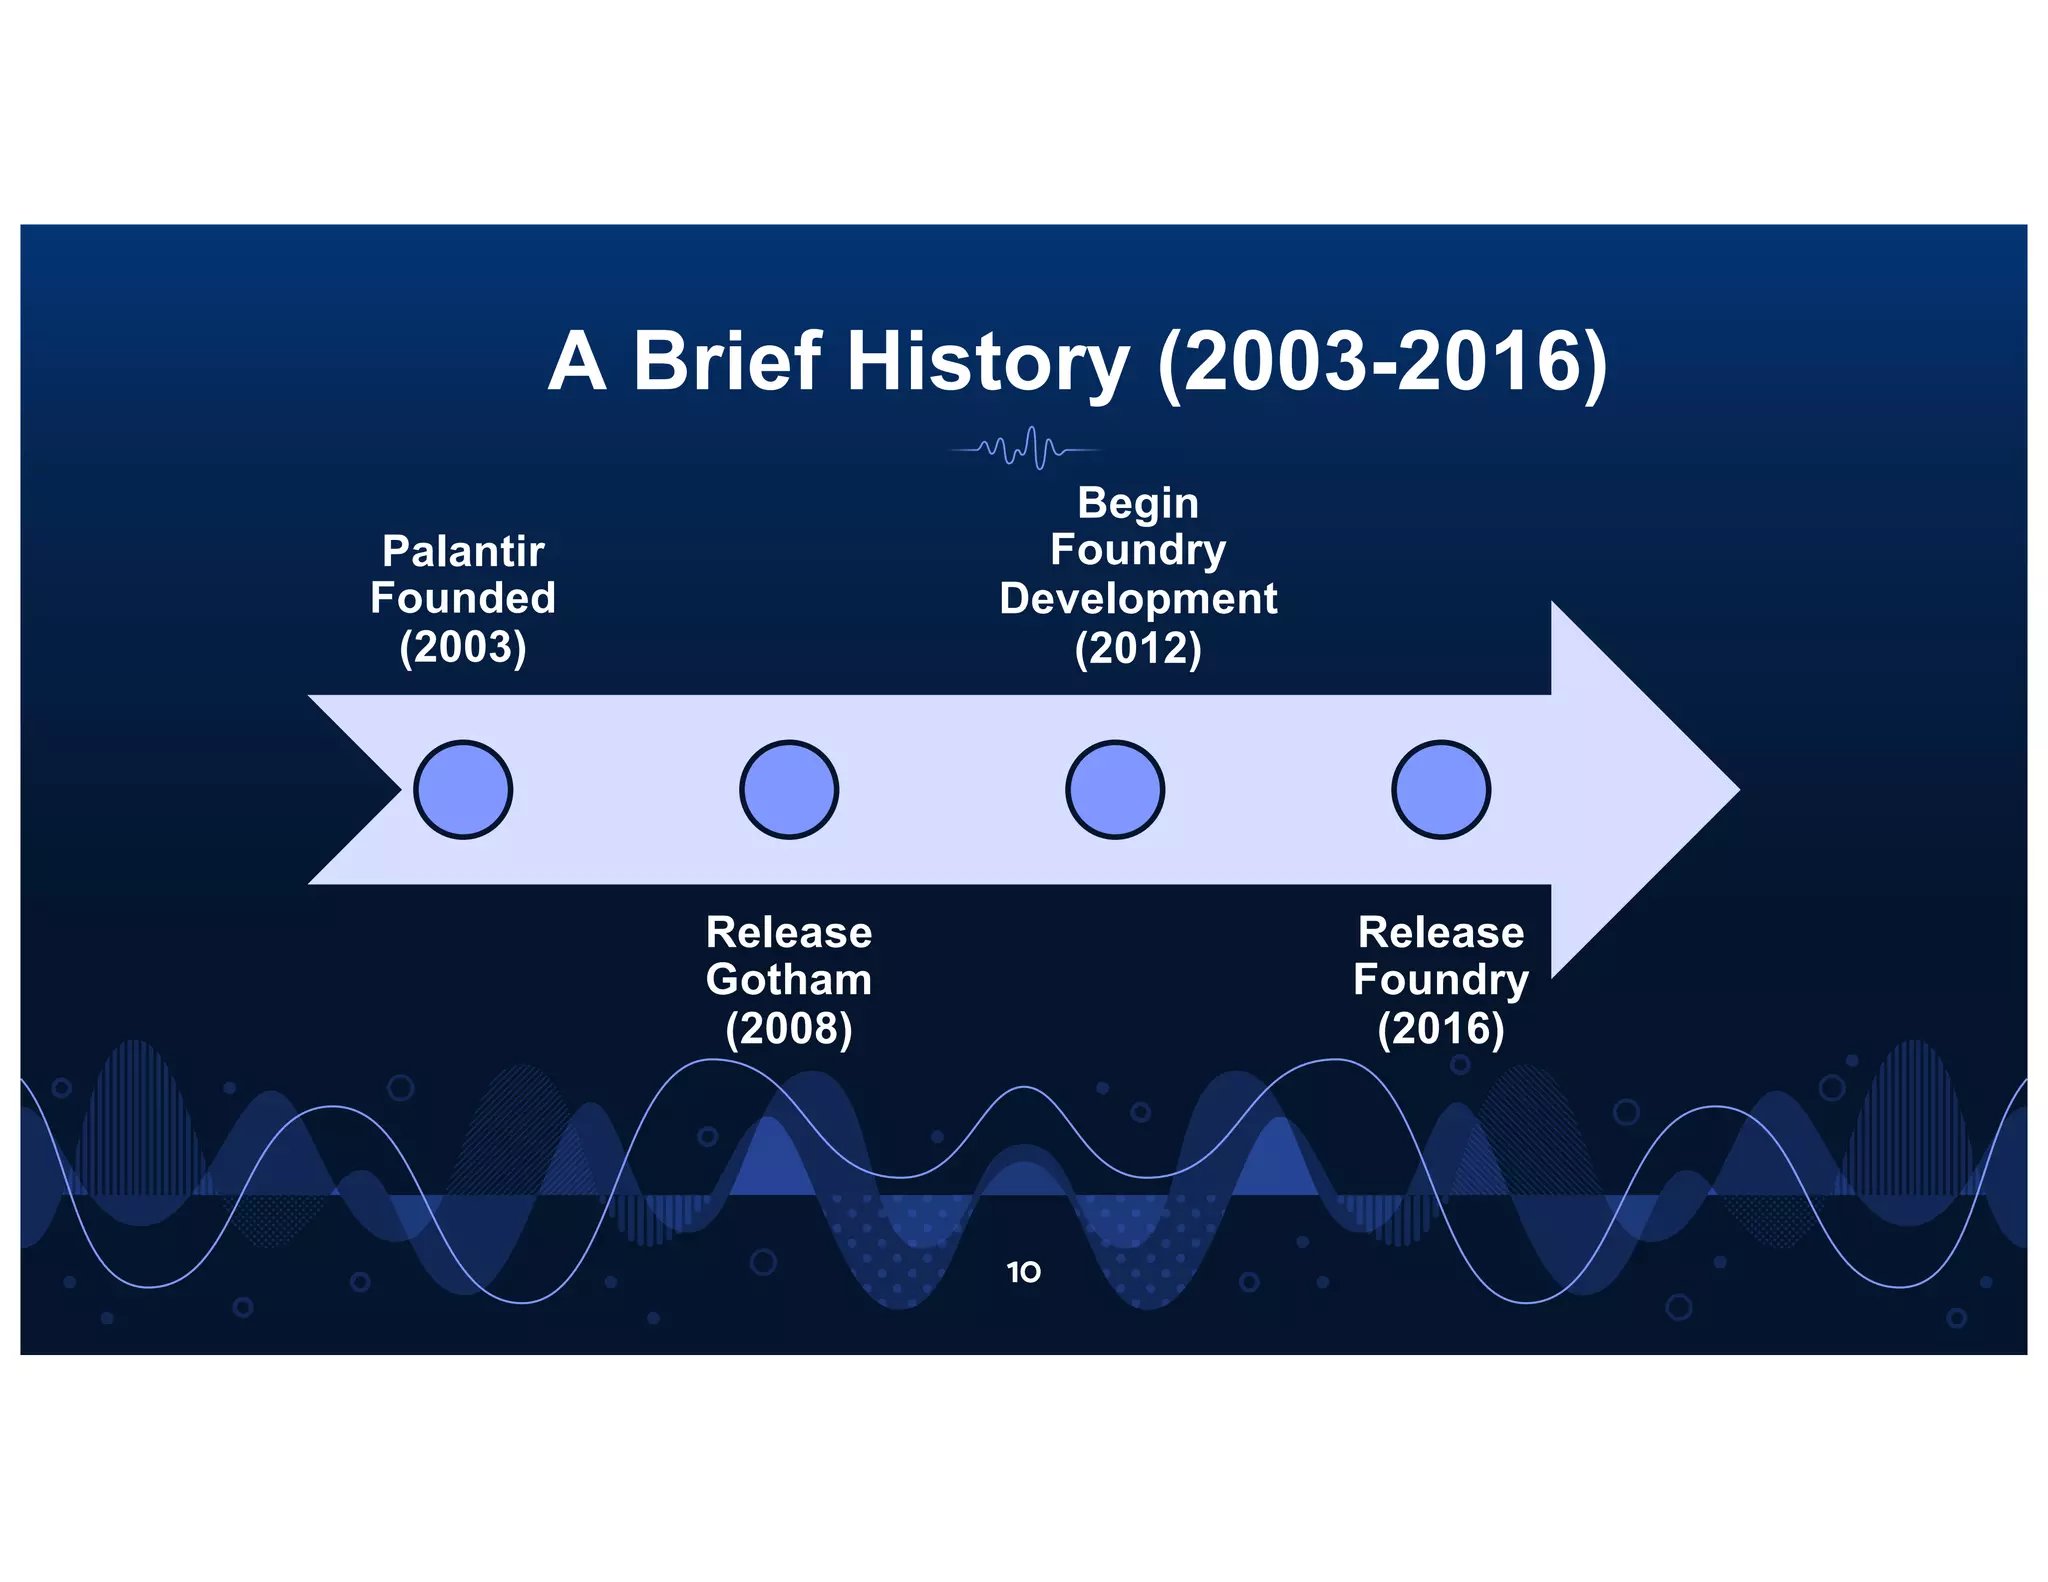
  • Launched: 2008 (5 years of development)
  • Use case: Intelligence analysis, law enforcement, national security
  • Deployment: Cloud, On-Premise, Professional Services

Palantir Foundry (Commercial/Enterprise)

  • Launched: 2016 (4 years of development)
  • Use case: Enterprise data integration, analytics, decision-making
  • Deployment: Cloud, On-Premise, Professional Services

Core Differentiators (“The Secret Sauce”)

  1. Low-Code Accessibility: Enables non-technical users to build analyses without SQL/coding
  2. Easy AI/ML Integration: Built-in machine learning capabilities for predictive analytics
  3. Entire OS: Full-stack platform (not point solution) covering data ingestion → transformation → visualization → ML
  4. 5 Years in Advance: Claims sustained R&D lead over competitors (unsubstantiated)

Go-to-Market Model: Acquire → Expand → Scale

Acquire Phase

  • Palantir bears pilot costs to onboard new customers
  • Pilots prove value before full deployment
  • High customer acquisition cost (CAC)

Expand Phase

  • Post-pilot, Palantir deepens vertical integration within customer organization
  • Professional services drive adoption across departments
  • Revenue grows through expanded use cases

Scale Phase

  • Mature accounts achieve positive contribution margins
  • Software-only revenue (no services) becomes profitable
  • Accounts transition to self-service model

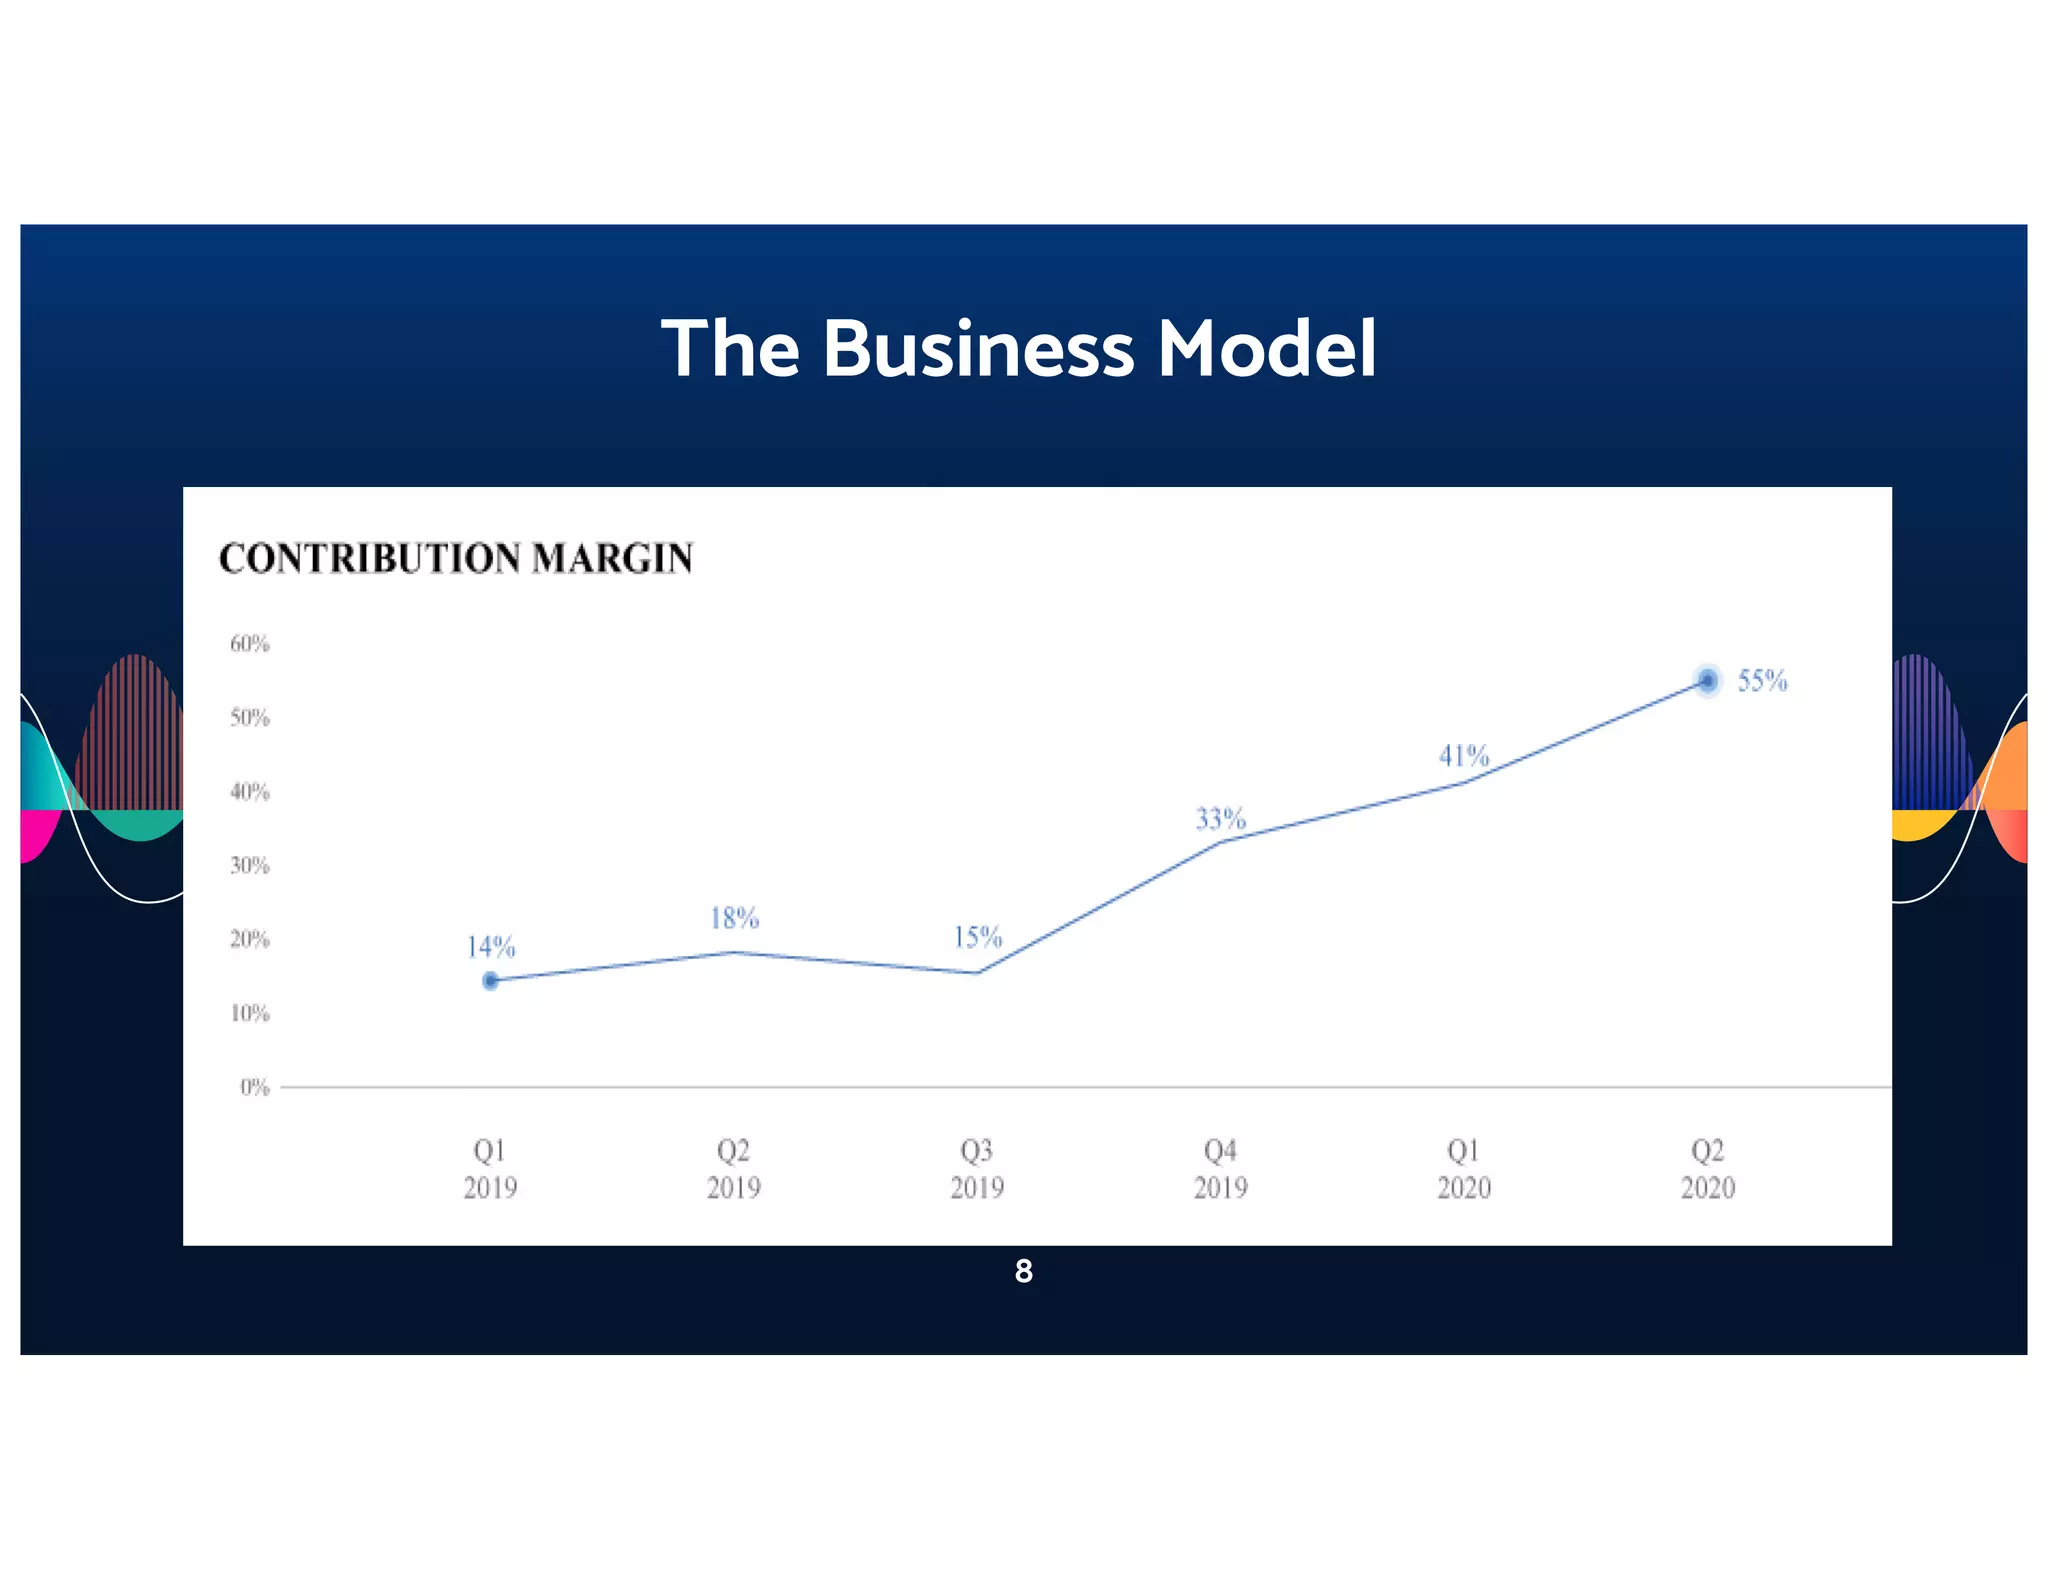
Evidence of Model Validation: Contribution margin trajectory (Slide 8) shows dramatic improvement:

  • Q1 2019: 14%
  • Q2 2020: 55%
  • +41 percentage point improvement in 18 months

This validates the thesis that pilot-heavy, services-led customer acquisition can achieve strong unit economics at scale.

Market Opportunity

**Slides 3, 7 Problem statement and business model**

Critical Gap: The deck provides no TAM/SAM/SOM analysis. This is a significant weakness for institutional investors evaluating market size.

Inferred market segments (from product positioning):

  • Government/Defense: Intelligence agencies, law enforcement, national security (Gotham)
  • Commercial Enterprise: Financial services, healthcare, manufacturing, retail (Foundry)

Market Size Indicators (not explicitly stated):

  • Competitive set includes Tableau, Splunk (both multi-billion dollar companies)
  • Suggests TAM in tens of billions for enterprise data/analytics
  • No customer count, ACV (Annual Contract Value), or market share targets provided

Opportunity Thesis (implicit):

  • Shift from point solutions (Tableau for viz, Splunk for logs) to integrated platforms
  • Increasing data complexity and regulatory requirements drive demand
  • Low-code/no-code trend creates addressable market for non-technical users

Business Model

**Slides 7, 8 “The Business Model,” “Contribution Margin”**

Revenue Model: Hybrid (Software + Services)

Acquisition Phase (Pilot)

  • Palantir funds pilot implementation
  • Professional services revenue: High
  • Software revenue: Low/zero
  • Contribution margin: Negative (pilot costs exceed revenue)

Expansion Phase (Proven Value)

  • Customer expands use cases across organization
  • Professional services revenue: High (integration, customization)
  • Software revenue: Growing
  • Contribution margin: Improving (15-33% range in data)

Scale Phase (Mature Account)

  • Self-service adoption, minimal services
  • Professional services revenue: Low
  • Software revenue: High (recurring SaaS)
  • Contribution margin: Positive (41-55% range in data)

Unit Economics Evidence

Contribution Margin Trajectory (Slide 8):
| Quarter | Contribution Margin |
|———|——————-|
| Q1 2019 | 14% |
| Q2 2019 | 18% |
| Q3 2019 | 15% |
| Q4 2019 | 33% |
| Q1 2020 | 41% |
| Q2 2020 | 55% |

Interpretation:

  • Dramatic margin expansion suggests successful transition from services-heavy to software-heavy model
  • Q3 2019 dip (15%) unexplained—potential customer churn or one-time cost
  • Trajectory validates “Scale” phase economics

Pricing Model

  • Not disclosed in deck
  • Implied: Enterprise SaaS (likely $100K-$1M+ ACV based on government/enterprise positioning)
  • Professional services likely billed at $150-300/hour or fixed project fees

Profitability Path

  • Current state (FY2020): -$1.15M EBITDA (negative)
  • Path to profitability: Scale phase contribution margins (55%) suggest path to profitability as revenue grows and services mix declines
  • No explicit timeline provided for EBITDA breakeven

Traction & Metrics

**Slides 5, 6, 8, 11 “The Finances,” “Contribution Margin,” “A Brief History”**

Revenue Growth

Historical Revenue (Slide 5: “Palantir Total Revenue 2018-2020”):
| Year | Revenue (thousands) |
|——|——————-|
| 2018 | ~$600 |
| 2019 | ~$750 |
| 2020 | ~$1,100 |

Growth Rate:

  • 2018-2019: ~25% YoY
  • 2019-2020: ~47% YoY
  • CAGR (2018-2020): ~35%

Interpretation: Strong acceleration in growth rate, particularly in 2020 (likely driven by COVID-19 government contracts).

Profitability Metrics

FY2020 EBITDA: -$1,150,424 (negative)

  • Deck’s framing: “which isn’t great. But revenue growth is strong”
  • Transparent acknowledgment of unprofitability
  • Implies path to profitability through revenue scale

Contribution Margin (Account-Level Unit Economics)

Q2 2020 Contribution Margin: 55%

  • Demonstrates strong unit economics at account level
  • Suggests software-only revenue (post-services) is highly profitable
  • Validates business model thesis

Customer Traction (Implicit)

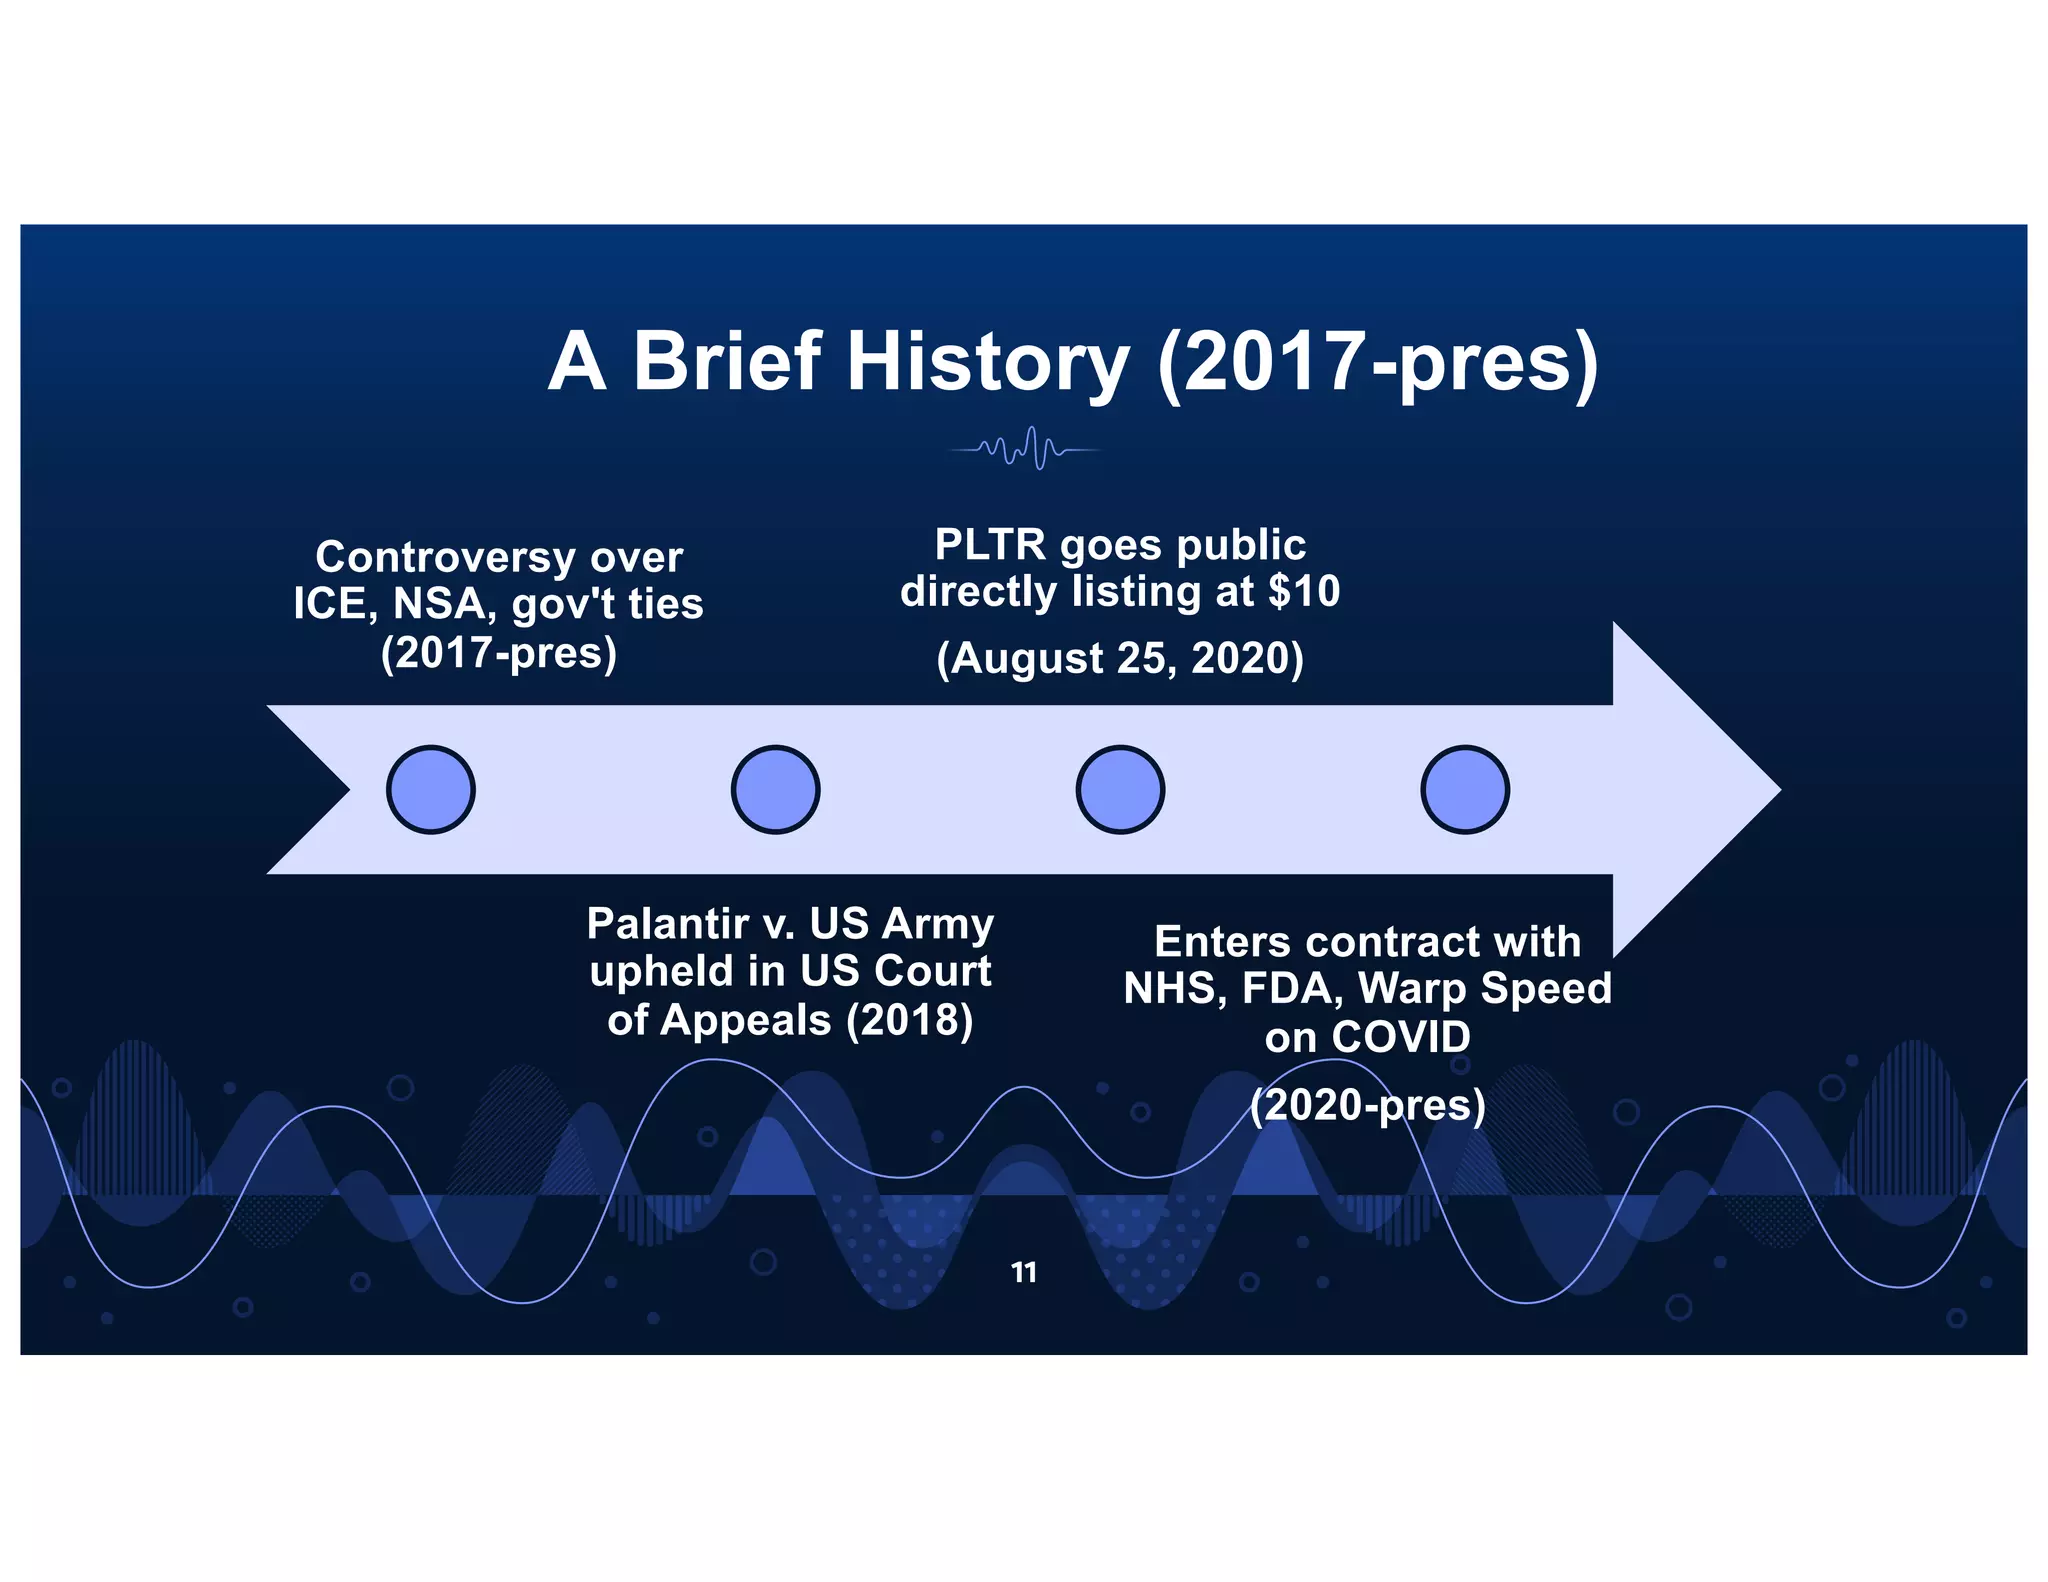
Government Contracts (Slide 11):

  • Palantir v. US Army upheld in Court of Appeals (2018)
    • Legal validation despite controversy
    • Suggests significant government customer base
  • NHS, FDA, Warp Speed COVID contracts (2020-present)
    • High-profile government/health agency customers
    • Demonstrates relevance during crisis

Missing Metrics:

  • Total customer count
  • Customer acquisition cost (CAC)
  • Customer lifetime value (LTV)
  • Net revenue retention (NRR)
  • Churn rate
  • Average contract value (ACV)

Competitive Positioning

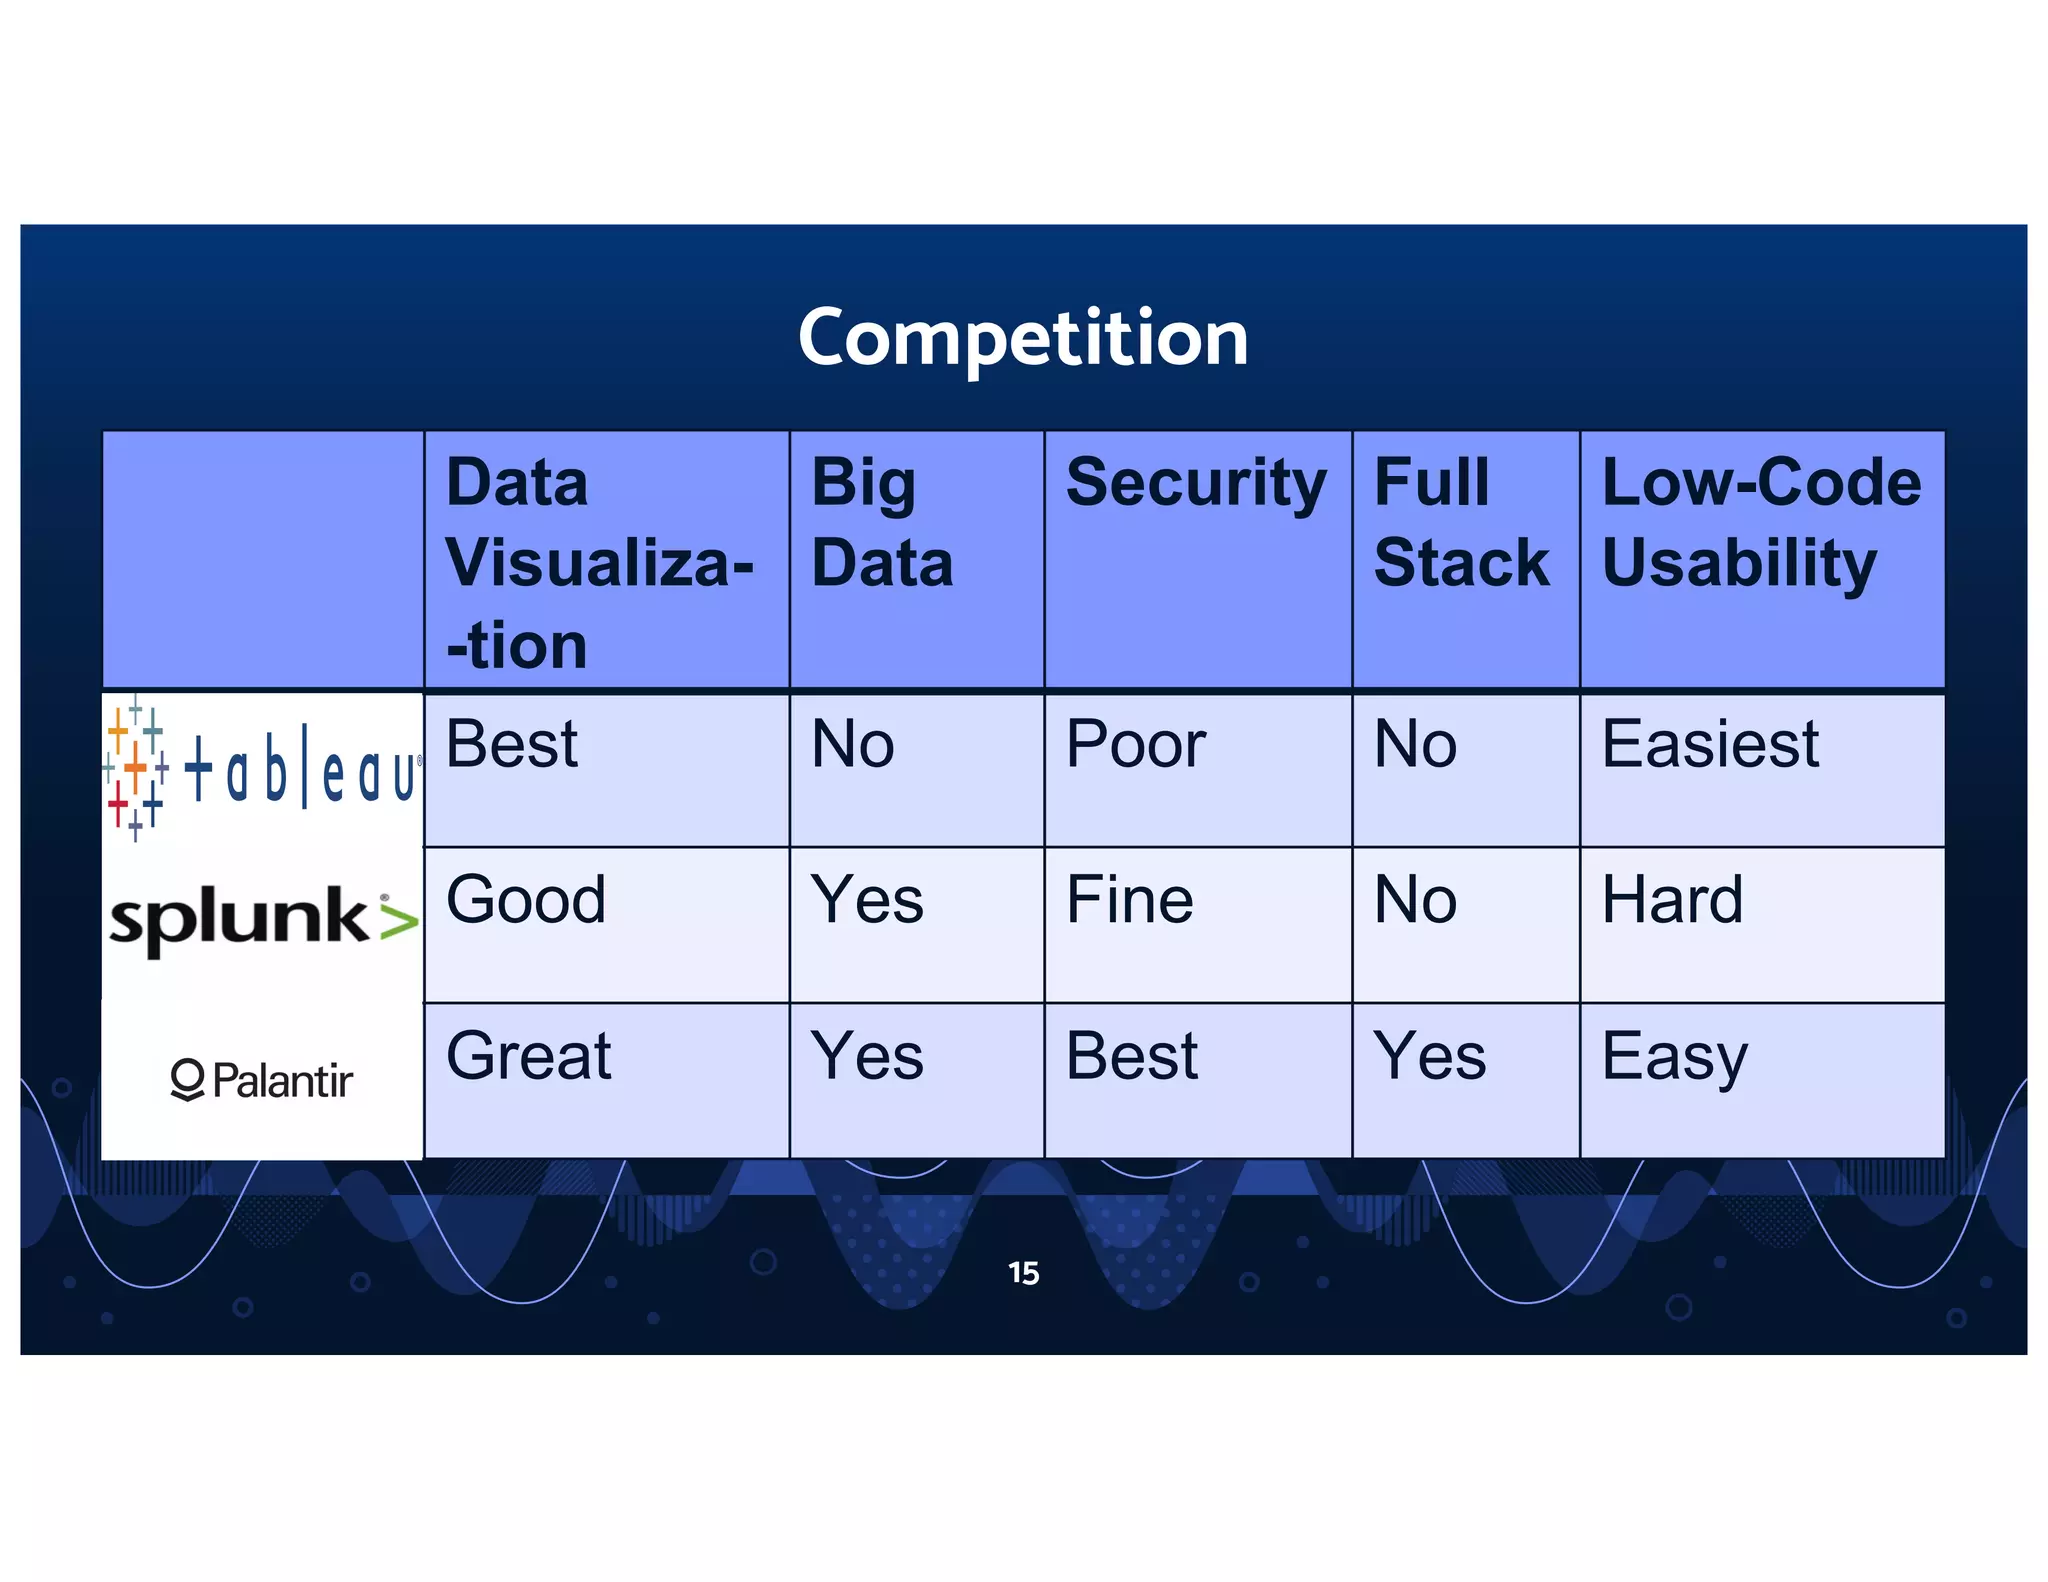
**Slide 15 “Competition”**

Competitive Comparison Matrix

Dimension Tableau Splunk Palantir
Data Visualization Best Good Great
Big Data No Yes Yes
Security Poor Fine Best
Full Stack No No Yes
Low-Code Usability Easiest Hard Easy

Competitive Positioning Strategy

Palantir’s Claimed Advantages:

  1. Full Stack: Only player offering integrated platform (data ingestion → transformation → visualization → ML)
    • Tableau: Visualization-only (requires external data prep)
    • Splunk: Log analytics (not general-purpose data platform)
  2. Security: Claims “Best” security (vs. Tableau’s “Poor”)
    • Likely refers to: encryption, access controls, audit trails
    • Relevant for government/regulated industries
    • Unsubstantiated claim
  3. Low-Code Accessibility: “Easy” (vs. Tableau’s “Easiest,” Splunk’s “Hard”)
    • Addresses problem from Slide 3 (non-technical users)
    • Differentiates from Splunk (requires technical expertise)
    • Slight disadvantage vs. Tableau (but Tableau lacks full stack)
  4. Big Data: “Yes” (vs. Tableau’s “No”)
    • Handles large-scale data processing
    • Splunk also handles big data, but Palantir claims better integration

Competitive Weaknesses (Implied)

Not addressed in deck:

  • Ease of use: Tableau still rated “Easiest” (Palantir is “Easy”)
  • Visualization: Tableau rated “Best” (Palantir is “Great”)
  • Market presence: Tableau and Splunk are public companies with larger market share
  • Ecosystem: No mention of integrations, partner ecosystem, or third-party apps

Critical Assessment of Competitive Positioning

Strengths:

  • Specific competitors named (not generic “competitors”)
  • Acknowledges competitor strengths (Tableau’s visualization, Splunk’s big data)
  • Full-stack differentiation is legitimate and valuable

Weaknesses:

  • All ratings are subjective (“Best,” “Great,” “Good,” “Fine,” “Poor”) with no supporting evidence
  • No third-party validation (Gartner, Forrester, customer reviews)
  • Missing competitors: Databricks, Alteryx, Qlik, Informatica, Palantir’s actual competitors in 2020
  • Biased framing: Palantir wins on all 5 dimensions (unrealistic and unconvincing)
  • No customer preference data: Doesn’t cite which customers prefer Palantir over alternatives

Team

**Slide 9 “Key Leaders”**

Executive Team

Role Name Background
CEO Alex Karp [No details provided]
COO Shyam Shankar [No details provided]
Cofounder Peter Thiel PayPal, Founders Fund, early VC investor

Team Credibility Assessment

Strengths:

  • Peter Thiel: Major credibility signal
    • Co-founder of PayPal (successful exit)
    • Early investor in Facebook, Airbnb, Spotify
    • Founder of Founders Fund (prominent VC firm)
    • Demonstrates access to capital and strategic guidance
  • Alex Karp: CEO (implied founder/early employee)
    • Long tenure (founded 2003, still CEO in 2020)
    • Demonstrates stability and vision continuity

Weaknesses:

  • No bios or backgrounds: Slide provides only names and titles
    • No information on prior experience
    • No indication of domain expertise (data, analytics, government)
    • No educational background
  • Limited team visibility: Only 3 leaders shown
    • No indication of broader team (engineering, sales, operations)
    • No mention of board of directors or advisors
    • No team size or headcount
  • Thiel’s role unclear: Listed as “cofounder” but unclear if he was involved in founding (2003) or joined later
    • Likely joined as early investor, not founder
    • Misleading title

Missing Information

  • CTO/Chief Product Officer (critical for technology company)
  • CFO (important for financial credibility)
  • VP Sales/Chief Revenue Officer (important for growth)
  • Board composition
  • Advisory board

Go-to-Market Strategy

**Slides 7, 11 “The Business Model,” “A Brief History”**

Distribution Model

Pilot-Based Sales (Acquire Phase)

  • Palantir funds pilot implementations
  • Pilots typically 3-6 months
  • Proves value before full deployment
  • High touch, services-intensive

Vertical Integration (Expand Phase)

  • Post-pilot, expand within customer organization
  • Professional services drive adoption across departments
  • Deepen relationships and increase wallet share

Self-Service Scaling (Scale Phase)

  • Mature accounts transition to self-service
  • Reduced professional services dependency
  • Recurring SaaS revenue model

Sales Strategy (Implied)

Government/Defense (Gotham)

  • Direct sales to federal agencies, law enforcement
  • Long sales cycles (6-18 months)
  • High contract values ($500K-$5M+)
  • Relationship-driven (Peter Thiel connections)

Commercial Enterprise (Foundry)

  • Direct sales to large enterprises
  • Focus on data-intensive industries (finance, healthcare, manufacturing)
  • Long sales cycles (3-12 months)
  • Account-based marketing (ABM)

Go-to-Market Challenges

Not addressed in deck:

  • Sales team size and experience
  • Customer acquisition cost (CAC)
  • Sales cycle length
  • Win rates vs. competitors
  • Channel strategy (direct vs. partners)

The Ask

Not explicitly stated in deck

The deck does not include a specific funding ask, use of funds, or valuation. However, context clues suggest:

Implied Fundraising Context

Timeline Discrepancy:

  • Deck is labeled “2010” but contains data through Q2 2020 and references to August 25, 2020 IPO
  • Likely scenario: This is a retrospective deck created post-IPO, not a pitch deck from 2010
  • Actual 2010 pitch deck would have been for earlier funding round (Series B/C)

IPO Details (Slide 11)

Direct Listing: August 25, 2020

  • Price: $10 (direct listing reference price)
  • Valuation: $22B (from deck metadata)
  • Outcome: Successful IPO despite reputational challenges

Historical Funding (Inferred)

Based on company timeline:

  • 2003: Founded (likely seed/angel funding)
  • 2008: Gotham released (Series A/B likely)
  • 2012: Foundry development begins (Series C/D likely)
  • 2016: Foundry released (Series D/E likely)
  • 2020: IPO at $22B valuation

Key Takeaways

What Palantir Did Well

  1. Transparent about challenges: Acknowledging ICE/NSA controversy builds credibility
  2. Strong unit economics: Contribution margin expansion validates business model
  3. Dual-market strategy: Government + commercial reduces risk
  4. Long-term vision: 17-year journey shows persistence and depth
  5. Design quality: Professional, memorable visual presentation

What Palantir Could Have Improved

  1. More data, less narrative: Provide customer count, CAC, LTV, NRR, churn
  2. Market sizing: Explicit TAM/SAM/SOM with methodology
  3. Team disclosure: Detailed bios for CEO, CTO, CFO, board
  4. Competitive validation: Third-party research (Gartner, customer reviews) vs. subjective claims
  5. Risk mitigation: Specific strategies to address reputational challenges
  6. Financial projections: Forward revenue and profitability timeline

Why It Worked Despite Weaknesses

  • Strong fundamentals: 35% revenue CAGR + 55% contribution margins offset narrative gaps
  • Credible founder: Peter Thiel’s involvement signals quality and access to capital
  • Government traction: High-profile contracts (NHS, FDA, Warp Speed) validate product-market fit
  • Honest about risks: Transparency on ICE/NSA controversy builds trust
  • Clear business model: Acquire → Expand → Scale is easy to understand and validate

Lessons for Other Startups

  1. Unit economics matter more than narrative: Palantir’s strong margins overcame negative EBITDA
  2. Transparency builds credibility: Acknowledging challenges is more convincing than hiding them
  3. Founder credibility is valuable: Peter Thiel’s involvement was a major asset
  4. Design quality signals professionalism: Palantir’s visual presentation differentiated it
  5. Dual-market strategy reduces risk: Government + commercial provides stability + growth
  6. Long-term vision matters: 17-year journey demonstrates commitment and depth
  7. Data > narrative: Investors want metrics, not just stories

Investor Deep Dive

Executive summary, strengths & red flags

Executive Summary

This 2010 pitch deck presents Palantir as a comprehensive data integration and analytics platform with dual products targeting government (Gotham) and commercial (Foundry) markets. The deck is notable for its bold, design-forward presentation style combined with transparent acknowledgment of reputational challenges (ICE, NSA ties). Despite negative EBITDA of -$1.15M in FY2020, the company demonstrates strong revenue growth (from ~$600K in 2018 to ~$1.1M in 2020) and dramatic margin expansion (14% to 55% contribution margin over 18 months), validating its Acquire → Expand → Scale business model. The deck's success in securing an IPO at a $22B valuation despite public controversy suggests that strong unit economics and government/enterprise traction can overcome reputational headwinds.

Key Strengths

6 identified

1

Transparent Acknowledgment of Challenges

- Slides 11, 14 directly address ICE/NSA controversy and negative publicity

2

Strong Unit Economics Validation

- Slide 8 shows contribution margin expansion from 14% (Q1 2019) to 55% (Q2 2020)

3

Dual-Market Strategy (Government + Commercial)

- Slides 4, 7 show Gotham (government) and Foundry (commercial) products

4

Credible Founder/Investor (Peter Thiel)

- Slide 9 lists Peter Thiel as cofounder

5

Design-Forward Presentation

- Consistent visual branding, colorful wave patterns, modern typography

6

Long Development History (2003-2020)

- Slide 10 shows 17-year journey from founding to dual-product maturity

More Pitch Decks To Study

Compare structure, fundraising context, and investor-facing story across similar startup decks.