Compare your deck to Mattermark

Compare Your Deck

Mattermark Pitch Deck (2015)

SaaS
Stage: Series A
Raised: $6.5M
Year: 2015
Slides: 30
Outcome: Acquired by FullContact

Pitch Deck

1 / 30
Mattermark pitch deck - The Opening: Brand and Positioning
Click to expand

Deck Analysis

This deck presents Mattermark — a SaaS data company that organized business data to answer questions about companies and markets. It frames the product as "Google for business people," defines a massive addressable market, shows early traction (rapid MRR growth and revenue segmentation), and highlights an experienced founding team. Notable aspects are the clarity of problem definition, simple but persuasive traction charts, and a crisp go-to-market narrative tying product to specific buyer roles (VCs, biz dev, sales). The deck helped Mattermark raise a Series A and ultimately was acquired, making it a useful model for founders who must balance product vision, market size, and proof of traction.

The Opening: Brand and Positioning

The Opening: Brand and Positioning

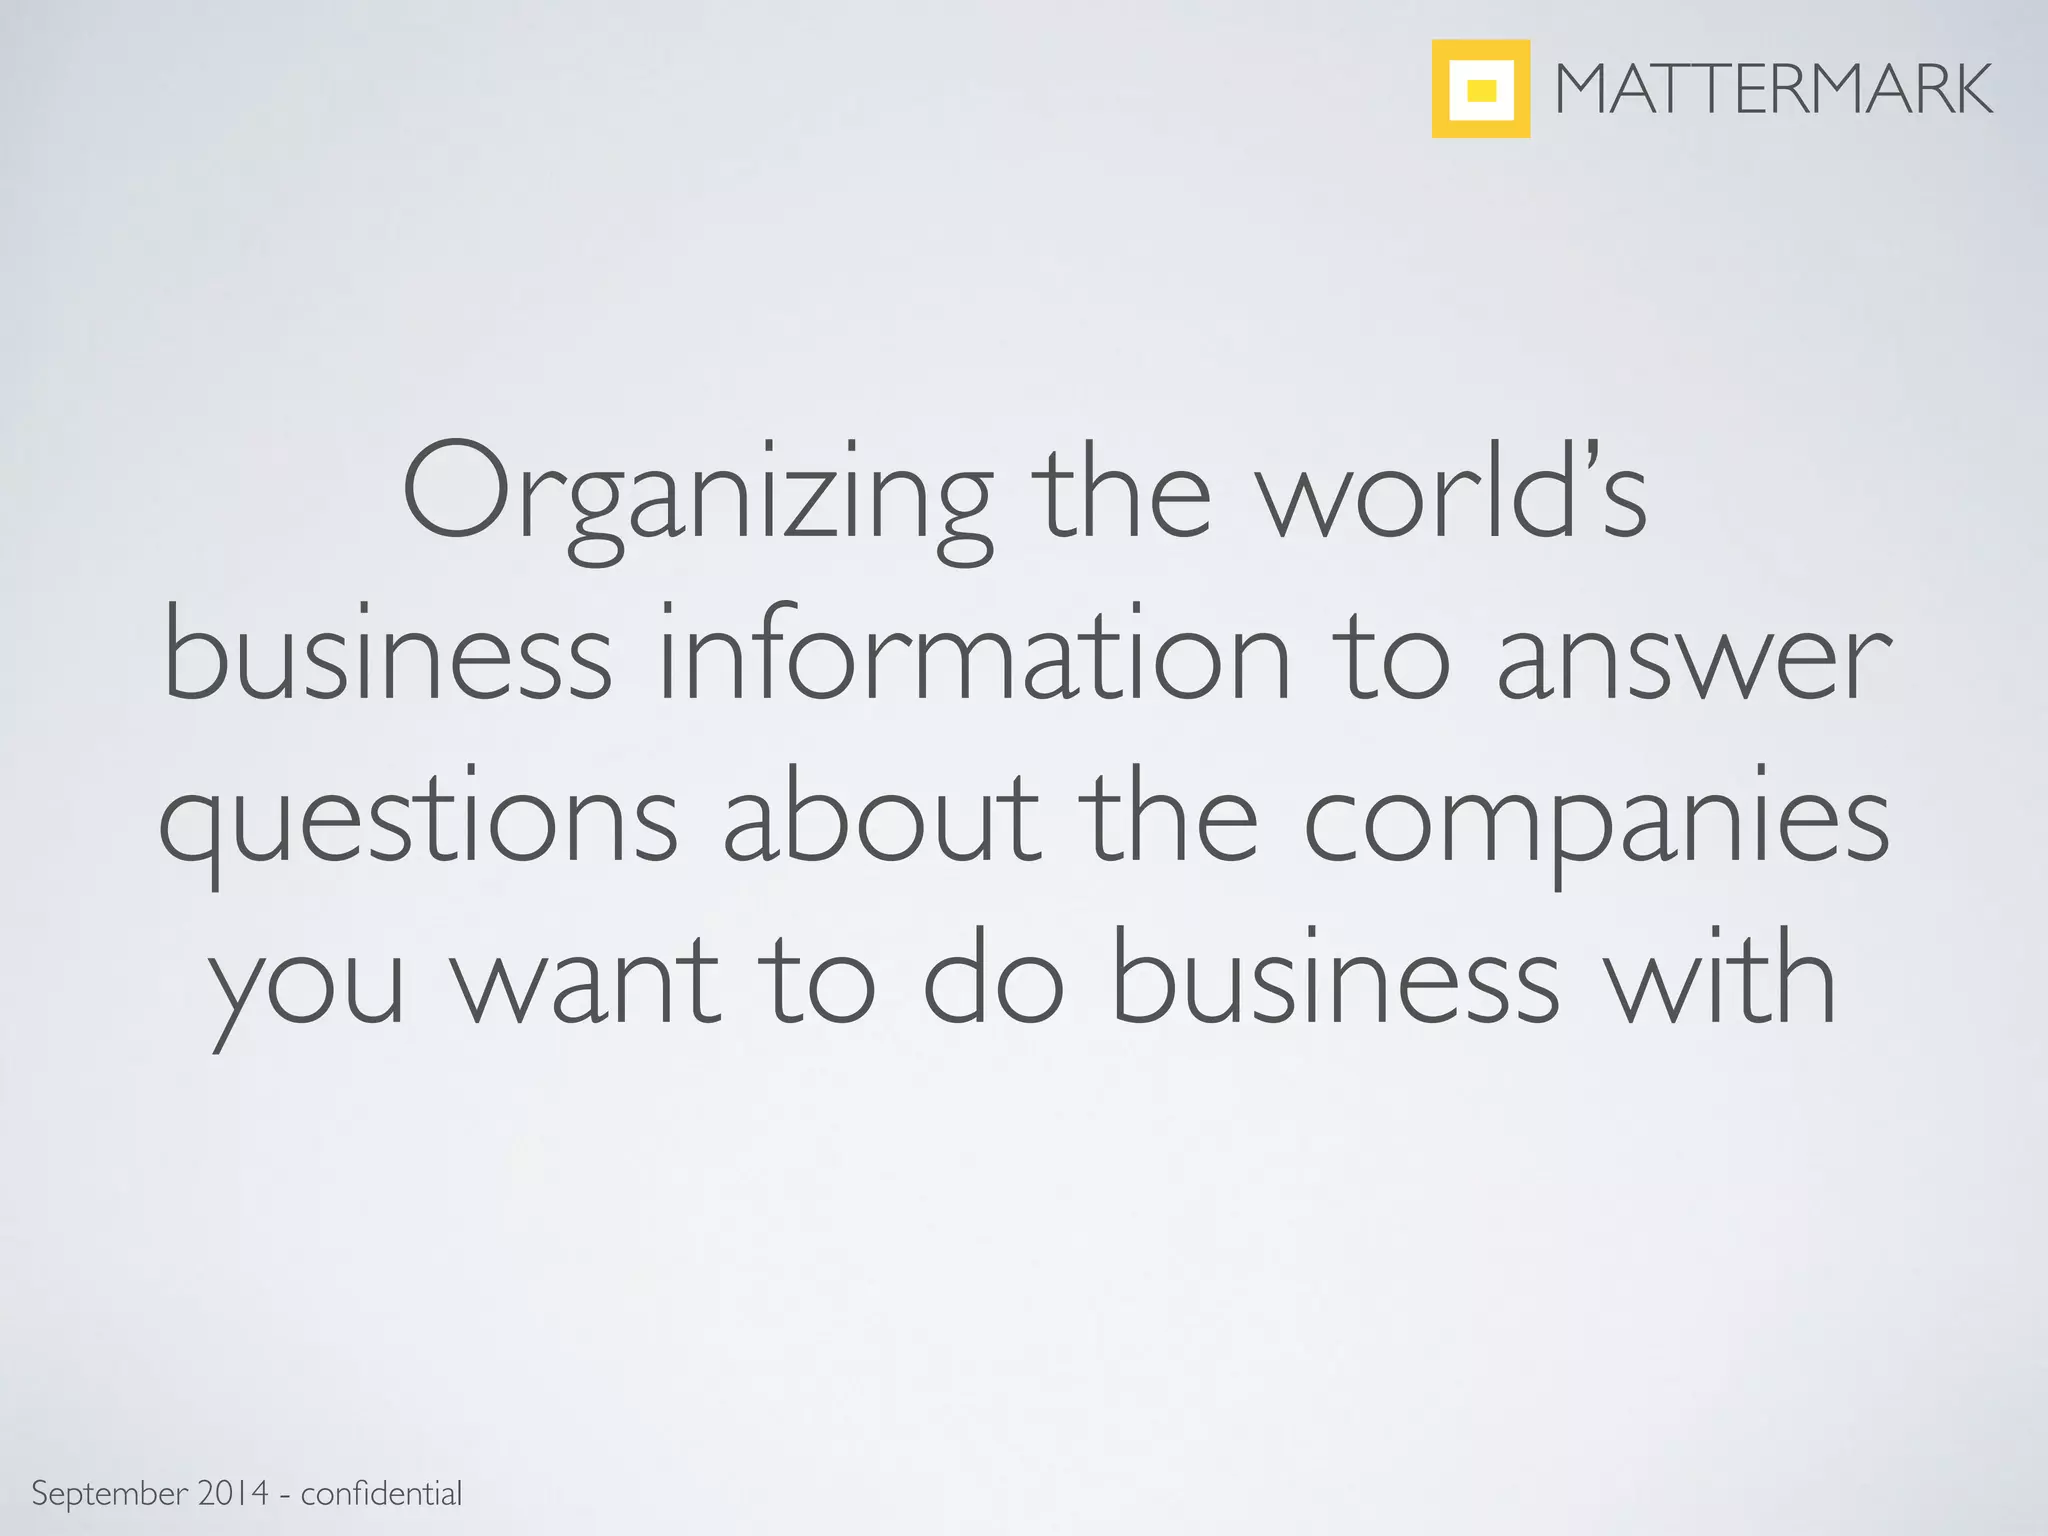
The cover (Slide 1) is deliberately minimalist: a bold logo, the company name and a short tagline — "organizing the world’s business information." That economy sets a professional tone and communicates the company’s mission immediately without distracting detail. The visual treatment (large white space, a single brand color) cues a data/product-first company and primes investors for a factual, numbers-driven presentation.

What founders can learn: an opening slide should establish brand/mission and visual seriousness. Mattermark uses the cover to signal focus and confidence rather than overloading with claims or busy graphics, which prepares the audience to digest the subsequent market and traction evidence.

Key Takeaway: Lead with a tight brand and single-sentence mission on the cover to frame the entire deck and set expectations for a focused, data-driven pitch.
Market Definition and Opportunity

Market Definition and Opportunity

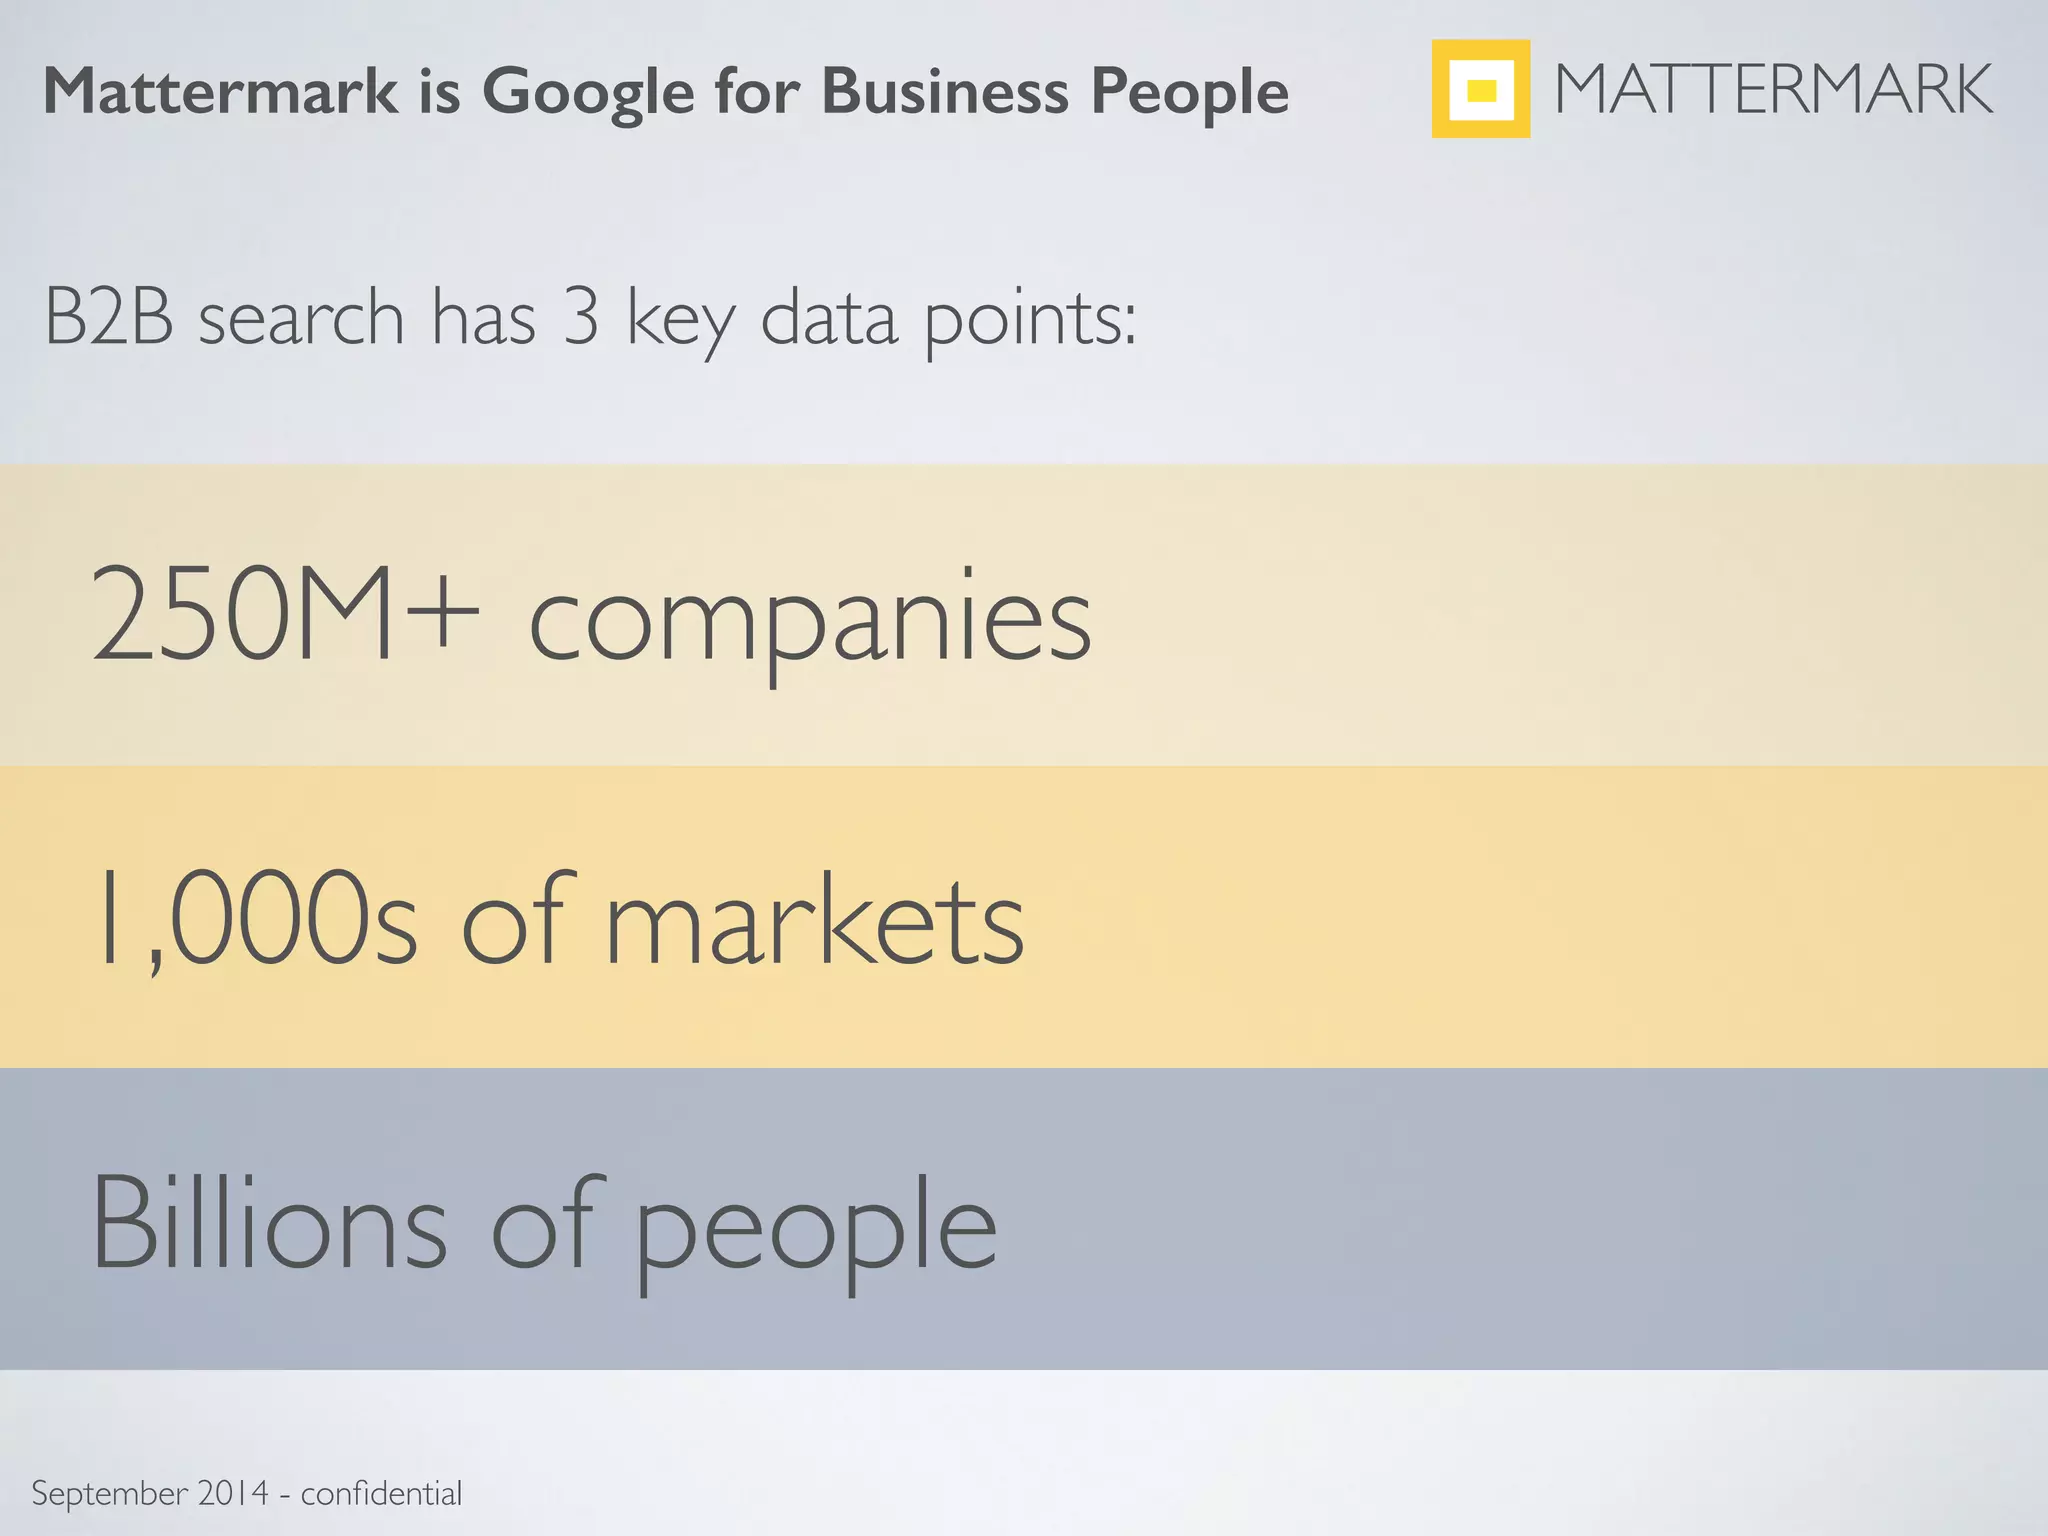
Slide 3 positions Mattermark with a memorable comparative — "Mattermark is Google for Business People" — followed by three concise data points: 250M+ companies, thousands of markets, billions of people. This combination of a simple analogy plus hard, large-scale numbers communicates both an intuitive product concept and a vast TAM (total addressable market). The phrasing ties product utility (search/answers) to scale, making the business case for building large datasets and search infrastructure.

For founders: pairing an easy-to-grasp metaphor with specific scale metrics is powerful. The metaphor helps non-experts understand the function, while the numeric indicators (company counts, market breadth, user population) give investors a handle on upside and why engineering investment makes sense.

Key Takeaway: Use a clear product metaphor plus a few authoritative scale numbers to convey both concept and market opportunity quickly.
Problem Statement: Clear Pain, Immediate Use Cases

Problem Statement: Clear Pain, Immediate Use Cases

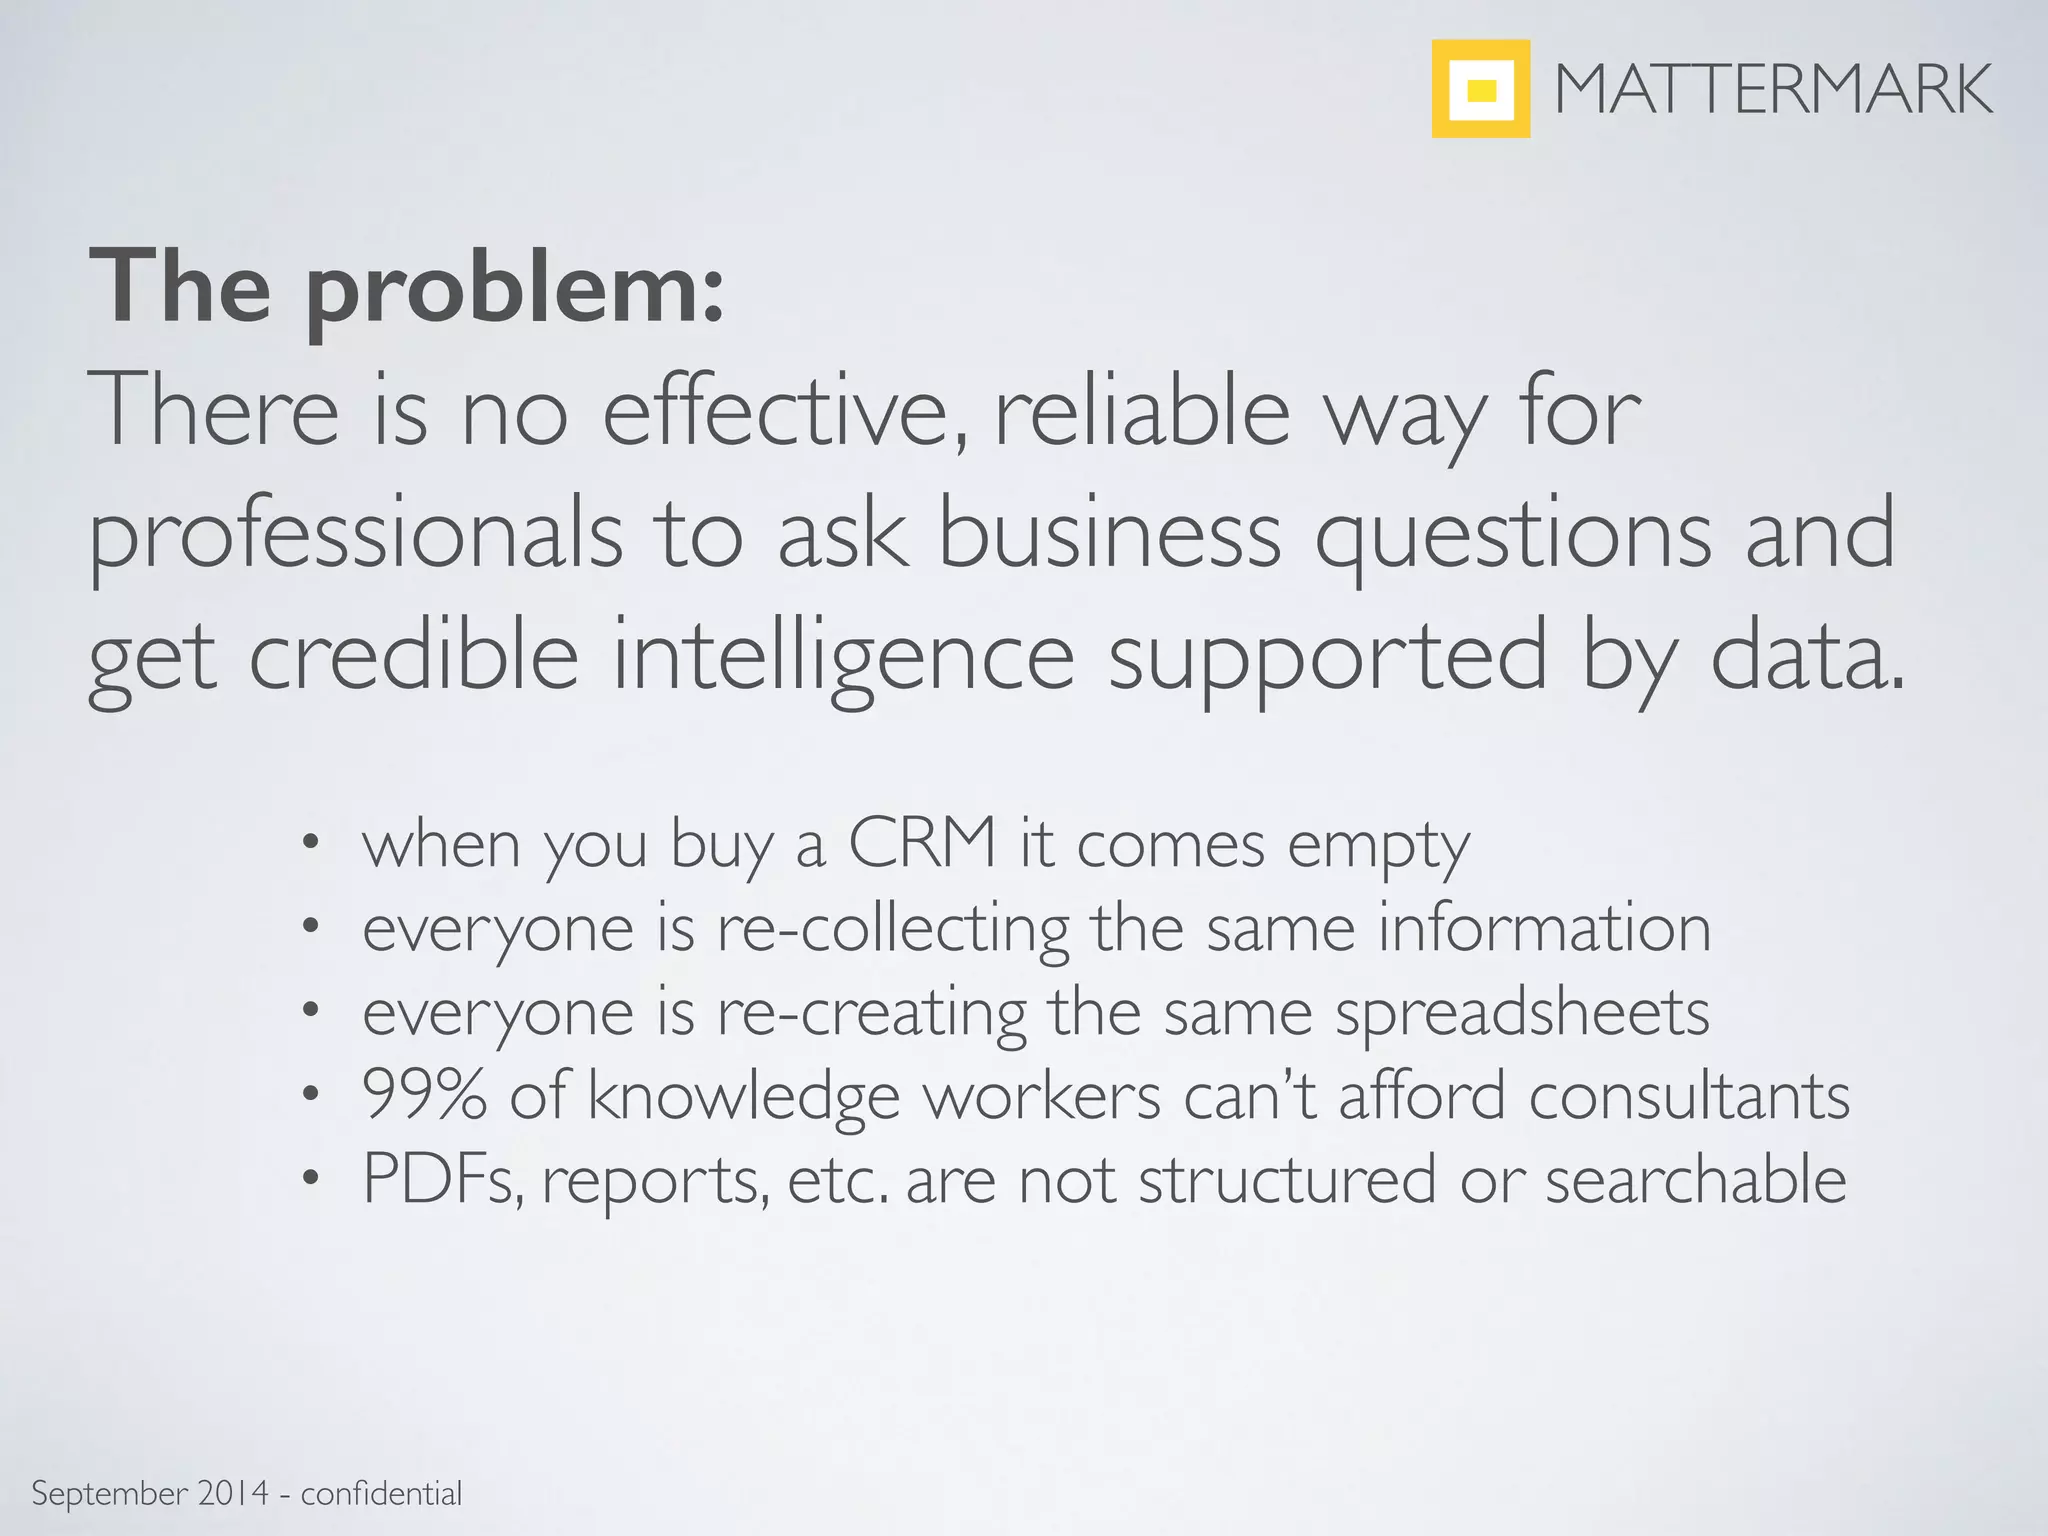
Slide 4 lays out the problem crisply: professionals lack an effective, reliable way to ask business questions and get data-backed answers. The slide lists specific pain points (empty CRM, duplicated spreadsheets, high consulting costs, unstructured documents) that ground the abstract problem in everyday workflow friction. That enumerated list makes the need tangible for several buyer personas (sales, VC, consultants).

This slide is effective because it moves beyond vague market chatter to concrete user pain that maps directly to value the product will deliver (automated, structured, searchable business intelligence). For founders, this demonstrates the importance of diagnosing the customer's current workaround and quantifying the inefficiency or cost to create urgency.

Key Takeaway: Describe the buyer’s current workaround and its frictions in concrete bullets — that contrast is what makes your solution feel necessary.
Product Vision: From Google+Spreadsheet to Data-driven Answers

Product Vision: From Google+Spreadsheet to Data-driven Answers

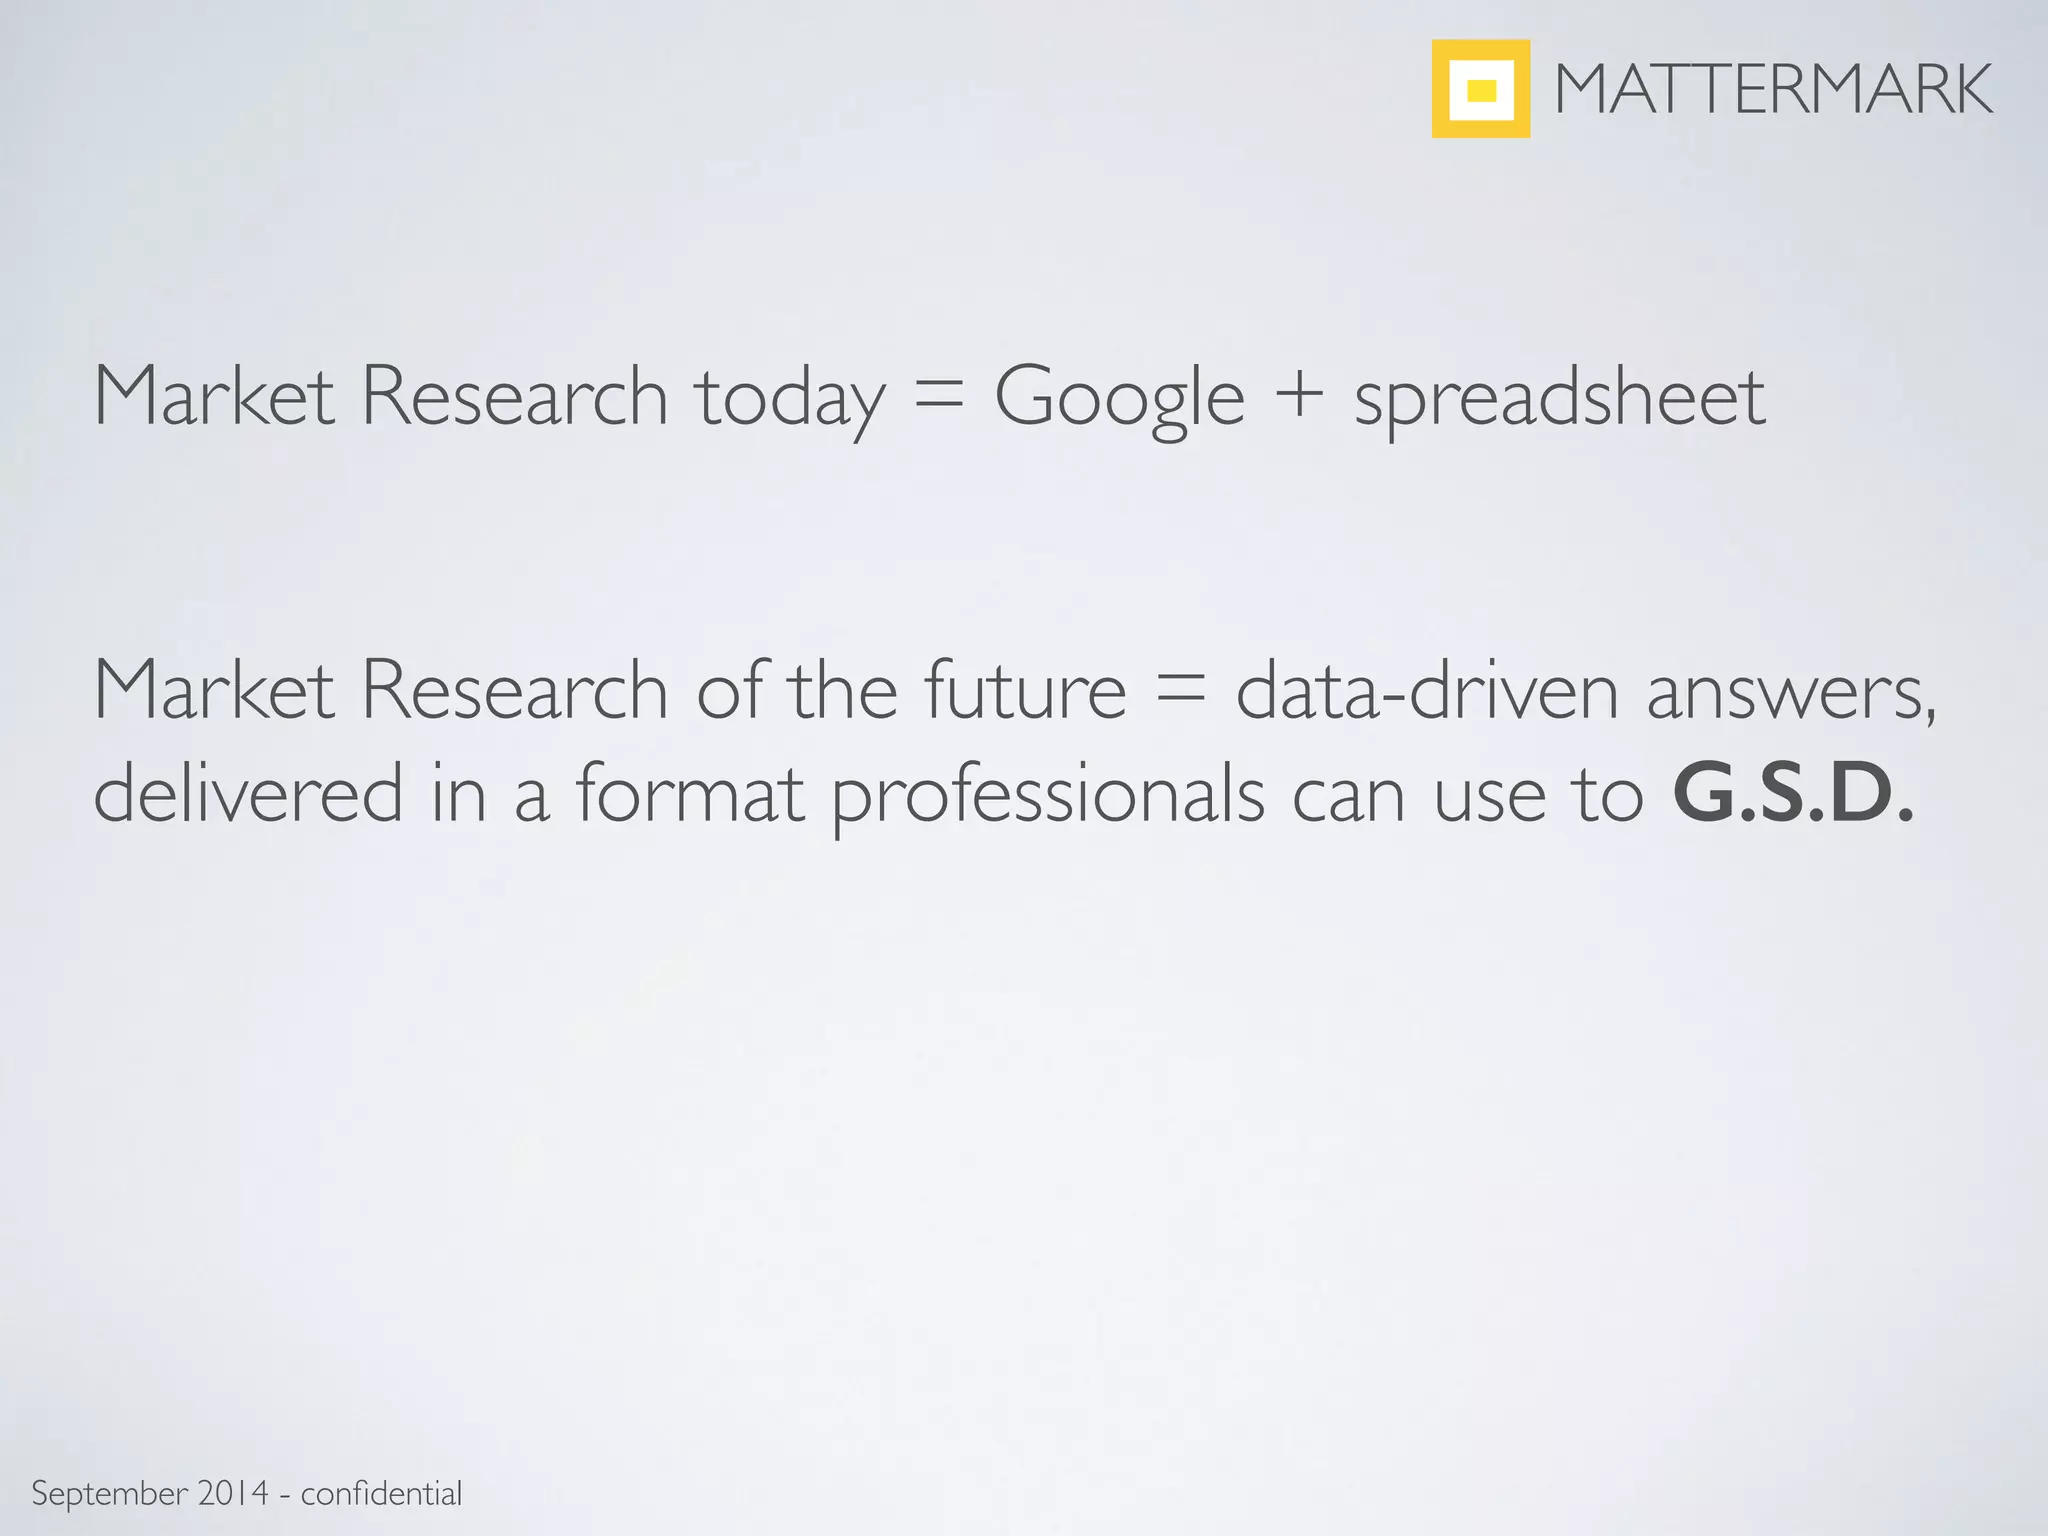
Slide 8 contrasts 'Market Research today = Google + spreadsheet' with a future state: 'data-driven answers, delivered in a format professionals can use to G.S.D.' That line neatly encapsulates the product’s promise: replace slow, manual research workflows with structured, actionable outputs. The slide frames the company’s roadmap in terms of replacing specific behaviors rather than simply providing another database.

Founders can learn from this clarity — showing how the product fits into and improves existing workflows helps buyers and investors visualize adoption and value capture. Also, pairing a concise problem narrative with an explicit future-state benefit (useable answers, not raw data) strengthens product-market fit messaging.

Key Takeaway: Show the current workaround and the concrete, workflow-level improvement your product delivers — not just the tech under the hood.
Traction: MRR, Growth Rates, and Visual Credibility

Traction: MRR, Growth Rates, and Visual Credibility

Slide 11 presents MRR growth as an easy-to-scan bar chart with a secondary line showing growth rate; headline metrics ($125K MRR, 377% CAGR) are called out prominently. This is classic traction storytelling: a clean time-series that demonstrates both momentum and durability. The combination of absolute dollars and growth percentage helps investors evaluate scale and velocity simultaneously.

The slide’s clarity and emphasis on month-by-month progress make it easy to validate claims and ask follow-up questions about churn, ARPU, and LTV. Founders should note how Mattermark uses a straightforward visual (bars + line) and big, bold metrics to anchor the company’s credibility — don’t hide behind vague claims when you can show an unambiguous trend.

Key Takeaway: Show month-by-month revenue growth with clear axes and a headline metric — investors want both the trend and the scale in one glance.
Revenue Mix and Customer Segmentation

Revenue Mix and Customer Segmentation

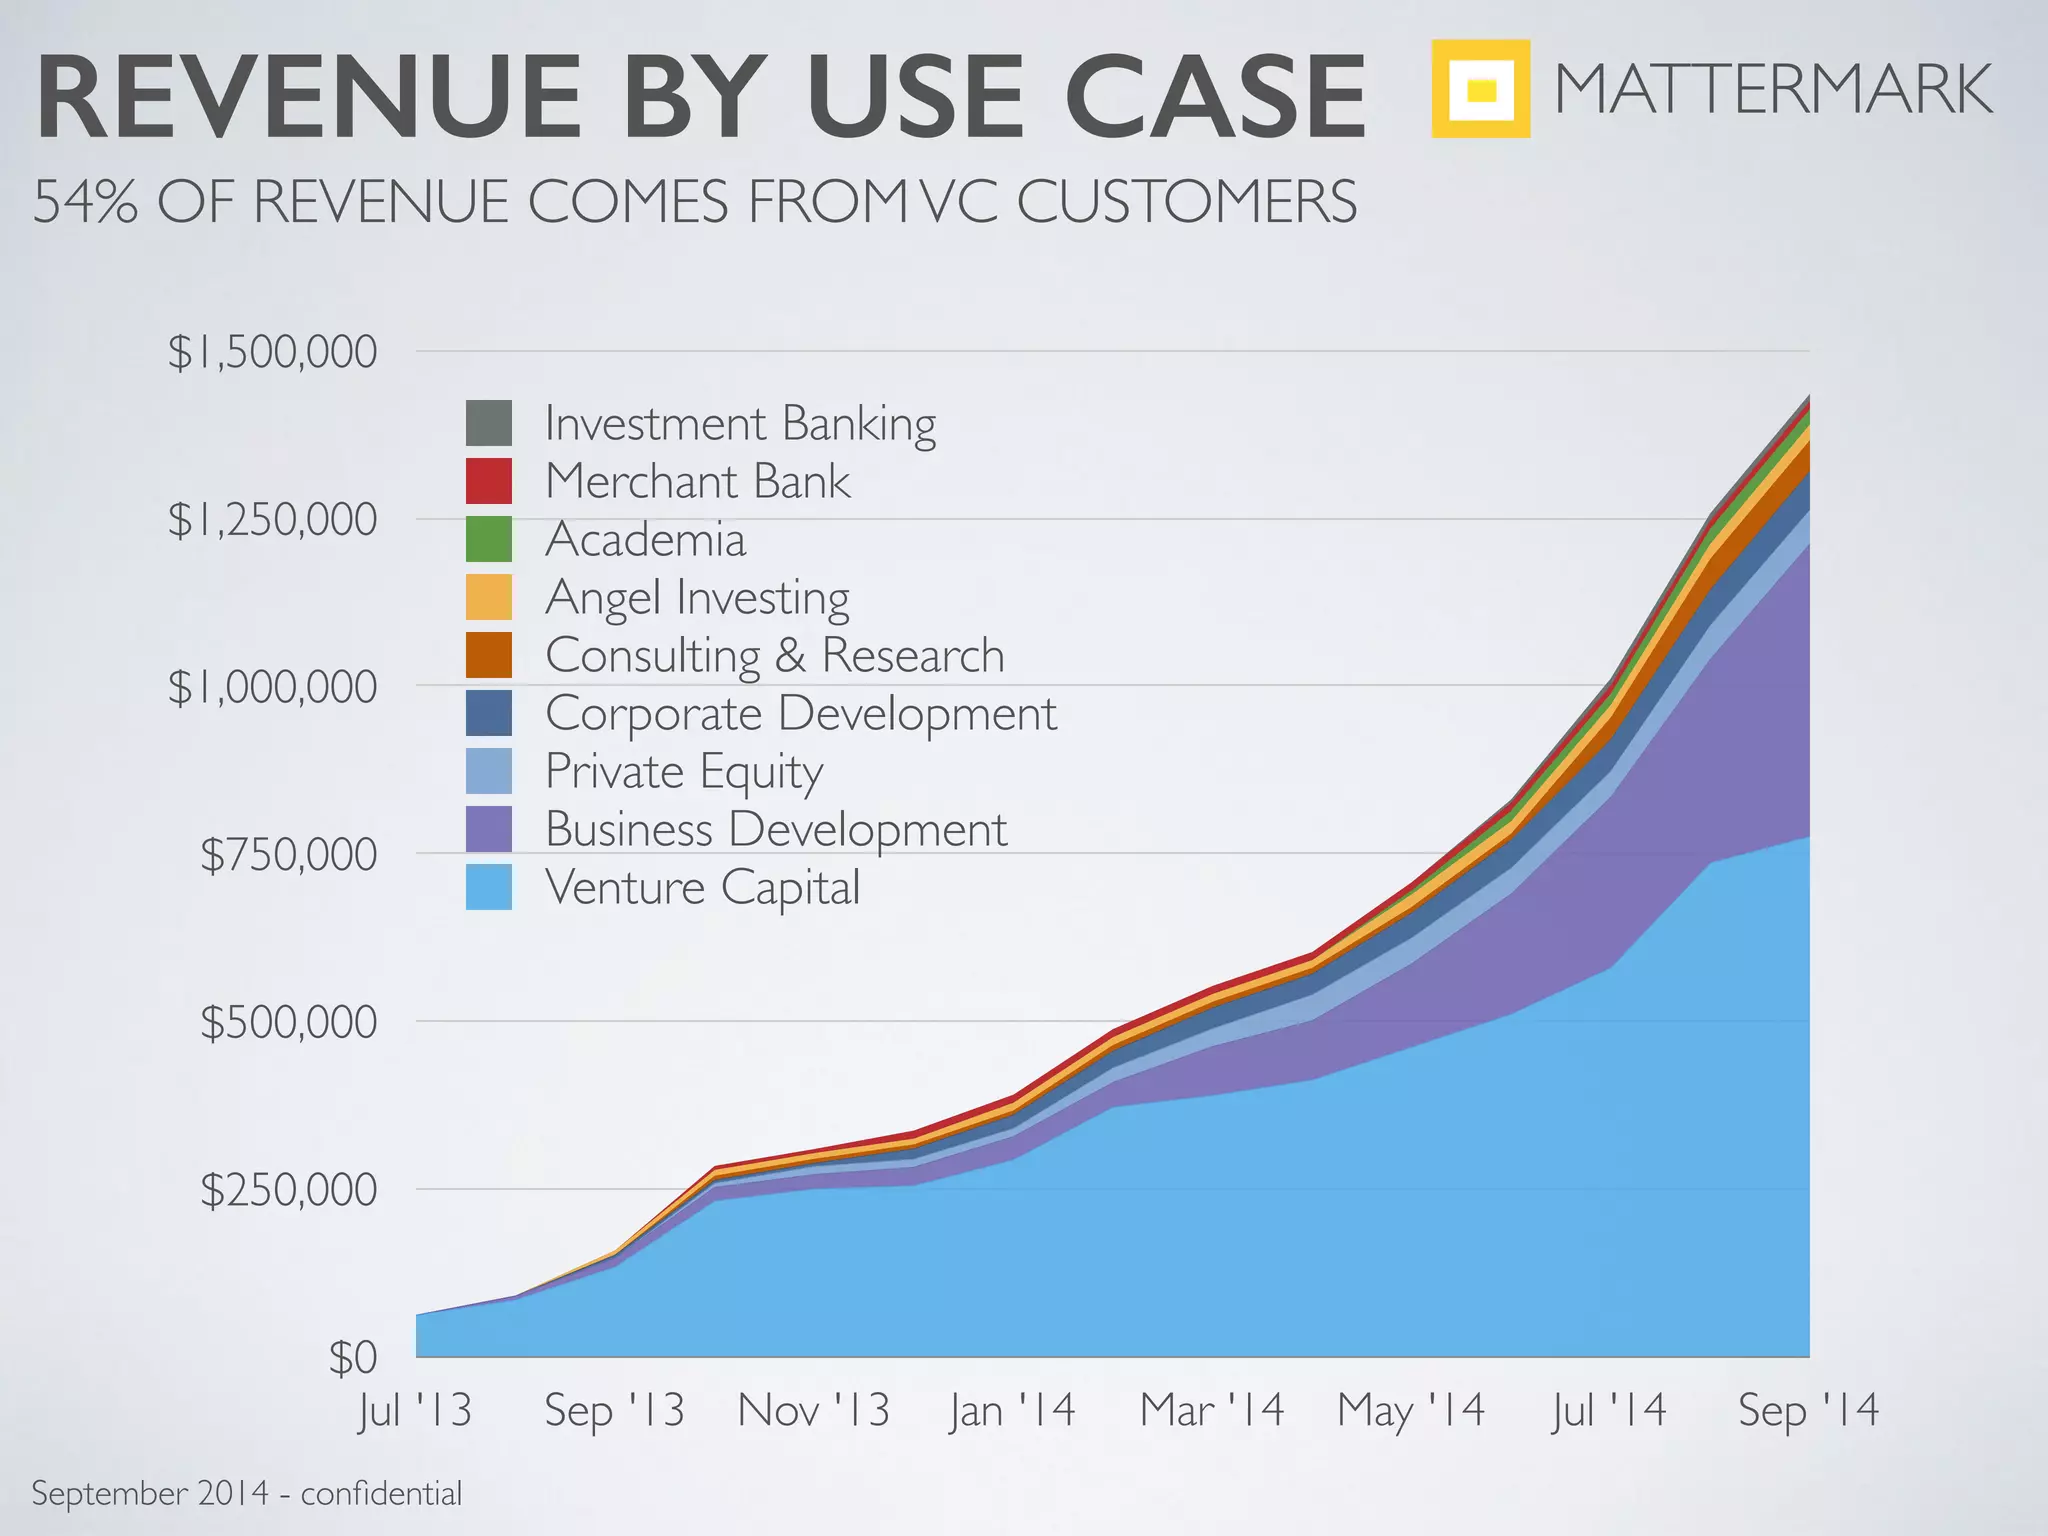
Slide 13 (Revenue by Use Case) breaks revenue down by vertical/use case over time and highlights that 54% of revenue comes from VC customers. This layered area chart conveys not just growth but the composition of that growth: which buyer segments are adopting and which are driving monetization. That’s important because it signals repeatable GTM channels and unit economics tied to specific customer profiles.

For founders, this is an excellent example of demonstrating early commercial validation (which segments pay) and scalability (expansion across categories). When possible, show revenue by use case or customer cohort — it helps investors understand where to double down and what predictable expansion looks like.

Key Takeaway: Break out revenue by customer segment or use case to show which buyers are paying and where your repeatable sales motion lives.
Team Credibility: Operators Who've Done It Before

Team Credibility: Operators Who've Done It Before

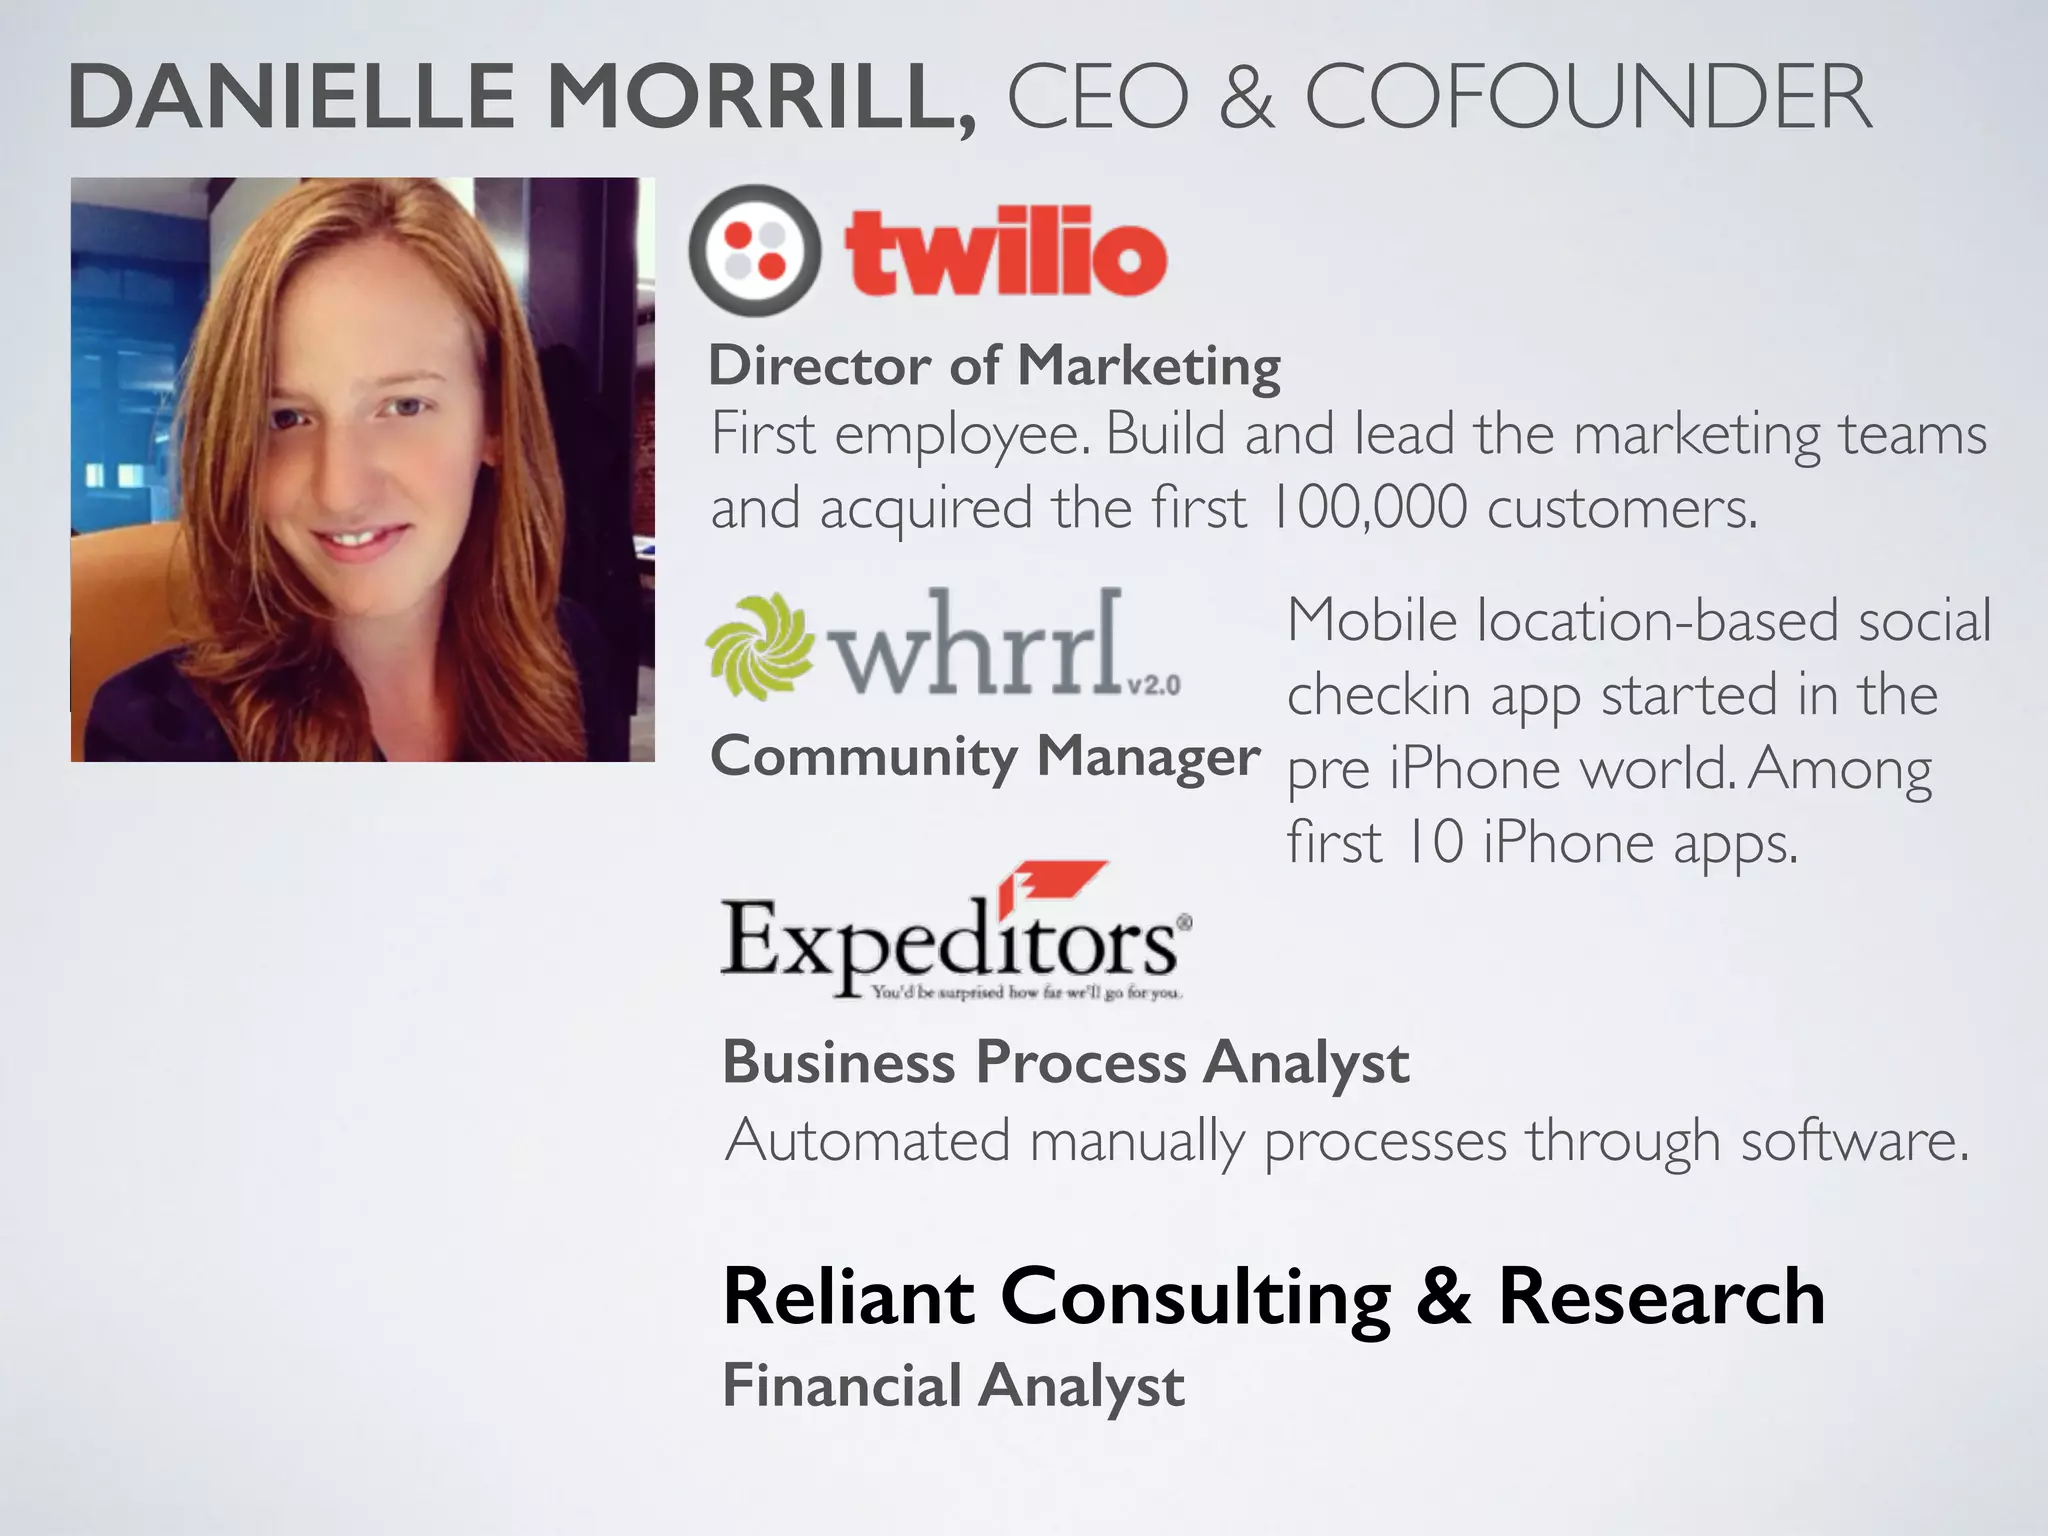
Slide 25 profiles Danielle Morrill with roles at Twilio and relevant experience in marketing, community building and finance/analytics. The slide uses specific prior outcomes (first employee, acquired users, analyst roles) to show demonstrated operator chops. Highlighting concrete past results (e.g., acquiring first 100,000 customers at Twilio) makes the team’s ability to execute believable.

This approach to team slides — focusing on outcomes, relevant domain experience, and complementary skill sets — is persuasive for investors. Founders should present succinct bios that emphasize prior operational accomplishments tied to their current company’s core challenges (e.g., growth, data, enterprise sales). It’s less about titles and more about repeatable success signals.

Key Takeaway: Highlight founders' relevant past outcomes (not just titles) that map to the current company's biggest execution risks.

Conclusion: Key Lessons

Mattermark’s deck is strong because it pairs an intuitive product metaphor with concrete scale metrics, spells out a clear customer pain and workflow improvement, and backs claims with month-by-month traction and revenue segmentation. Visuals are simple and purposeful: large numbers and clean charts make the evidence easy to absorb, while team bios link prior outcomes to execution risk mitigation. The narrative flows from mission to problem to solution to traction to team — the classic investor checklist — executed with restraint and clarity.

Actionable advice for founders building pitch decks: open with a crisp mission and a memorable product metaphor; quantify market size with a few credible numbers; articulate the customer’s current workaround and the specific workflow improvement you provide; show unambiguous traction (time-series revenue + headline MRR/Growth); break revenue out by customer segment to prove a repeatable sales motion; and present team bios centered on relevant, prior outcomes. Keep slides visually clean, emphasize the single most important number on each page, and make it effortless for investors to see product-market fit and execution capability.

Full Deck Analysis

11 sections

Overview

Company: Mattermark
Round: Series A ($6.5M)
Year: 2015
Outcome: Acquired by FullContact (2016)
Deck Date: September 2014

Executive Summary

Mattermark’s Series A pitch deck presents a B2B intelligence platform positioned as “Google for Business People,” enabling professionals to search and analyze data on 500K+ companies. The deck is notable for combining exceptional founder credibility (Twilio, Palantir, Bloomberg, Kabam) with real traction ($125K MRR, 377% CAGR) to justify an ambitious growth vision (3M companies, $10M ARR by Sept 2015). However, the deck notably lacks clarity on the actual product, data sources, and competitive differentiation—suggesting that investor confidence was driven primarily by team pedigree and revenue metrics rather than product-market fit clarity.

Problem Statement

Core Problem (Slide 4): “There is no effective, reliable way for professionals to ask business questions and get credible intelligence supported by data.”

Supporting Pain Points:

  • CRM systems come empty; users must re-collect information
  • Professionals waste time re-creating spreadsheets with duplicate data
  • 99% of knowledge workers cannot afford consultants
  • PDFs and reports are unstructured and unsearchable

Problem Illustration (Slides 5-7): Three Google search examples demonstrate information fragmentation:

  • “What is the market size of SaaS?” → 184,000 results
  • “All Series A rounds in 2013” → 65.6M results
  • “Startups growing headcount 20% month over month” → 886,000 results

Problem Framing: The deck positions this as a search/discovery problem—professionals need structured, reliable business intelligence but currently rely on fragmented Google searches, manual spreadsheets, and expensive consultants.

Solution

Positioning (Slide 3): “Mattermark is Google for Business People”

Mission (Slide 2): “Organizing the world’s business information to answer questions about the companies you want to do business with”

Vision (Slide 8):

  • Today: Market research = Google + spreadsheet
  • Future: Market research = data-driven answers, delivered in a format professionals can use to G.S.D. (Get Stuff Done)

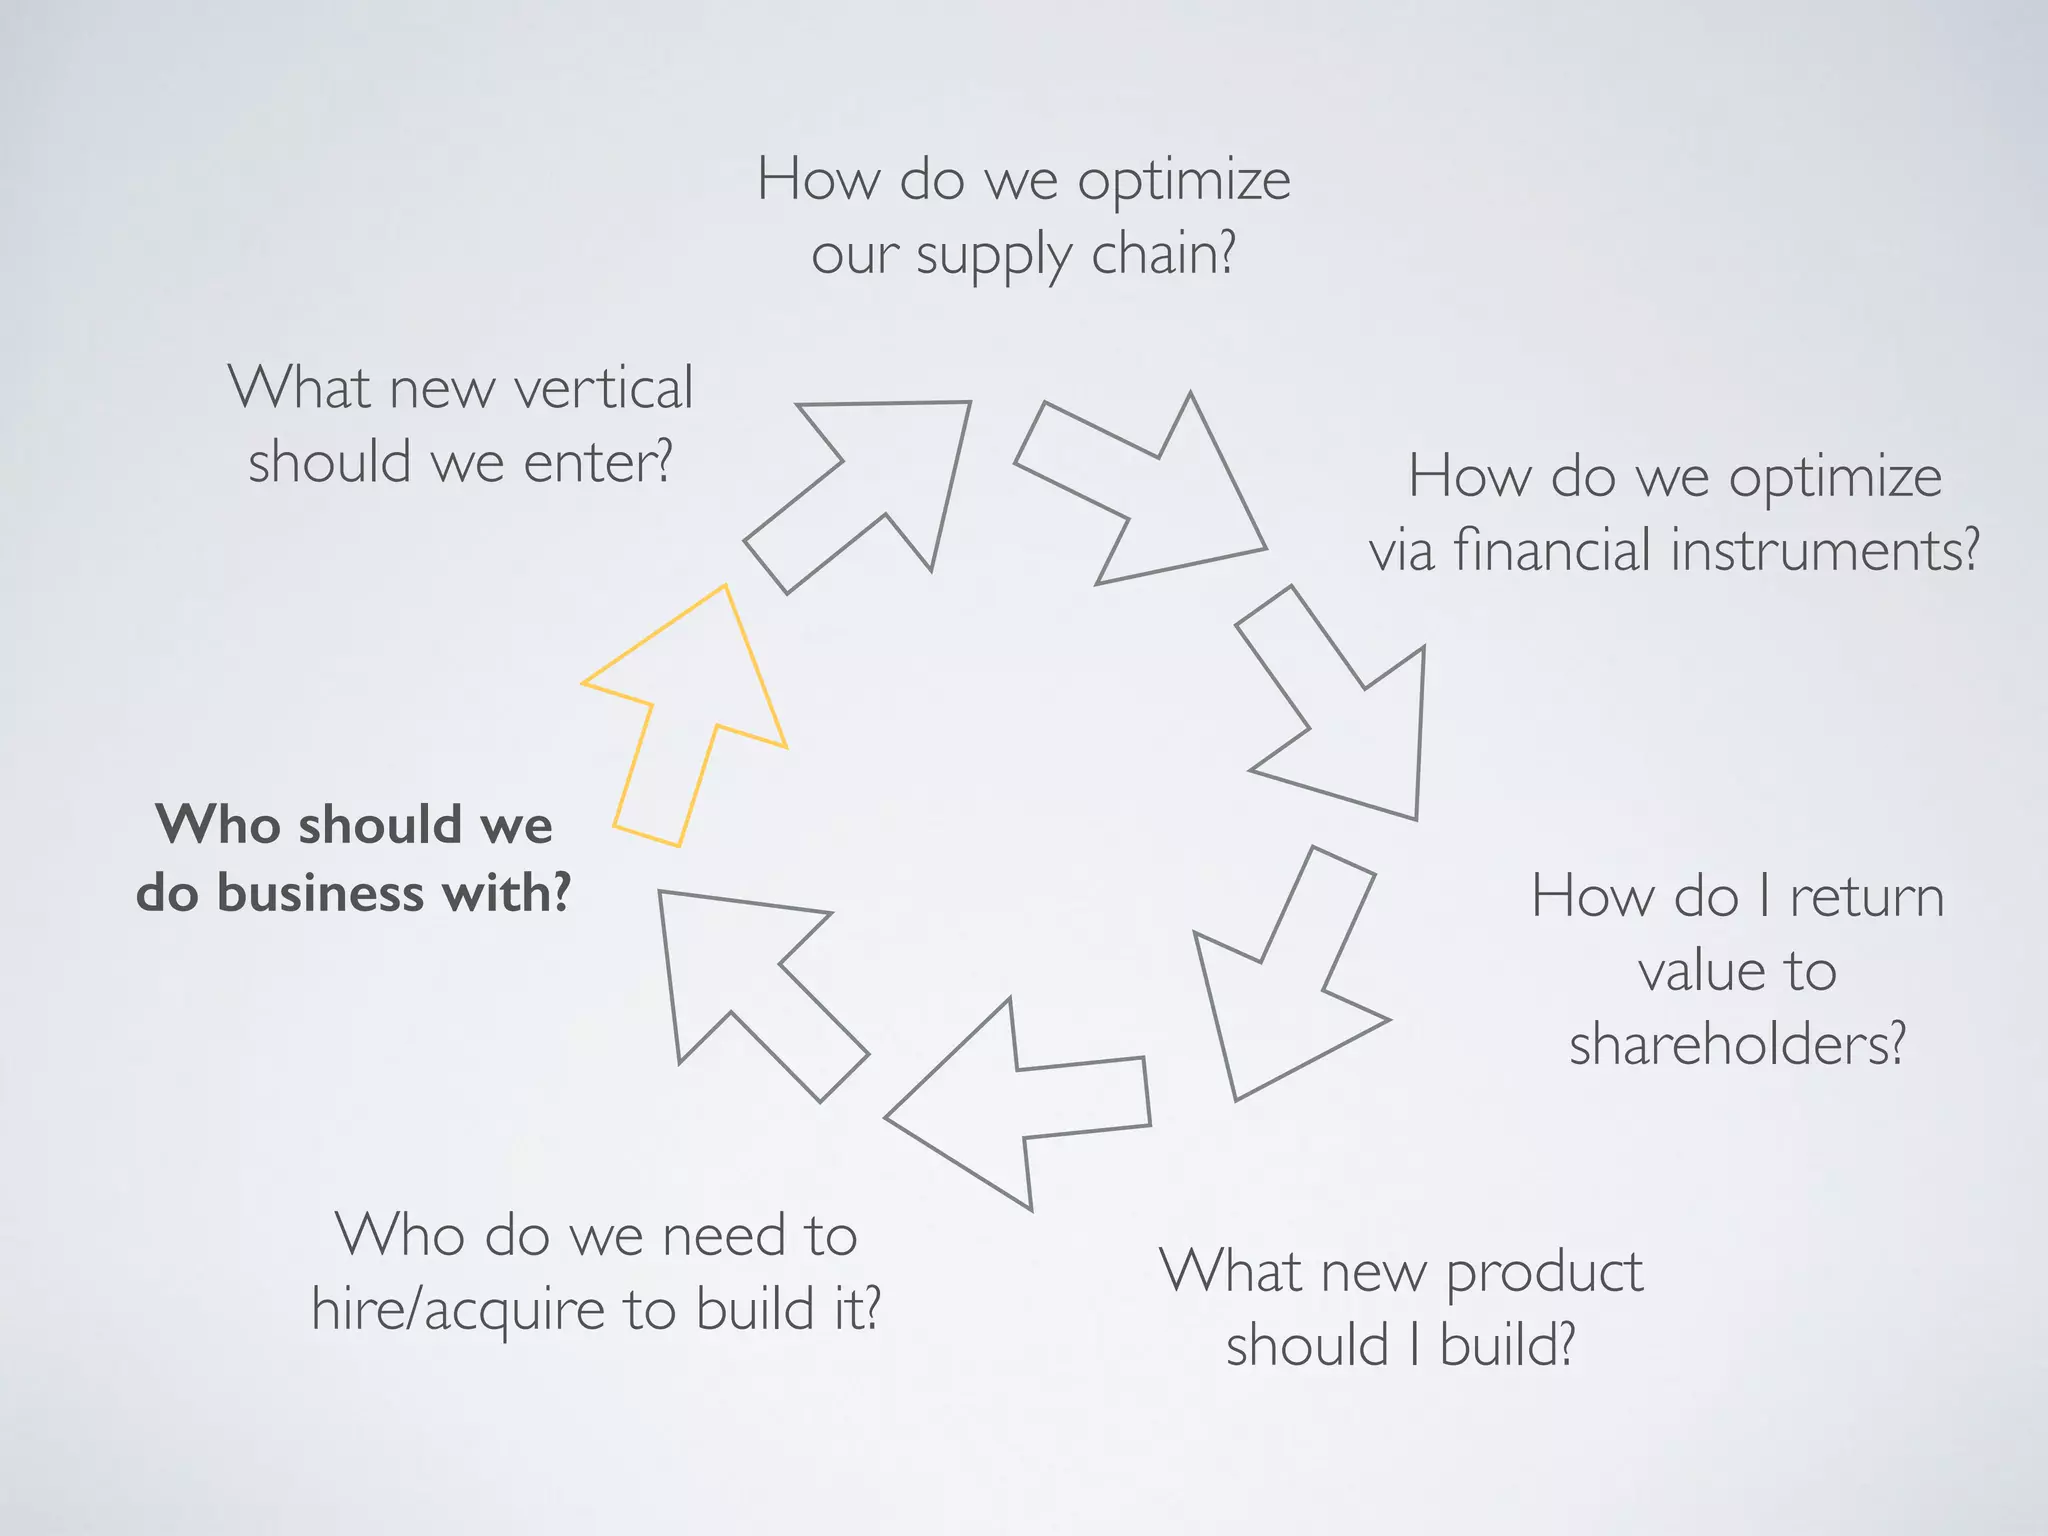
Product Scope (Slides 16-18): Mattermark enables customers to answer eight core business questions:

  1. Who should we do business with?
  2. What new vertical should we enter?
  3. How do we optimize our supply chain?
  4. How do we optimize via financial instruments?
  5. How do I return value to shareholders?
  6. What new product should I build?
  7. Who do we need to hire/acquire to build it?
  8. M&A and recruiting decisions

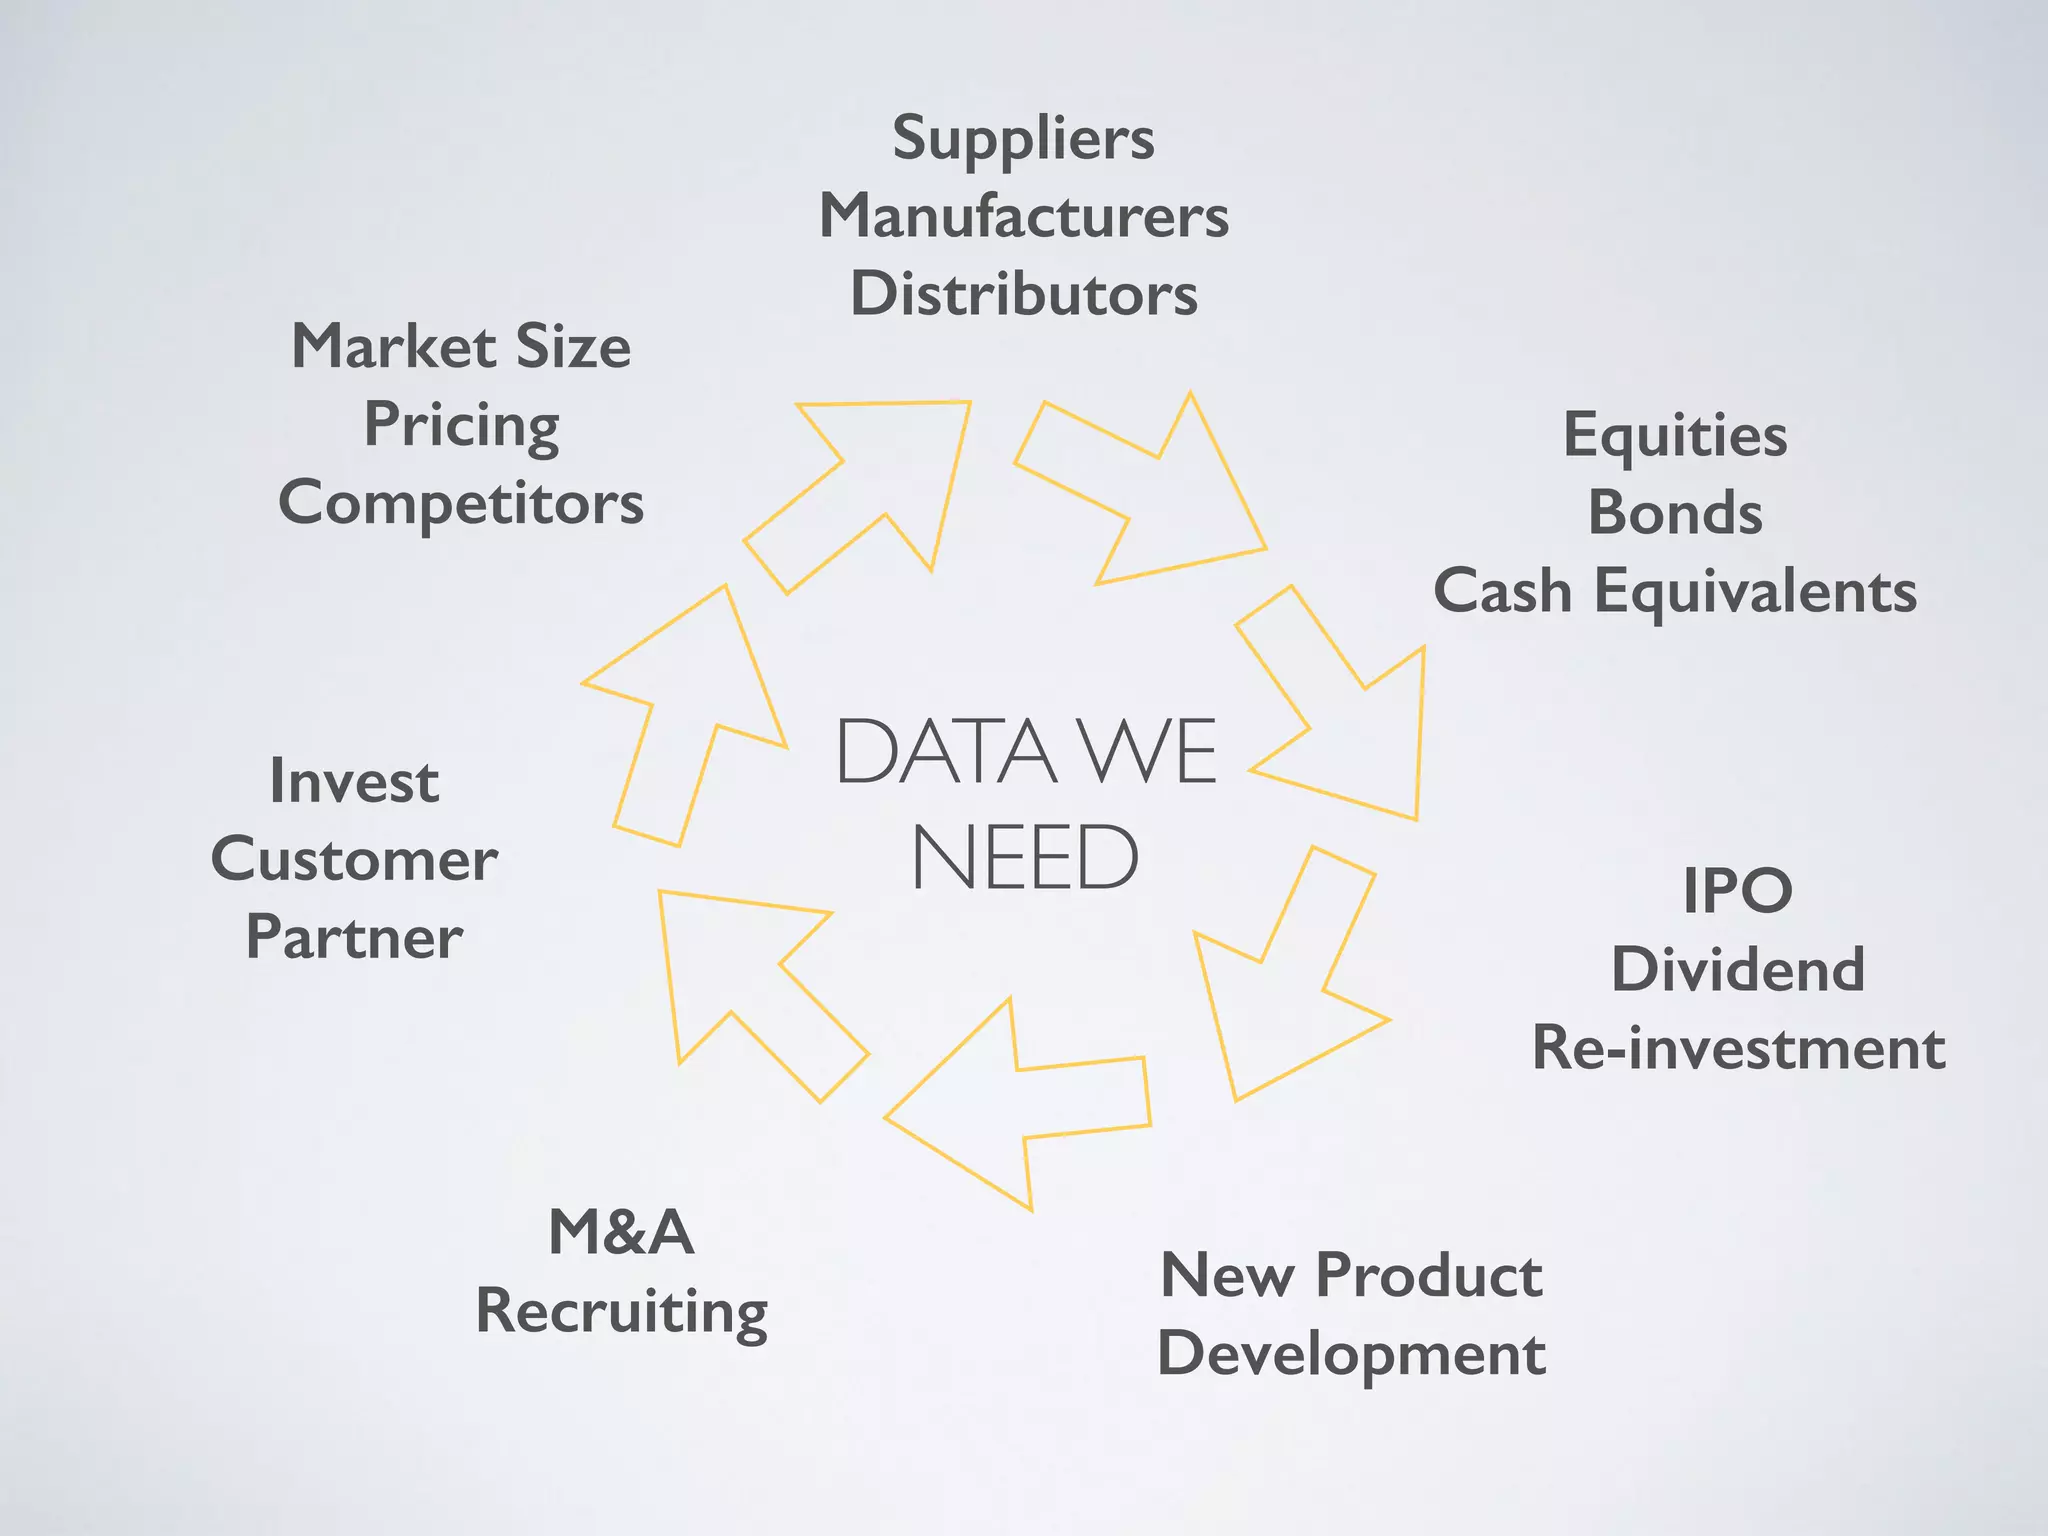
Data Coverage (Slide 17): Mattermark organizes data across 12 categories:

  • Company fundamentals (market size, pricing, competitors)
  • Supply chain (suppliers, manufacturers, distributors)
  • Financial instruments (equities, bonds, cash equivalents)
  • Business operations (M&A, recruiting, new product development)
  • Exit events (IPO, dividend, re-investment)

Critical Gap: The deck never explicitly explains what Mattermark’s product actually is—platform? API? Database? Search engine? This is a significant omission for a Series A pitch.

Market Opportunity

Total Addressable Market (Slide 3):

  • 250M+ companies globally
  • 1,000s of markets
  • Billions of people

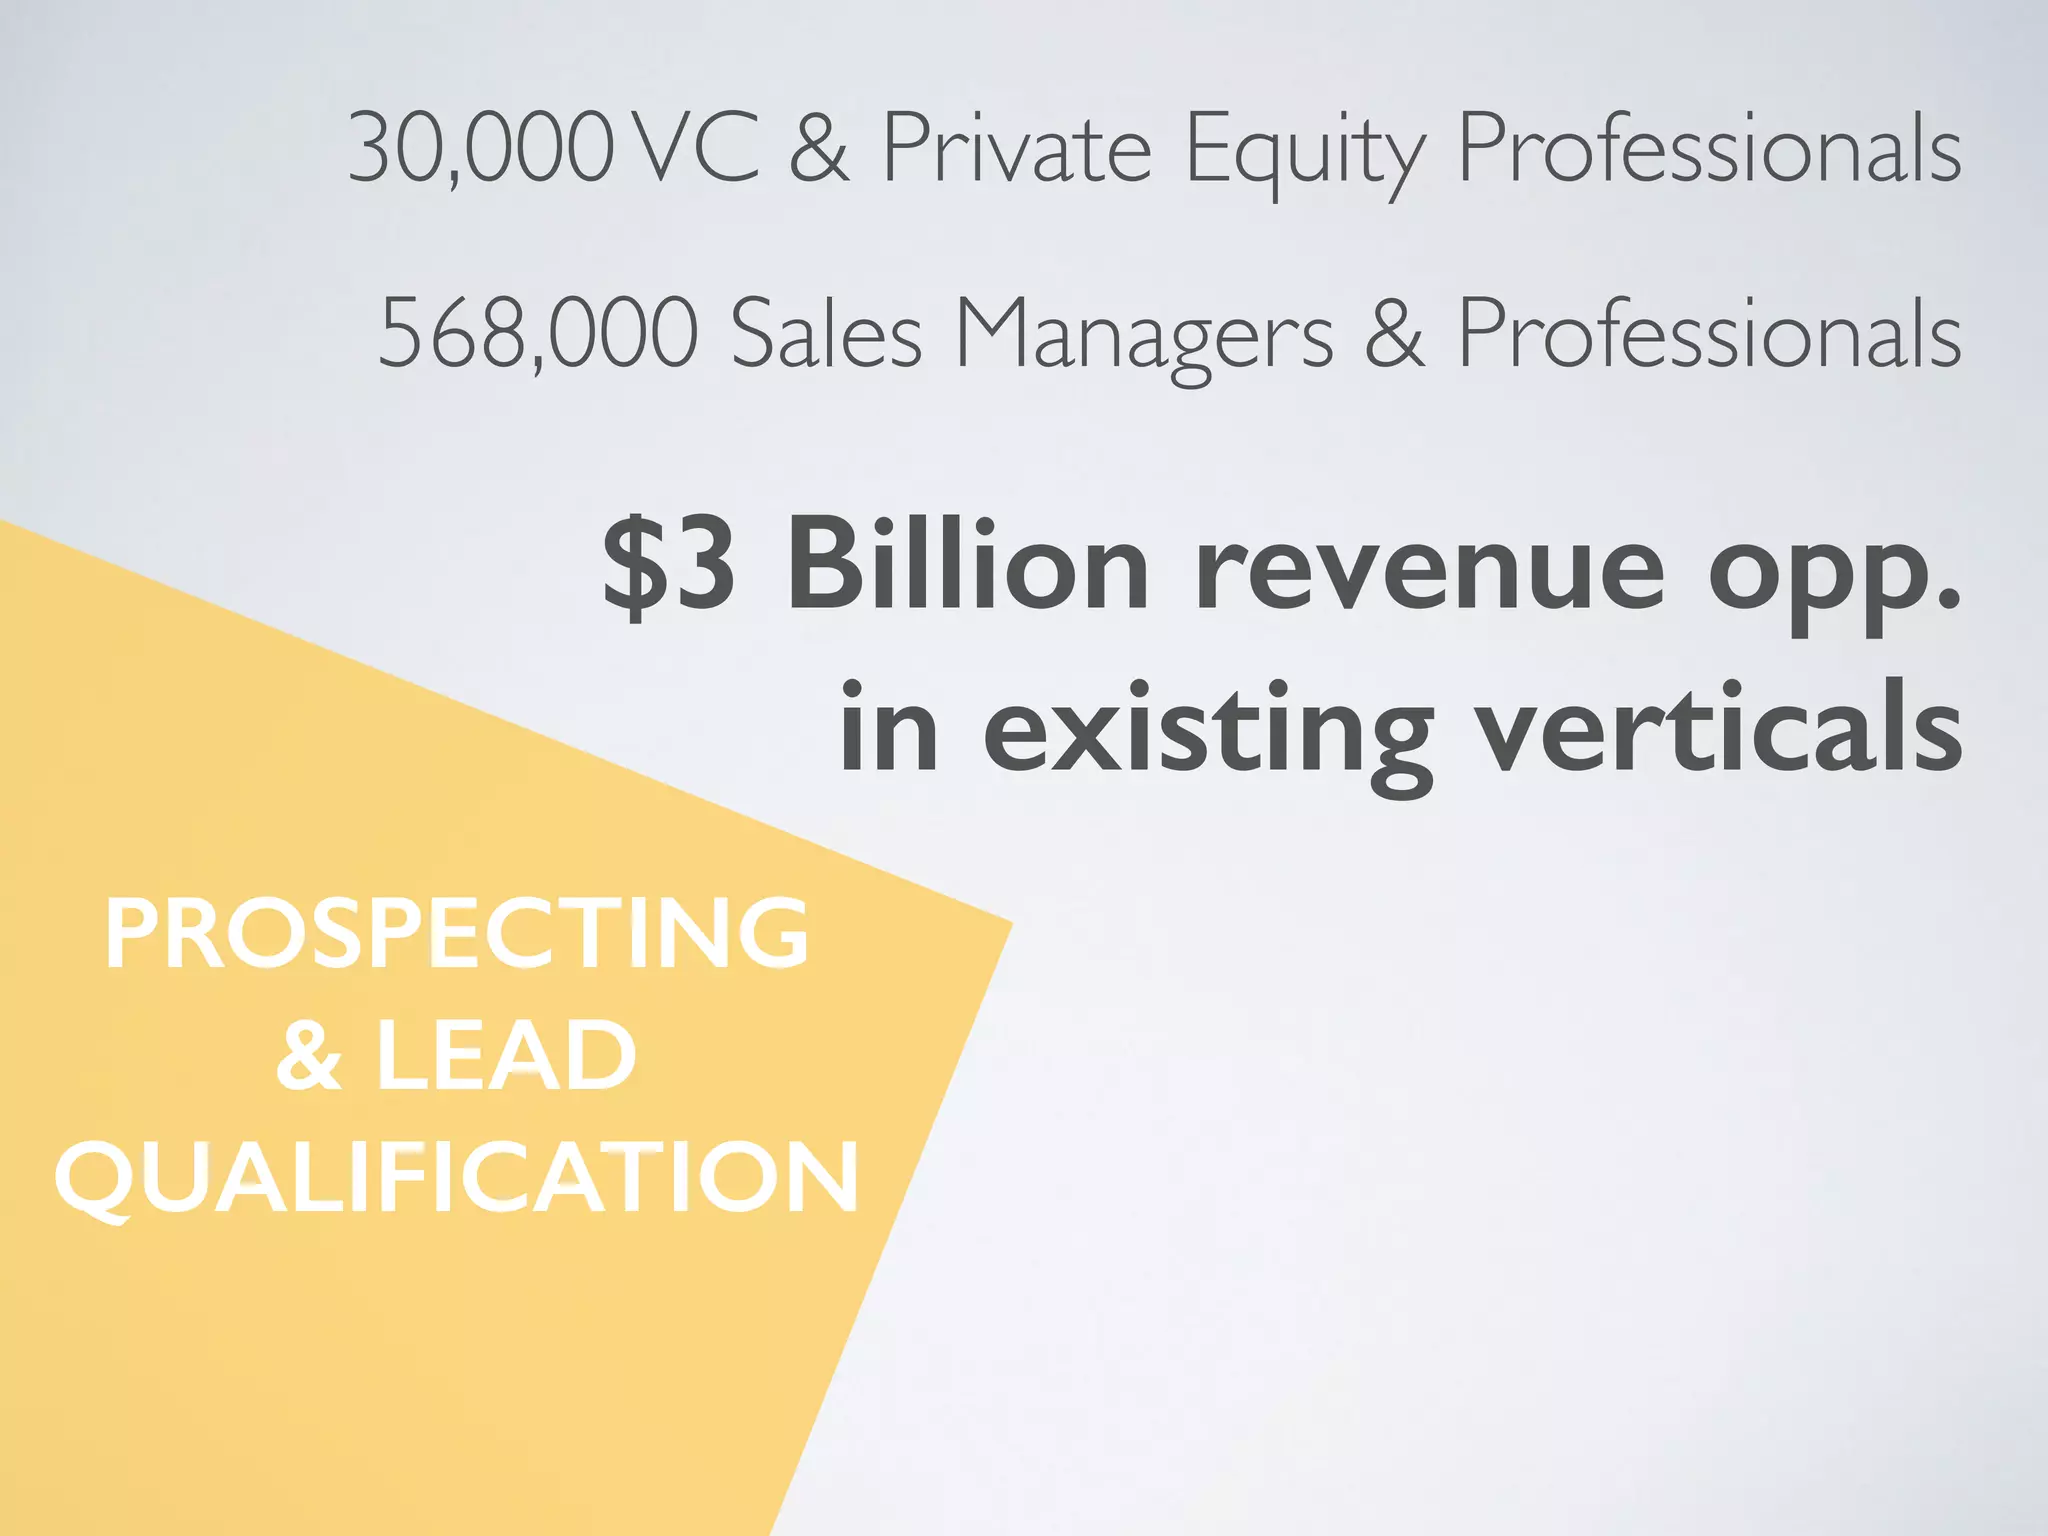
Serviceable Addressable Market (Slide 10):

  • 30,000 VC & Private Equity Professionals (initial target)
  • 568,000 Sales Managers & Professionals (larger segment)
  • $3 Billion revenue opportunity in existing verticals

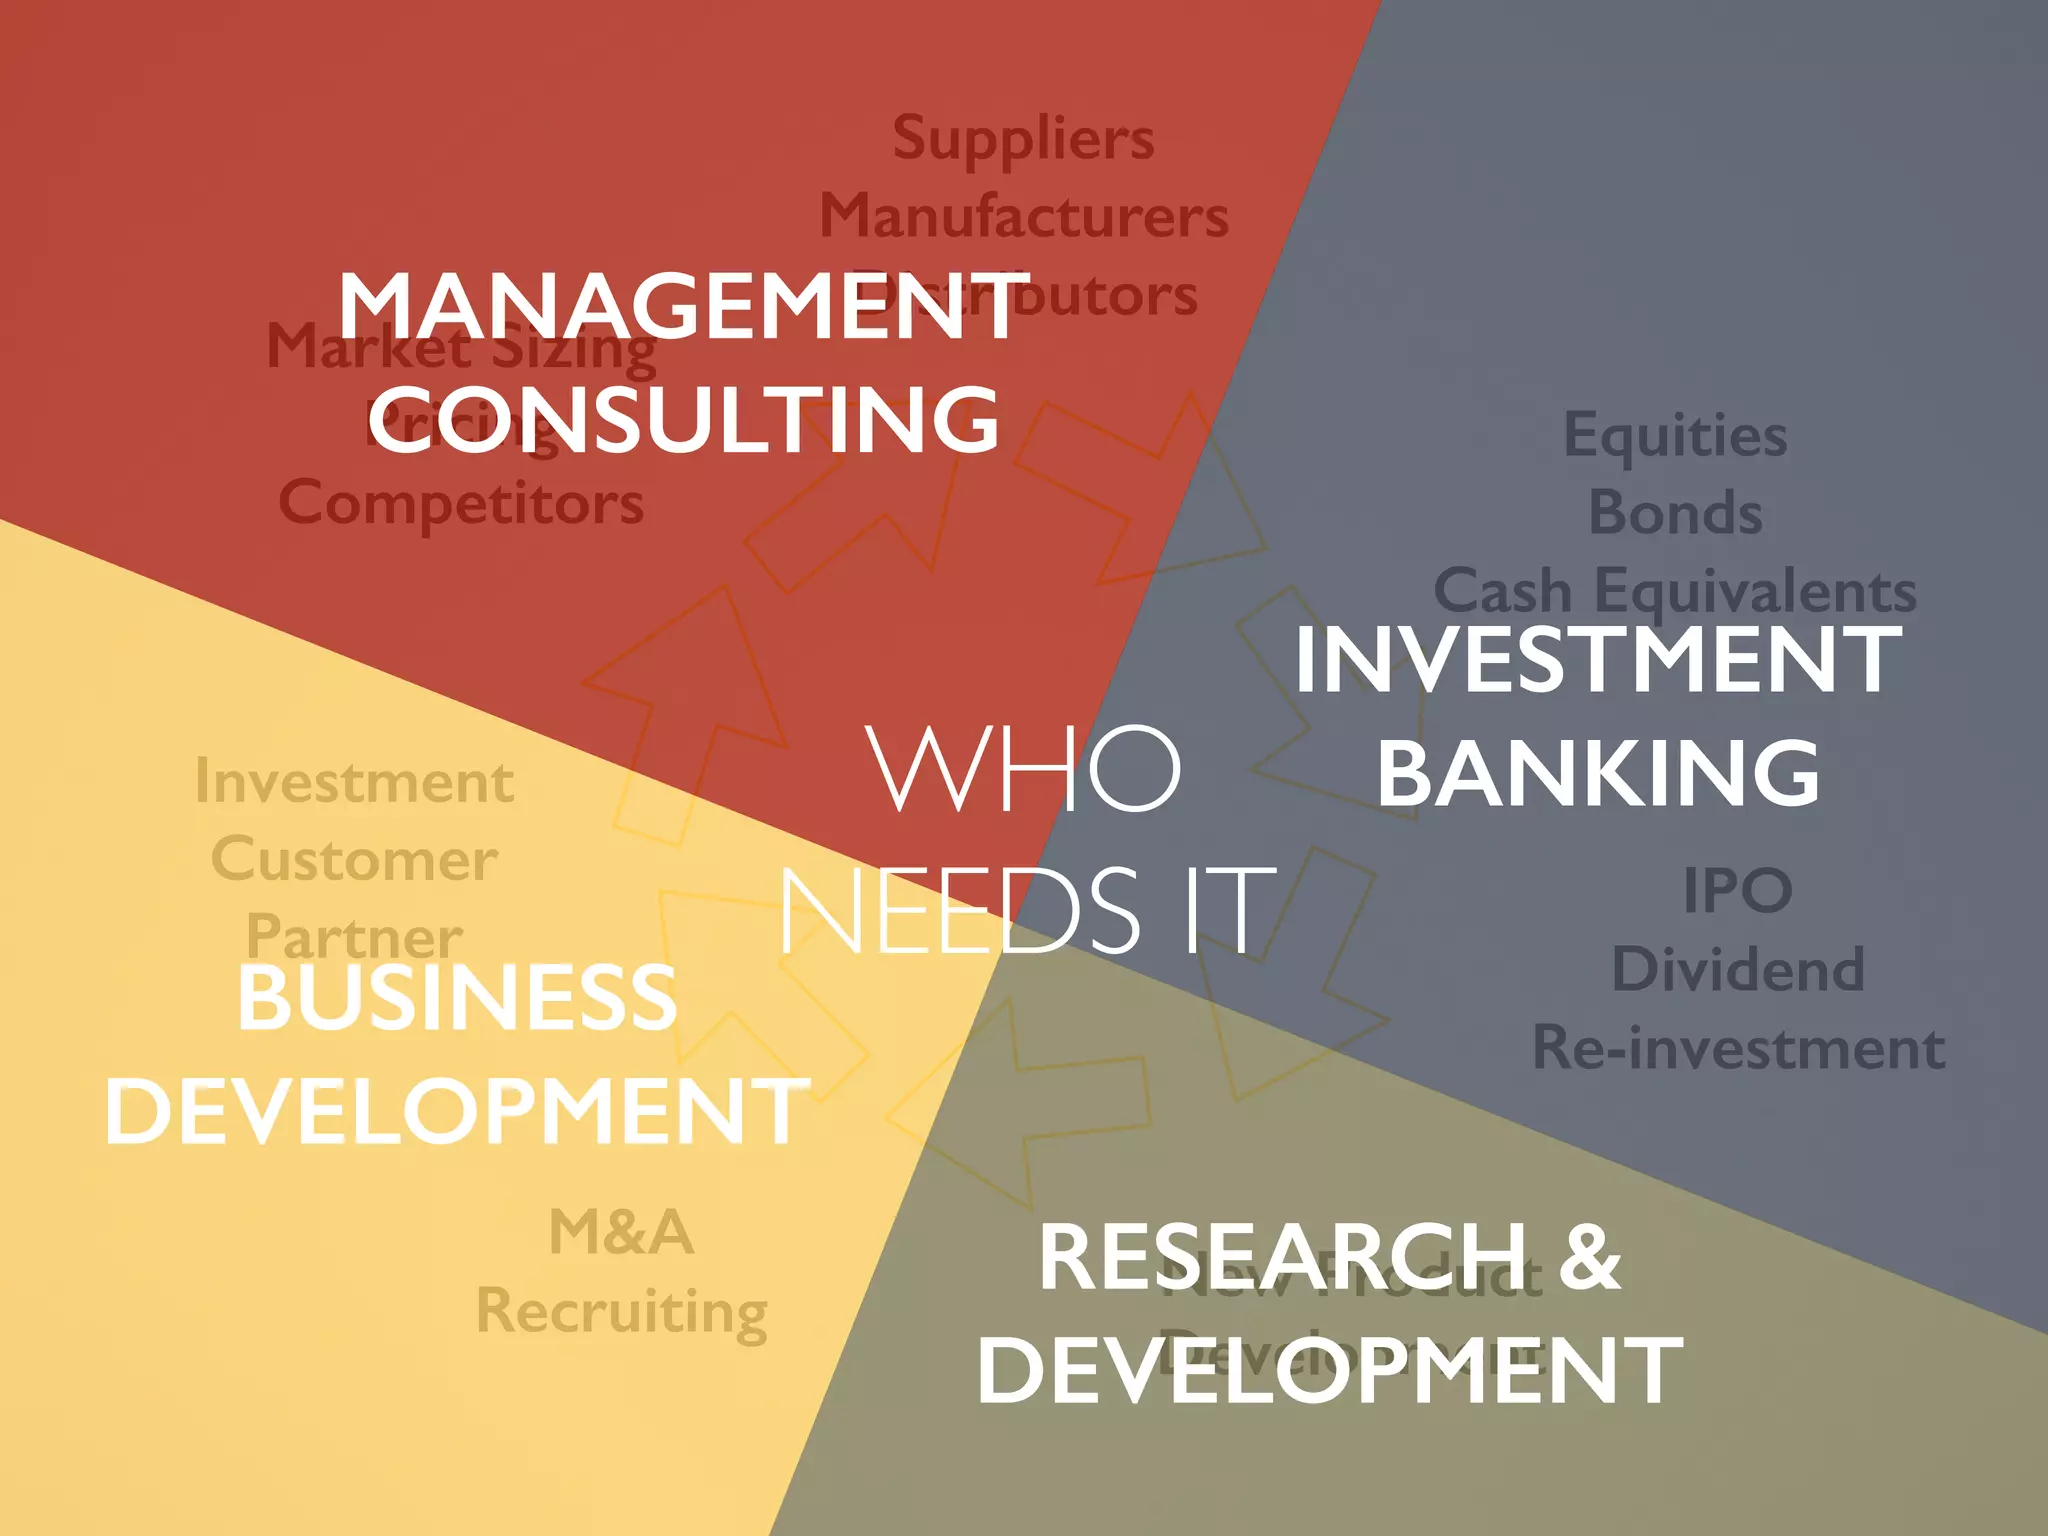
Market Segmentation (Slide 18): Four primary customer segments:

  1. Management Consulting - Need market/competitor data
  2. Business Development - Need partnership/acquisition targets
  3. Investment Banking - Need financial/exit data
  4. Research & Development - Need product/market data

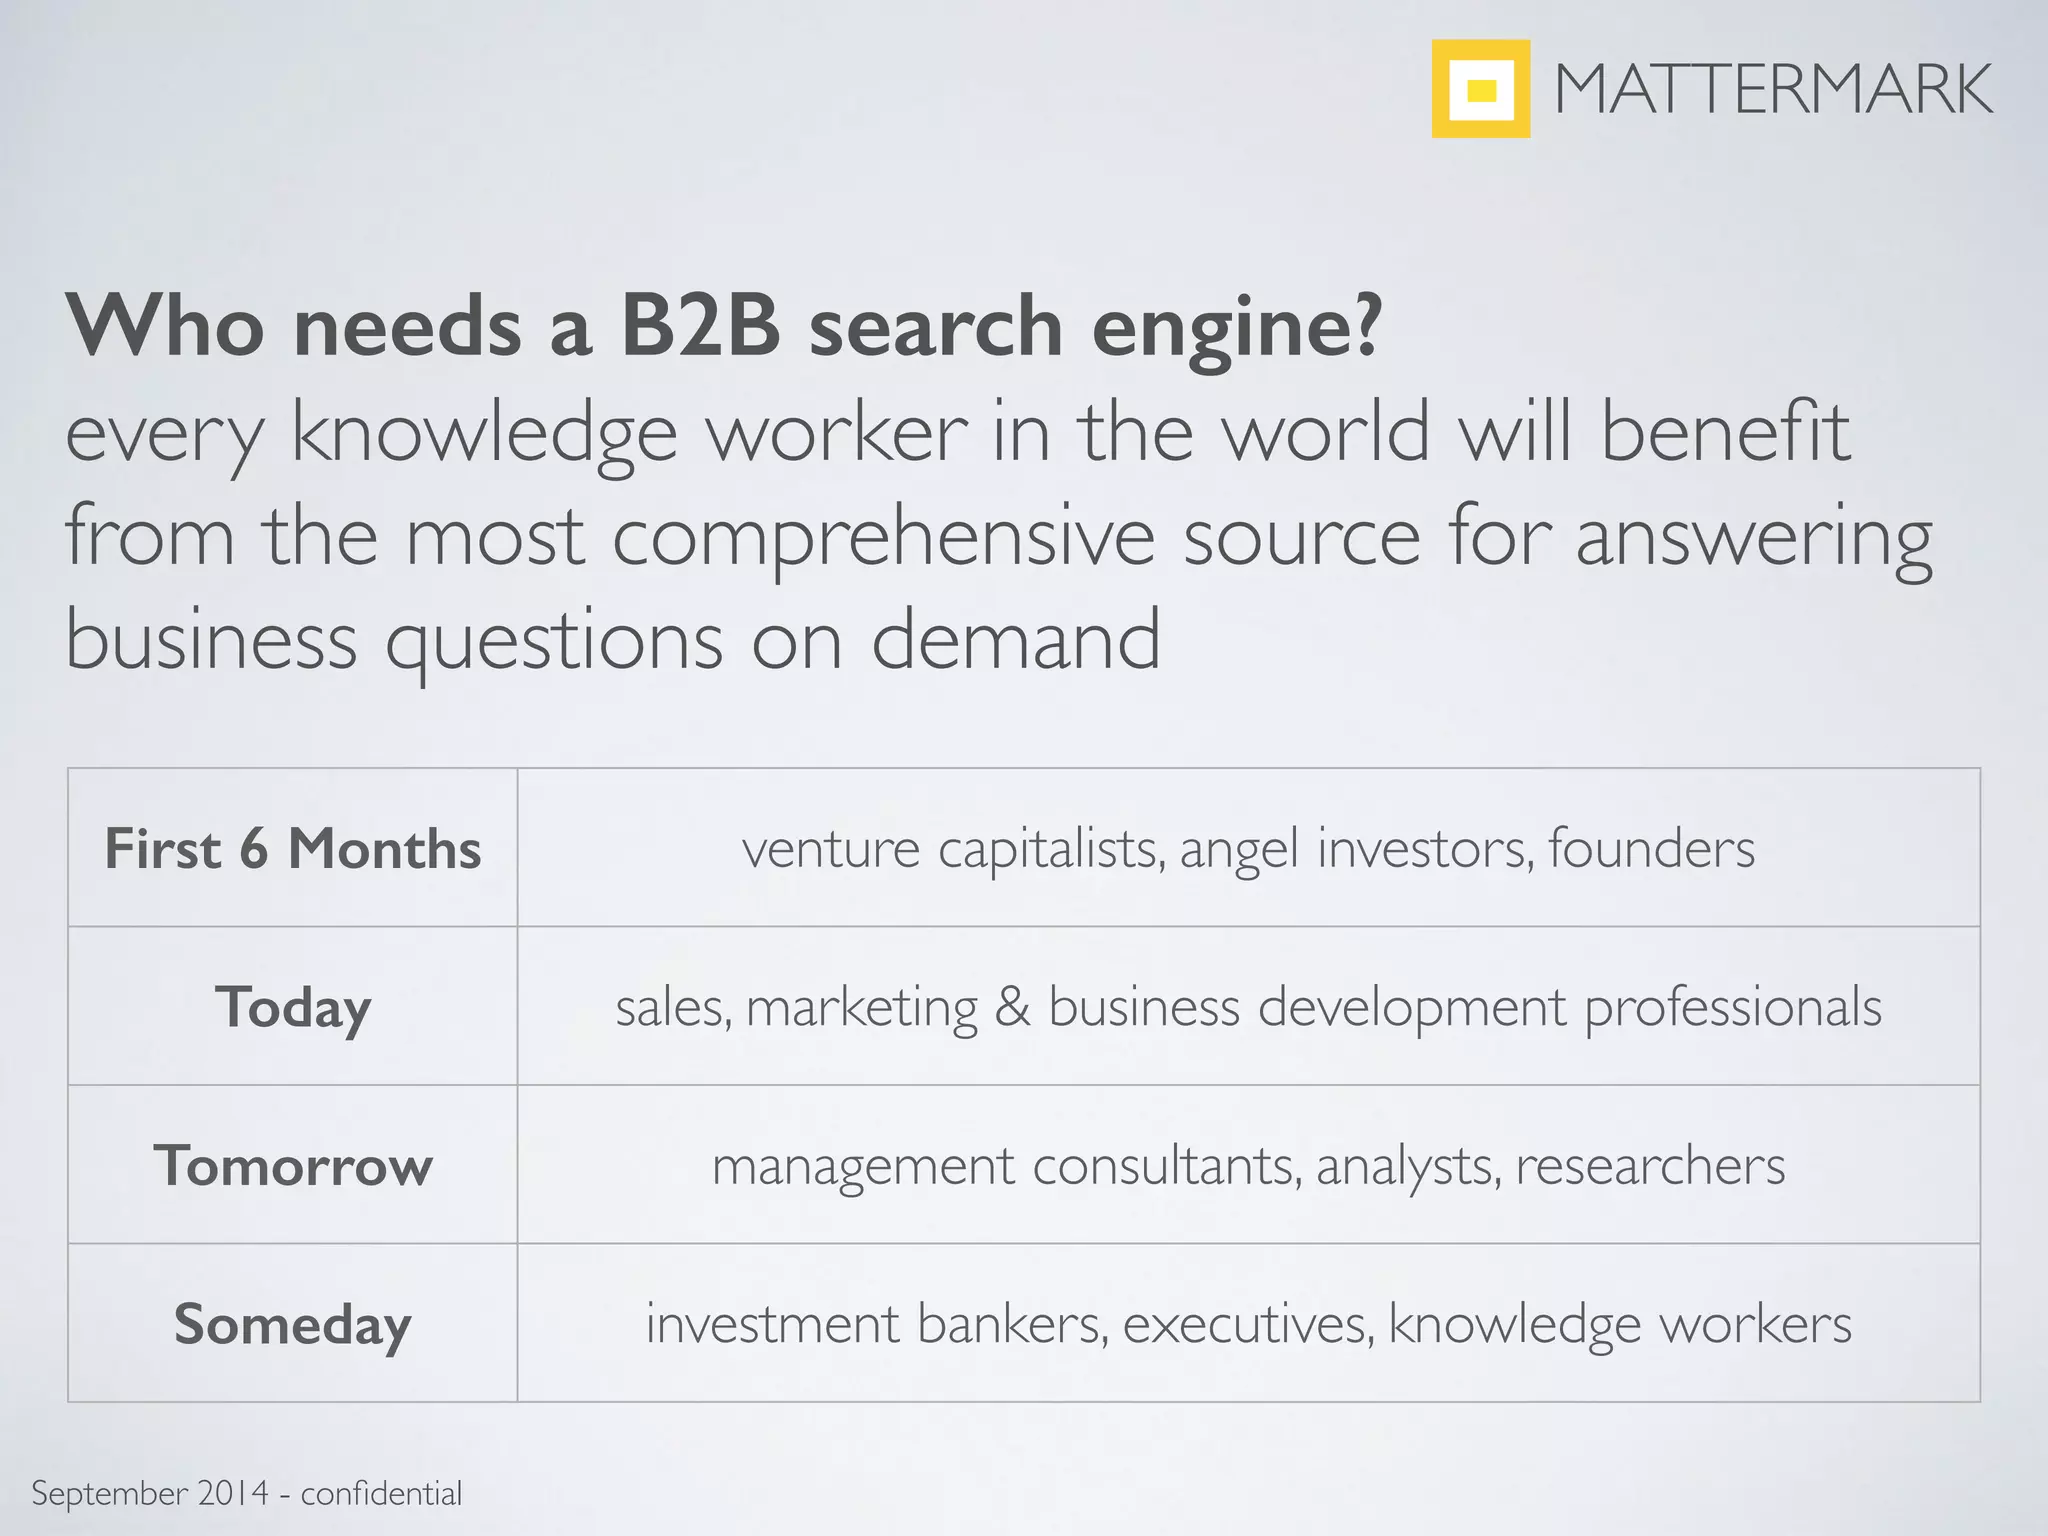
Expansion Strategy (Slide 9): Phased market entry:

  • First 6 Months: VCs, angel investors, founders
  • Today: Sales, marketing & business development professionals
  • Tomorrow: Management consultants, analysts, researchers
  • Someday: Investment bankers, executives, knowledge workers

Market Validation: 54% of current revenue from VC customers (Slide 13) validates initial target market strategy, while 46% from other segments demonstrates expansion potential.

Business Model

Revenue Model: Subscription-based SaaS (implied but not explicitly stated)

Pricing: Not disclosed in deck

Unit Economics: Not disclosed in deck

Critical Gaps:

  • No pricing tiers or pricing strategy shown
  • No Customer Acquisition Cost (CAC) metrics
  • No Lifetime Value (LTV) metrics
  • No churn/retention rates
  • No gross margin or unit economics
  • No explanation of how $3B opportunity translates to revenue capture

Revenue by Use Case (Slide 13):

  • Venture Capital: 54% of revenue (~$67.5K MRR)
  • Business Development: 16% (~$20K MRR)
  • Private Equity: 12% (~$15K MRR)
  • Corporate Development: 8% (~$10K MRR)
  • Other segments: 10% (~$12.5K MRR)

This diversification suggests multiple revenue streams but raises questions about which segments are most profitable and sticky.

Traction & Metrics

Revenue Metrics (Slide 11)

  • Current MRR: $125K (September 2014)
  • Current ARR: ~$1.5M (annualized)
  • Growth Rate: 377% CAGR (July 2013 - September 2014)
  • Historical Trend: $10K (July 2013) → $125K (September 2014)
  • Recent Growth Rate: ~20% monthly (September 2014)

Data Metrics (Slide 20)

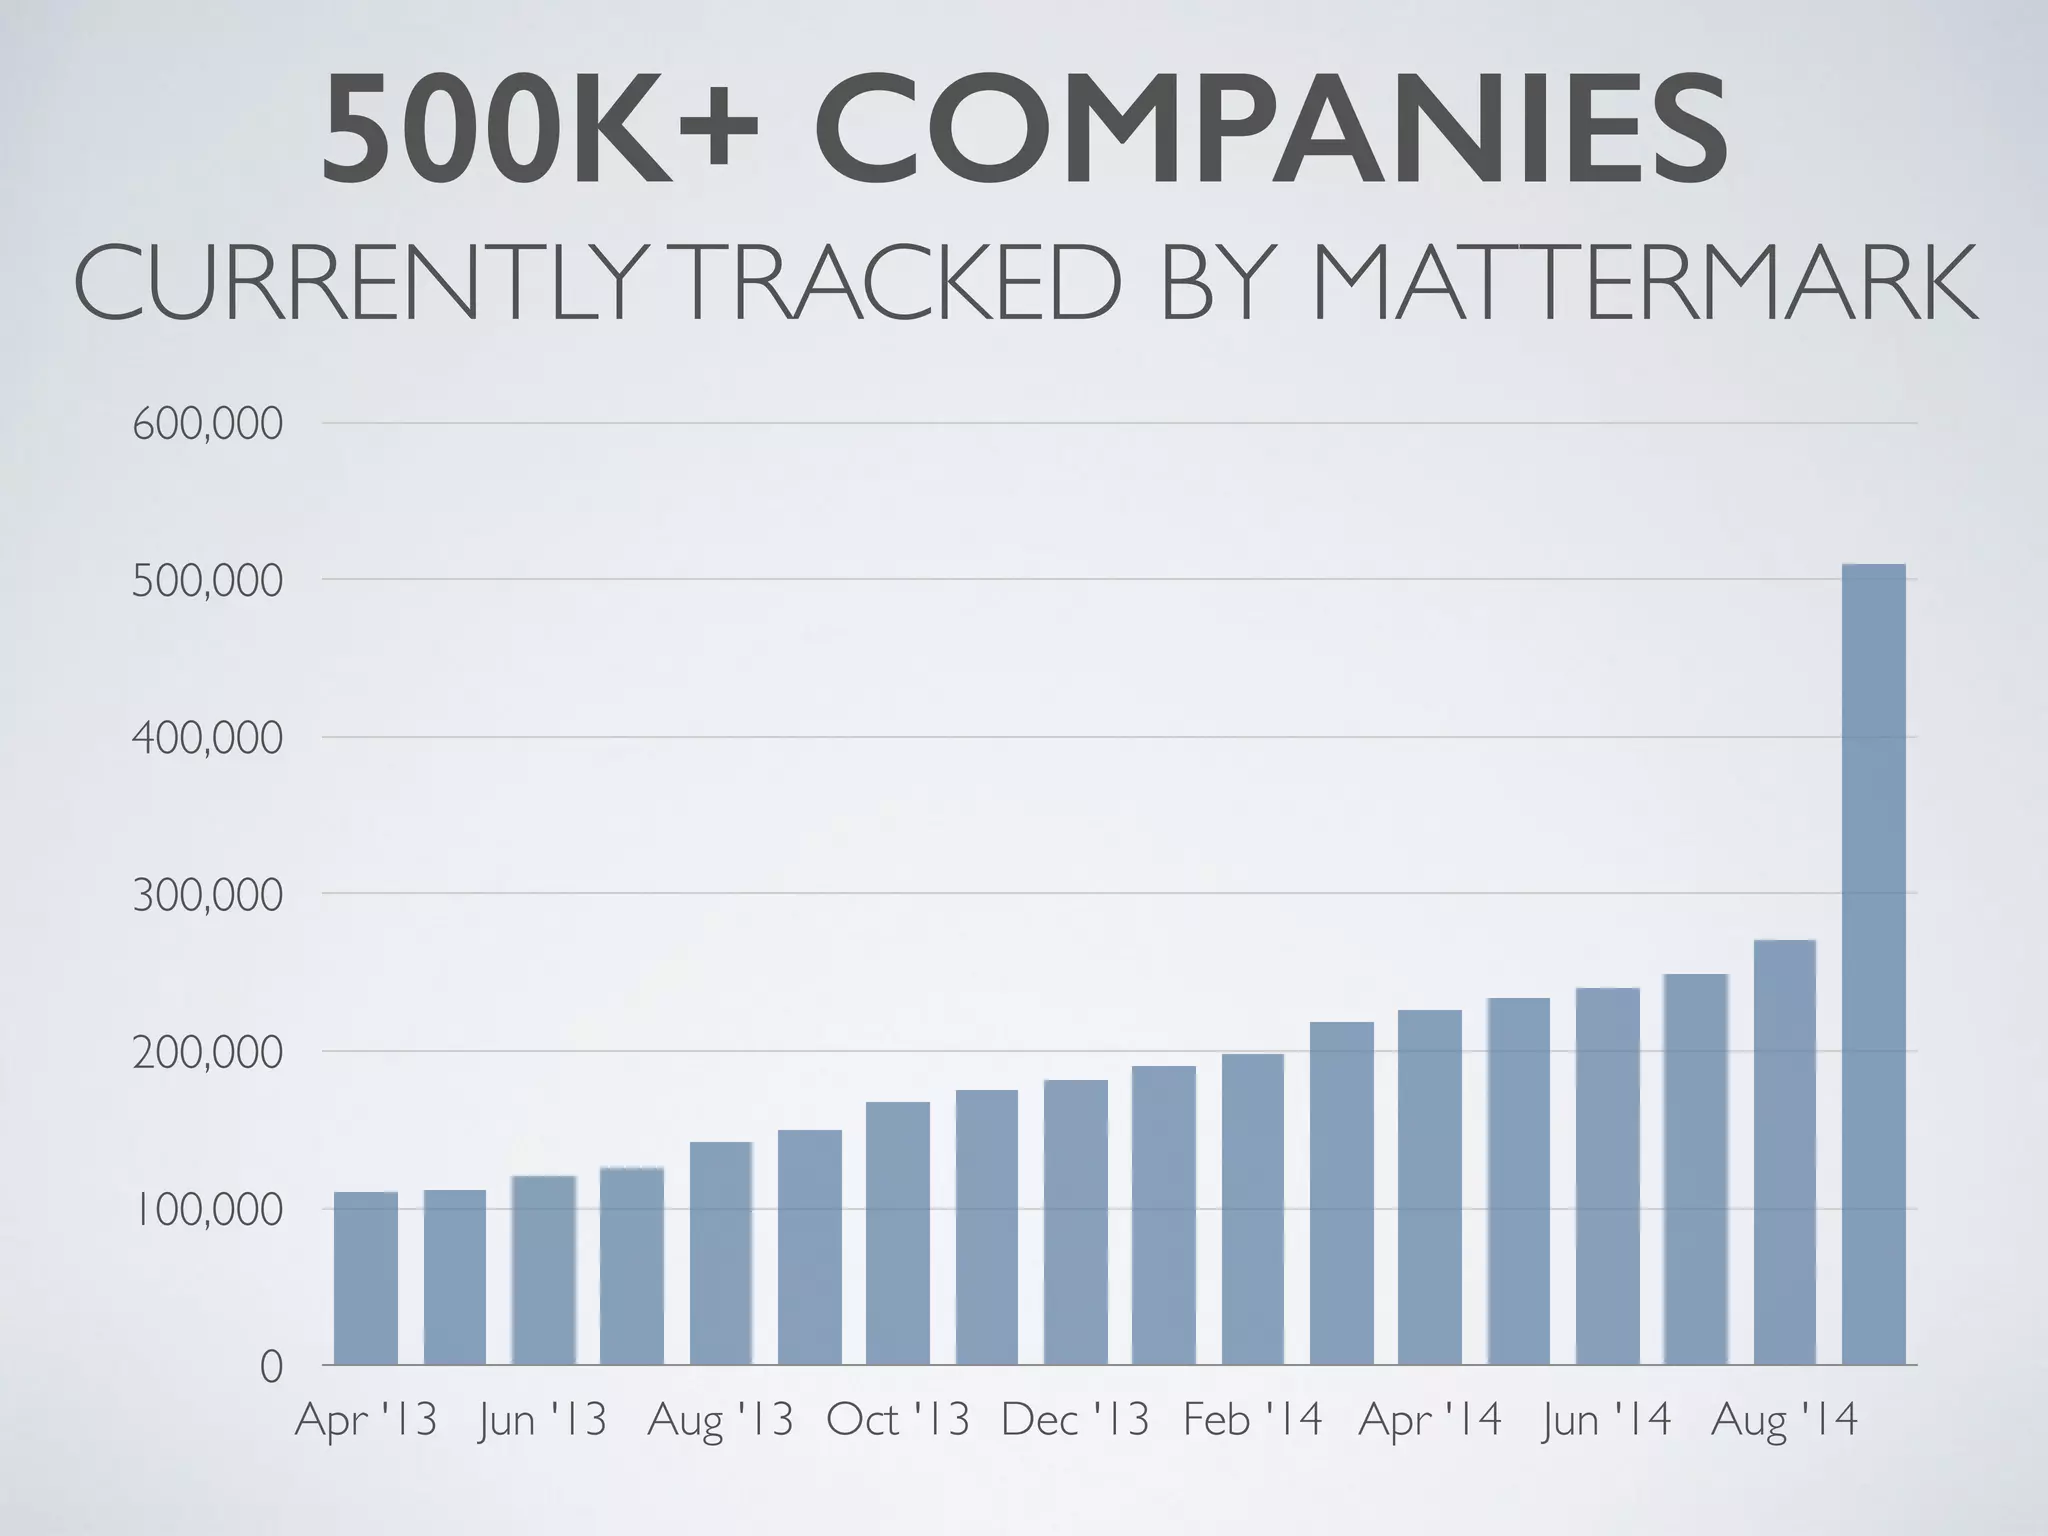
  • Companies Tracked: 500K+ (September 2014)
  • Growth Trajectory: ~110K (April 2013) → 500K+ (September 2014)
  • Implied Monthly Growth: ~22K companies/month average
  • Growth Acceleration: Visible in recent months

Customer Metrics

  • Revenue Diversification: 9 distinct customer segments (Slide 13)
  • VC Concentration: 54% of revenue from VCs (concentration risk)
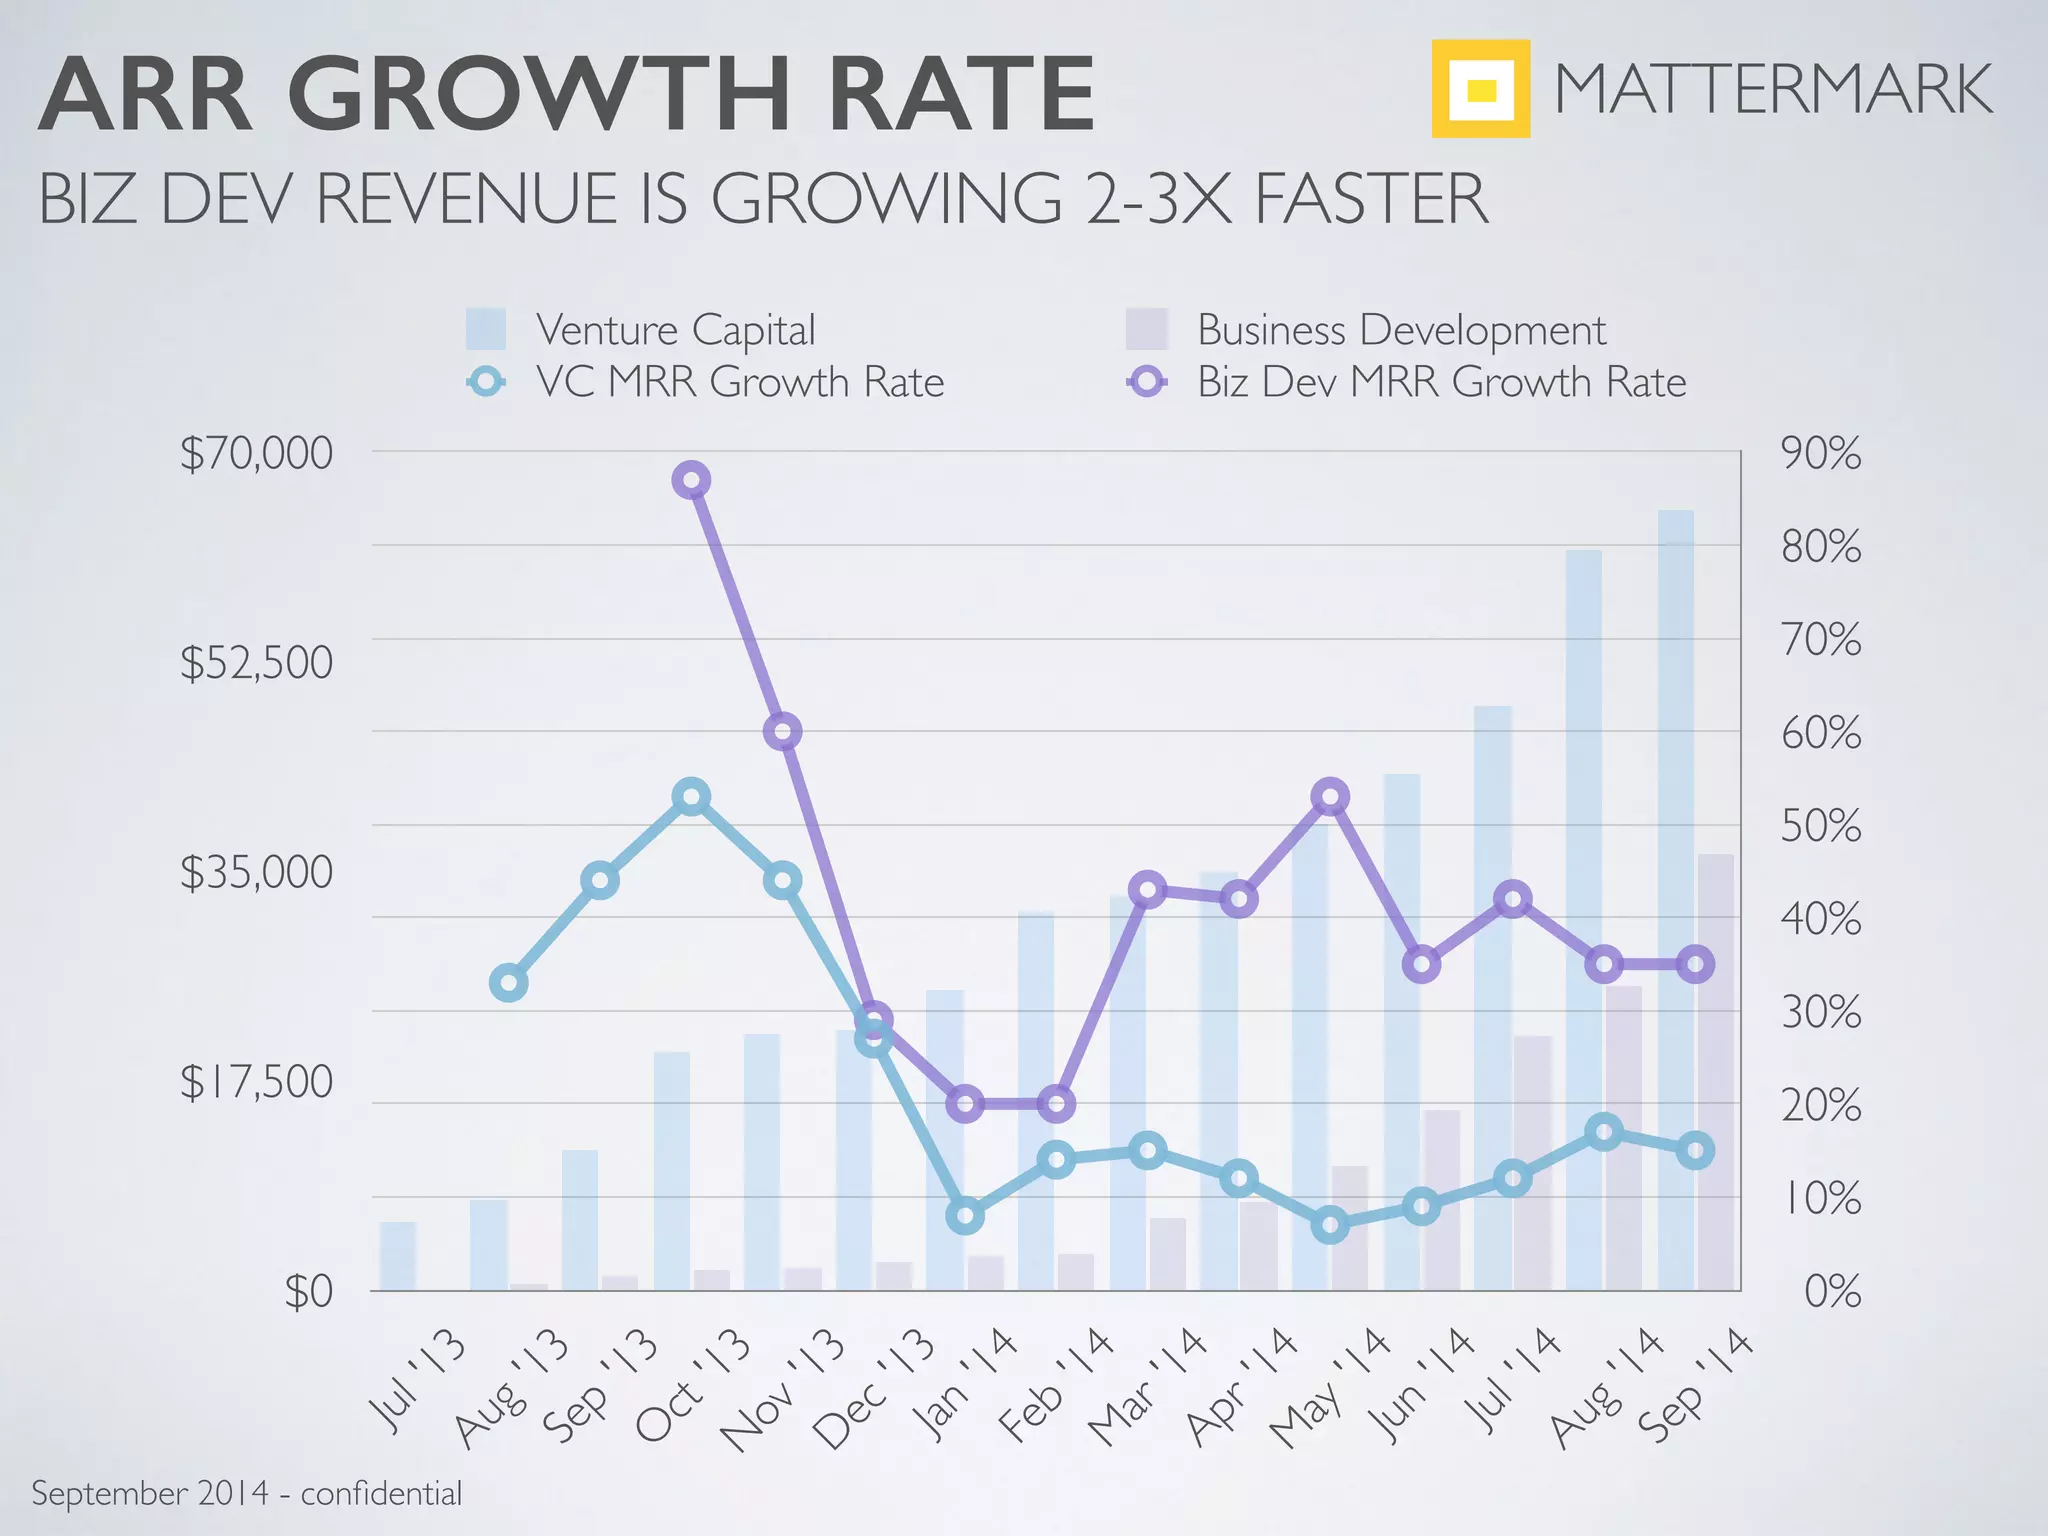
  • Segment Growth: Business Development growing 2-3x faster than VC (Slide 14)

Growth Projections (Slide 12)

  • 2015 Goal: $10M ARR
  • Target MRR by Dec 2015: ~$900K
  • Implied Growth Rate: 13.5% monthly MRR growth
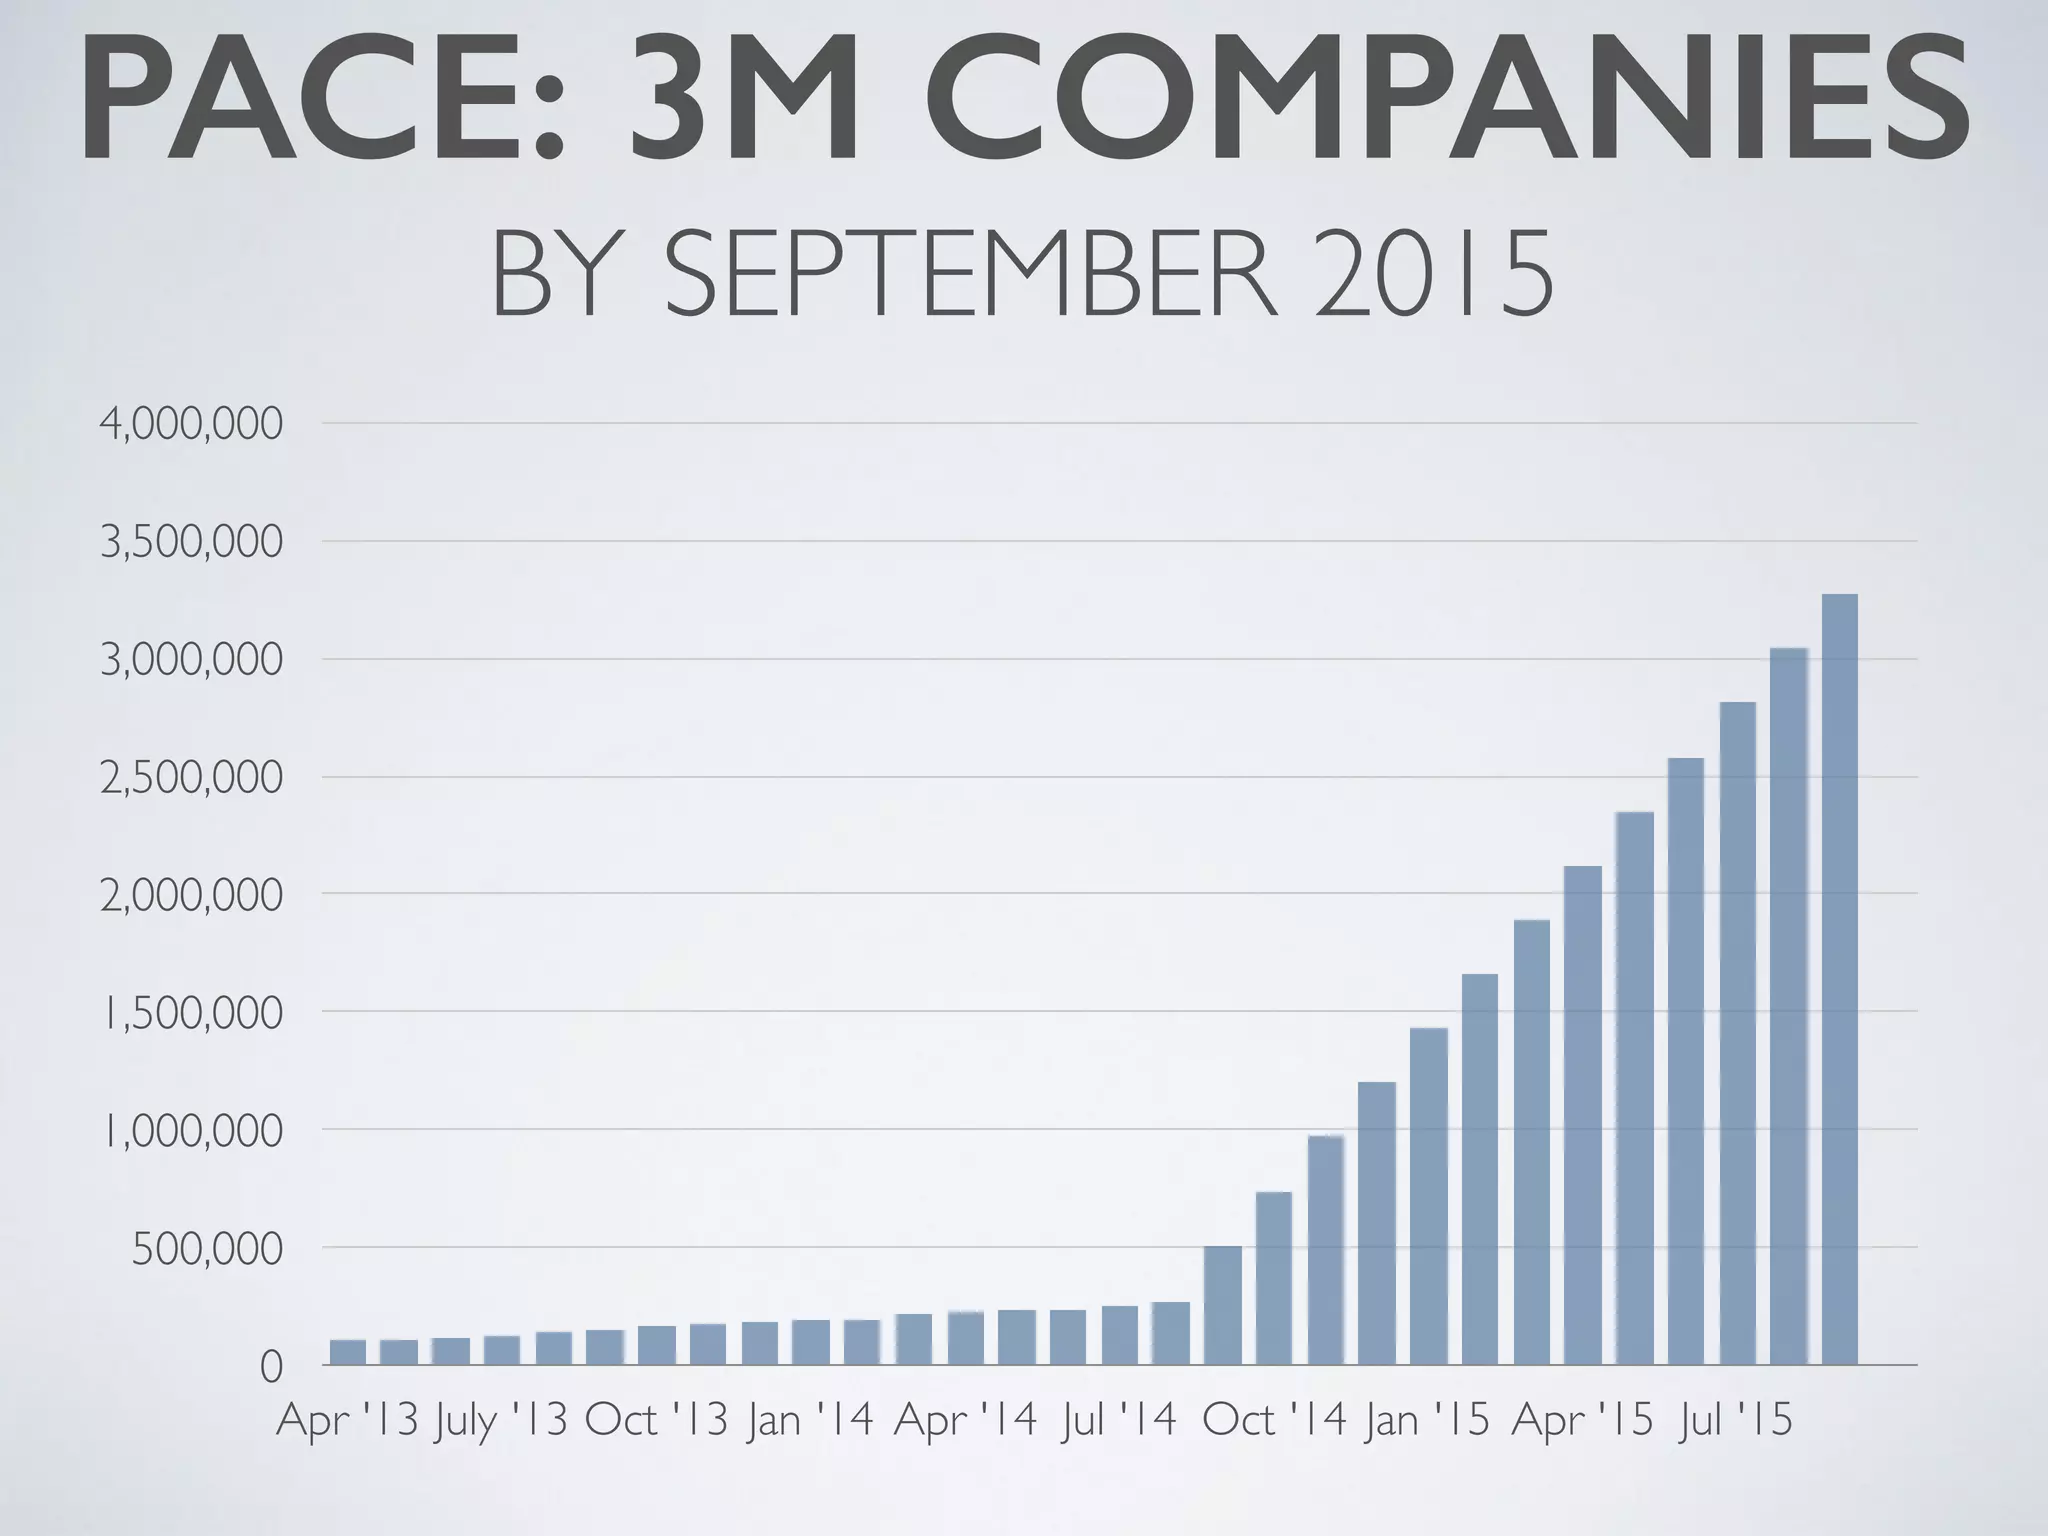
  • Implied Acceleration: From 500K to 3M companies by Sept 2015 (6x growth)

Key Observations

  • Strong historical growth: 377% CAGR demonstrates product-market fit
  • Growth deceleration: Recent growth rate (20%) is lower than historical peak (60%+), suggesting natural scaling dynamics
  • Ambitious projections: 80x revenue growth and 6x company growth in 12 months is extremely aggressive
  • No customer count: Deck doesn’t disclose number of customers, making it impossible to calculate CAC or LTV

Competitive Positioning

Explicit Competitive Positioning: Minimal to none in the deck

Implied Competitors (not mentioned):

  • Bloomberg (financial data platform)
  • Crunchbase (startup/company database)
  • ZoomInfo (B2B contact database)
  • Palantir (data integration platform)
  • Traditional consulting firms

Competitive Advantages (Implied):

  1. Data Scale: 500K+ companies tracked (vs. competitors’ coverage)
  2. Founder Pedigree: Team from Twilio, Palantir, Bloomberg, Kabam suggests execution capability
  3. Real Traction: $125K MRR and 377% CAGR demonstrate market validation
  4. Diversified Use Cases: Nine customer segments vs. competitors’ narrower focus

Critical Gap: The deck never explicitly addresses:

  • How Mattermark’s data differs from Bloomberg, Crunchbase, or ZoomInfo
  • Why customers would switch from incumbents
  • What proprietary data or technology Mattermark has
  • How Mattermark will compete against well-funded incumbents with existing customer bases

This is a significant weakness for a Series A pitch, as investors need to understand the competitive moat and defensibility.

Team

Leadership Team

Danielle Morrill, CEO & Cofounder

  • Twilio: Director of Marketing (first employee, acquired 100K customers)
  • Whirrl v2.0: Community Manager (early iPhone app)
  • Expeditors: Business Process Analyst
  • Reliant Consulting & Research: Financial Analyst
  • Strengths: Proven ability to scale (100K customers at Twilio), marketing/growth expertise
  • Gaps: No mention of Mattermark-specific accomplishments or tenure

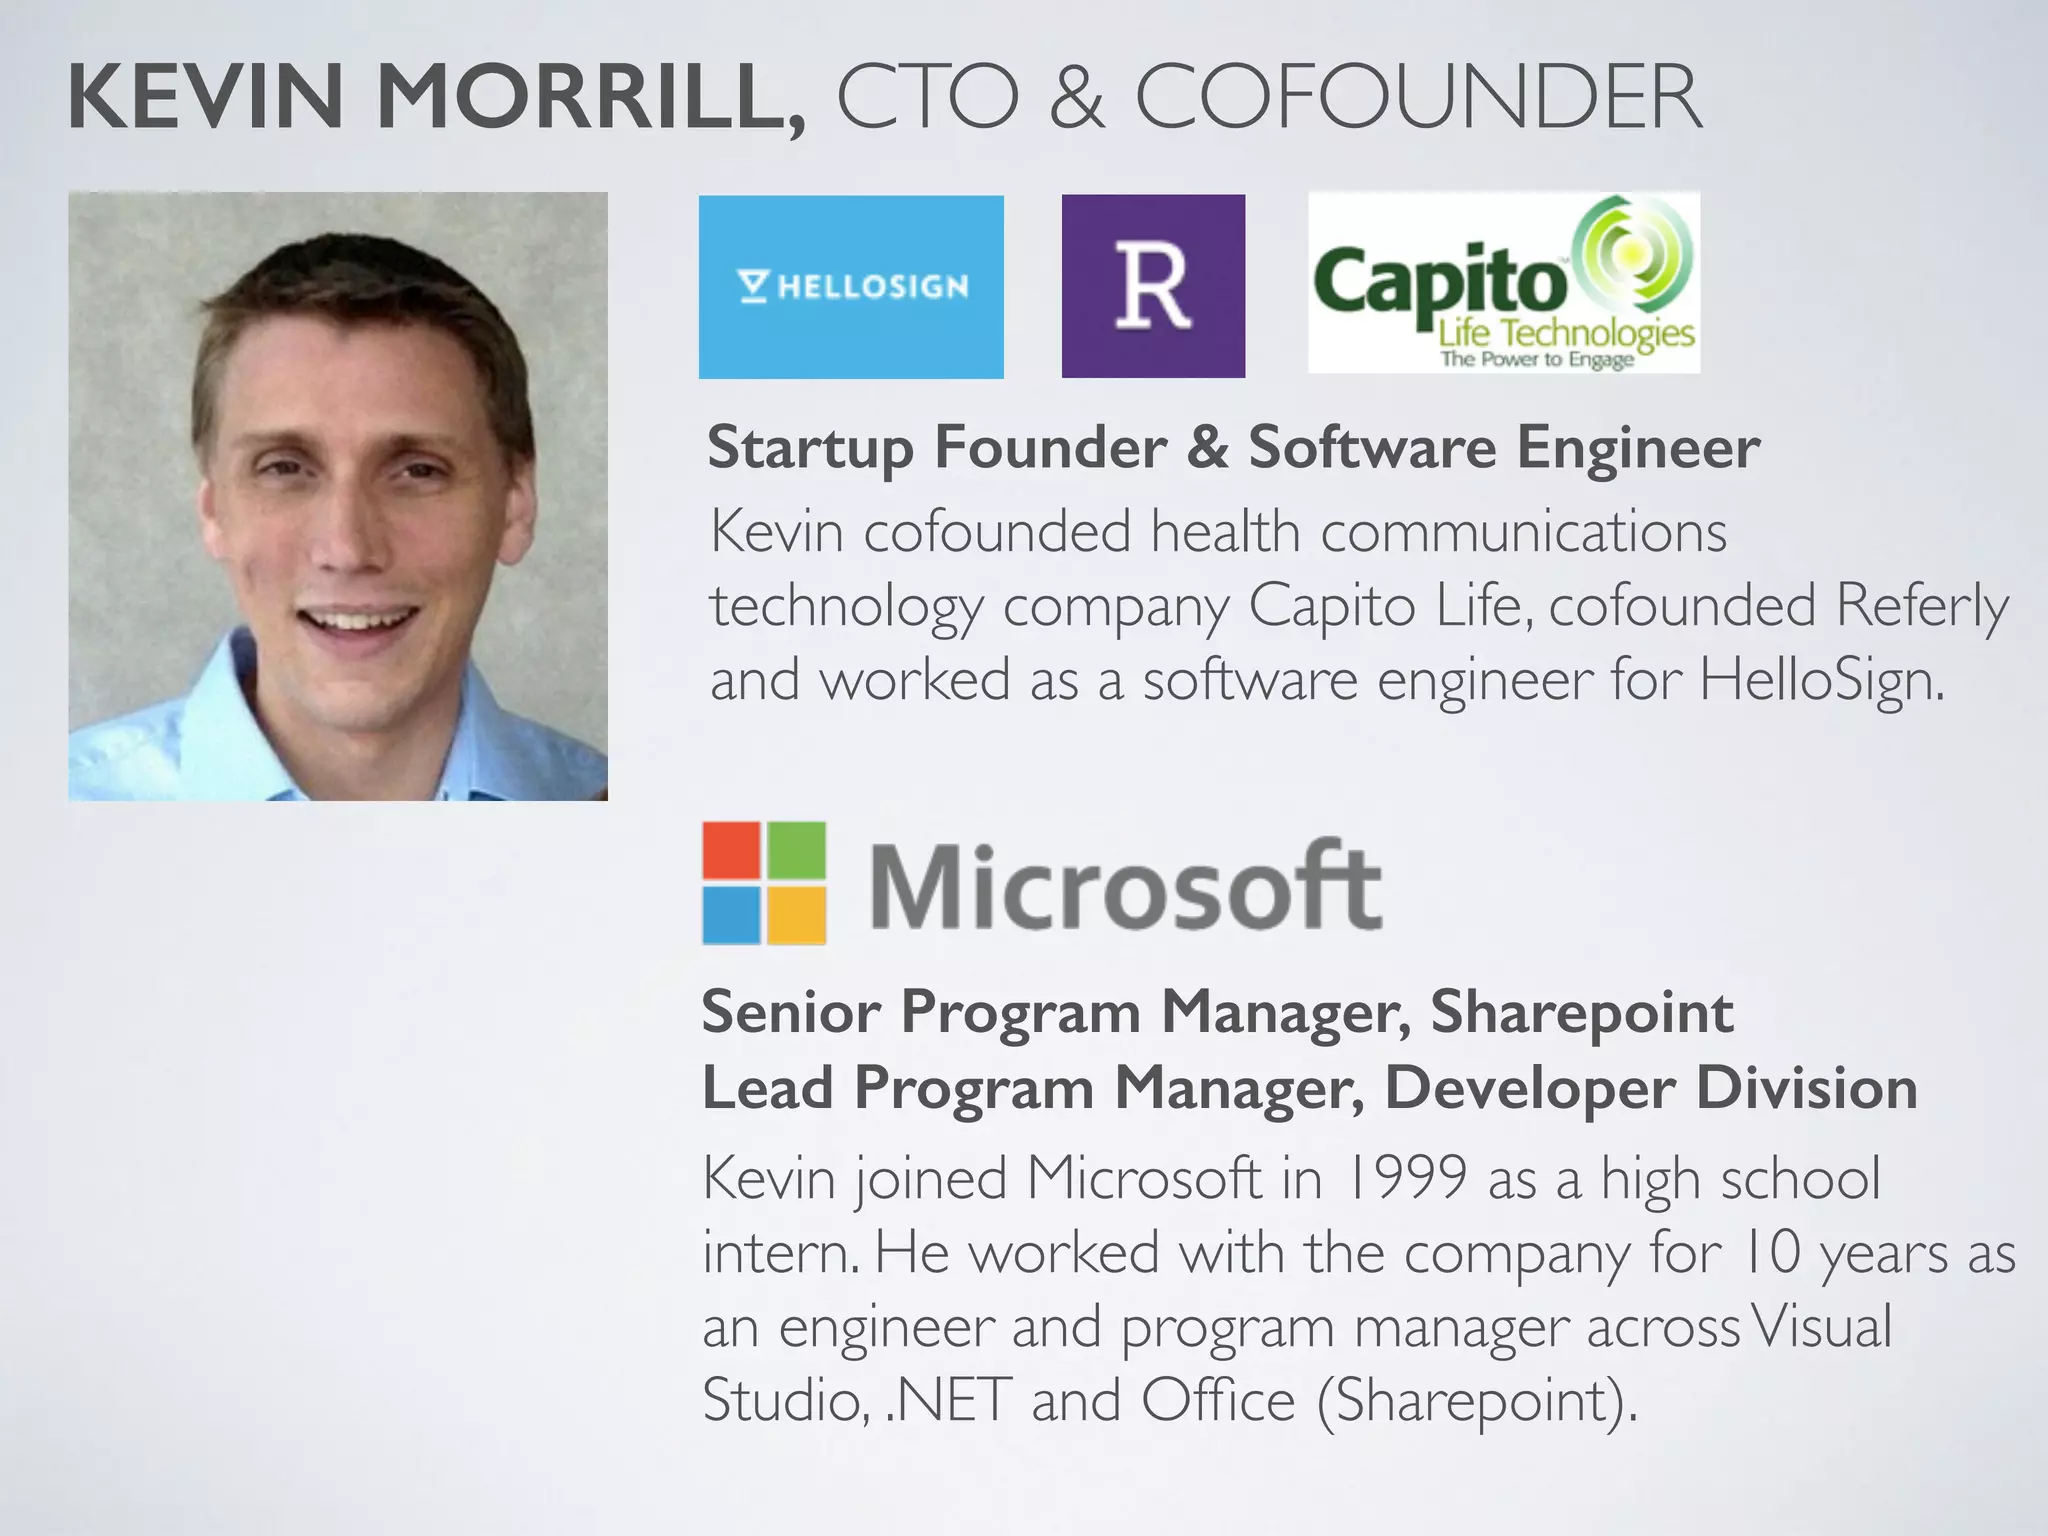
Kevin Morrill, CTO & Cofounder

  • Microsoft: 10 years (1999-2009) as engineer and program manager
    • Senior Program Manager, Sharepoint
    • Lead Program Manager, Developer Division
    • Visual Studio, .NET, Office experience
  • Capito Life Technologies: Cofounder (health communications technology)
  • Referly: Cofounder
  • HelloSign: Software Engineer
  • Strengths: Deep technical expertise, startup founding experience, large-scale system design
  • Gaps: No mention of Mattermark-specific technical accomplishments or data architecture

Andy Sparks, COO & Cofounder

  • LaunchGram: CEO & Cofounder (acquired by Referly/Mattermark in February 2012)
  • Strengths: Founder/operator experience, early Mattermark connection
  • Gaps: Minimal background information, unclear what he’s accomplished at Mattermark since acquisition

Key Executives

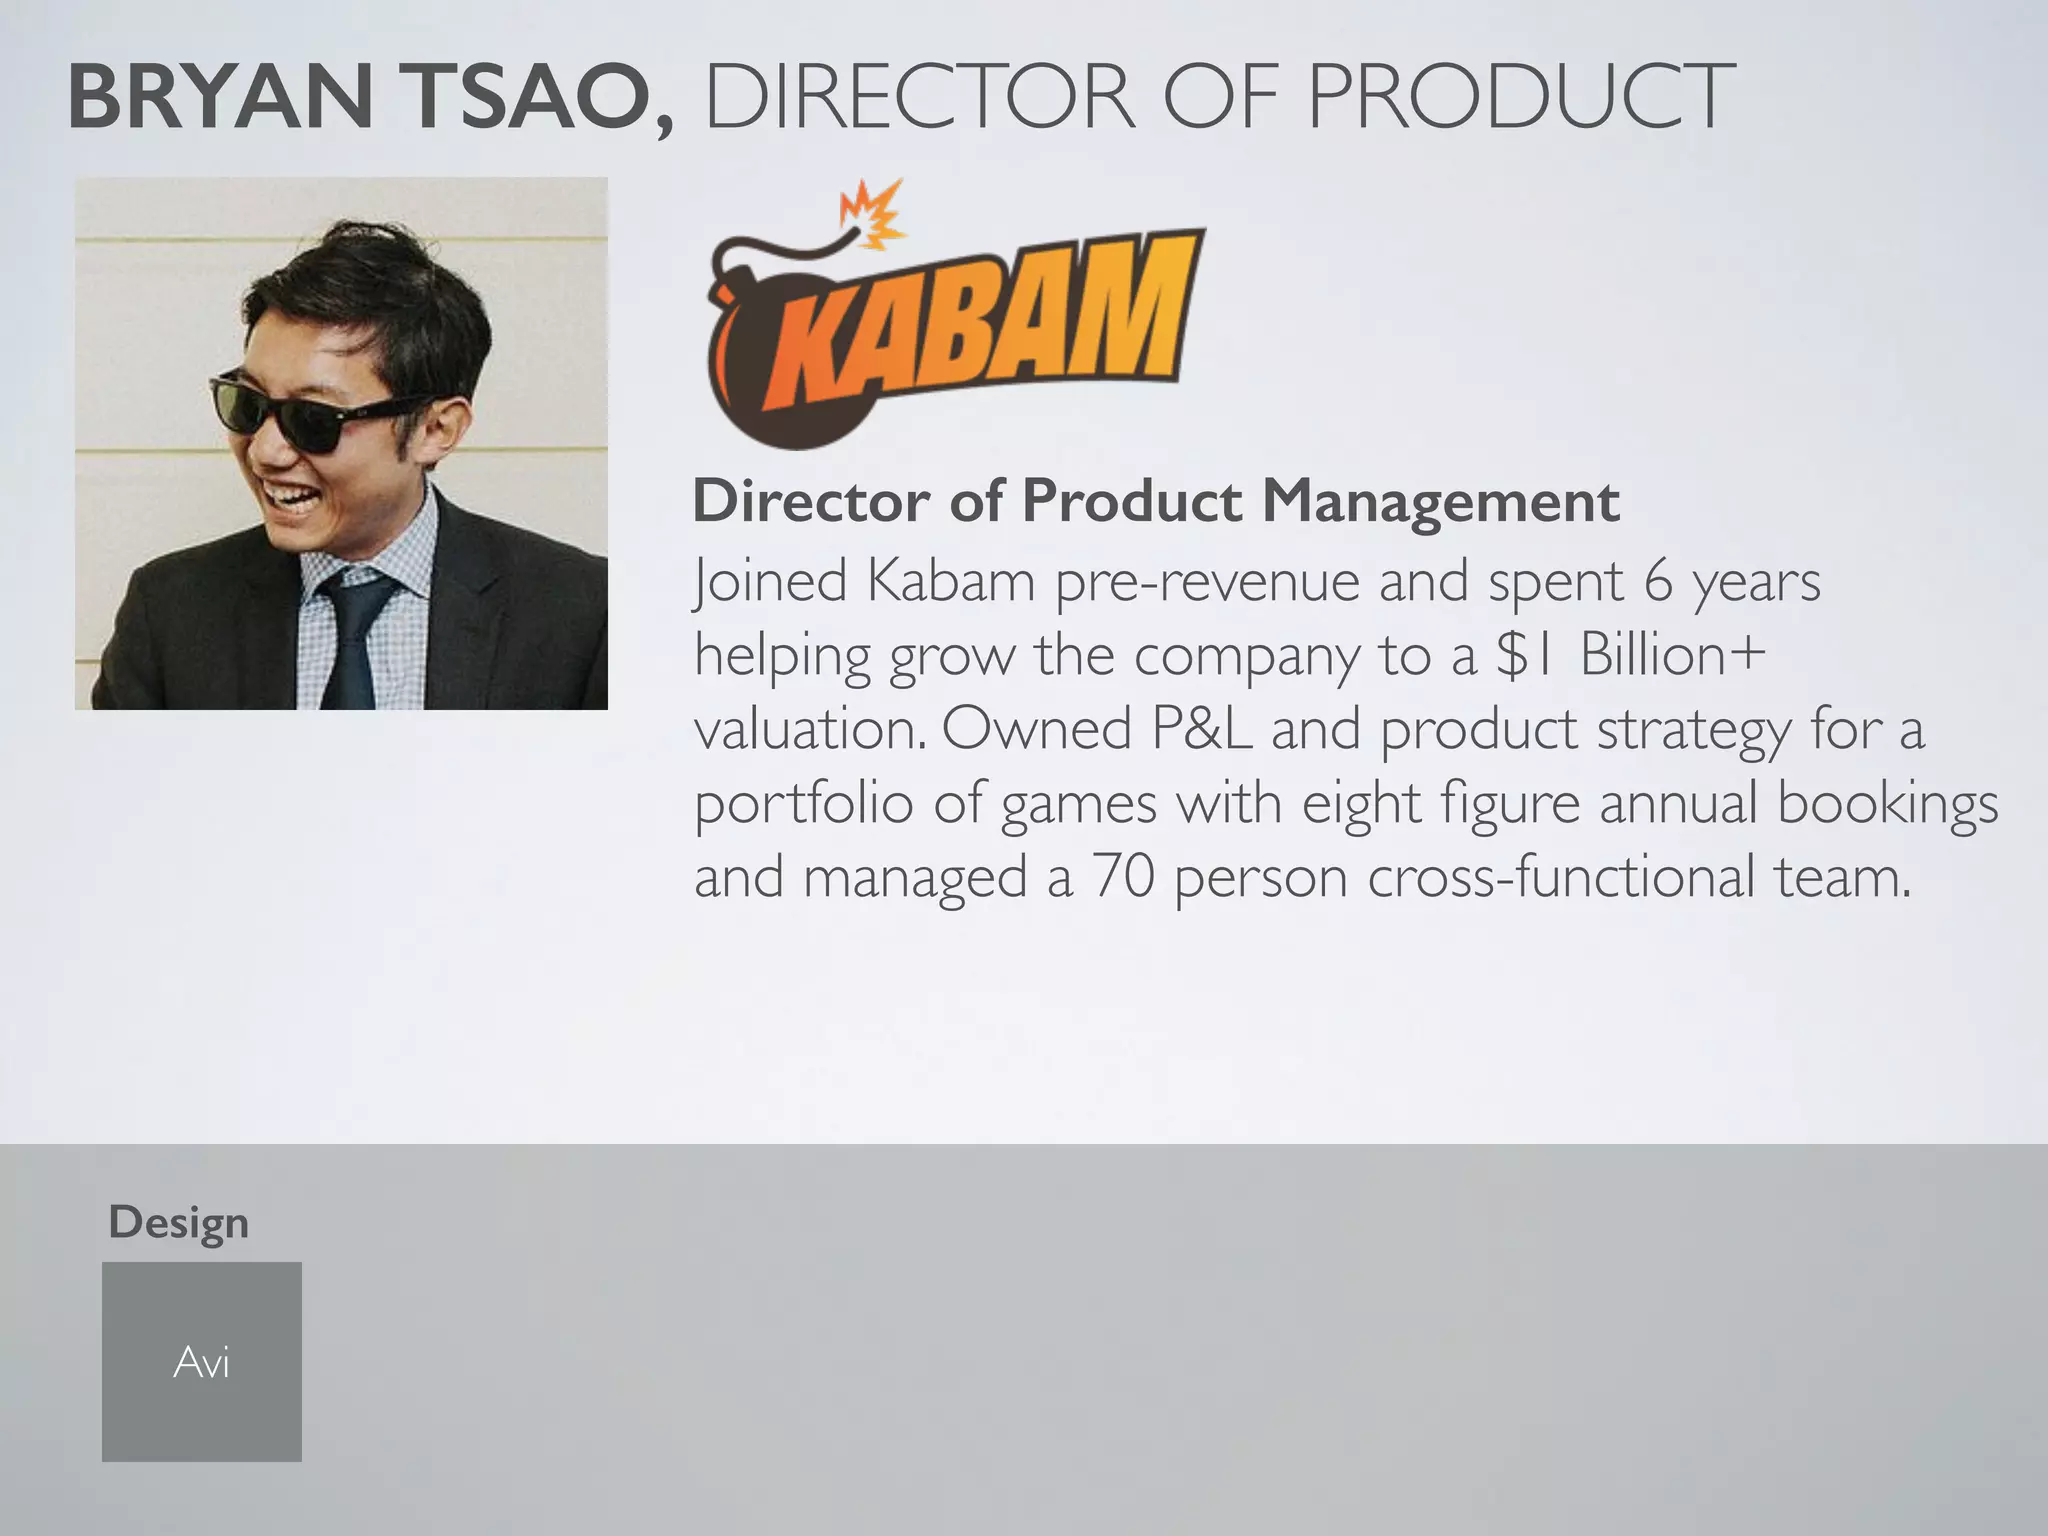
Bryan Tsao, Director of Product

  • Kabam: Director of Product Management
    • Grew company from pre-revenue to $1B+ valuation
    • Owned P&L for game portfolio with eight-figure annual bookings
    • Managed 70-person cross-functional team
  • Strengths: Exceptional scaling experience, P&L ownership, large team management
  • Gaps: Gaming background may not transfer to B2B; no Mattermark-specific accomplishments mentioned

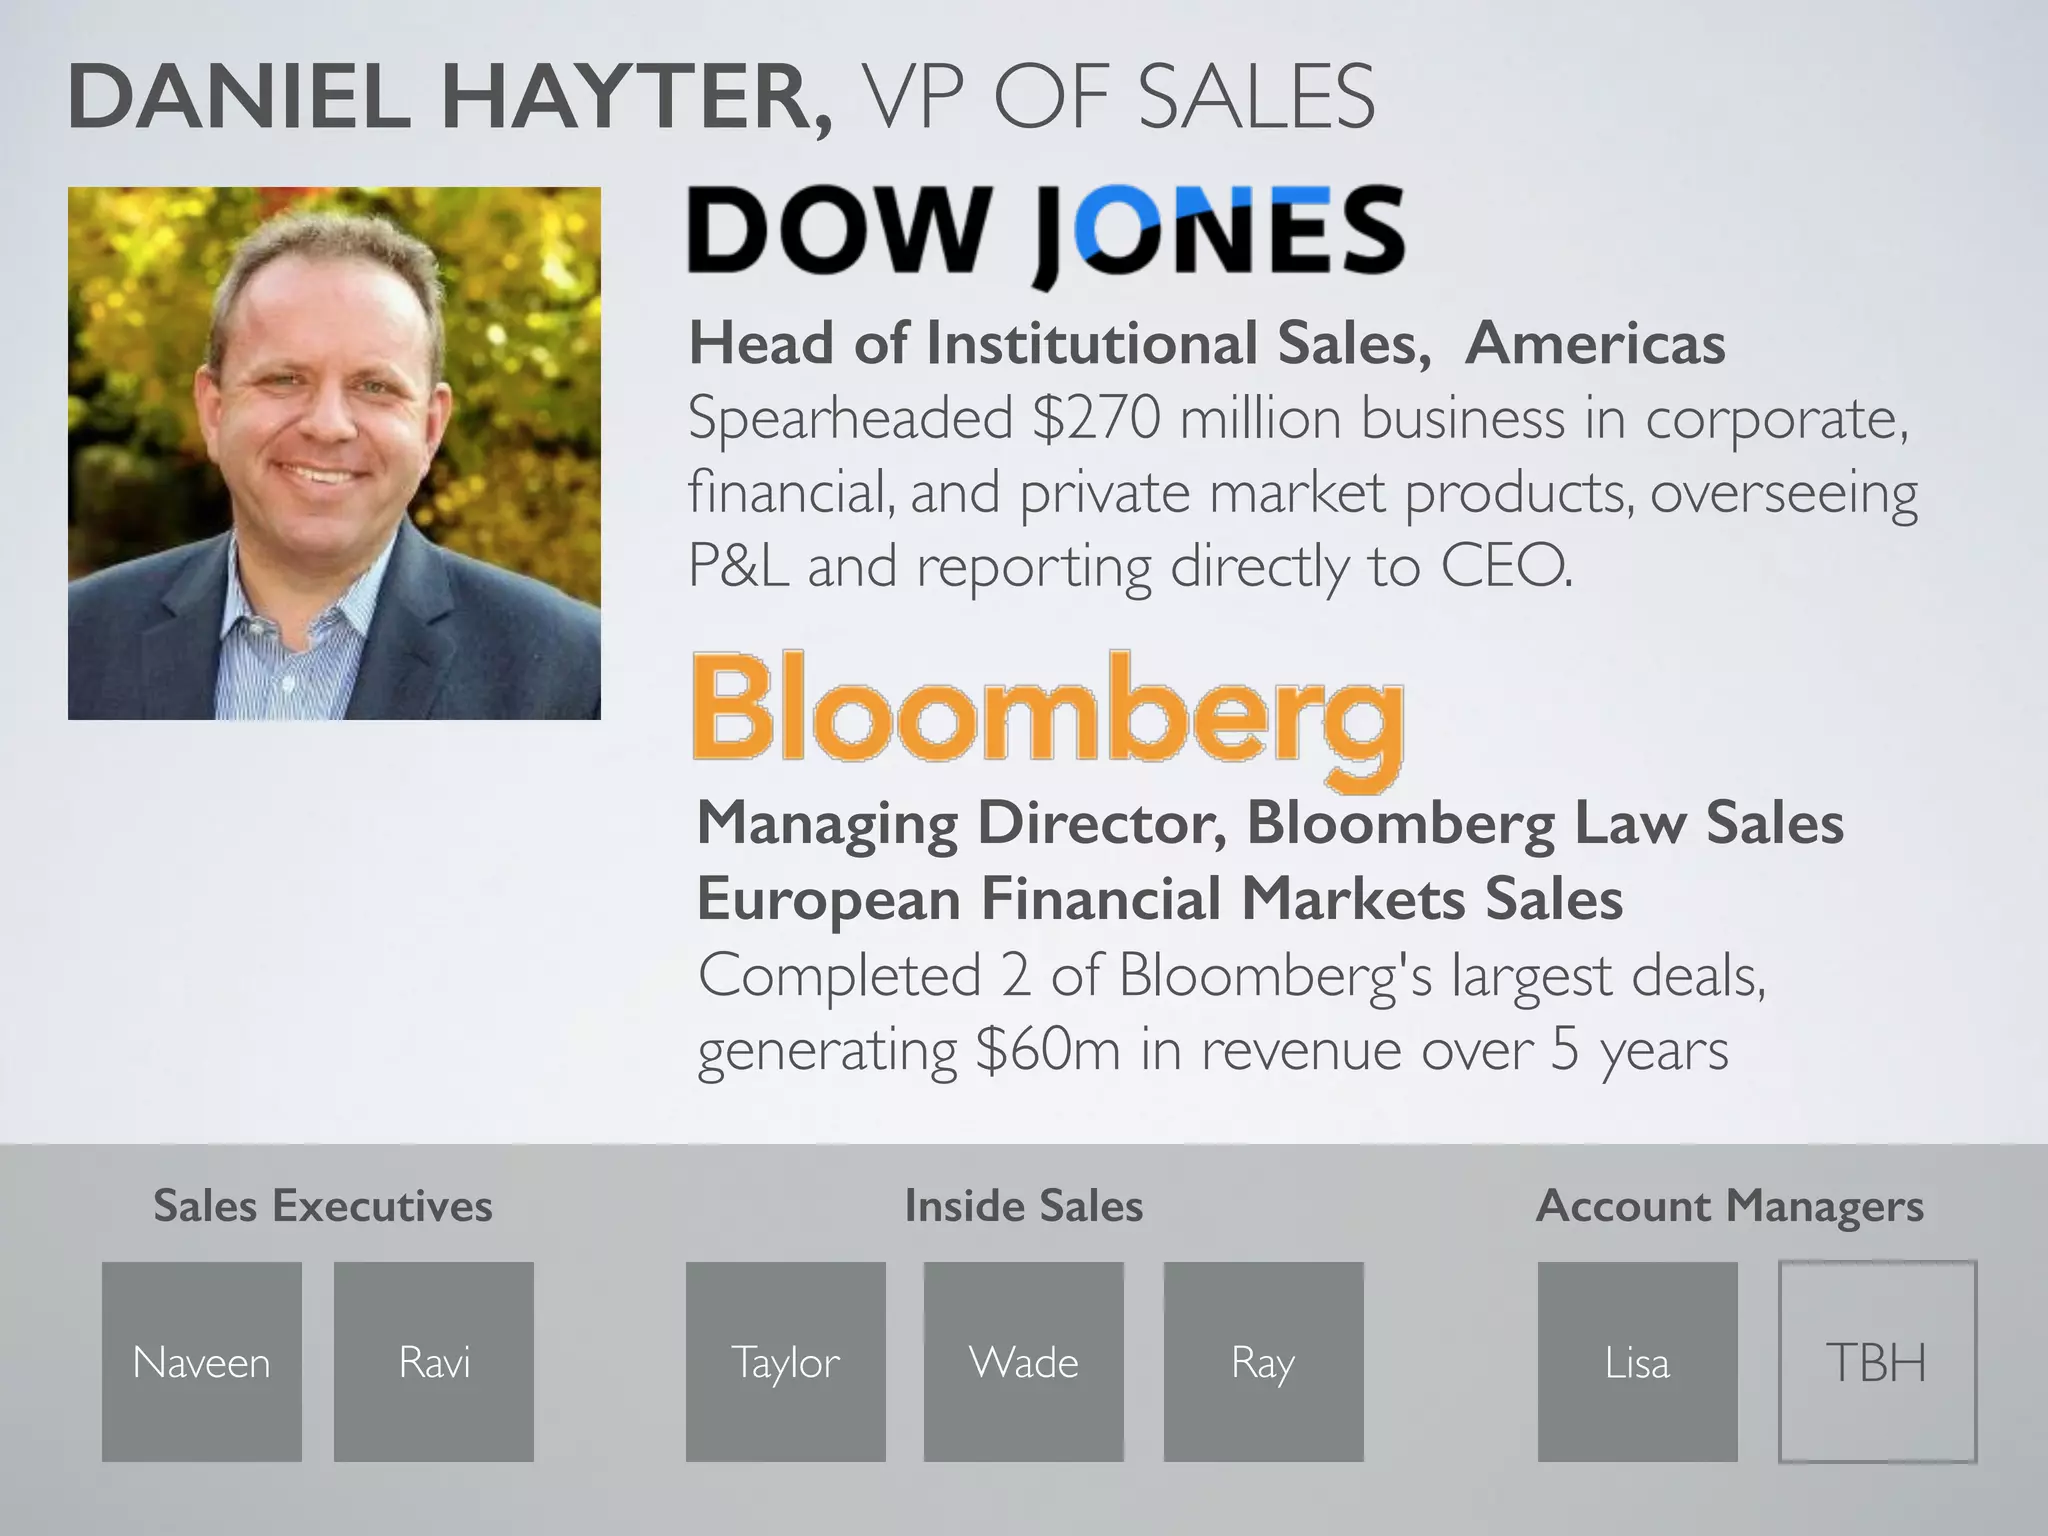
Daniel Hayter, VP of Sales

  • Dow Jones: Head of Institutional Sales, Americas
    • Spearheaded $270M business
    • Oversaw P&L, reported to CEO
  • Bloomberg: Managing Director, Bloomberg Law Sales & European Financial Markets Sales
    • Completed 2 of Bloomberg’s largest deals ($60M in revenue over 5 years)
  • Strengths: World-class enterprise sales experience, direct competitor knowledge, CEO-level credibility
  • Gaps: Sales team has 1 open position (“TBH”); team of 7 seems lean for $10M ARR goal

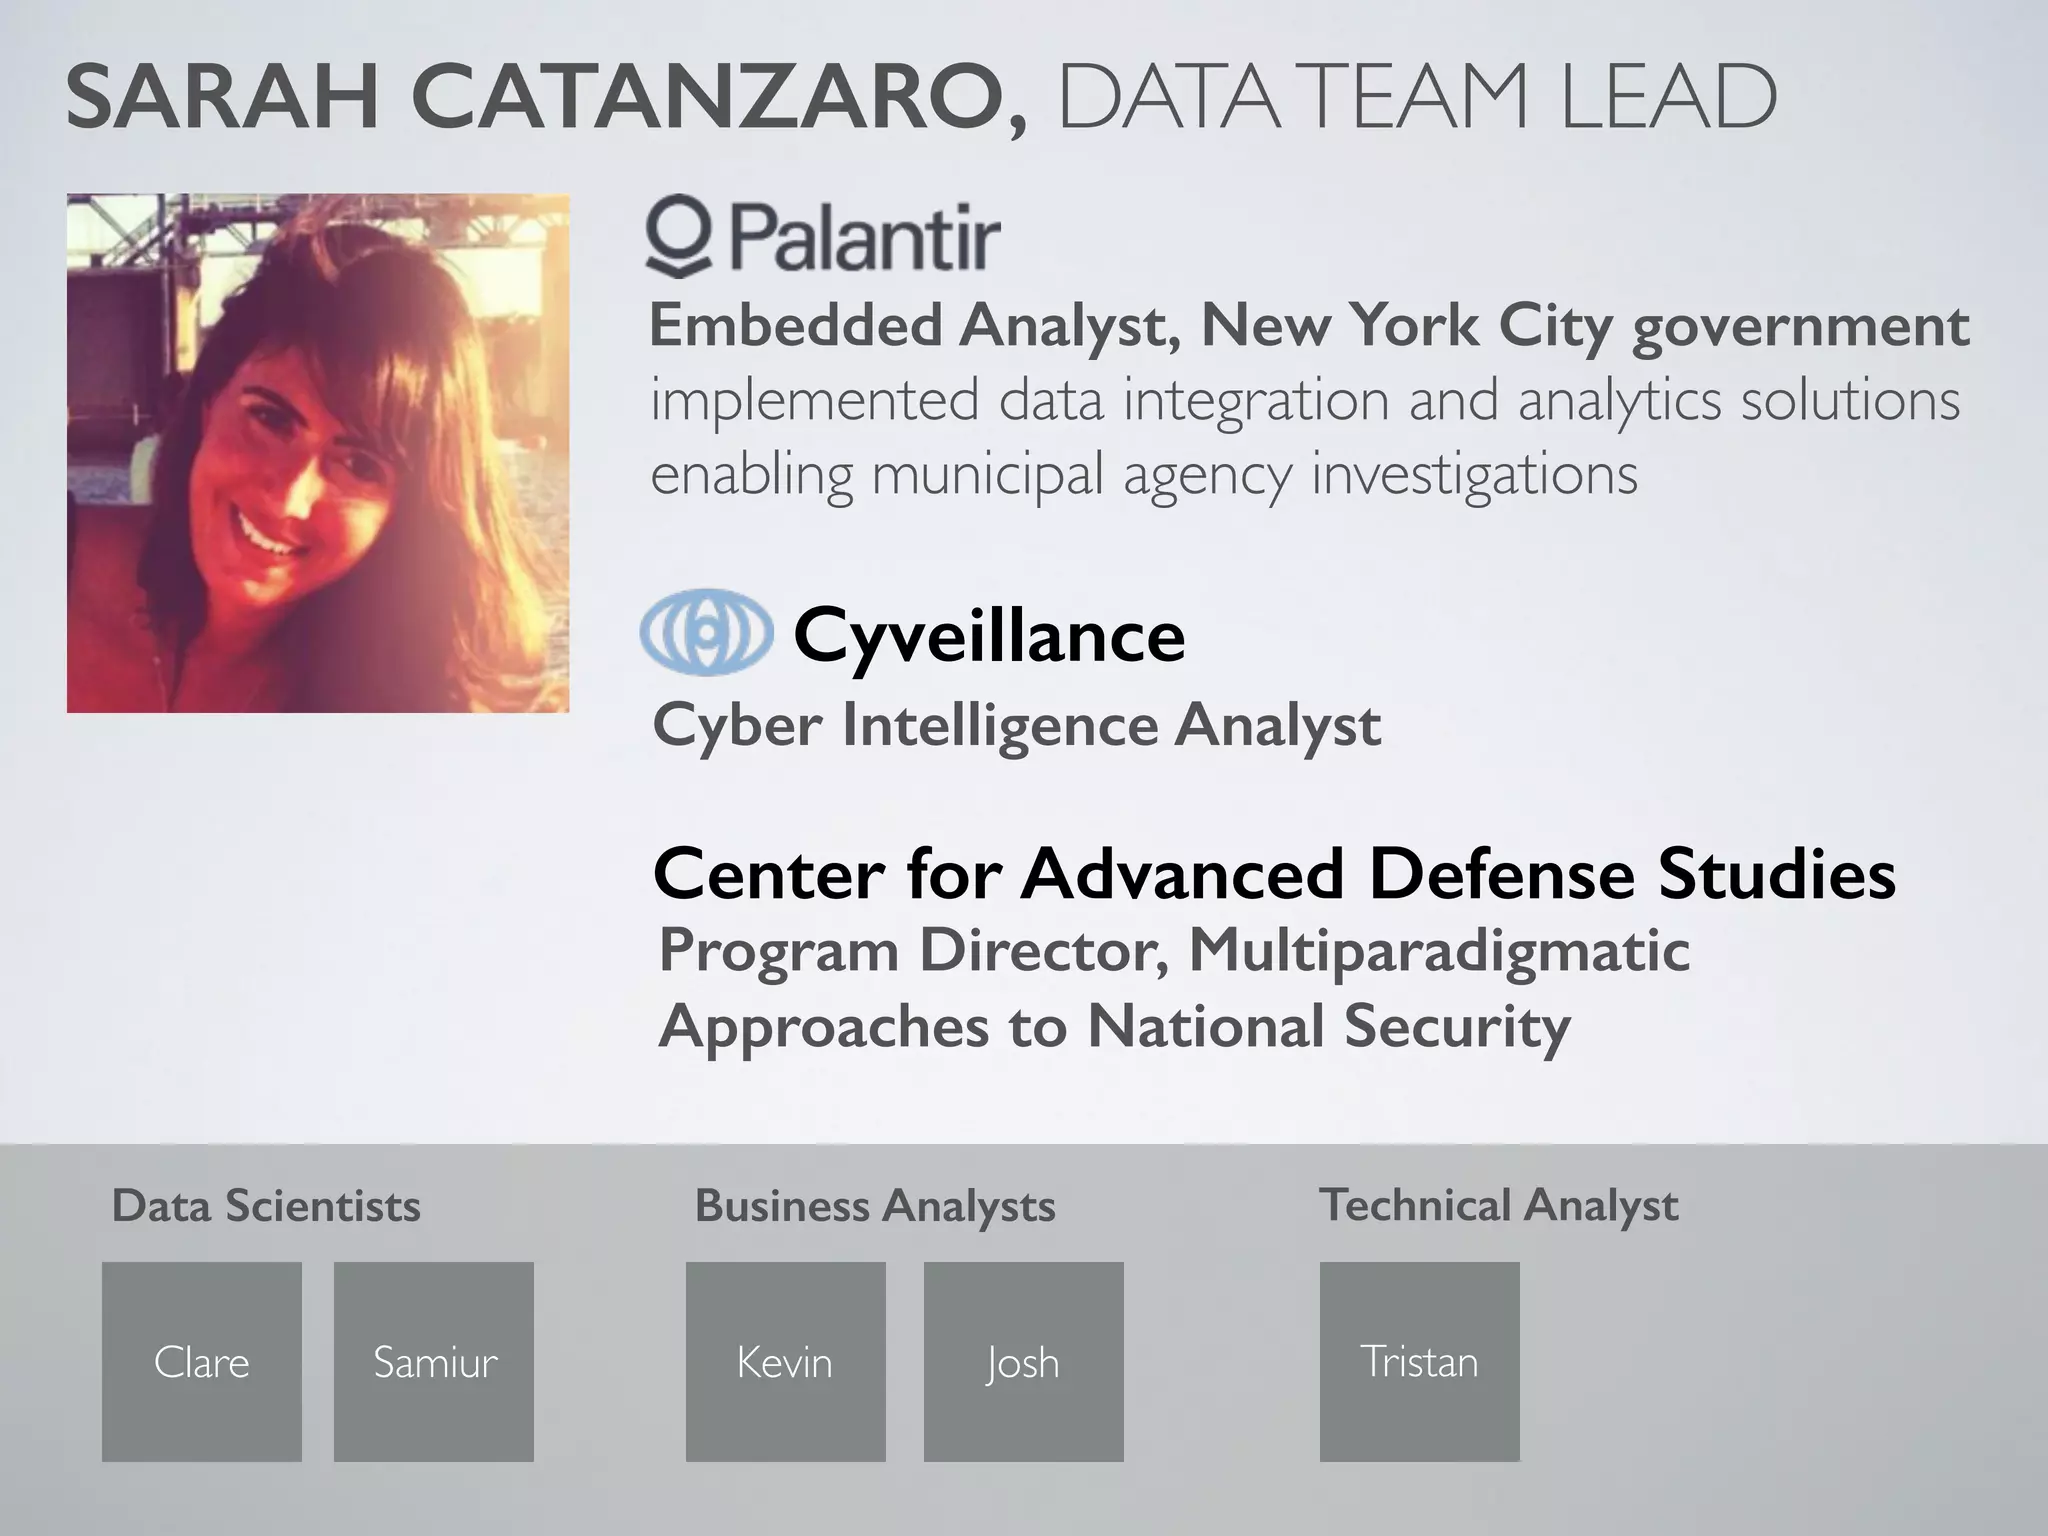
Sarah Catanzaro, Data Team Lead

  • Palantir: Embedded Analyst, NYC government (data integration and analytics)
  • Cyveillance: Cyber Intelligence Analyst
  • Center for Advanced Defense Studies: Program Director, Multiparadigmatic Approaches to National Security
  • Strengths: World-class data expertise, intelligence sector background, Palantir experience
  • Gaps: Data team of 5 seems lean for 3M company goal; no explanation of data collection methodology

Team Assessment

Strengths:

  • Exceptional founder credibility across multiple tier-1 companies
  • Complementary skill sets (CEO: growth/marketing, CTO: engineering, COO: operations, VP Sales: enterprise sales, Data Lead: intelligence)
  • Proven ability to scale (Twilio 100K customers, Kabam $1B+, Bloomberg $60M deals)
  • Diverse startup experience (multiple founders, multiple exits)

Weaknesses:

  • Married cofounders (Danielle and Kevin) without addressing governance/decision-making dynamics
  • Sales team incomplete (1 open position)
  • Data team appears lean for ambitious 3M company goal
  • Limited mention of Mattermark-specific accomplishments or tenure
  • No mention of board members or advisors

Go-to-Market Strategy

Initial Target Market (Slide 9): VCs, angel investors, founders

Current Customer Base (Slide 13): Nine distinct segments:

  1. Venture Capital (54% of revenue)
  2. Business Development (16%)
  3. Private Equity (12%)
  4. Corporate Development (8%)
  5. Consulting & Research
  6. Angel Investing
  7. Academia
  8. Merchant Banking
  9. Investment Banking

Sales Organization (Slide 28):

  • VP Sales: Daniel Hayter (Bloomberg, Dow Jones experience)
  • Sales Executives: 2 (Naveen, Ravi)
  • Inside Sales: 3 (Taylor, Wade, Ray)
  • Account Managers: 2 (Lisa, 1 TBH)
  • Total Sales Team: 7 people (1 open position)

Go-to-Market Approach (Implied):

  • Enterprise Sales: Sales executives for large deals (VCs, investment banks)
  • Mid-Market Sales: Inside sales for mid-market segments (business development, consulting)
  • Account Management: Account managers for customer success and expansion

Critical Gaps:

  • No mention of marketing strategy or customer acquisition channels
  • No pricing strategy or sales process described
  • No explanation of how different segments are targeted differently
  • Sales team of 7 seems lean for ambitious $10M ARR goal and 3M company expansion

The Ask

Funding Amount: $6.5M Series A

Use of Proceeds: Not explicitly stated in deck

Implied Use of Proceeds (based on team hiring and growth targets):

  • Sales team expansion (currently 7 people)
  • Data collection and validation (currently 5 people)
  • Engineering/product development
  • General operations and overhead

Growth Targets Enabled by Funding:

  • $10M ARR by end of 2015 (from current $1.5M ARR)
  • 3M companies tracked by Sept 2015 (from current 500K)
  • Expansion into new customer segments (consultants, analysts, researchers)

Missing Information:

  • No explicit breakdown of how $6.5M will be deployed
  • No hiring plan or team expansion roadmap
  • No product development roadmap
  • No data collection strategy or partnerships planned
  • No timeline for achieving 3M company goal

Investor Deep Dive

Executive summary, strengths & red flags

Executive Summary

Mattermark's Series A pitch deck presents a B2B intelligence platform positioned as "Google for Business People," enabling professionals to search and analyze data on 500K+ companies. The deck is notable for combining exceptional founder credibility (Twilio, Palantir, Bloomberg, Kabam) with real traction ($125K MRR, 377% CAGR) to justify an ambitious growth vision (3M companies, $10M ARR by Sept 2015). However, the deck notably lacks clarity on the actual product, data sources, and competitive differentiation—suggesting that investor confidence was driven primarily by team pedigree and revenue metrics rather than product-market fit clarity.

Key Strengths

5 identified

1

Exceptional Founder Credibility

The team's track record is world-class: Danielle scaled Twilio to 100K customers, Kevin spent 10 years at Microsoft, Bryan grew Kabam to $1B+ valuation, Daniel managed $270M at Dow Jones and $60M a...

2

Real Traction with Strong Growth Metrics

$125K MRR and 377% CAGR (July 2013 - Sept 2014) demonstrate genuine product-market fit and customer demand. This is not a pre-revenue company; it's a growing SaaS business with real customers payin...

3

Large and Diversified Market Opportunity

The $3B revenue opportunity in existing verticals, combined with 250M+ companies globally and nine distinct customer segments, establishes a compelling TAM. The diversification across VCs, sales/bu...

4

Data Scale as Competitive Moat

500K+ companies tracked represents significant data collection capability and suggests a potential network effect. The ambitious 3M company goal (if achieved) would create a substantial competitive...

5

Professional Design and Clear Narrative Flow

The deck maintains consistent visual language, clean typography, and logical flow from problem → solution → market → traction → team. The design quality signals professionalism and attention to det...

Red Flags & Weaknesses

10 identified

1

Vague Product Definition

The deck never clearly explains what Mattermark's product actually is. Is it a search platform? An API? A database? A SaaS application? This is a critical gap for a Series A pitch. Investors should...

2

Aggressive Projections Without Detailed Roadmap

The 3M company goal (6x growth) and $10M ARR target (80x growth) are extremely ambitious for 12 months. The deck provides no explanation of how these targets will be achieved—no data collection str...

3

Data Quality and Validation Concerns

The rapid scaling from 500K to 3M companies raises questions about data accuracy and validation. How does Mattermark ensure data quality at scale? What's the validation process? The deck never addr...

4

Missing Competitive Positioning

The deck never explicitly addresses competitors (Bloomberg, Crunchbase, ZoomInfo) or explains how Mattermark differentiates. This is a significant gap. Investors need to understand why customers wo...

5

Incomplete Unit Economics

The deck provides no pricing model, CAC, LTV, churn rate, or gross margin. Without these metrics, it's impossible to assess the business model's sustainability or scalability. The $3B market opport...

6

VC Concentration Risk

54% of revenue from VCs (Slide 13) represents significant concentration risk. If the VC segment churns or becomes saturated, revenue growth could stall. While the deck shows Business Development gr...

7

Sales Team Appears Lean

With only 7 people on the sales team (including 1 open position), the organization seems understaffed for a $10M ARR goal. Typical SaaS companies require significant sales investment to scale. The ...

8

Data Team Appears Lean for Ambitious Goals

With only 5 people on the data team (2 data scientists, 2 business analysts, 1 technical analyst), the organization seems understaffed for collecting, validating, and maintaining 3M companies. The ...

9

Three Repetitive Problem Slides (Slides 5-7)

The deck uses three Google search screenshots to illustrate the problem, which is repetitive and inefficient. Each slide shows a different query (SaaS market size, Series A rounds, startup headcoun...

10

Missing Contact Information and Call to Action

The closing slide (Slide 30) provides no contact information, funding ask, or next steps. For a pitch deck, this is a missed opportunity. Investors should know how to follow up or request additiona...

More Pitch Decks To Study

Compare structure, fundraising context, and investor-facing story across similar startup decks.