Compare your deck to Fivetran

Compare Your Deck

Fivetran Pitch Deck (2013)

SaaS
Stage: Seed
Raised: $100K
Year: 2013
Slides: 13
Outcome: Valued at $5.6B (2021)

Pitch Deck

1 / 13
Fivetran pitch deck - Cover and positioning: Clear brand and promise
Click to expand

Deck Analysis

This seed-stage pitch deck from Fivetran lays out a focused, design-forward narrative for solving a specific pain in modern analytics: centralizing operational data into cloud data warehouses with minimal maintenance. The deck is notable for its clear problem-solution pairing, emphasis on automation and developer-friendly architecture, and early evidence of product-market fit through partner integrations and customers. It shows how a technically ambitious backend product can be communicated simply through visuals, workflow diagrams, and customer logos.

Cover and positioning: Clear brand and promise

Cover and positioning: Clear brand and promise

The opening slide is a minimal, brand-forward cover that states the company name and a single-line value proposition. It establishes immediate clarity about what the company does with no distracting details. This approach sets the tone for a deck that prioritizes clarity over complexity.

Founders can learn from the restraint here. A simple, confident cover primes investors to expect a tightly woven narrative and makes the presentation look professional and focused right from the first impression.

Key Takeaway: Start with a single clear promise on the cover to set expectations and communicate focus.
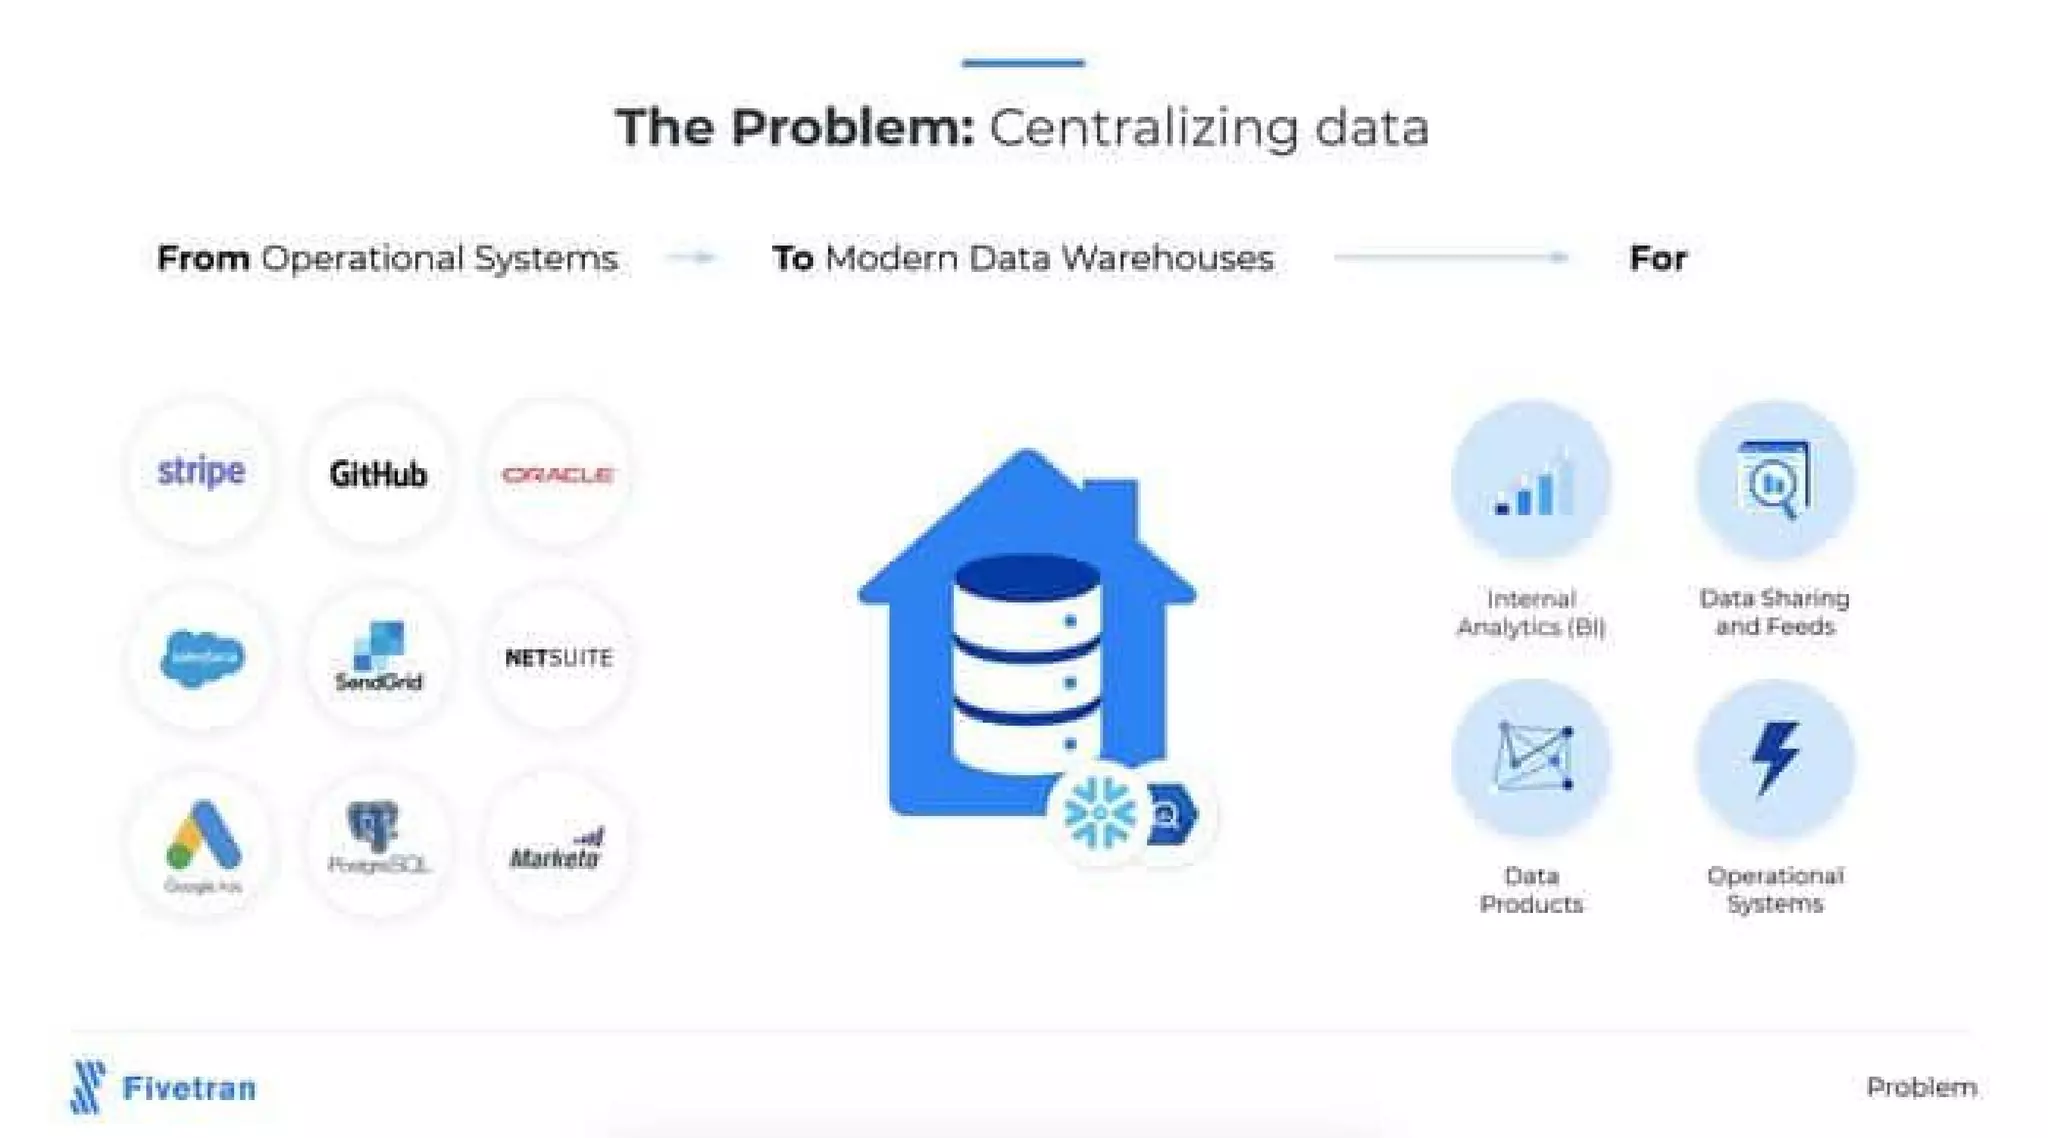
The Problem: Centralizing fragmented operational data

The Problem: Centralizing fragmented operational data

Slide 2 lays out the market context visually: many operational systems generate data but teams need one modern data warehouse. The three-column layout (sources, warehouse, consumers) makes the end-to-end need intuitive and shows the large surface area of integrations required. It communicates the business pain without heavy text.

This slide is effective because it frames the opportunity in terms of clear downstream use cases like analytics, data sharing, and operational systems. Founders should emulate this by showing both supply (data sources) and demand (analytics and products) to demonstrate a two-sided pull for their solution.

Key Takeaway: Frame the problem by showing the full flow from heterogeneous sources to diverse consumers to make the market need tangible.
The Pain of Traditional ETL: Step-by-step friction

The Pain of Traditional ETL: Step-by-step friction

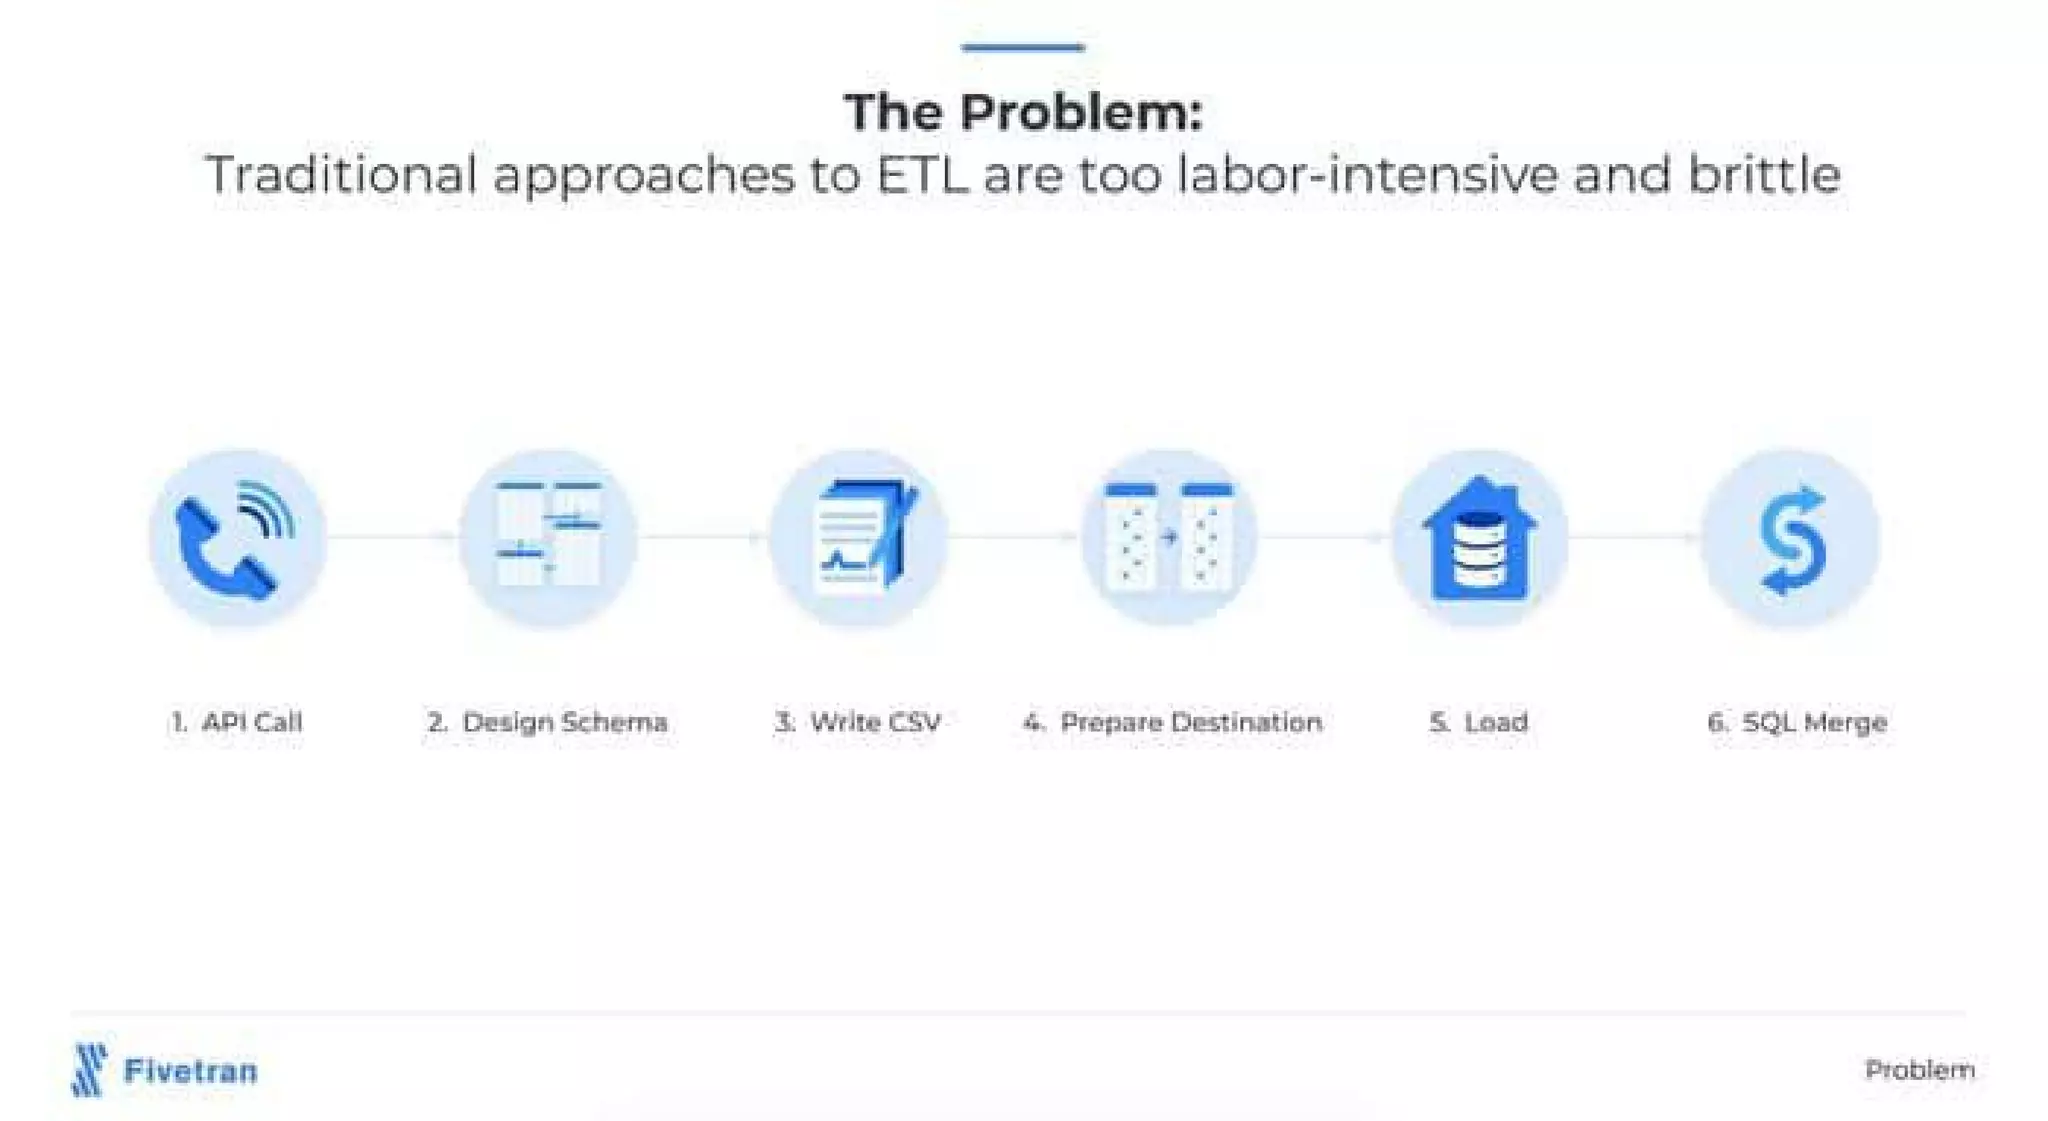
Slide 3 breaks down the traditional ETL process into a chain of manual steps, highlighting labor intensity and brittleness. The icon-driven linear flow is easy to scan and makes the operational burden concrete, converting an abstract complaint into visible, discrete tasks requiring engineering time.

This is an instructive technique: map the incumbent workflow and call out specific friction points. It helps investors see why an alternative can create outsized leverage. Founders should use similar deconstruction to make the inefficiencies of the status quo obvious and defensible.

Key Takeaway: Illustrate incumbent workflows with concrete steps to expose specific pain points your product eliminates.
The Solution: Prebuilt automated connectors

The Solution: Prebuilt automated connectors

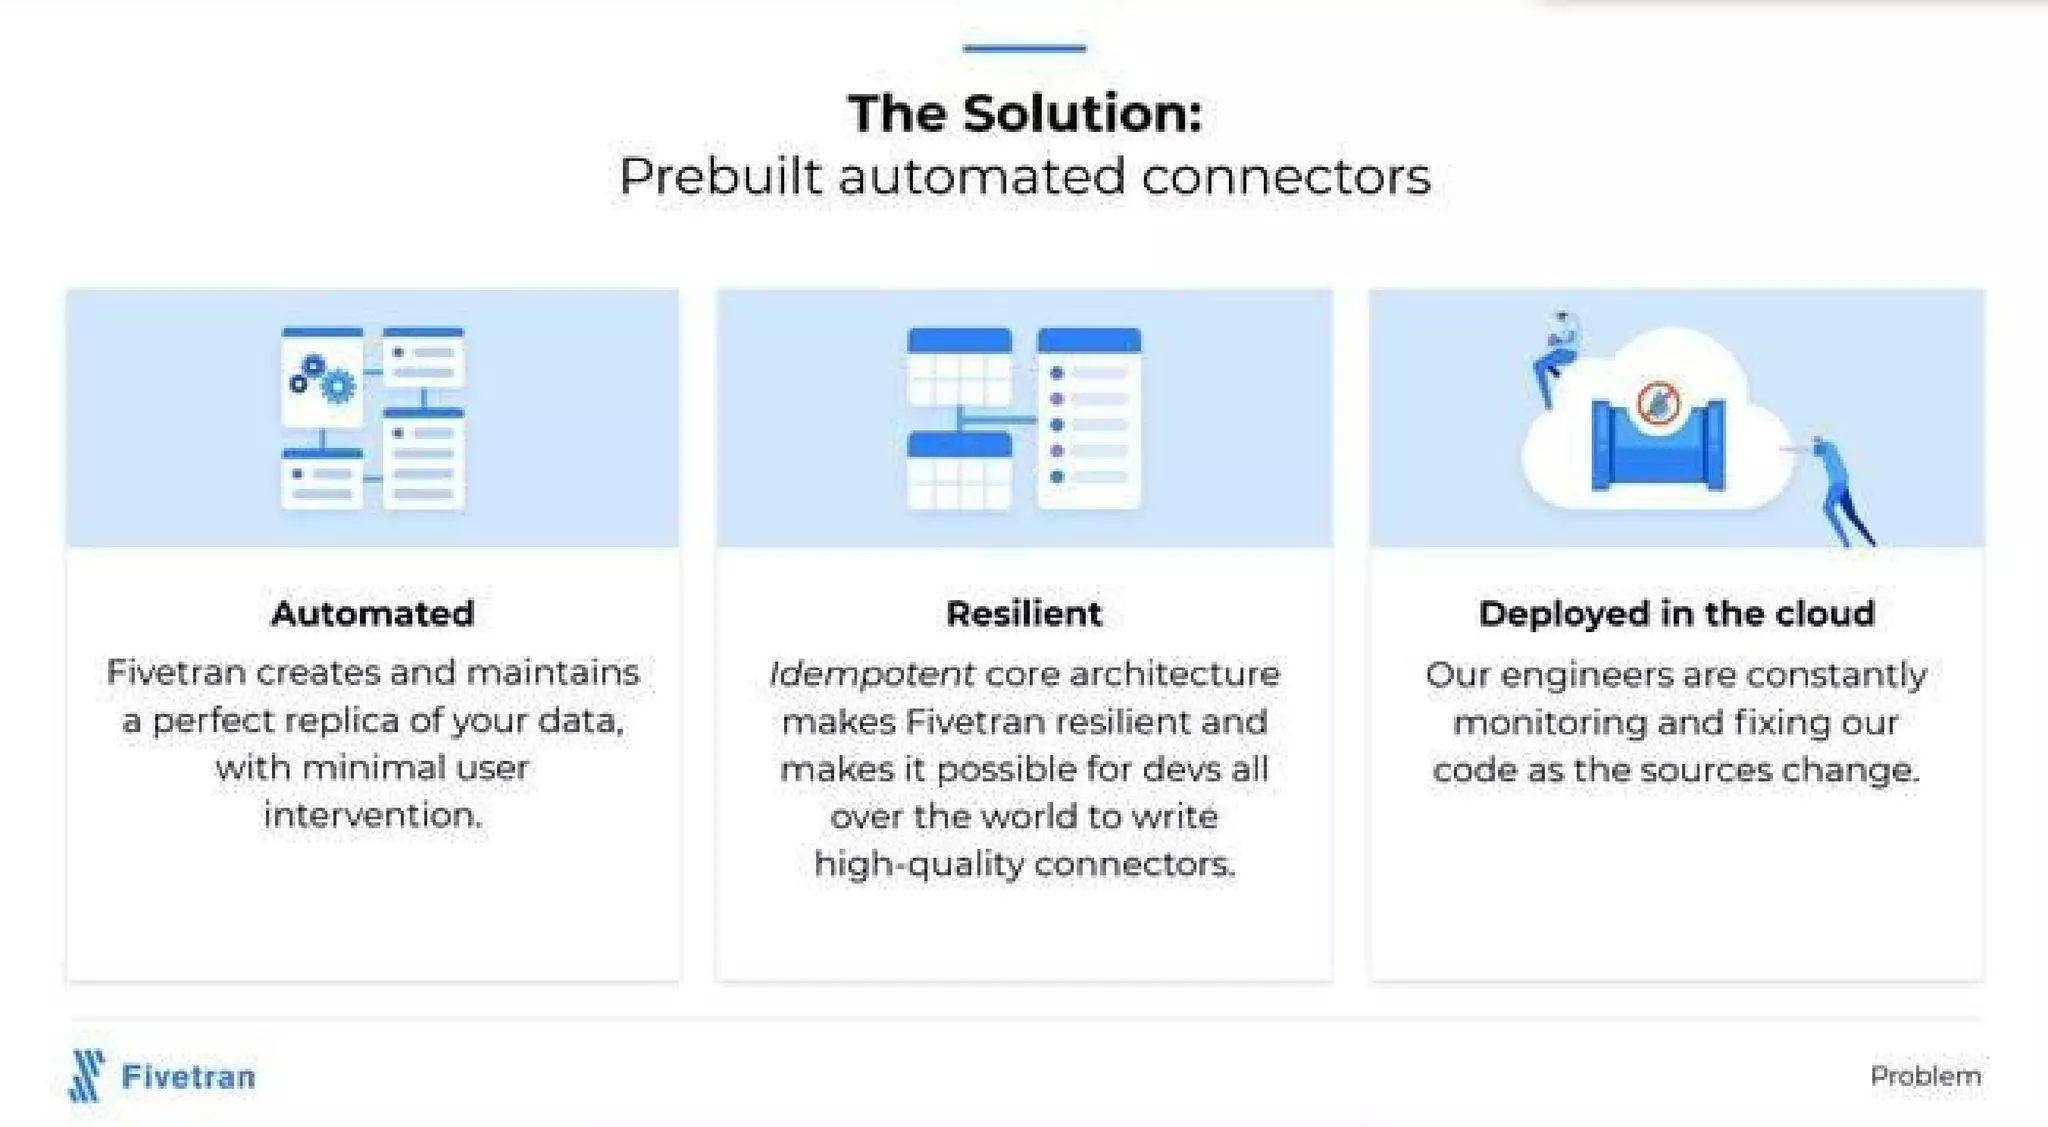
Slide 4 offers a direct counterpoint to the previous slide by presenting automated connectors as the solution and succinctly listing three pillars: automated, resilient, and cloud deployed. Each pillar has a short explanation that connects product design decisions to customer benefits, showing both technical thinking and user outcomes.

The slide works because it ties product attributes to operational advantages, helping investors understand why the solution is sustainable. Founders should emulate this structure by naming the architectural choices that enable their value proposition and briefly explaining how those choices translate into lower cost of ownership or better reliability.

Key Takeaway: Explain not just what you build but the architectural choices that make it distinct and durable.
User experience and onboarding: Reduce time to value

User experience and onboarding: Reduce time to value

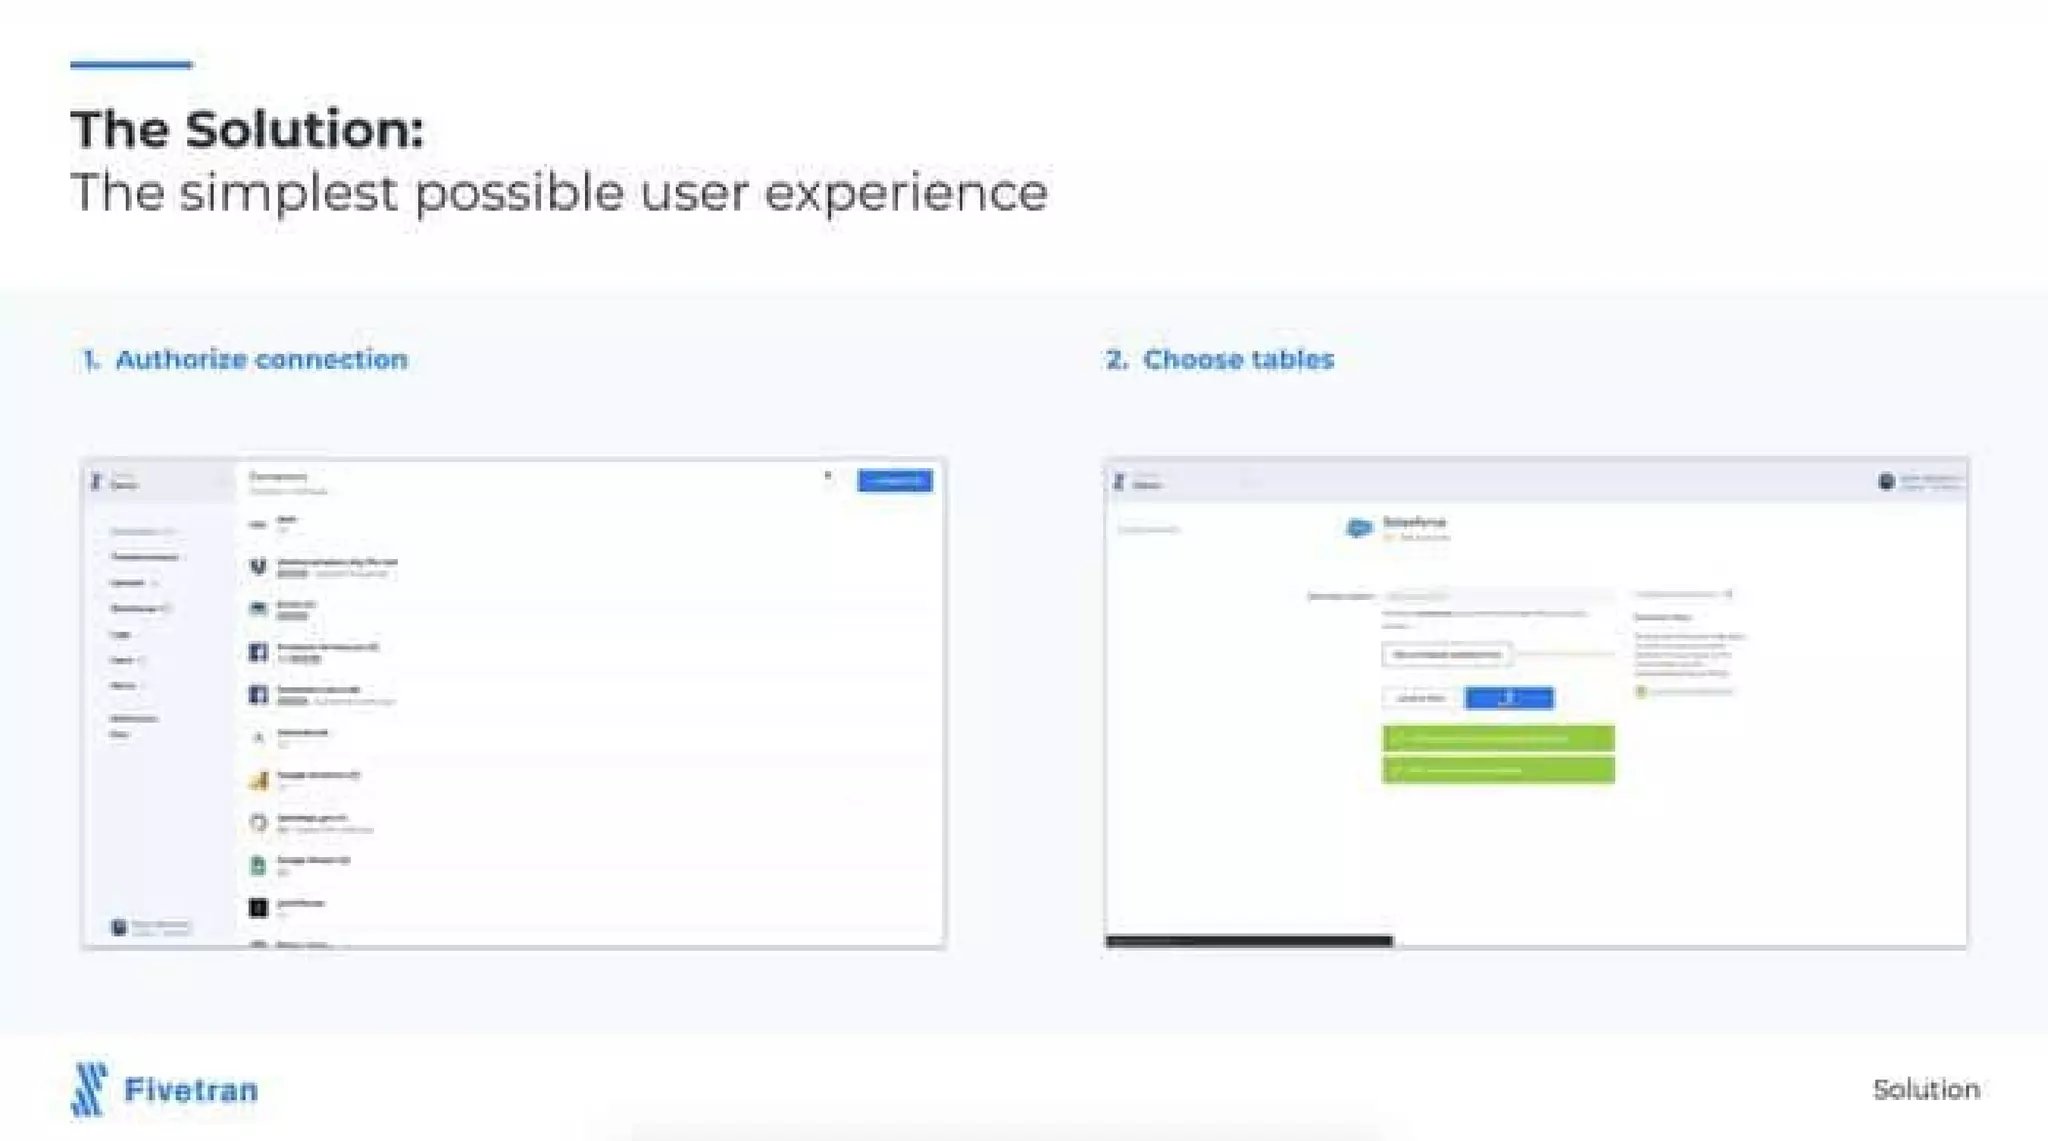
Slide 5 demonstrates the product experience with two UI screenshots labeled Authorize connection and Choose tables. This gives a sense of ease and speed, reinforcing the promise of minimal user intervention. Showing the onboarding path reduces perceived integration risk for buyers and investors.

Presenting real UI flows is a powerful persuasion tool for infrastructure products. Founders should surface the simplest core user journey early to prove that technical complexity is hidden behind an approachable UX, and to give confidence that adoption friction has been considered and minimized.

Key Takeaway: Show the core user flow or onboarding to prove low friction and shorten investors' trust timeline.
Competitive landscape: Position by automation and workflow

Competitive landscape: Position by automation and workflow

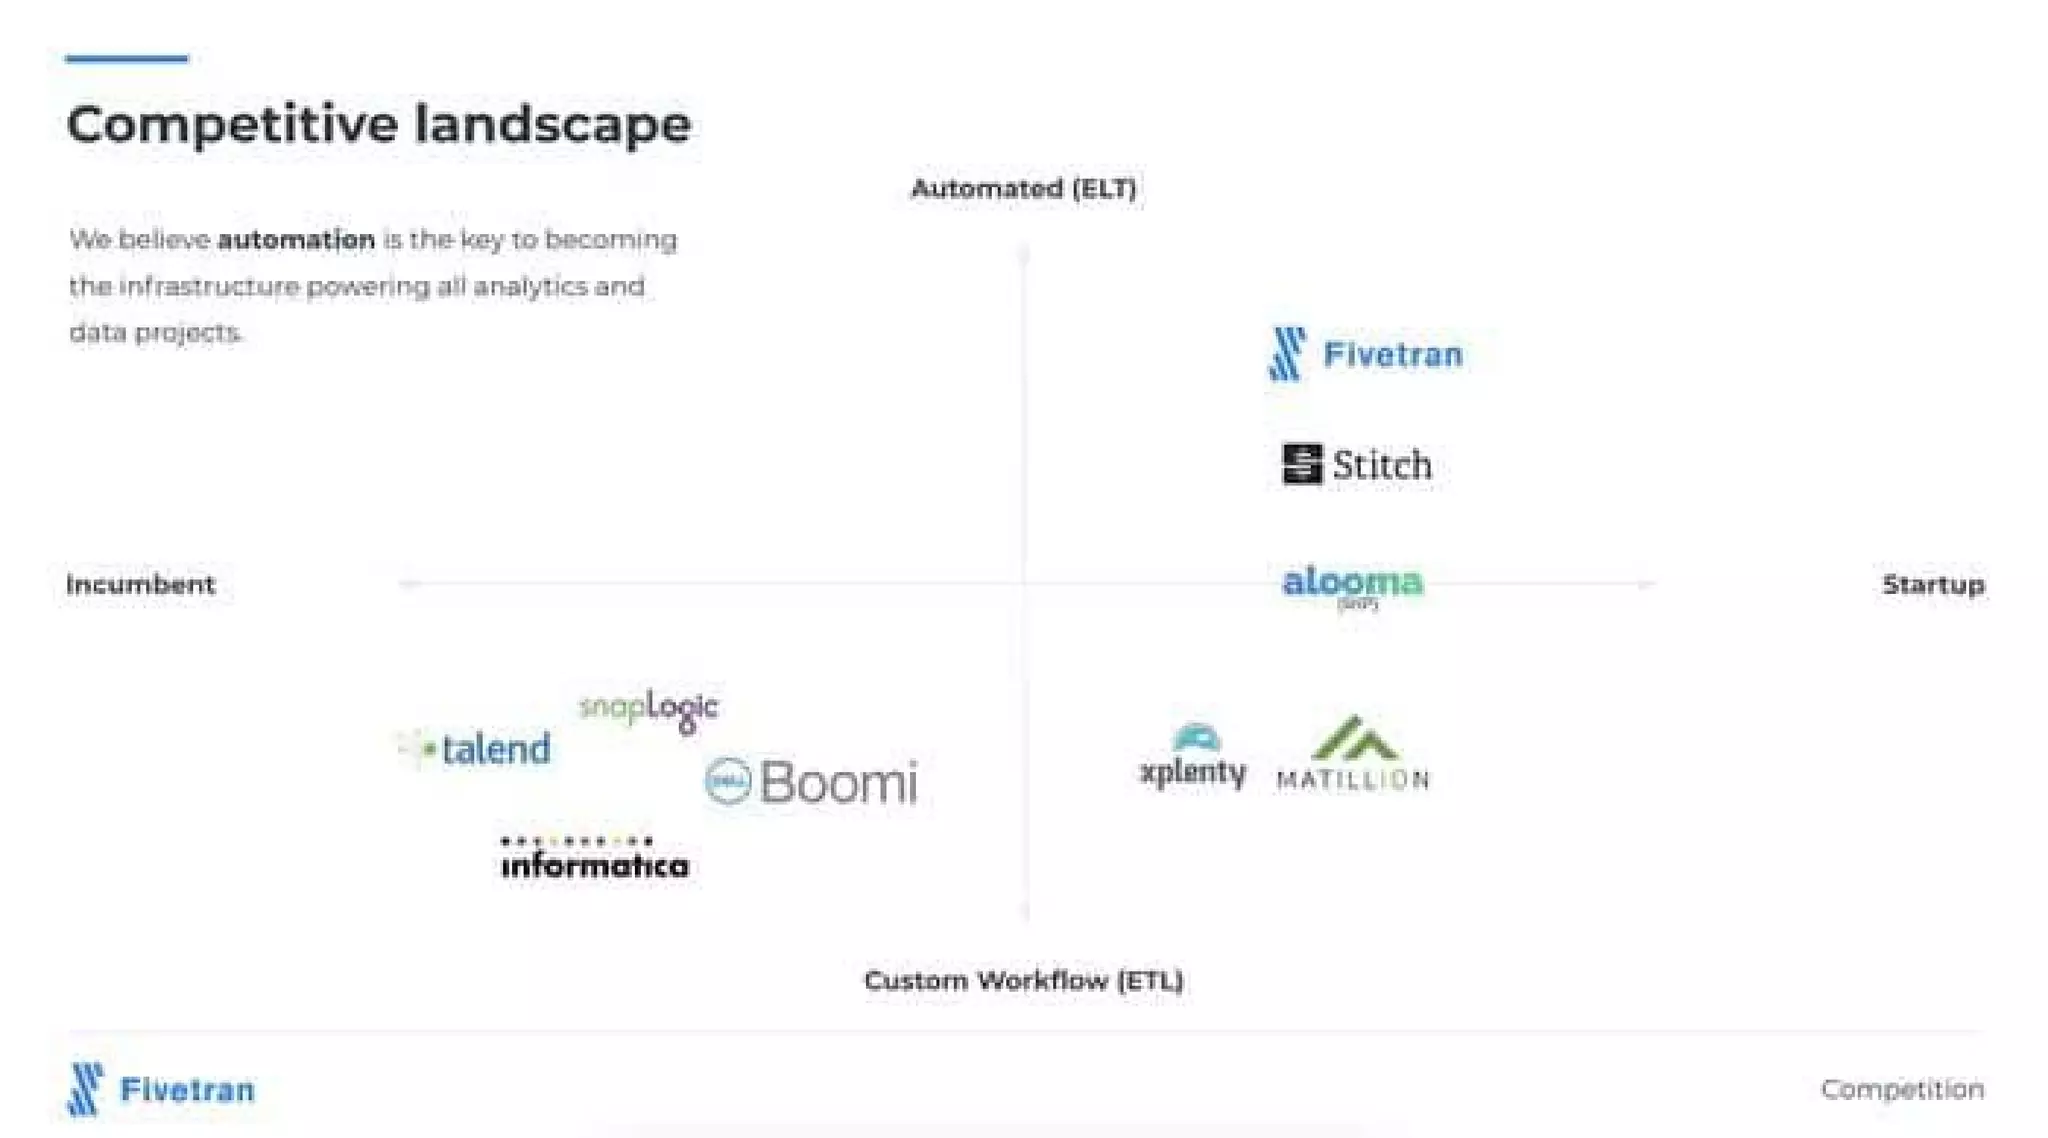
Slide 6 uses a two-axis competitive map to position Fivetran as an automated ELT player versus incumbents providing custom ETL workflows. The visual separation helps communicate why the team believes automation is a distinct category and not just a feature. Logos of direct and indirect competitors make the landscape credible and concrete.

This slide is effective because it clarifies category strategy and target customers. For founders, a plotted competitive map is a useful tool to show both differentiation and the addressable space. Be honest about rivals and show why your approach is meaningfully different.

Key Takeaway: Use a clear competitive map to show category positioning and why your approach creates a distinct value axis.
Traction: Customers and validation

Traction: Customers and validation

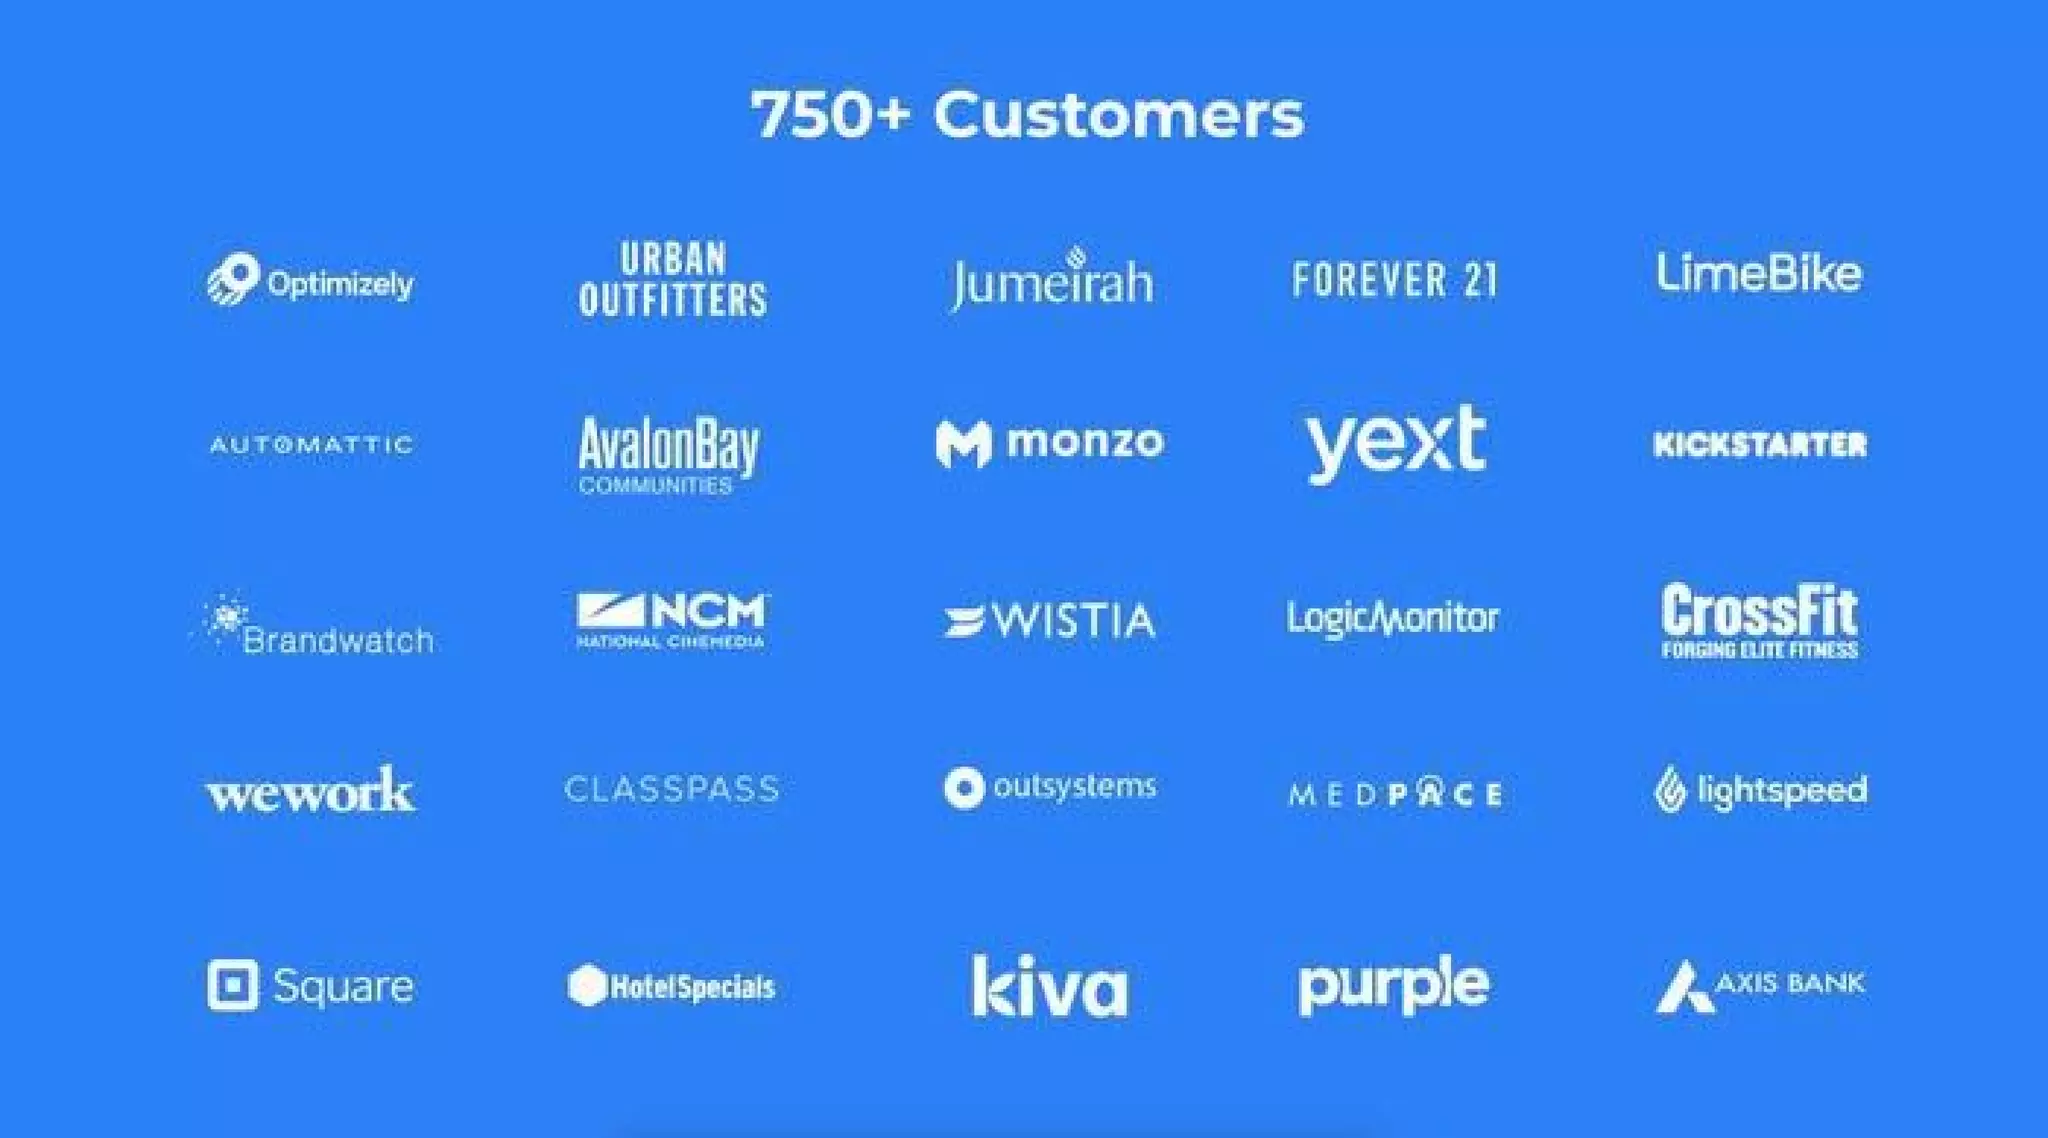
Slide 11 highlights customer logos and a headline number of 750+ customers, signaling strong product-market fit and momentum for a seed-era company. The visual density of recognizable brands is persuasive and serves as social proof for both enterprise credibility and scalability.

Including logos early is a proven traction tactic. Founders should show meaningful customer milestones and, when possible, name recognizable users to validate demand. Pair logos with metrics so investors can quickly assess scale and quality of adoption.

Key Takeaway: Showcase customer logos and headline metrics together to convert narrative claims into verifiable traction.
Team and company metrics: Headcount and culture signals

Team and company metrics: Headcount and culture signals

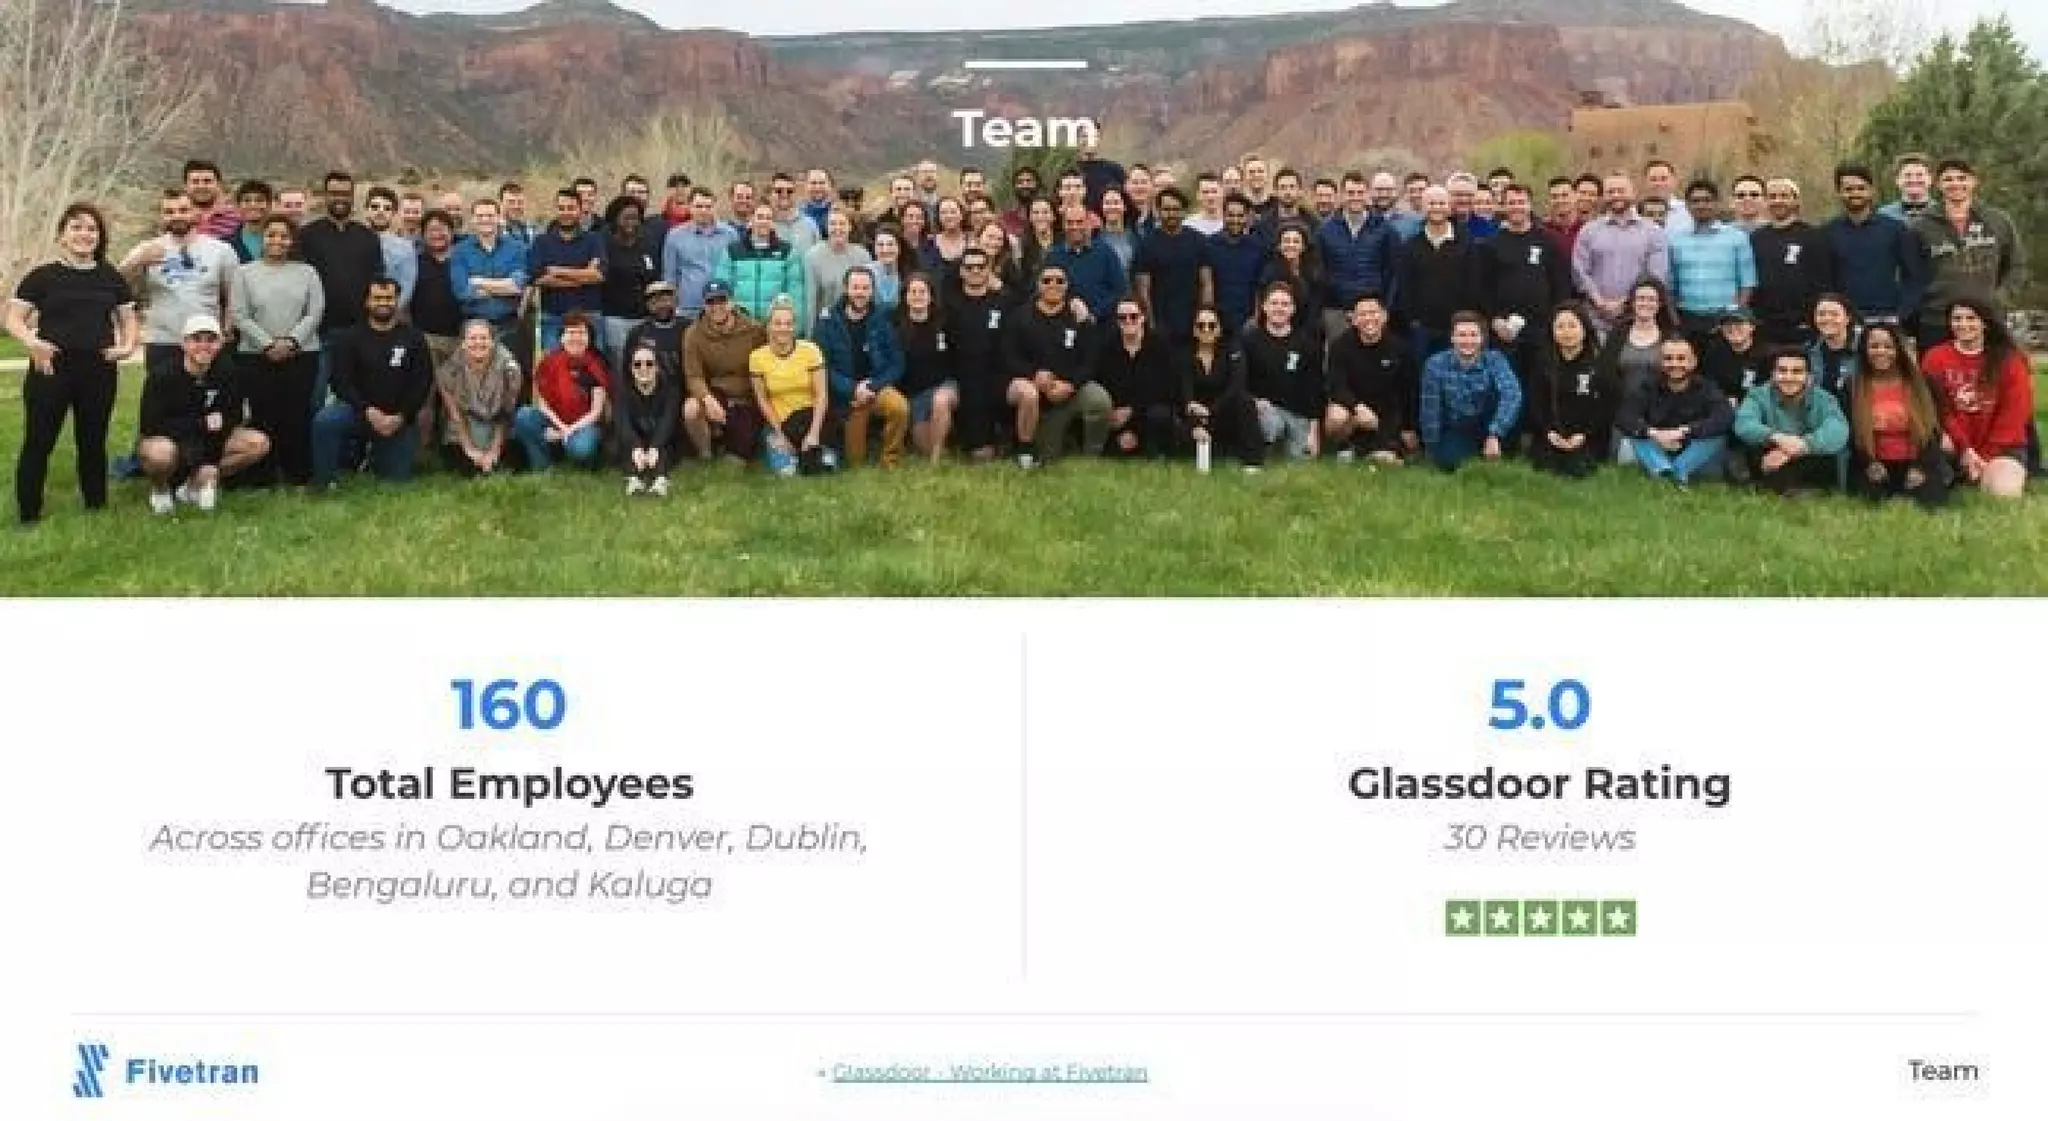
Slide 12 presents a team photo and quick company metrics like total employees and a Glassdoor rating. This communicates both capacity to execute and cultural strength, which can be a differentiator when a product requires ongoing engineering maintenance and partnerships.

For early-stage investors, team signals are as important as product claims. Founders should include concise metrics that demonstrate hiring progress, global footprint, or team quality, and supplement them with qualitative cues about culture when relevant.

Key Takeaway: Use compact team metrics and imagery to convey execution capability and culture without long bios.

Conclusion: Key Lessons

Fivetran's seed deck is a strong example of clear problem framing, a tightly articulated technical solution, and early validation through customers and partners. The deck succeeds by translating technical architecture into business benefits, by visualizing workflows to reveal incumbent weaknesses, and by using real UX and logos to reduce perceived risk. For founders, the actionable lessons are to keep narratives simple, pair problem and solution with concrete visuals, show the core user flow, and supply credible traction and team signals. Finally, explicitly call out the architectural choices that make your product defensible to help investors appreciate long-term durability.

Full Deck Analysis

11 sections

Overview

Company: Fivetran
Round: Seed ($100K)
Year: 2013
Outcome: Valued at $5.6B (2021)

Executive Summary

This deck crisply frames a practical, developer/operations pain — centralizing data from many SaaS/operational systems into modern cloud data warehouses — and presents a simple product vision: fully-managed, automated connectors that remove the labor of traditional ETL. It stands out for clean storytelling, partner validation (Snowflake / Google Cloud screenshots), early customer logos (750+ customers shown), and a straightforward competitive map that places Fivetran as an automated ELT leader versus incumbent ETL vendors.

Problem Statement

How the deck articulates the problem:

  • Slide 2: “The Problem: Centralizing data” — shows many operational sources (Stripe, GitHub, Oracle, Salesforce, Adwords, Postgres, Marketo) and the need to feed modern data warehouses for analytics, data products, operational systems, etc.
  • Slide 3: Breaks down why current approaches are painful: traditional ETL is “labor-intensive and brittle,” listing discrete, manual steps (1. API call → 2. Design schema → 3. Write CSV → 4. Prepare destination → 5. Load → 6. SQL Merge). This makes the cost and fragility explicit and easy to grasp.
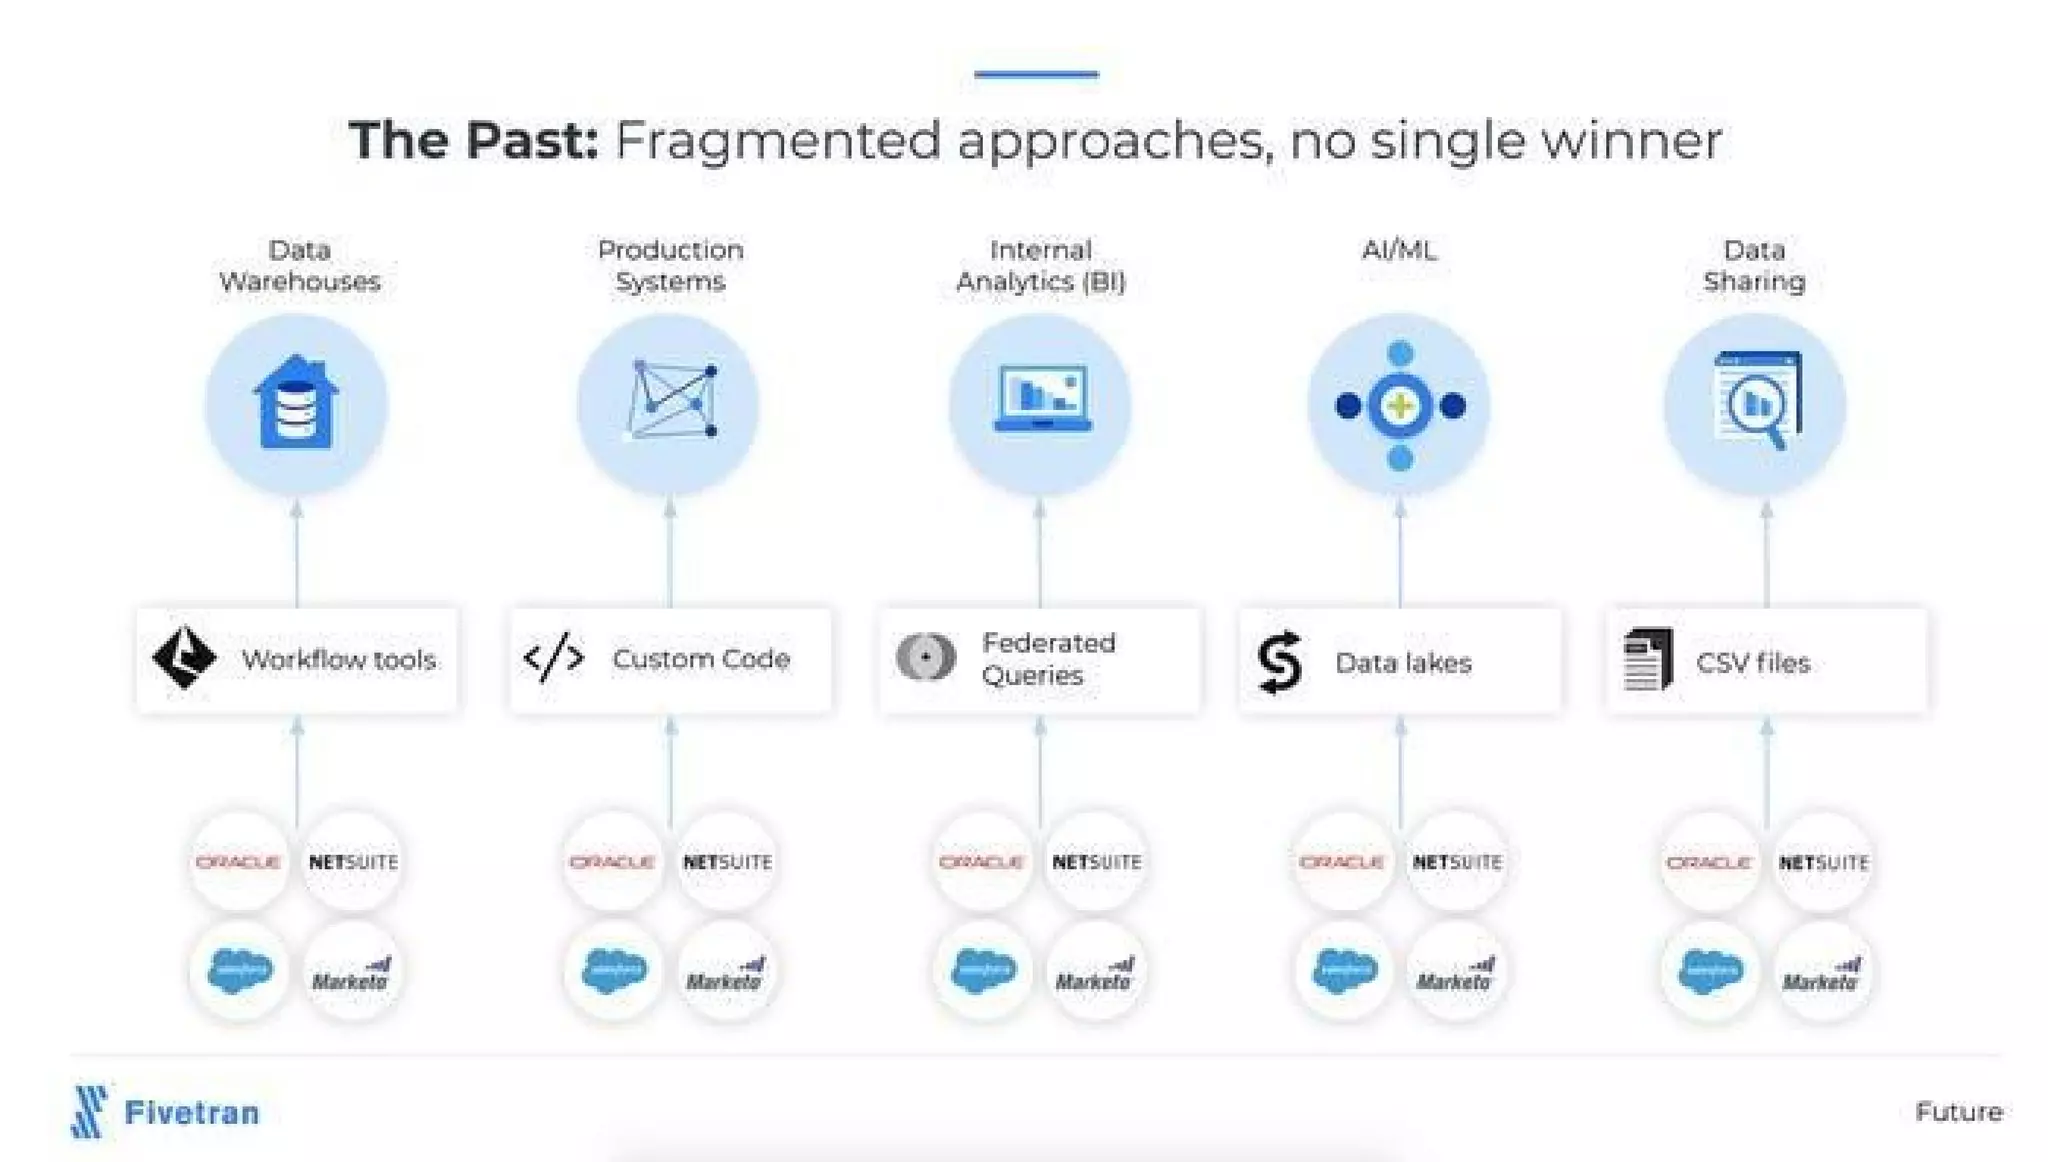
  • Slide 10: “The Past” demonstrates fragmentation and multiple non-scalable approaches (workflow tools, custom code, federated queries, CSVs, data lakes).

Solution

How the deck positions the solution:

  • Slide 4 & 5: “The Solution: Prebuilt automated connectors” — Fivetran is presented as automated, resilient (idempotent core architecture), and deployed in the cloud (engineers monitor/fix as sources change).
  • Slide 6: UX is intentionally simple —Authorize connection → Choose tables — emphasizing low friction for onboarding.
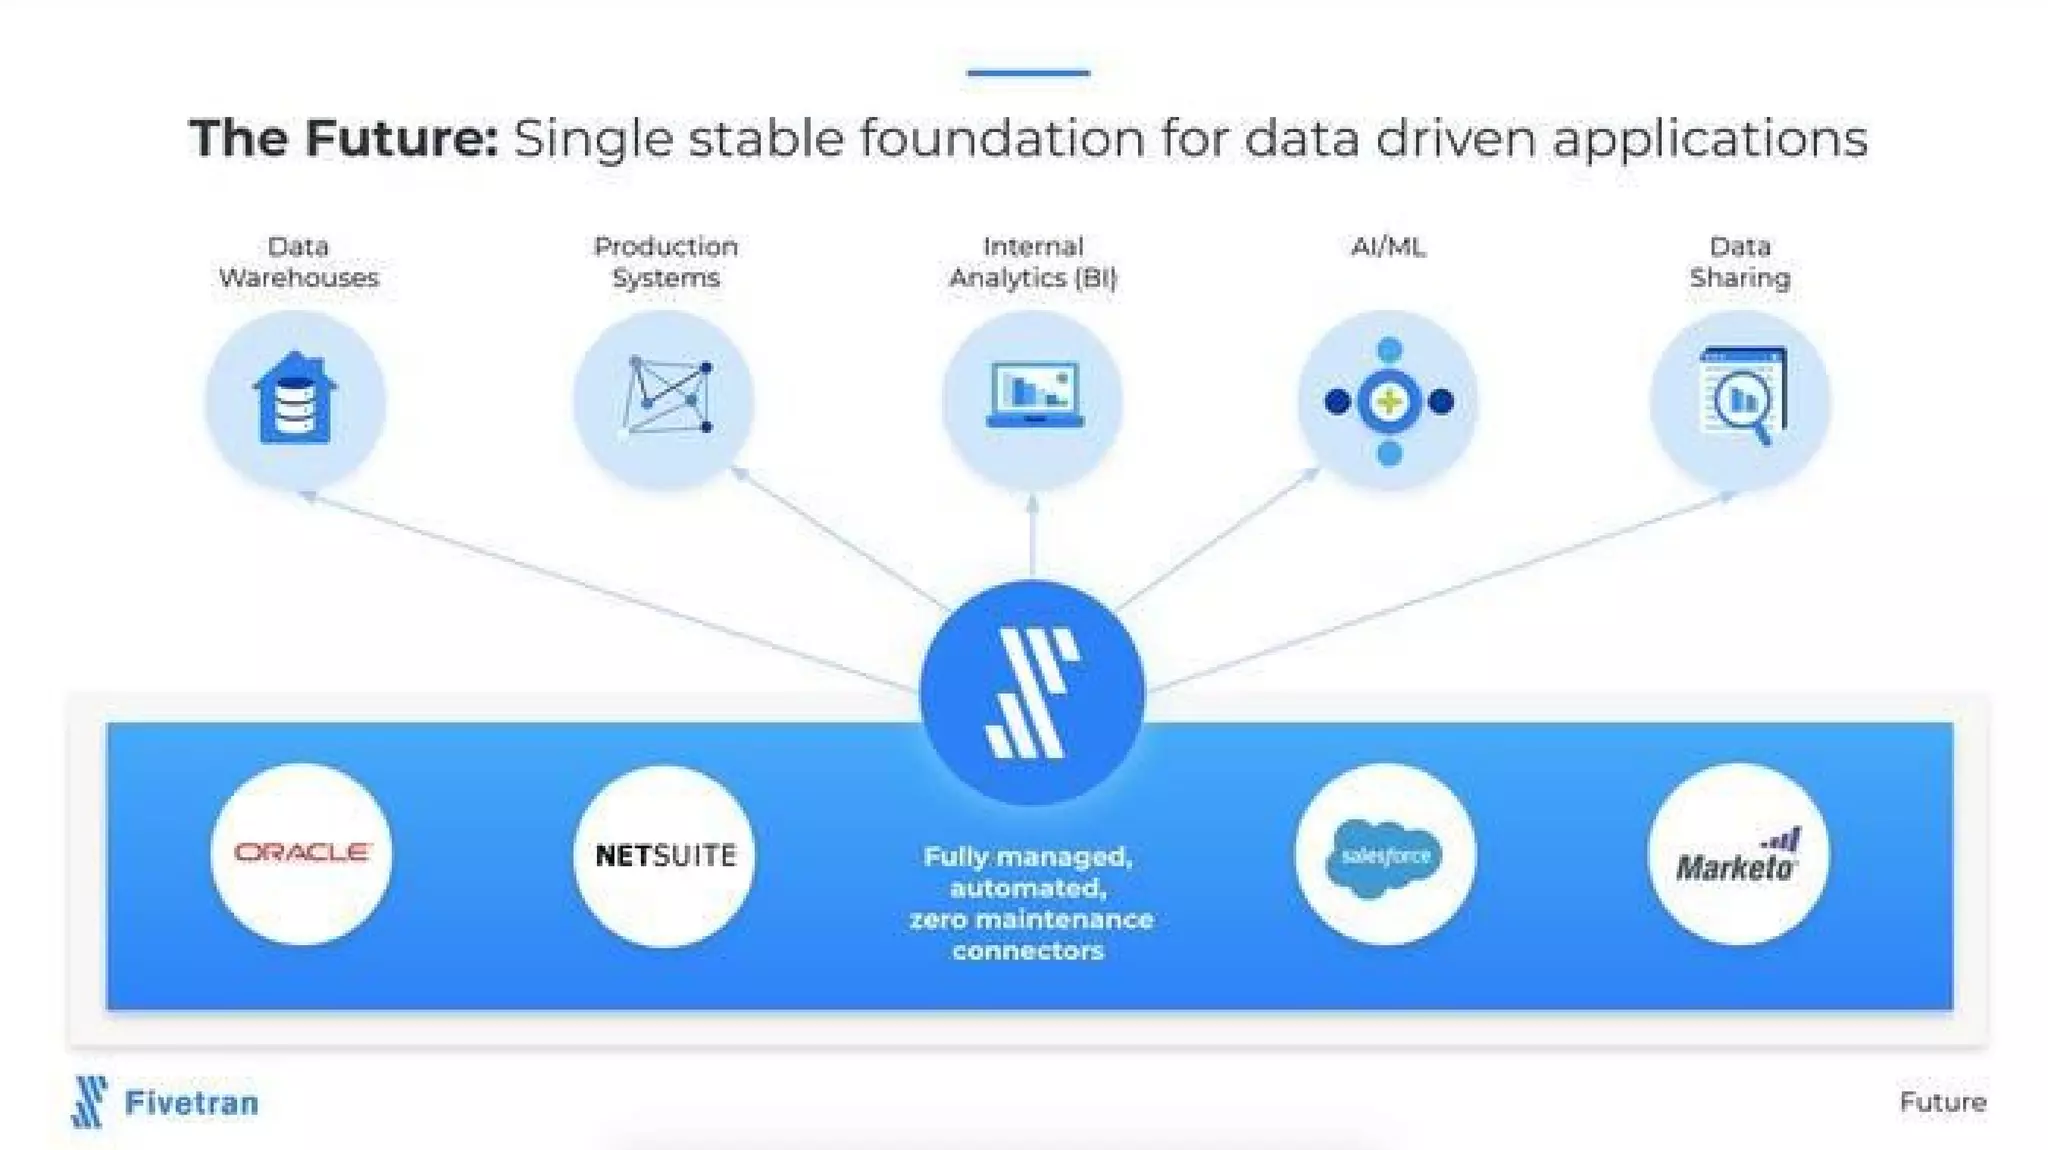
  • Slide 11: “The Future” diagram shows Fivetran as a single stable foundation feeding data warehouses, production systems, BI, AI/ML, and data sharing with “fully managed, automated, zero maintenance connectors.”

Market Opportunity

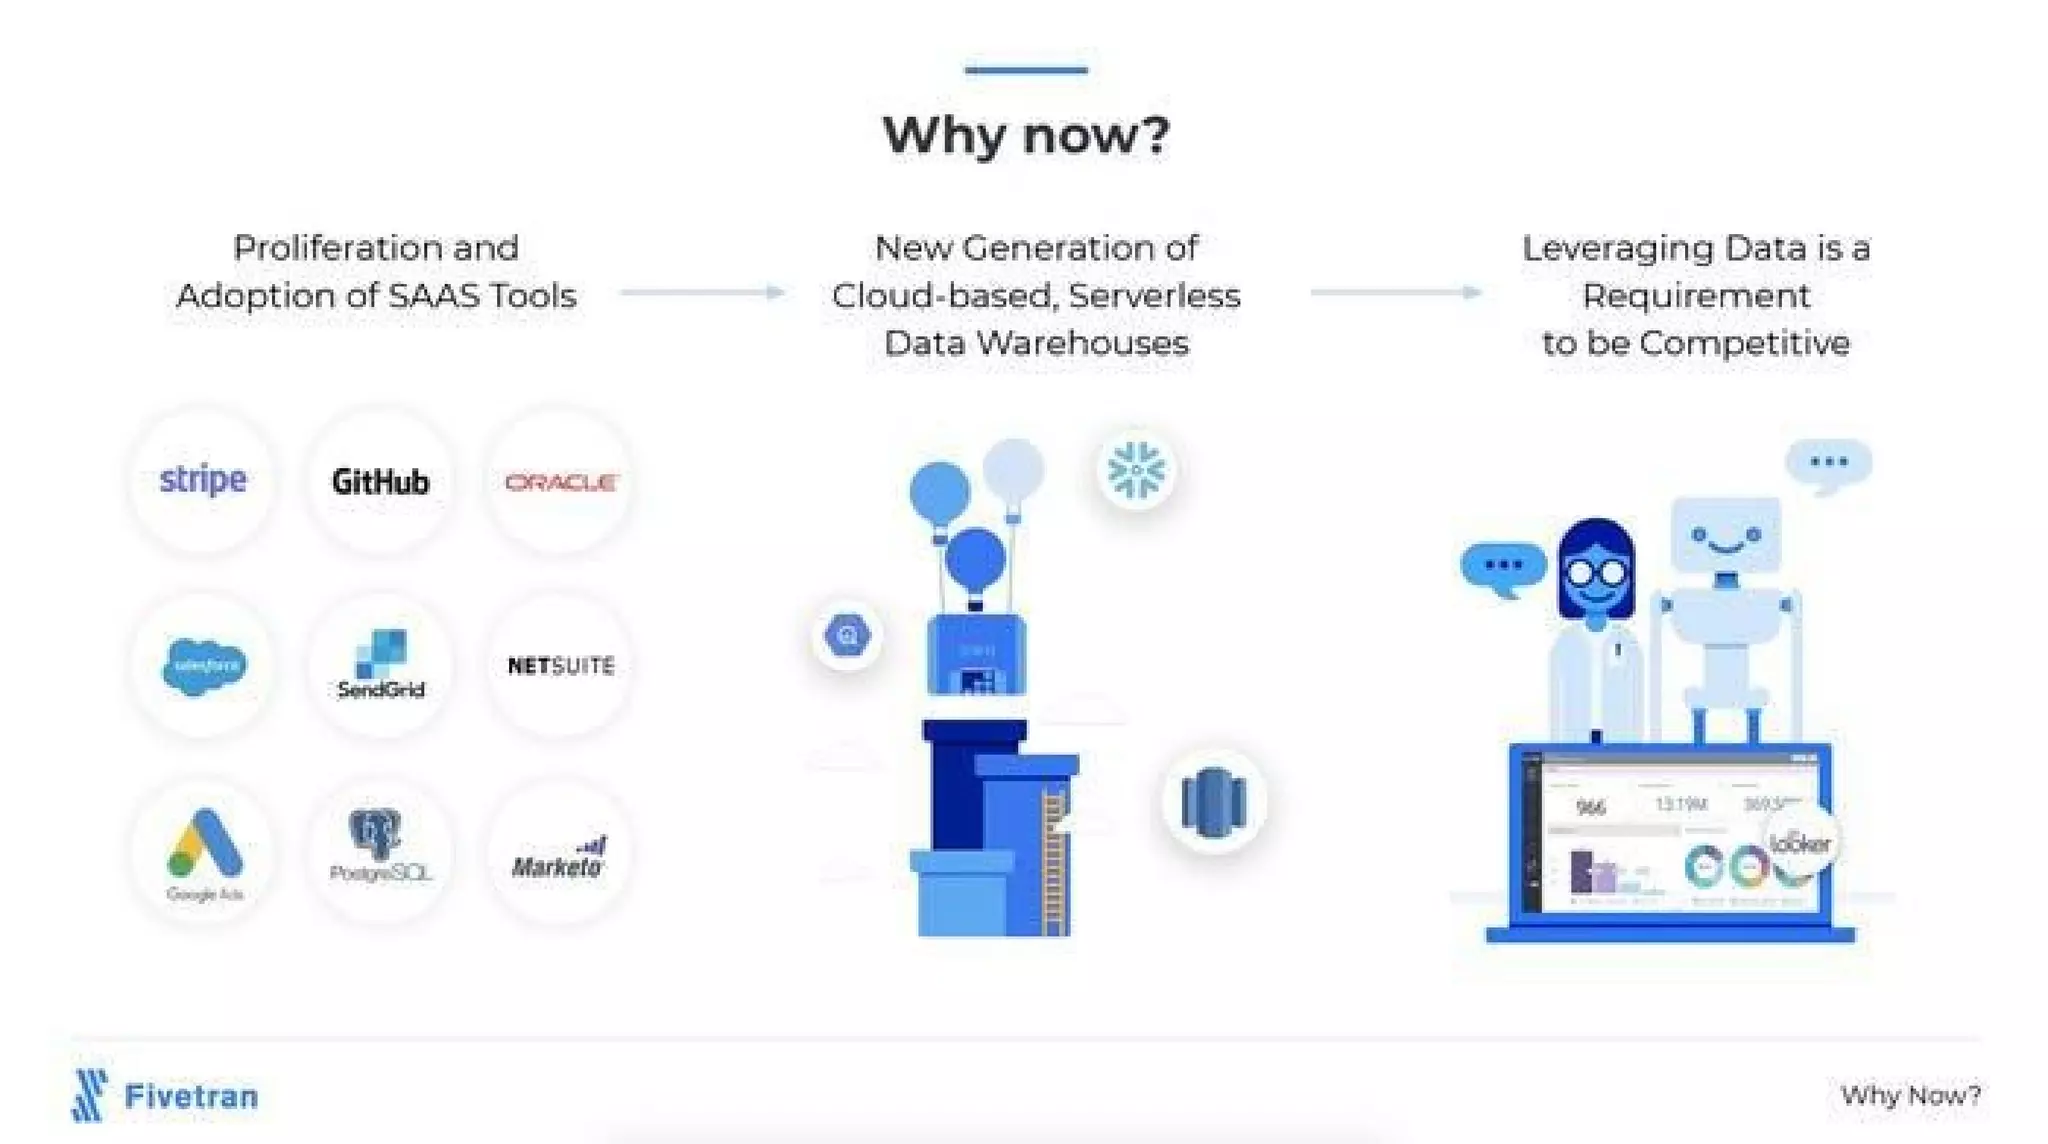
  • The deck stresses a structural market trend (slides 8 & 11): proliferation of SaaS apps + emergence of cloud, serverless data warehouses (Snowflake shown) => companies must leverage data to remain competitive.
  • No explicit TAM / SAM / SOM numbers are provided in the deck. The market opportunity is argued qualitatively (many SaaS sources + new types of consumers: BI, AI/ML, data products) but lacks quantified market sizing.

Business Model

  • The deck does not show explicit pricing, subscription tiers, or unit economics.
  • Implied model: SaaS — sold as fully-managed connector service (subscription-based, likely per-connector / per-destination / or usage/volume pricing). Slide copy emphasizes “fully managed, automated, zero maintenance connectors,” indicating enterprise SaaS positioning.
  • No details shown on ARPU, CAC, LTV, churn, or gross margins.

Traction & Metrics

  • Slide 11: “750+ Customers” is presented prominently with many logo marques (WeWork, LimeBike, Square, Kickstarter, Monzo, Forever21, etc.) — strong logo-based traction signal.
  • Slide 12 (Team/Traction area): shows “160 Total Employees” (across offices in Oakland, Denver, Dublin, Bengaluru, Kaluga) and “5.0 Glassdoor Rating (30 Reviews)”. These employee numbers / offices signal operational scale but may reflect progress beyond a minimal seed-stage snapshot.
  • No revenue figures, ARR, MRR, growth rates, customer cohorts, or churn metrics are displayed.

Competitive Positioning

  • Slide 7: Competitive landscape places Fivetran in the “Automated (ELT)” quadrant alongside Stitch and Alooma (startups), and contrasts them with incumbents (Talend, Informatica, SnapLogic, Boomi) on the “Custom Workflow (ETL)” axis.
  • Slide 10: “The Past” shows alternatives (workflow tools, custom code, data lakes, CSVs) and positions Fivetran as the single stable foundation for modern data stack needs.
  • Differentiation claims: full automation (no user maintenance), resilient/idempotent architecture, cloud-deployed, partner integrations (Snowflake / Google Cloud Marketplace).

Team

  • Slide 12: Large team photo (group shot) — no named founder bios on slides. The deck lists:
    • “160 Total Employees” and offices across multiple geographies.
    • Glassdoor rating shown (5.0, 30 reviews) as cultural validation.
  • The deck omits individual founder backgrounds, technical credentials, or prior exits on the slides shown — a notable omission for seed investors who often want founder CVs up front.

Go-to-Market Strategy

  • Partnership-driven distribution:
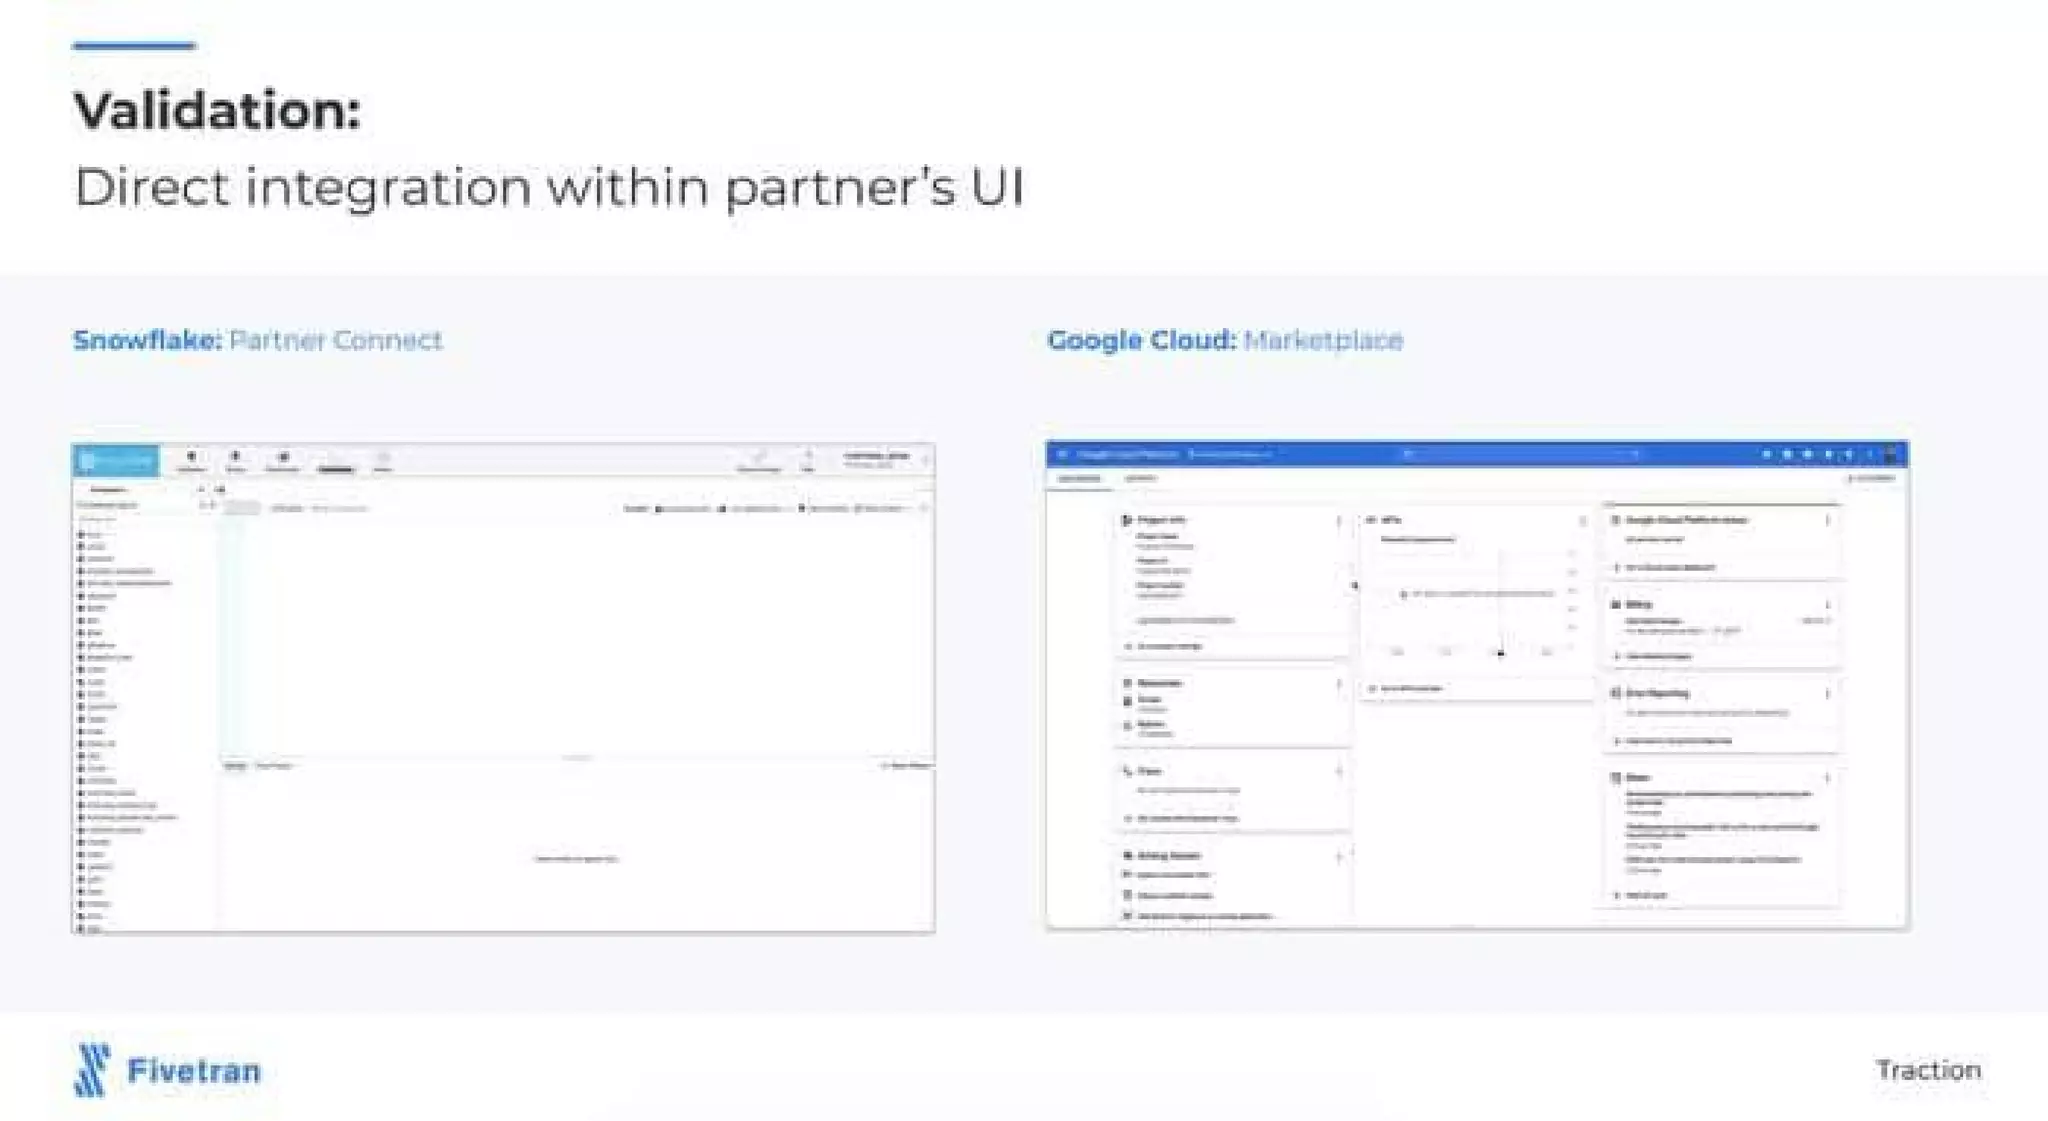
    • Slide 9 (Validation): direct integration screenshots show Fivetran within partner UIs (Snowflake Partner Connect and Google Cloud Marketplace) — implies channel and platform partnerships are central to distribution.
  • Logo-driven credibility and inbound: large customer logos suggest sales via product-led / logos / references and likely enterprise outreach.
  • No detailed playbook on direct sales motion, pricing, distribution channels, sales cycles, or target segments is provided.

The Ask

  • As stated in context: Seed raise of $100K (from the top-level summary you provided). The deck itself does not display a slide that itemizes the ask or a use-of-funds breakdown.
  • No slide-specific allocation (R&D vs GTM vs hiring) is shown.

Investor Deep Dive

Executive summary, strengths & red flags

Executive Summary

This deck crisply frames a practical, developer/operations pain — centralizing data from many SaaS/operational systems into modern cloud data warehouses — and presents a simple product vision: fully-managed, automated connectors that remove the labor of traditional ETL. It stands out for clean storytelling, partner validation (Snowflake / Google Cloud screenshots), early customer logos (750+ customers shown), and a straightforward competitive map that places Fivetran as an automated ELT leader versus incumbent ETL vendors.

Key Strengths

3 identified

1

Clear problem articulation and stepwise breakdown (Slide 3) — the deck walks investors through the manual ETL steps that developers hate; this makes the value proposition tangible and urgent.

2

Simple, tangible product positioning and UX (Slides 4–6) — “authorize connection, choose tables” communicates low friction onboarding and a product-first mindset.

3

Strong validation signals (Slides 9 & 11) — partner integration screenshots (Snowflake, Google Cloud) plus a large set of customer logos (Slide 11: 750+ customers) provide credibility beyond claims.

Red Flags & Weaknesses

3 identified

1

No financials or unit economics — the deck lacks ARR/MRR, revenue growth, CAC, LTV, or margins. For an investor, absence of monetization metrics is a major gap.

2

No founder bios / individual team credentials — only a group photo and headcount; missing founder background and technical leadership detail that seed investors typically expect.

3

No TAM numbers or go-to-market detail — while the “why now” case is solid qualitatively, there are no quantified market size estimates or an explicit GTM playbook and sales metrics.

More Pitch Decks To Study

Compare structure, fundraising context, and investor-facing story across similar startup decks.