Compare your deck to Esusu

Compare Your Deck

Esusu Pitch Deck (2019)

Fintech
Stage: Seed
Raised: $2.3M
Year: 2019
Slides: 12
Outcome: Valued at $1.2B (2025)

Pitch Deck

1 / 12
Esusu pitch deck - The Opening: Brand and One-line Positioning
Click to expand

Deck Analysis

This deck for Esusu (Seed, 2019) presents a concise, visually consistent story about unlocking credit-building and deployable capital by reporting rent payments to credit bureaus. It pairs a clear market opportunity with a straightforward product flow (property managers → Esusu → bureaus), landlord and tenant value propositions, third-party validation (TransUnion), traction metrics, and a strong founding team. The deck is notable for focusing on a single, measurable outcome (rent reporting increases on-time payments and creates credit visibility) and for using partnerships and data points to justify commercial and social impact.

The Opening: Brand and One-line Positioning

The Opening: Brand and One-line Positioning

The cover slide (dark background with logo and the line "Accessing trillions in untapped deployable capital") immediately frames Esusu as a mission-driven fintech tackling a very large, addressable market. The use of a bold, simple tagline establishes scale and aspiration without burying the audience in nuance; it primes investors to expect a thesis about financial inclusion tied to institutional capital flows.

From a founder's perspective, this slide is effective because it sets tone and stakes quickly. The minimalist design and emphasis on a single big number ("trillions") orient the listener to think about market size and impact first, which is appropriate for early-stage fundraising where differentiation and vision are critical.

Key Takeaway: Open with a single, bold value proposition that communicates scale and mission — keep the cover minimal and memorable.
Market Opportunity: Quantify the Problem

Market Opportunity: Quantify the Problem

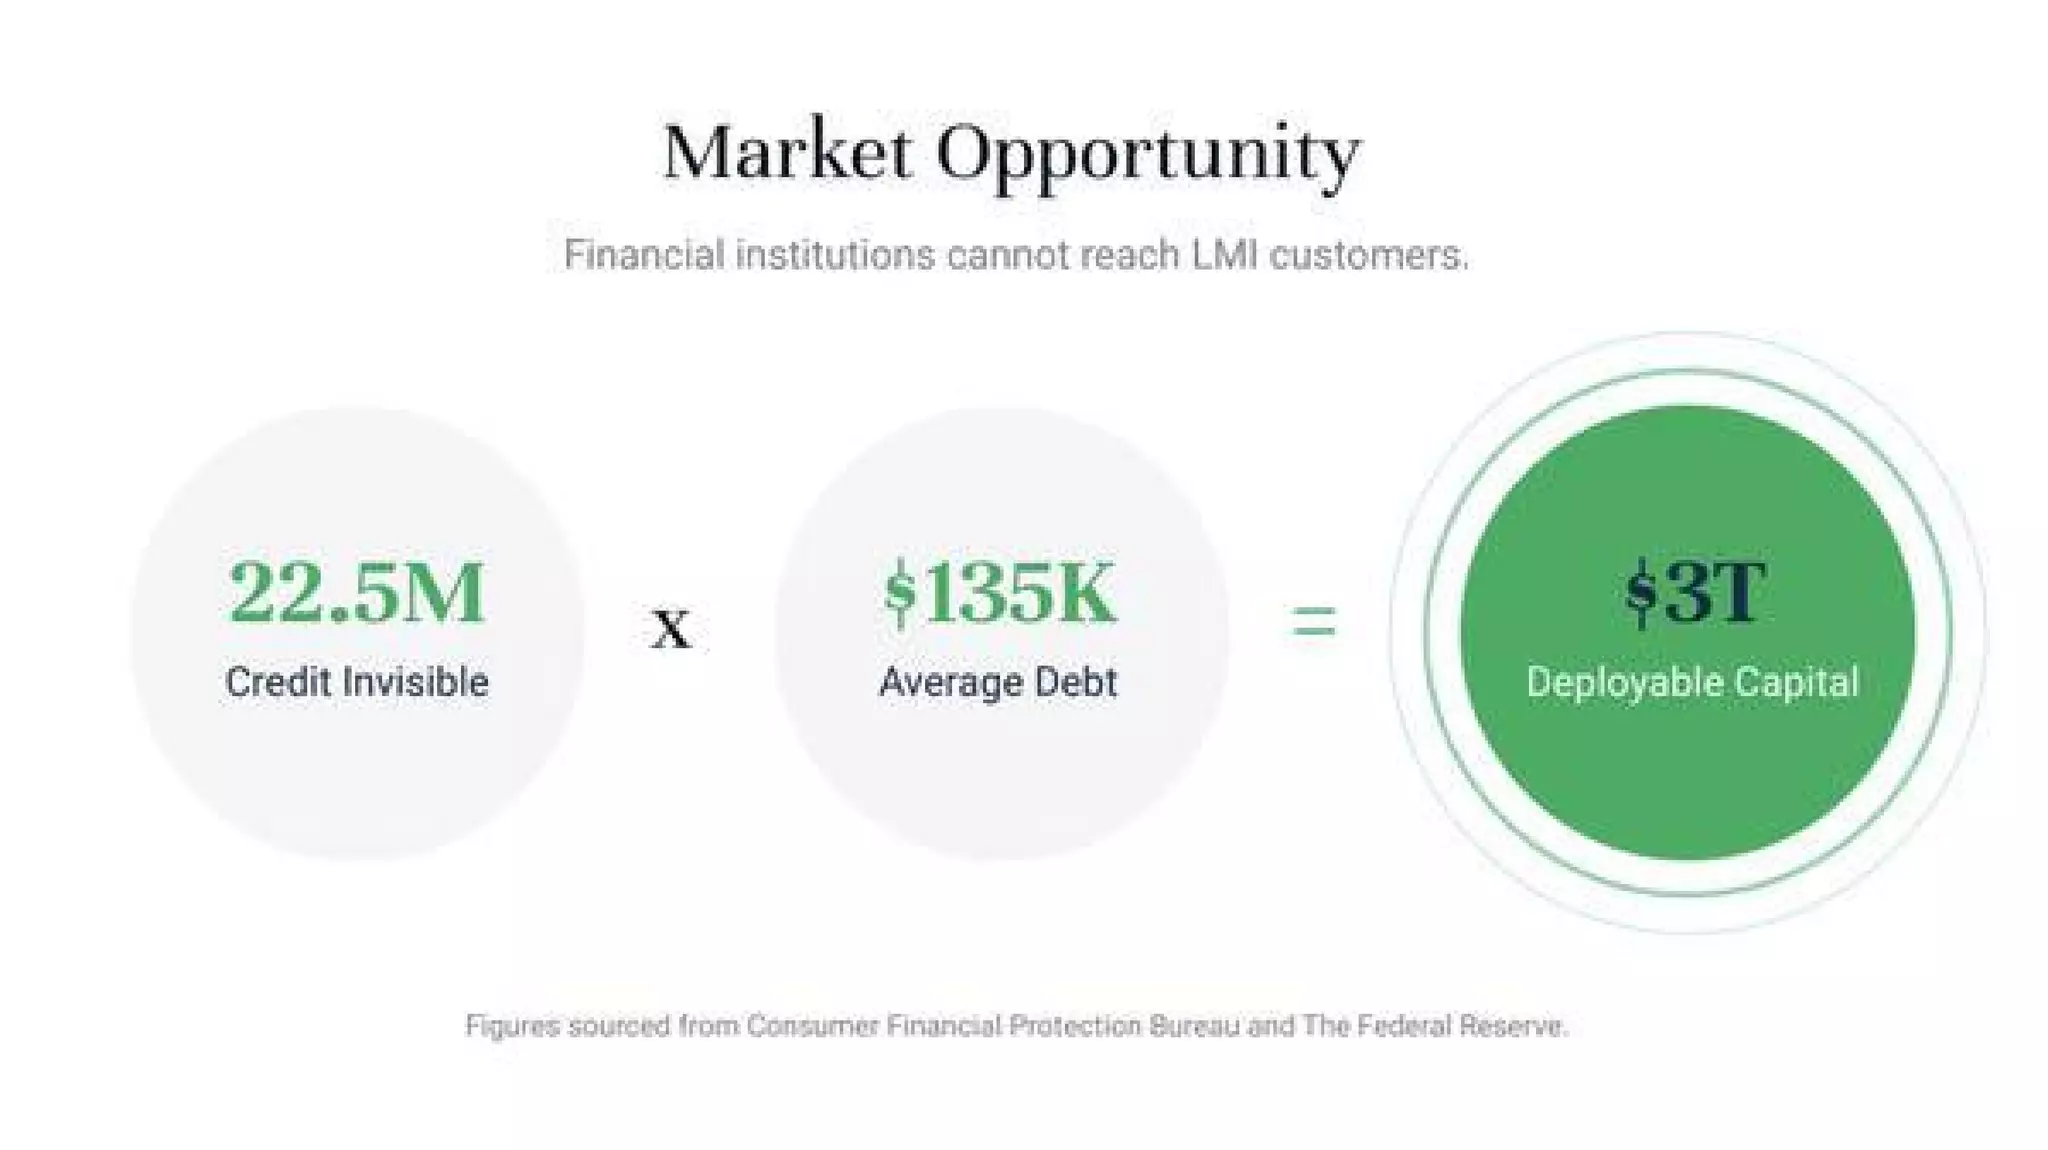
Slide 2 quantifies the opportunity: "22.5M credit invisible" multiplied by "$135K average debt" to arrive at "$3T deployable capital." The visual uses simple circles and arithmetic to make the TAM straightforward and believable. Importantly, the slide cites sources (CFPB, Federal Reserve) which signals the team did homework and that the numbers are not arbitrary.

This is effective because investors need a defensible view of market size; the slide achieves this without overcomplication. It balances social framing (credit invisible customers) with investor language (deployable capital), bridging impact and commercial potential. Founders should note how combining a credible user count with a conservative per-user financial figure yields a compelling headline TAM.

Key Takeaway: Translate your impact metric into investor language (TAM, deployable capital) using sourced, simple arithmetic to make your market opportunity credible.
Product & Partnerships: Clear End-to-End Flow

Product & Partnerships: Clear End-to-End Flow

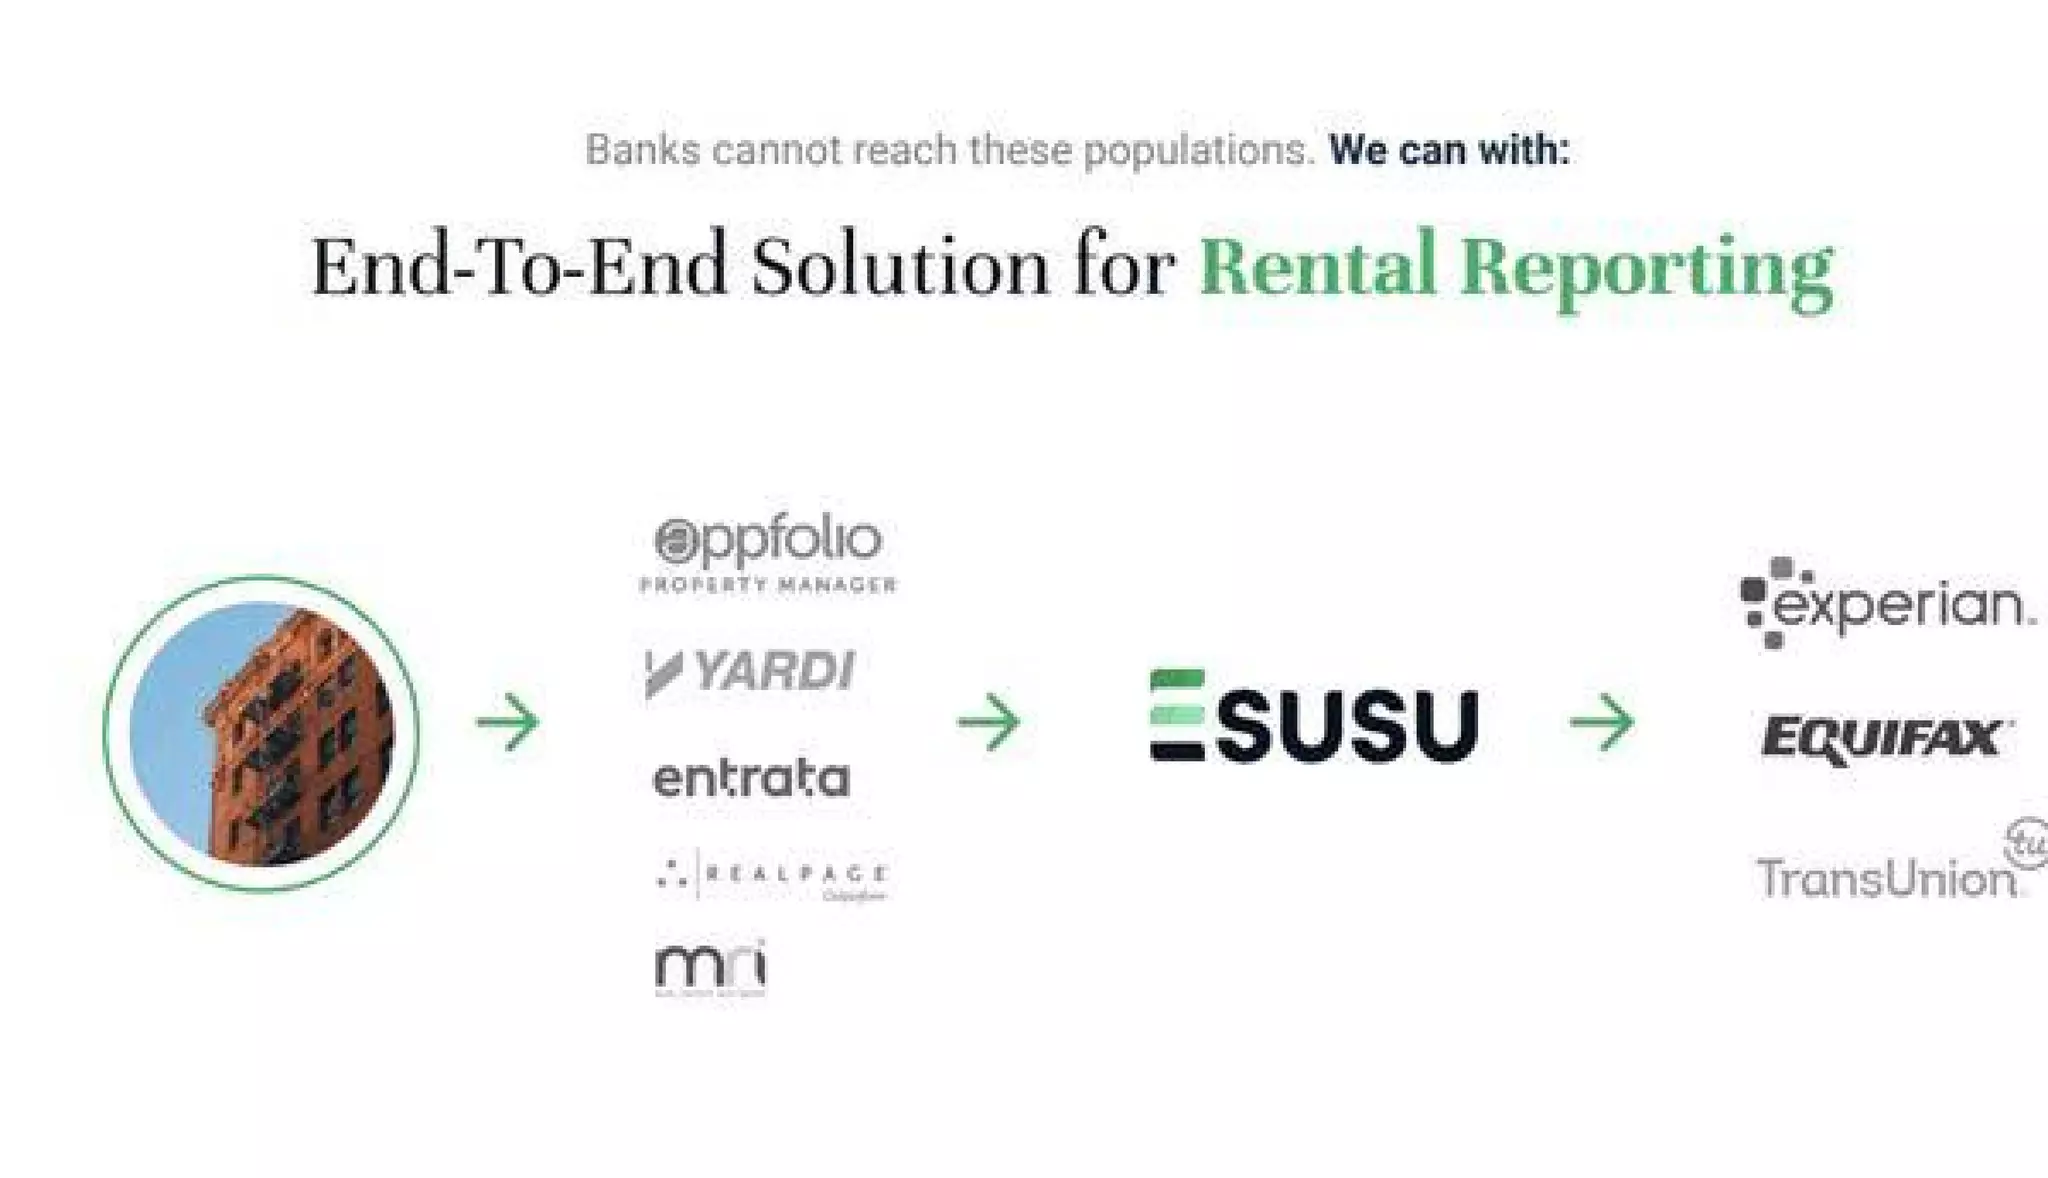
Slide 3 maps the product flow: property managers and listing/PMS platforms feed rental data into Esusu, which then reports to credit bureaus (Experian, Equifax, TransUnion). The logos used (Yardi, AppFolio, Entrata, major bureaus) communicate ecosystem integration and make the solution feel plug-and-play for landlords and financial institutions. The left-to-right arrow flow is intuitive and reduces friction in understanding how the business operates.

This layout is a strong example of using partner logos as credibility signals. It tells investors that Esusu isn't trying to build every part of the stack — instead they integrate with trusted platforms and leverage bureau relationships for distribution and impact. Founders should emulate this: show how data flows through your product and call out recognizable partners to de-risk execution in the eyes of investors.

Key Takeaway: Use a simple flow diagram and partner logos to show how your product integrates into existing infrastructure — this conveys feasibility and distribution channels.
Customer Value: Landlord Proposition

Customer Value: Landlord Proposition

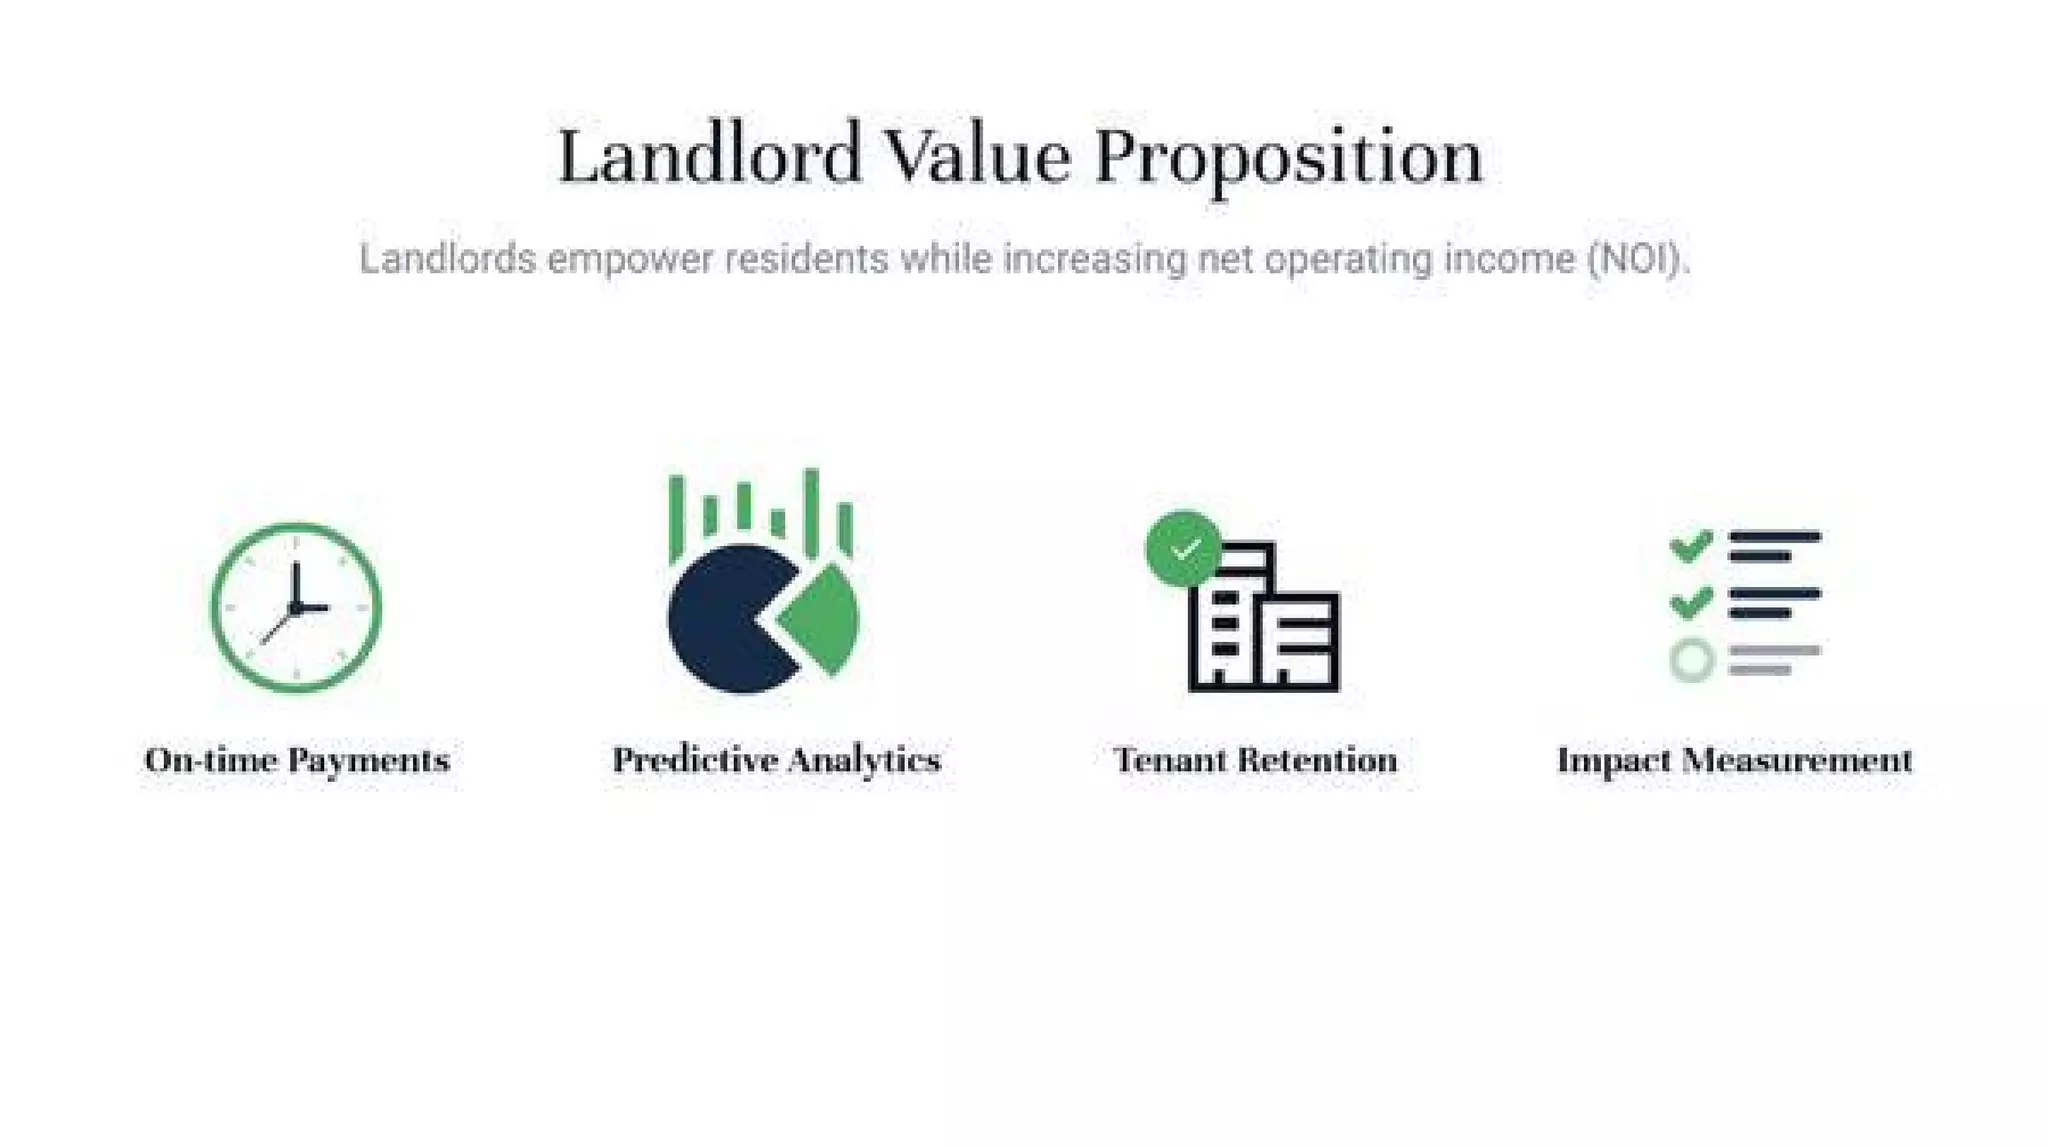
Slide 4 lays out the landlord value prop with four outcomes: on-time payments, predictive analytics, tenant retention, and impact measurement. Icons and short labels make each benefit immediately scannable. Notably, the slide frames the product as revenue/ops-improving for landlords (NOI improvement) rather than purely altruistic, which is crucial for commercial adoption.

This slide demonstrates how to bridge user benefit and customer ROI. By translating tenant-focused functionality into landlord economic outcomes, the team shows path to monetization. Founders should ensure each buyer-focused slide links product features to quantifiable business metrics (e.g., reduced churn, higher rent collection), as this is what convinces paying customers and investors.

Key Takeaway: Frame product benefits in the buyer’s language (ROI, NOI, retention) and make the economic case clear and concrete.
Validation: Third-party Data That Supports the Thesis

Validation: Third-party Data That Supports the Thesis

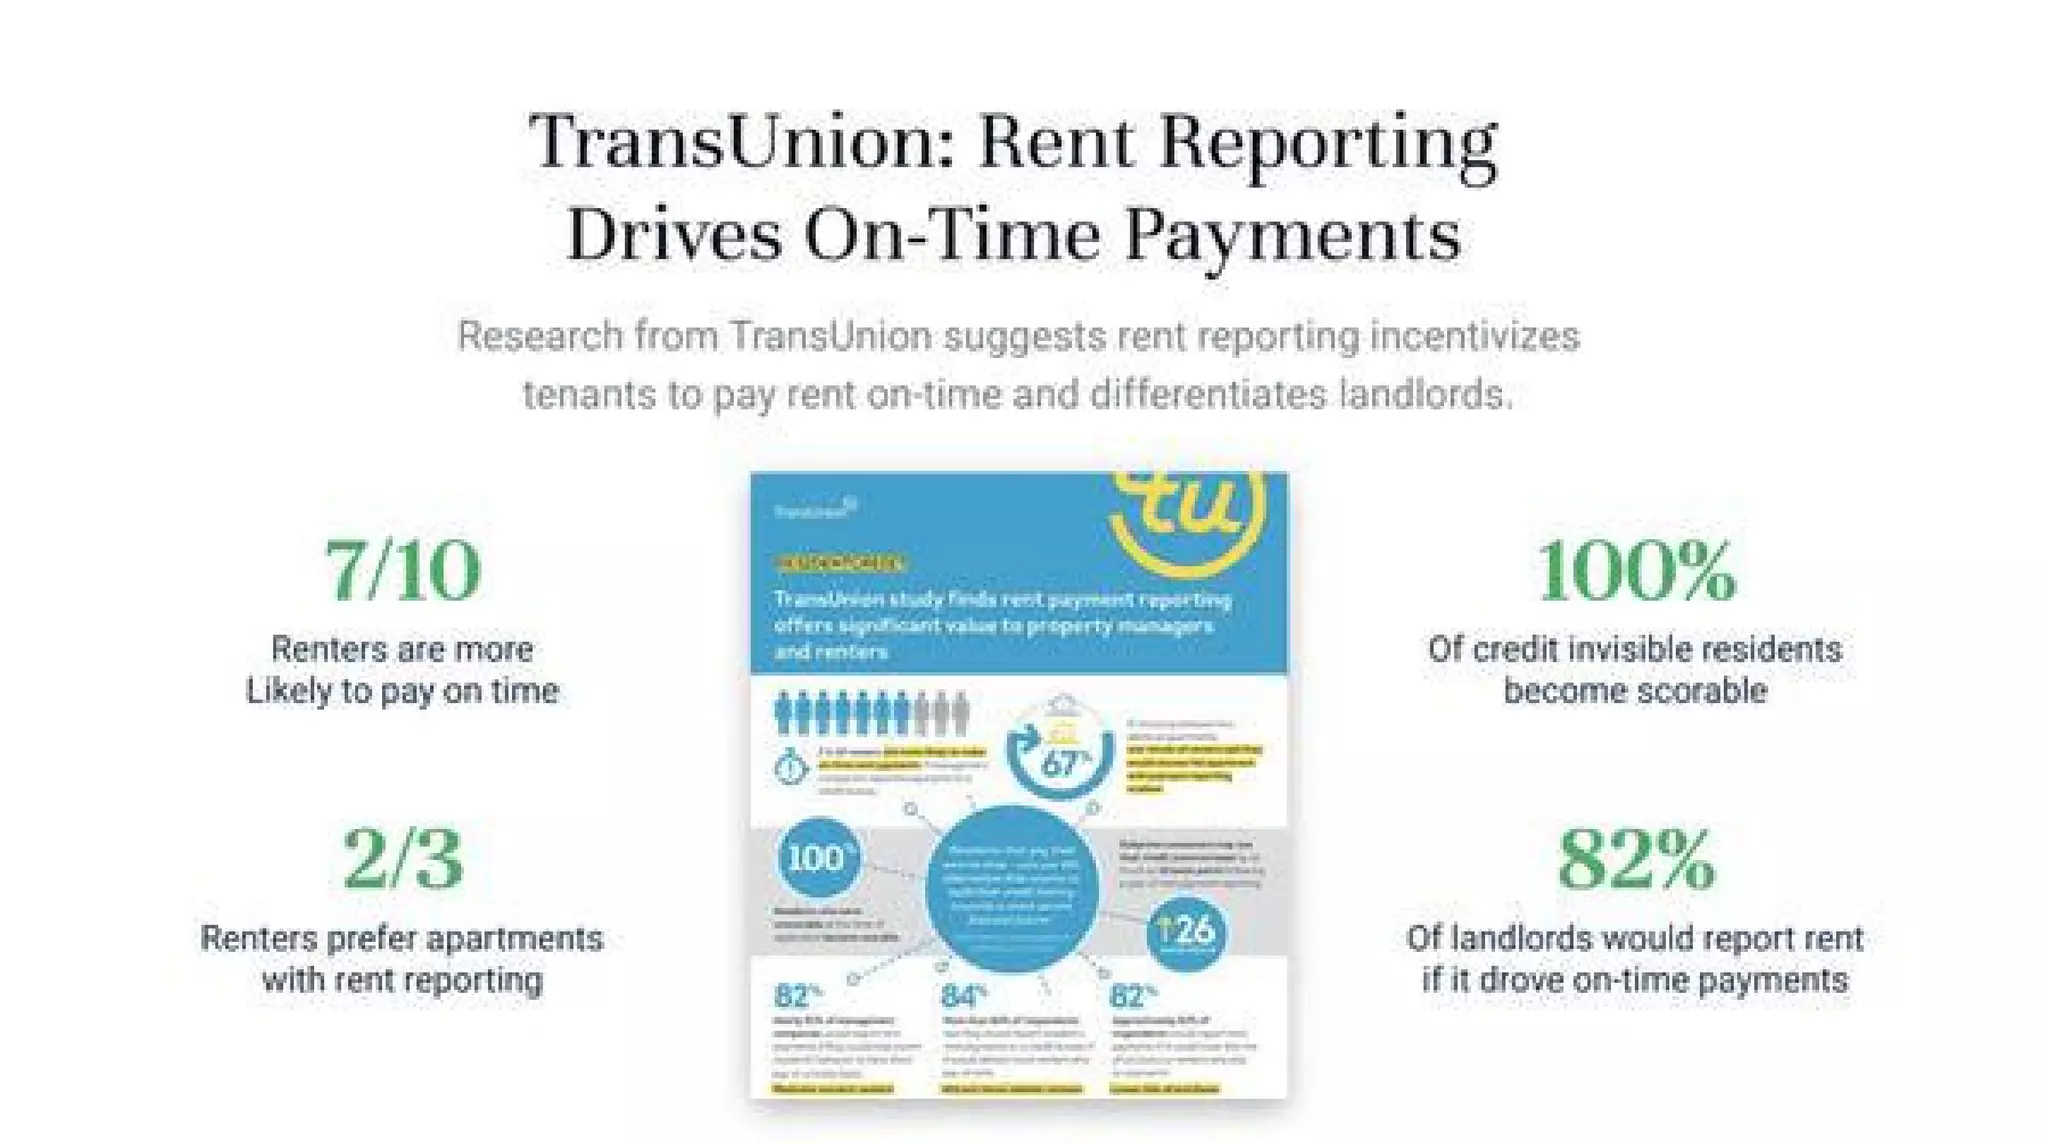
Slide 6 (TransUnion research) uses third-party evidence to validate core claims: rent reporting drives on-time payments, makes credit invisible renters scorable, and landlords would report if it improved payments. The statistics (7/10 renters more likely to pay on time, 100% of credit invisible become scorable, 82% of landlords would report) provide social proof that the intervention works and that the market will adopt it.

This is an effective investor-facing tactic: external validation reduces execution risk and strengthens the business case. Rather than relying solely on internal pilot data, citing an authoritative industry source like TransUnion provides credibility to both the behavioral and technical claims. Founders should seek and prominently feature reputable third-party validation that supports their key assumptions.

Key Takeaway: Include independent, reputable validation (industry reports, studies) to substantiate your behavioral and business assumptions and reduce perceived risk.
Go-to-Market & Traction: One-to-many Distribution and Early Growth

Go-to-Market & Traction: One-to-many Distribution and Early Growth

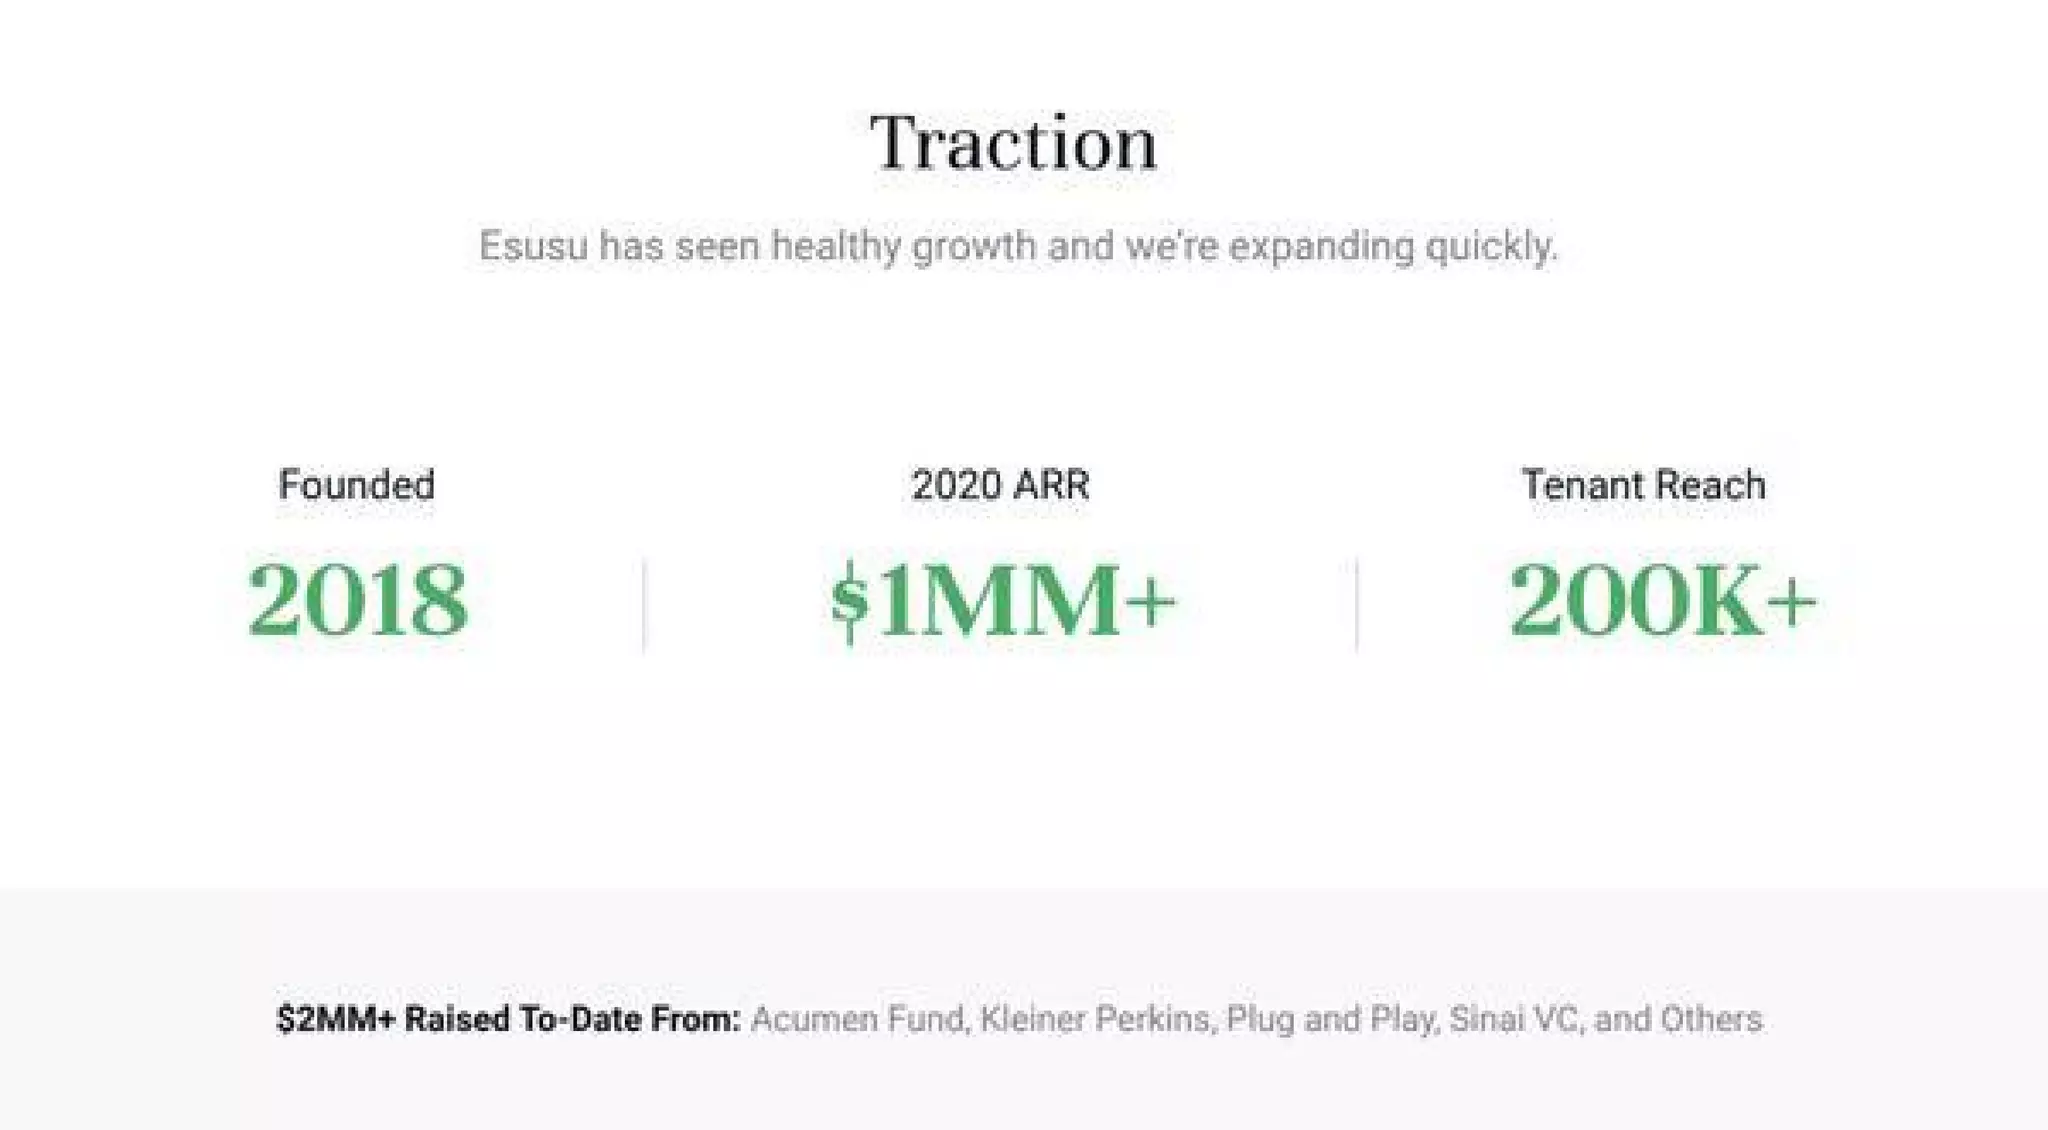
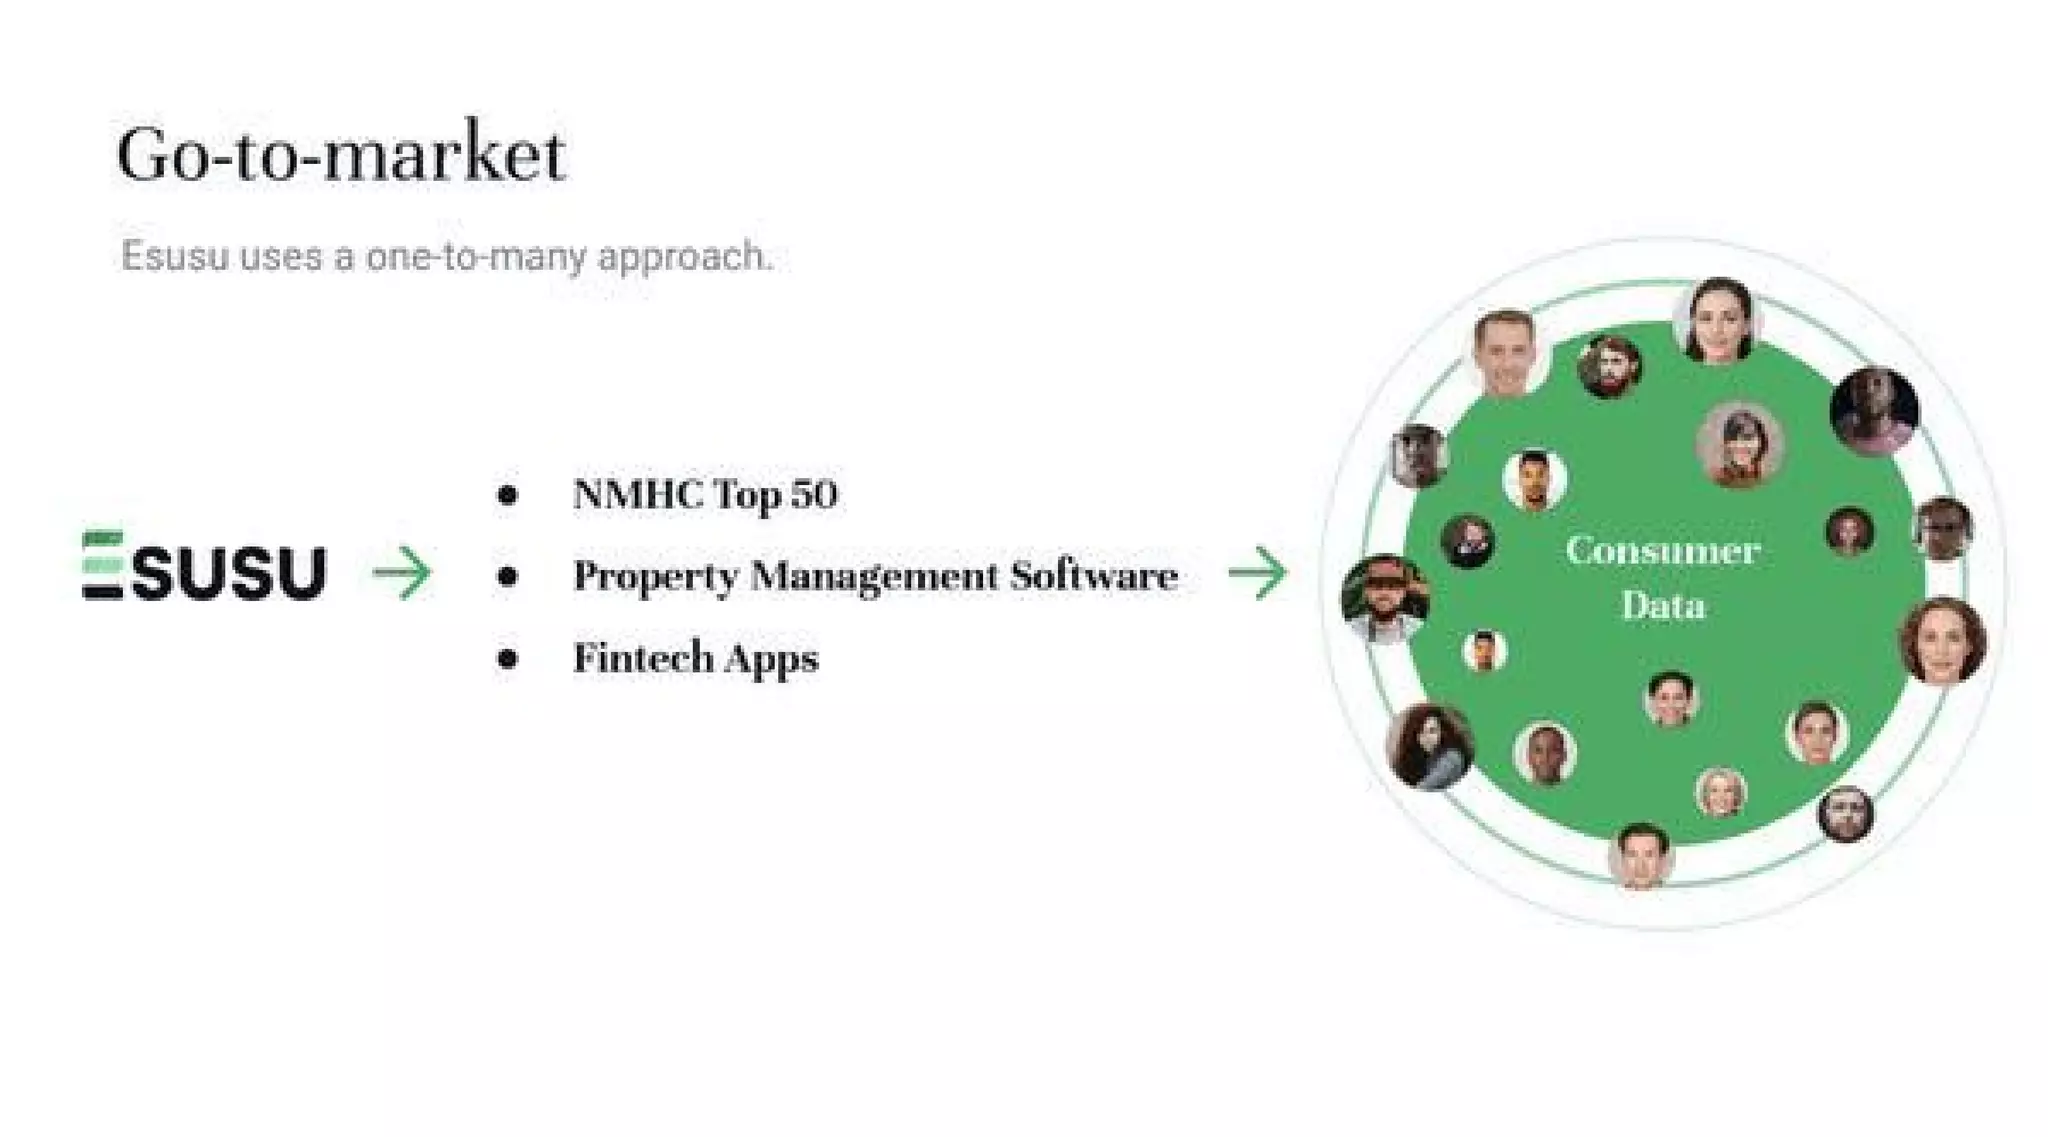
Slide 8 outlines a one-to-many GTM approach: target NMHC Top 50, property management software, and fintech apps to access consumer data at scale. The circular 'consumer data' visual implies network effects and compounding reach. Slide 9 (Traction) states founding year (2018), 2020 ARR of $1MM+, and tenant reach of 200K+, plus $2MM+ raised to date, which together signal early commercial validation and momentum.

These slides are effective because they pair a clear distribution strategy with concrete traction metrics. Investors look for repeatable GTM and evidence it’s working; Esusu communicates both. Founders should articulate a specific channel strategy (who they sell through and why) and back it up with hard numbers on ARR, users, and partnerships to demonstrate early product-market fit.

Key Takeaway: Present a defensible, repeatable GTM with concrete early traction numbers — show both strategy and evidence that it scales.
Team & Commitment: Founders with Relevant Domain and Product Experience

Team & Commitment: Founders with Relevant Domain and Product Experience

Slide 11 presents the team with roles and prior company affiliations (Goldman Sachs, LinkedIn, PayPal, PwC, Accenture). Photos, concise role labels, and previous employer logos communicate credibility and complementary skill sets across sales, product, data, and operations. The presence of operators and technologists signals the ability to execute both in the enterprise real estate ecosystem and in building a compliant data product.

This team slide is effective because it balances pedigree with role clarity; investors can quickly see who will run sales, tech, product, and finance. For founders, the lesson is to highlight domain relevance and past outcomes: show why this particular combination of people increases the probability of success and mitigates execution risk.

Key Takeaway: Showcase a balanced team with clear roles and relevant prior experience — make it easy for investors to see why this team can execute.

Conclusion: Key Lessons

Esusu’s deck is a strong example of clarity, credibility, and focus: it pairs a bold vision with a defensible market calculation, a simple product flow, buyer-focused value propositions, third-party validation, GTM strategy, and measurable traction. The visuals are clean and consistent, partner and bureau logos are used as trust signals, and the team slide ties execution capability to the thesis.

Actionable advice for founders: open with a single high-level claim that ties impact to market opportunity; quantify your TAM with sourced numbers; illustrate end-to-end data and partner flows; translate features into buyer ROI; include independent validation to derisk assumptions; and present early traction and a complementary team. Together these elements create a coherent, investable narrative that balances mission and monetization.

Full Deck Analysis

11 sections

Overview

Company: Esusu
Round: Seed ($2.3M)
Year: 2019
Outcome: Valued at $1.2B (2025)

Executive Summary

Esusu is a B2B2C fintech focused on rent-reporting to credit bureaus to convert “credit invisible” renters into scorable consumers and unlock capital for financial services. The seed deck presents a large, simple TAM ($3T deployable capital), early product integrations with major property management platforms, and early traction (2018 founding; 2020 ARR $1M+; 200K+ tenant reach). The deck is notable for clear buyer channels (landlords / property managers), strong partnerships, and a mission-driven impact narrative.

Problem Statement

  • Financial institutions cannot reach low- and moderate-income (LMI) customers because many renters are “credit invisible” (Slide 2).
  • Lack of rental payment data in credit files prevents tenants from accessing mainstream credit and forces landlords to bear rent collection friction (Slides 2, 3).
  • Banks and lenders therefore miss a large pool of deployable capital and renters miss opportunities to build credit (Slide 2 & Slide 9).

(Specific references: Slide 2 quantifies the “credit invisible” population and the dollar value; Slide 9 summarizes tenant impact.)

Solution

  • Esusu positions itself as an end-to-end rental reporting platform that:
    • Integrates with property management systems (AppFolio, Yardi, Entrata, RealPage, MRI) to ingest rent/payment data (Slide 3).
    • Reports verified rental payment histories to major credit bureaus (Experian, Equifax, TransUnion) (Slide 3).
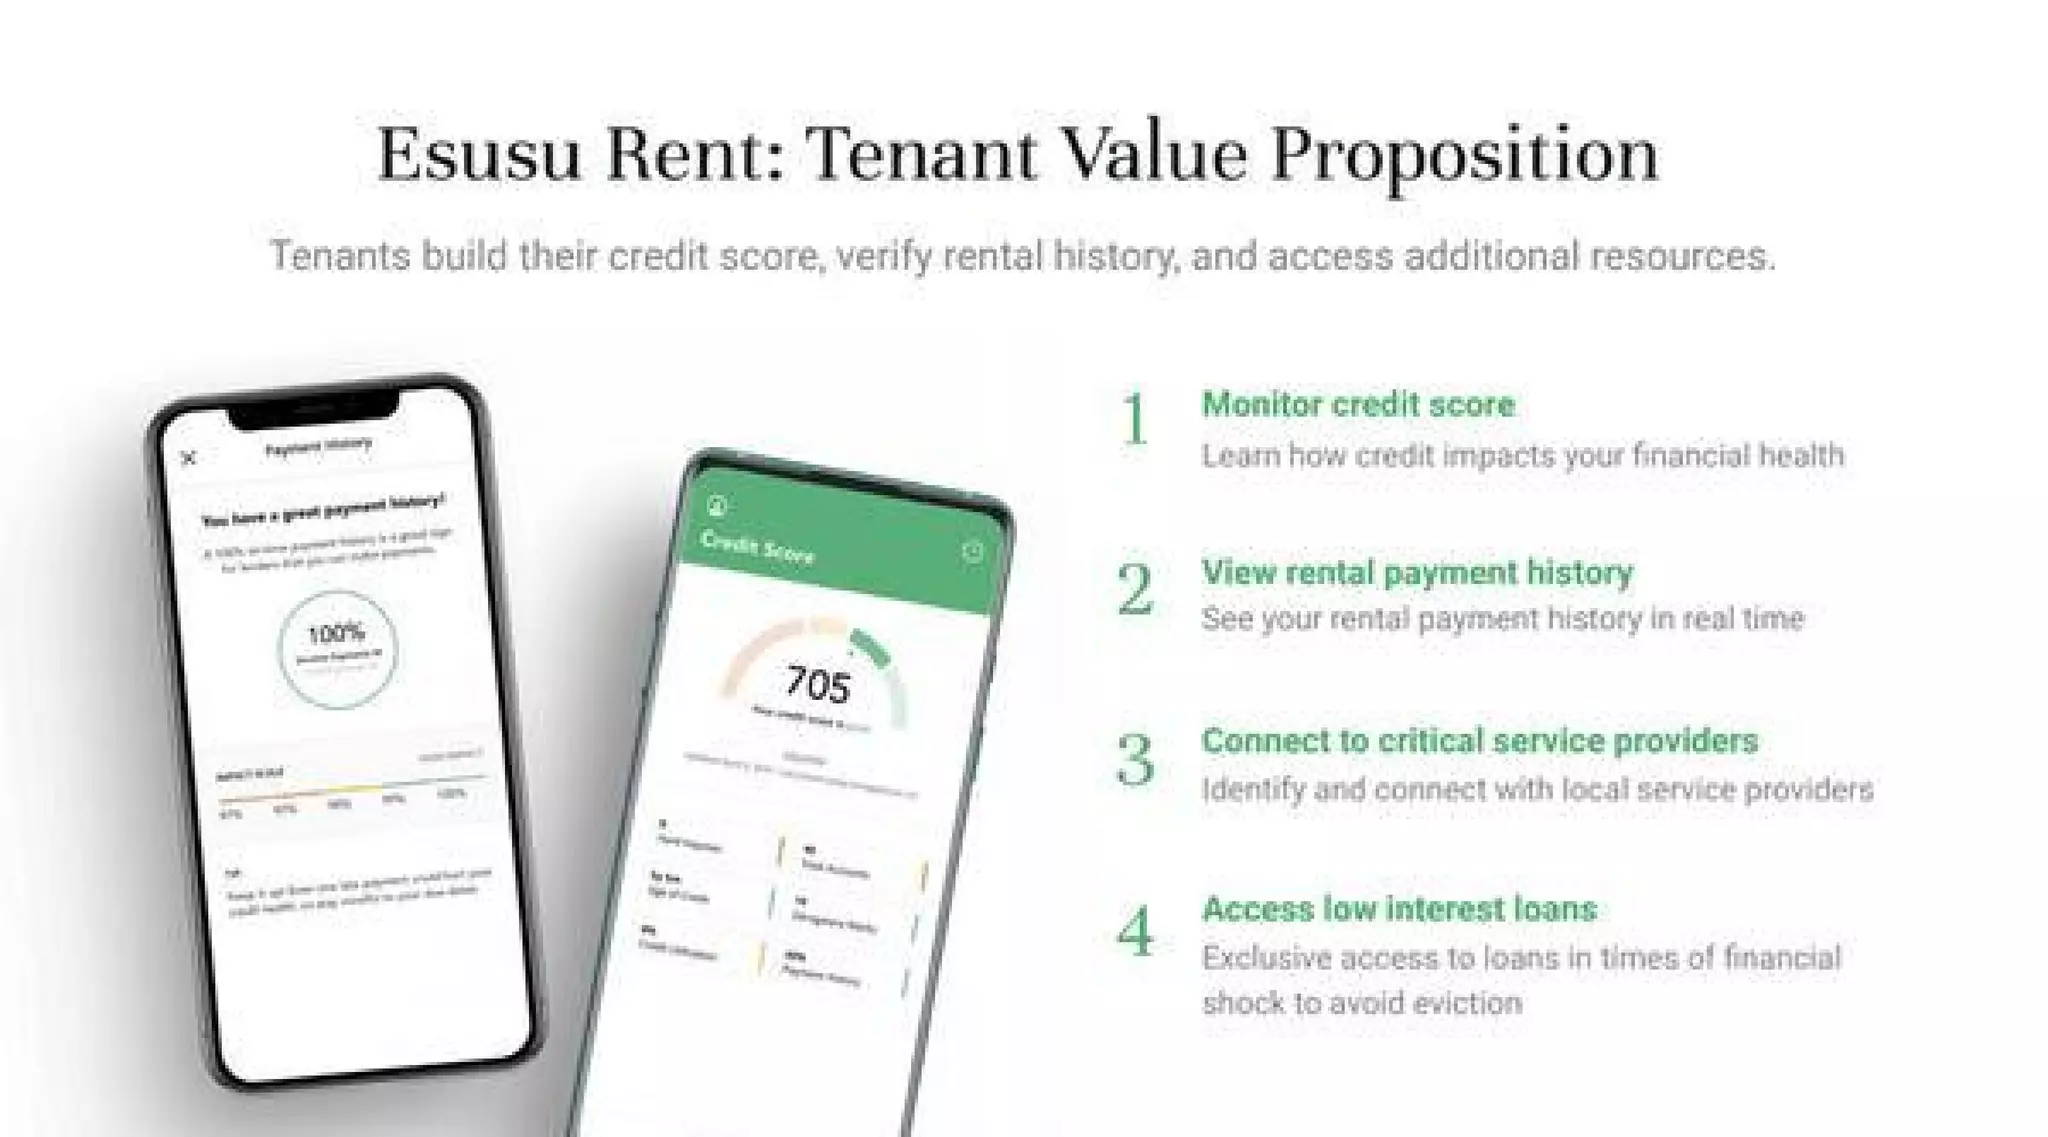
    • Provides a tenant-facing app with credit monitoring, payment history, service connections and access to low-interest loans (Slide 6).
    • Delivers landlord value via on-time payments, predictive analytics, tenant retention and measurable impact (Slide 4).

Market Opportunity

  • TAM shown explicitly: $3T “Deployable Capital” derived from:
    • 22.5M credit invisible individuals × $135K average debt = $3T (Slide 2).
  • The deck does not break down SAM/SOM explicitly. No granular geography, vertical sizing, or time-phased serviceable market is provided.
  • Implication: large macro TAM is emphasized but addressable market and early penetration assumptions are not detailed.

Business Model

  • The deck does not state a line-item pricing model or unit economics. Implied revenue streams:
    • SaaS/subscription or per-unit reporting fees from landlords / property managers or from property management software partners (Slide 3 & 7 go-to-market).
    • Data licensing or indirect monetization via partnerships with credit bureaus/fintechs (Slide 3 integrations).
    • Potential marketplace or loan facilitation fees for access to low-interest loans to tenants (Slide 6).
  • Unit economics (CAC, ARPU, LTV) and margins are not shown.

Traction & Metrics

  • Founding year: 2018 (Slide 8).
  • 2020 ARR: $1MM+ (Slide 8).
  • Tenant reach: 200K+ (Slide 8).
  • Capital to date (as shown): $2MM+ raised to-date (Slide 8). (Company context provided by you: $2.3M raised.)
  • TransUnion research claims shown as validation metrics (Slide 5):
    • 7/10 renters are more likely to pay on time when rent is reported.
    • 2/3 renters prefer apartments with rent reporting.
    • 100% of “credit invisible residents become scorable” (presentation claim).
    • 82% of landlords would report rent if it drove on-time payments.
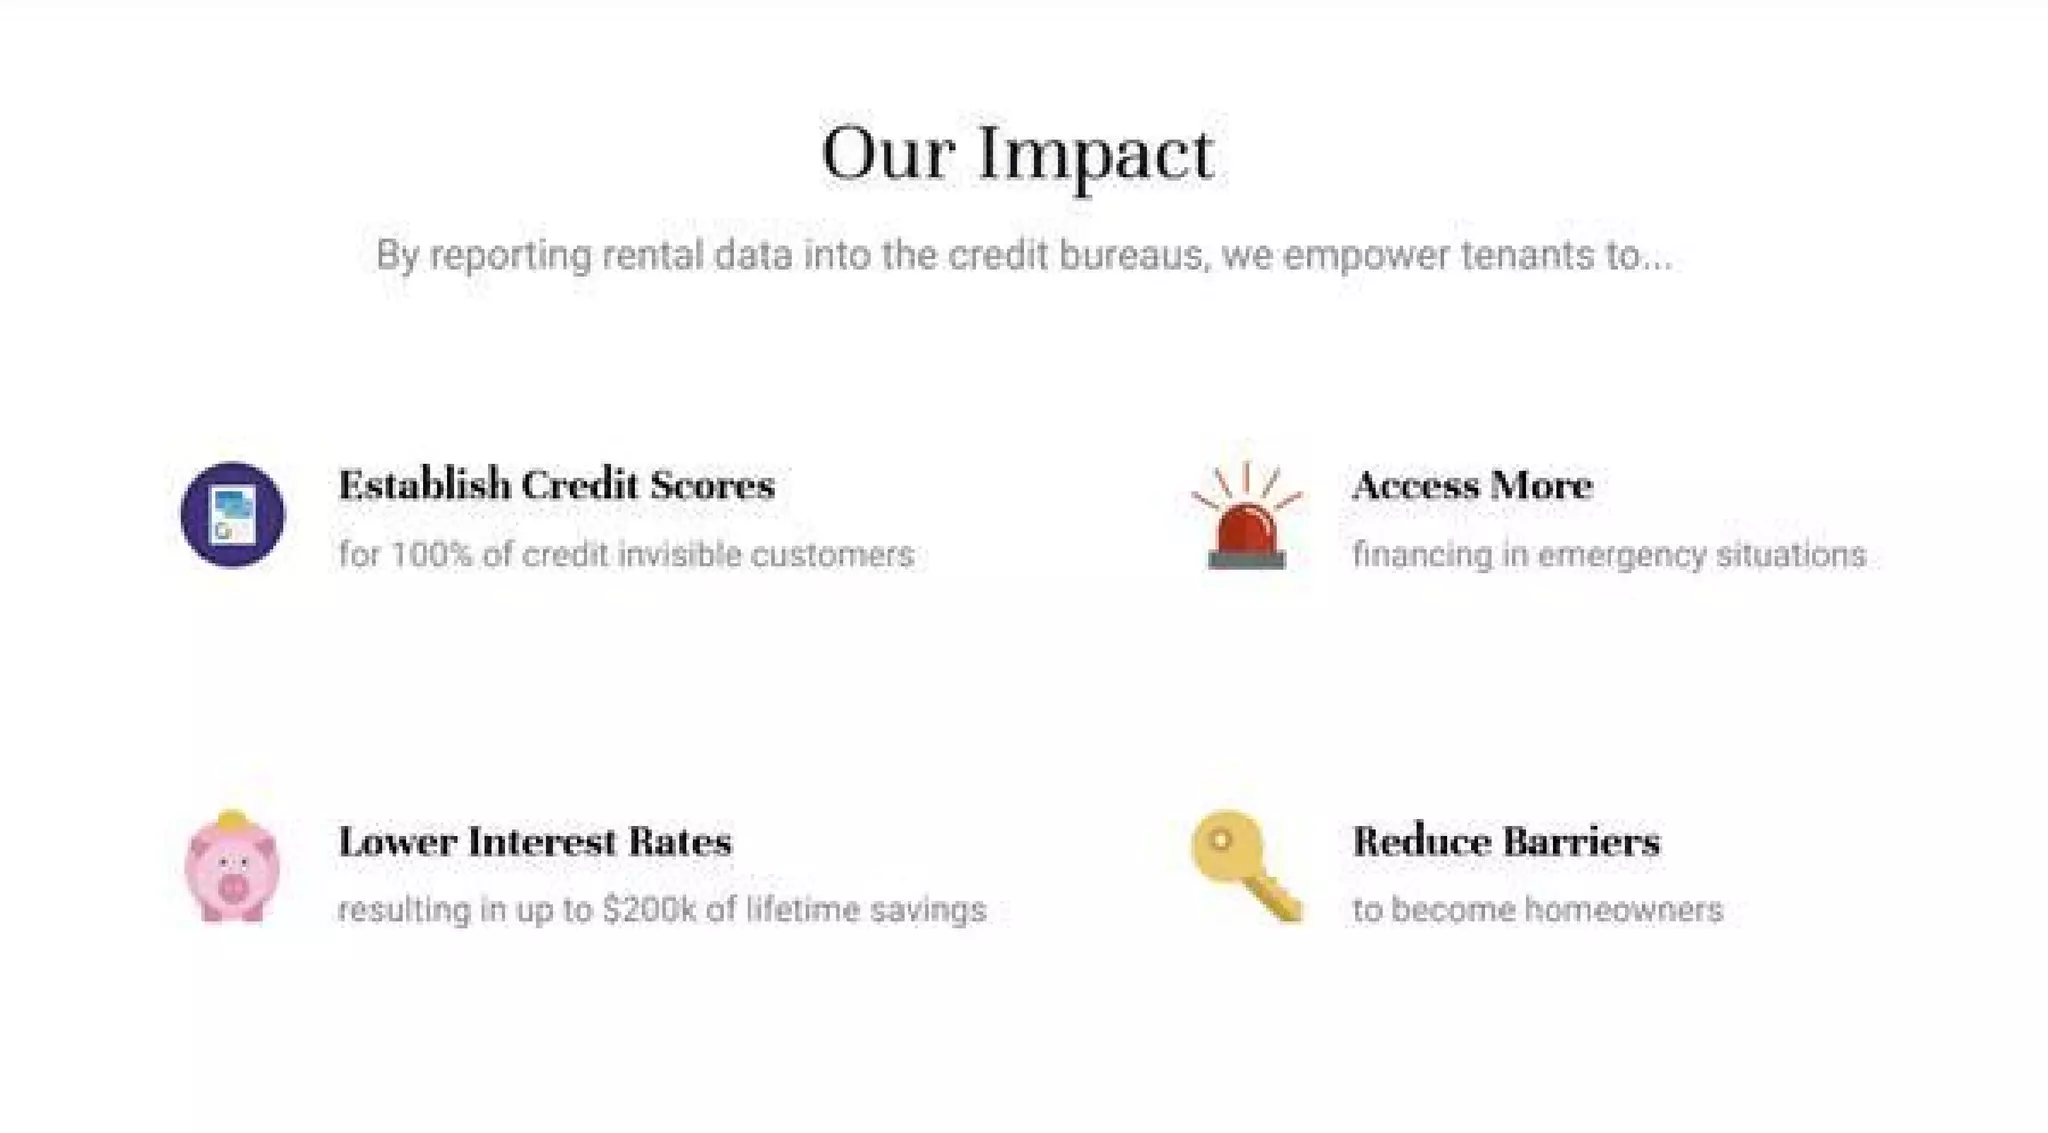
  • Impact claims (Slide 9): establish credit scores for 100% of credit invisible customers; lower interest rates could result in up to $200K of lifetime savings (per-customer claim is not fully sourced in the deck).

Competitive Positioning

  • Differentiators highlighted:
    • Direct integrations with leading property management platforms (Slide 3) — lowers friction to deploy at scale.
    • End-to-end product: landlord tools + tenant app + reporting to bureaus (Slides 3, 4, 6).
    • Focus on converting “credit invisible” population (clear niche & social impact angle).
    • Early validation via TransUnion statistics and bureau partnerships.
  • The deck does not show a competitive matrix or list direct competitors (e.g., other rent-reporting startups), nor explain defensibility beyond integrations and partnerships.

Team

  • Multi-disciplinary founding and leadership team (Slide 10). Roles/credentials emphasized:
    • Founders with backgrounds in sales/strategy, finance and technology (some prior experience at Goldman Sachs, LinkedIn, PayPal, PwC, Accenture, and university credentials shown on slide).
    • Product, data science and operations leaders with relevant prior employers.
  • Team slide projects credibility through known company names and diverse functions (product, data, ops, finance).

Go-to-Market Strategy

  • One-to-many approach focused on channel distribution through:
    • NMHC Top 50 property owners (enterprise landlords) (Slide 7).
    • Property management software integrations (AppFolio, Yardi, Entrata, RealPage, MRI) (Slide 3 & 7).
    • Fintech apps as partners (Slide 7).
  • Strategy: embed via software partners and large property managers to scale tenant data capture (Slide 7 diagram).

The Ask

  • The deck appears to be a Seed pitch. Company context indicates $2.3M raised at seed. The slides show “$2MM+ Raised To-Date” (Slide 8).
  • The deck does not explicitly show a detailed use-of-funds slide (breakdown for product, hiring, GTM, runway) or a specific ask line-item within the slides provided.

Investor Deep Dive

Executive summary, strengths & red flags

Executive Summary

Esusu is a B2B2C fintech focused on rent-reporting to credit bureaus to convert “credit invisible” renters into scorable consumers and unlock capital for financial services. The seed deck presents a large, simple TAM ($3T deployable capital), early product integrations with major property management platforms, and early traction (2018 founding; 2020 ARR $1M+; 200K+ tenant reach). The deck is notable for clear buyer channels (landlords / property managers), strong partnerships, and a mission-driven impact narrative.

Key Strengths

3 identified

1

Clear, compelling macro opportunity: Slide 2 uses a simple calculation (22.5M × $135K = $3T) to create an attention-grabbing TAM that ties directly to the product’s value proposition.

2

Channel-focused GTM with strong integration story: Logos of major property management platforms (Slide 3) and explicit channel strategy (Slide 7) make it clear how Esusu can scale distribution.

3

Early traction and social impact validation: 2020 ARR $1MM+, 200K+ tenant reach and TransUnion stats (Slides 5 & 8) give credible early signal and a strong “impact + business” narrative.

Red Flags & Weaknesses

3 identified

1

Lack of unit economics / revenue model detail: No ARPU, CAC, LTV, pricing, or margin data — hard to evaluate scalability and capital efficiency.

2

Overly broad TAM presentation without SAM/SOM: The $3T figure is persuasive but presented without explanation of realistic serviceable market, timeline, or achievable penetration (Slide 2).

3

Bold claims without sourcing or nuance: Statements like “100% of credit invisible residents become scorable” (Slide 5) and lifetime savings up to $200k (Slide 9) lack supporting methodology or references; investors would ask for validation and cohort analysis.

More Pitch Decks To Study

Compare structure, fundraising context, and investor-facing story across similar startup decks.