Compare your deck to Carta

Compare Your Deck

Carta Pitch Deck (2013)

Fintech
Stage: Seed
Raised: $1.8M
Year: 2013
Slides: 41
Outcome: Valued at $7.4B after Series G (2021)

Pitch Deck

1 / 41
Carta pitch deck - Cover & positioning: a clean, confident opener
Click to expand

Deck Analysis

This deck is an early Series A investor presentation from Carta (then eShares) that lays out a focused fintech play: become the transfer agent and cap-table standard for private companies as they scale toward IPO. Notable for its clarity, single-minded product positioning, and evidence of traction, the deck combines a regulatory moat (SEC transfer-agent registration), a simple transaction-based pricing model, and early growth metrics to tell a credible story about product-market fit and go-to-market momentum. Founders can learn from its disciplined narrative: problem → regulated advantage → product demonstration → pricing → traction → team.

Cover & positioning: a clean, confident opener

Cover & positioning: a clean, confident opener

The cover slide is minimal and branded: the eShares logo plus the line 'Series A Investor Deck.' The design choice sets an understated, professional tone that signals this is an investor-focused document rather than a marketing brochure. That restraint keeps attention on the narrative that follows and establishes trust before any numbers are shown.
The single-page simplicity also demonstrates discipline — the company is communicating confidence that the product and business case will carry the discussion. For founders, this reinforces the benefit of a strong, uncluttered opener that states who you are and what the deck is (fundraise stage), so investors immediately understand context.

Key Takeaway: Start with a clean, unambiguous cover that establishes the raise stage and brand — it frames the conversation and signals discipline.
Market positioning and competitive map

Market positioning and competitive map

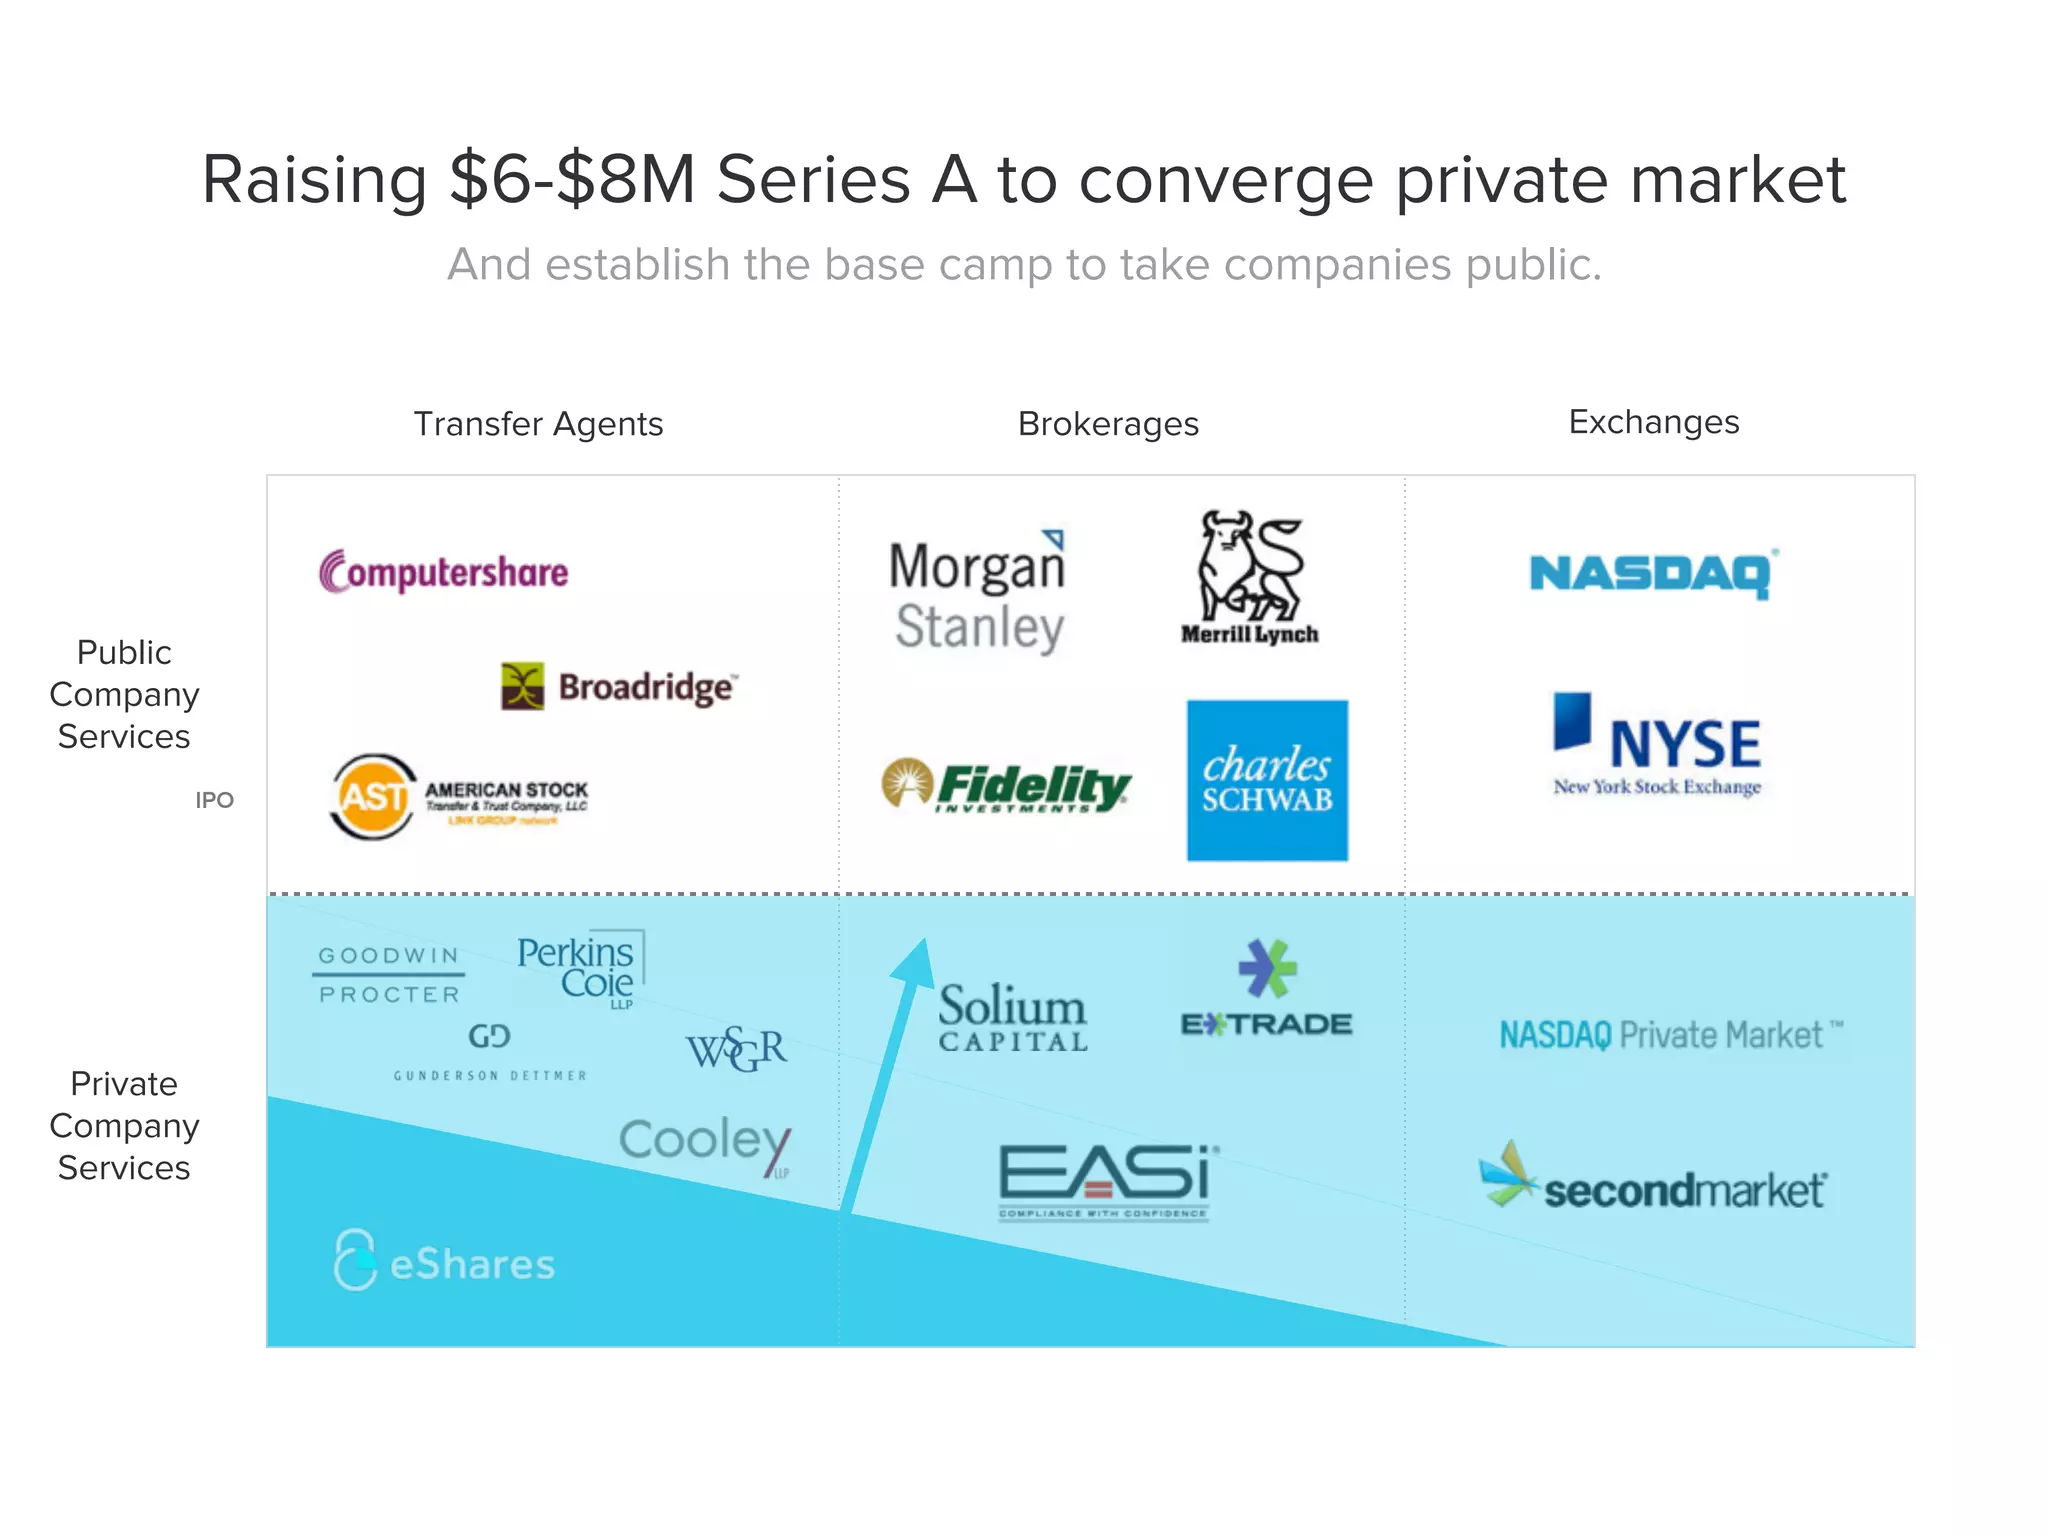
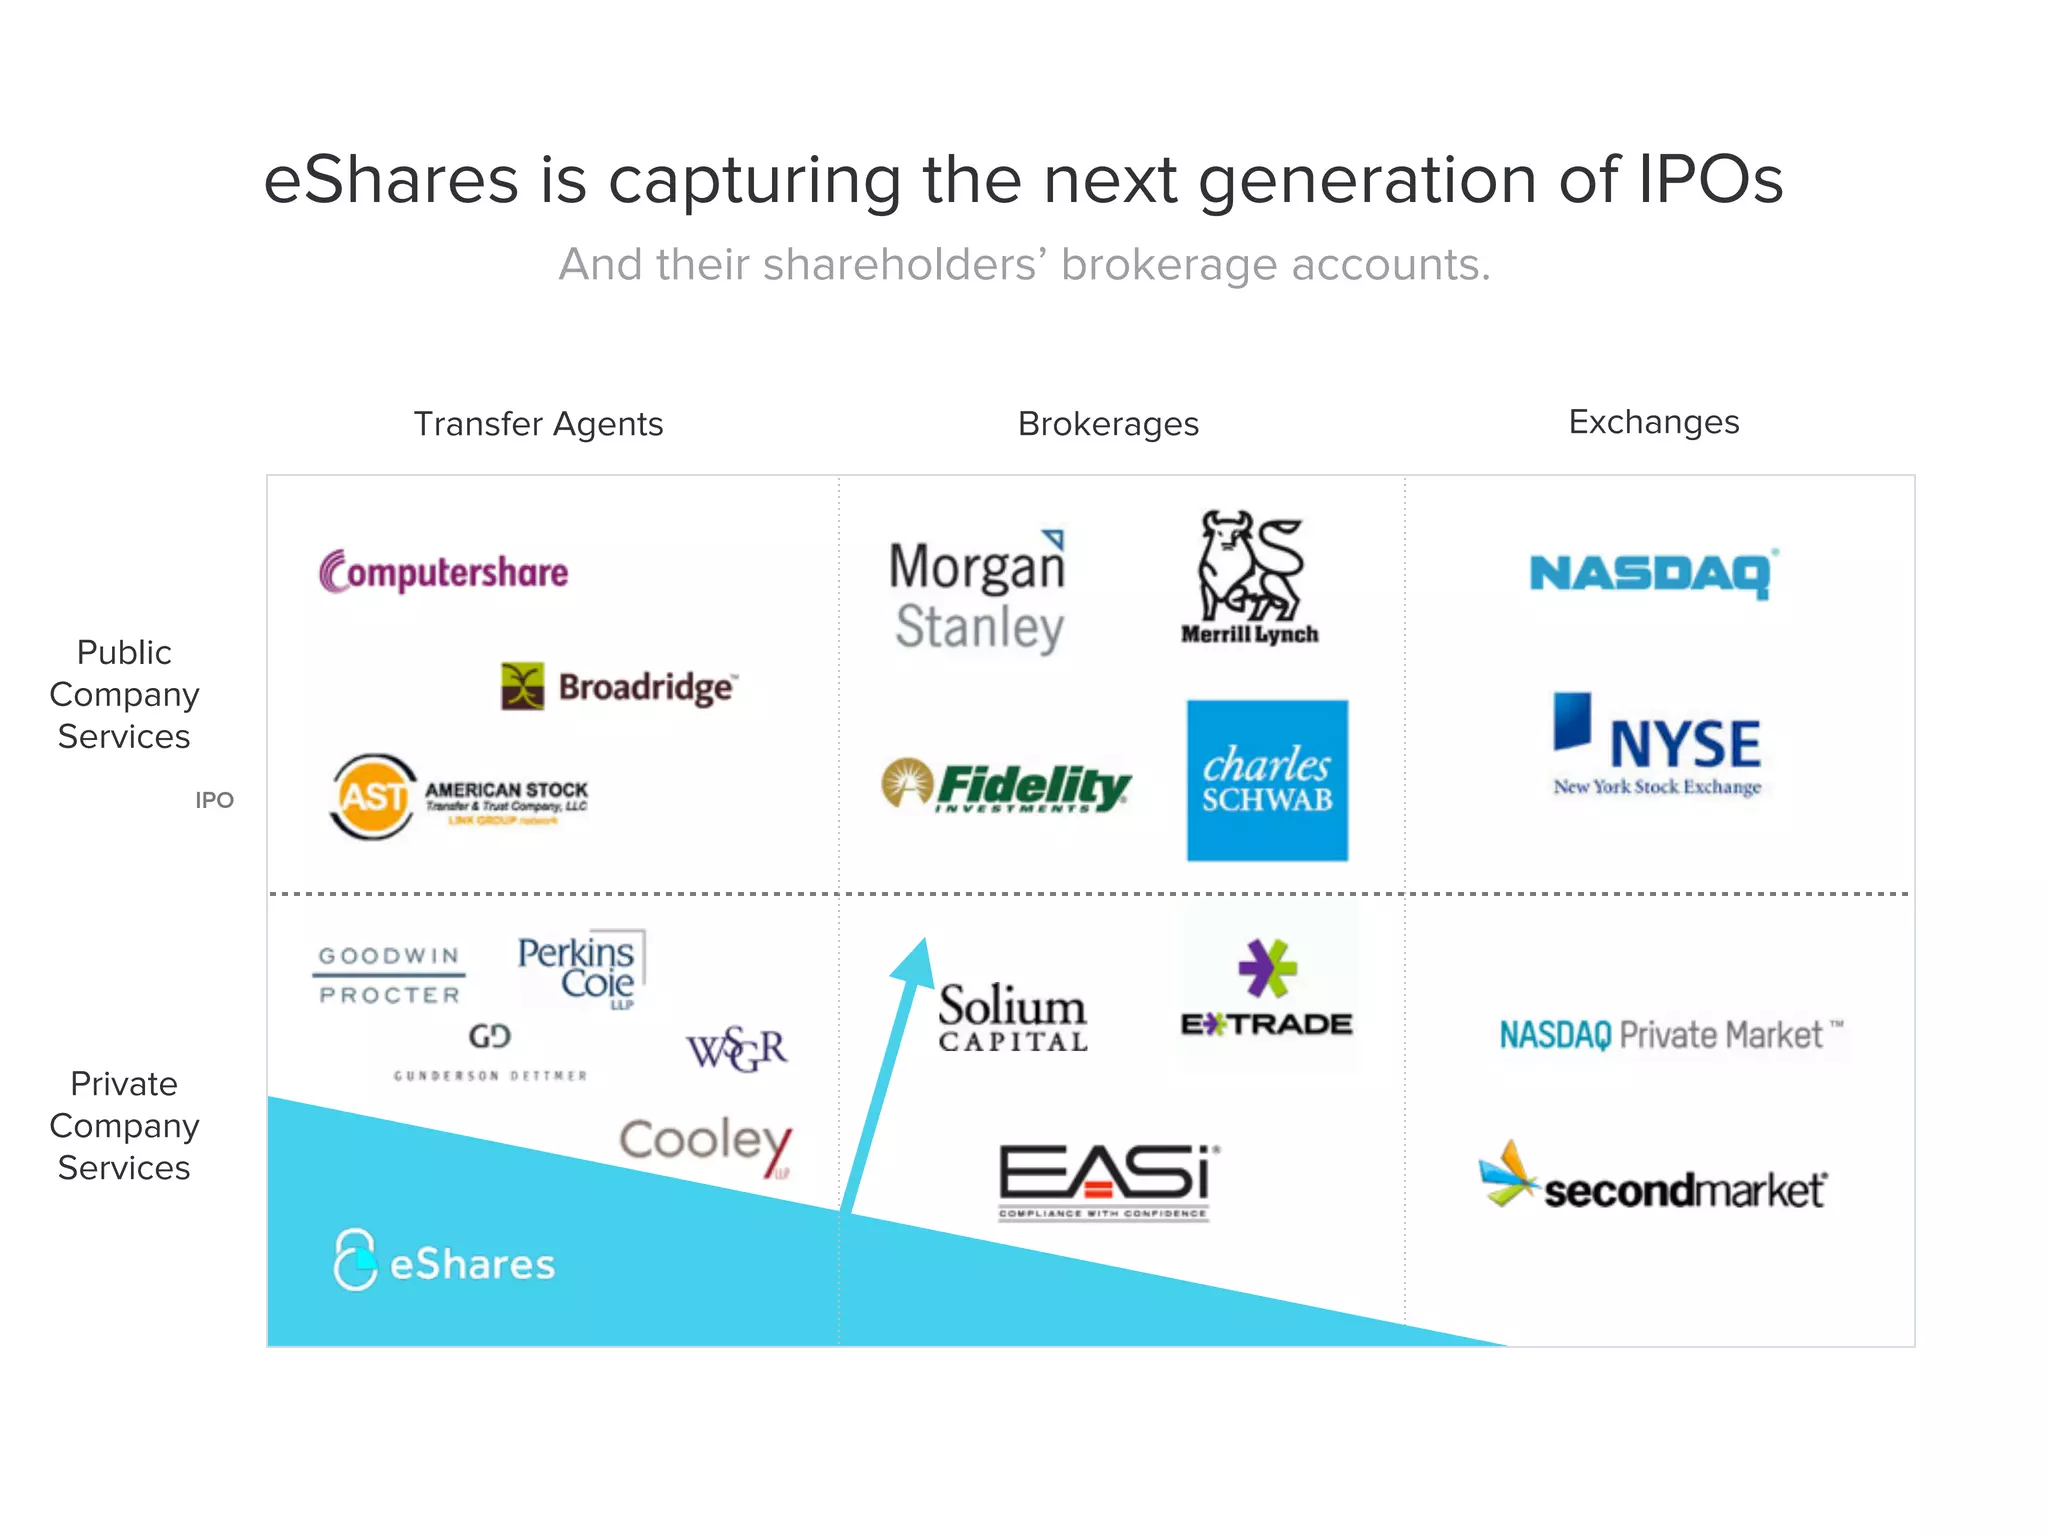
Slide 3 presents a competitive matrix that maps transfer agents, brokerages, and exchanges across public vs private company services. This visual quickly communicates where eShares sits (private-company, bottom-left) and the white space they intend to own. The chart includes incumbent logos (Computershare, Broadridge) to make the size and conservatism of the incumbents obvious while highlighting the opportunity to capture the 'next generation of IPOs'.
Using logos and a simple quadrant helps investors see both the incumbent landscape and the strategic path forward: take the private company segment and move up-market toward IPO services. Founders should emulate this: show where you play, why incumbents are weak in that space, and the natural path to adjacent, higher-value services.

Key Takeaway: Use a simple competitive matrix with familiar logos to immediately convey your beachhead, incumbents' weaknesses, and the logical path to expansion.
Regulatory credibility as moat — SEC transfer agent registration

Regulatory credibility as moat — SEC transfer agent registration

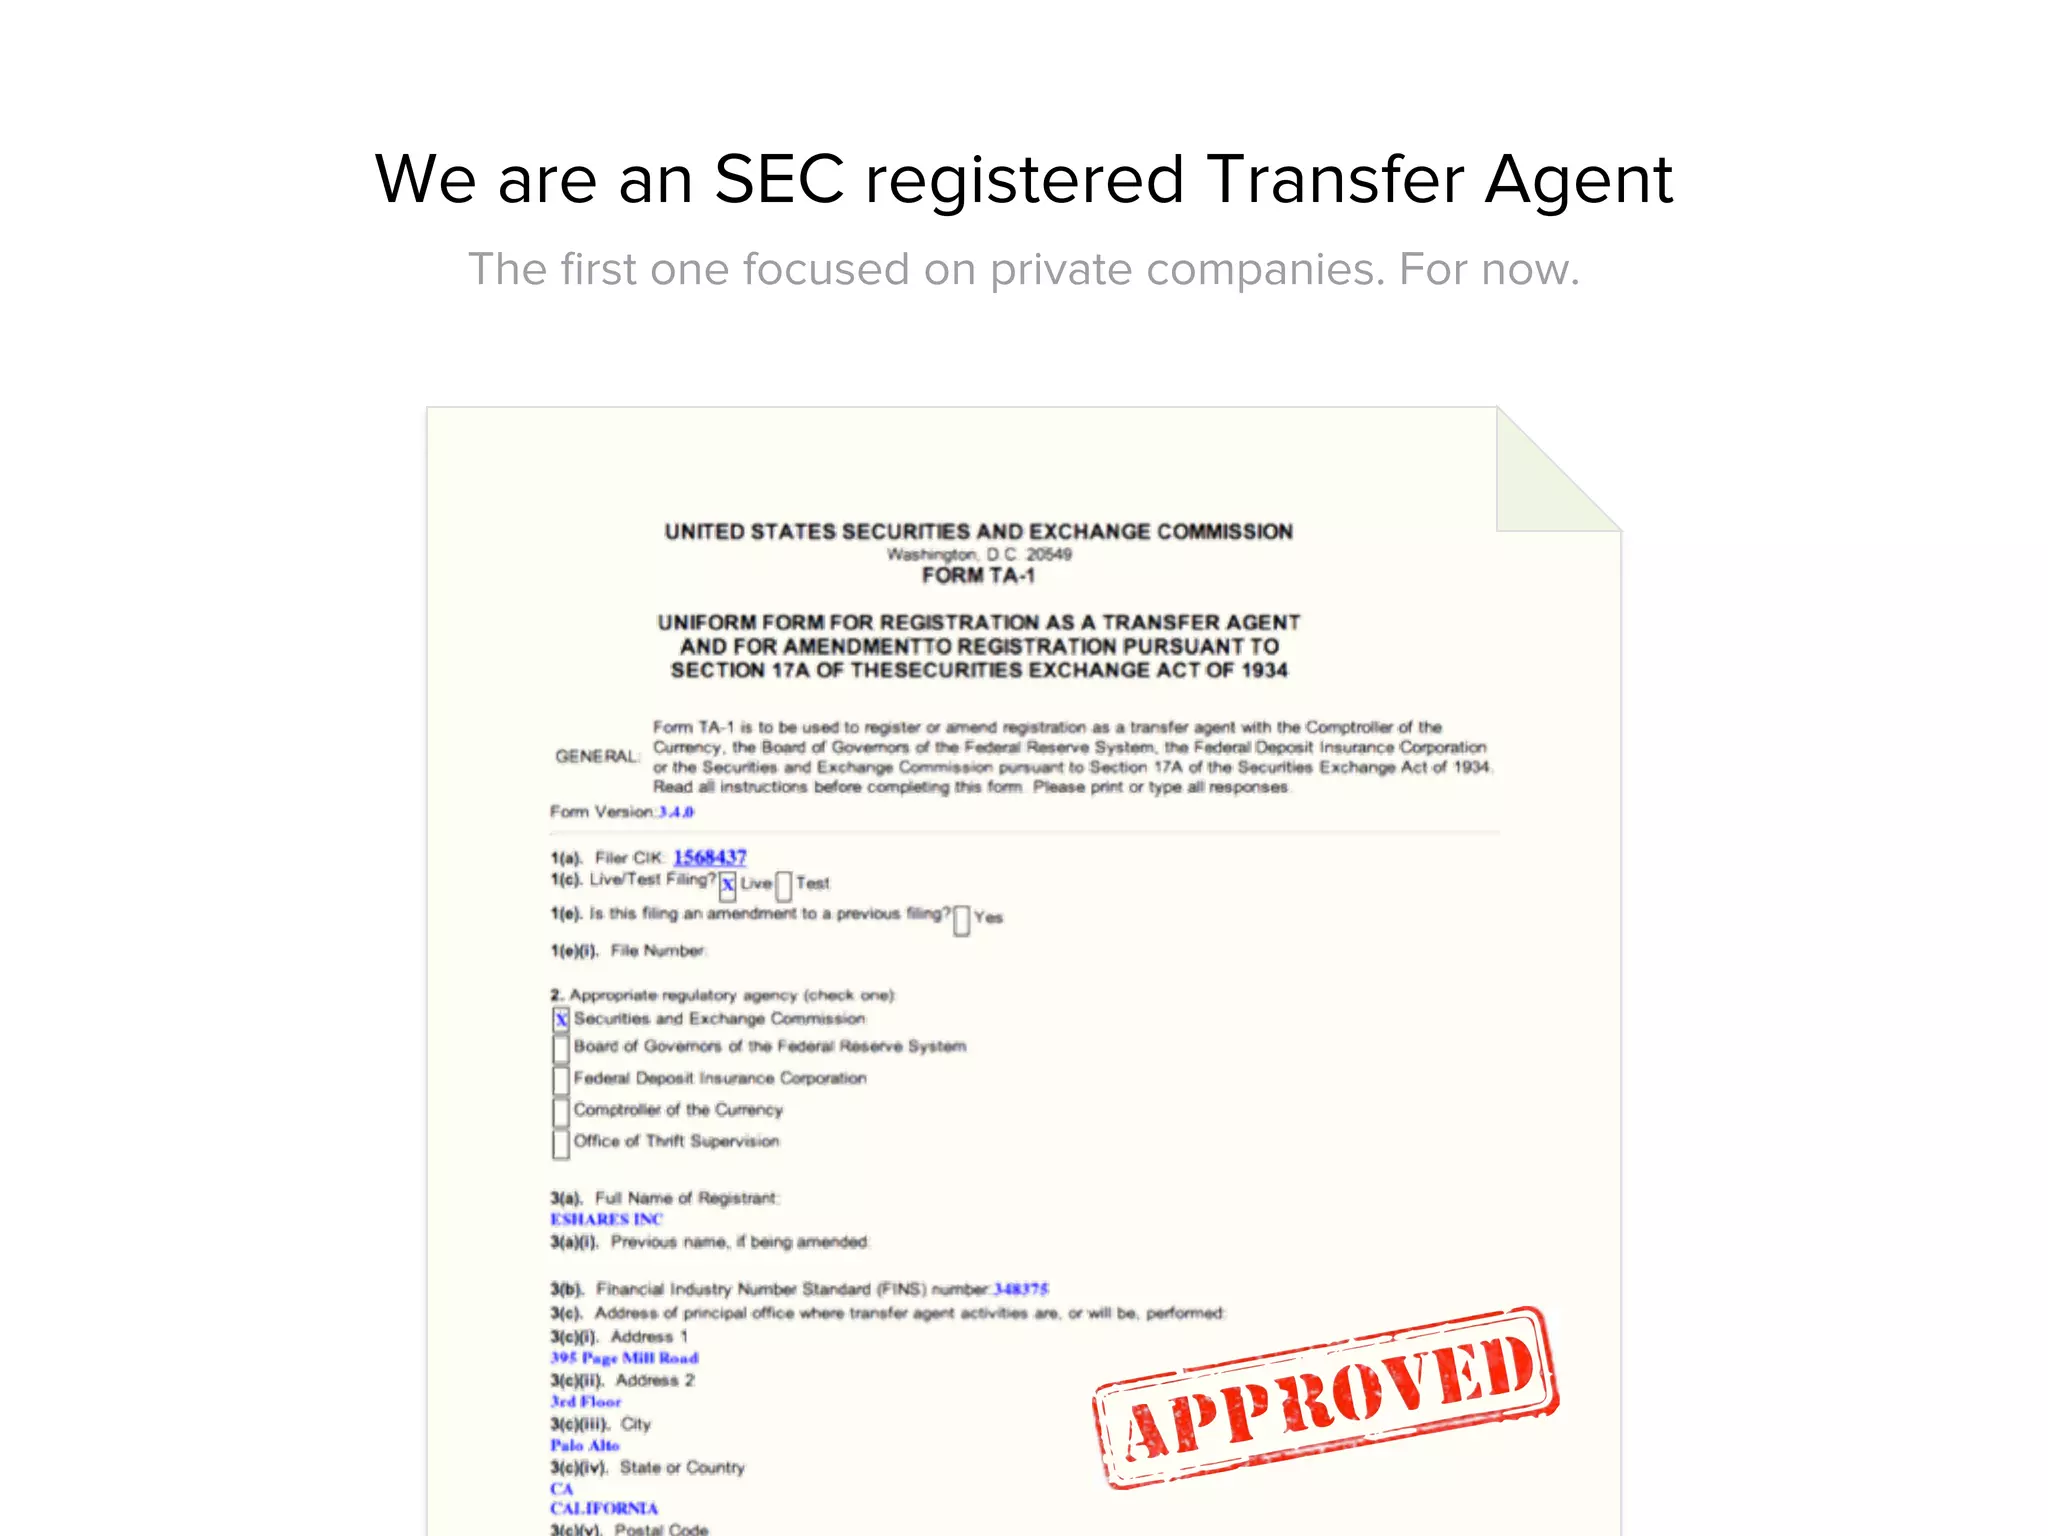
Slide 4 highlights that eShares is an SEC-registered transfer agent, with an image of the registration form stamped 'Approved.' This is a powerful element: for a company operating in the securities infrastructure, regulatory approval is not just a box to check — it's a moat. By leading with the registration, eShares removes a major investor concern about legality and operational risk.
Beyond signaling legitimacy, this slide functions strategically: it differentiates the company from many startups that promise to handle securities but lack the formal permissions. Founders in regulated industries should mirror this approach — surface certifications and approvals early to convert skepticism into confidence and to show you’ve cleared institutional hurdles.

Key Takeaway: In regulated markets, foreground certifications and approvals early — they convert risk questions into competitive advantage.
Product demonstration: issuing and tracking electronic shares

Product demonstration: issuing and tracking electronic shares

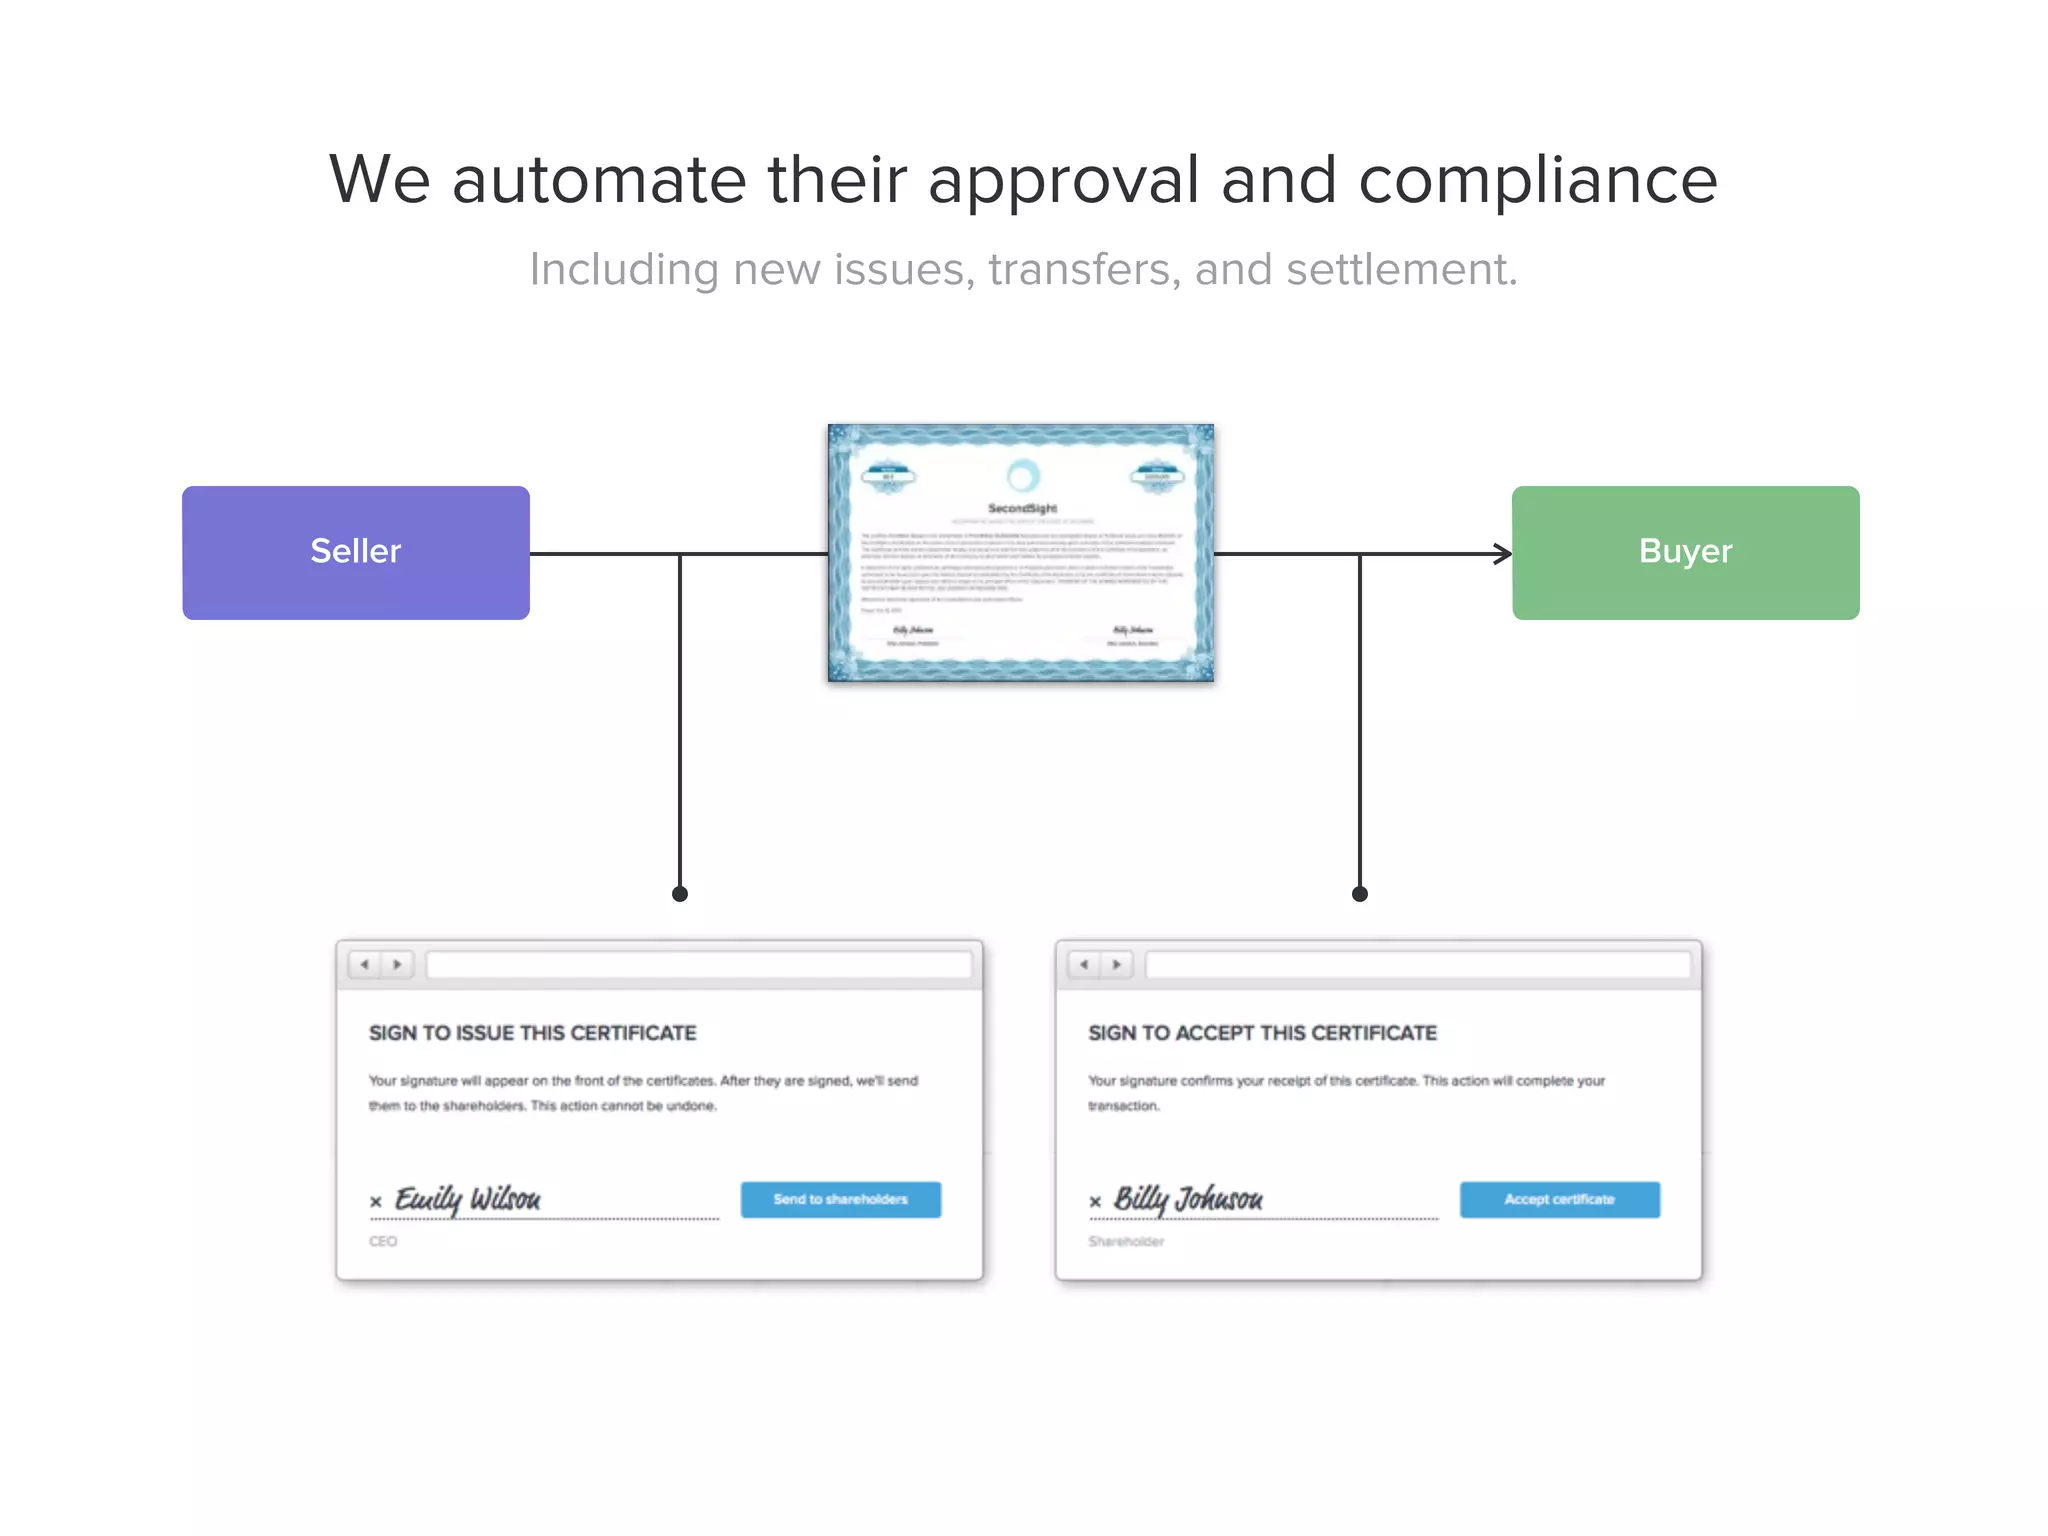
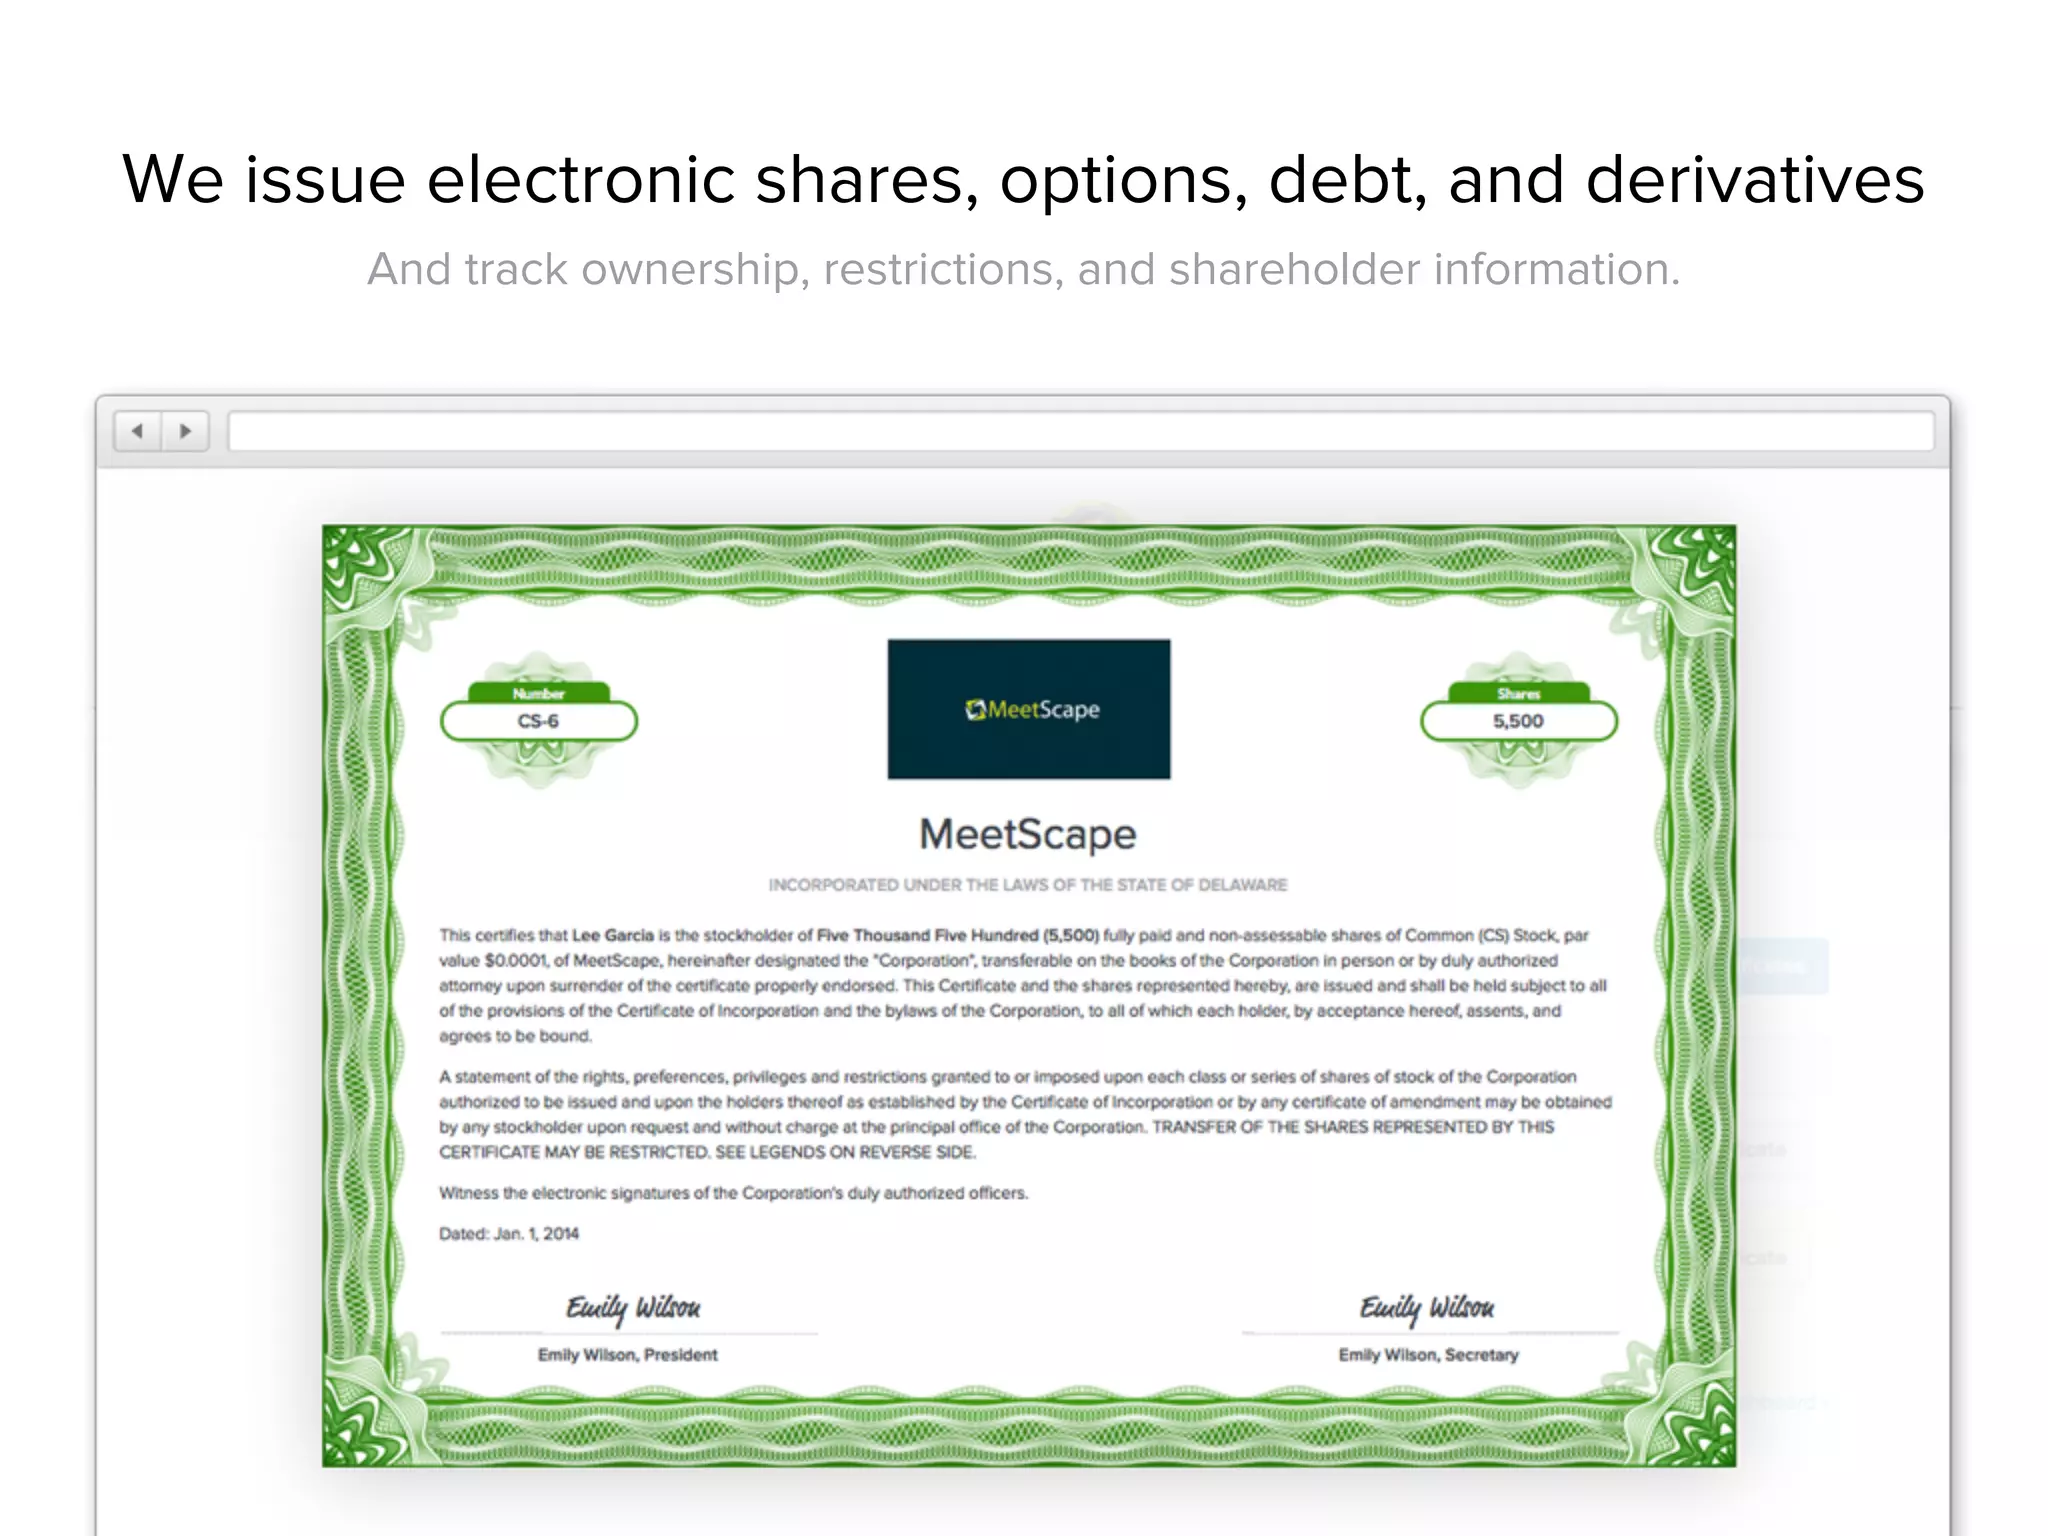
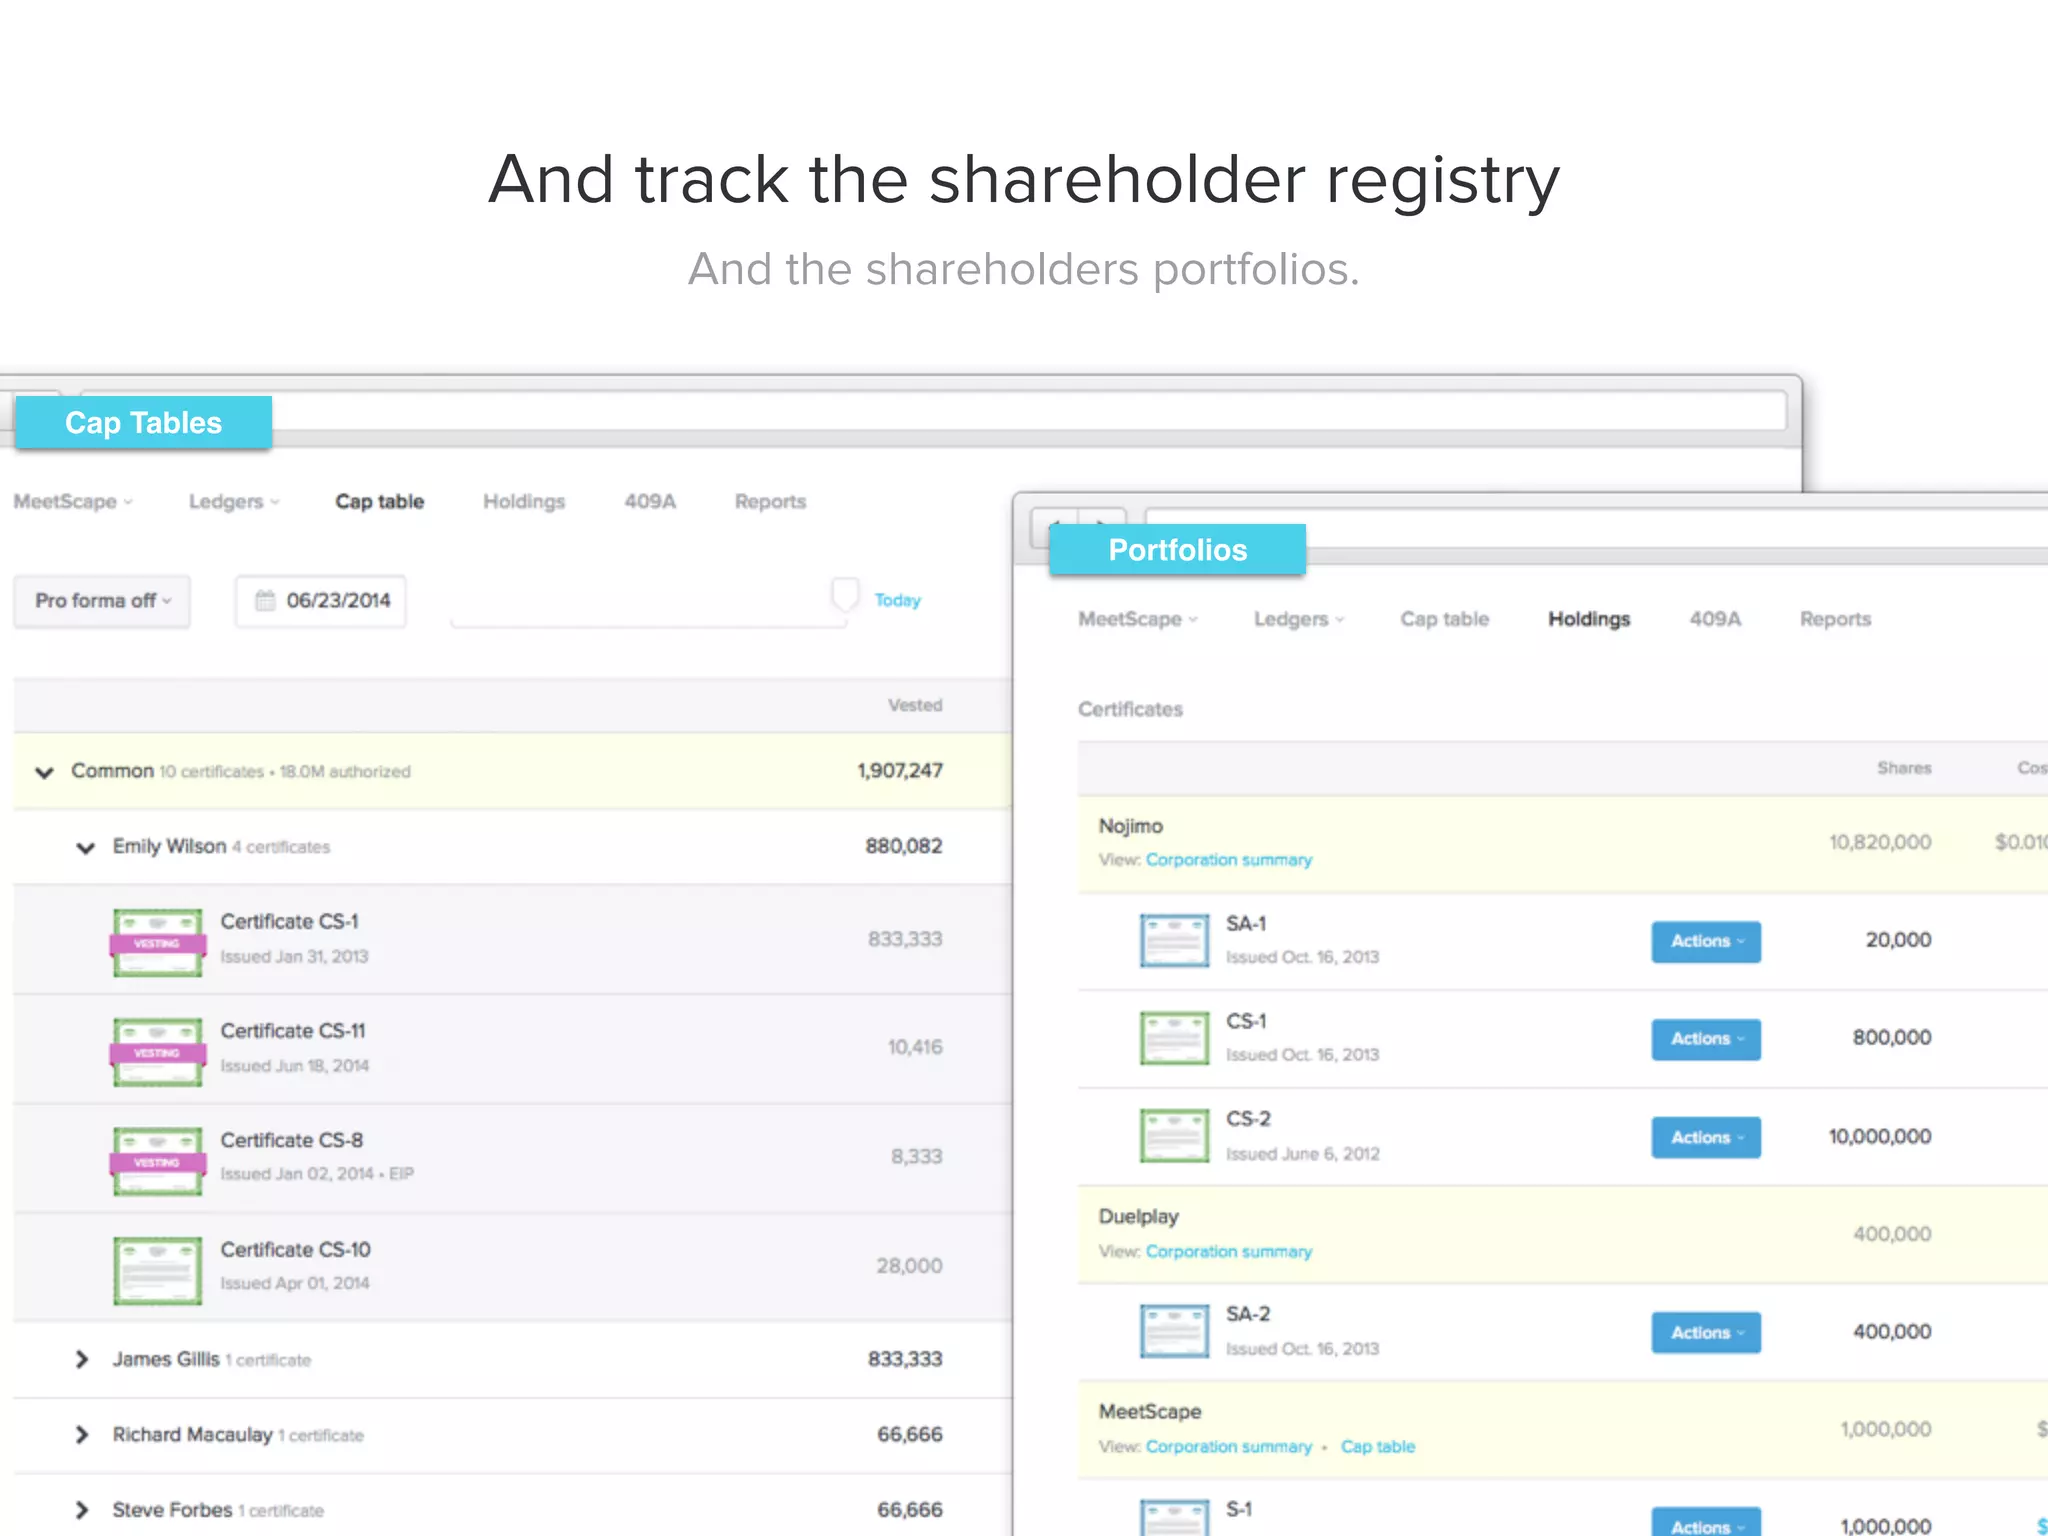
Slide 6 demonstrates the core product: issuing electronic shares and visually tracking certificates. The large screenshot of a certificate and the explanatory headline make the core proposition tangible — eShares isn't an abstract ledger, it replaces paper certificates and automates ownership tracking. The visual UI cues and real-looking certificate increase credibility and make it easy for a non-technical investor to understand the product's value.
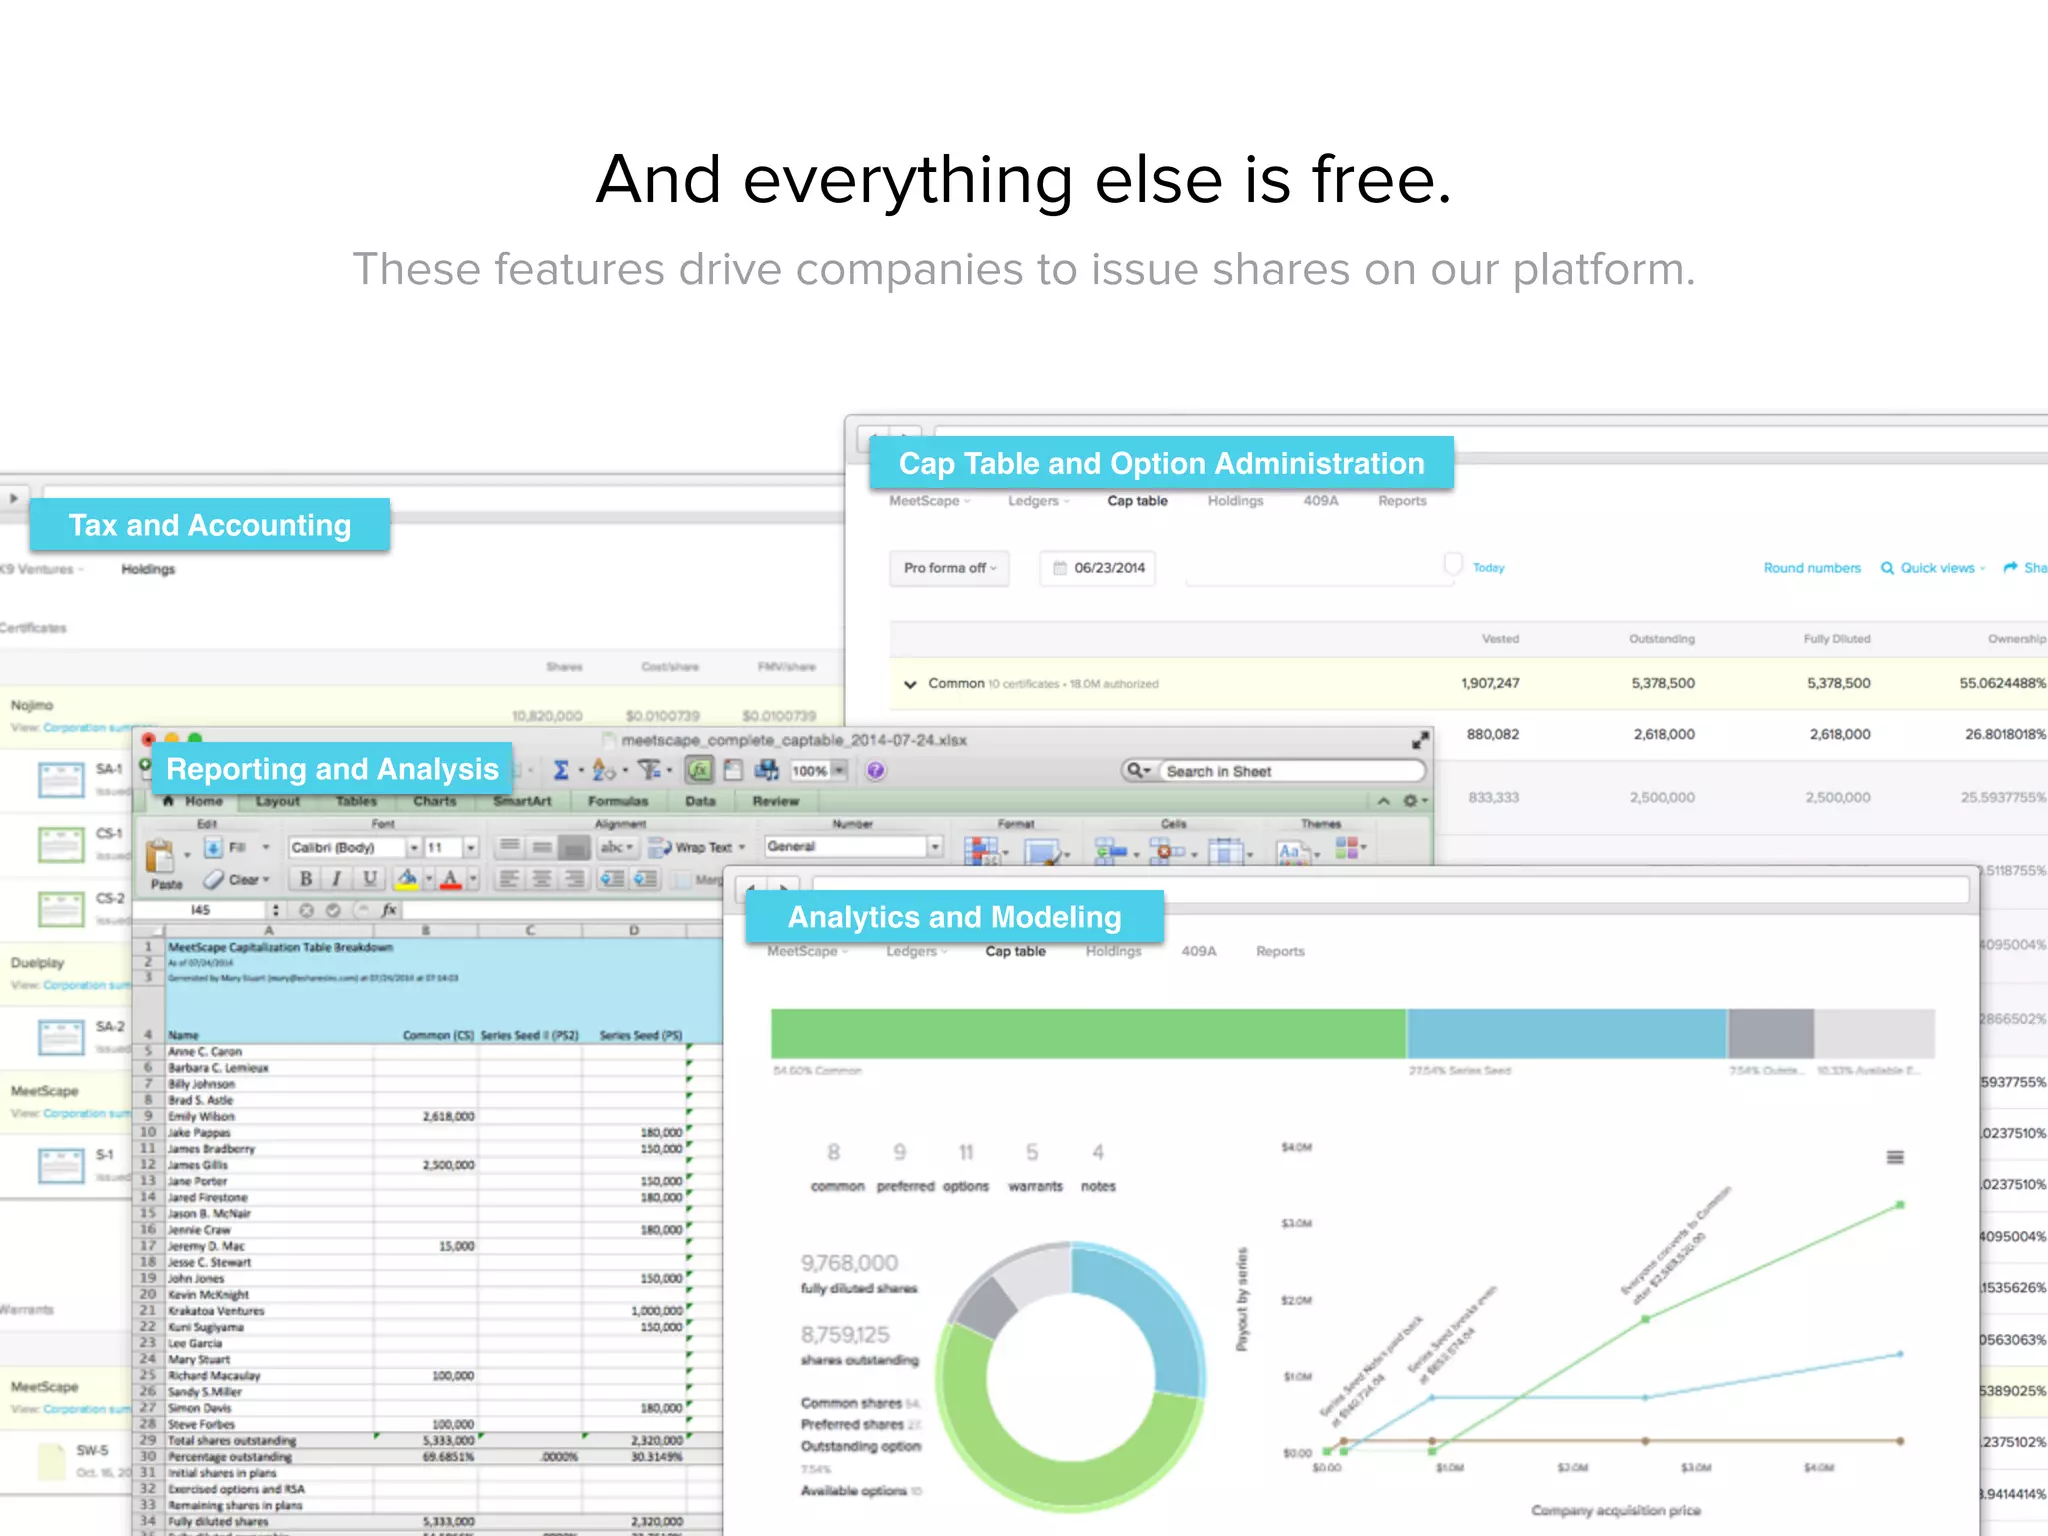
The deck continues to show flows (issuance, approvals, cap table, portfolios) in adjacent slides, which helps tie the UI to workflows (compliance, transfers, holdings). Founders should remember: real screenshots of the product in context (not mockups of isolated screens) help investors imagine adoption across customer workflows and reduce the perceived implementation risk.

Key Takeaway: Use real product screenshots that show the actual workflows customers will use — visuals that map to operational pain points sell credibility.
Pricing & monetization: a simple transaction model

Pricing & monetization: a simple transaction model

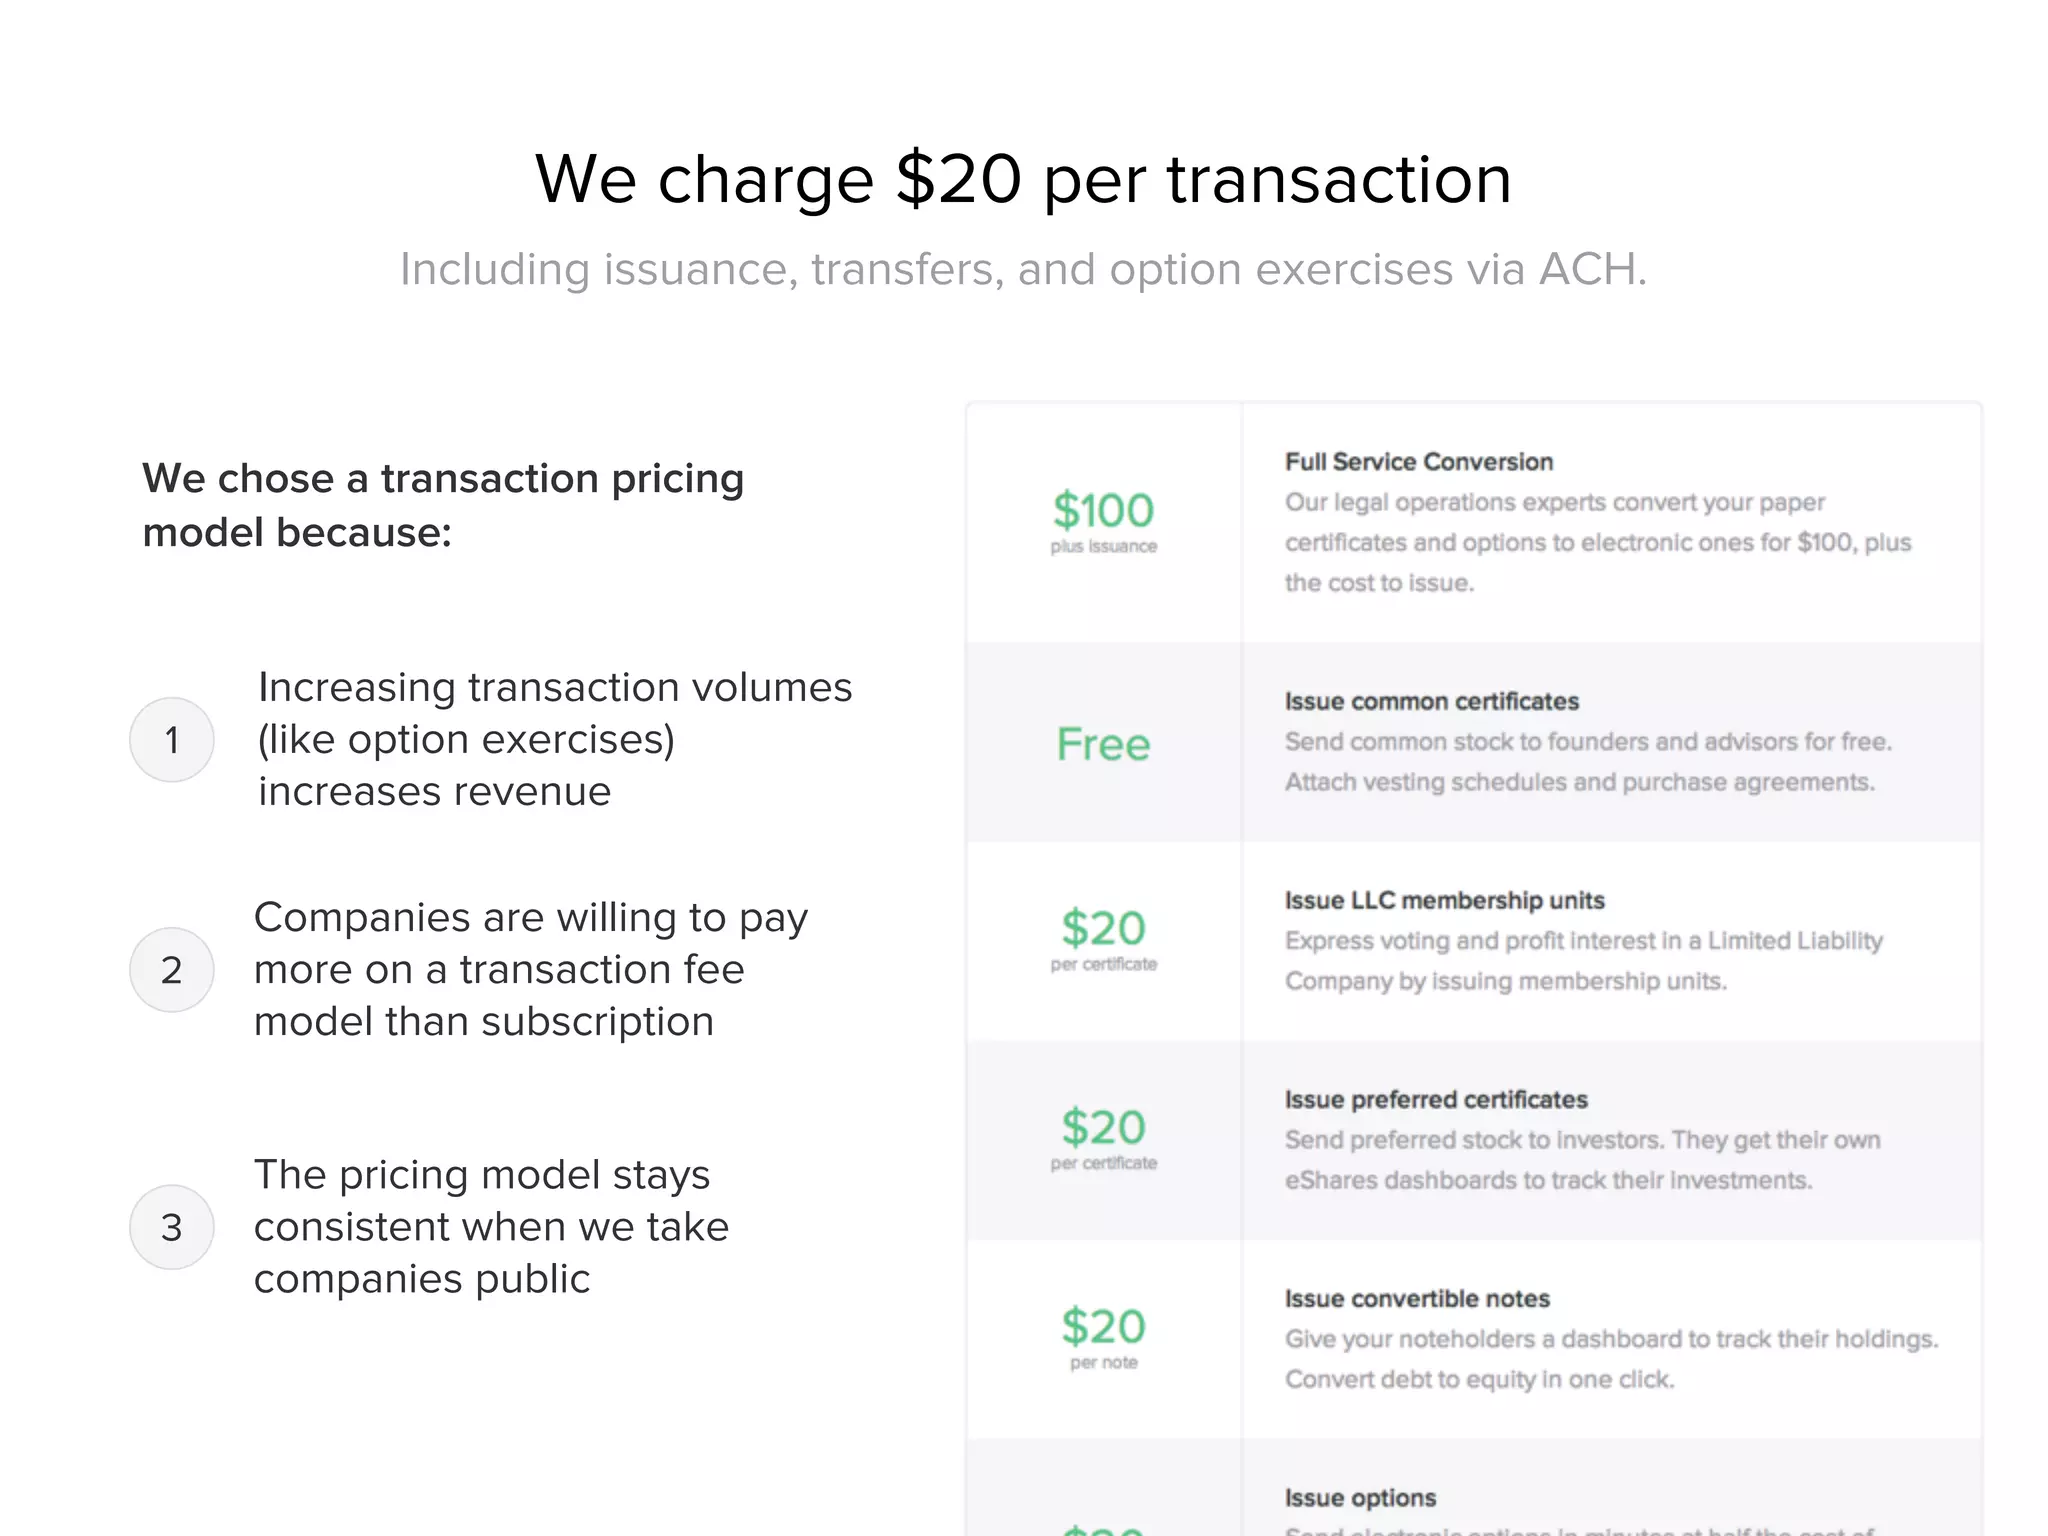
Slide 9 lays out the transaction pricing: $20 per transaction, plus a few premium services. The slide explains the rationale — transaction volume will grow (e.g., option exercises), companies prefer paying per transaction over subscription, and the model stays consistent post-IPO. That clarity is important: the team is explicit about unit economics and why this model scales with activity rather than headcount.
The slide mixes quantitative pricing with qualitative reasoning, which is effective for investors who want to see both the numbers and the logic. For founders, the lesson is to pick a simple primary monetization method and justify it with customer behavior and scaling logic — complexity can be added later as add-ons once the core model proves out.

Key Takeaway: Choose a simple, scalable pricing model tied directly to customer activity and justify it with customer behavior and scaling logic.
Traction and growth: 40% month-over-month revenue growth

Traction and growth: 40% month-over-month revenue growth

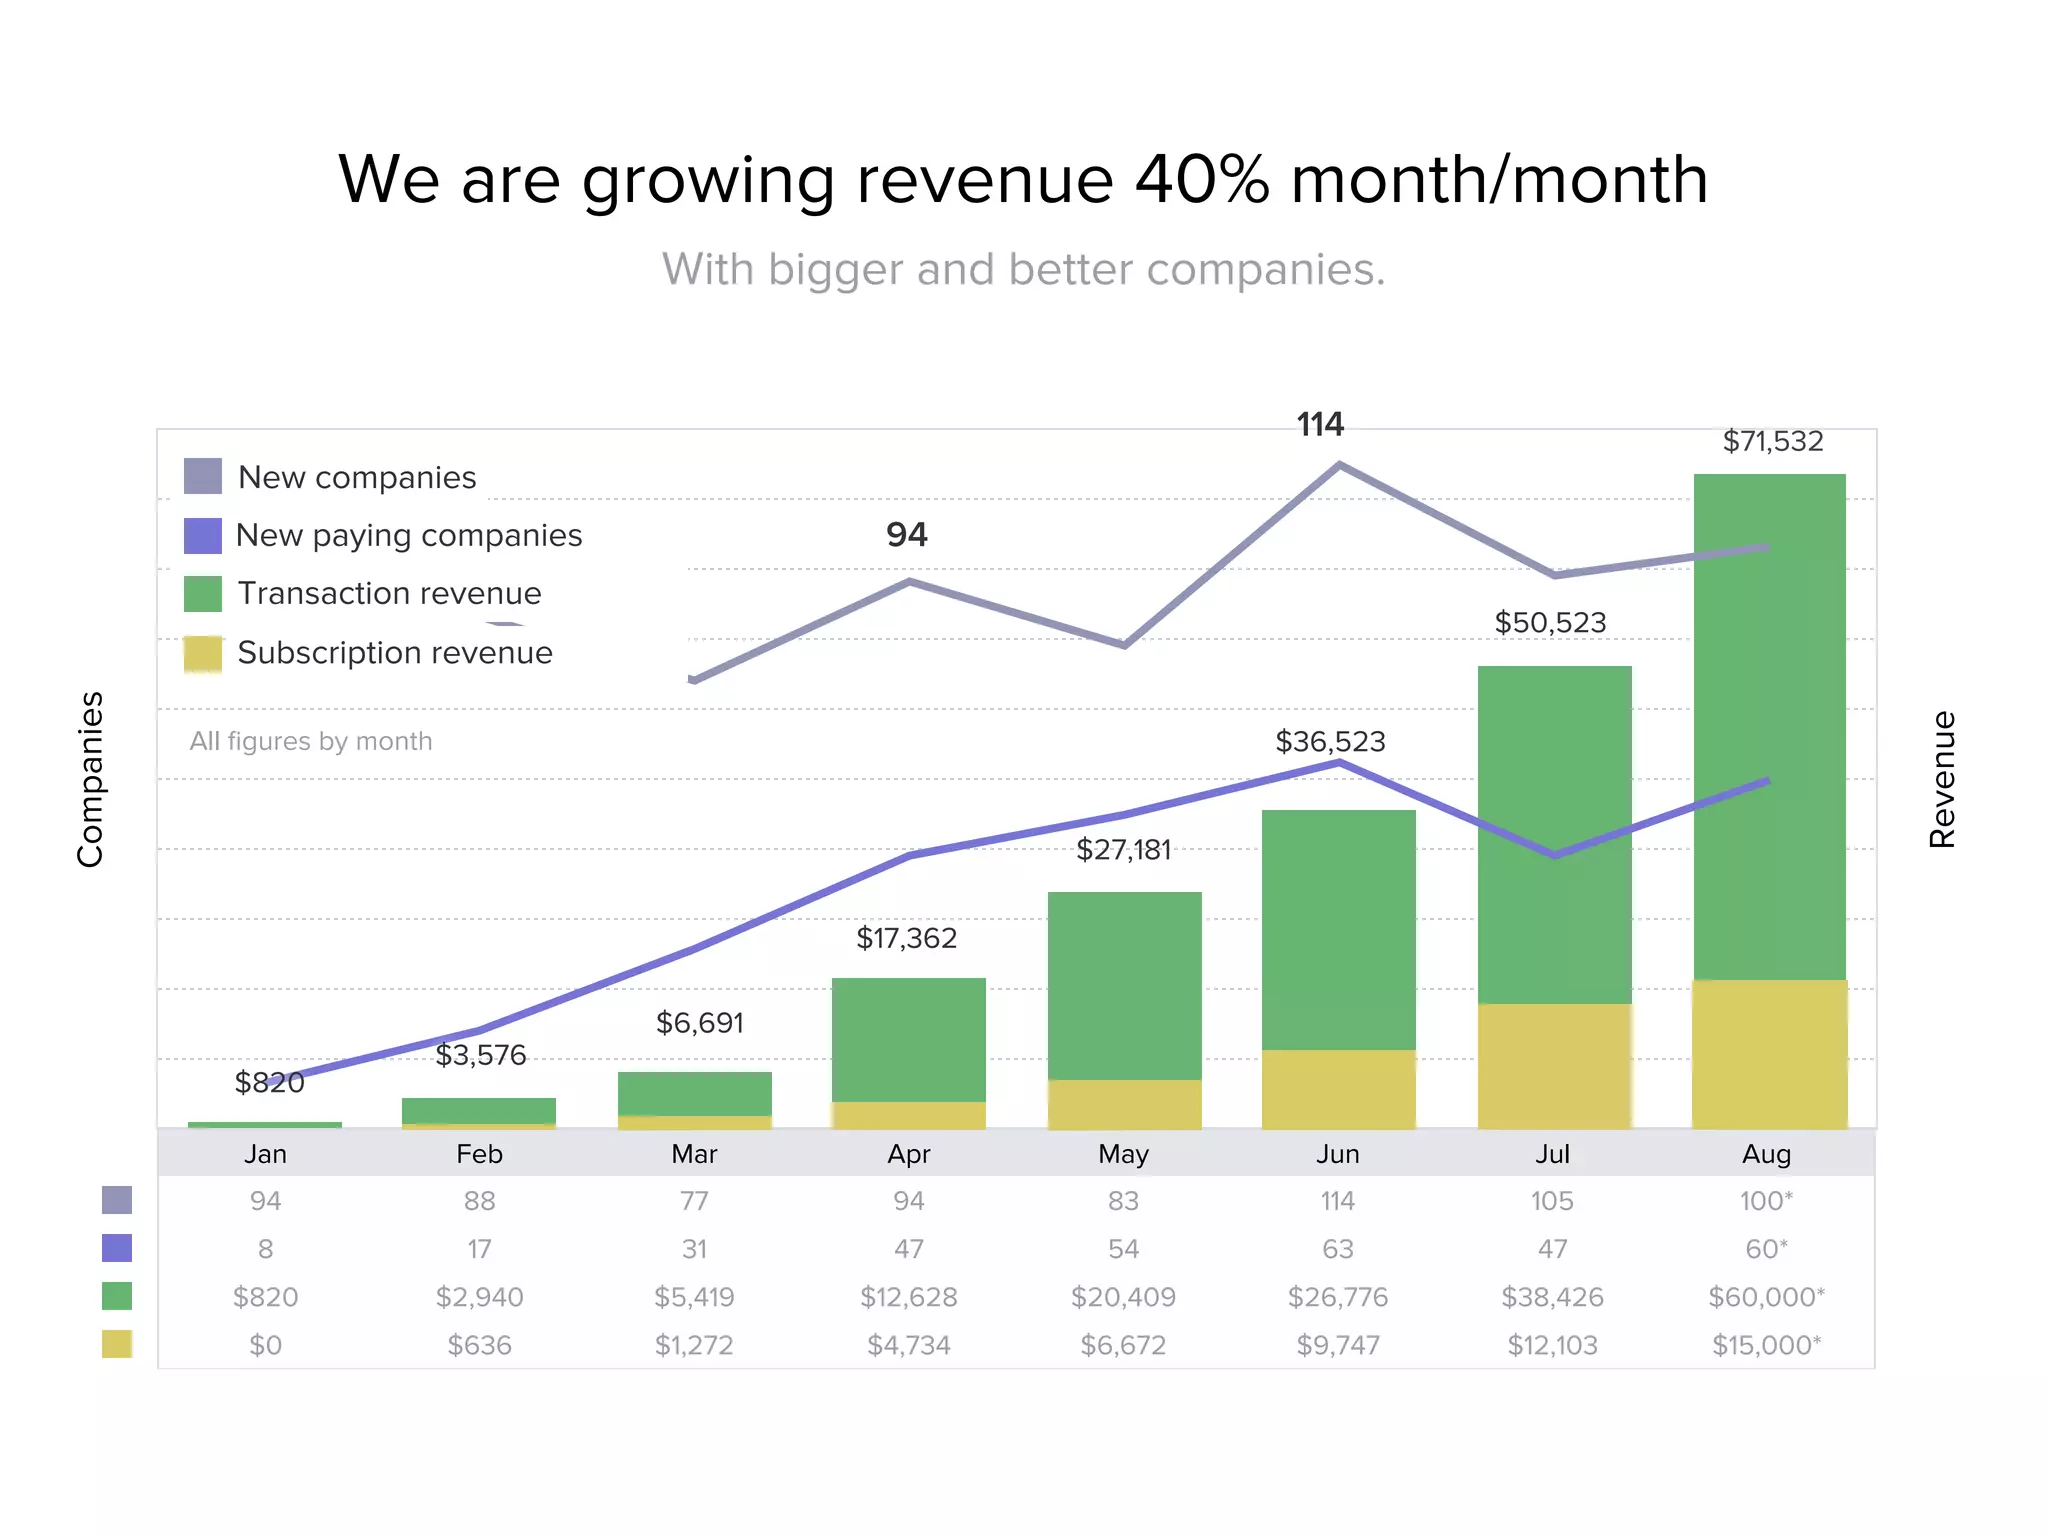
Slide 13 presents concrete traction: a chart showing revenue growth month-to-month with $71K in August and annotations for new companies and paying customers. The visual mix of stacked bars and a line for paying companies communicates both top-line revenue growth and the expanding customer base. Showing month-over-month metrics at an early stage is persuasive because it demonstrates momentum and operational execution.
Importantly, the deck pairs growth numbers with other supporting slides showing cohorts and customer references, which together build the narrative that growth is real, repeatable, and driven by product-market fit. Founders should present clean, honest growth metrics and pair them with qualitative evidence (testimonials, logos, cohort charts) to make traction tangible and defensible.

Key Takeaway: Show clean, consistent traction metrics and pair them with customer evidence to turn momentum into investor conviction.
Execution, team, and efficiency: 'lean and mean' summary

Execution, team, and efficiency: 'lean and mean' summary

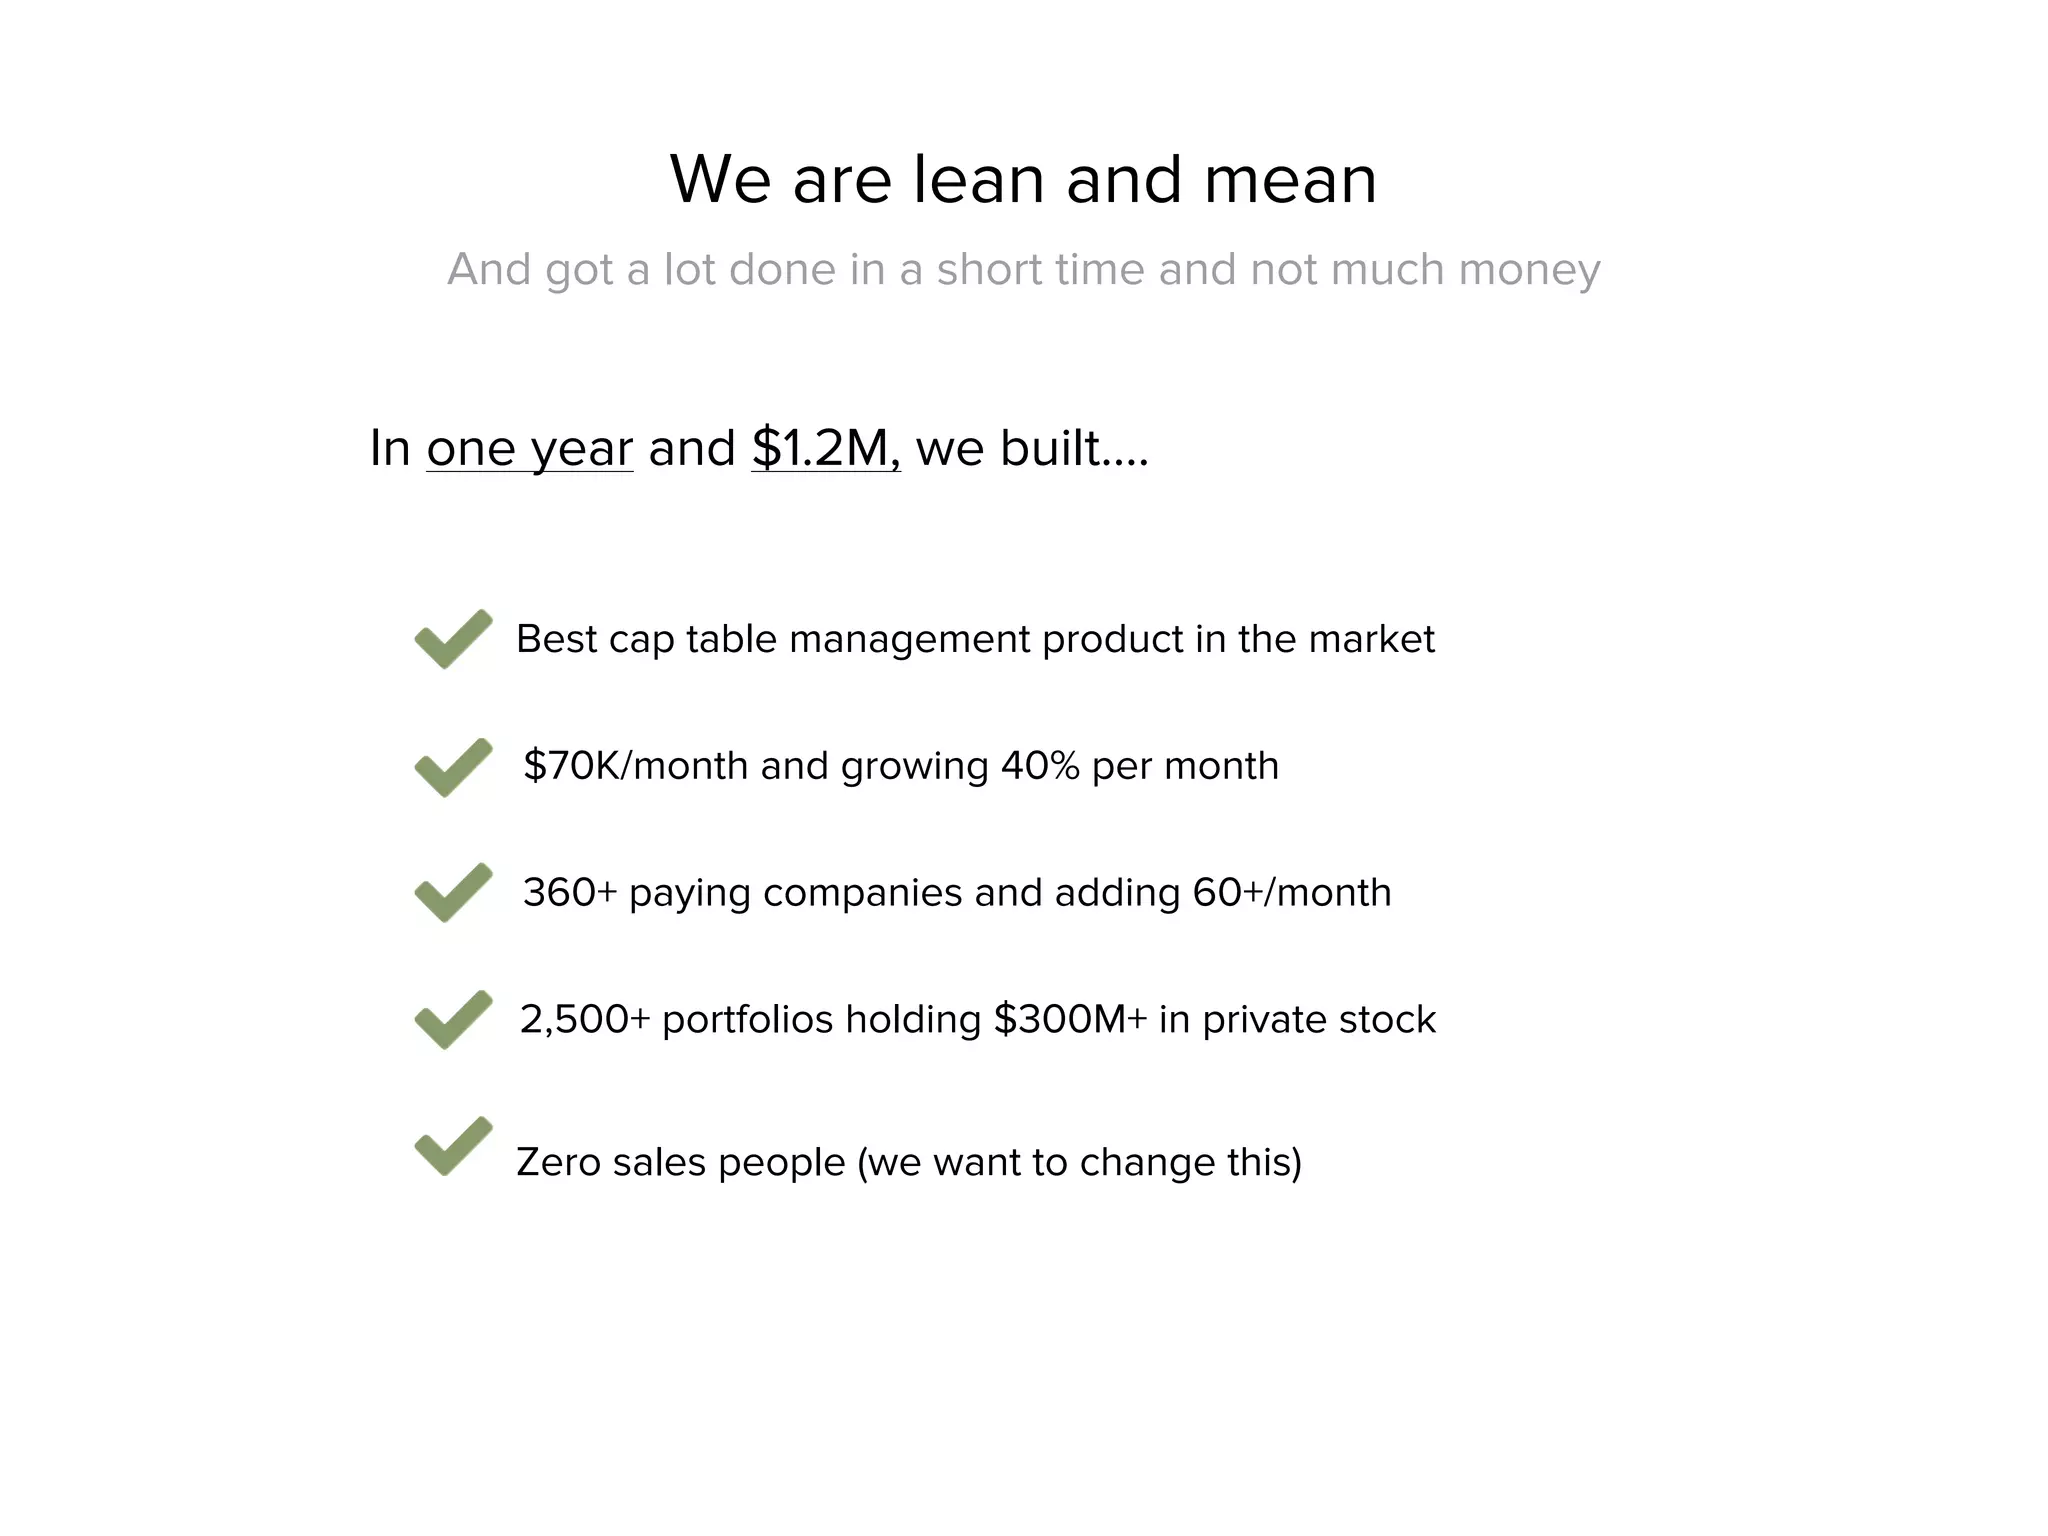
Slide 22 summarizes execution in one concise slide: what was built in one year with $1.2M, revenue run rate, paying customers, portfolio counts, and the lack of a formal sales team. This is an effective combination — it shows capital efficiency, product-led growth, and room to scale with sales resources. For investors, the slide answers the key question: can this team do more with more capital?
The candid presentation of resources used and results achieved signals credibility and allows investors to model the impact of additional funding. Founders should emulate this transparency: highlight capital efficiency, early unit economics, and a realistic plan for how new funding will accelerate outcomes.

Key Takeaway: Highlight capital efficiency and what you achieved with limited resources — investors want to see evidence that the team will scale results with additional capital.

Conclusion: Key Lessons

This deck is an instructive example of how to present a regulated fintech startup concisely: lead with credibility (regulatory approvals), show a tangible product that solves a painful operational problem, choose a simple monetization tied to customer activity, and back claims with clear traction metrics and customer validation. The visual language is minimalist and consistent — screenshots that map to workflows, a competitive matrix that clarifies the path to market, and charts that illustrate real momentum.
Actionable advice for founders: (1) establish and surface any regulatory or compliance approvals early, (2) use screenshots and workflow examples to make product value obvious, (3) pick a single, defensible pricing model and explain why it scales, (4) present clean traction with cohort/contextual evidence, and (5) highlight capital efficiency and a specific plan for how the raise will accelerate growth. Follow those principles and your deck will communicate both credibility and upside in a compact, investor-friendly package.

Full Deck Analysis

11 sections

Overview

Company: Carta (then eShares)
Round: Seed ($1.8M)
Year: 2013
Outcome: Valued at $7.4B after Series G (2021)

Executive Summary

This seed-era deck (branded eShares at the time) presents a productized transfer-agent and cap-table platform that digitizes issuance, ownership ledgers, 409A/valuation services and investor reporting for private companies. The deck is notable for (a) having an SEC-registered transfer-agent claim, (b) early traction with clear month-over-month revenue and customer-growth charts, and (c) a product-led monetization mix of low-touch transaction fees plus higher-value add-ons (409A, SPVs, fund services).

Problem Statement

  • Private-company equity management is manual, error-prone and expensive: paper certificates, law-firm driven cap-table processes, disparate spreadsheets and expensive legacy transfer agents (slide set: product/problem description across slides 3–8).
  • Traditional transfer-agent and cap-table solutions are built for public companies and cumbersome/priced for private early-stage usage (competitor positioning slides 3, 19–21, 30–32).
  • Law firms and VCs spend time and money on conversions and cap table maintenance — the pain is operational and repetitive (evidenced by screenshots of workflows and testimonials on slides 6–8 and 15–17).

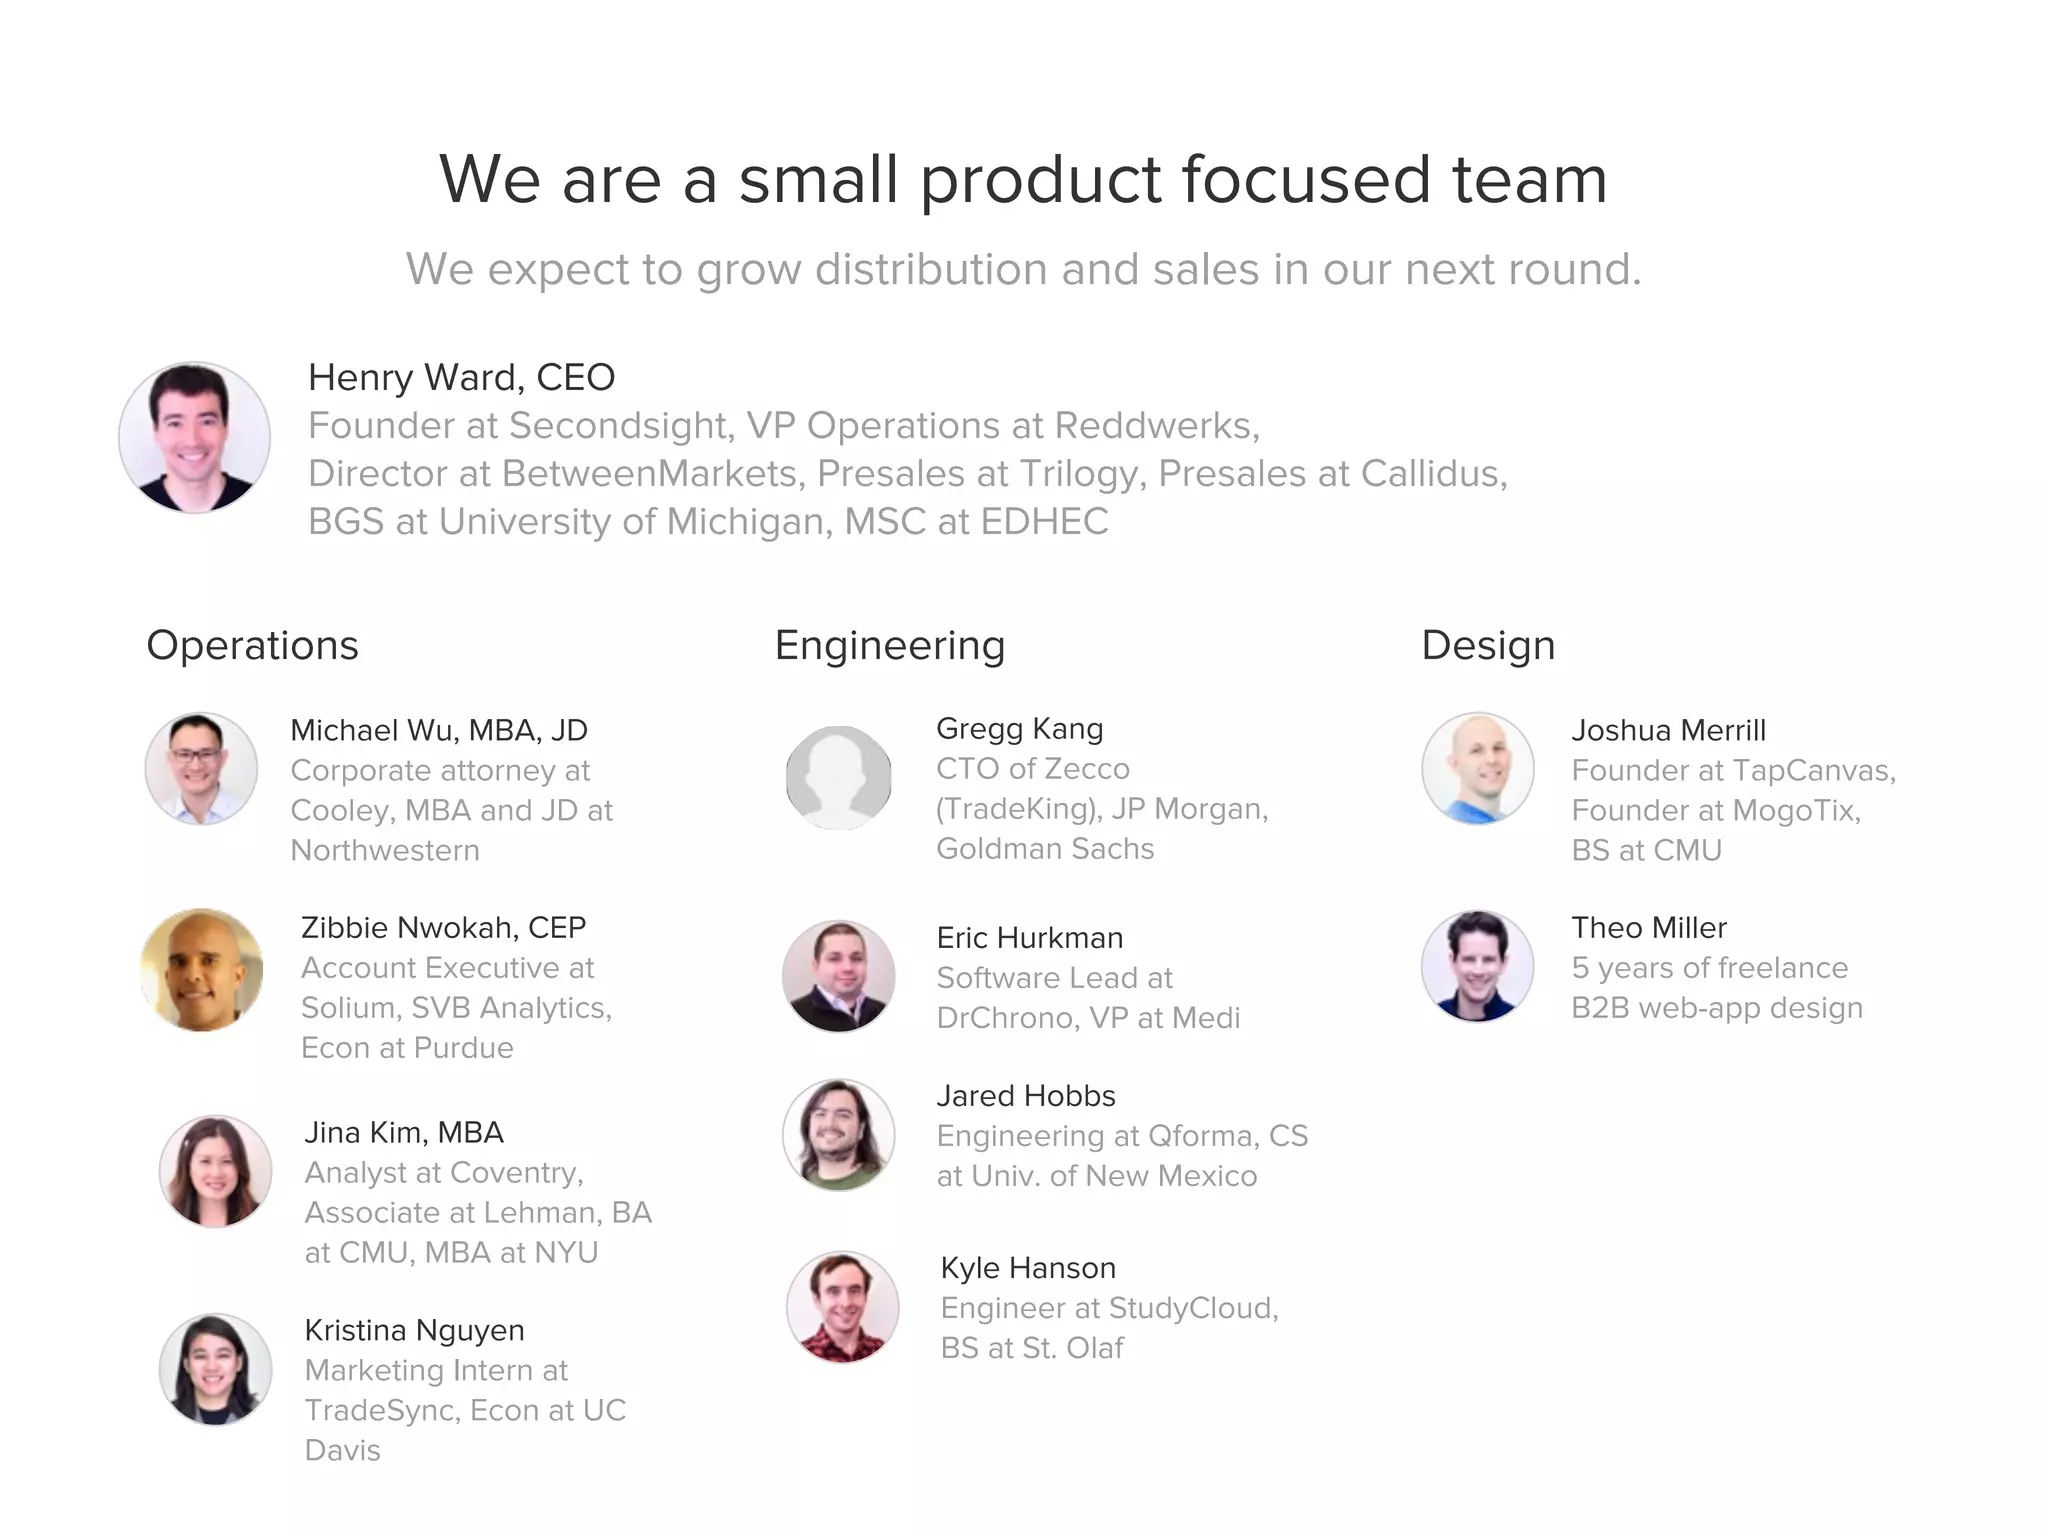
Solution

  • A web-native, SEC-registered transfer agent and cap-table product that issues and tracks electronic shares, options, debt and derivatives; automates approvals, compliance, transfers and settlement; and maintains shareholder registries and portfolios (slides 3–8).
  • Productized pricing: small per-transaction fees for issuance/transfers (core $20 per transaction model), free core features to drive adoption, and higher-priced add-ons (409A compliance, SPV formation, fund services) (slides 9–12).
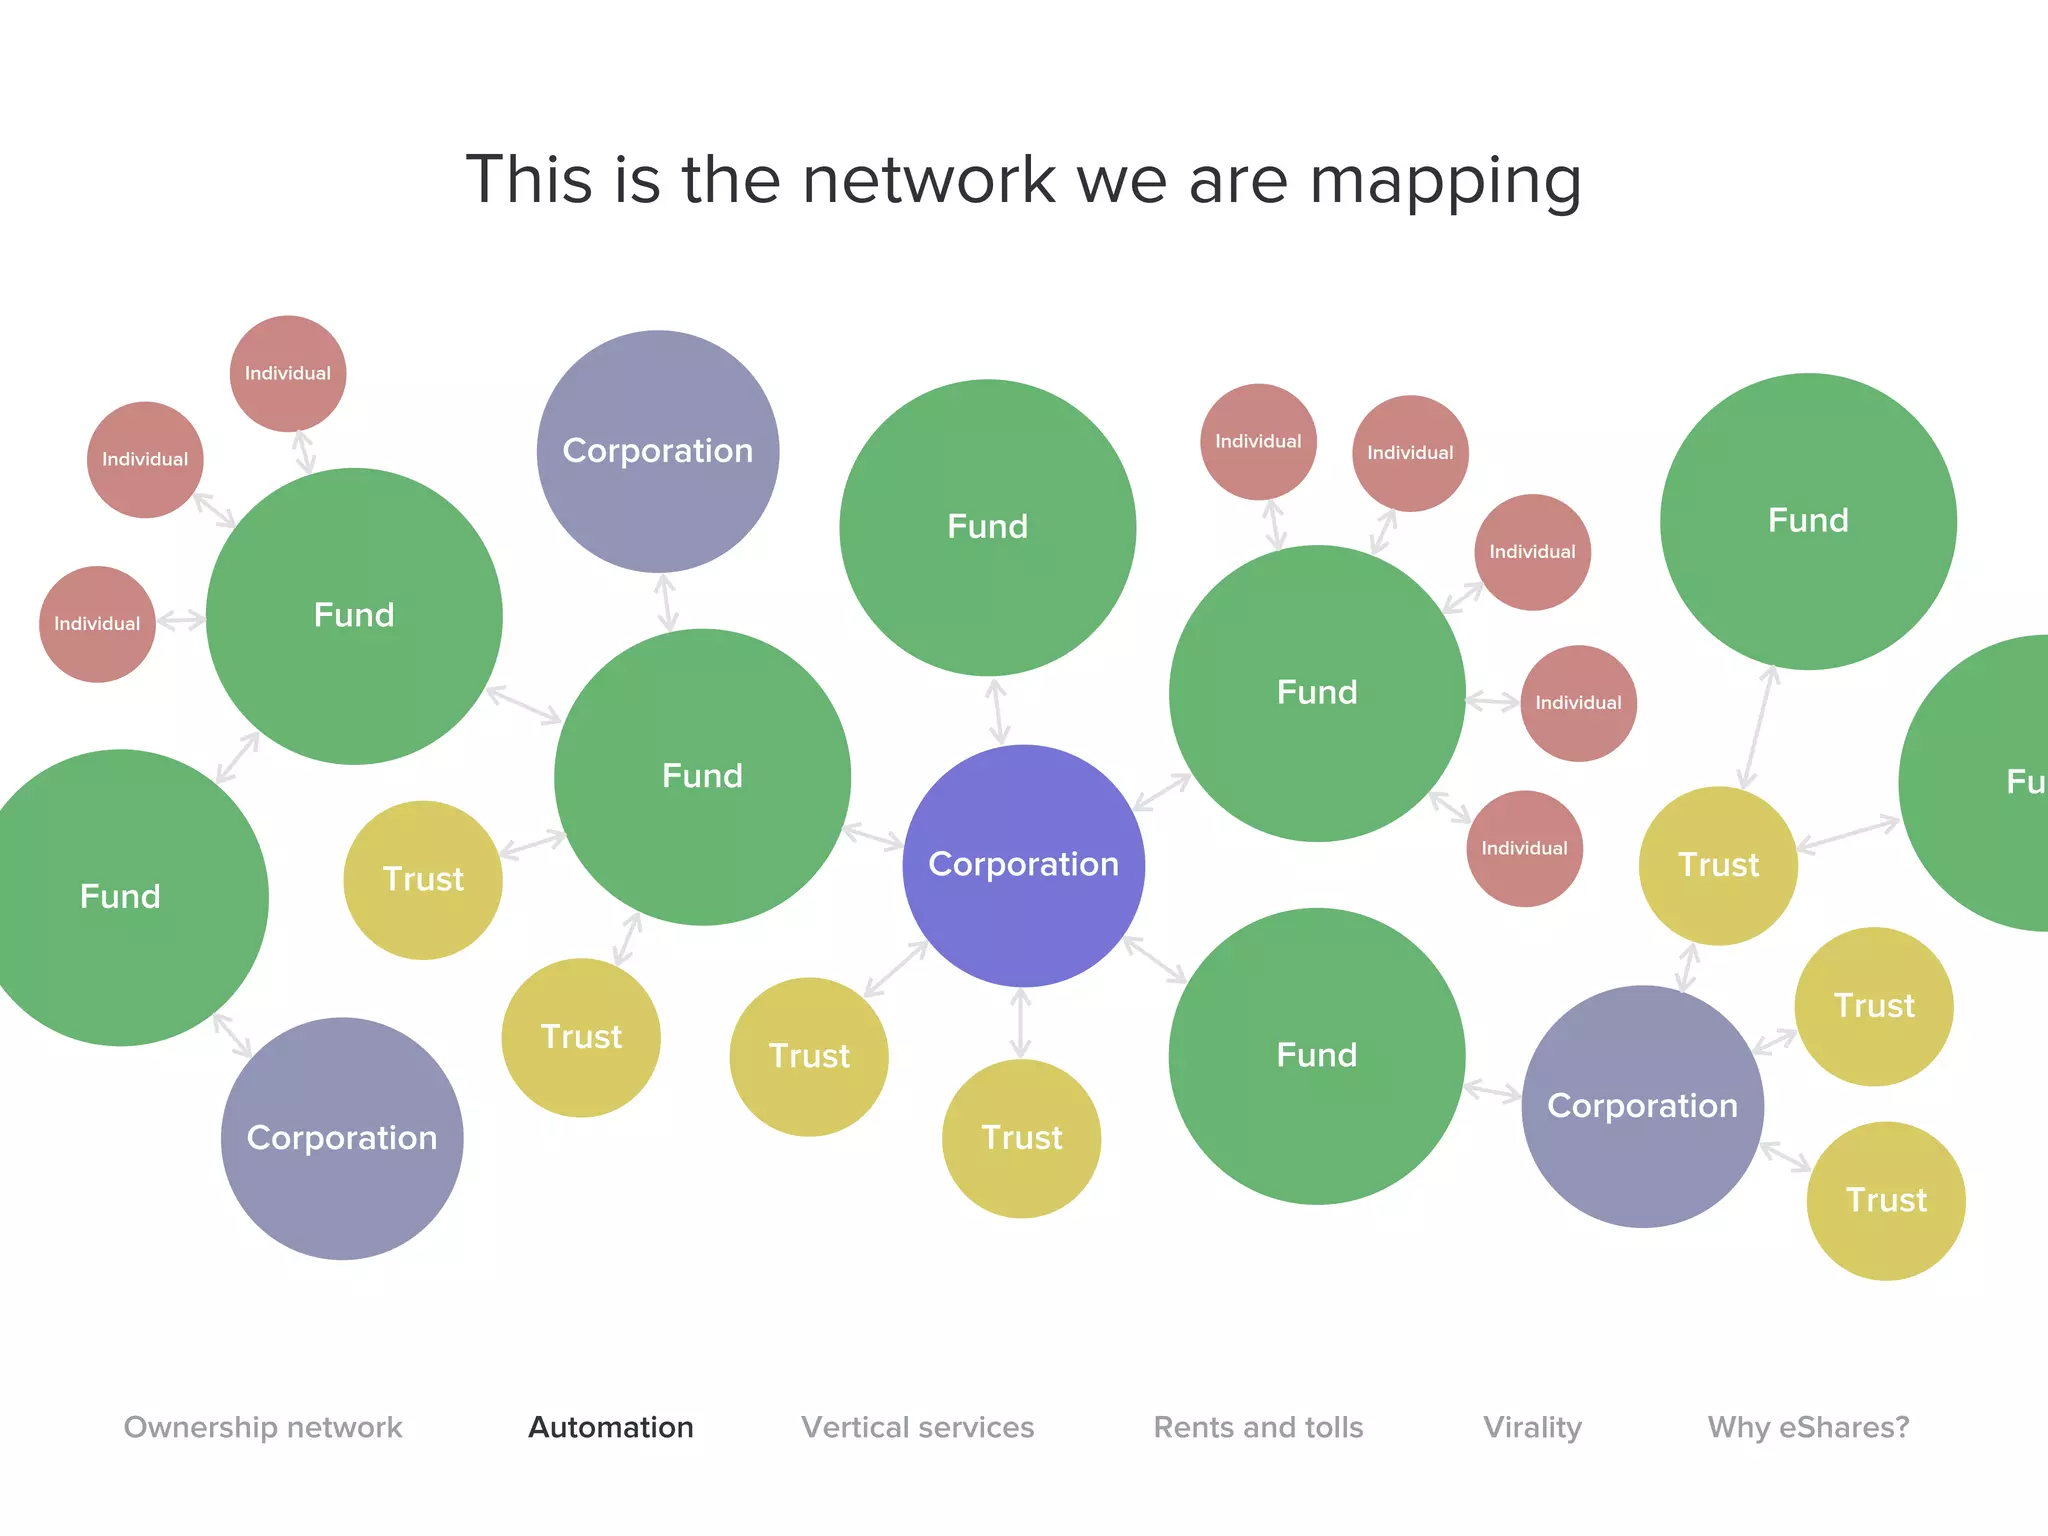
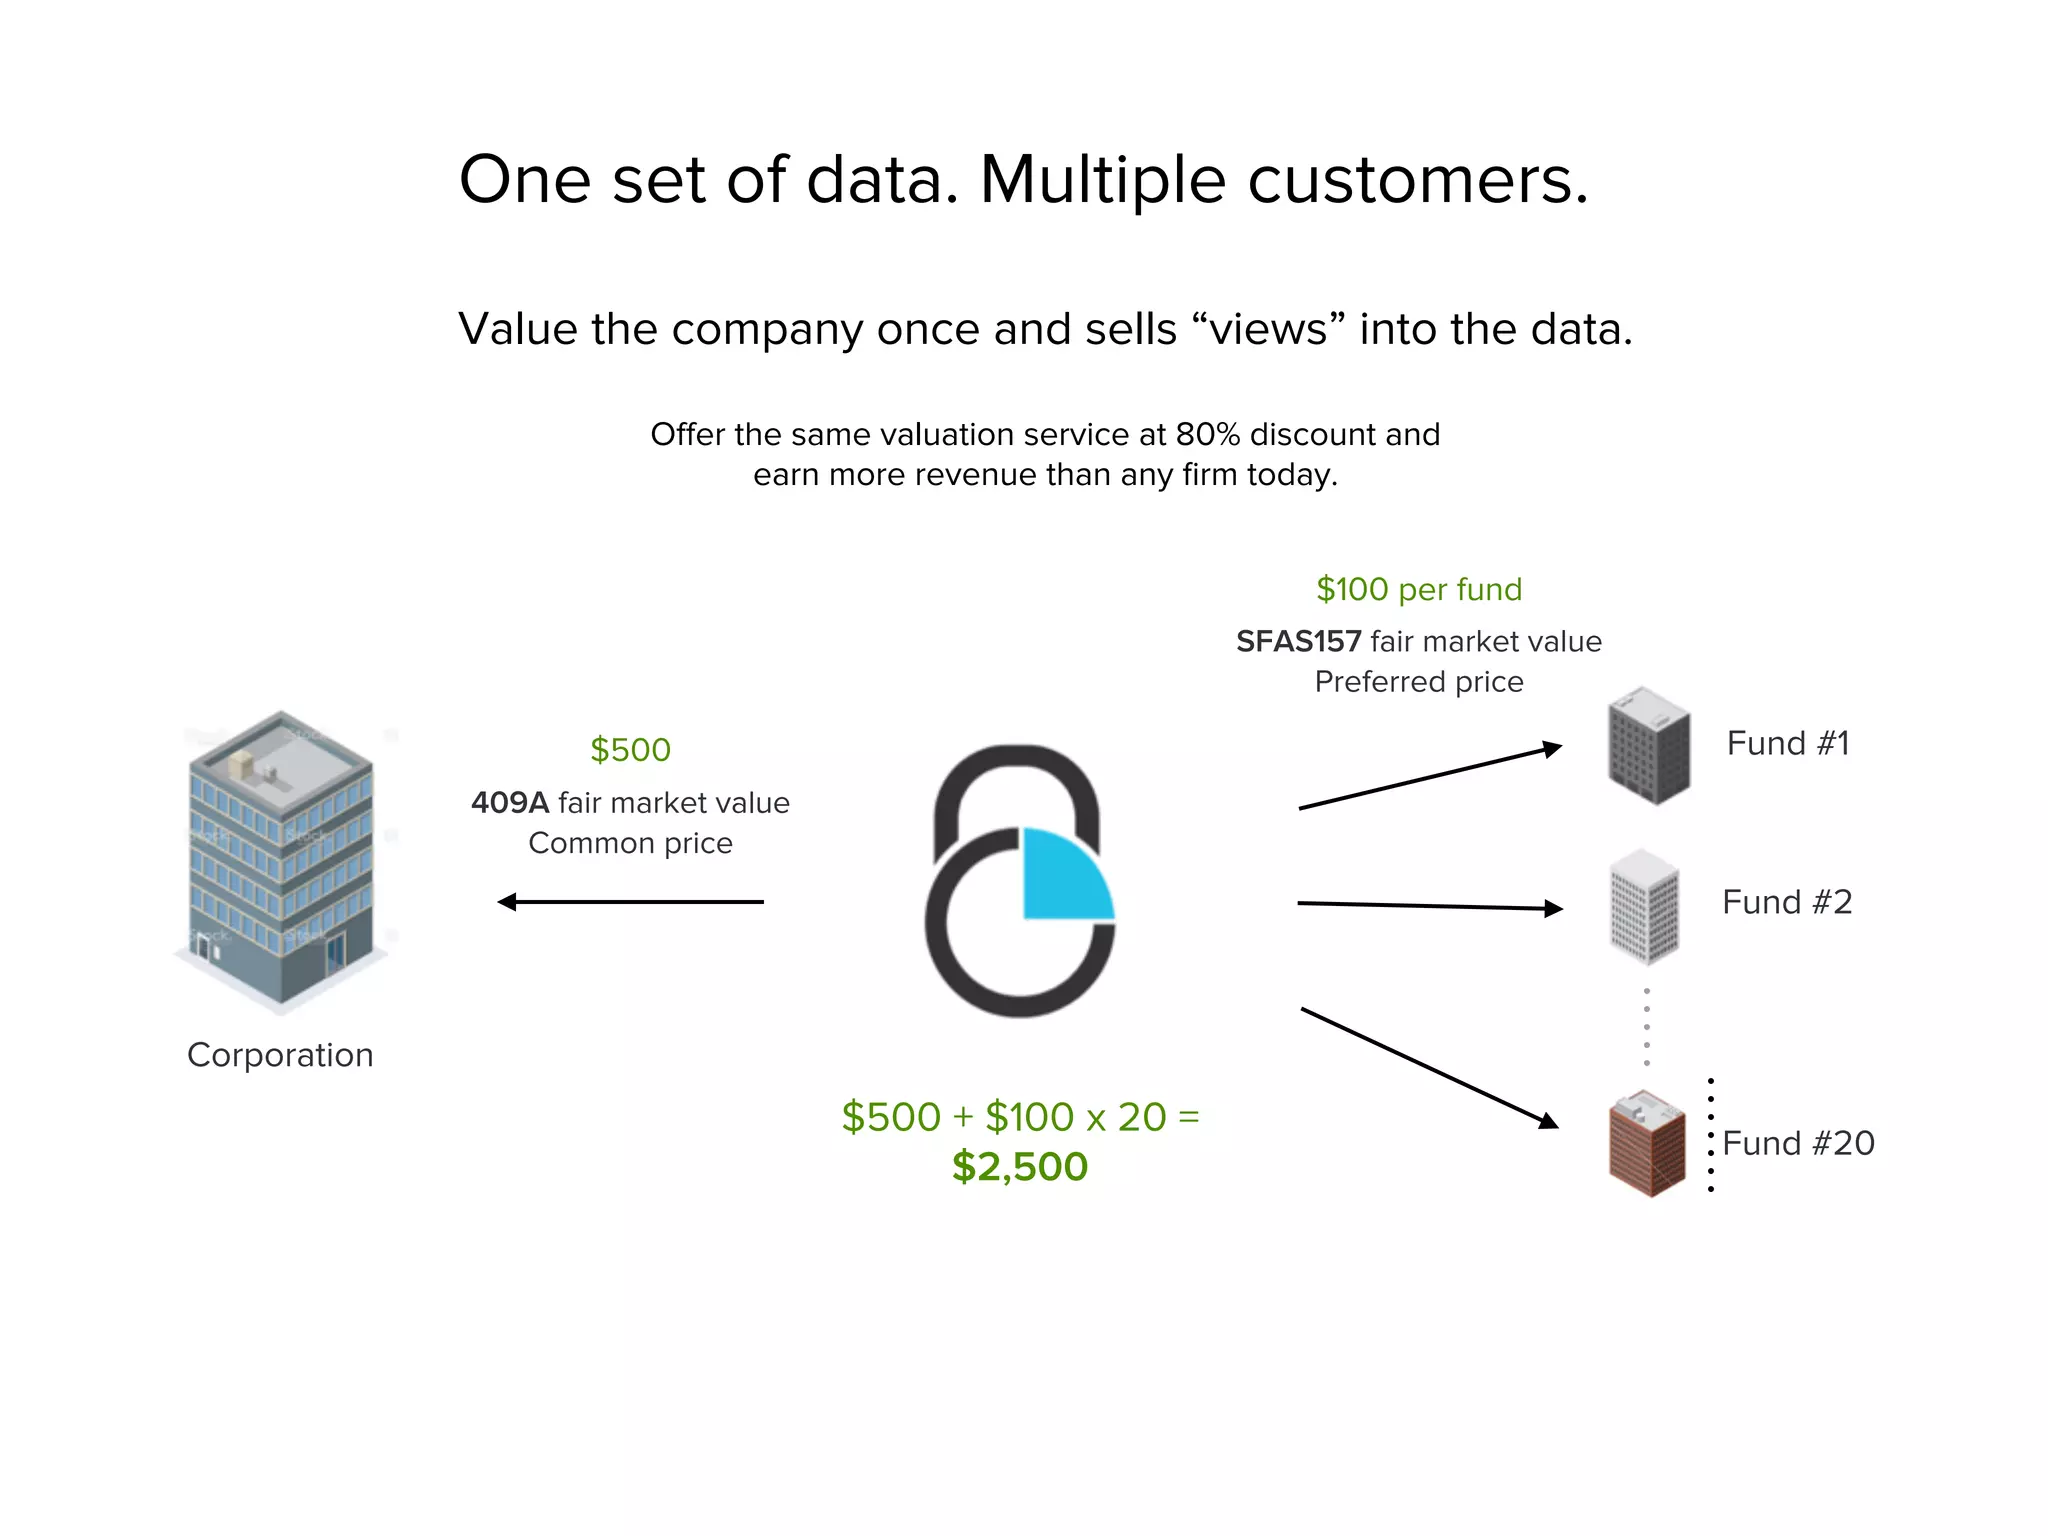
  • Network play: sell the same valuation/ownership data to multiple consumers (companies, funds) to multiply revenue per asset (slides 40–41).

Market Opportunity

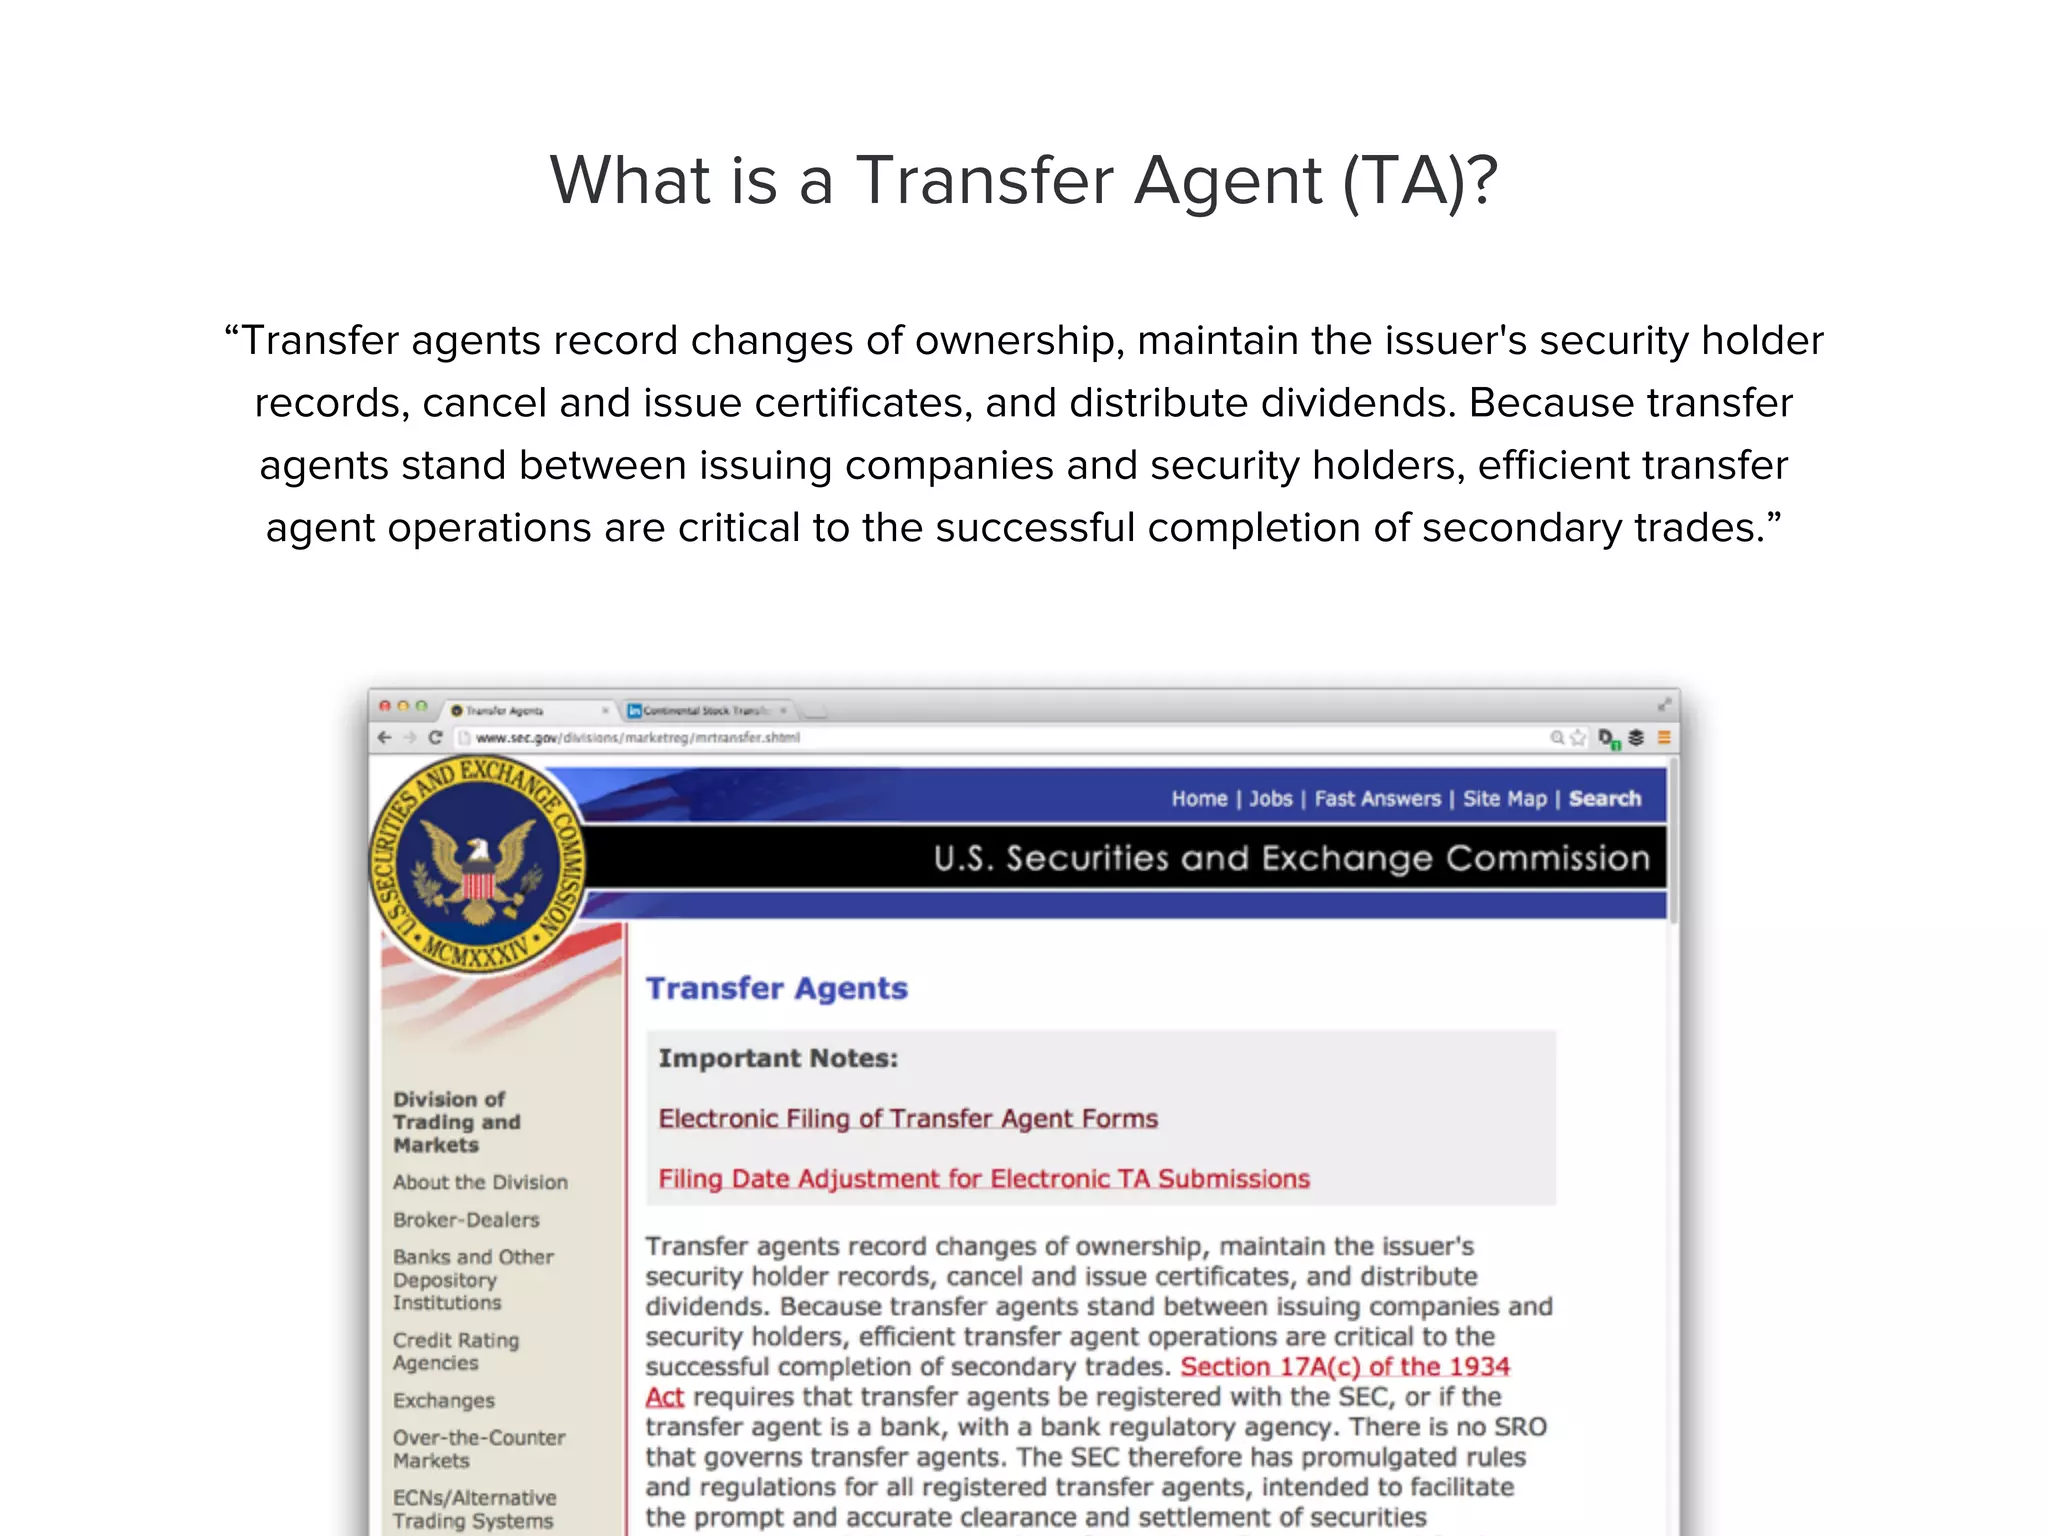
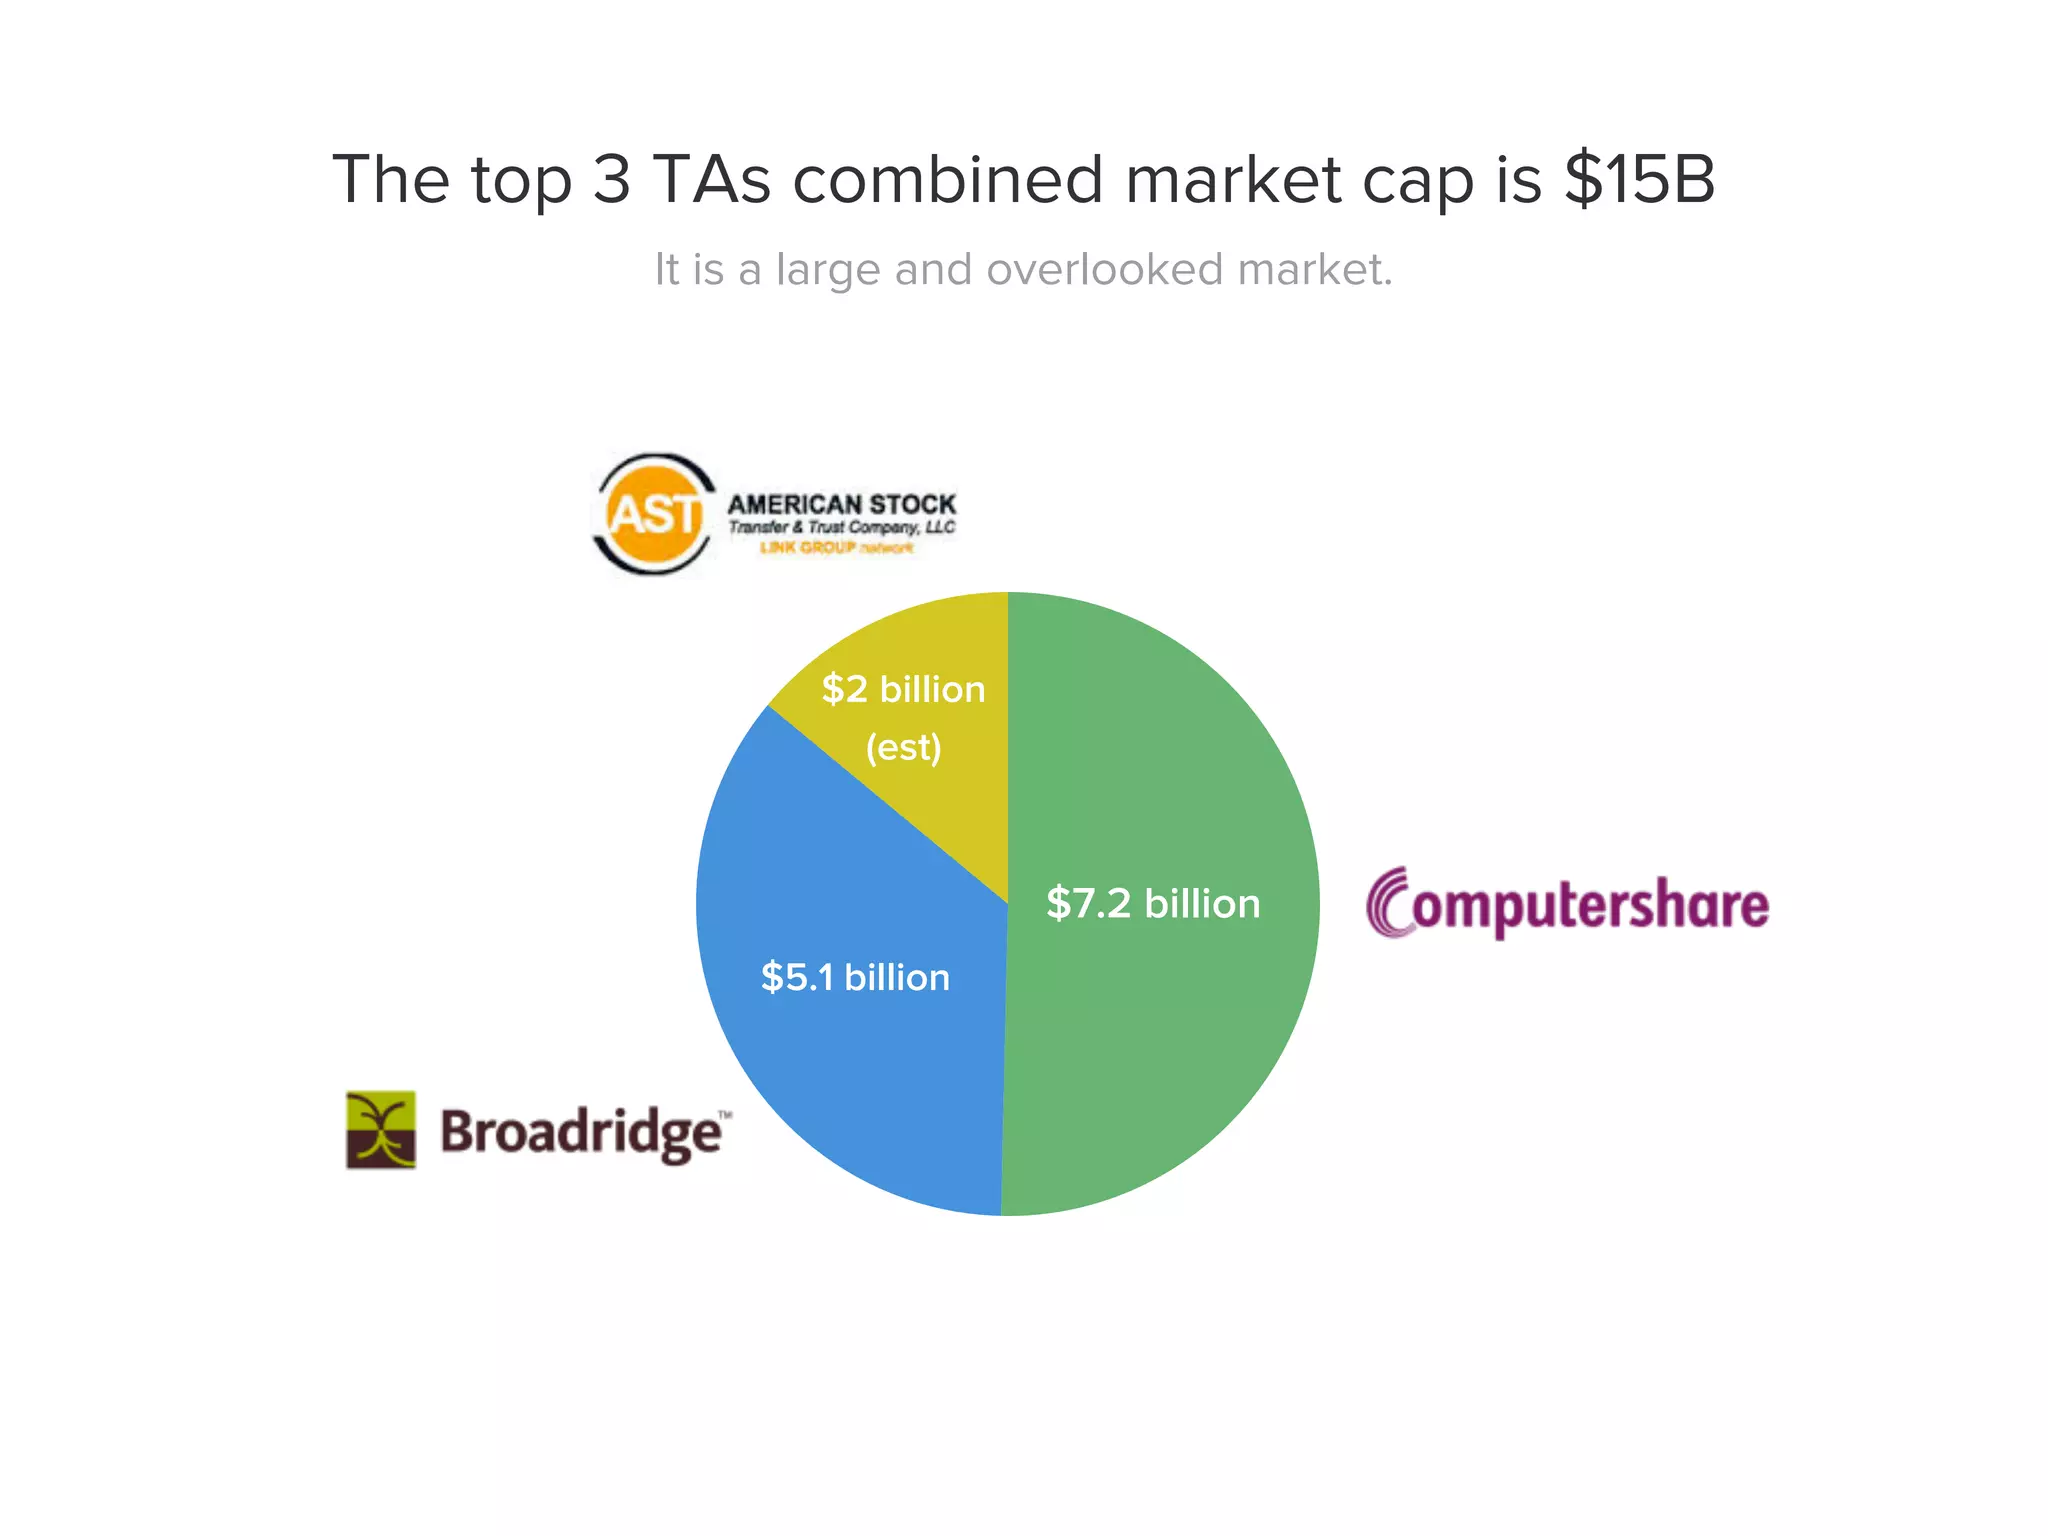
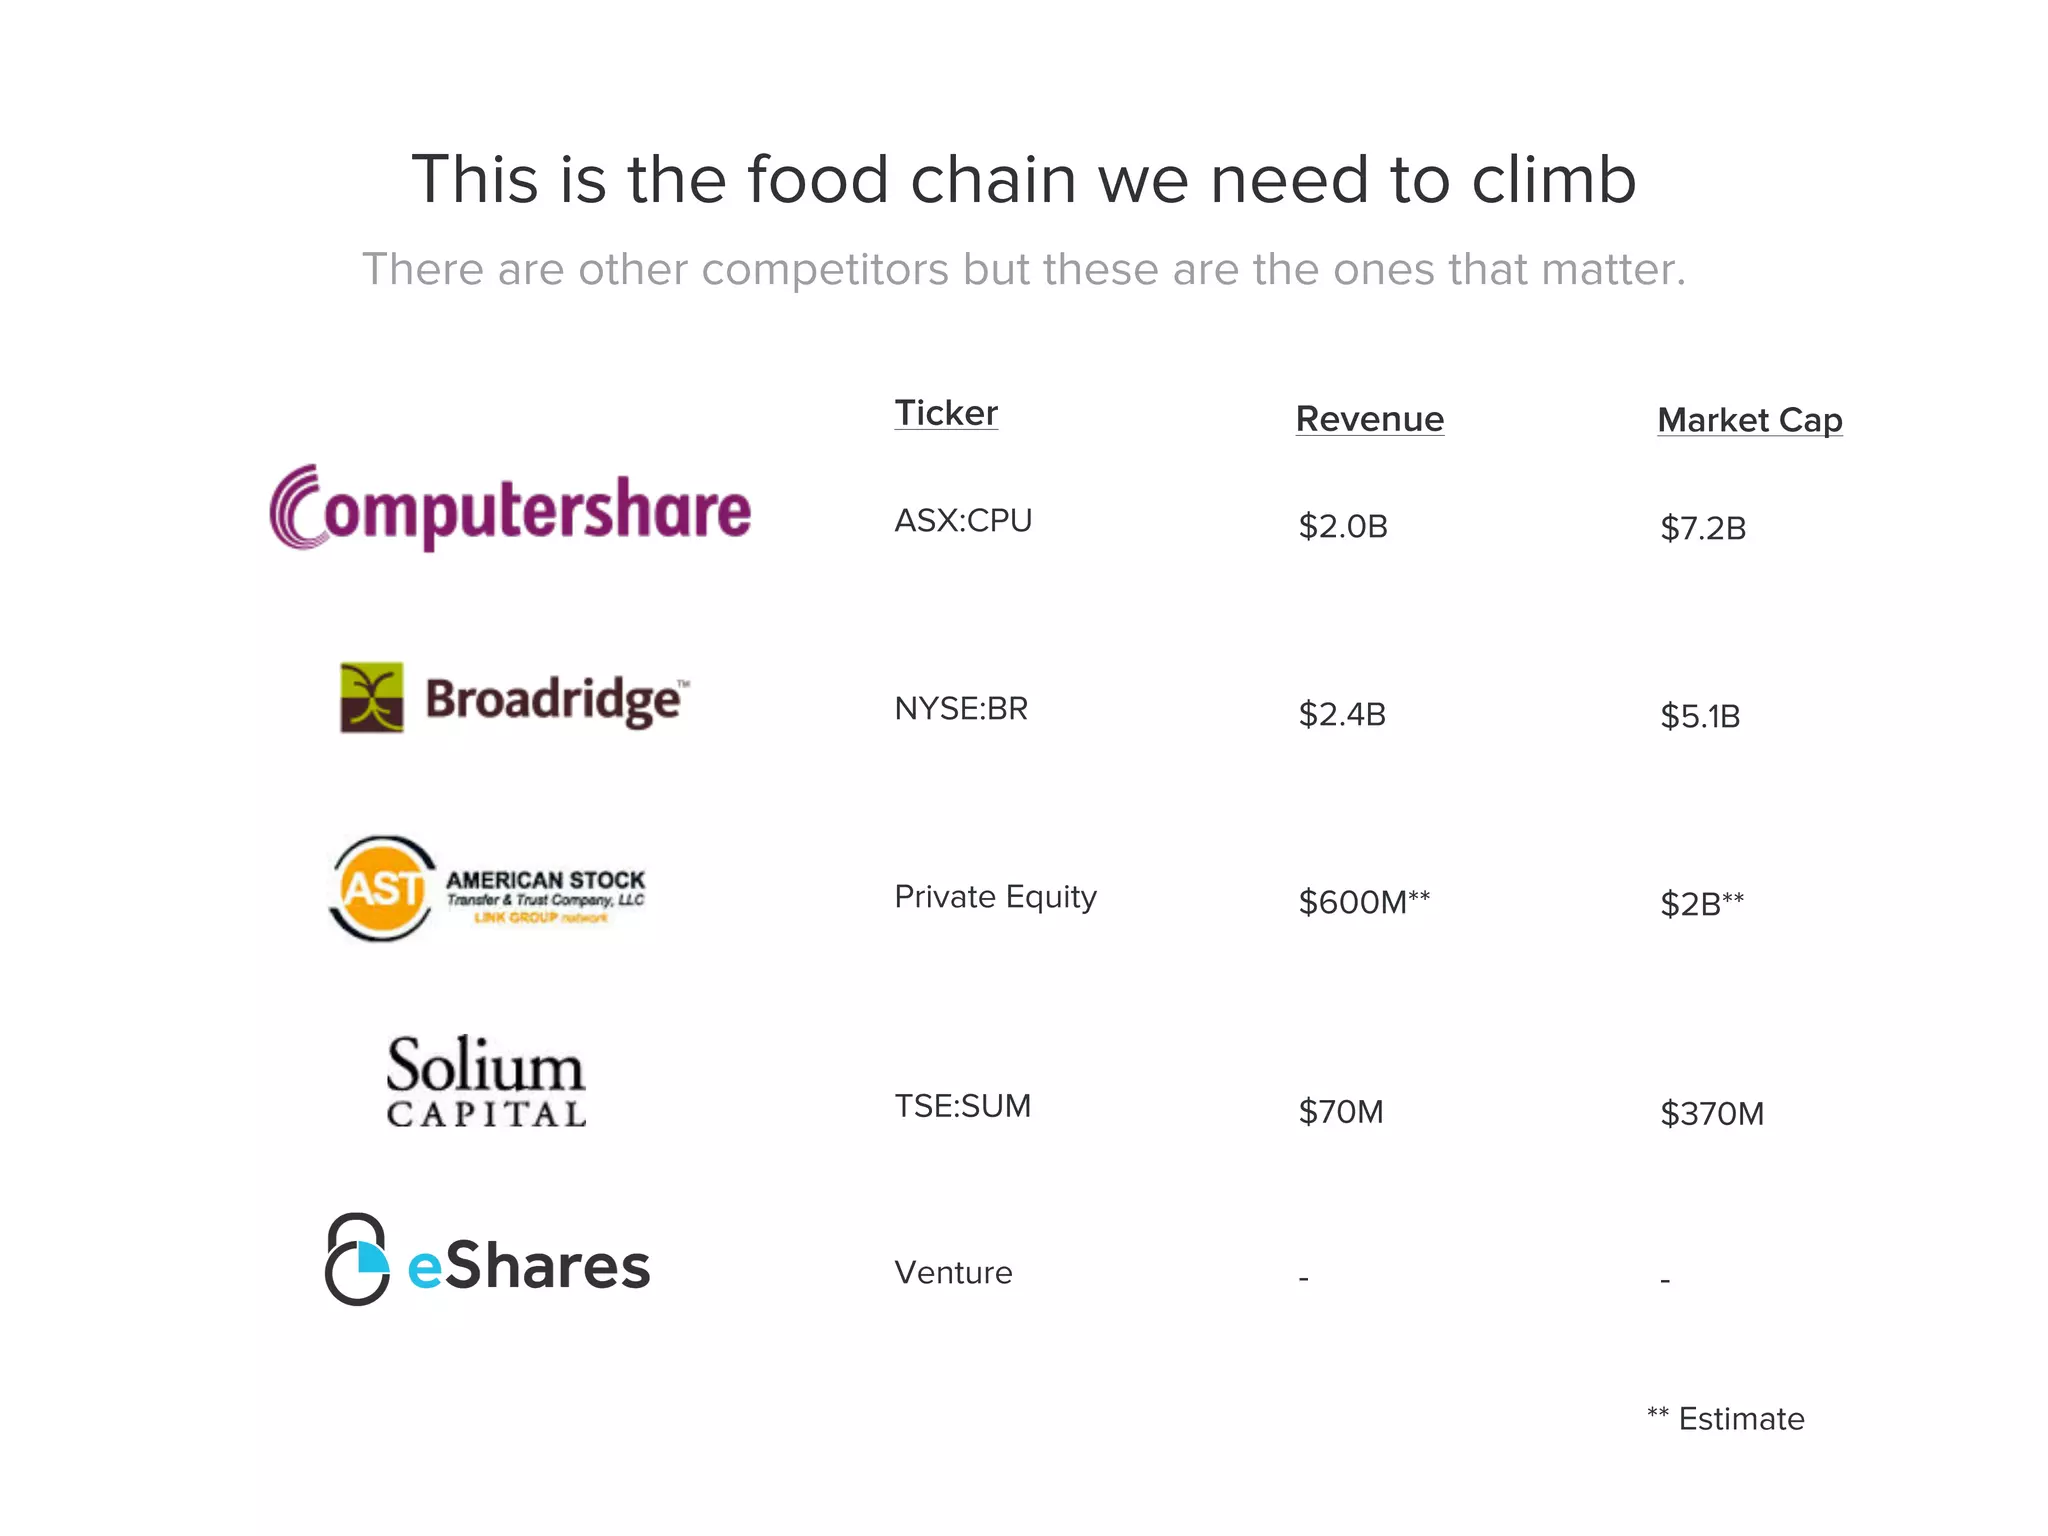
  • The deck frames the TAM via the incumbent transfer-agent market: top transfer agents (Computershare, Broadridge, AST) represent a multi-billion-dollar market (slide 30 shows combined market cap / revenue context; slide 31 lists $2.0B and $2.4B revenue numbers for incumbents and a $15B combined market cap for top 3).
  • Target customers: private, venture-backed companies in Series A–D (slide 17 shows customer logos and states “sweet spot Series A–D”).
  • No explicit TAM/SAM/SOM cube is calculated in the deck, but incumbents’ revenues and the number of private companies & funds are used to imply a large addressable market.

Business Model

  • Core: per-transaction pricing (stated headline: $20 per transaction for issuance/transfers/exercises via ACH; slide 9).
    • Free: some small-ticket items (issue common certificates to founders/advisors free) to lower adoption friction.
    • Paid (examples from slides 9–12):
      • $20 per certificate for many instrument types (LLC units, preferred, notes, options)
      • $100 one-time “full service conversion” (legal conversion of paper to electronic)
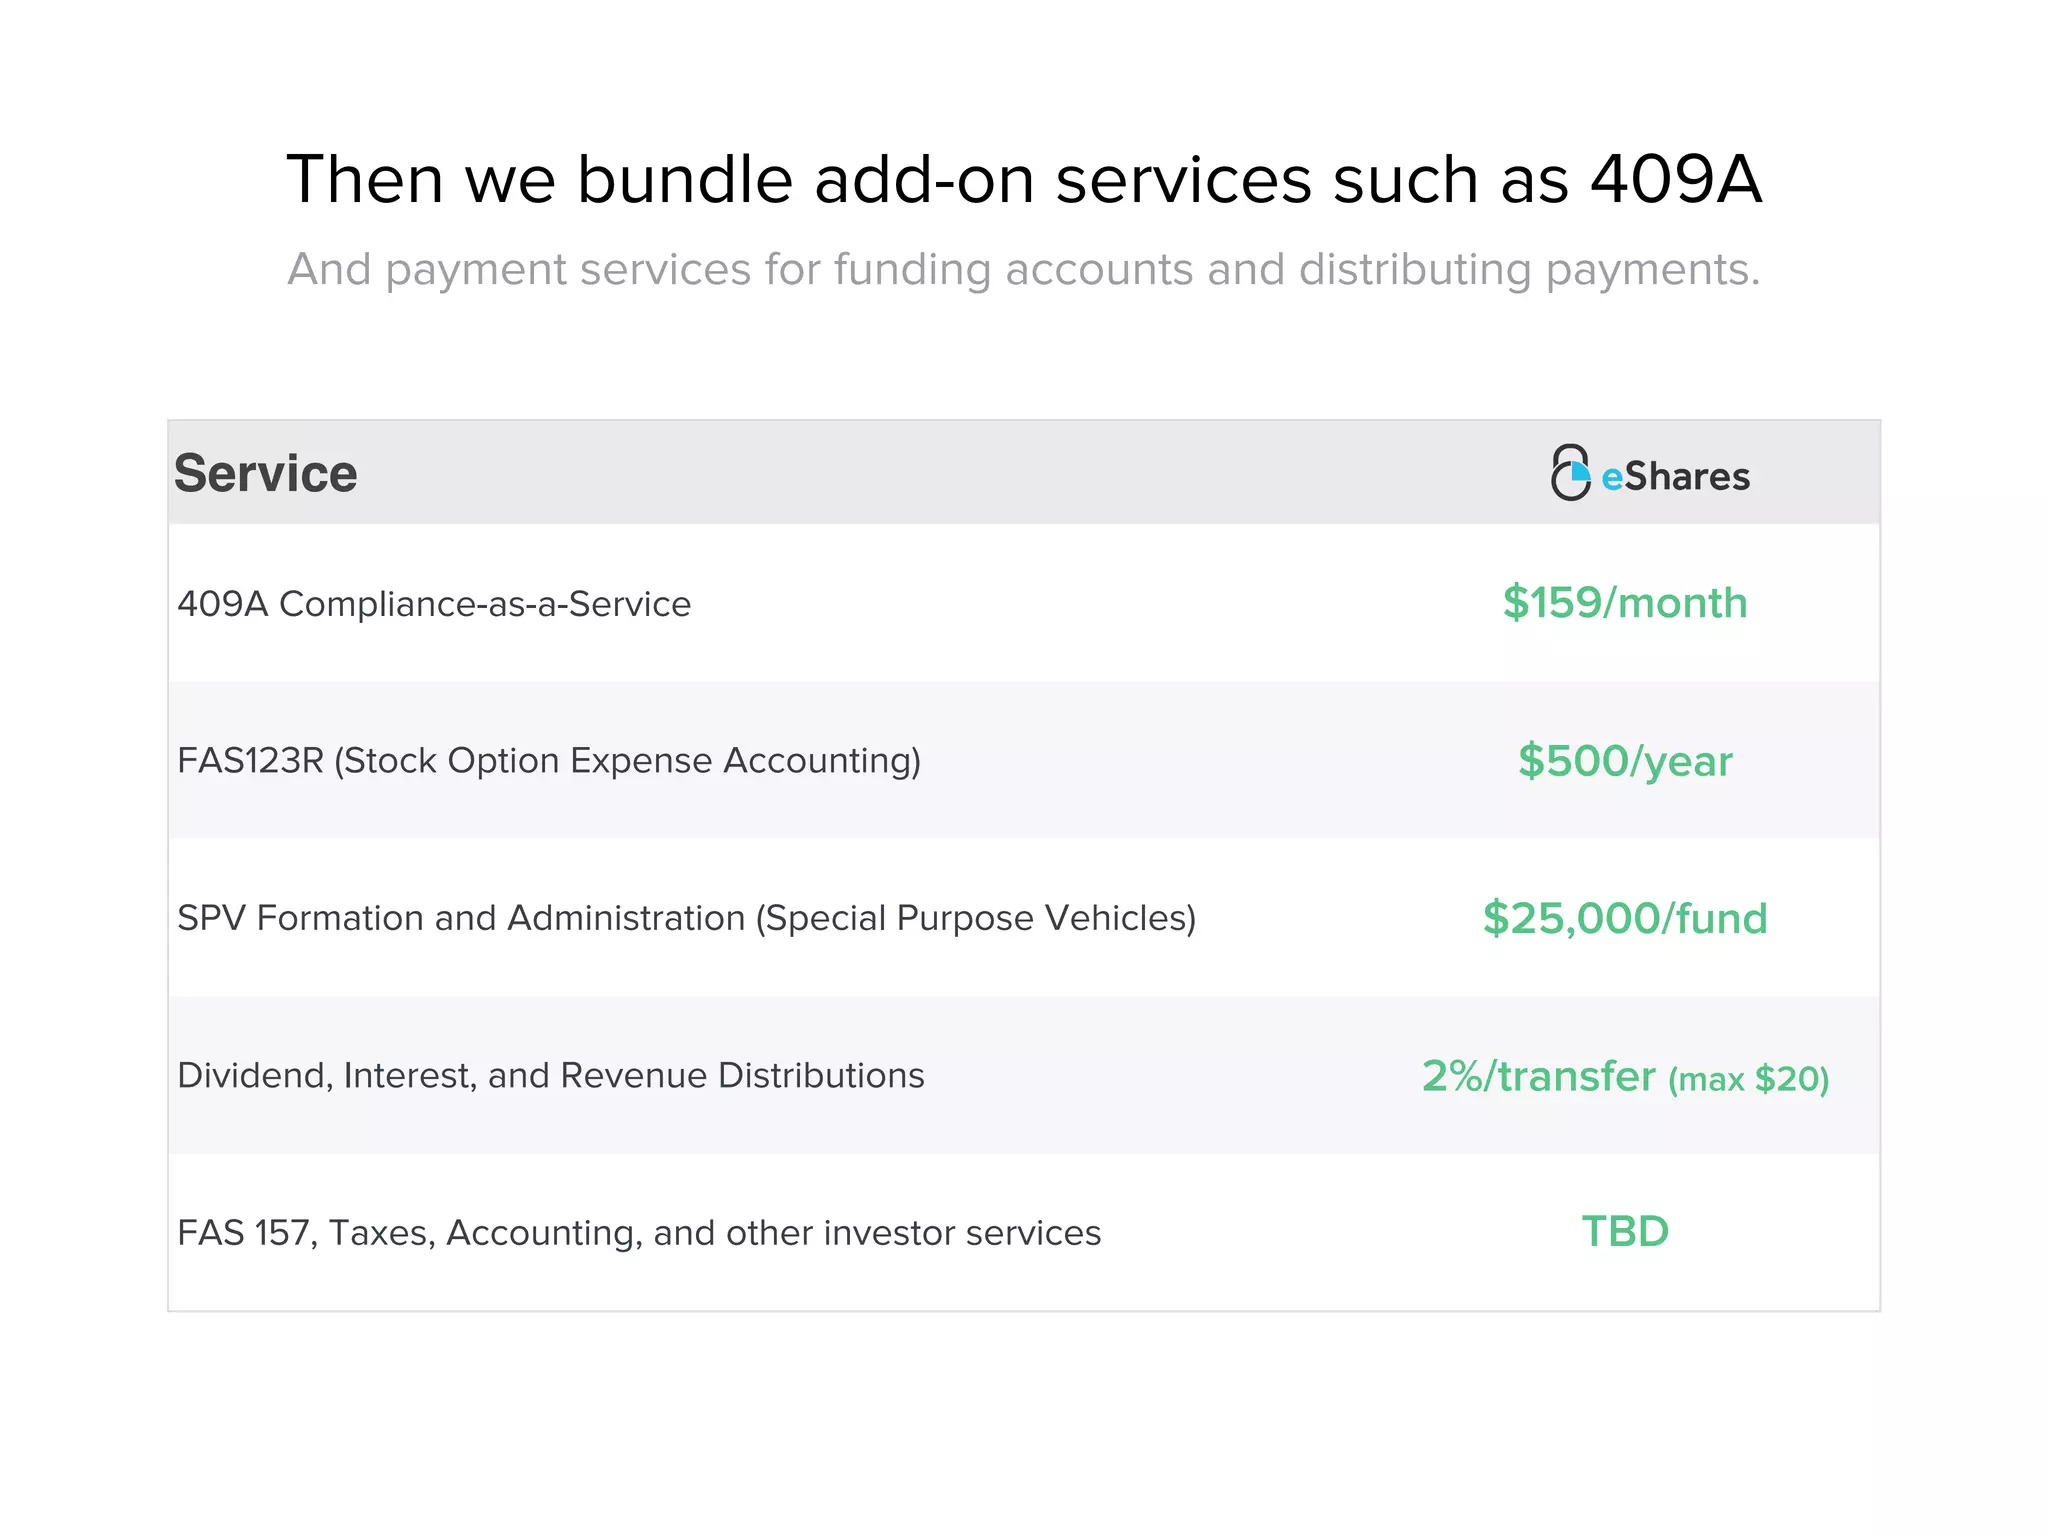
      • Add-ons: 409A Compliance-as-a-Service $159/month, FAS123R stock option accounting $500/year, SPV formation & admin $25,000/fund, dividend/interest distributions 2%/transfer (max $20)
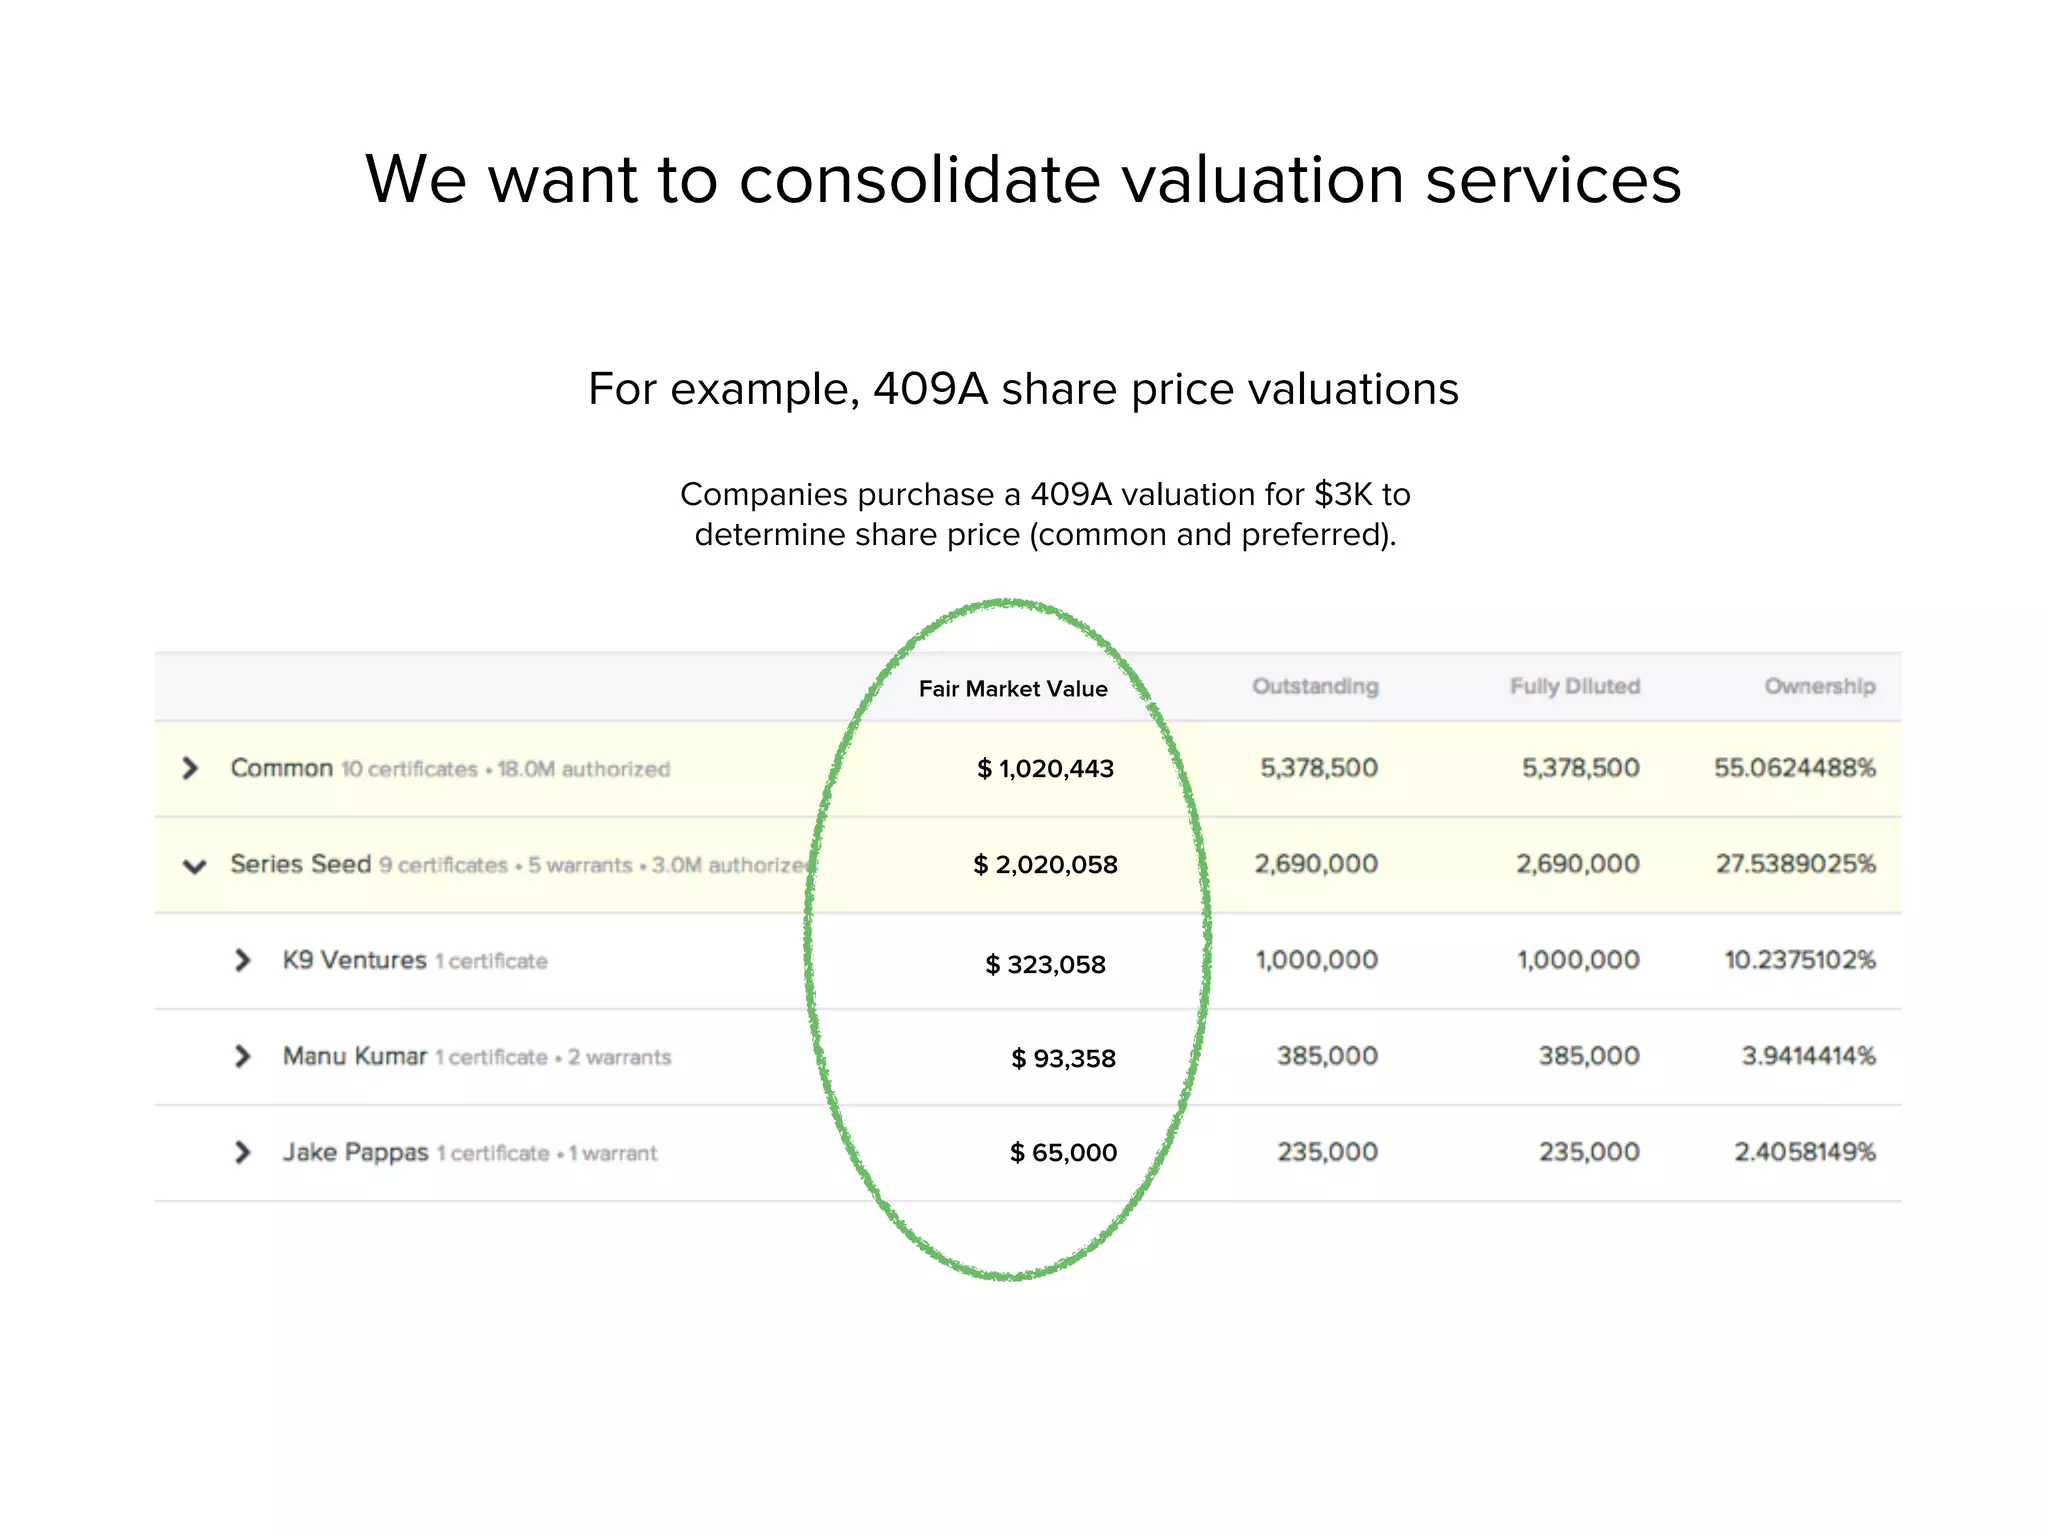
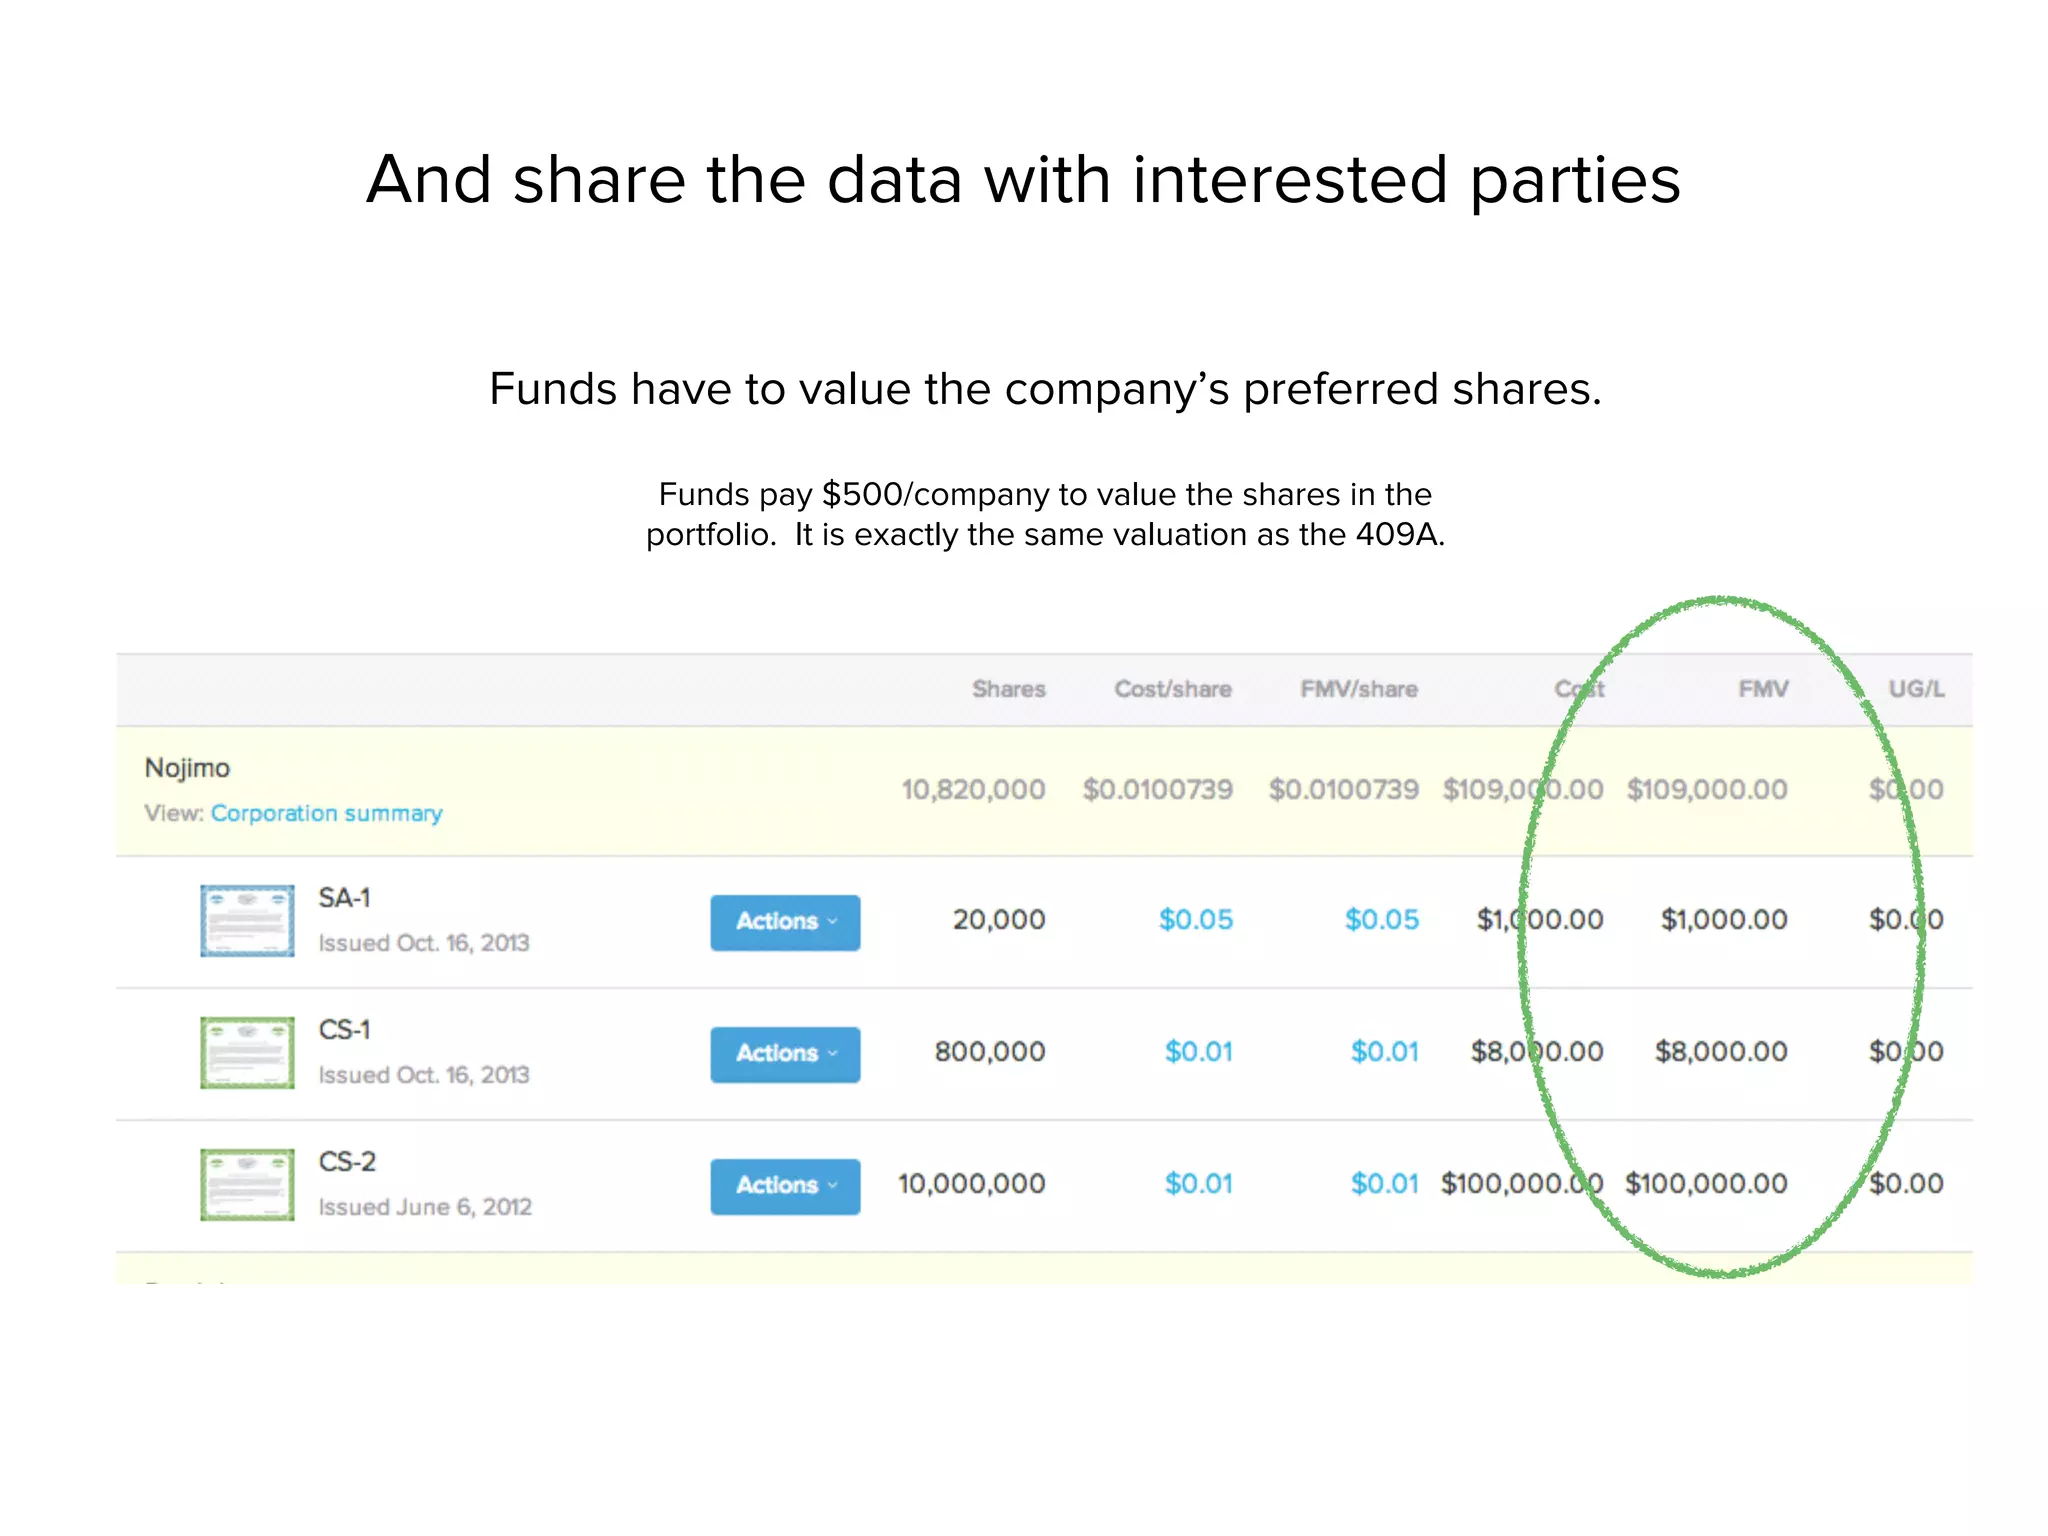
  • Upsell / data leverage: $500 409A (company valuation) sold to companies; sell valuations to funds/customers at lower unit price (e.g., $100 per fund) to multiply revenue from a single valuation (slides 40–41).

Traction & Metrics

  • Stated growth: revenue growing ~40% month-over-month (slide 13, 22).
  • Monthly revenue progression (slide 13 chart; values read from slide): Jan ~$820 → Feb ~$2.9k → Mar ~$5.4k → Apr ~$12.6k → May ~$20.4k → Jun ~$26.8k → Jul ~$38.4k → Aug ~$60–71.5k (slide annotations show ~$71,532 top-line for Aug).
  • Customer growth (slide 13): New companies per month shown (Jan–Aug): 94, 88, 77, 94, 83, 114, 105, 100. New paying companies per month: 8, 17, 31, 47, 54, 63, 47, 60.
  • Portfolio scale claims: 360+ paying companies at time-of-deck, adding 60+/month; 2,500+ investor portfolios holding $300M+ in private stock (slide 22).
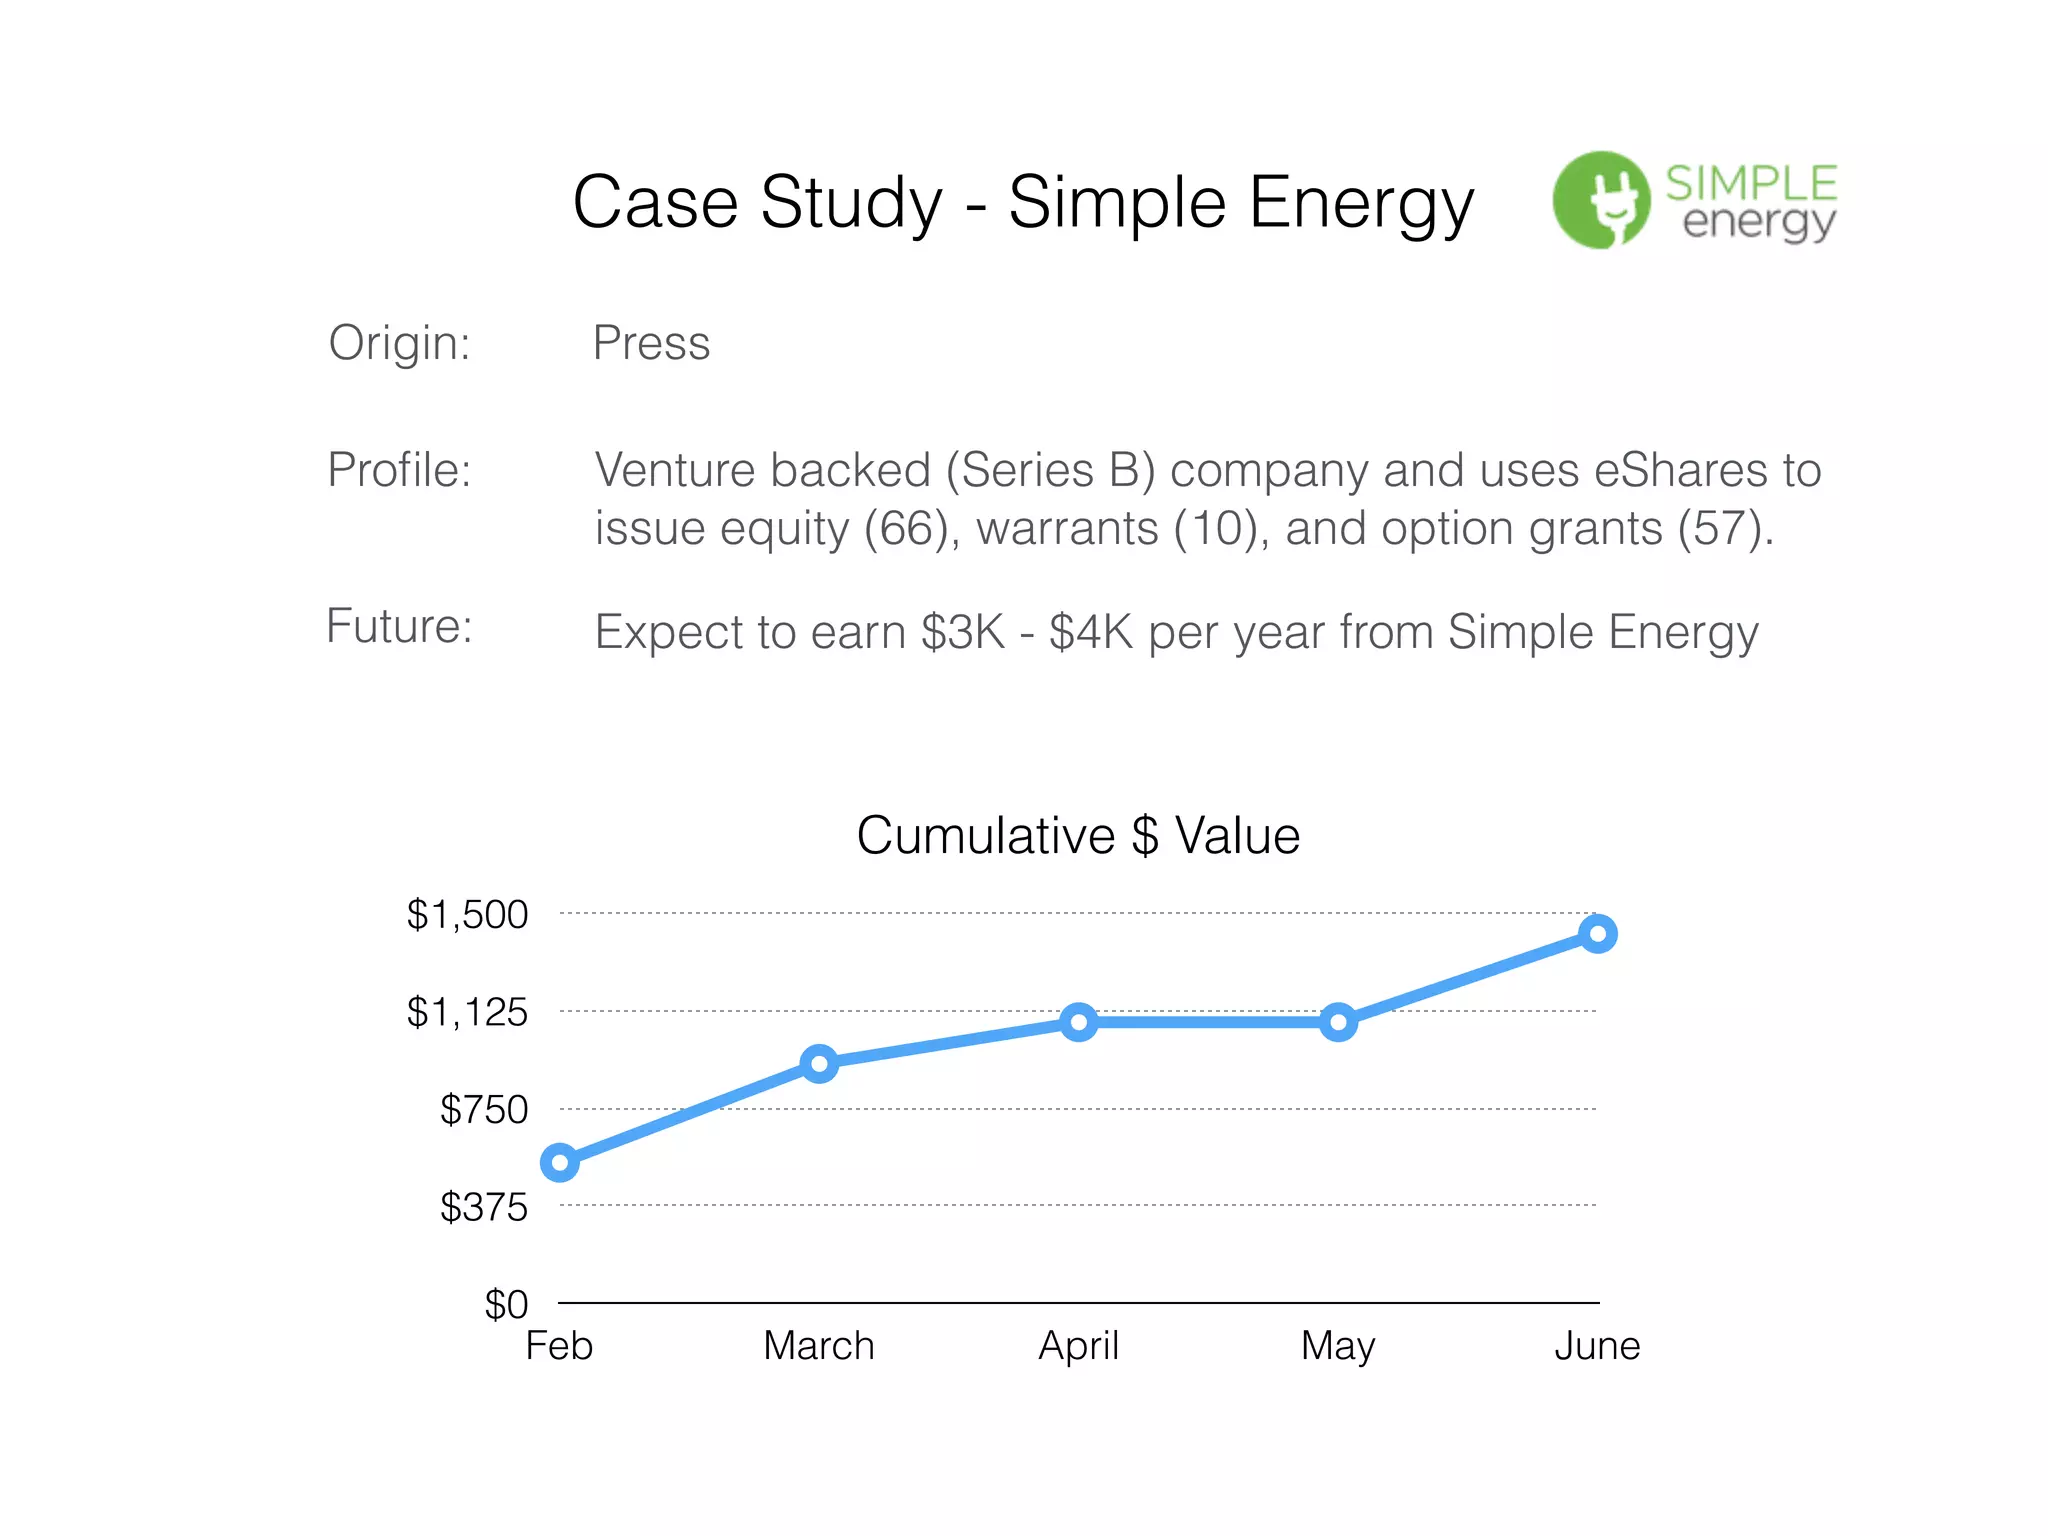
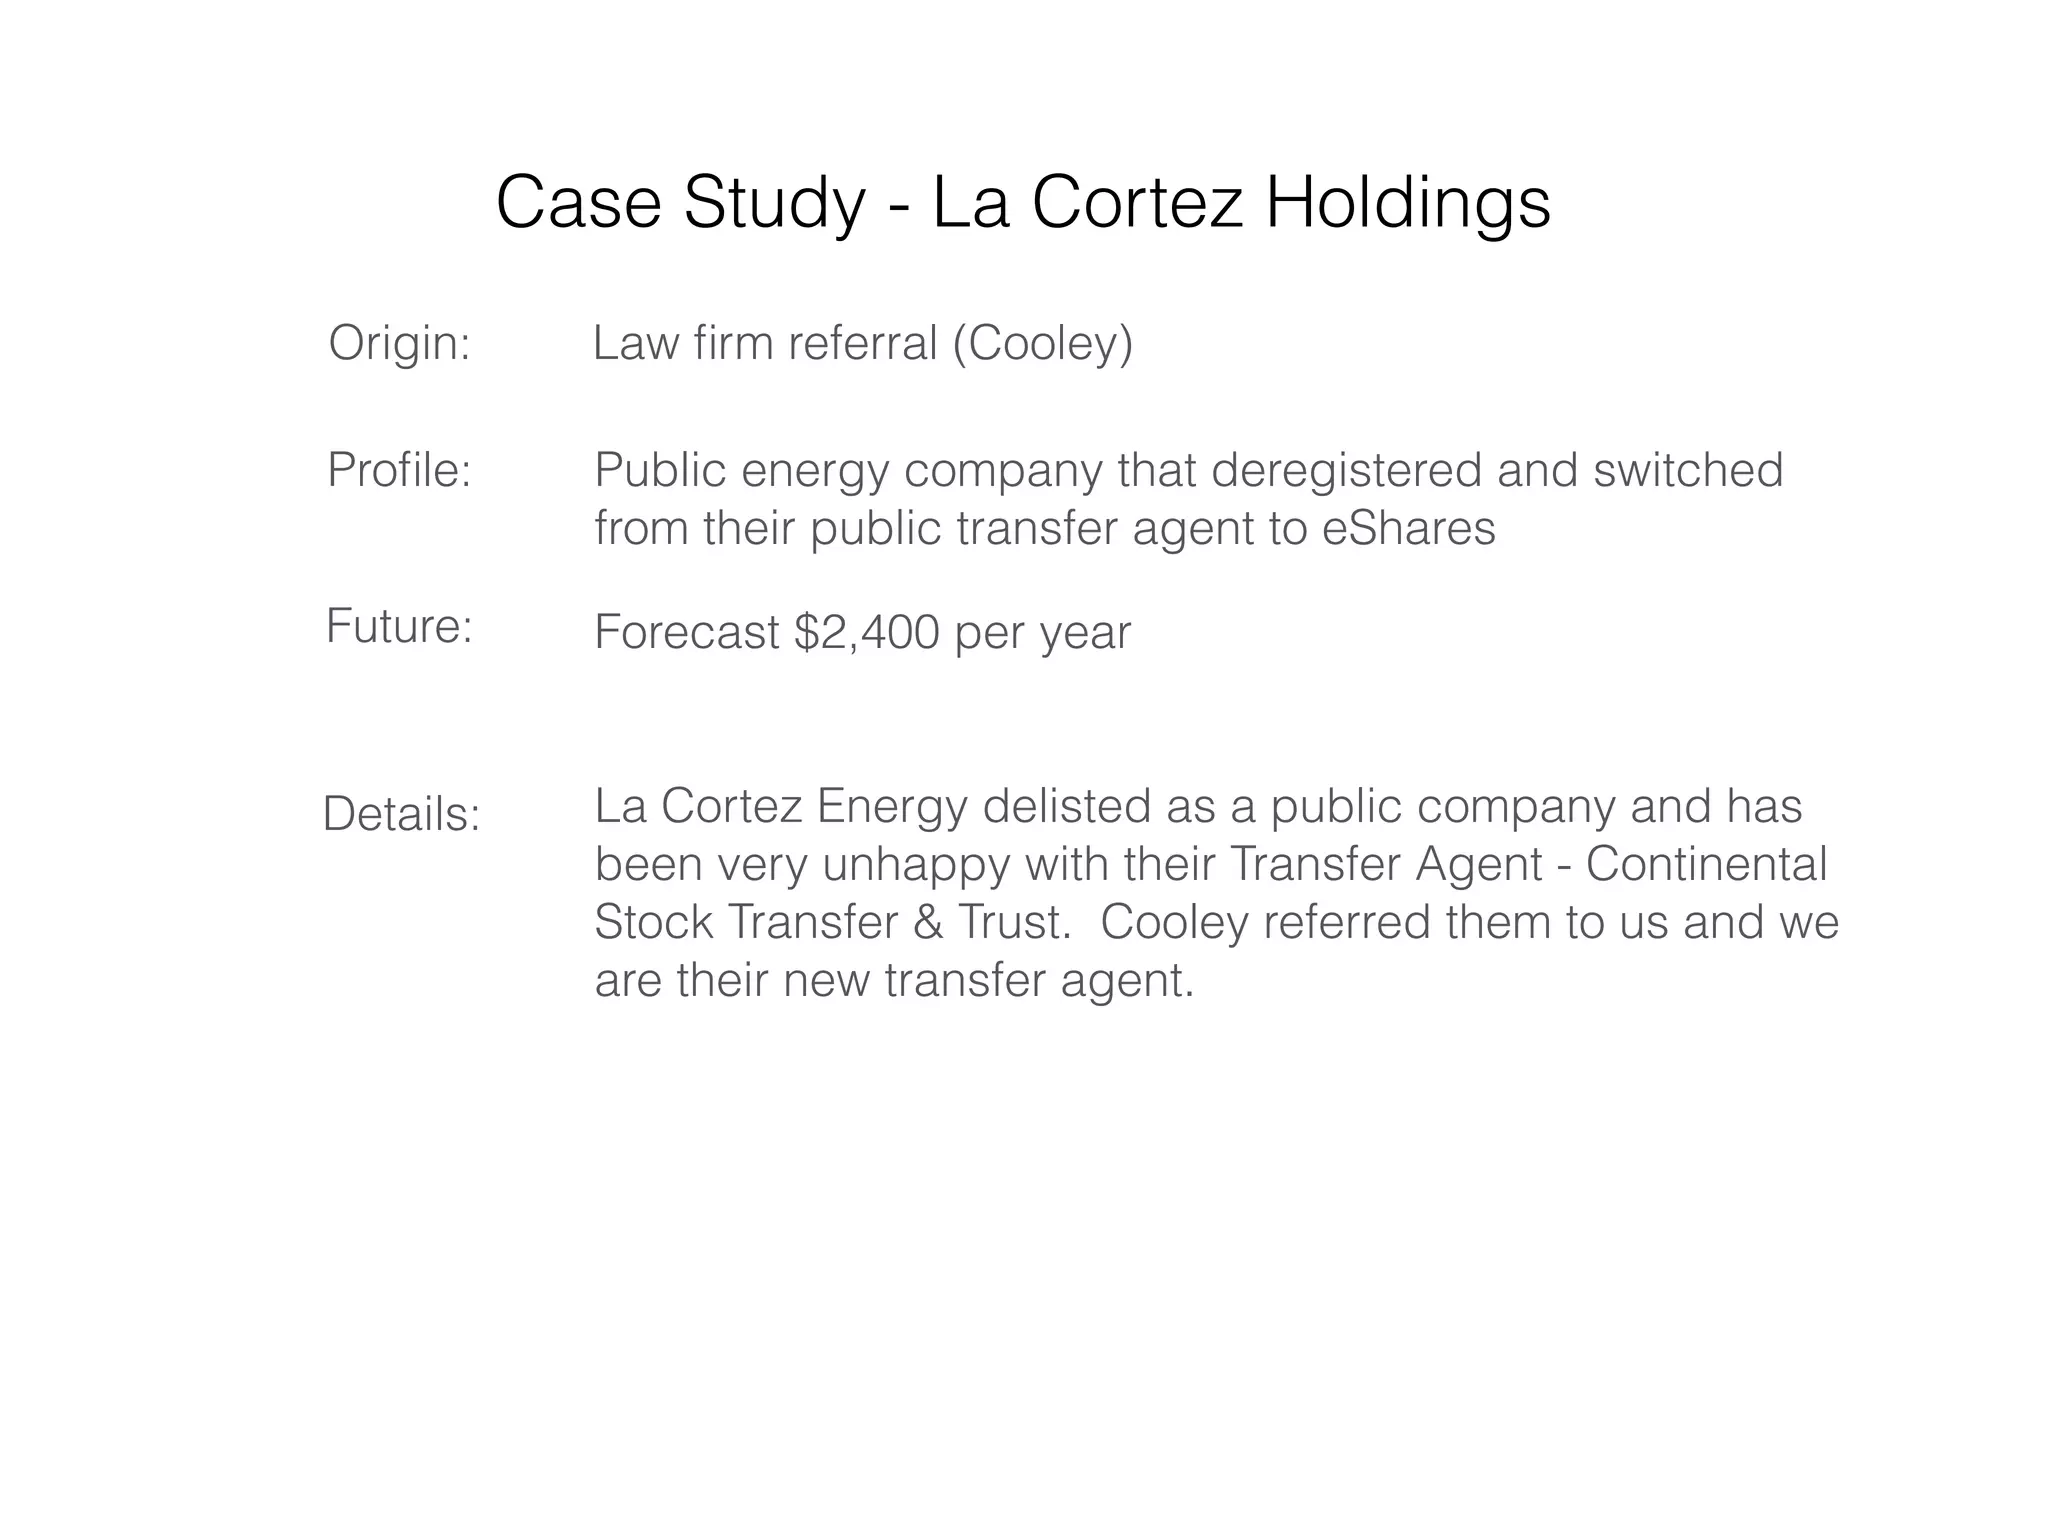
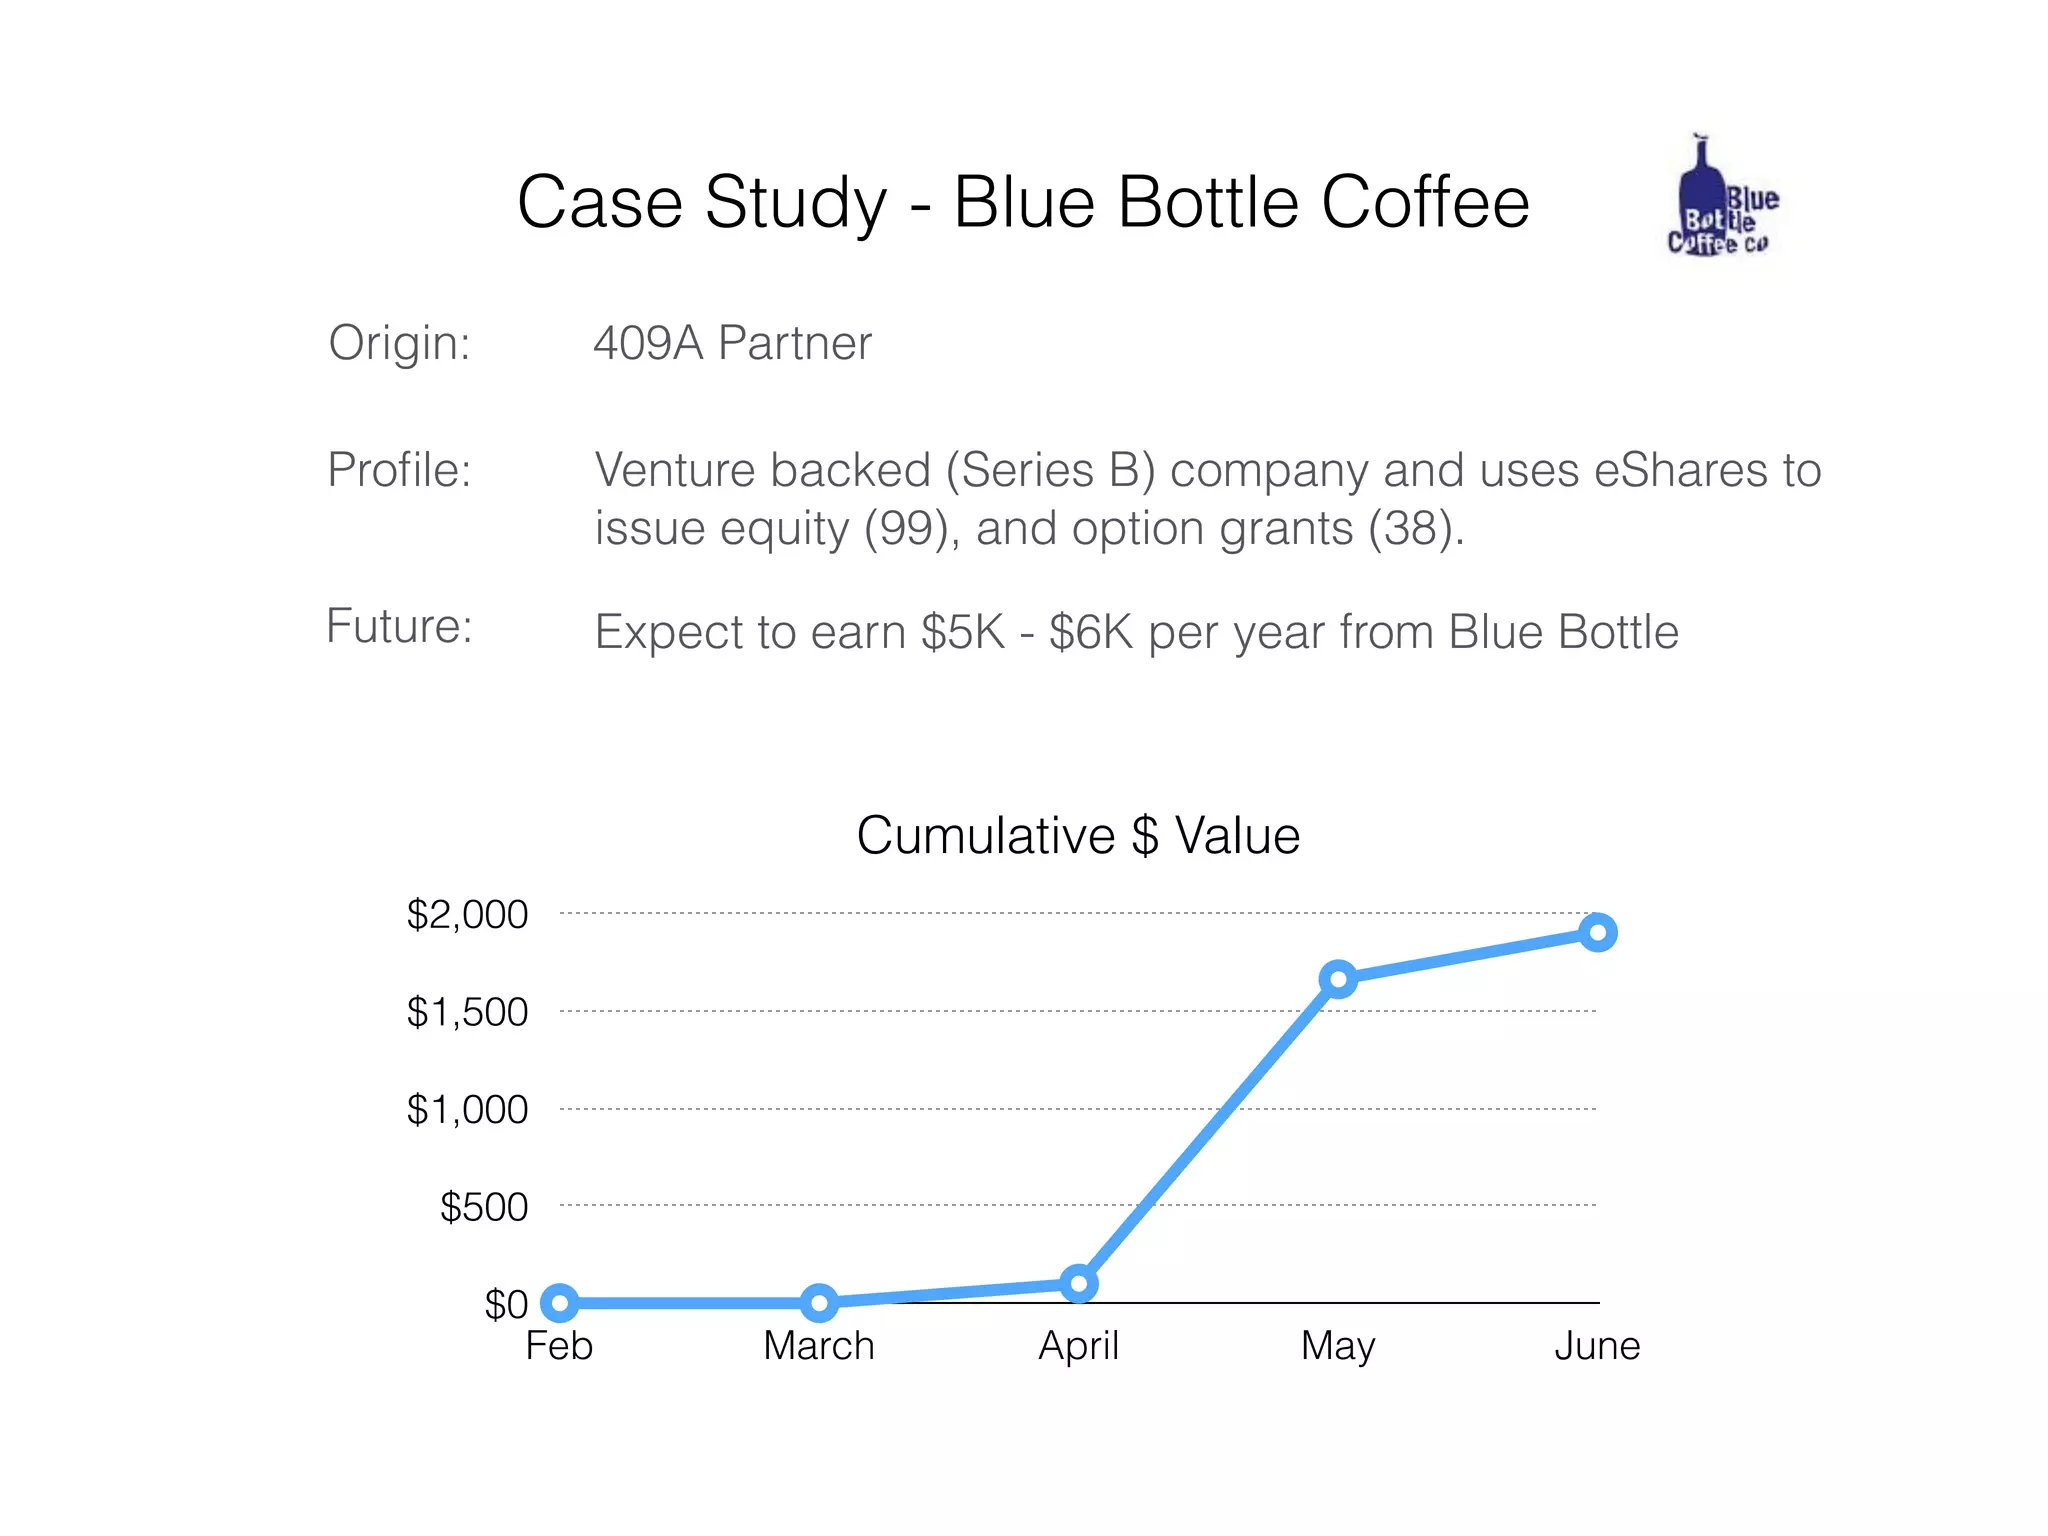
  • Case studies and expected revenue per customer example: Simple Energy ($3–4K/year), Blue Bottle ($5–6K/year), fund/SPV customers with much higher per-fund revenue (several slides in appendix; slides 33–37).
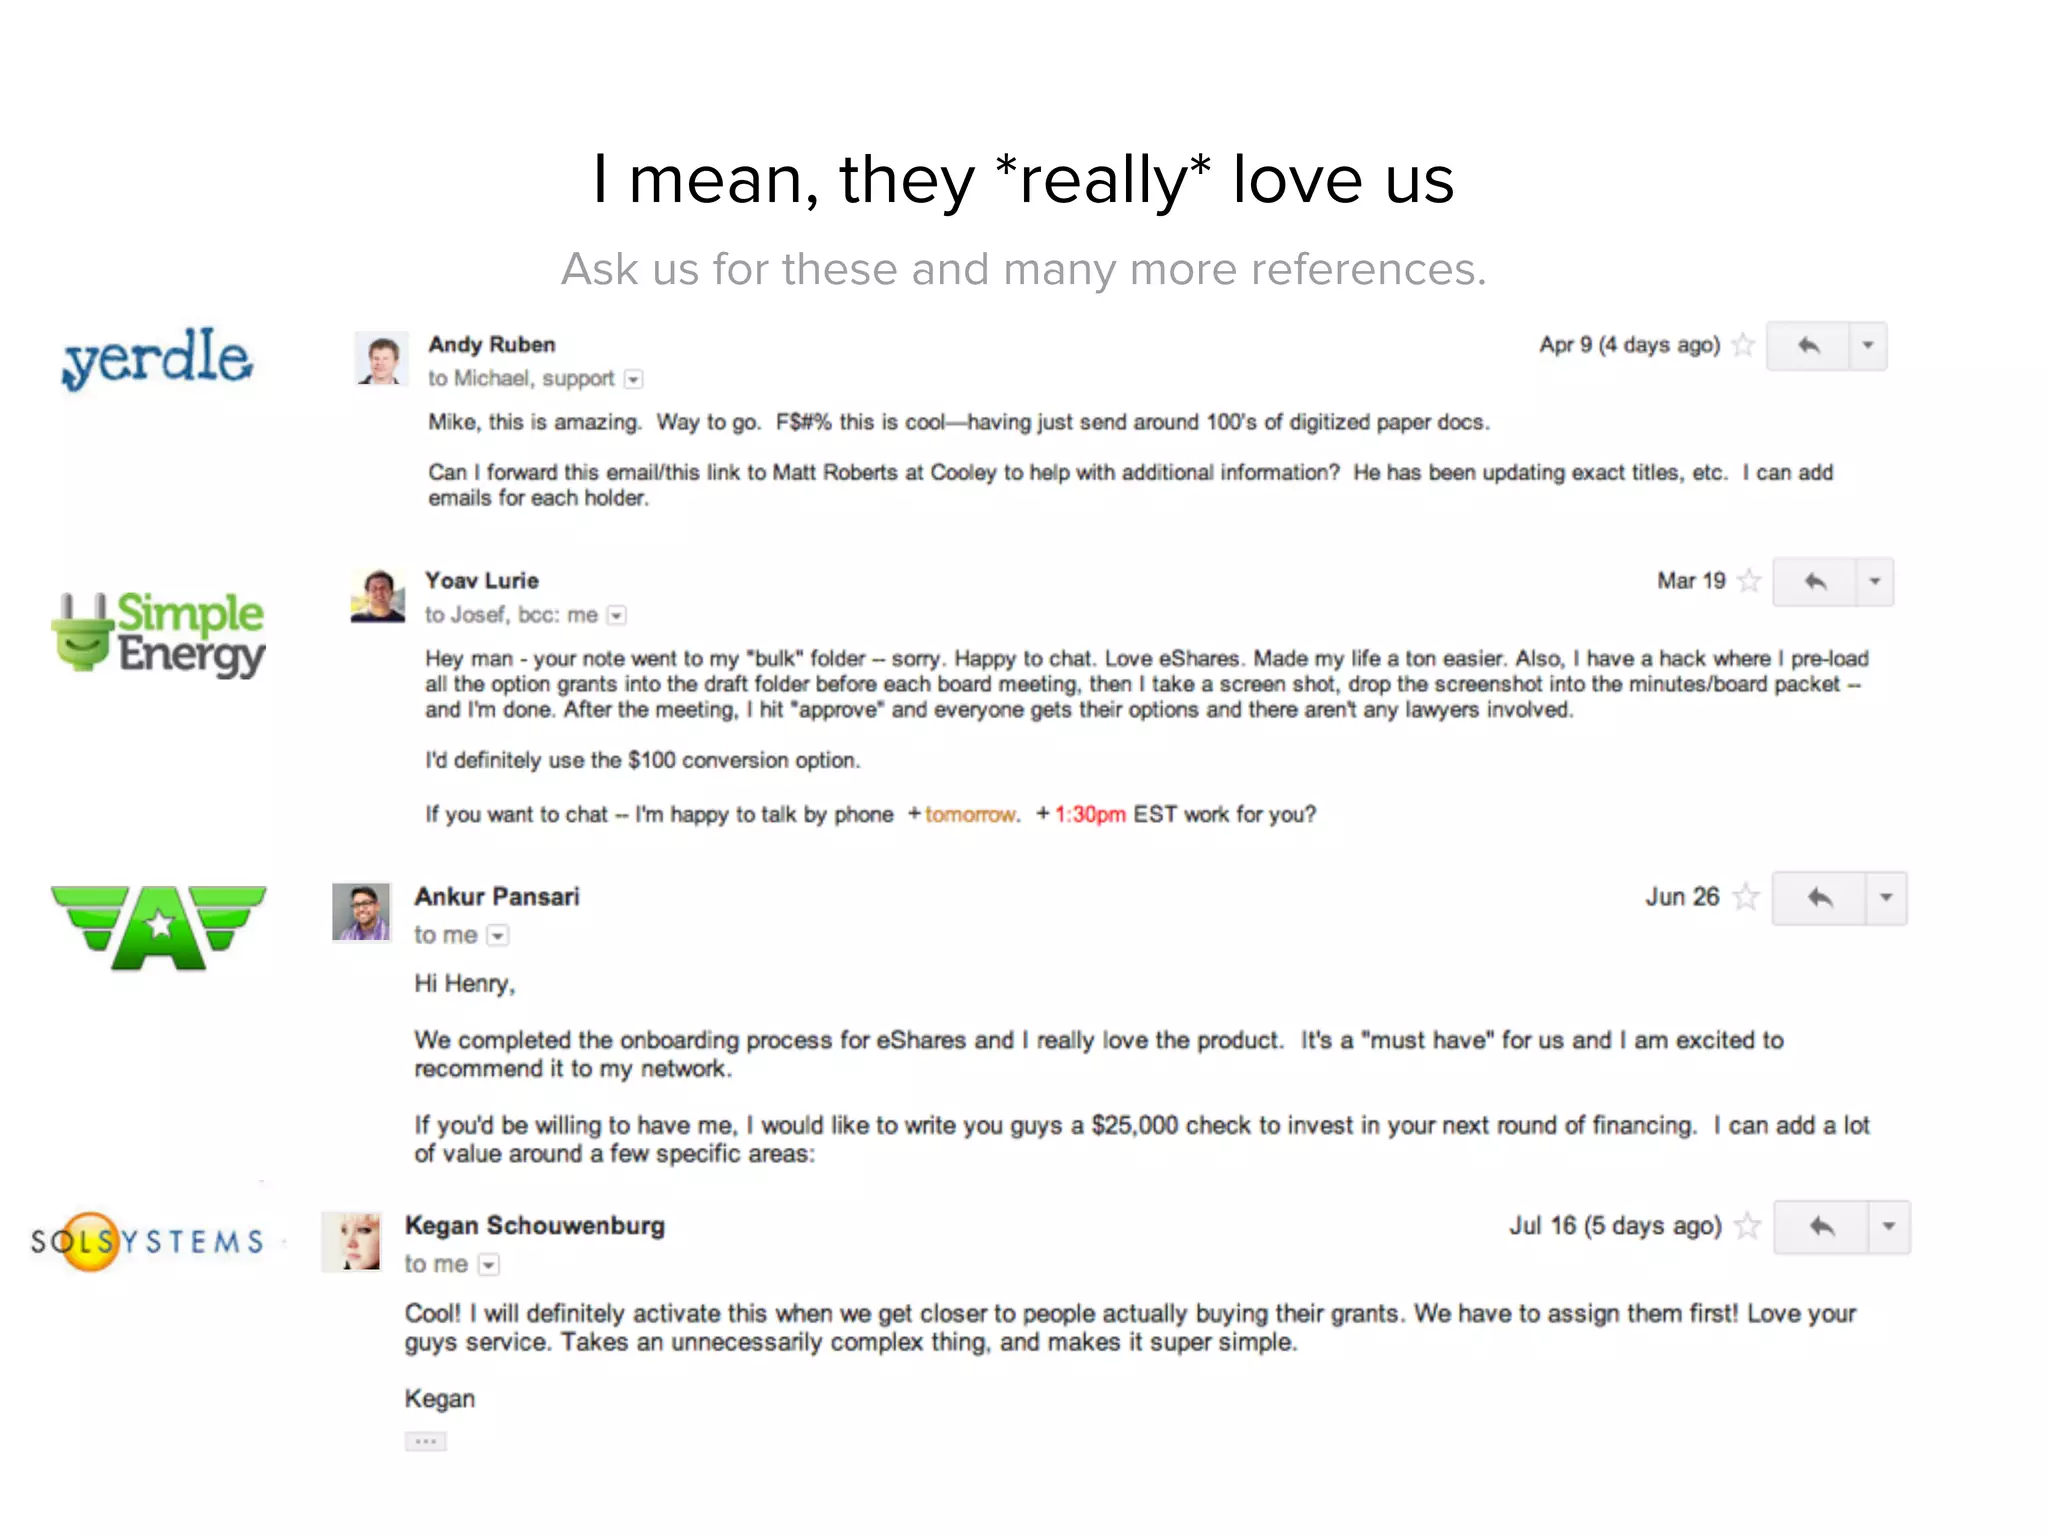
  • Organic product virality and legal referrals are cited as primary distribution (testimonials & law firm endorsements on slides 15–20).

Competitive Positioning

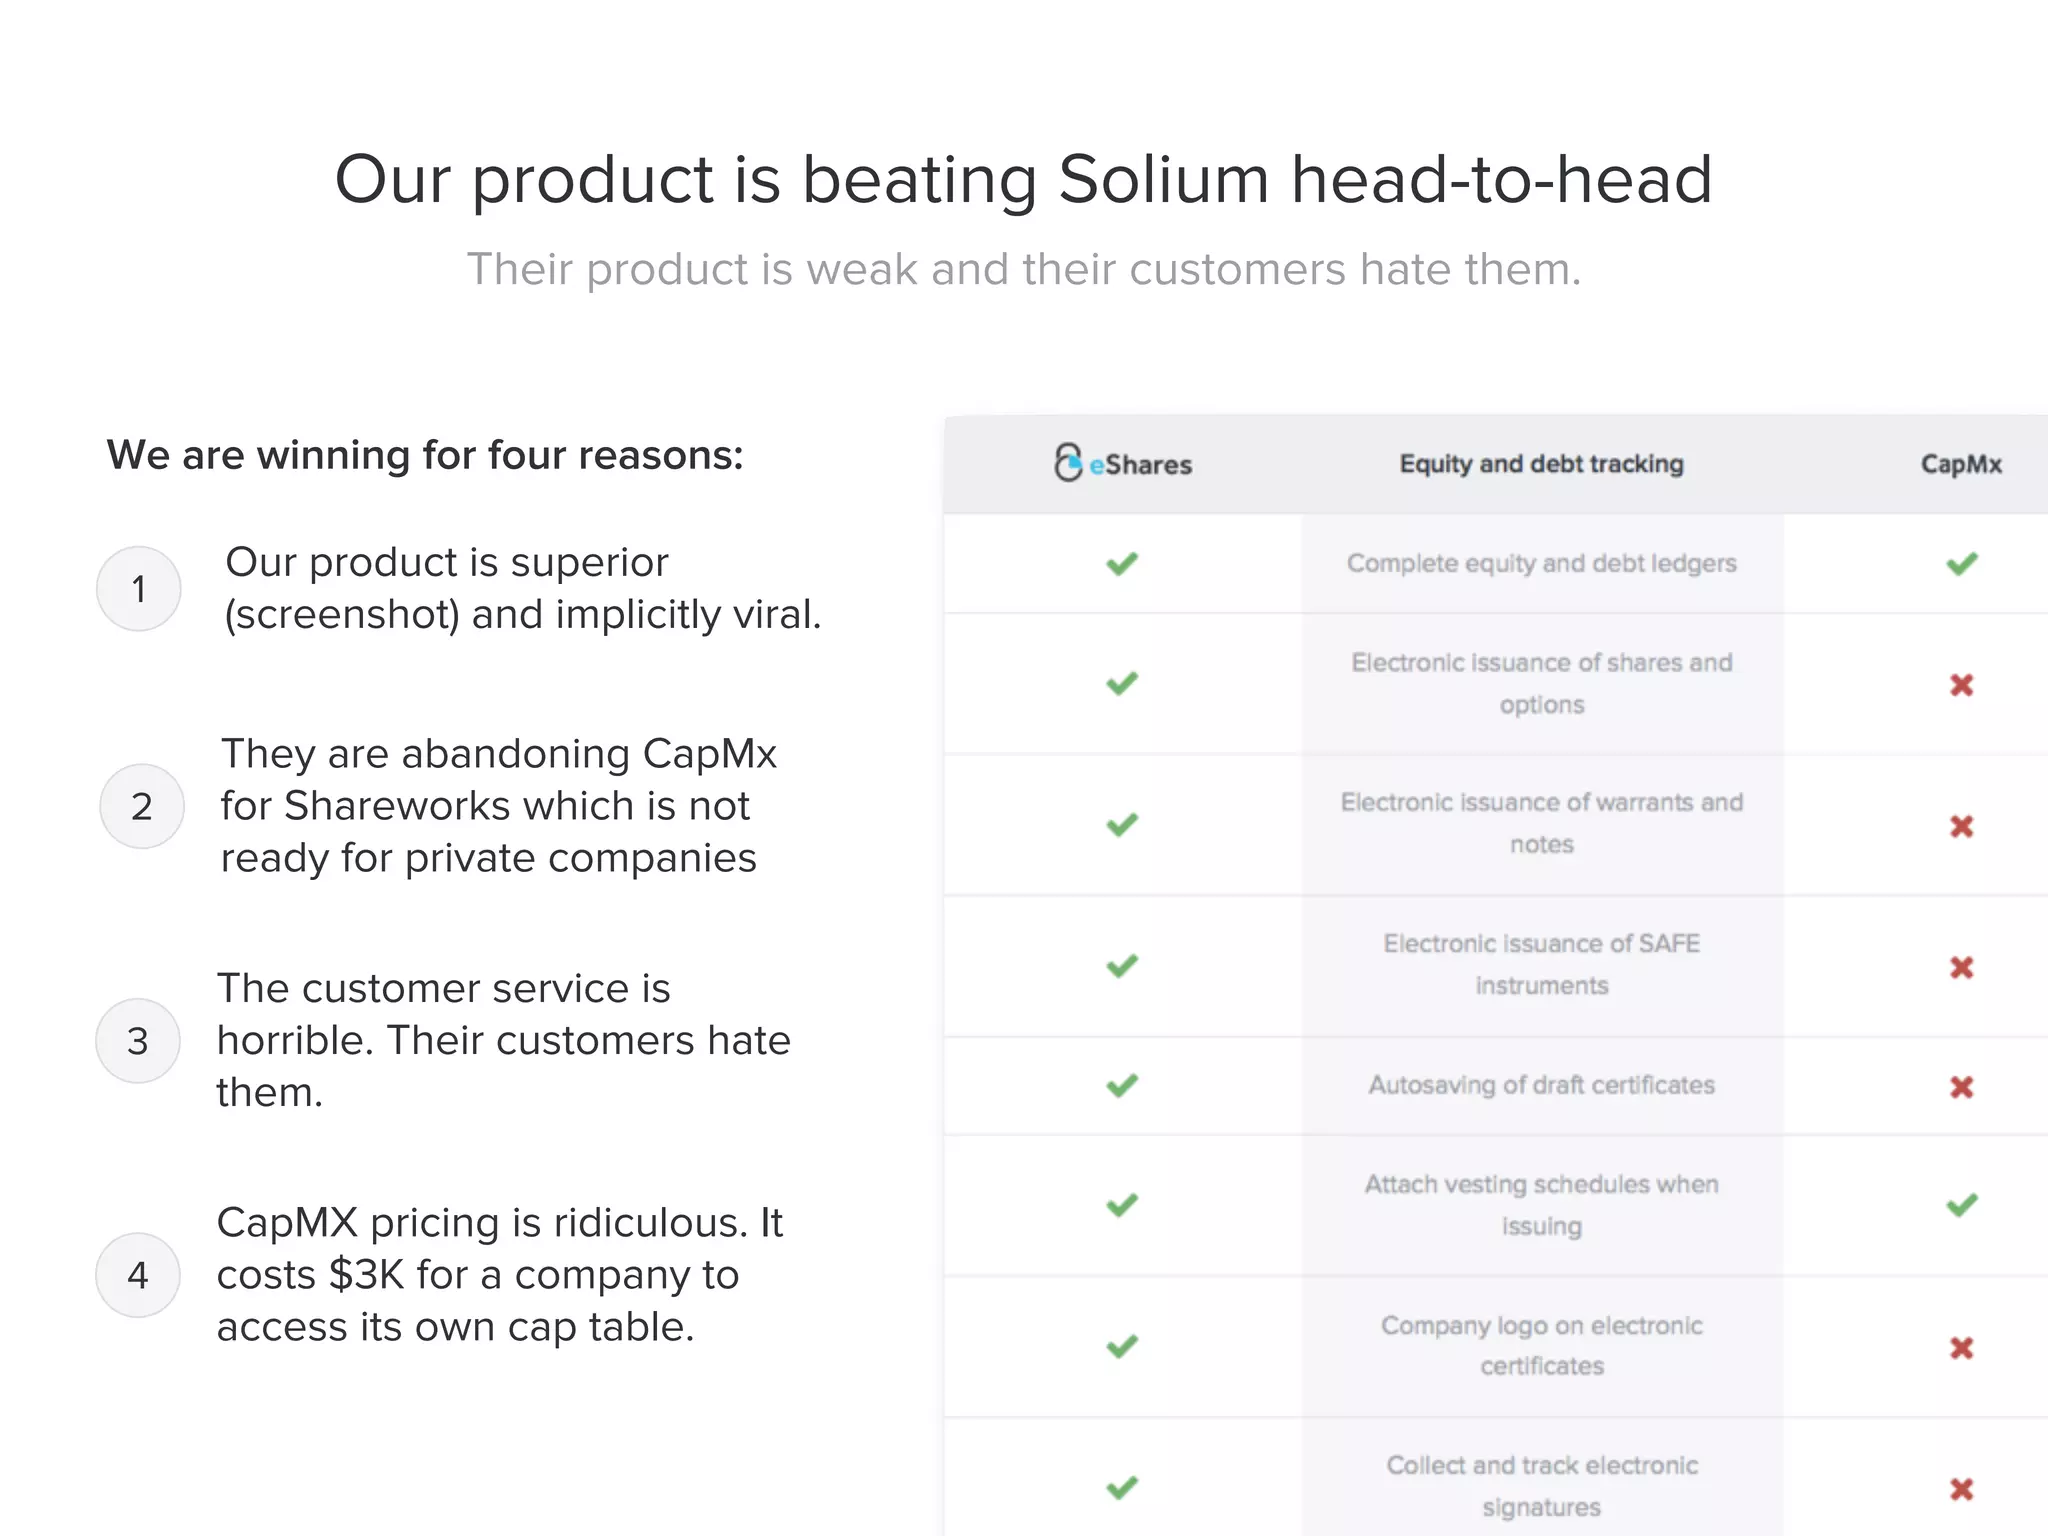
  • Main incumbent/comparator: Solium/CapMx / Shareworks and traditional transfer agents (slides 3 & 19–21).
  • Differentiation claims:
    • Product-first and viral UX that supports private-company workflows (slides 5–8, 19).
    • Much cheaper and more accessible pricing than legacy competitors (claim that CapMX charges $3K to access your cap table; slide 19).
    • SEC-registered transfer agent (regulatory credibility / moat) — highlighted as unique in the private-company space (slide 4).
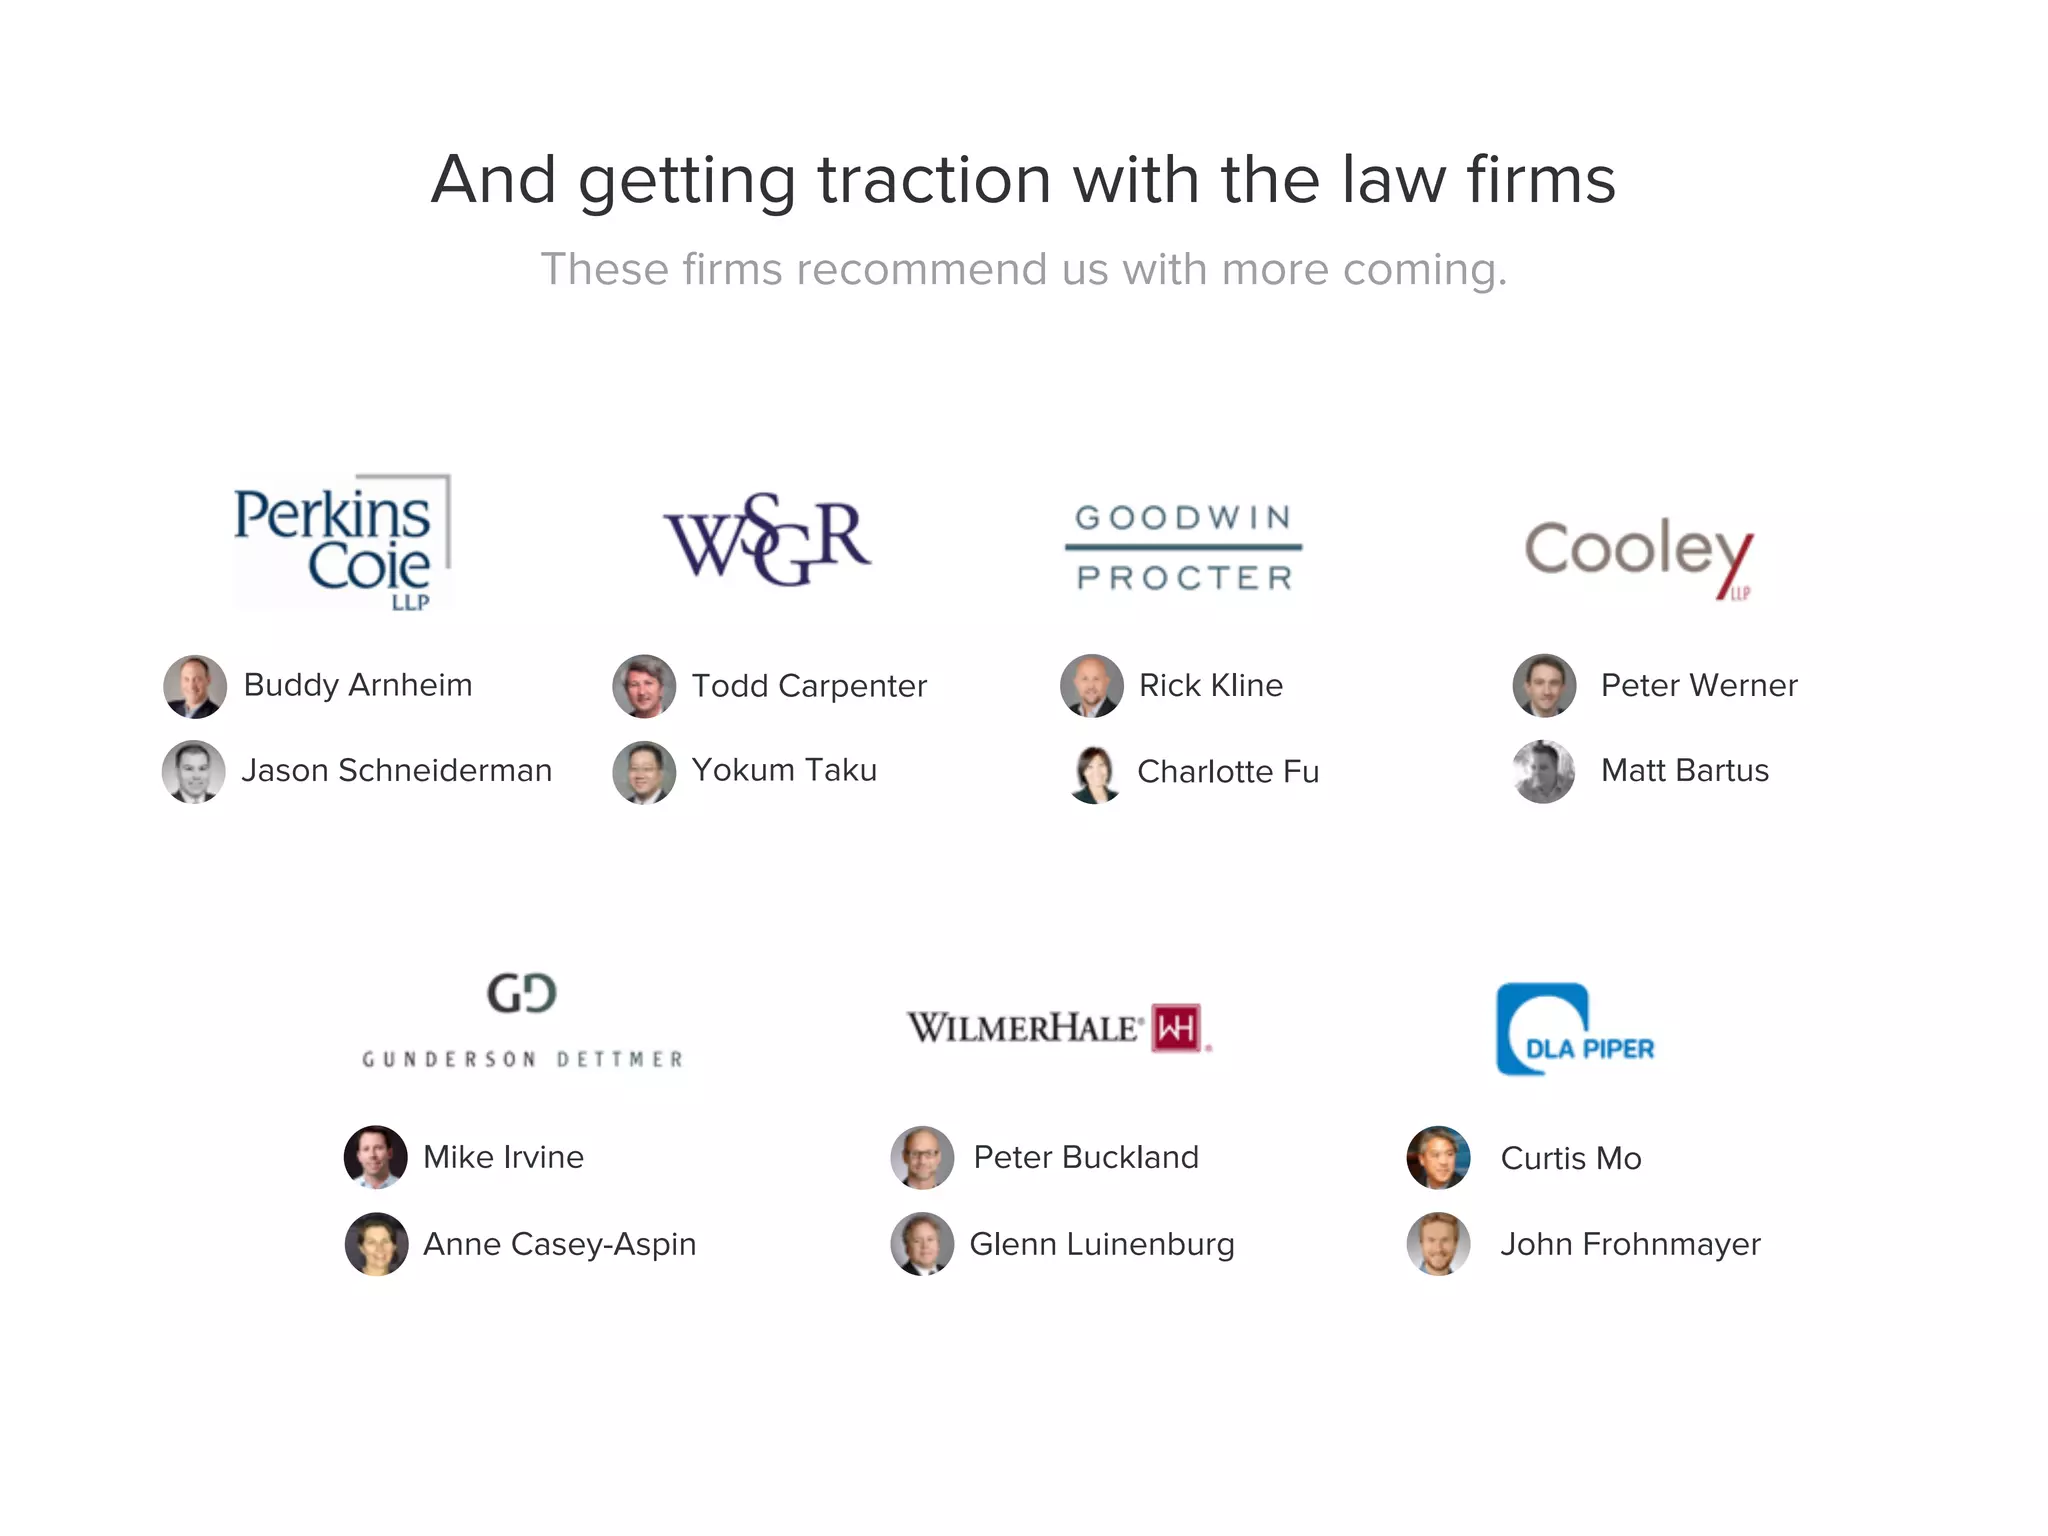
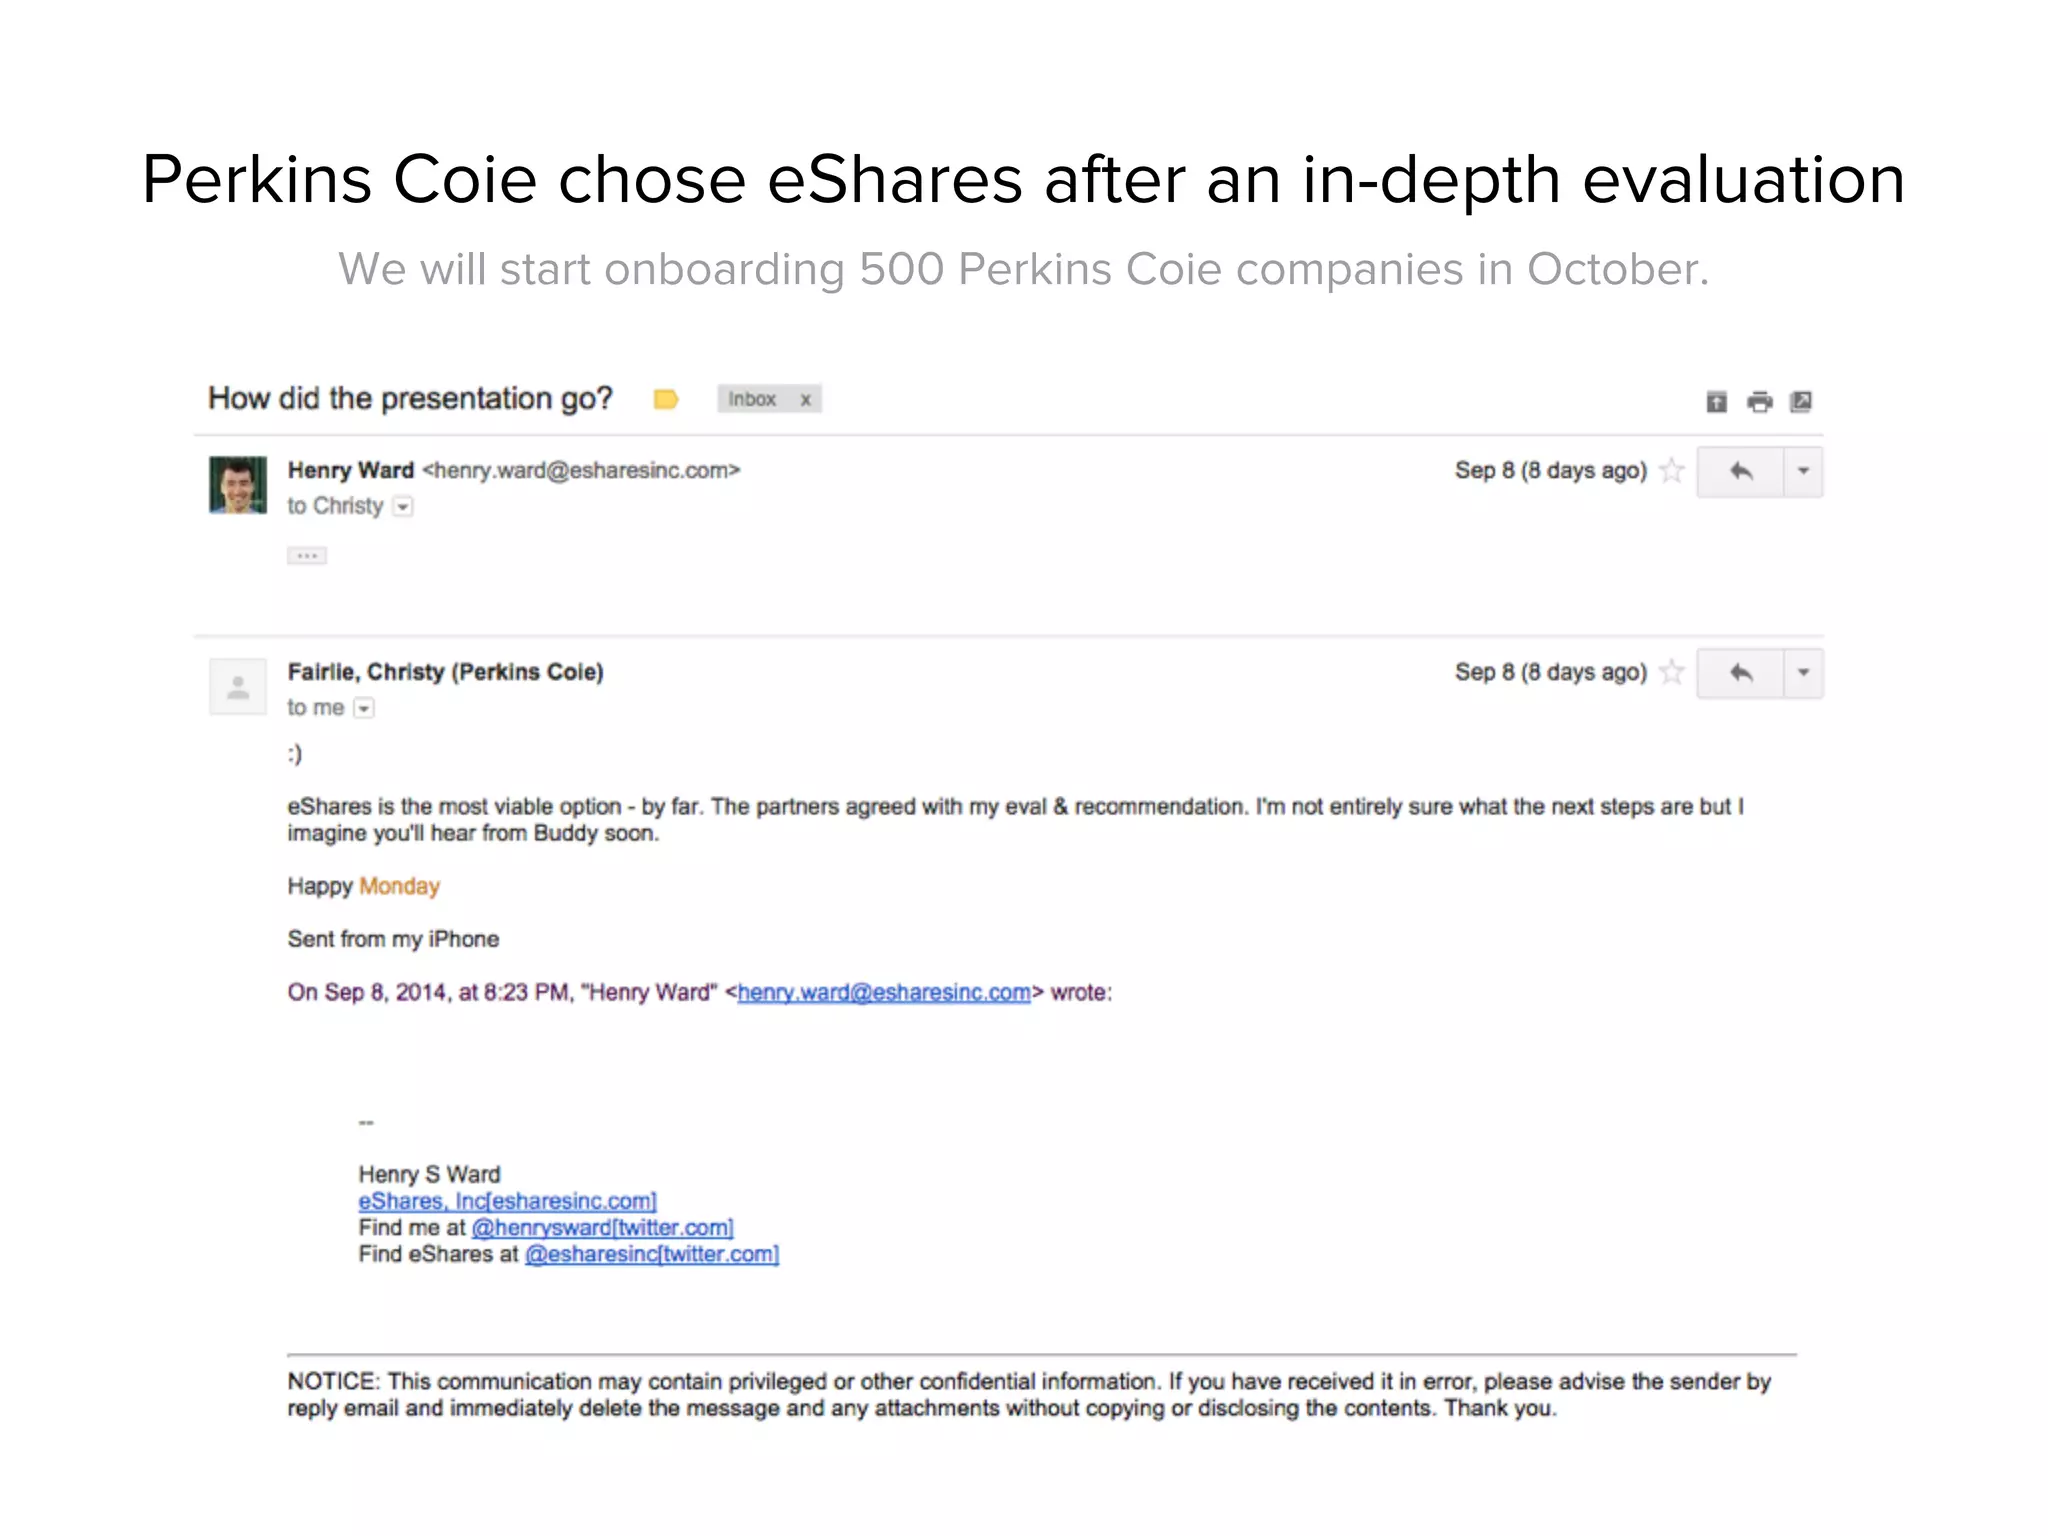
    • Strong legal partnerships and endorsements from major law firms that refer clients (slide 18–20).

Team

  • Small, product-focused founding team with backgrounds across operations, legal/compliance (corporate attorney experience), engineers from trading/finance platforms and designers. The deck emphasizes legal/compliance and product/engineering depth (slide 23).
  • Note: the deck highlights being lean and capital-efficient: built product in ~1 year on ~$1.2M (slide 22).

Go-to-Market Strategy

  • Product-led growth: free core service to seed viral adoption; customers invite investors, advisors, lawyers onto the platform (slides 5–8, 11).
  • Law-firm partnerships: onboarding and referrals via major corporate law firms (slides 18–19).
  • Channel expansion into fund services and SPV formation: sell higher-ticket services to funds and platforms (slides 11–12, 27–37).
  • No outbound sales initially (“zero sales people” claim) — intent to invest Series A proceeds into building distribution & sales (slides 21–23).

The Ask

  • Company context: seed capital raised ~$1.8M (historical).
  • The deck itself includes a plan/ask for the next round: an A round of $6–8M to scale distribution, take companies public and expand product & operations (slide 23).
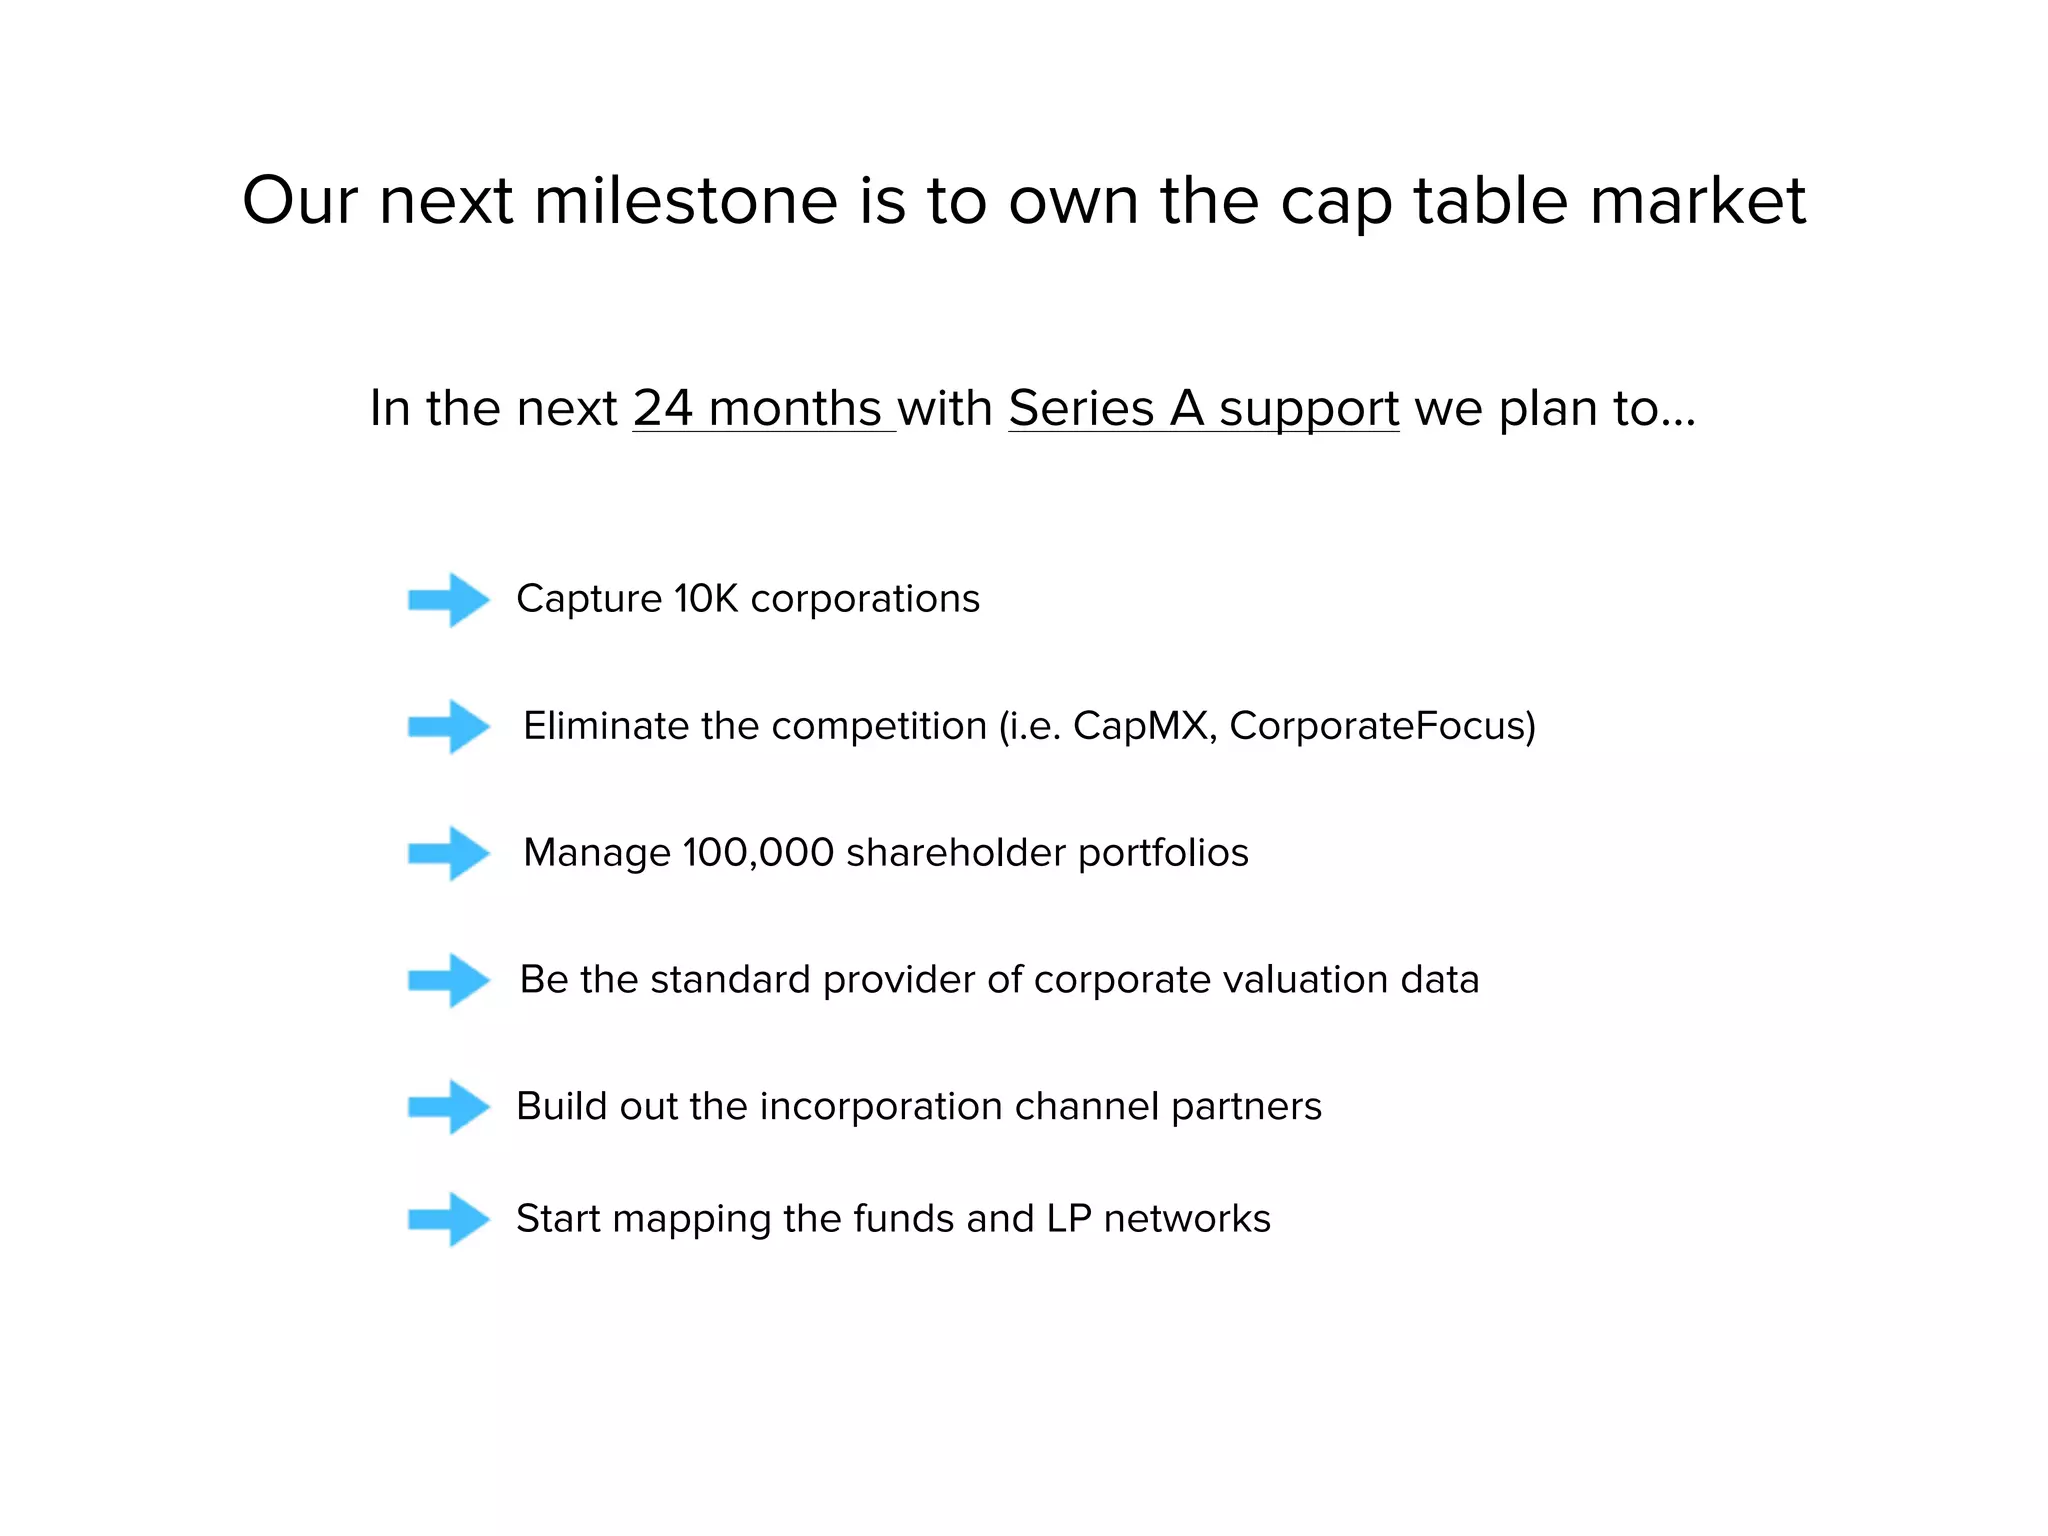
  • Primary uses (implied across slides): hiring sales/distribution, scaling operations and compliance (transfer-agent ops), developing valuation & fund products, building out SPV/fund administrative capability, mapping fund/LP networks.

Investor Deep Dive

Executive summary, strengths & red flags

Executive Summary

This seed-era deck (branded eShares at the time) presents a productized transfer-agent and cap-table platform that digitizes issuance, ownership ledgers, 409A/valuation services and investor reporting for private companies. The deck is notable for (a) having an SEC-registered transfer-agent claim, (b) early traction with clear month-over-month revenue and customer-growth charts, and (c) a product-led monetization mix of low-touch transaction fees plus higher-value add-ons (409A, SPVs, fund services).

Key Strengths

3 identified

1

Regulatory credibility and differentiated moat — SEC-registered transfer agent for private companies (slide 4). This is rare and reduces a major adoption friction.

2

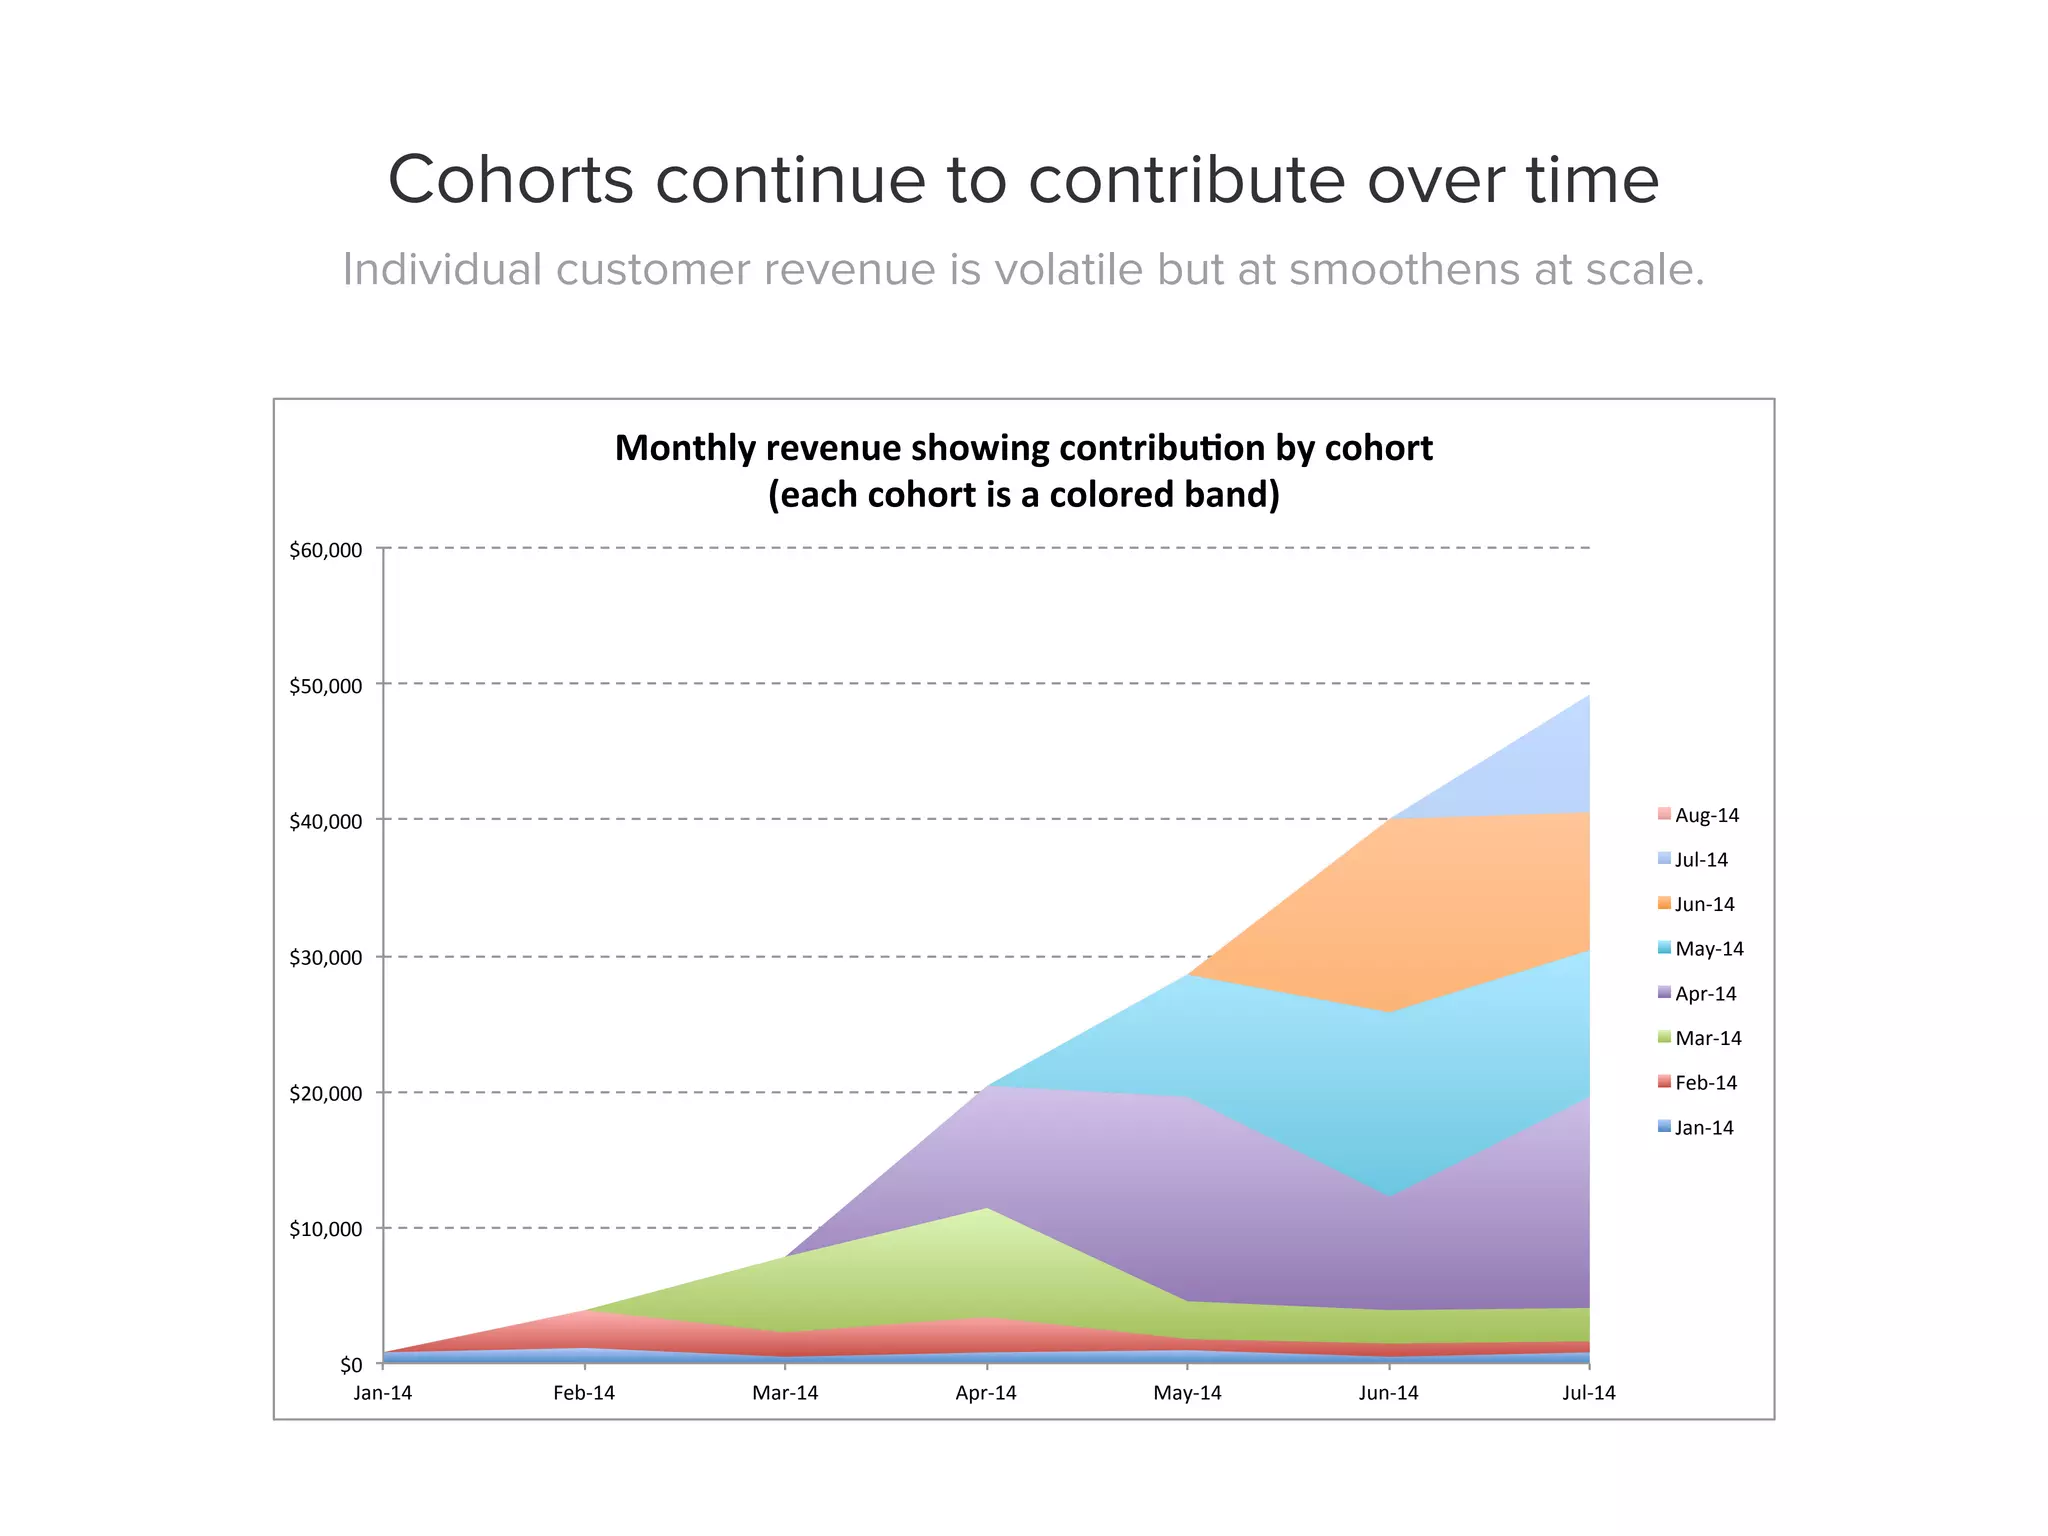
Clear traction with measurable month-over-month revenue and customer growth (slides 13, 22) — the deck shows a convincing early growth curve and cohort contributions (slide 14–15).

3

Product-led, viral mechanics + law firm channel — low CAC acquisition through network effects (investors, counsel, and portfolio managers) and partner referrals (slides 6–8, 15–20).

Red Flags & Weaknesses

3 identified

1

Financial detail gaps — unit economics and margins are not fully quantified (e.g., LTV/CAC, gross margins on transaction vs. add-on services are missing). The spreadsheet screenshots exist but not clear line-item P&L (slides 26–27 show models but are not legible/explicit).

2

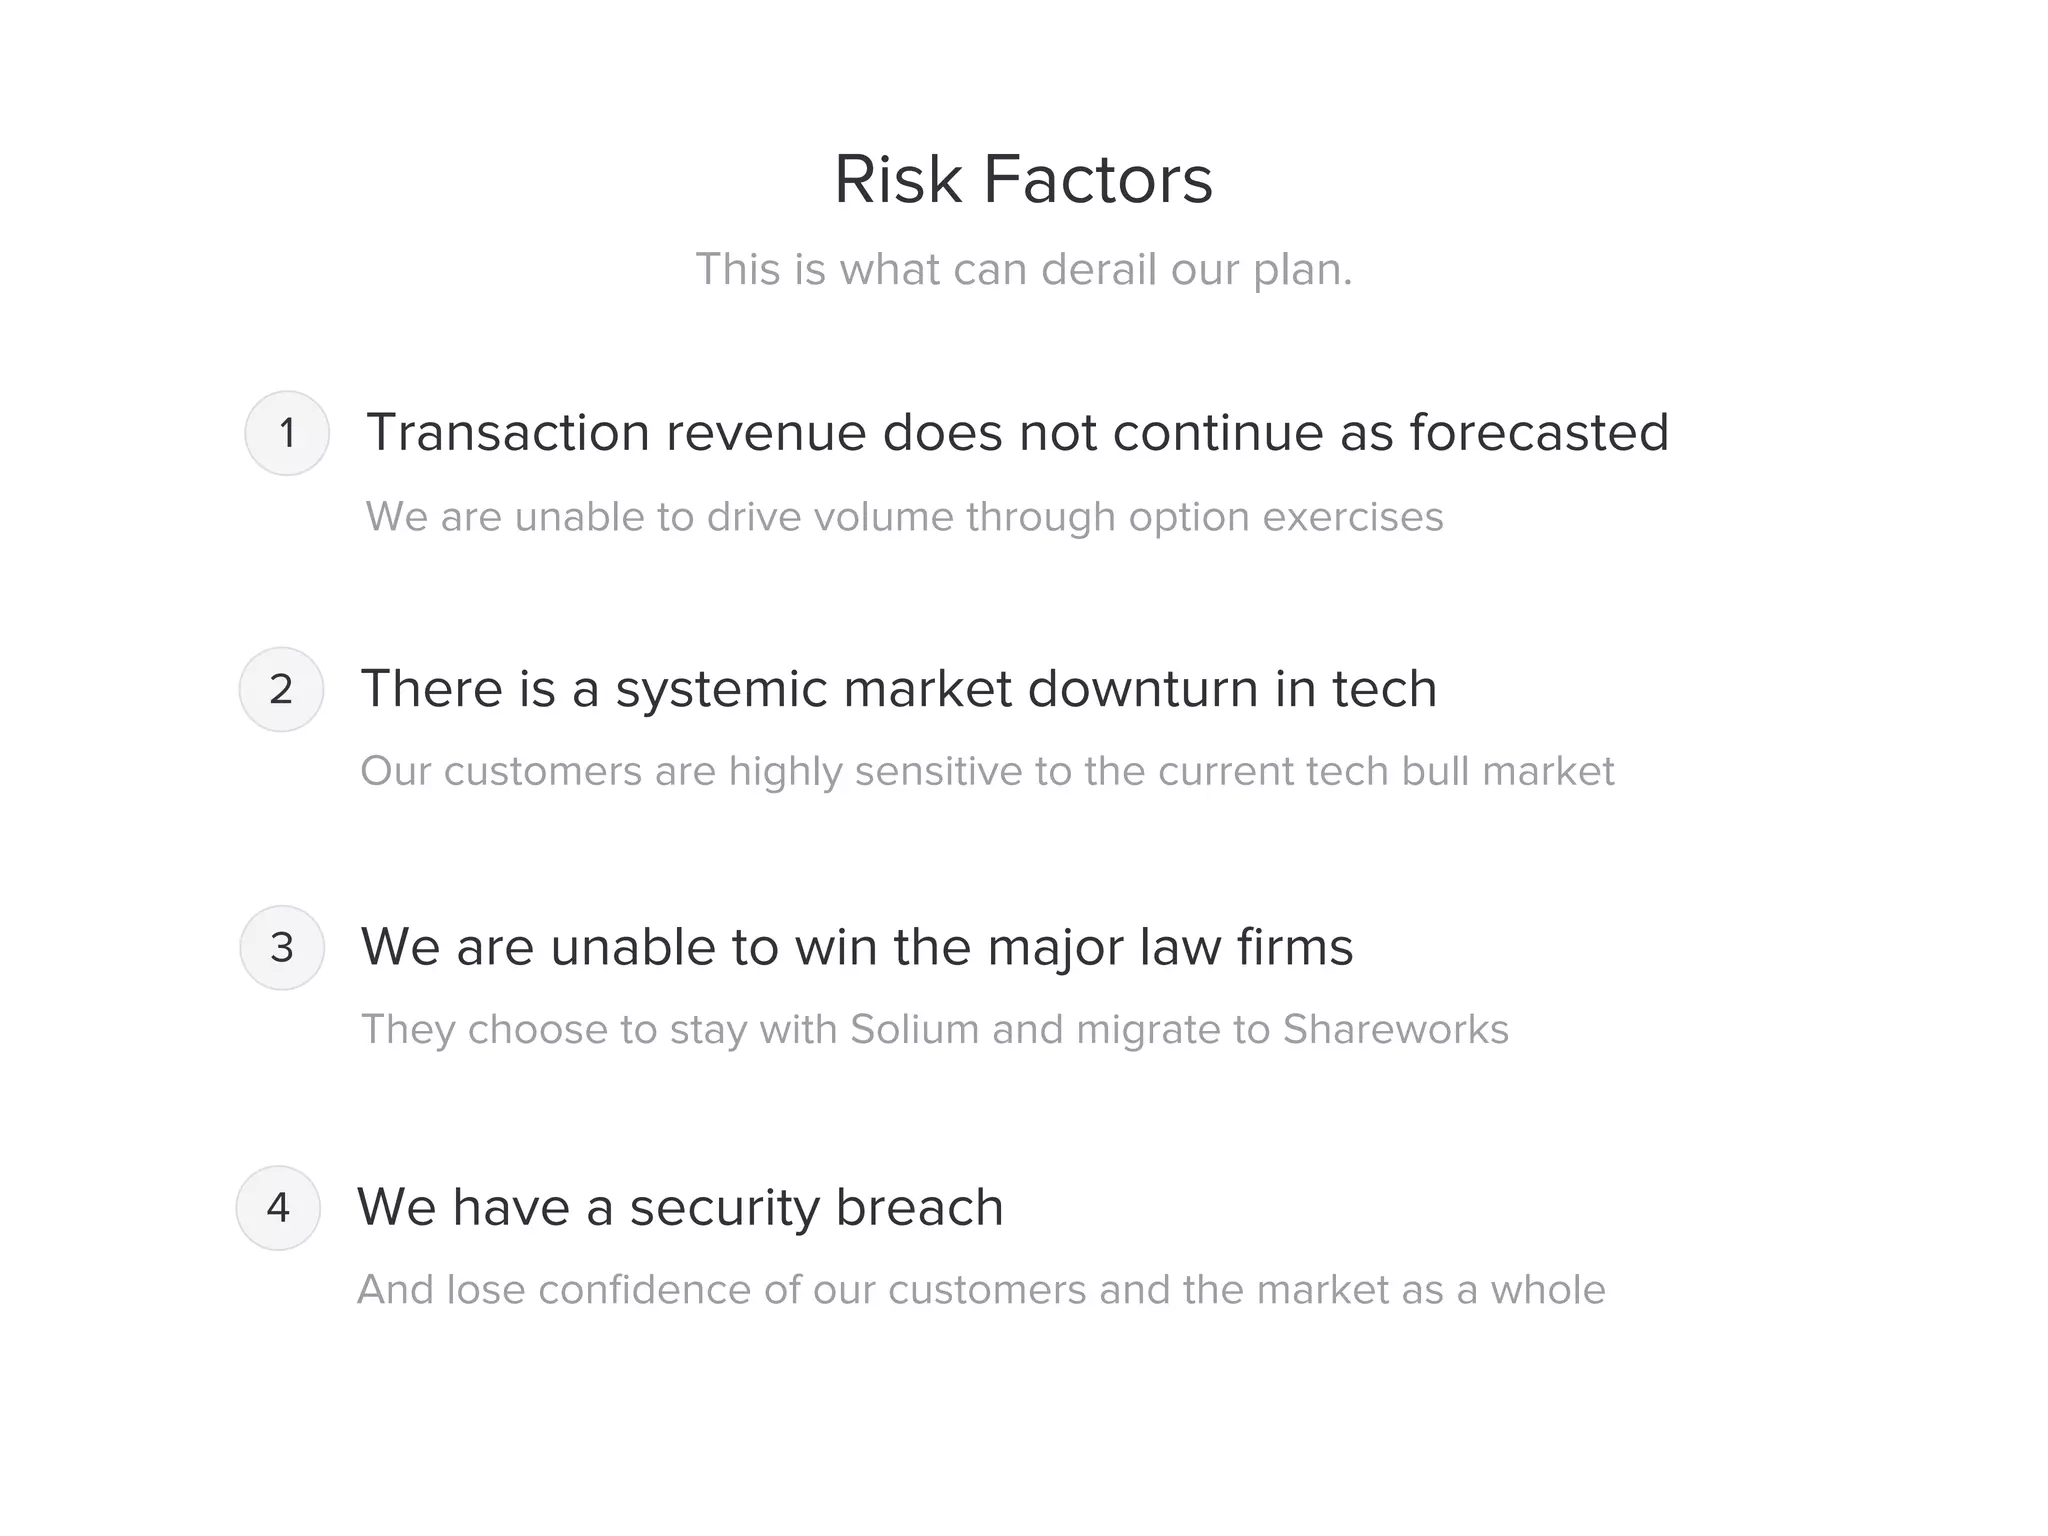
Concentration on transaction revenue — the core $20 per transaction model is volume-dependent and could be volatile if exercises/transfers don’t scale as forecasted (deck acknowledges this as a risk; slide 30 “Risk Factors” point 1).

3

Go-to-market scaling assumptions — the deck shows strong organic adoption but lacks an explicit, tested sales motion or CAC plan. They admit zero sales people initially (slide 22) and plan to hire on Series A; investor diligence would want validated CAC payback scenarios.

More Pitch Decks To Study

Compare structure, fundraising context, and investor-facing story across similar startup decks.