Compare your deck to Divvy Homes

Compare Your Deck

Divvy Homes Pitch Deck (2018)

Proptech
Stage: Seed
Raised: $10M
Year: 2018
Slides: 14
Outcome: Valued at $2B (2021); fire-sold (2023)

Pitch Deck

1 / 14
Divvy Homes pitch deck - The Opening: Mission and Brand
Click to expand

Deck Analysis

This deck from Divvy Homes (Seed, 2018) presents a concise pitch for a fractional homeownership product that lets renters buy equity in the home they live in while the company provides capital and management. It’s notable for a clean, design-forward presentation that emphasizes mission (“Access to home ownership. For everyone”), a huge addressable market, a simple three-step product flow, and early traction. The outcome — rapid growth, a peak valuation near $2B in 2021 and a later fire-sale in 2023 — makes the deck especially interesting: it highlights how strong storytelling, product-market fit and capital intensity can combine for fast rise and sudden risk.

The Opening: Mission and Brand

The Opening: Mission and Brand

Slide 1 is a minimalist title slide: dark background, prominent logo and a single-line mission statement. The design sets a tone — mission-first, modern and serious — with the date included (April 2018) which anchors the story in time. This establishes credibility and emotional framing before any numbers are shown.

Founders can learn from this disciplined approach: begin with a crisp mission statement and consistent visual identity to create an immediate impression. The downside to note is that a title slide alone can’t sell the business; it must be paired with fast, clear evidence of market need and traction on subsequent slides.

Key Takeaway: Open with a clear, mission-driven tagline and professional branding to set tone and focus your audience.

The Problem: One High-Impact Statistic

The Problem: One High-Impact Statistic

Slide 3 uses a single bold sentence — “6 million credit-worthy households should be homeowners, but aren’t” — to communicate the problem in one line. The heavy use of whitespace and the simple typographic hierarchy make the number the hero and make it instantly memorable. This is effective because it translates a complex market into a single, emotionally resonant metric.

The lesson for founders is to identify the one statistic that communicates the size and injustice of the market opportunity and put it front and center. However, that statistic must be defensible — investors will probe the assumptions behind it — so follow-up materials or an appendix should back up any large-claim numbers.

Key Takeaway: Lead with one defensible, high-impact statistic that instantly communicates the problem size and urgency.
The Solution: Simple, Visual Product Flow

The Solution: Simple, Visual Product Flow

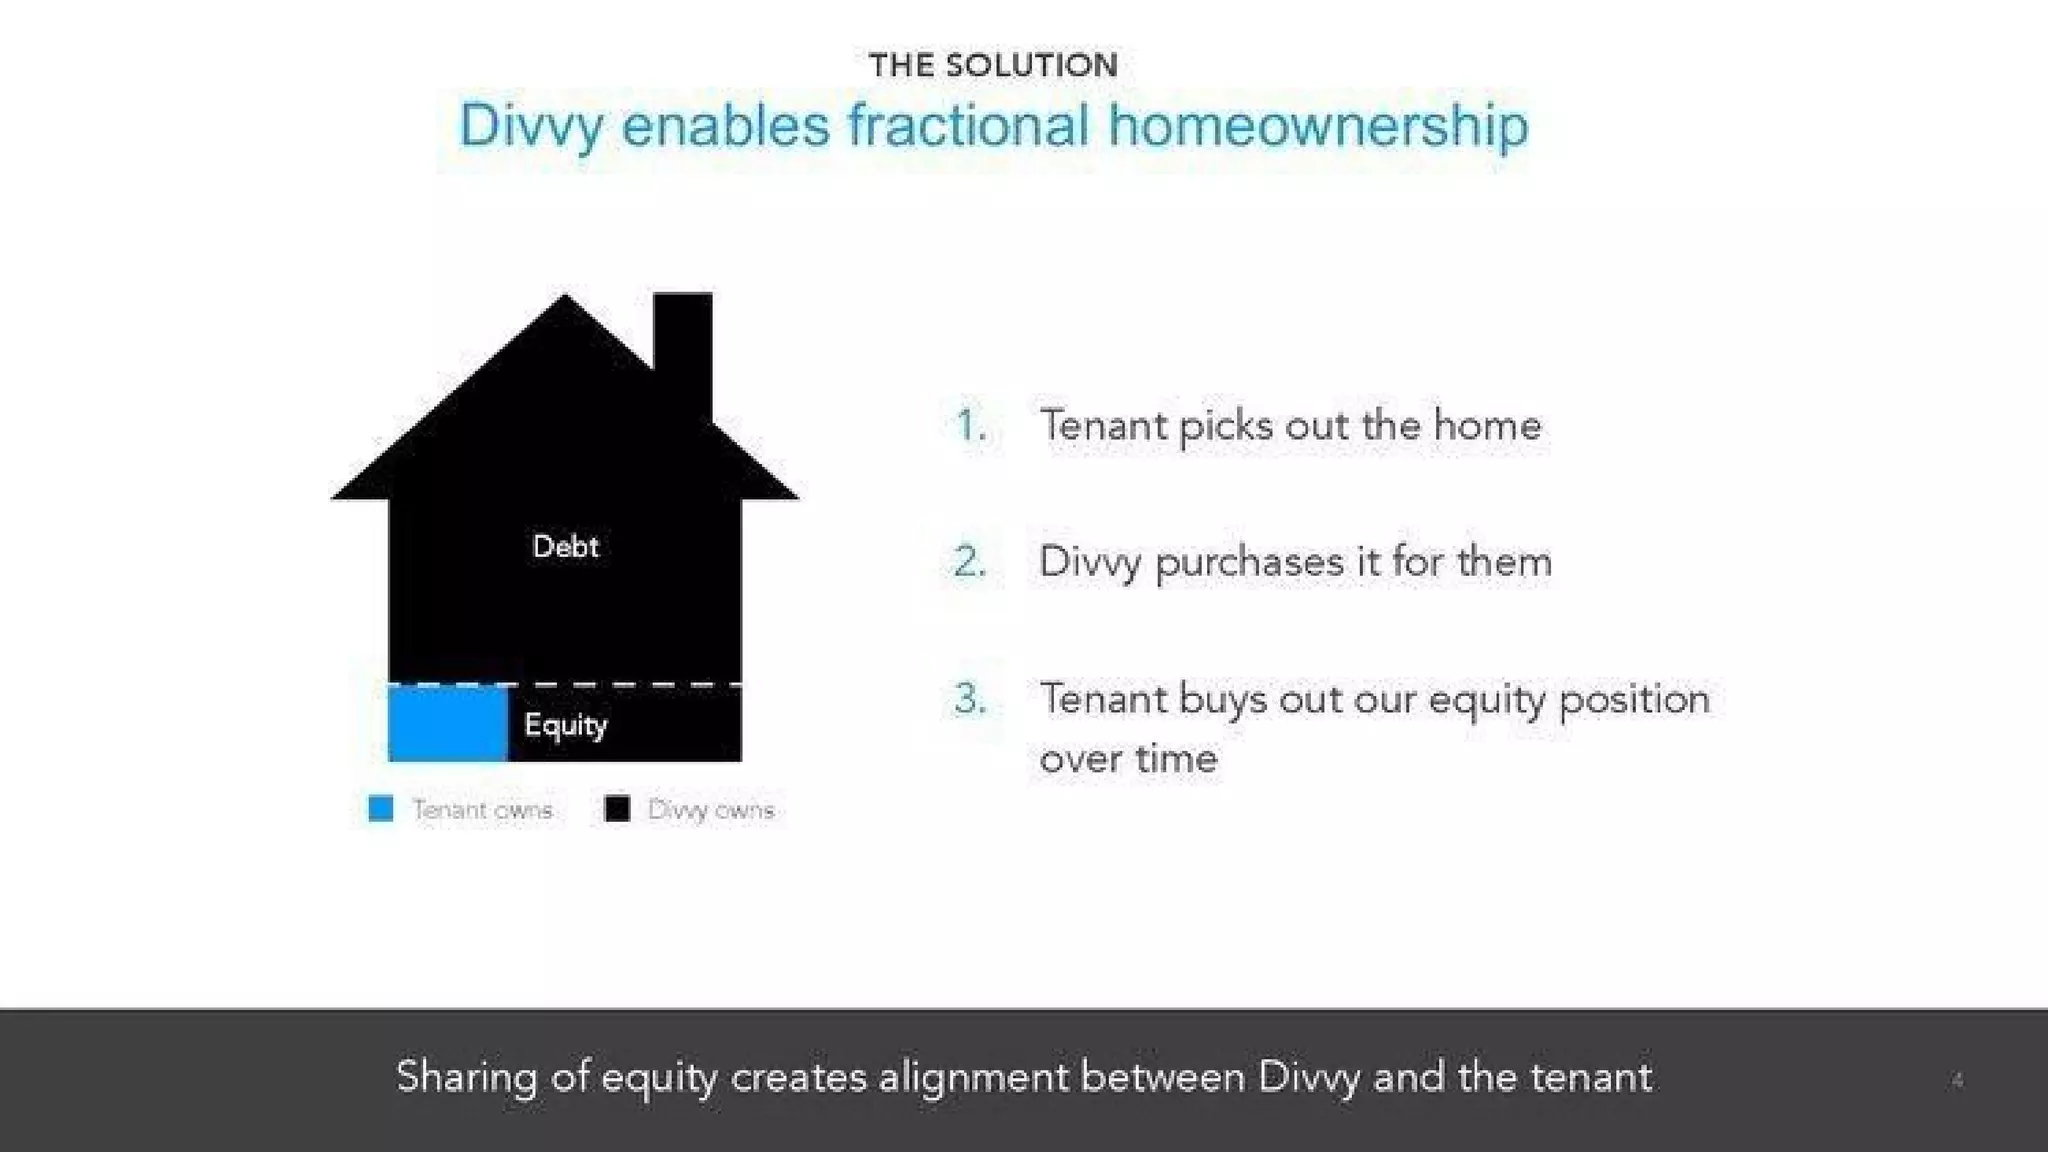
Slide 4 explains Divvy’s product with a three-step flow and a clear house graphic that breaks ownership into equity and debt. The steps — tenant picks home, Divvy purchases it, tenant buys out equity over time — are simple, logical and easy to explain aloud. The visual metaphor of the house with colored equity/debt bands quickly conveys the product’s mechanics without heavy text.

Founders should emulate the combination of a short numbered process and a supporting visual when describing new or counterintuitive business models. The slide’s strength is simplicity; its weakness would be missing nuance (e.g., legal structure, fees, timelines), so ensure you can layer in details when investors ask for more depth.

Key Takeaway: Use a short numbered process plus a single visual metaphor to explain complex product mechanics quickly and clearly.
Unit Economics: Visualizing Value but Beware Placeholders

Unit Economics: Visualizing Value but Beware Placeholders

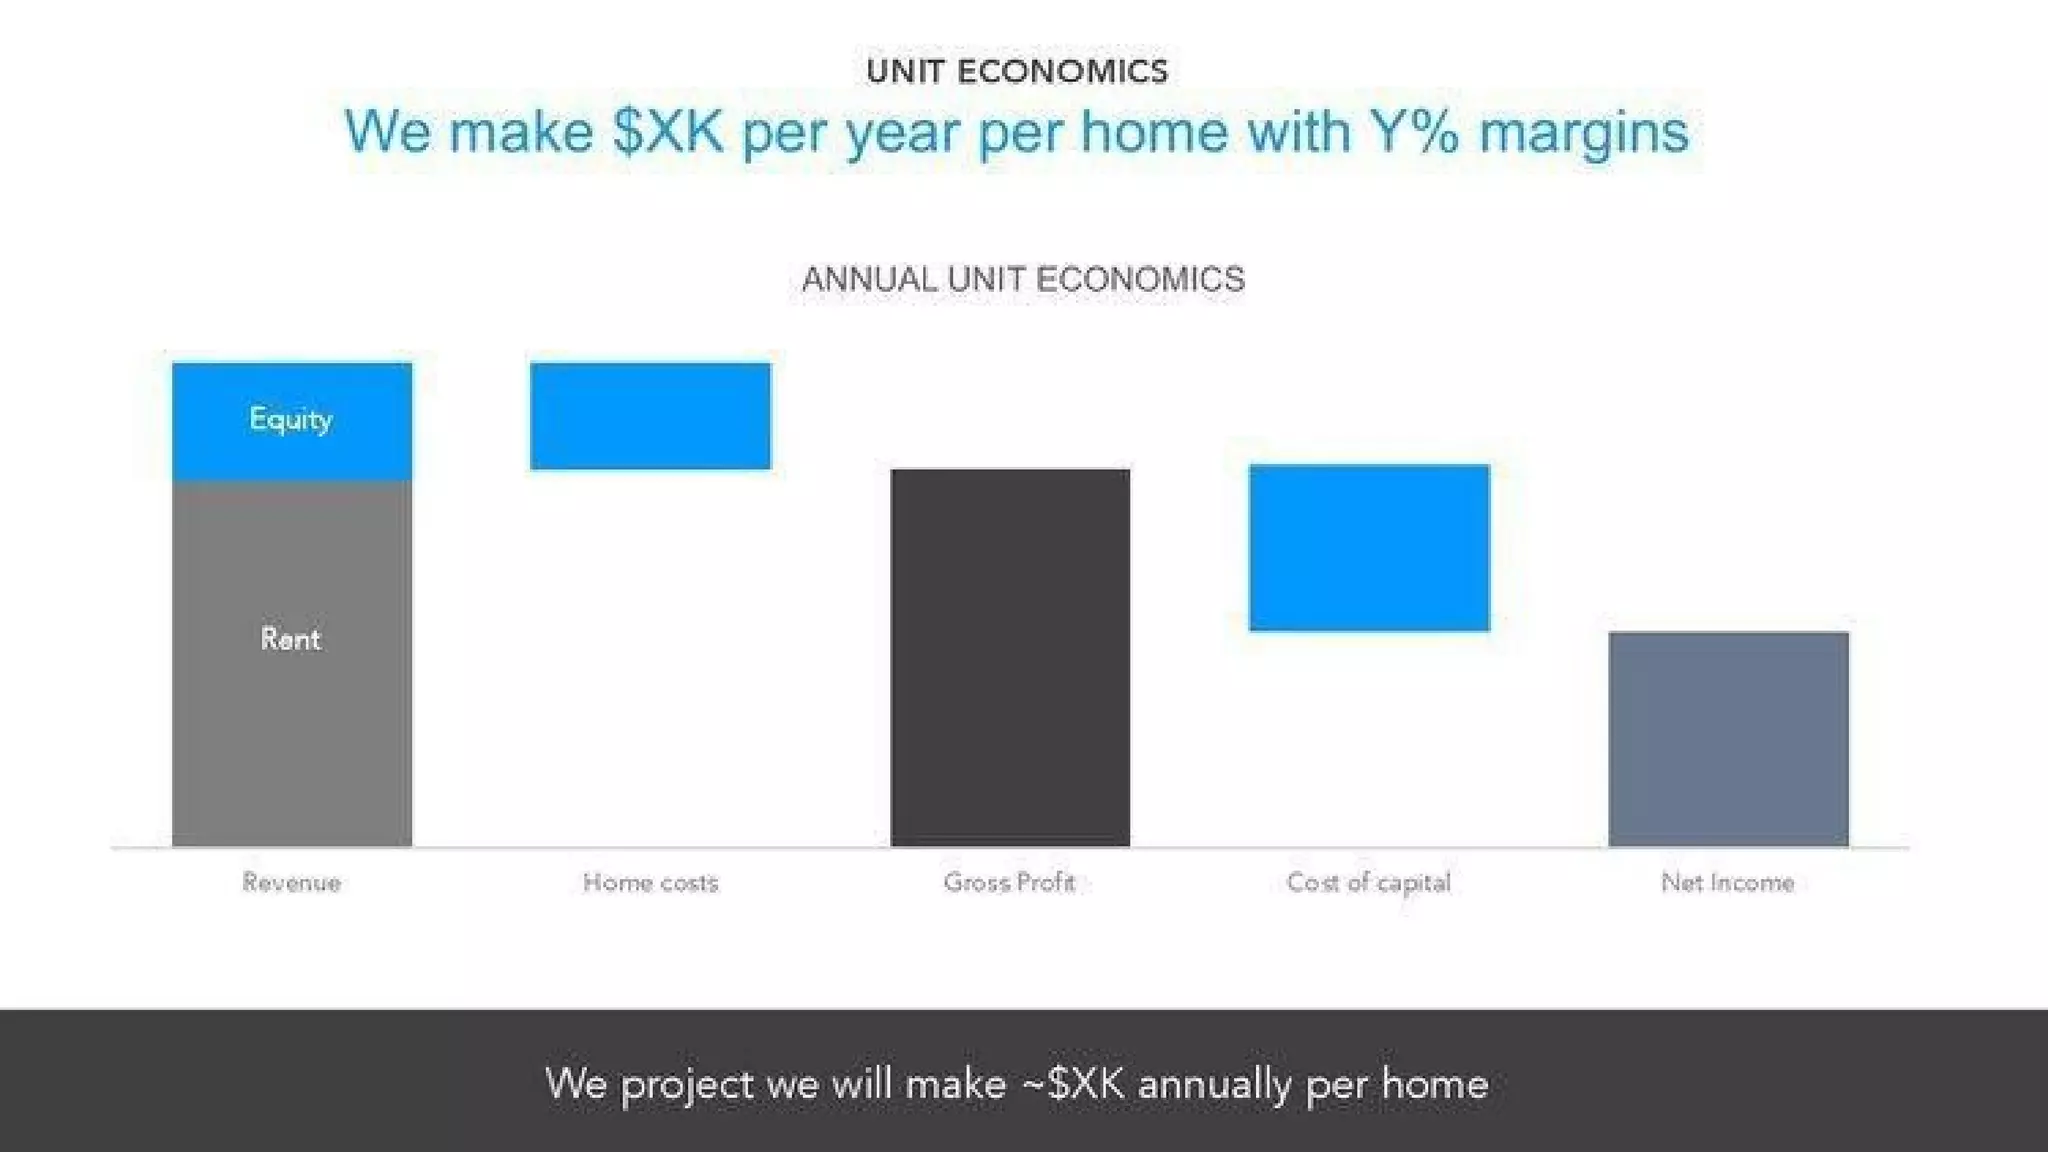
Slide 6 presents annual unit economics with stacked bars for revenue (rent + equity), home costs, gross profit, cost of capital and net income. The visual approach helps investors see where value is created and how capital and operating costs flow through the model. It signals that the team is thinking about per-home profitability, which is critical for asset-heavy businesses.

However, this deck uses placeholders ($XK, Y%) rather than concrete numbers in the headline and presumably leaves blanks for detailed figures. That weakens credibility. Founders should show per-unit economics clearly but must provide specific, realistic numbers and assumptions — lenders and investors will insist on them, especially for capital-intensive models.

Key Takeaway: Show per-unit economics visually, but always pair charts with concrete, defensible numbers — placeholders undermine credibility.
Market Expansion: Targeted City Strategy

Market Expansion: Targeted City Strategy

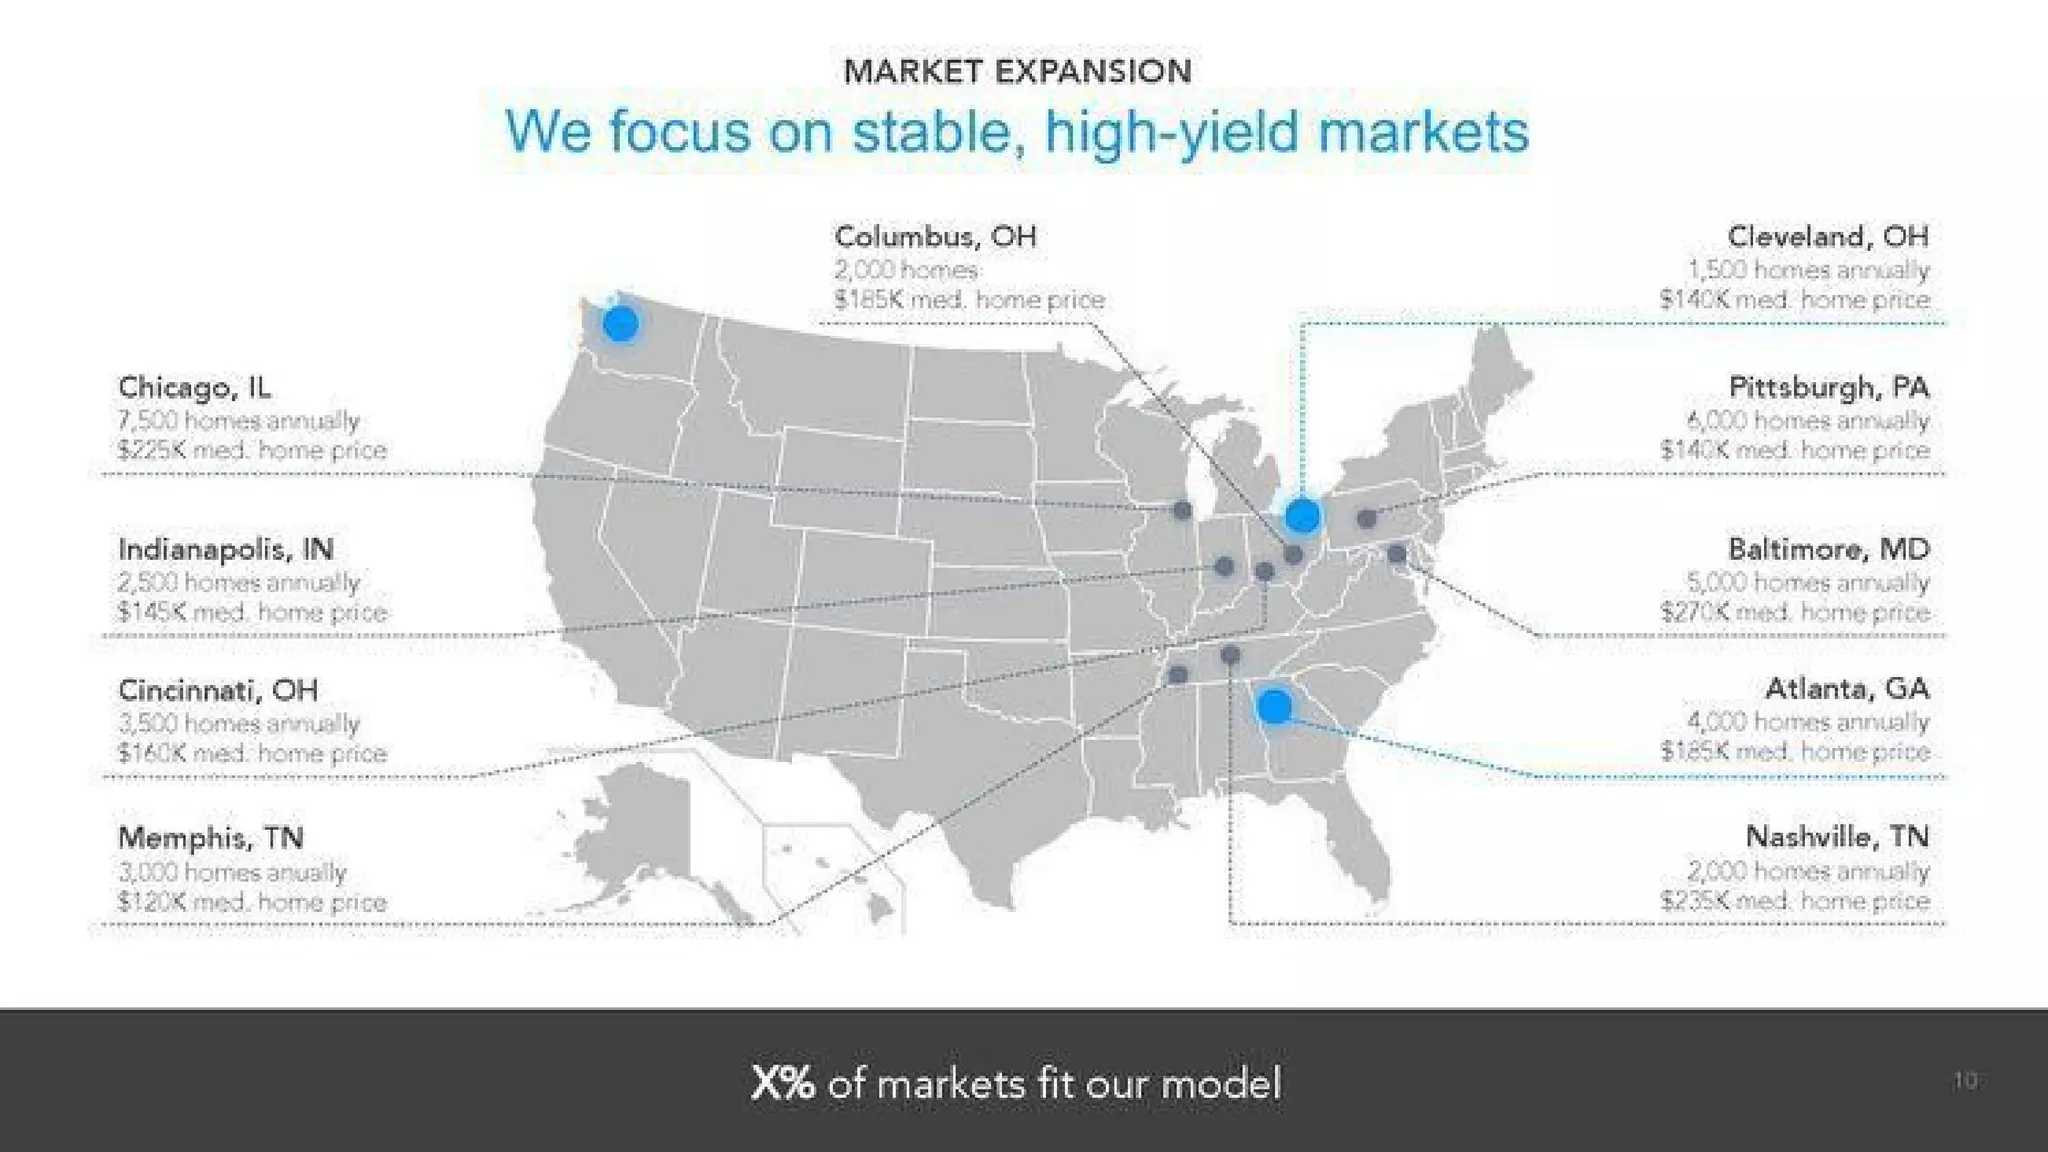
Slide 7 is a U.S. map highlighting target expansion markets (Columbus, Pittsburgh, Atlanta, etc.) with market-by-market home counts and median prices. This communicates a repeatable market selection framework and shows that the team has thought about where their model is economically viable. It’s more believable than a generic TAM because it maps the opportunity to actual cities and numbers.

Founders should show geographies and criteria for expansion when their business depends on market-level unit economics. This slide could be improved by adding the selection criteria explicitly (e.g., median price range, rent-to-price ratios, regulatory climate), but it succeeds in demonstrating both breadth and selectivity.

Key Takeaway: Map your go-to-market expansion to specific cities with justification — investors want to see repeatable market selection, not broad strokes.
Distribution: Leveraging Agent Networks

Distribution: Leveraging Agent Networks

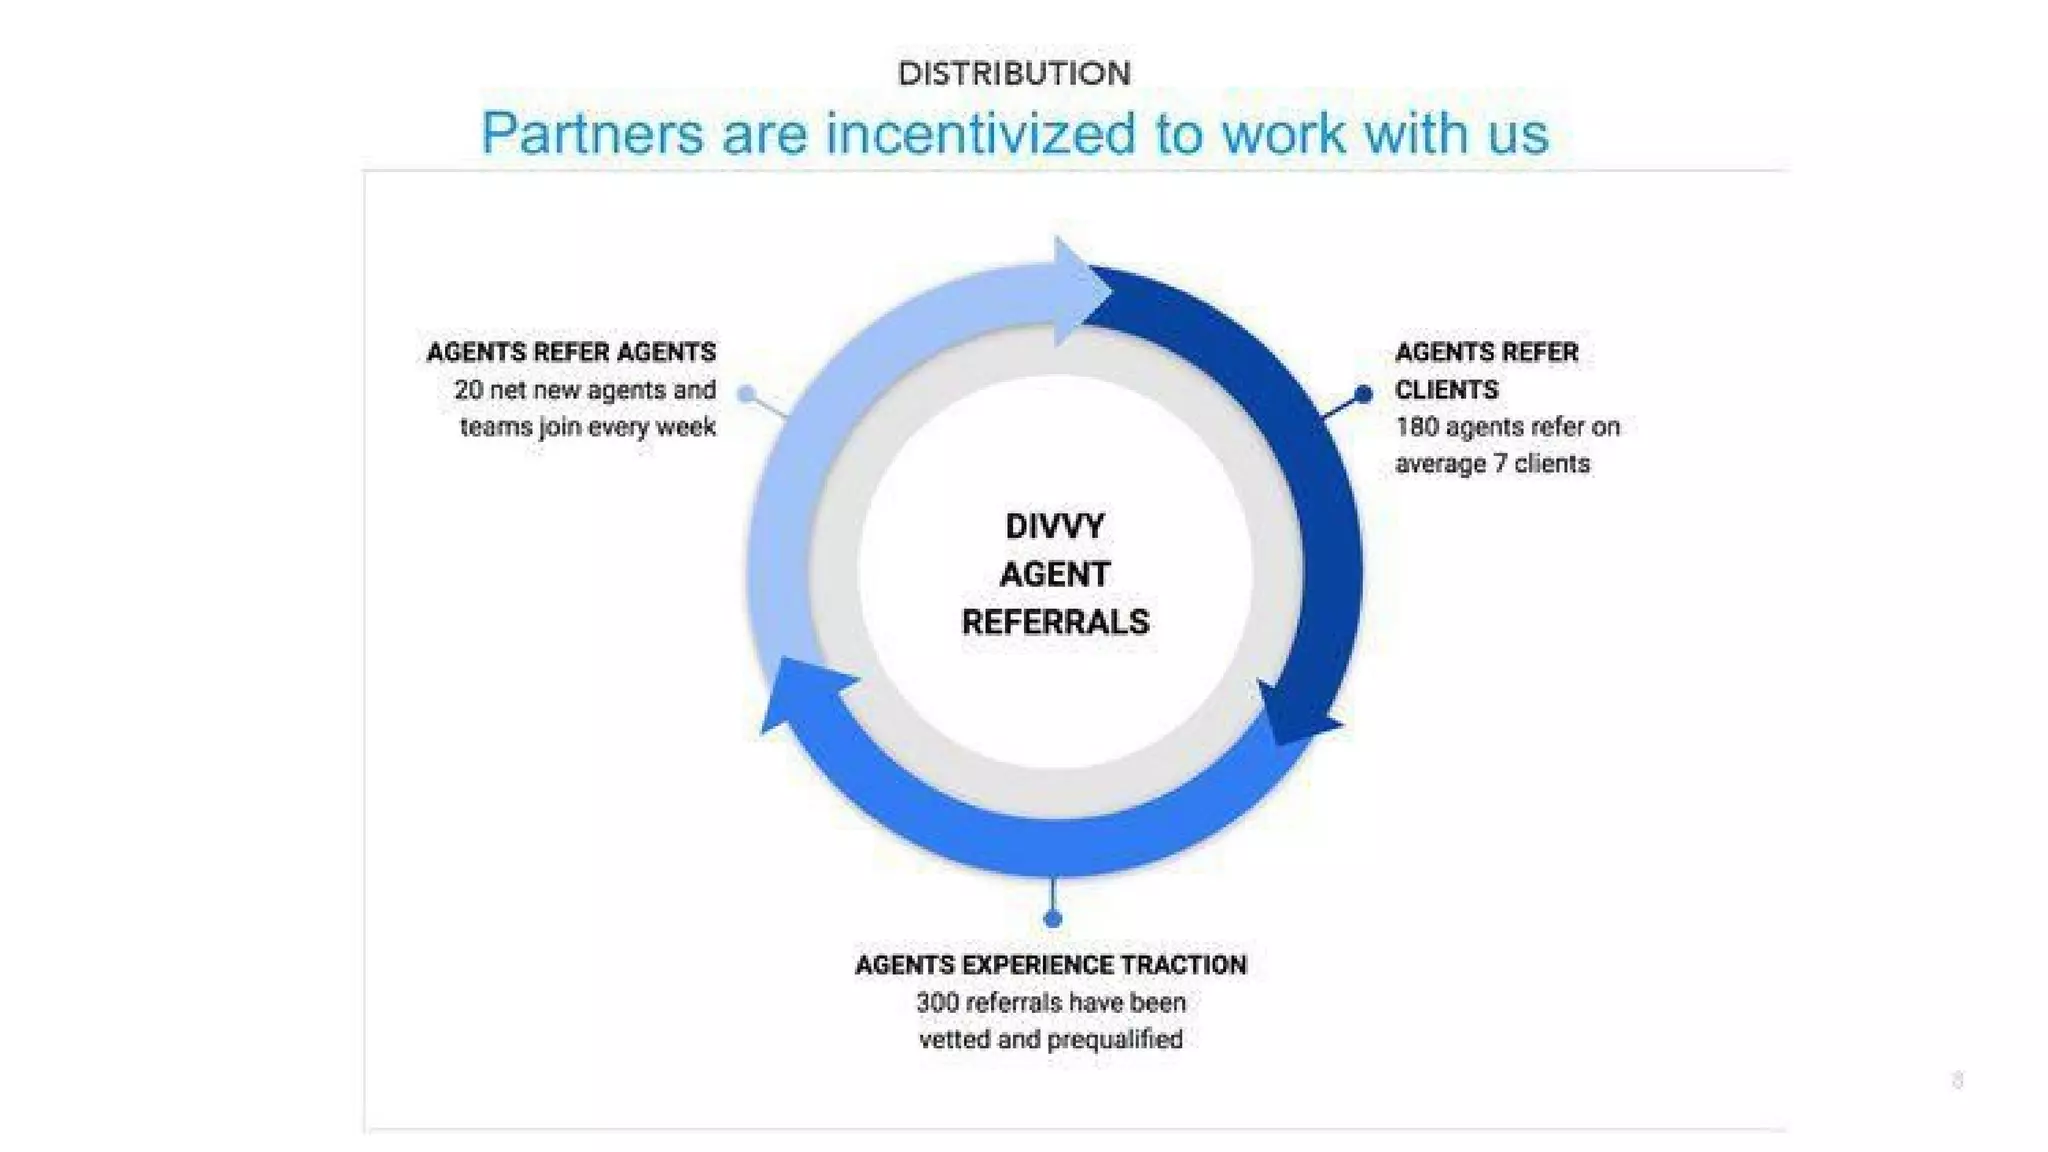
Slide 11 shows a circular referral loop for agents — agents refer agents, agents refer clients, and traction feeds the loop. This emphasizes a networked, partner-driven distribution channel rather than expensive consumer acquisition. Displaying the mechanics of a referral flywheel helps investors see a scalable path to demand growth that leverages existing industry relationships.

The takeaway for founders is to explain not just that you have partners, but how those partnerships self-reinforce growth (metrics, incentives, conversion multipliers). Provide actual conversion rates and unit economics driven by the channel to prove it’s both scalable and efficient.

Key Takeaway: Demonstrate a repeatable partner-driven distribution flywheel with metrics and incentives to show how growth scales without runaway marketing spend.
Traction: Visual, Recent Growth Momentum

Traction: Visual, Recent Growth Momentum

Slide 12 displays monthly homes closed as a rising bar chart from Nov ’17 through a run-rate in Apr ’18. The fast upward trend communicates momentum — a critical signal at seed stage. Coupling that with a short caption about backlog and timeframes would make the story even stronger, but the chart itself is clear and persuasive.

Founders should show real, recent traction trends (monthly or weekly) to prove momentum; charts beat adjectives. Be ready to back the chart up with conversion funnels, unit economics and backlog details, because investors will want to know how sustainable the growth is and what capital is required to continue scaling.

Key Takeaway: Use recent, time-series charts to show momentum — real monthly metrics and backlog details are powerful credibility builders for early-stage investors.

Conclusion: Key Lessons

This deck is strong on narrative: mission-first opening, a simple one-line problem, a clear three-step solution, targeted markets, a partner growth model and visible traction. The visual discipline — spare slides, single-idea-per-slide, supportive graphics — keeps the story tight and memorable. For capital-intensive models like Divvy’s, investors look for an alignment of product-market fit, defensible unit economics, repeatable distribution and a path to financing; this deck touches all those points.

For founders building their own decks: be concise and visual, lead with one compelling market stat, explain your product in simple steps with a clear visual metaphor, show per-unit economics with concrete numbers (not placeholders), map expansion to real markets, and demonstrate scalable distribution and recent traction. Finally, because asset-heavy models hinge on capital and regulatory risk, include a clear slide on funding strategy, credit facilities, and contingencies — investors will want to understand how you will fund growth and absorb market shocks.

Full Deck Analysis

11 sections

Overview

Company: Divvy Homes
Round: Seed ($10M)
Year: 2018
Outcome: Valued at $2B (2021); fire-sold (2023)

Executive Summary

This is a concise, investor-facing seed deck that pitches Divvy as a technology-enabled fractional homeownership platform that buys homes for tenants, then sells equity to tenants over time. The deck is notable for a crisp problem statement and simple solution visuals, identifiable early traction and agent distribution mechanics, but it also contains many placeholders for key financials and unit economics.

Problem Statement

  • Slide 3 presents the core problem in one line: “6 million credit-worthy households should be homeowners, but aren’t.”
  • The deck frames the gap as an affordability / access problem (people who qualify for mortgages still cannot or do not become homeowners).
  • The problem is stated simply and in a large-font, consumer-focused way — it’s clear who the customer is (credit‑worthy renters who aren’t buying).

Solution

  • Slides 4–5 outline the product: Divvy purchases a home chosen by the tenant, gives the tenant an initial equity stake, holds the debt, and the tenant gradually buys out Divvy’s equity position. A house icon (debt/equity split) communicates the model visually.
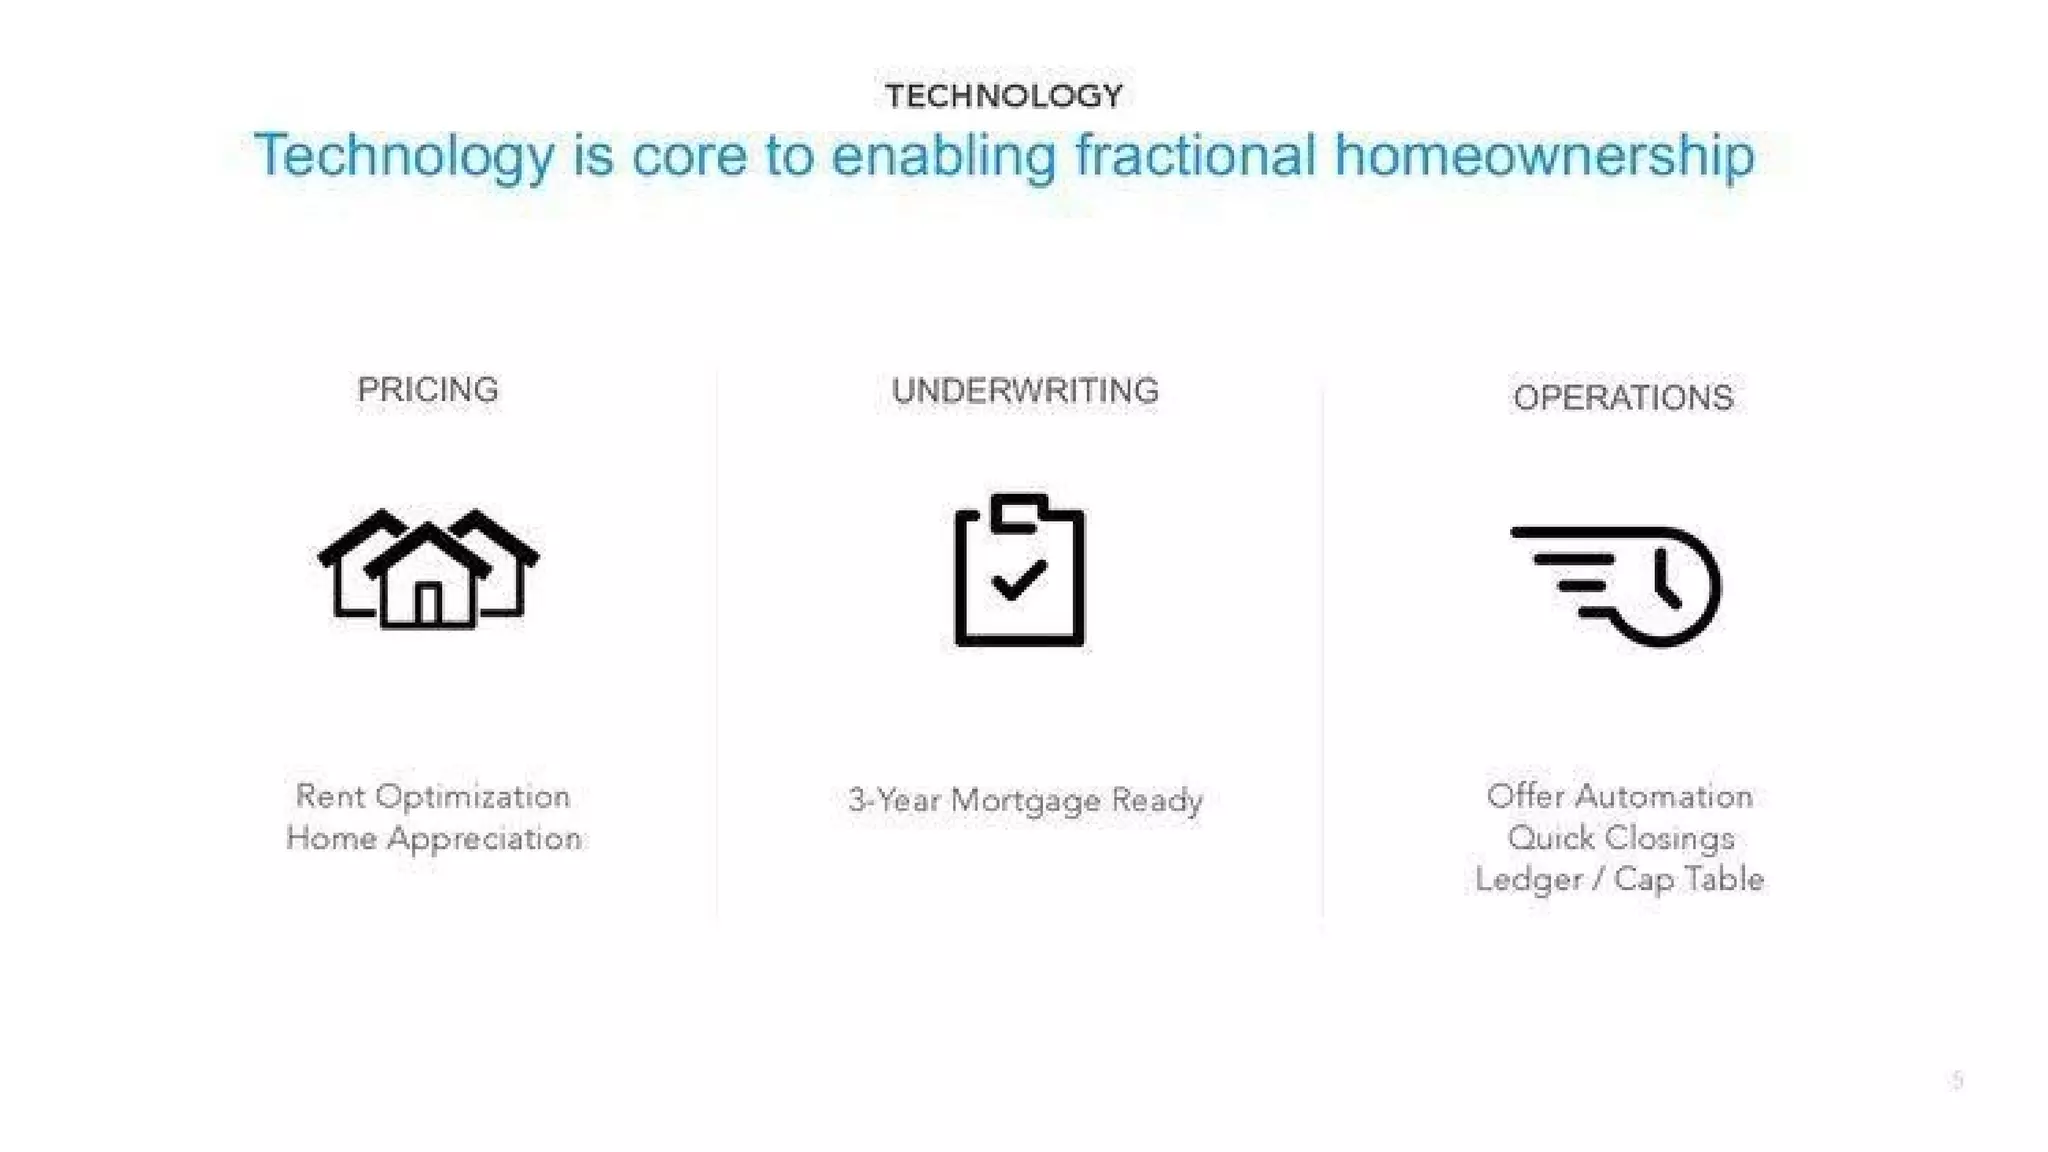
  • Technology is presented as a core enabler (Slide 5) with three pillars: Pricing (rent optimization + appreciation modeling), Underwriting (3‑year mortgage readiness), and Operations (offer automation, quick closings, ledger/cap table).
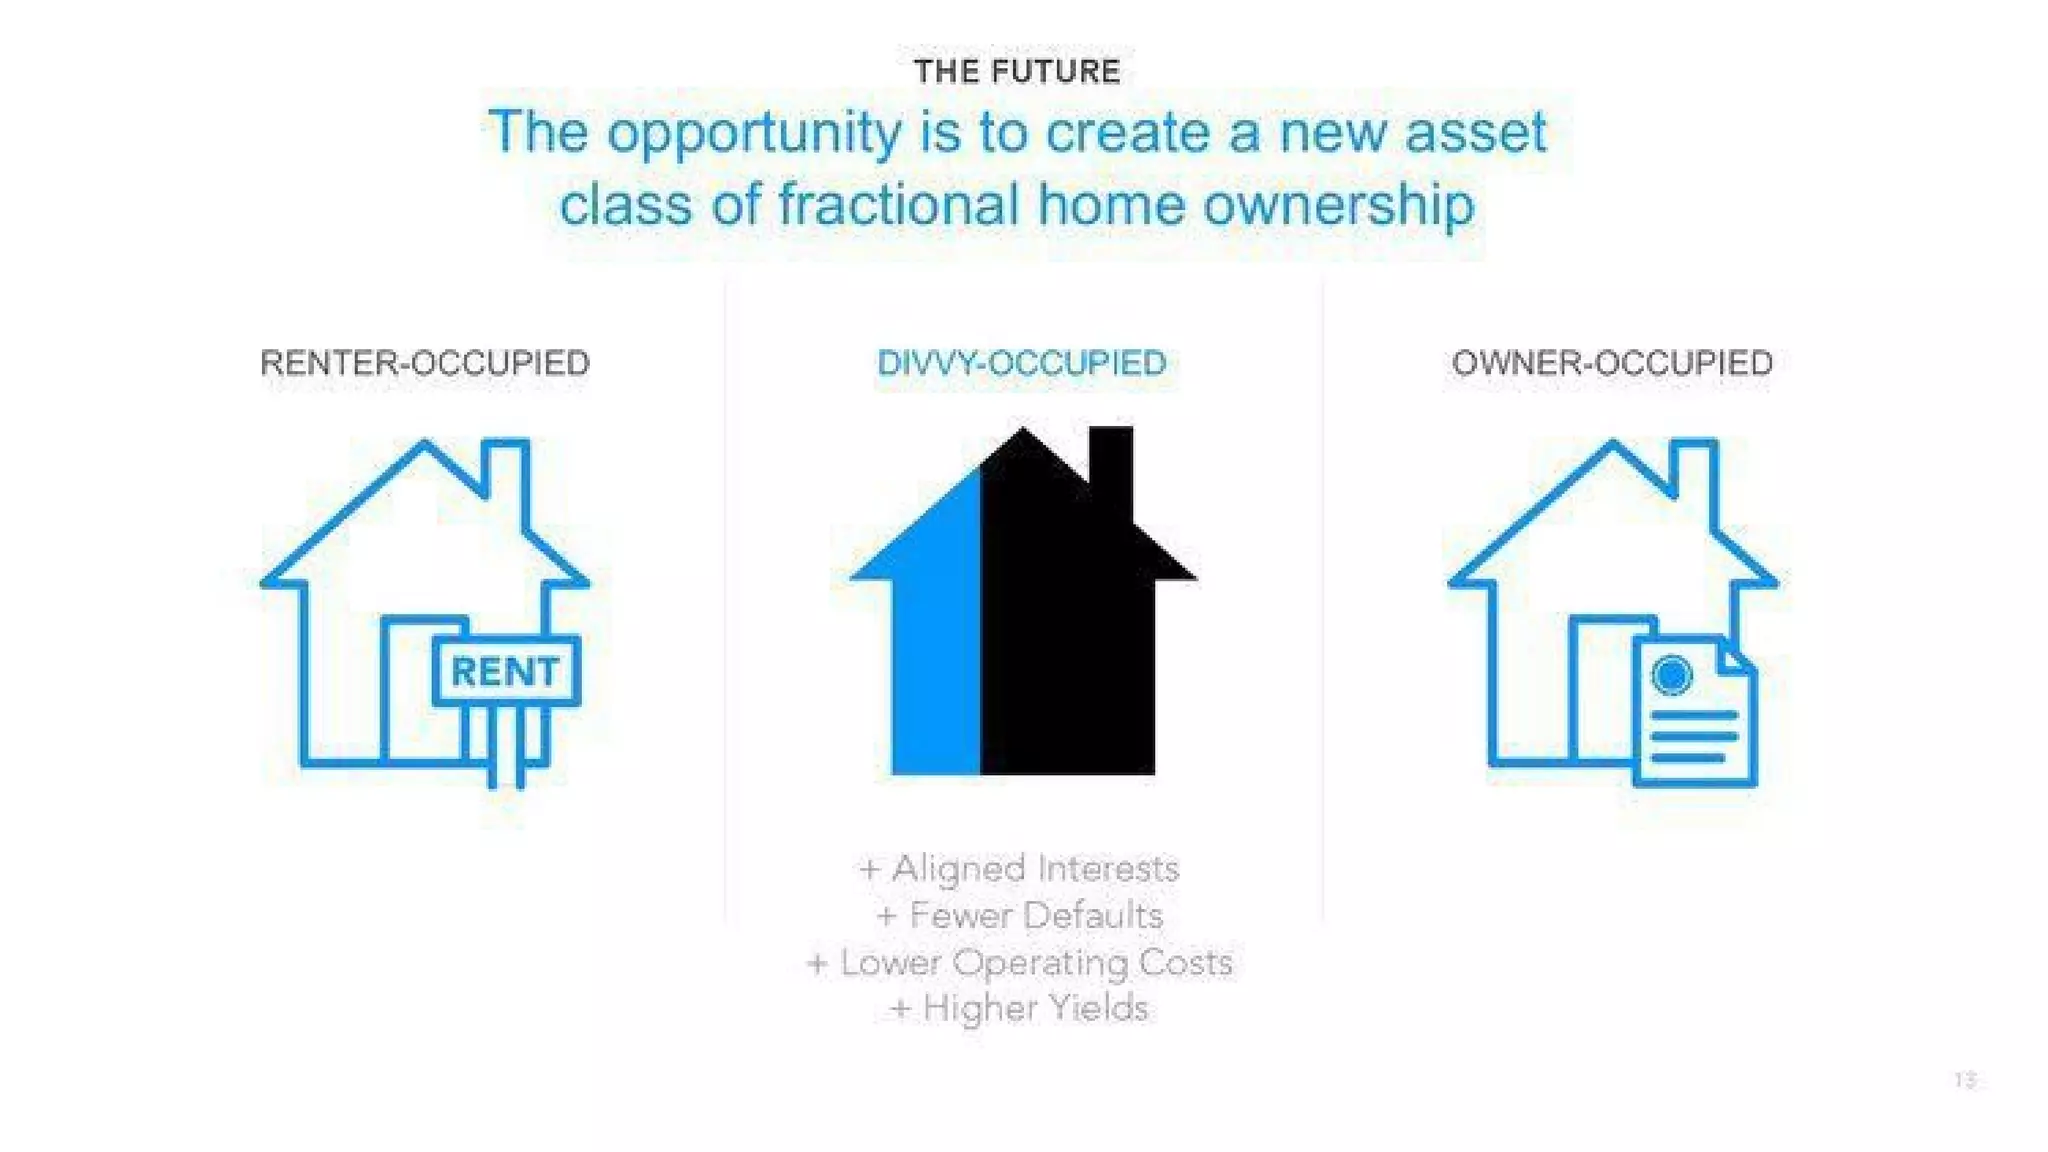
  • The solution is positioned as aligning interests (Divvy shares upside with tenants) and offering a gradual path to ownership vs. traditional renting or immediate mortgage.

Market Opportunity

  • The deck claims a target of “6 million credit‑worthy households” (Slide 3) but does not break this down into TAM/SAM/SOM explicitly.
  • Slide 7 / Market Expansion maps a set of target high-yield markets with annual home opportunity estimates by city:
    • Chicago, IL: 7,500 homes annually (median home price ~$225K)
    • Indianapolis, IN: 2,500 homes annually ($145K)
    • Cincinnati, OH: 3,500 homes annually ($160K)
    • Memphis, TN: 3,000 homes annually ($120K)
    • Columbus, OH: 2,000 homes annually ($185K)
    • Cleveland, OH: 1,500 homes annually ($140K)
    • Pittsburgh, PA: 6,000 homes annually ($140K)
    • Baltimore, MD: 5,000 homes annually (slide shows “$27K med. home price” — likely a typo, probably $270K)
    • Atlanta, GA: 4,000 homes annually ($165K)
    • Nashville, TN: 2,000 homes annually ($235K)
  • The slide footer claims “X% of markets fit our model” (placeholder) — no consolidated TAM or dollar-value TAM is presented.

Business Model

  • Revenue source: the revenue stack is rent + a piece of equity appreciation (visualized on Slide 6 as “Rent” and “Equity” components).
  • The model is capital-intensive: Divvy purchases homes (holds debt) and needs lending/credit facilities (Slides 9 and 8).
  • Unit economics are shown conceptually (Slide 6 & Slide 7) but use placeholders: “We make $XK per year per home with Y% margins” and “$XK annual per home” — no concrete per-home revenue, gross margin or payback period is provided in the deck.
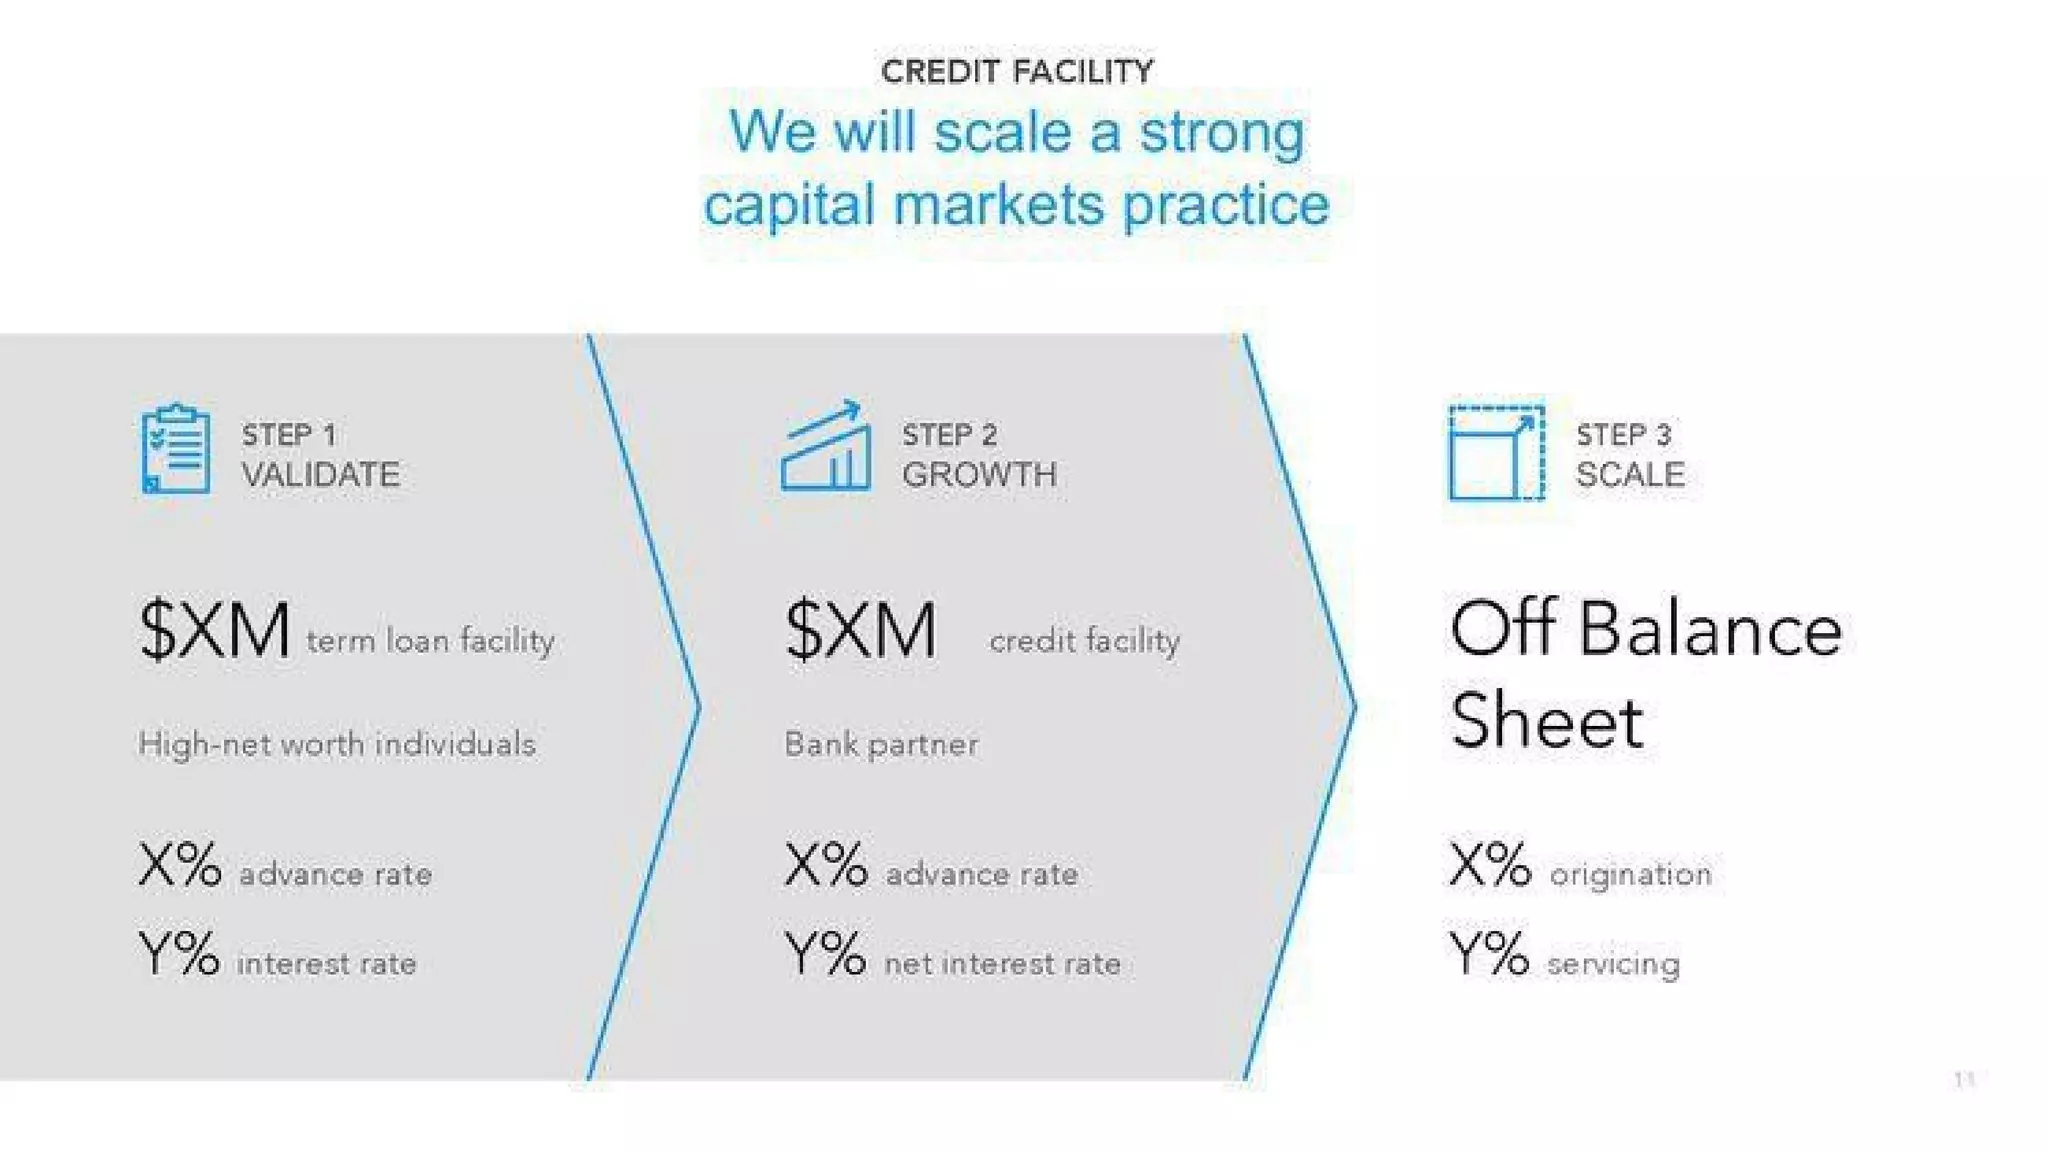
  • Capital structure plan (Slide 9): three-step plan to fund purchasing — Step 1 Validate (term loan from HNW individuals, $XM), Step 2 Growth (bank credit facility, $XM), Step 3 Scale (off-balance sheet origination/servicing with % fees). Key advance rates and interest rates are left as placeholders (X%, Y%).

Traction & Metrics

  • Traction chart (Slide 13) shows rapidly increasing monthly homes closed from Nov 2017 → Apr 2018 (run-rate). Bars show strong month-over-month growth, but the slide has no explicit counts — only visual growth (Nov & Dec small, Jan medium, Feb larger, Mar much larger, Apr run-rate highest).
  • Distribution traction (Slide 12):
    • “Agents refer clients” — 180 agents refer on average 7 clients (callout).
    • “Agents refer agents” — 20 net new agents and teams join every week.
    • “Agents experience traction” — 300 referrals vetted and prequalified.
  • Other traction metrics are graphical/qualitative; the deck lacks hard dollar revenue, customer LTV, churn, or payback period numbers.

Competitive Positioning

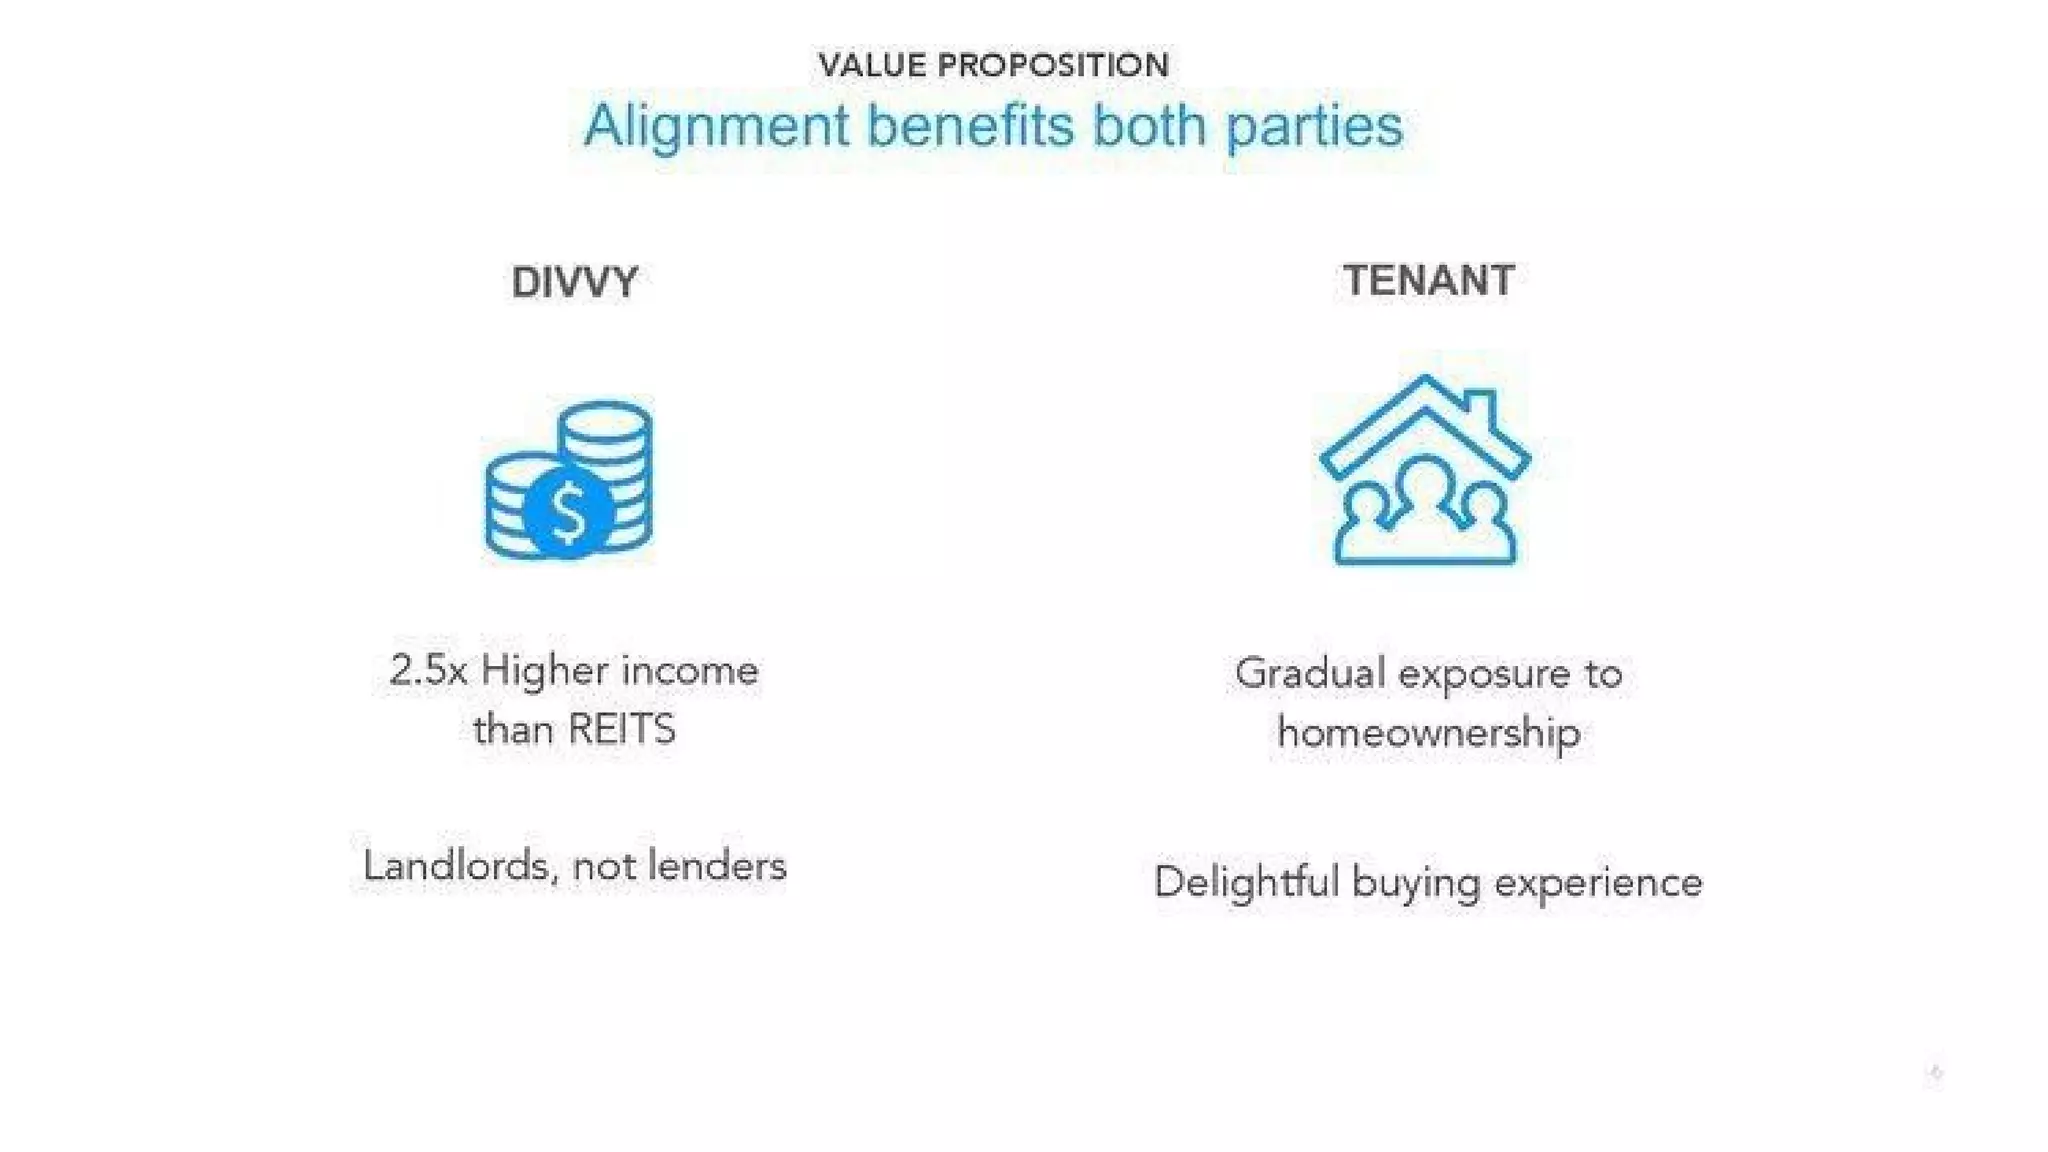
  • Differentiation is built on alignment of incentives: Divvy is not a lender but a landlord/owner that aligns with tenant upside (Slide 11: “Landlords, not lenders”; “2.5x Higher income than REITS” claim).
  • Technology focus for pricing, underwriting and operations is positioned as defensible moat vs. local landlords.
  • Distribution differentiator: agent referral flywheel (Slide 12) — leveraging local real estate agents as a scalable source of demand and supply.
  • The deck does not directly list competitors or a competitive matrix (no mention of Shared Ownership peers, rent-to-own providers, iBuyers, or mortgage lenders).

Team

  • Slide 2 highlights the core founding team:
    • Adena Hefets — CEO. Background: PM & capital markets at Square Capital, investor at TPG, banker at BAML, MBA from Stanford, Cornell University (education lines are on the slide).
    • Brian Ma — CPO. Background: Repeat founder (3rd company), founder at Decide.com, Product @ Zillow, real estate agent & investor, CS & EE from UW.
    • Nicholas Clark — CTO. Background: CTO @ DoubleDutch, Sr. Engineer @ Microsoft, founder @ MobileSRc, ECE from Cornell University.
  • Team combines real estate, product, capital markets and engineering experience — a strong founding mix for this business.

Go-to-Market Strategy

  • Primary GTM is partnerships with real estate agents: an agent-referral flywheel (Slide 12) — agents refer clients and recruit agents.
  • Targeting specific, stable high-yield markets (Slide 7 map) where median home prices and annual inventory fit the model.
  • Operations: automated offers, quick closings and a tech-enabled ledger/cap table to streamline transactions (Slide 5).
  • Credit facility approach (Slide 9) is also a go-to-capital strategy for scaling supply-side capability.

The Ask

  • The deck is from a seed raise; in reality Divvy raised $10M in this round (context provided).
  • Slide 9 describes intended use: build/validate a lending/credit facility and then scale to bank partner and off-balance-sheet origination — funds would primarily support capital for home purchases and building credit infrastructure. Exact allocation percentages are not shown.

Investor Deep Dive

Executive summary, strengths & red flags

Executive Summary

This is a concise, investor-facing seed deck that pitches Divvy as a technology-enabled fractional homeownership platform that buys homes for tenants, then sells equity to tenants over time. The deck is notable for a crisp problem statement and simple solution visuals, identifiable early traction and agent distribution mechanics, but it also contains many placeholders for key financials and unit economics.

Key Strengths

3 identified

1

Clear, concise problem + simple one‑slide solution (Slides 3–4) — the core value proposition is instantly understandable.

2

Strong founding team with relevant product, tech and capital markets experience (Slide 2) — covers the main disciplines required to execute.

3

Credible distribution flywheel (Slide 12) and early traction visuals (Slide 13) — suggests demand and a replicable agent-led acquisition channel.

Red Flags & Weaknesses

6 identified

1

Missing/placeholder unit economics and financials (Slides 6–7 & 9) — many slides use $X, Y% placeholders; per-home revenue, margins, payback periods and capital efficiency are not provided. This is a major red flag for an investor evaluating capital intensity.

2

Capital and credit risk not fully quantified — the deck acknowledges need for a credit facility but lacks stress-testing, default rate assumptions, required advance rates, and detailed capital sources.

3

Regulatory, tax and title/legal complexity of fractional homeownership is not addressed — shared ownership, equity transfers, mortgage readiness and foreclosure/process flows are operationally and legally complex but not discussed.

4

Market sizing is loose — the 6M households claim is headline-level; no bottom-up TAM, SAM or credible SOM calculation is provided.

5

Lack of competitor analysis — no explicit comparison to rent-to-own providers, iBuyers, mortgage originators, REITs or other alternative pathways to homeownership.

6

Some slide copy errors/typos (e.g., "$27K med. home price" for Baltimore) reduce perceived polish.

More Pitch Decks To Study

Compare structure, fundraising context, and investor-facing story across similar startup decks.