Compare your deck to Cloudera

Compare Your Deck

Cloudera Pitch Deck (2008)

SaaS
Stage: Series A
Raised: $5M
Year: 2008
Slides: 15
Outcome: Acquired by KKR/CD&R for $5.3B (2021)

Pitch Deck

1 / 15
Cloudera pitch deck - The Opening: Mission and Timing
Click to expand

Deck Analysis

This 2008 Series A pitch deck from Cloudera presents Hadoop as an enterprise-grade platform for large-scale data processing. The deck frames a clear market opportunity (exploding data volumes vs. Moore's Law), explains the open-source technology (MapReduce + HDFS), shows early user momentum and a product solution that replaces expensive ETL grids, and closes with company differentiators focused on enterprise hardening. It's notable because it combines technical clarity with a business case and operational concerns that enterprise buyers care about—positioning an open-source project into a commercial, supportable offering.

The Opening: Mission and Timing

The Opening: Mission and Timing

The title slide (SLIDE 1) establishes Cloudera and its mission: “Hadoop for the Enterprise.” It’s simple and direct, immediately signaling that this is about delivering a developer-centric infrastructure technology into enterprise contexts. The visual (calm ocean background) and the date (September 2008) subtly communicate a strategic moment — the early wave of big data adoption — and set expectations for a foundational technology story rather than a flashy consumer product pitch.

From a founder’s perspective, this slide demonstrates the value of a crisp positioning statement up front. Investors and enterprise buyers need to immediately understand who you are selling to and what problem you intend to solve; Cloudera uses four words to do that. The slide could be improved with a one-line subheader that quantifies the opportunity, but its restraint helps the deck steer attendees toward the market narrative that follows.
Key Takeaway: Open with a concise positioning statement that identifies who you serve and the core value — clarity up front primes the investor for the rest of the story.
Establishing the Market Need: Data Growth vs. Moore’s Law

Establishing the Market Need: Data Growth vs. Moore’s Law

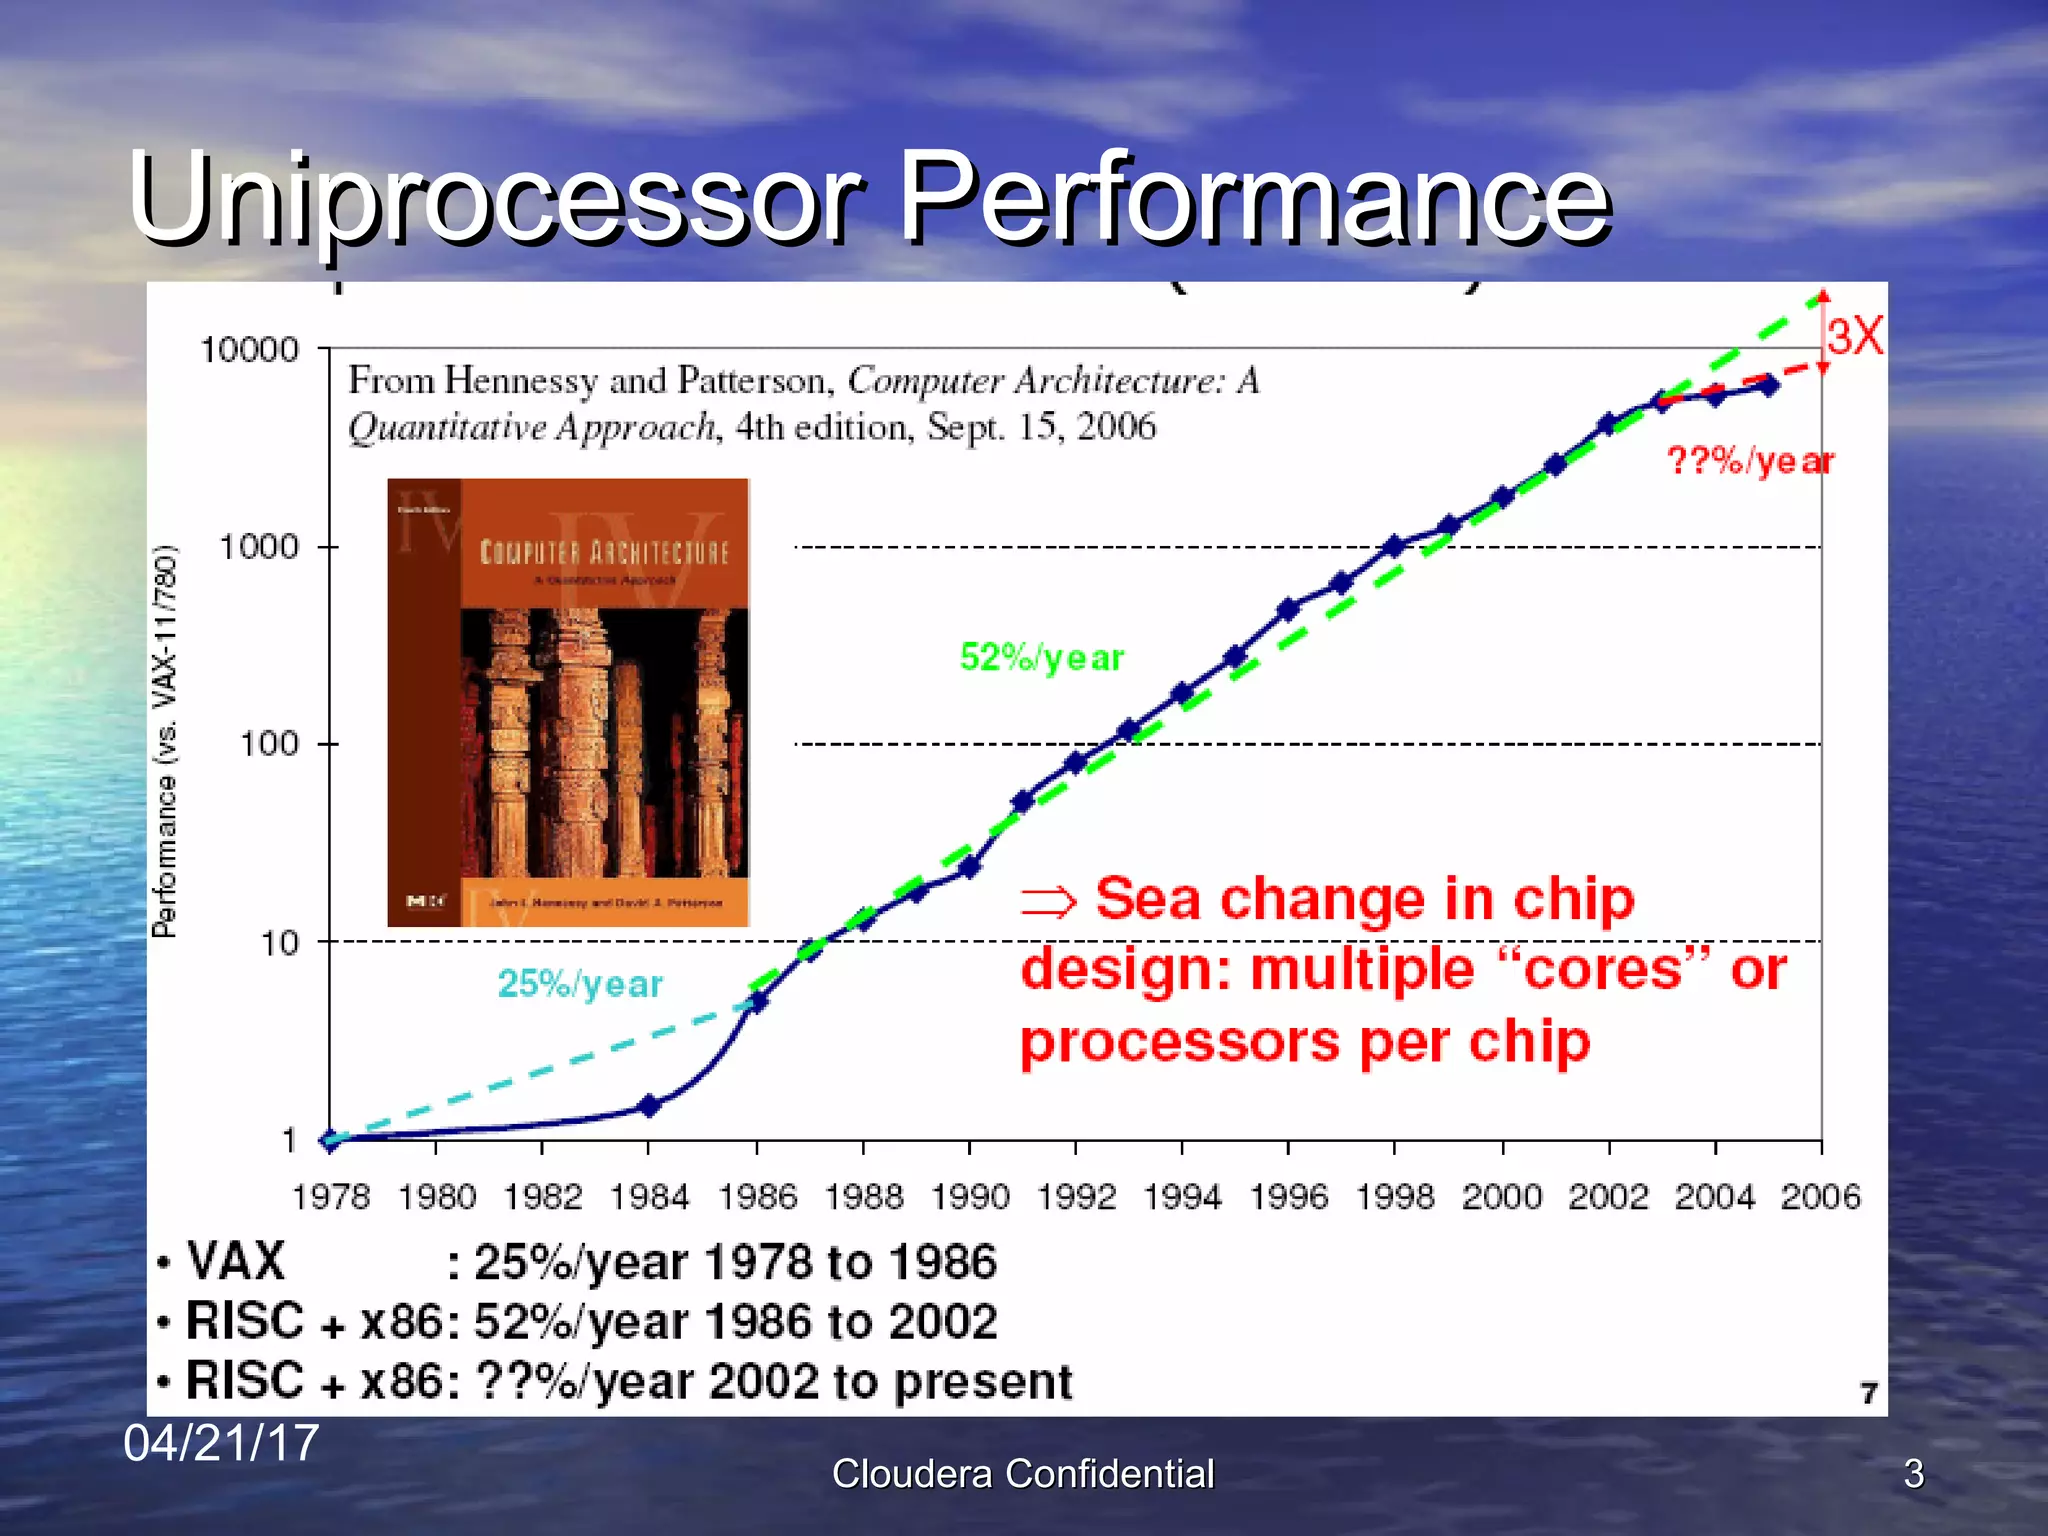
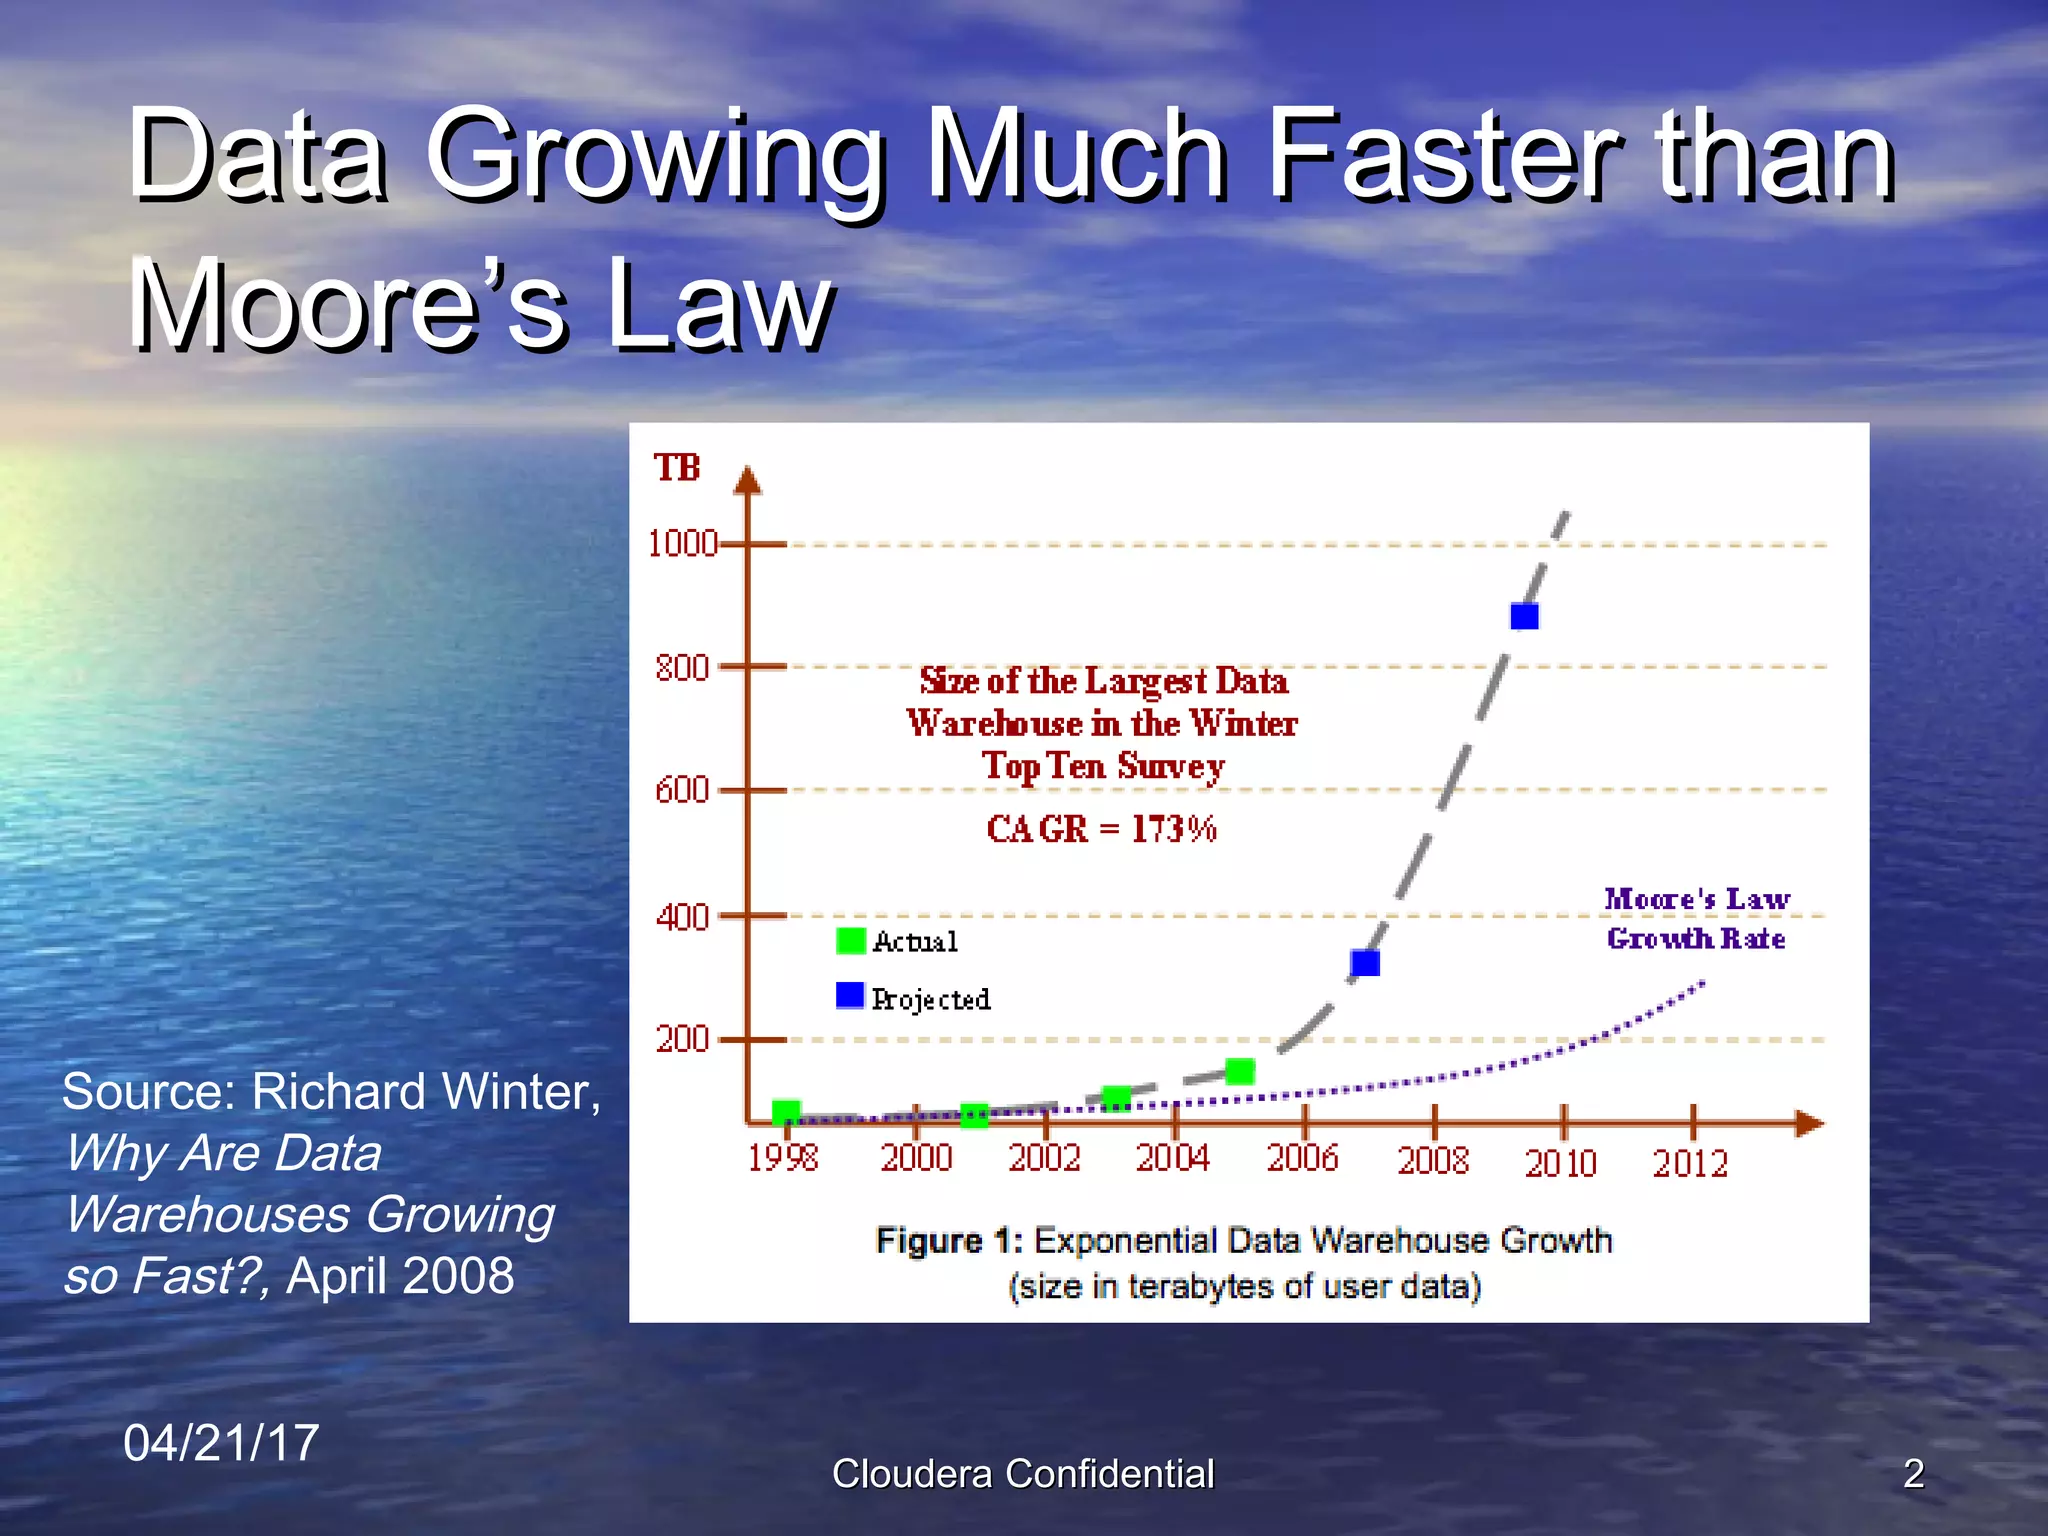
Slide 2 uses a chart (sourced to Richard Winter) to dramatize that data growth is outpacing traditional hardware scaling. This slide is effective because it quantifies why legacy architectures and single-node improvements won’t solve the problem: scale (TB → PB) requires new distributed approaches. The juxtaposition of a steep data-growth curve and a much slower Moore’s Law curve makes the necessity of distributed storage and processing self-evident.

For founders, this is a model for building urgency: use a credible data point or external research to show why incumbent solutions will fail and why your approach is not just better, but required. The slide also illustrates the power of visual contrast — make the gap obvious so the audience perceives the structural opportunity rather than a marginal improvement.

Key Takeaway: Back your problem statement with a clear, data-driven visual that shows incumbents can’t keep up — urgency sells necessity.
Product: What Hadoop Is and Why It Matters

Product: What Hadoop Is and Why It Matters

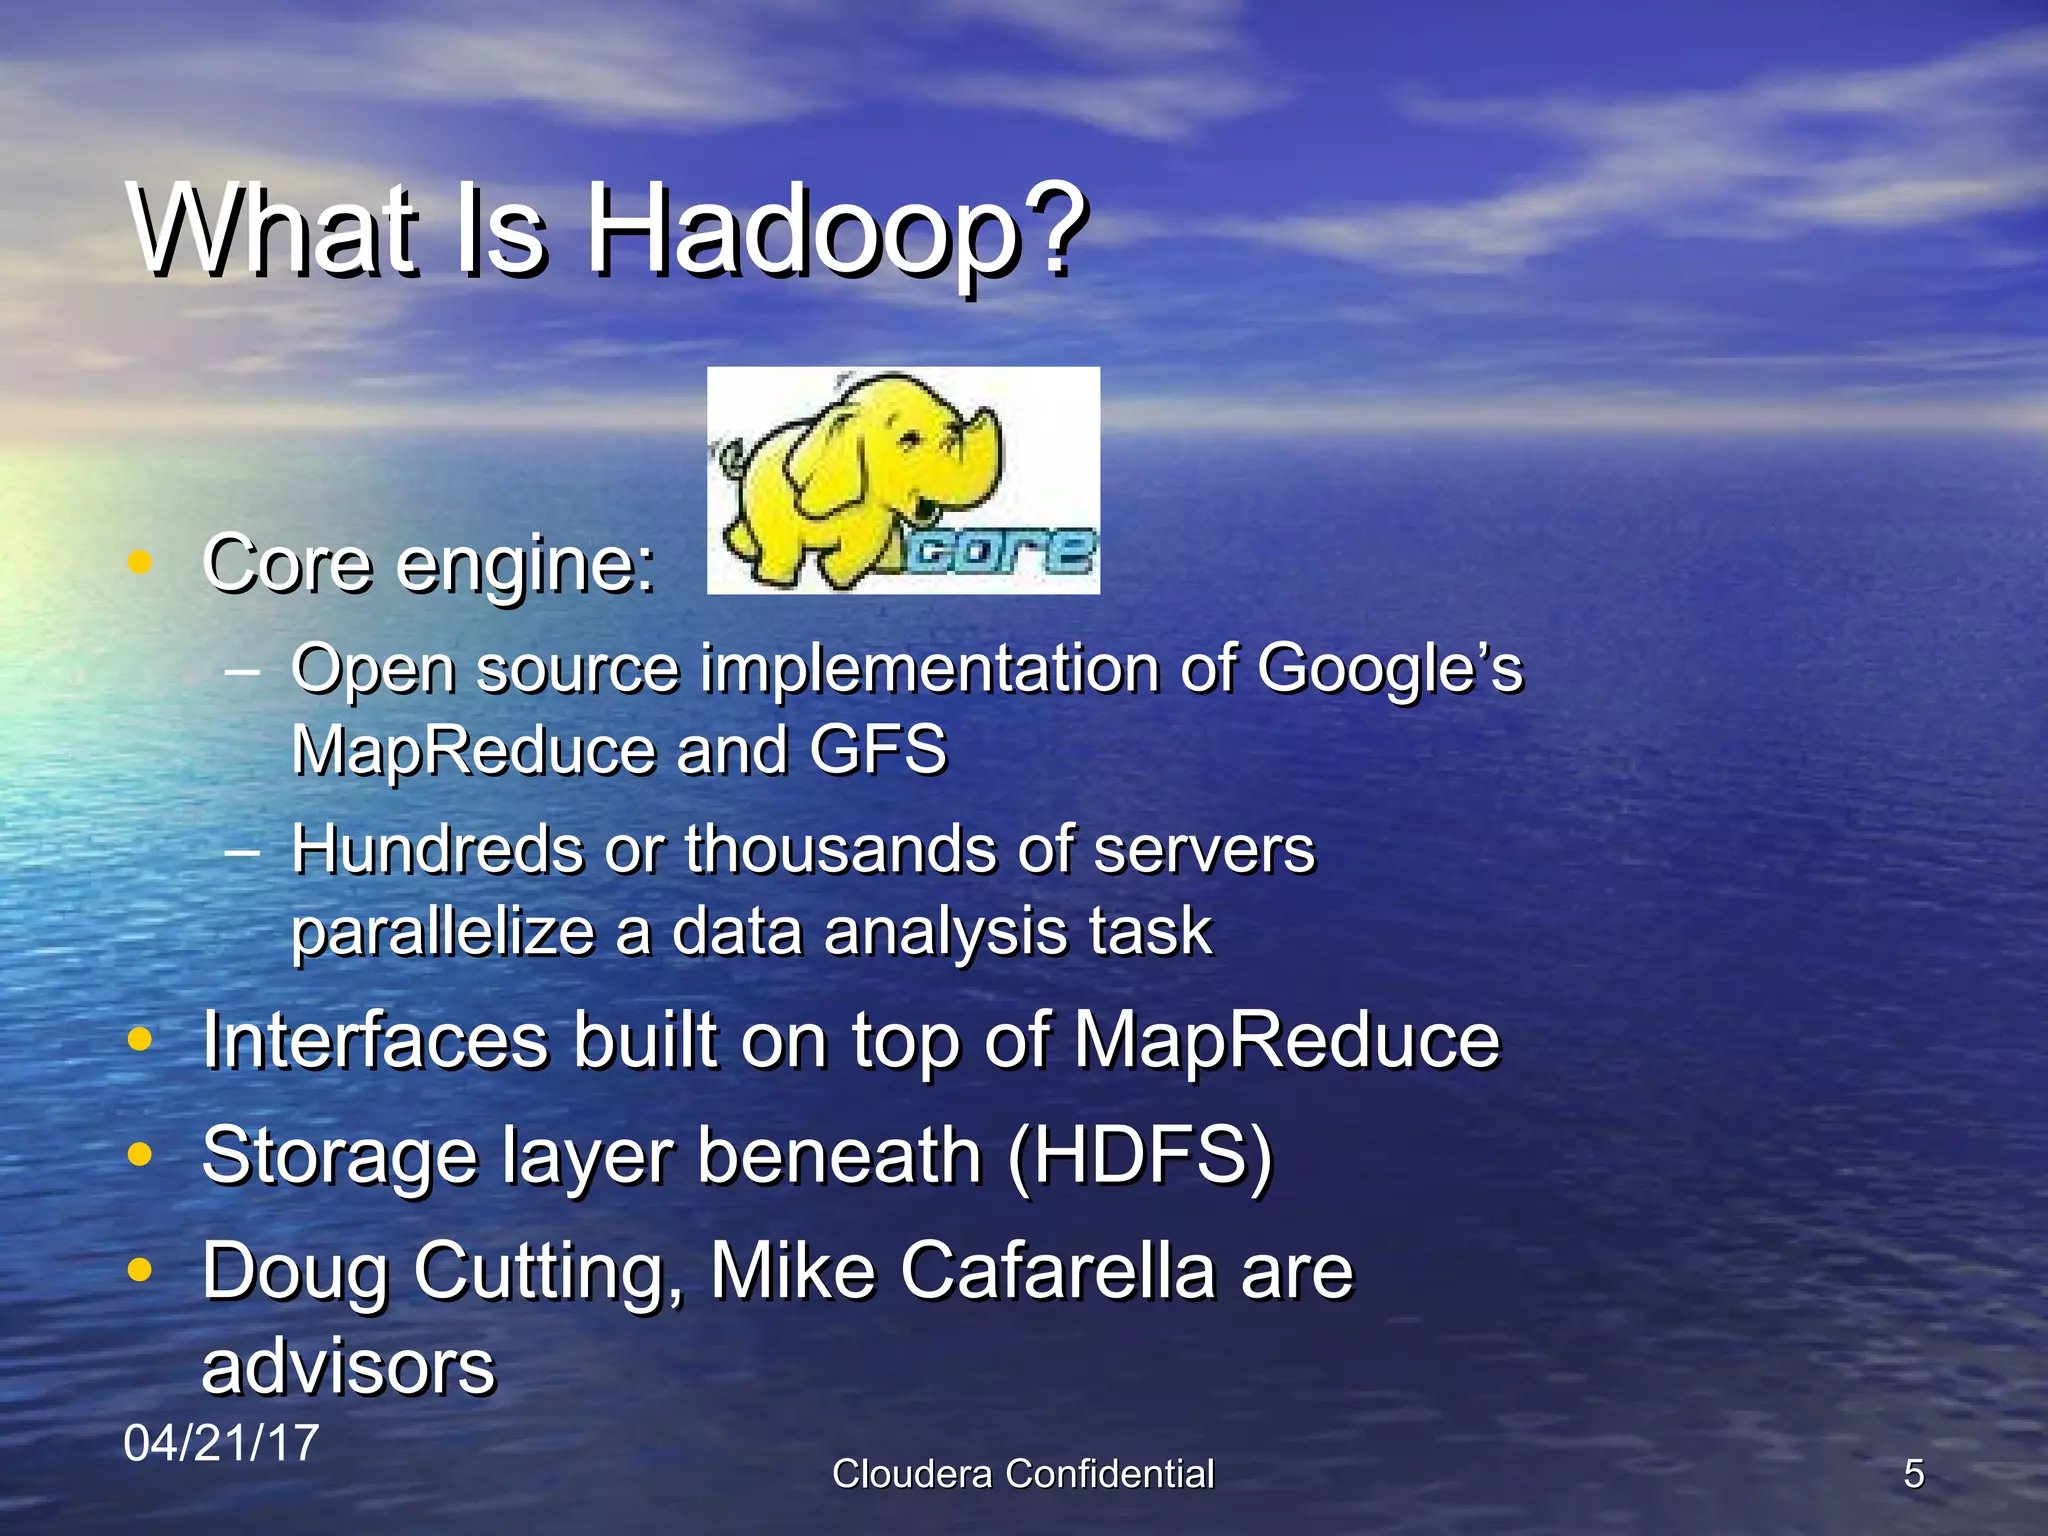
Slide 5 explains Hadoop in plain terms: an open-source implementation of Google’s MapReduce and GFS, the ability to parallelize across hundreds/thousands of servers, and a storage layer (HDFS). The slide balances technical accuracy with accessibility by naming both the core engine and common interfaces, and by referencing well-known advisors (Doug Cutting, Mike Cafarella) to increase credibility. This makes it suitable for mixed technical/business audiences typical in enterprise buying committees.

Founders should note how this slide translates technical architecture into business outcomes: scale, parallelism, and ecosystem compatibility. It also demonstrates the benefit of signaling open-source provenance and community credibility when your go-to-market will rely on developer adoption and partner integrations.

Key Takeaway: Explain core technology clearly and tie it to business outcomes; name-checking ecosystem and advisors builds early trust.
Proof Points: Early Users and Momentum

Proof Points: Early Users and Momentum

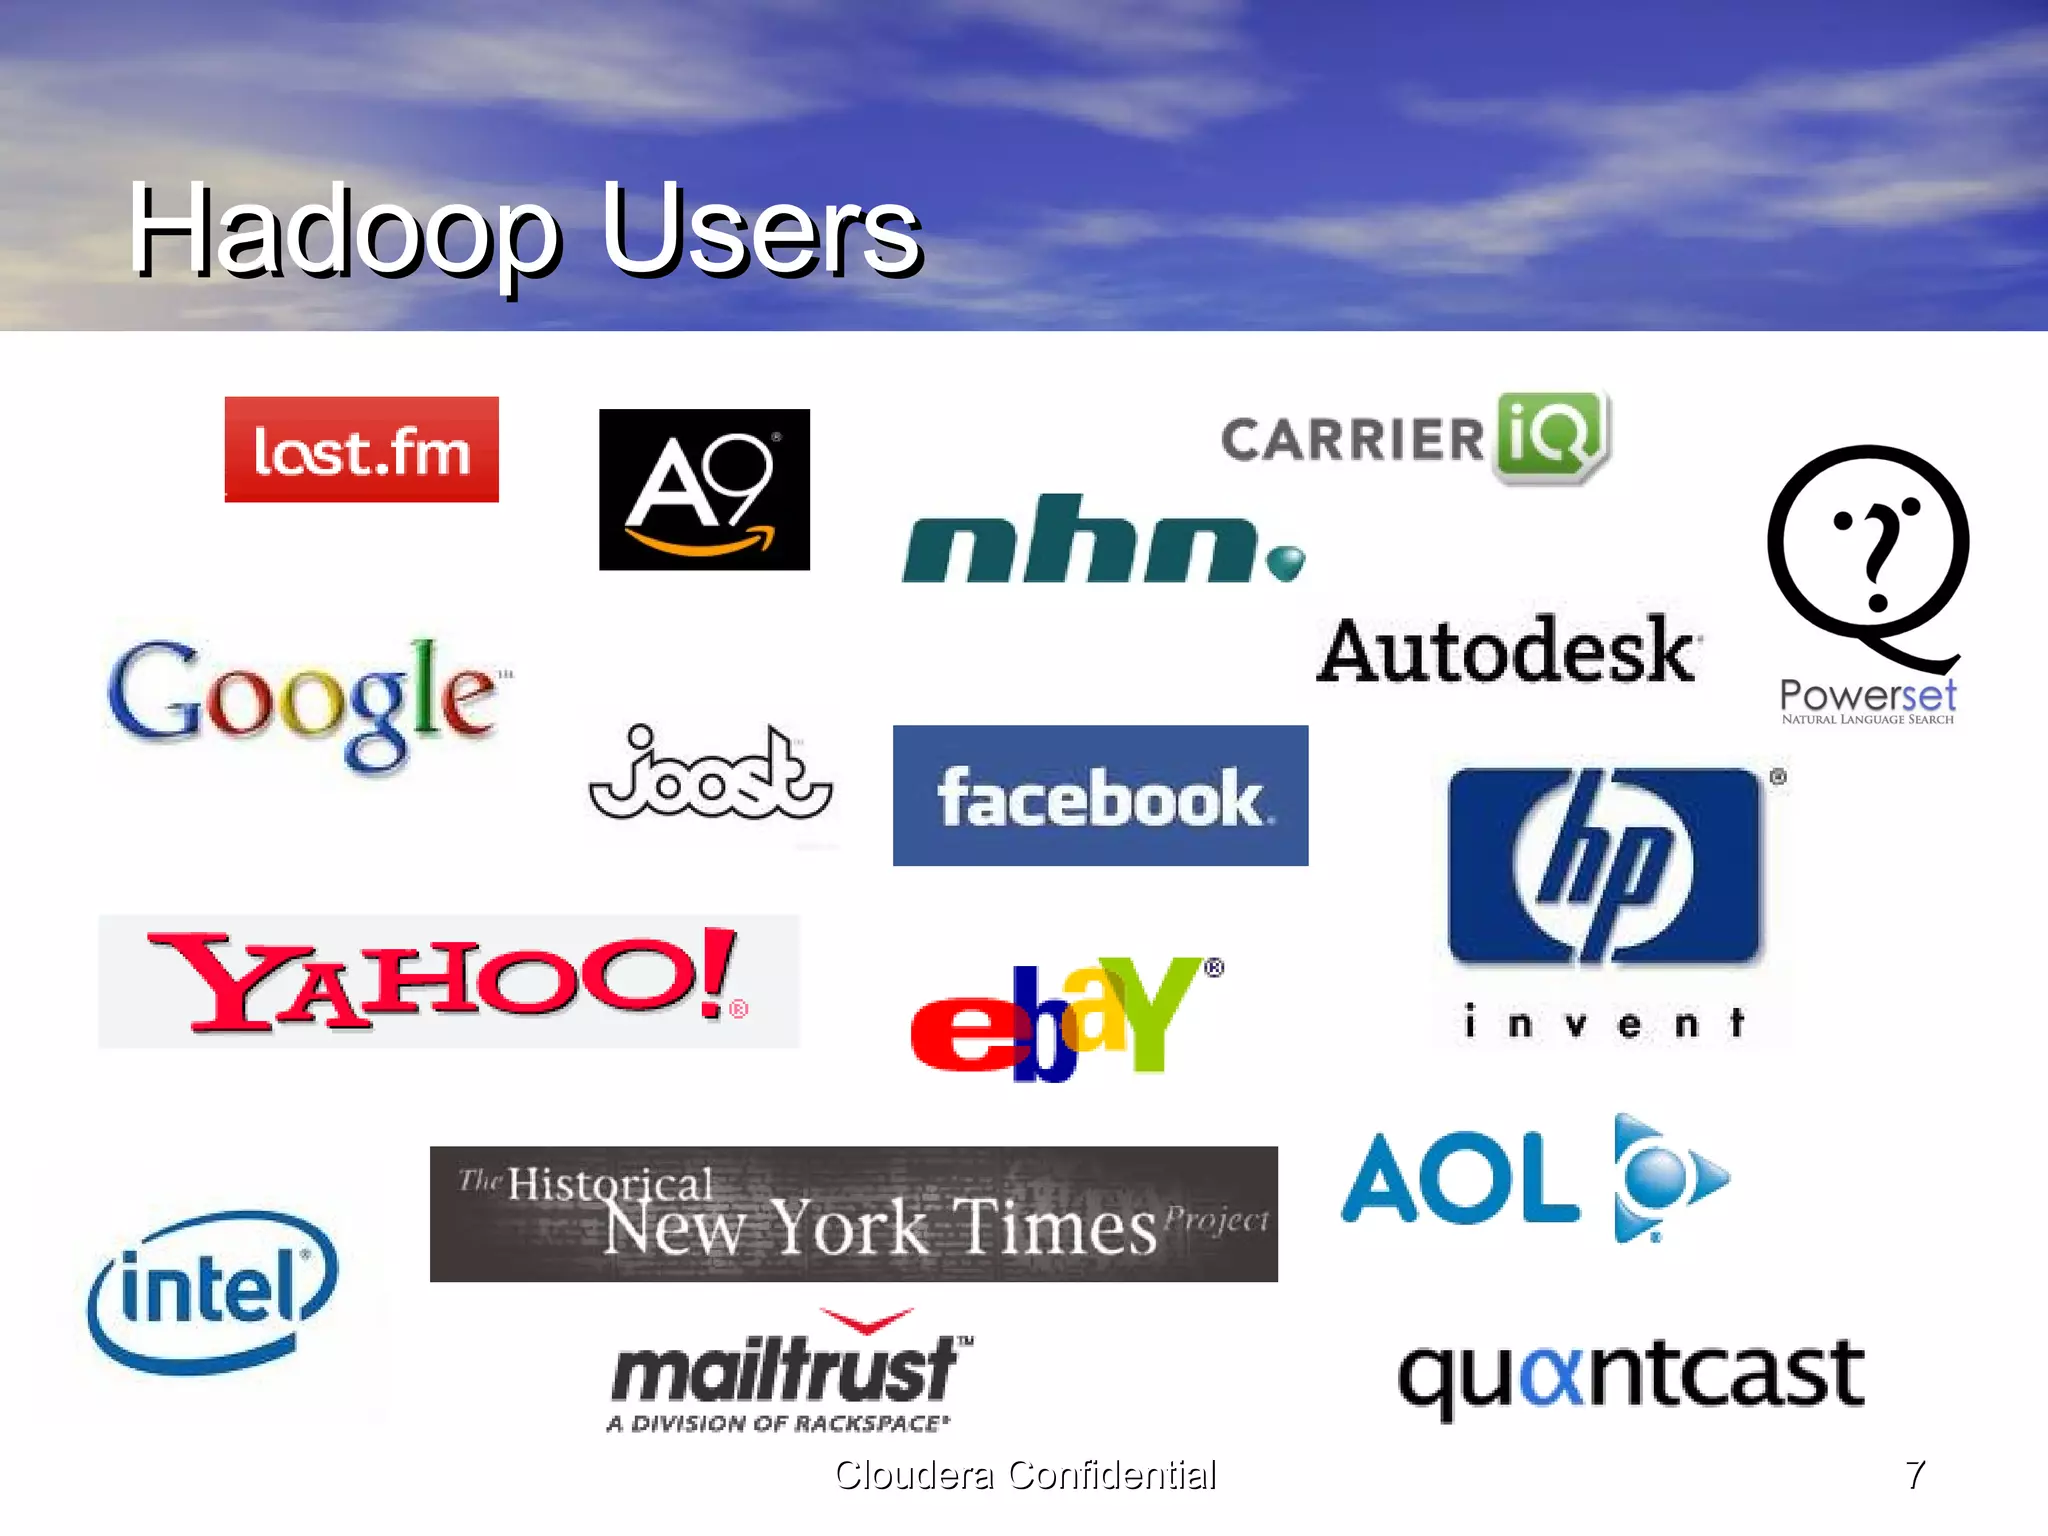
Slide 7 is a classic logo collage showing early adopters (Google, Facebook, Yahoo, eBay, HP, Intel, NYT, etc.), which delivers social proof that Hadoop works at scale and is already trusted by major tech players. This visual quickly answers the investor question: who’s using this? — and implies technical validation without lengthy case studies. The slide is low-effort but high-impact: recognizable brands provide credibility and help the audience infer use cases and scale.

Founders should emulate this when they have credible customers: a single slide of logos can be more persuasive than long testimonials. Make sure logos are accurate and permissioned as needed, and pair the collage with at least one short callout slide or appendix that provides a quantified customer example if time allows.

Key Takeaway: Use a logo roster to provide quick social proof — it’s an efficient credibility signal that drives trust with investors and customers.
Problem Deep Dive: Current Systems Isolate Access to Raw Data

Problem Deep Dive: Current Systems Isolate Access to Raw Data

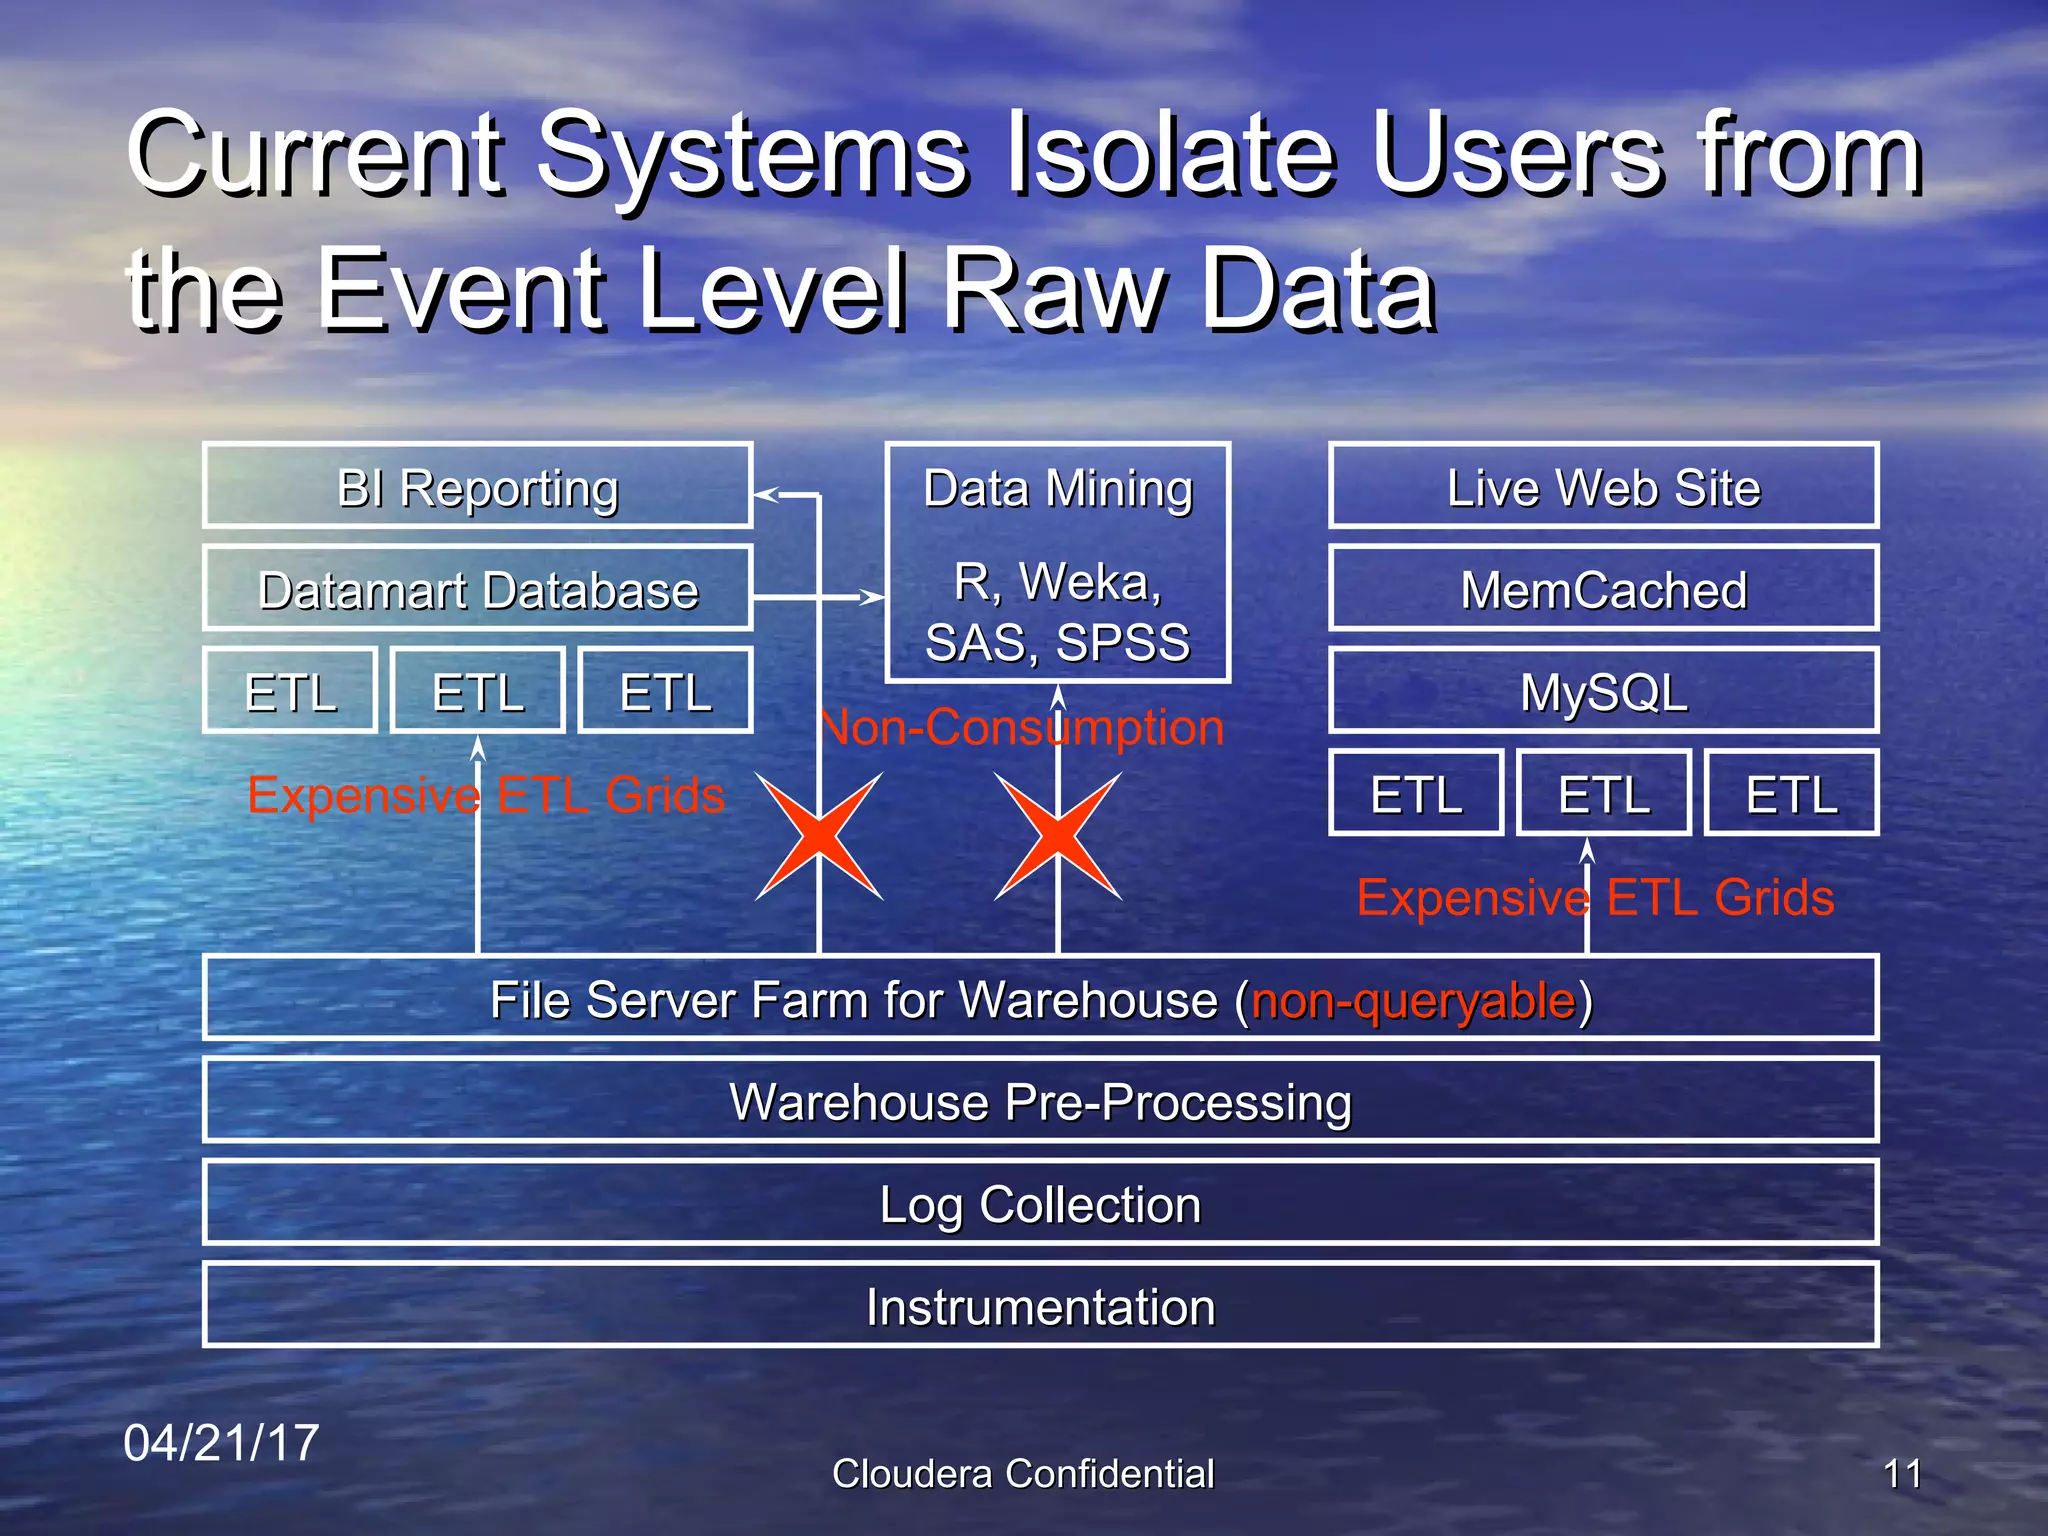
Slide 11 diagrams the enterprise data stack and highlights friction points: expensive ETL grids, non-queryable file server farms, and separation between raw event data and analytics/production systems. The visualization is effective because it maps the operational reality that many enterprises face — siloed systems, repeated ETL costs, and barriers to ad hoc analysis. By showing the pain concretely, Cloudera prepares the audience for a structural solution rather than a point product.

For founders, this is a strong example of diagnosing customer pain at an operational level. The more concretely you can articulate the workflow and cost implications (time, money, missed SLAs), the easier it is to justify both technical and commercial solutions. Diagrams that show “before” workflows set up the “after” solution in a way stakeholders can immediately evaluate.

Key Takeaway: Map the customer's existing workflow and pain points visually — show the operational cost of the problem to justify a structural solution.
Solution Narrative: Smart Storage Service and Eliminating ETL Grids

Solution Narrative: Smart Storage Service and Eliminating ETL Grids

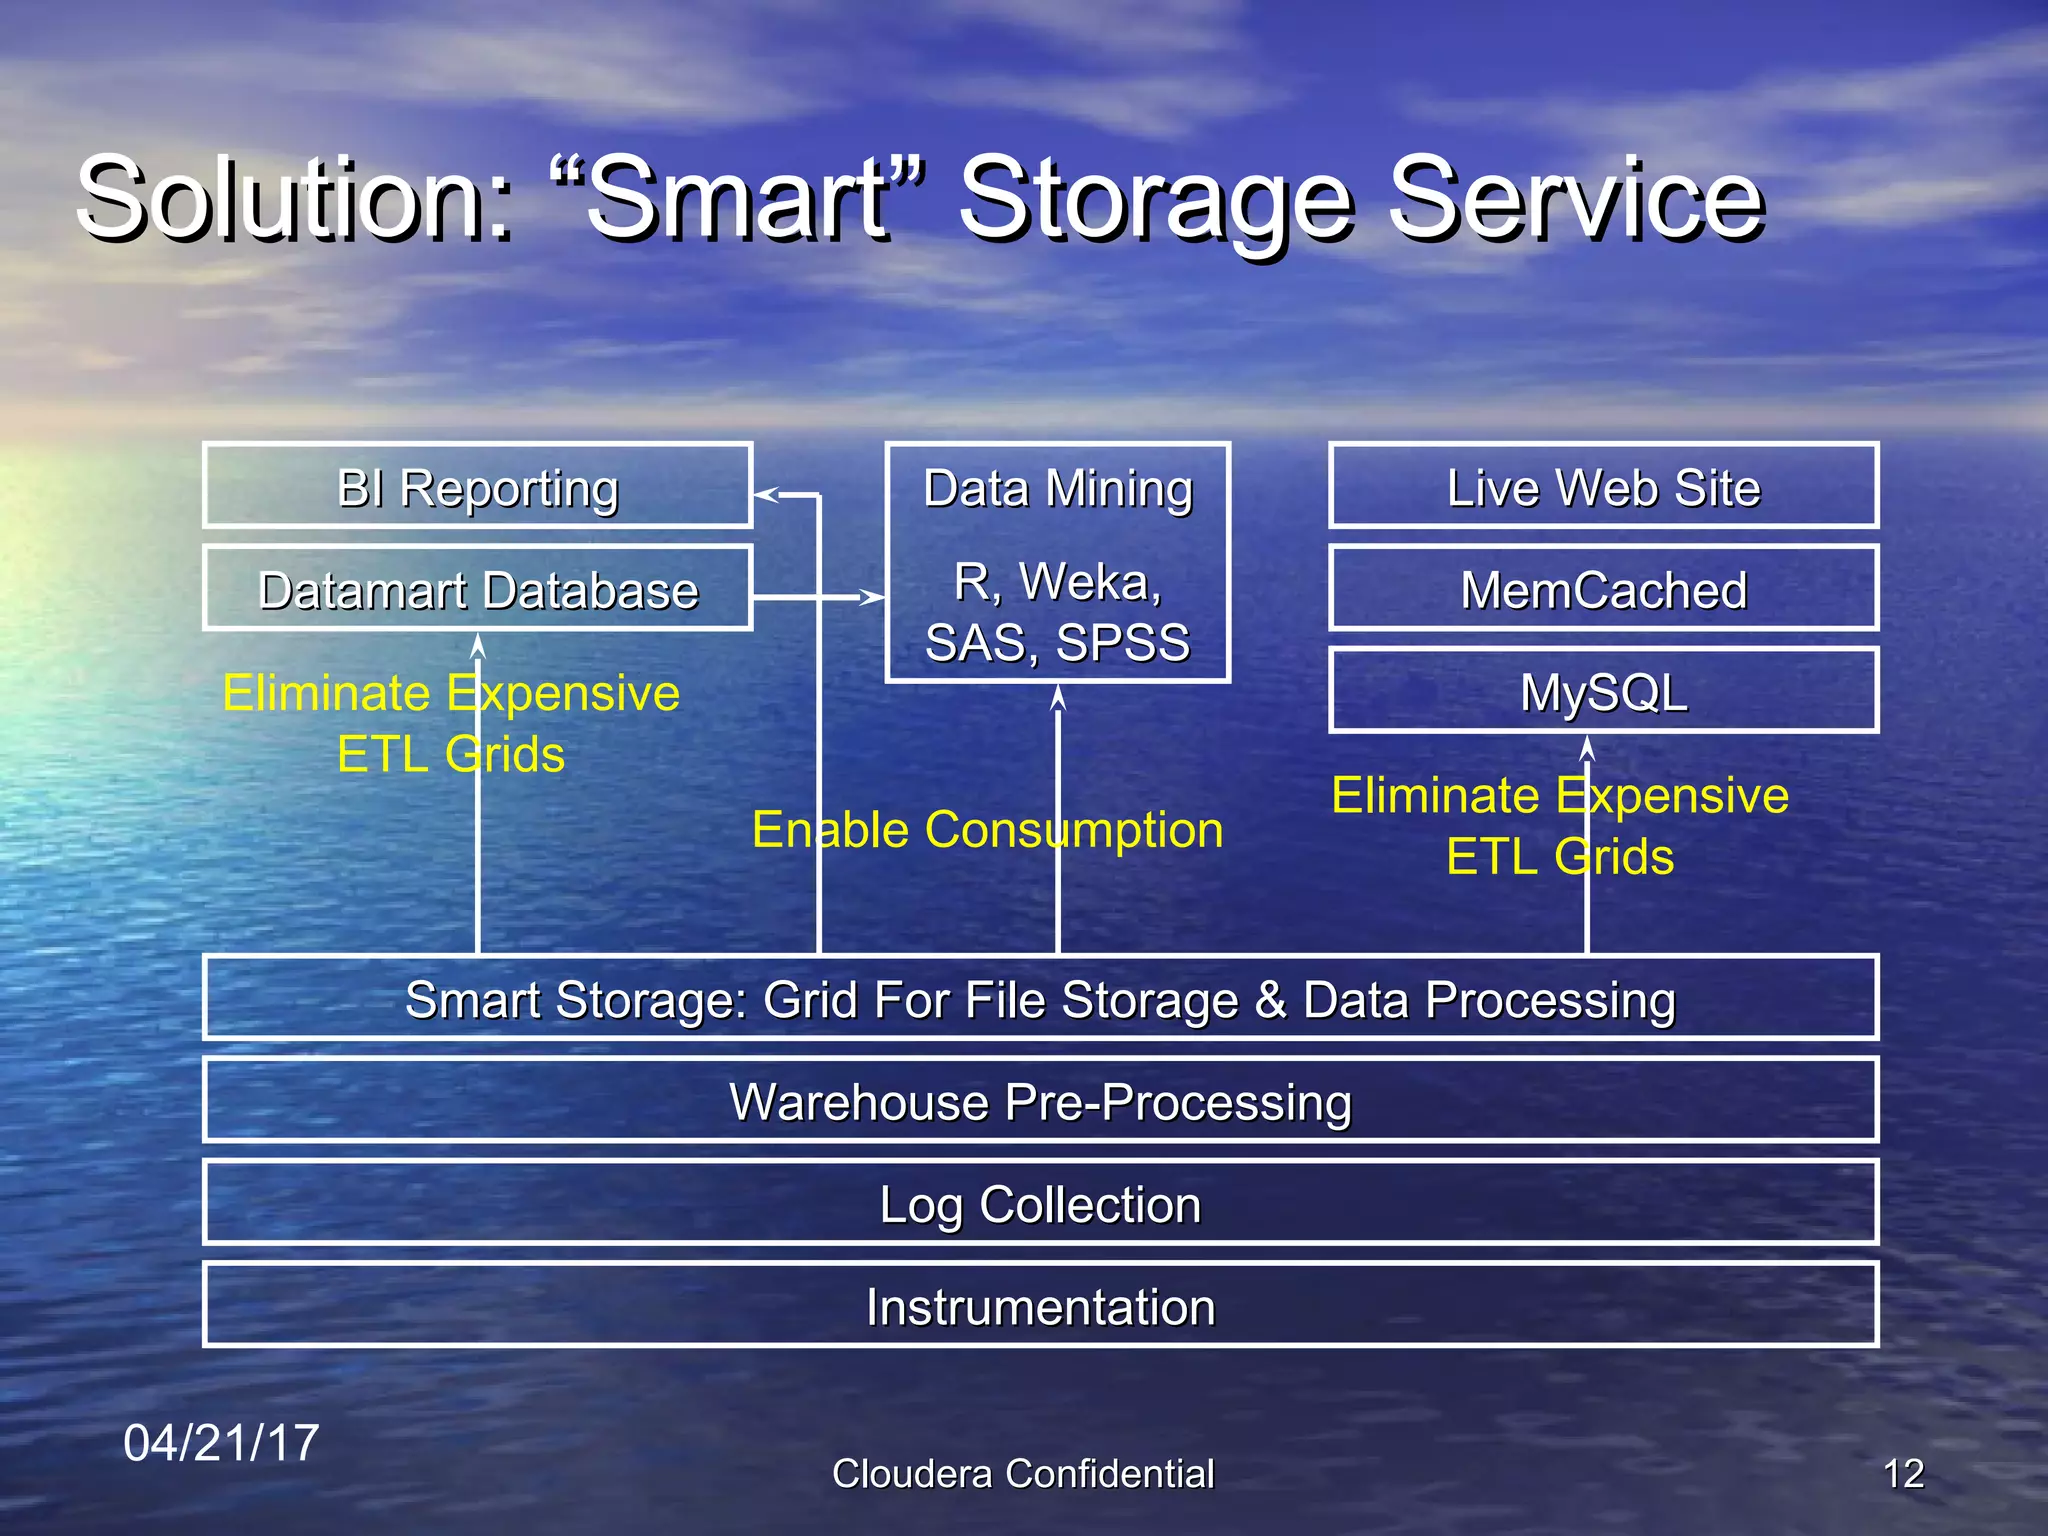
Slide 12 follows the problem slide with a direct solution: a ‘Smart Storage’ layer that enables consumption and eliminates expensive ETL grids. The slide mirrors the prior diagram so the audience can instantly compare before/after, which is a persuasive rhetorical technique. It positions Hadoop not just as raw compute or storage, but as a service that integrates into enterprise workflows — a necessary pitch when selling to IT and operations teams.

Founders should note the flow: identify the operational breakage, then align the product as a drop-in layer that reduces cost and friction. Emphasize measurable benefits (fewer ETL jobs, faster time-to-insight) and include implementation stories or metrics in the appendix to quantify ROI for enterprise buyers.

Key Takeaway: Present your product as a drop-in improvement to existing workflows and quantify how it reduces operational costs or complexity.
Go-to-Market & Differentiation: Enterprise Hardening

Go-to-Market & Differentiation: Enterprise Hardening

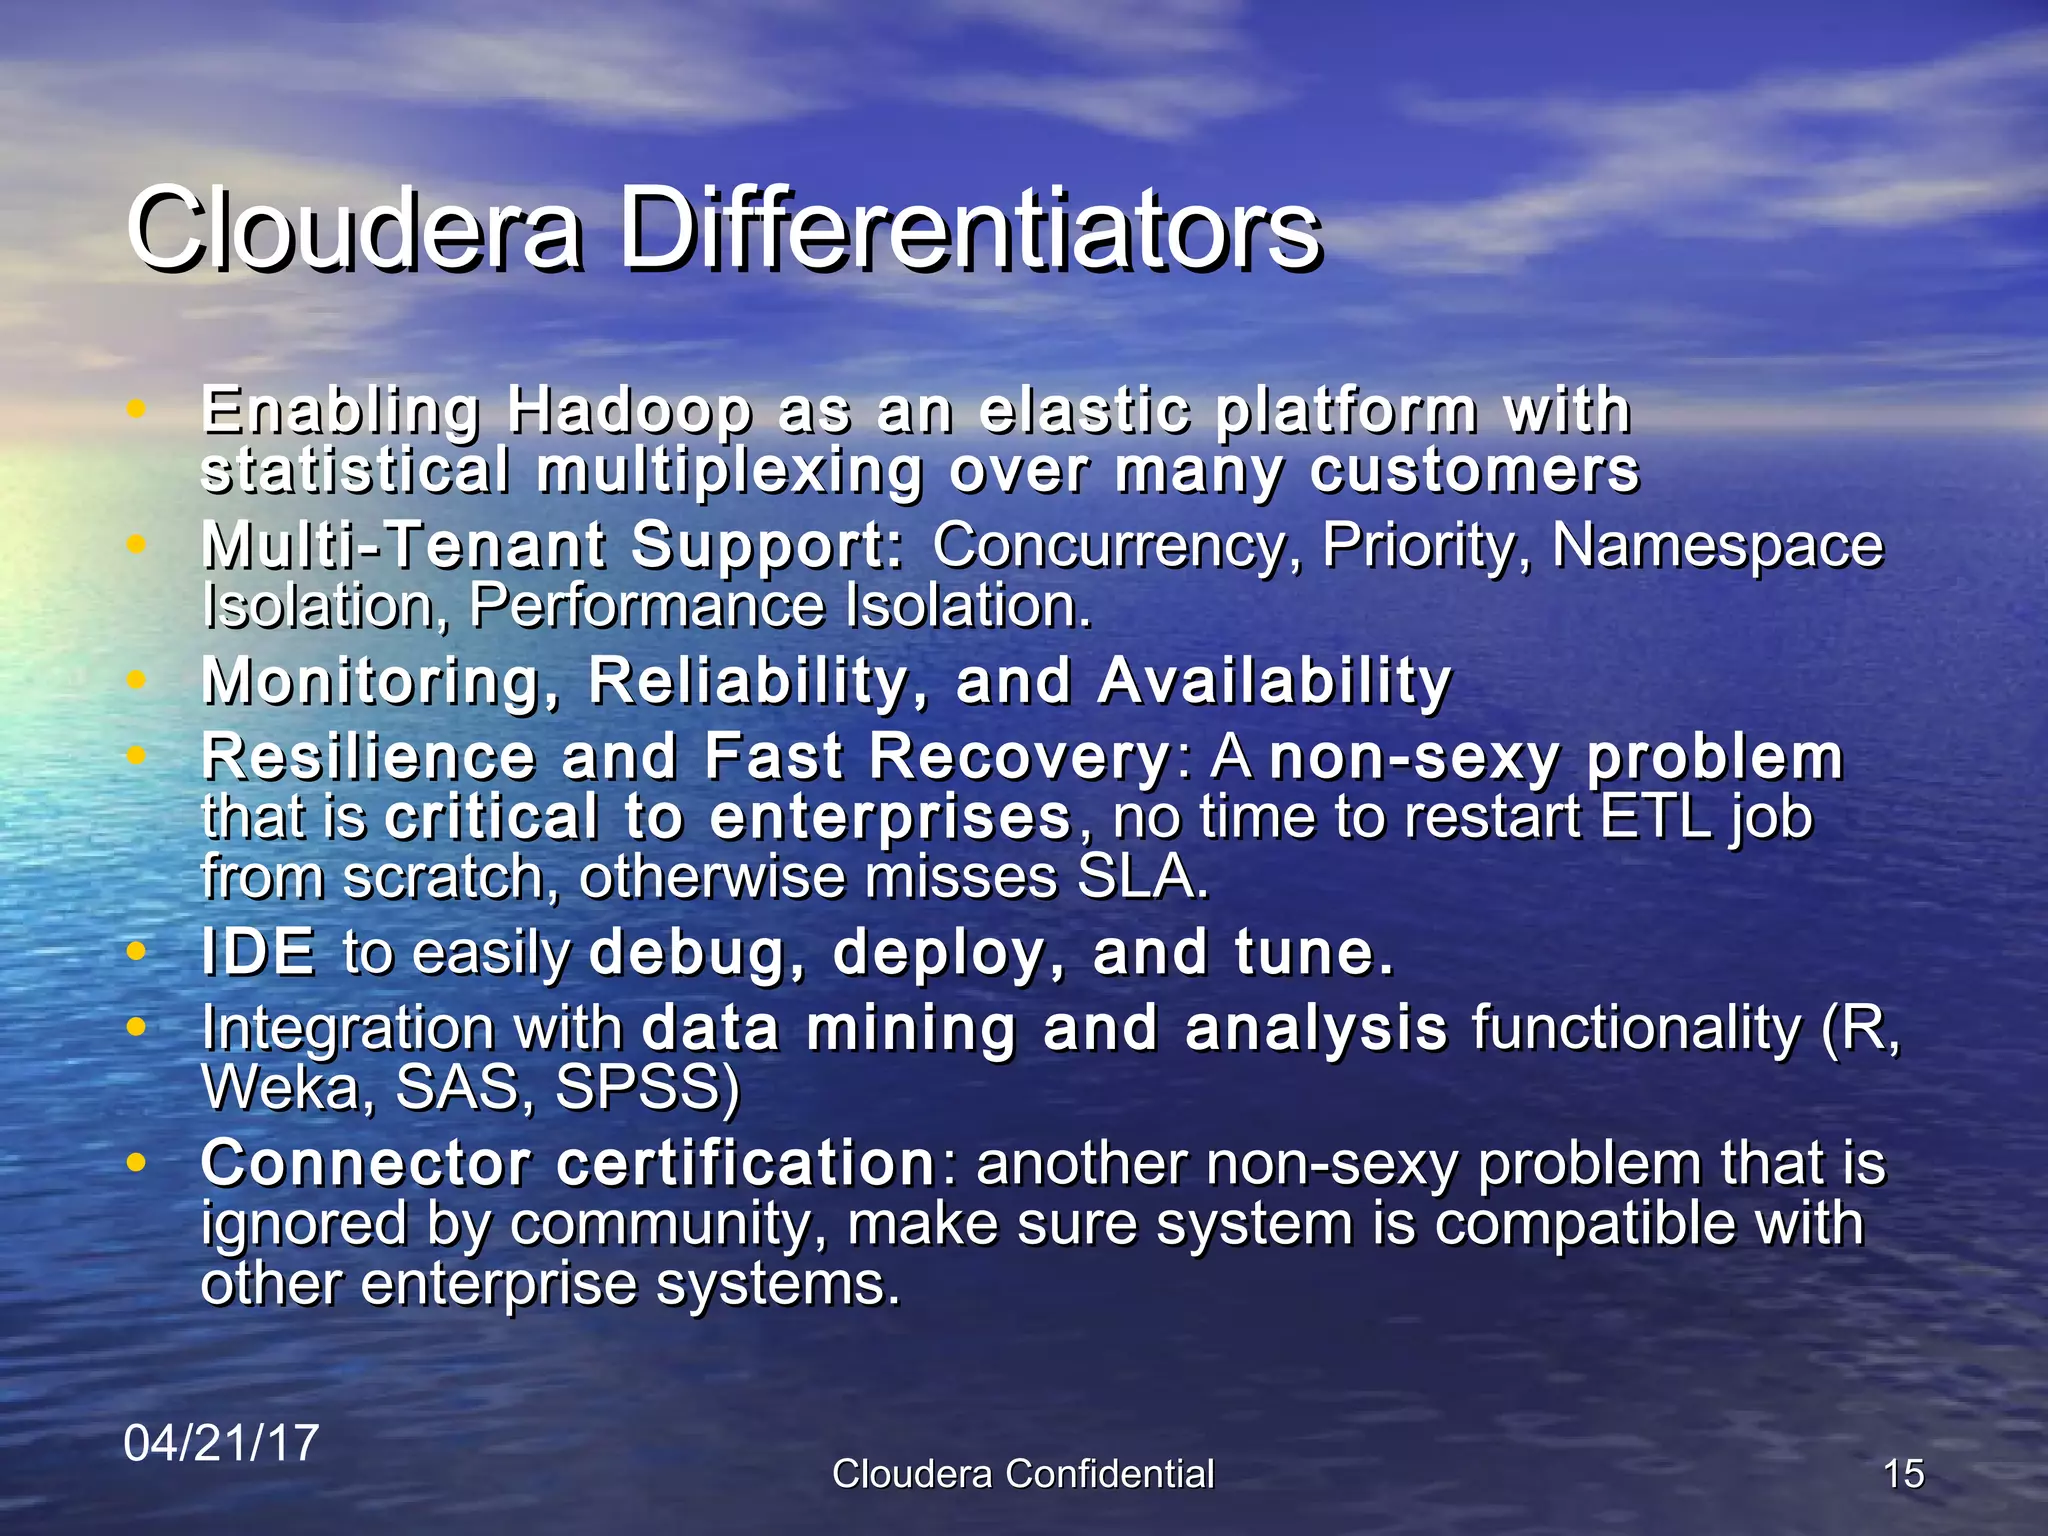
Slide 15 lists Cloudera’s differentiators: multi-tenant support, monitoring, resilience, IDEs for debugging, integration with analytics tools, and connector certification. This slide is valuable because it acknowledges that enterprise adoption hinges on non-glamorous features — reliability, management, and interoperability — that larger customers require. It also signals Cloudera’s go-to-market: position Hadoop as a hardened, supported platform rather than a community project.

For founders, the lesson is explicit: product-market fit in the enterprise often depends on operational features and services more than on novel algorithms. If you target enterprises, prioritize management, security, monitoring, and supportability early in both the product roadmap and the sales narrative, and be prepared to demonstrate SLA-oriented capabilities.

Key Takeaway: Differentiate on enterprise-grade features (resilience, multi-tenancy, tooling, connectors) — these operational capabilities unlock large deals.

Conclusion: Key Lessons

This deck succeeds by combining a crisp market narrative (data growth crisis), an accessible technical explanation (Hadoop’s architecture), credible social proof (logos and momentum), a clear problem/solution flow (ETL pain → smart storage), and enterprise-focused differentiation (resilience, monitoring, connectors). The balance between technical detail and commercial storytelling made it an effective Series A pitch for a company translating open-source technology into a commercial platform.

Actionable advice for founders: lead with a concise positioning statement; use data-driven visuals to create urgency; show how your product alters existing workflows and reduces concrete costs; demonstrate customer validation early; and invest in the non-sexy operational features that enterprise buyers require. Finally, structure the deck so each slide naturally sets up the next — problem, tech, proof, solution, and GTM — giving investors a clear path from need to monetization.

Full Deck Analysis

11 sections

Overview

Company: Cloudera
Round: Series A ($5M)
Year: 2008
Outcome: Acquired by KKR / CD&R for $5.3B (2021)

Executive Summary

This is Cloudera’s 2008 Series A deck positioning the company as the enterprise-grade vendor for Hadoop (MapReduce + distributed file system). The deck frames a fast-growing data problem, argues open-source Hadoop as the technical foundation, highlights enterprise feature gaps (multi-tenancy, monitoring, fast recovery) and shows early logos/interest and a very large market opportunity ($100B+ / $160B figure cited). It’s notable for identifying a huge structural trend early and pairing it with an experienced founding team.

Problem Statement

  • Slide 2: Data is growing “much faster than Moore’s Law” — establishes scale problem and inadequacy of traditional systems.
  • Slide 11: Current systems “isolate users from the event level raw data” — expensive ETL grids, preprocessing, and non-consumption by analytics tools.
  • The problem emphasized: existing enterprise data warehousing, ETL and BI stacks cannot scale economically to raw event-level data and large unstructured datasets.

Solution

  • Slides 12 and 5: Position Hadoop/HDFS as the “Smart Storage Service” and “Core engine” (open-source implementation of Google’s MapReduce and GFS) that can (a) store massive raw data, (b) bring compute to data and (c) eliminate expensive ETL grids by enabling direct consumption (analytics, BI, web apps).
  • Slide 15: Cloudera layers enterprise features on top of Hadoop: multi-tenant support, monitoring, resilience/fast recovery, IDEs for debugging/deploying/tuning, connector certification and integration with analytics tools (R, Weka, SAS, SPSS).

Market Opportunity

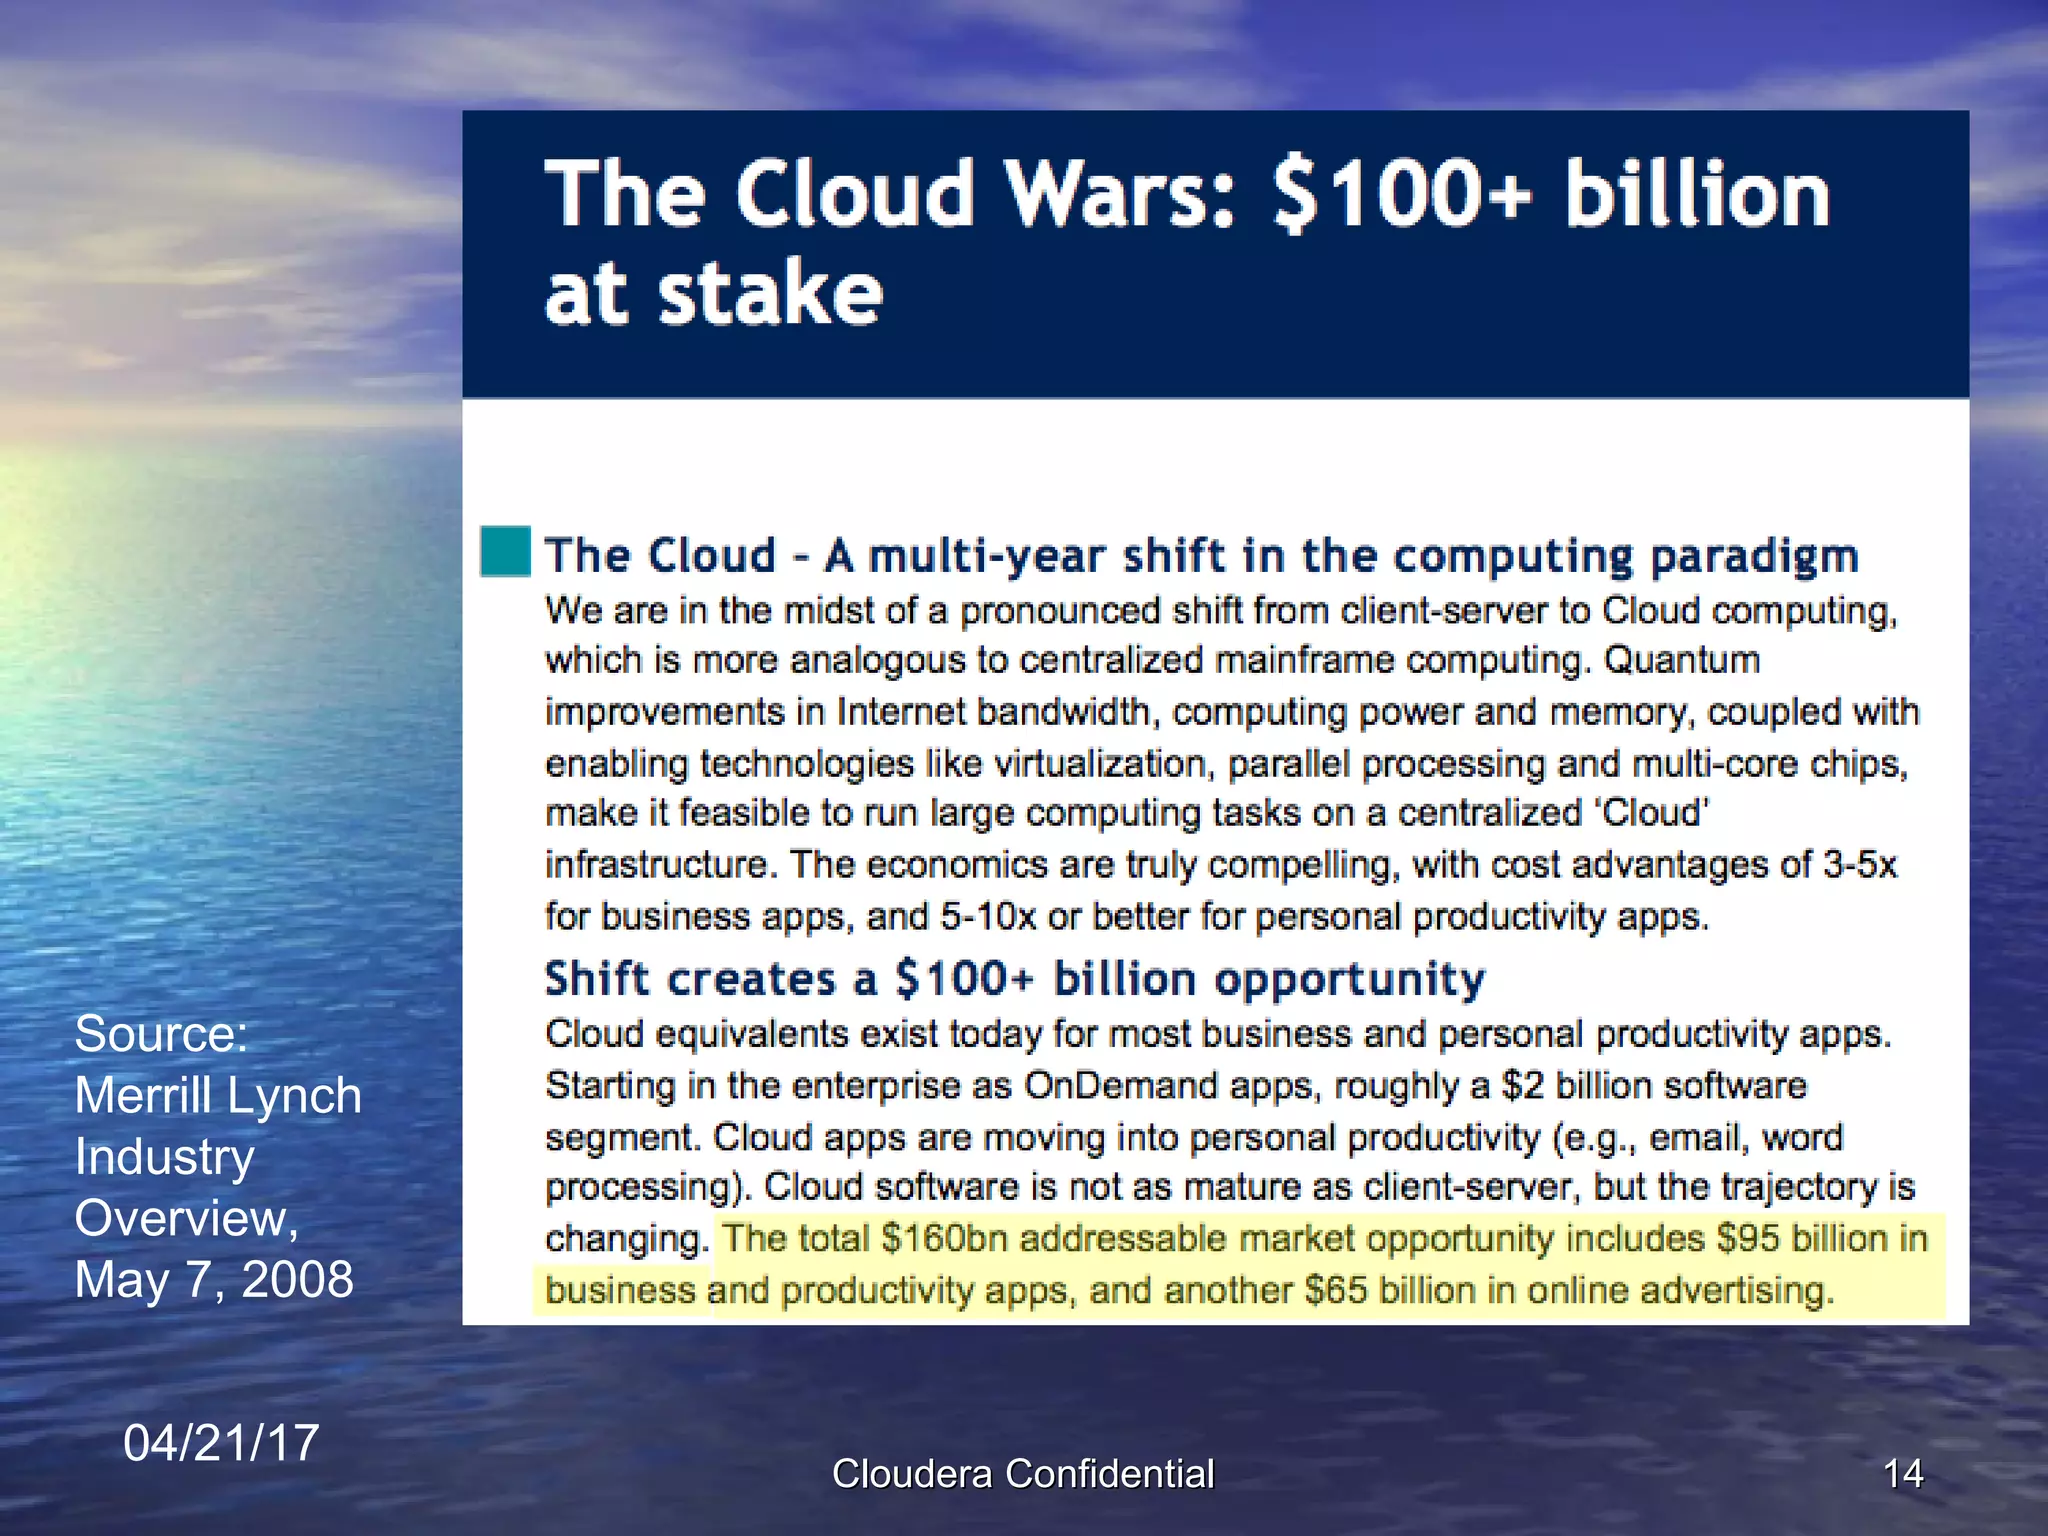
  • Slide 14 cites Merrill Lynch: “The Cloud Wars: $100+ billion at stake” and highlights a total $160B addressable market (text in yellow: “The total $160bn addressable market opportunity includes $95 billion in business and productivity apps, and another $65 billion in online advertising”).
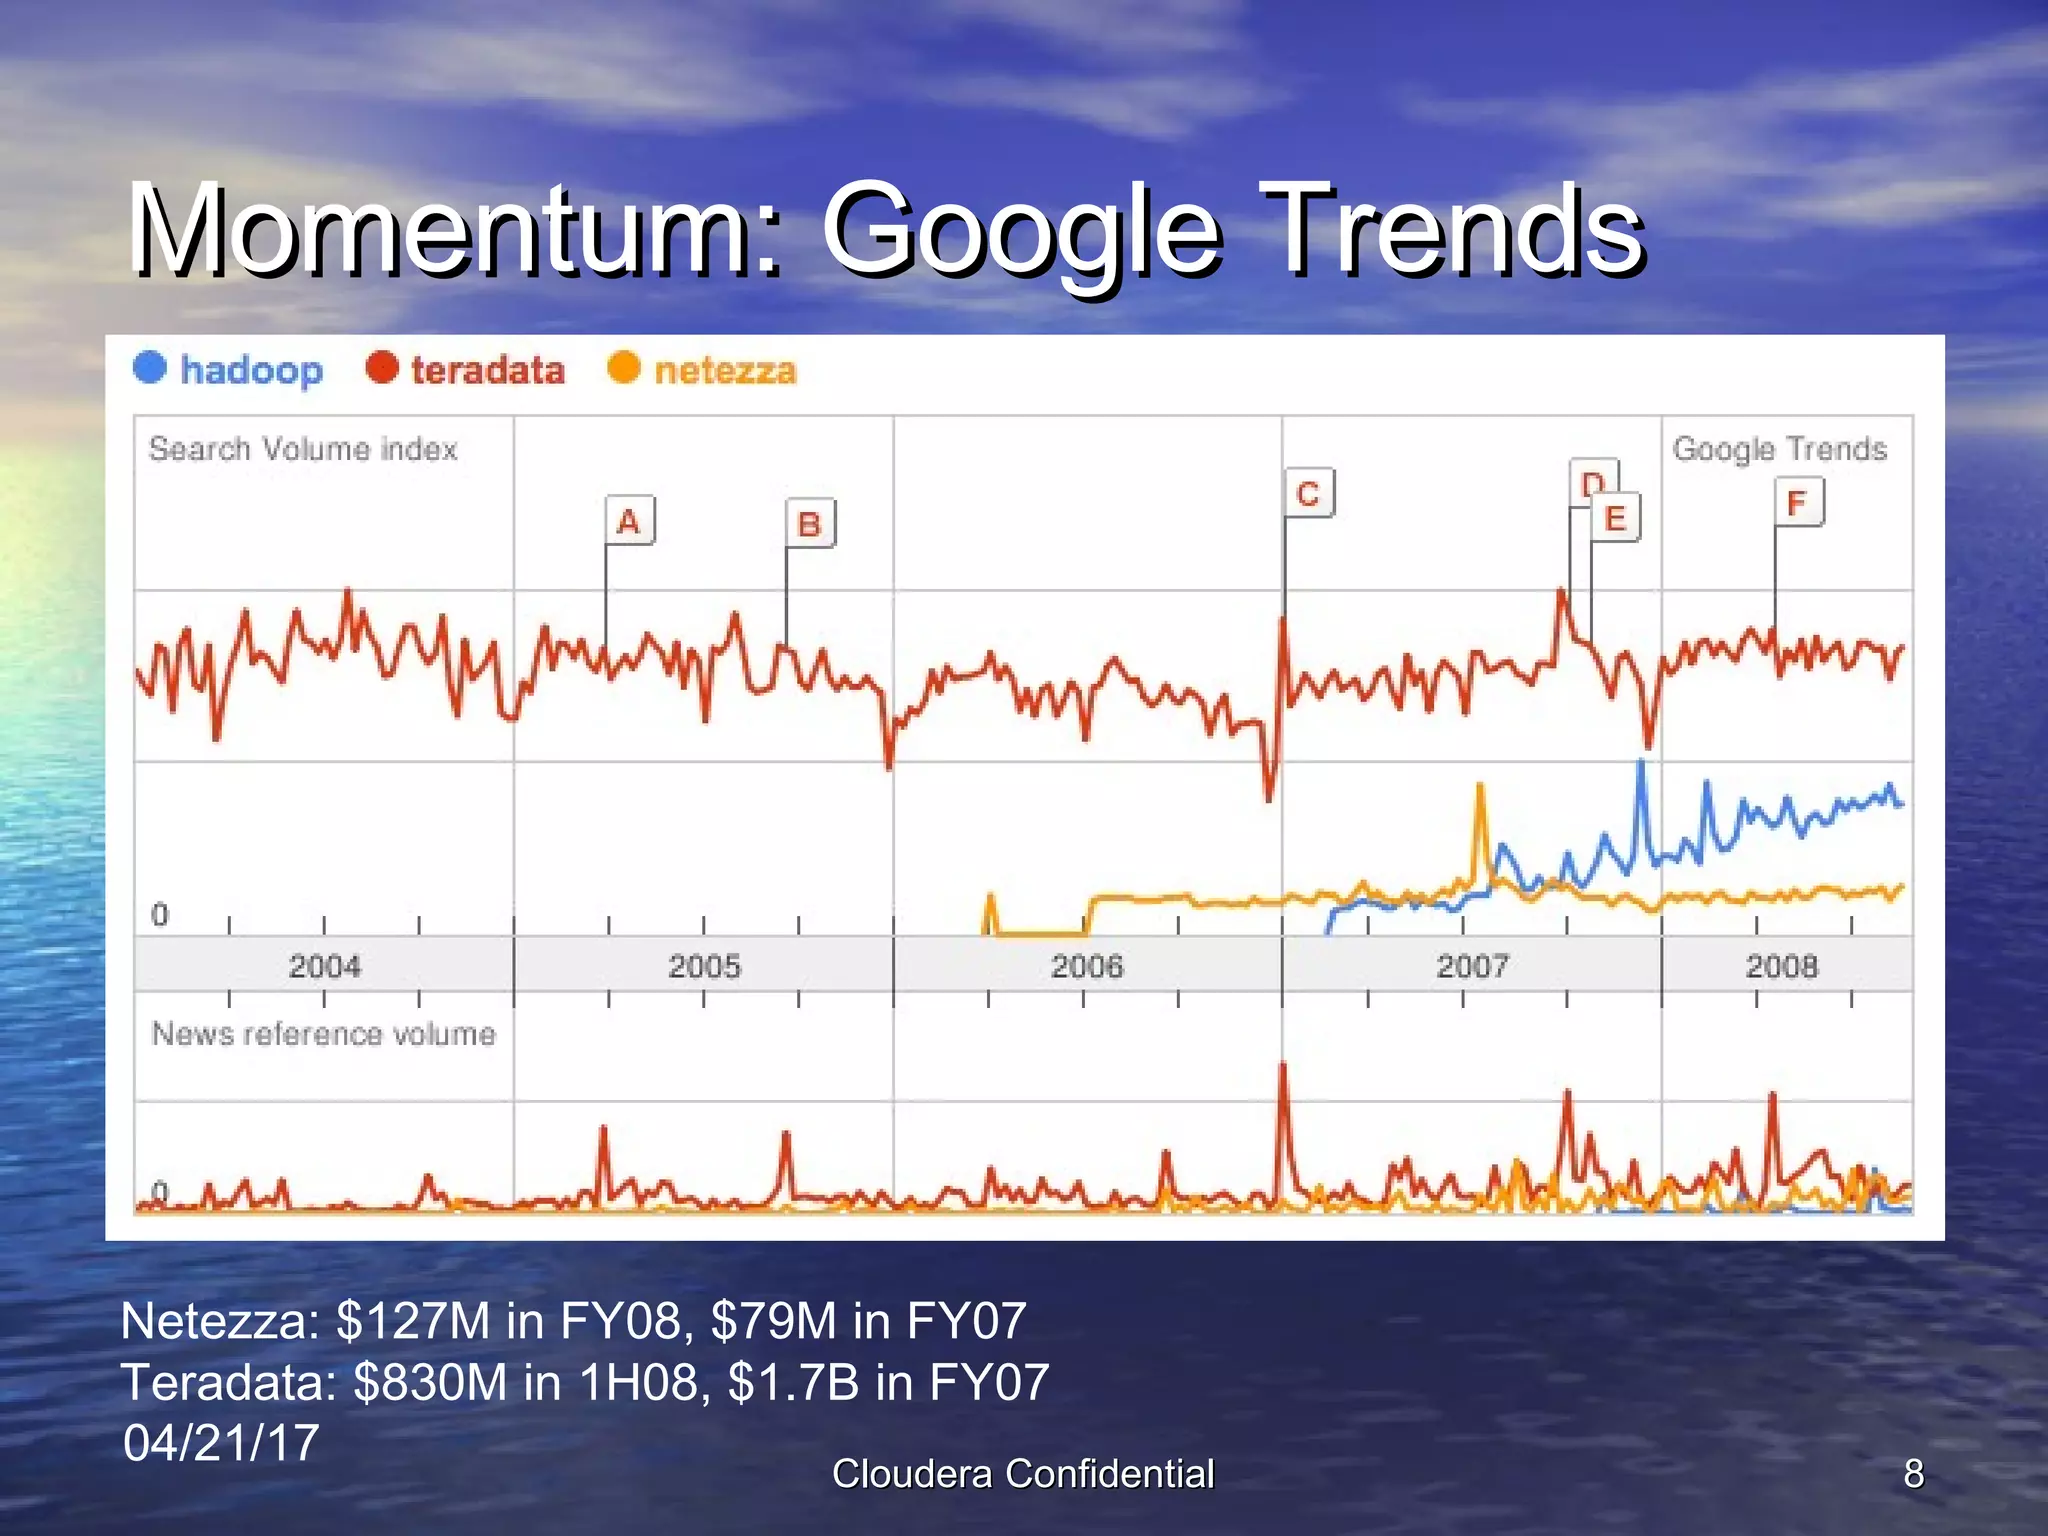
  • Slide 8 provides comparative revenues for incumbents / adjacent vendors: Netezza ($127M FY08, $79M FY07) and Teradata ($830M in 1H08; $1.7B FY07) to show existing large markets for data warehousing/analytics.
  • Implication: very large TAM for enterprise big data / cloud infrastructure and analytics.

Business Model

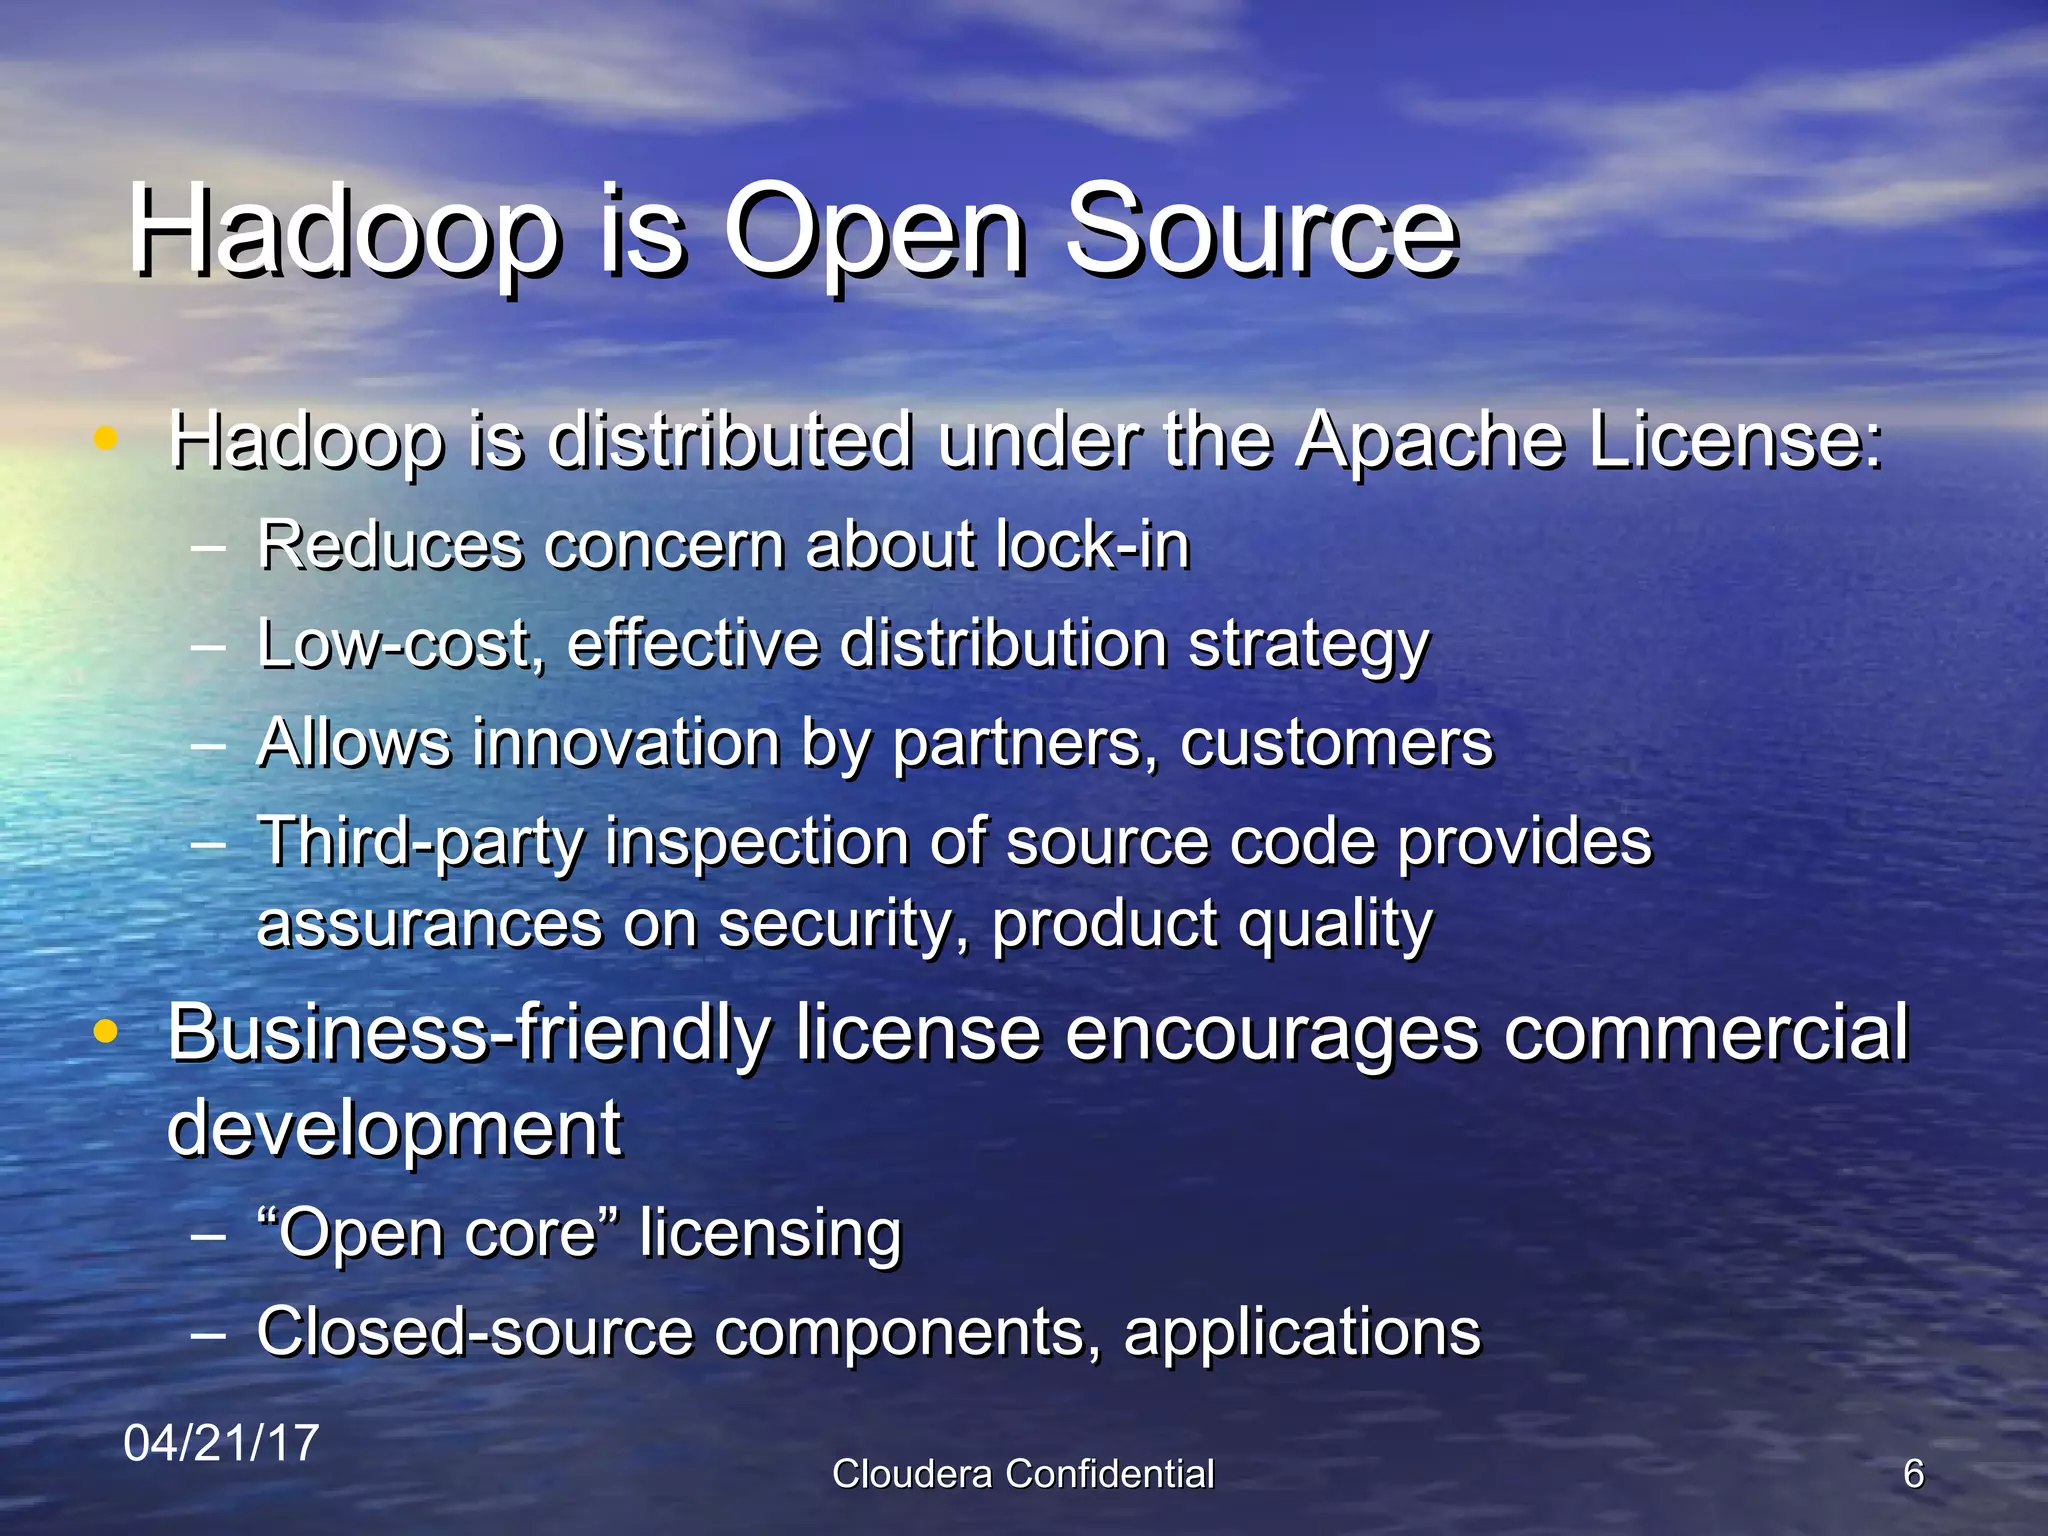
  • Licensing approach implied on Slide 6: Hadoop is Apache-licensed (reduces lock-in), while the deck explicitly mentions business-friendly / “open core” licensing and closed-source components & applications. This signals an enterprise support/subscription and commercial add-on model:
    • Revenue likely from enterprise subscriptions, support, proprietary enterprise features (multi-tenant, management, connectors), and services (integration/certification).
  • No explicit pricing, ARPU, or unit economics shown in the slides.

Traction & Metrics

  • Customer / user evidence: Slide 7 shows a large set of logo customers / users (Google, Yahoo, Facebook, eBay, HP, Intel, AOL, New York Times project, etc.). This provides credibility and early traction (logos rather than detailed metrics).
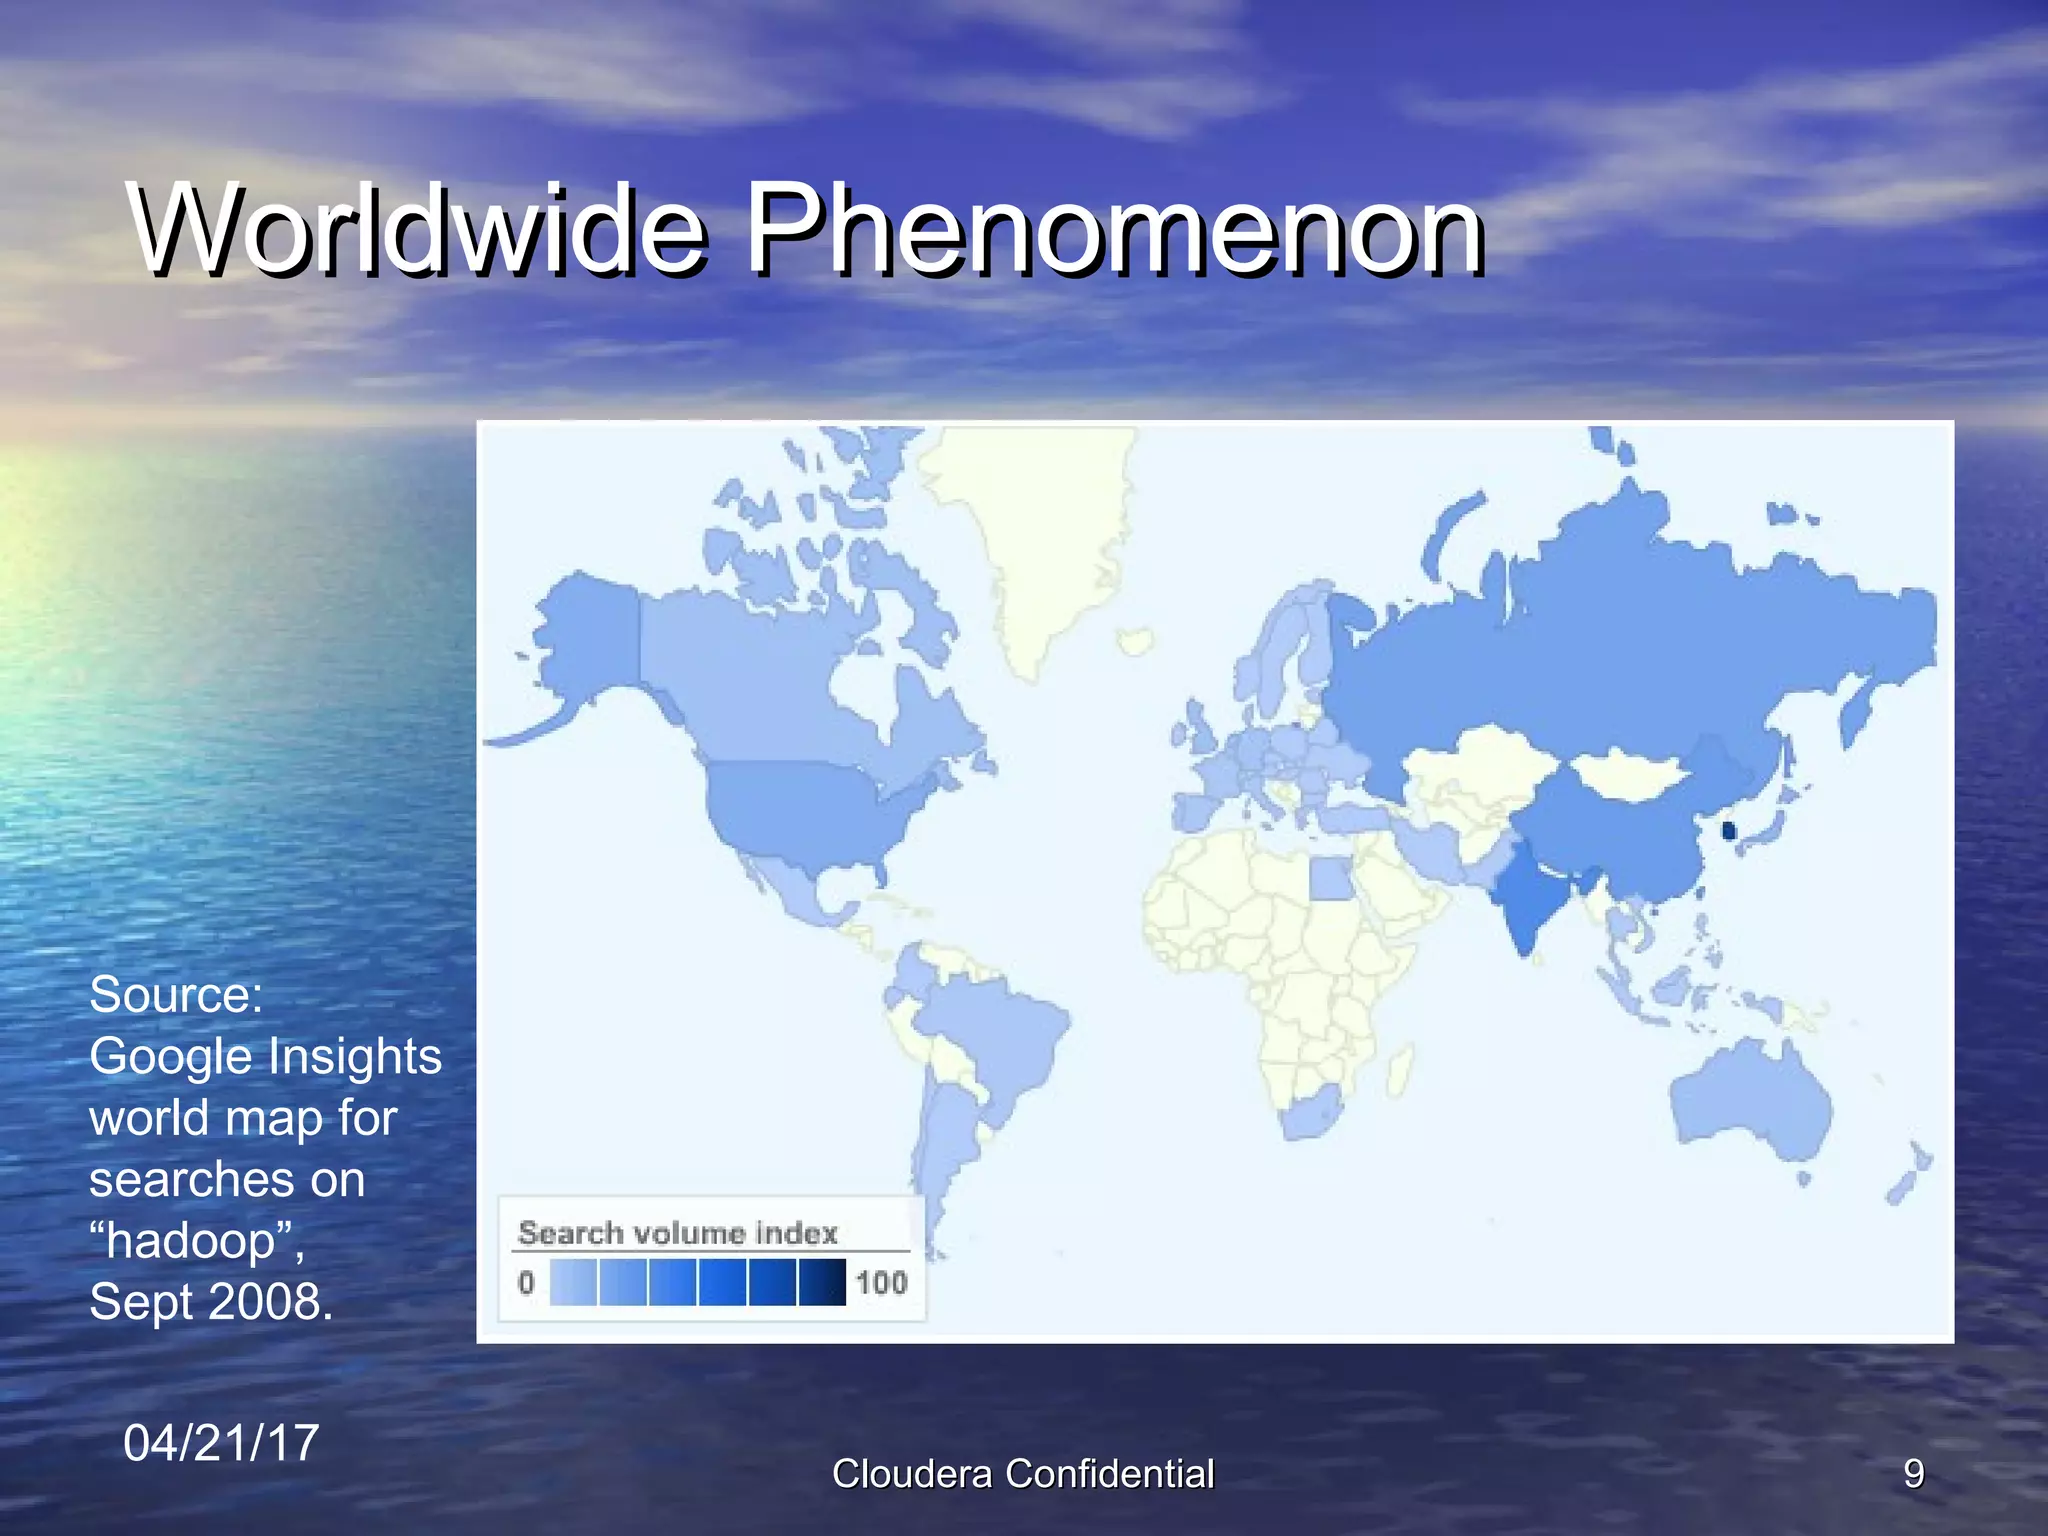
  • Momentum evidence: Slide 8 Google Trends chart showing rising interest in “hadoop” versus incumbents; Slide 9 world map showing global search interest (Sept 2008).
  • Competitive revenue context (Slide 8) provides market scale comparisons (Netezza, Teradata revenue figures).
  • What’s missing: no explicit ARR, MRR, number of clusters deployed, revenue to date, churn, or unit economics.

Competitive Positioning

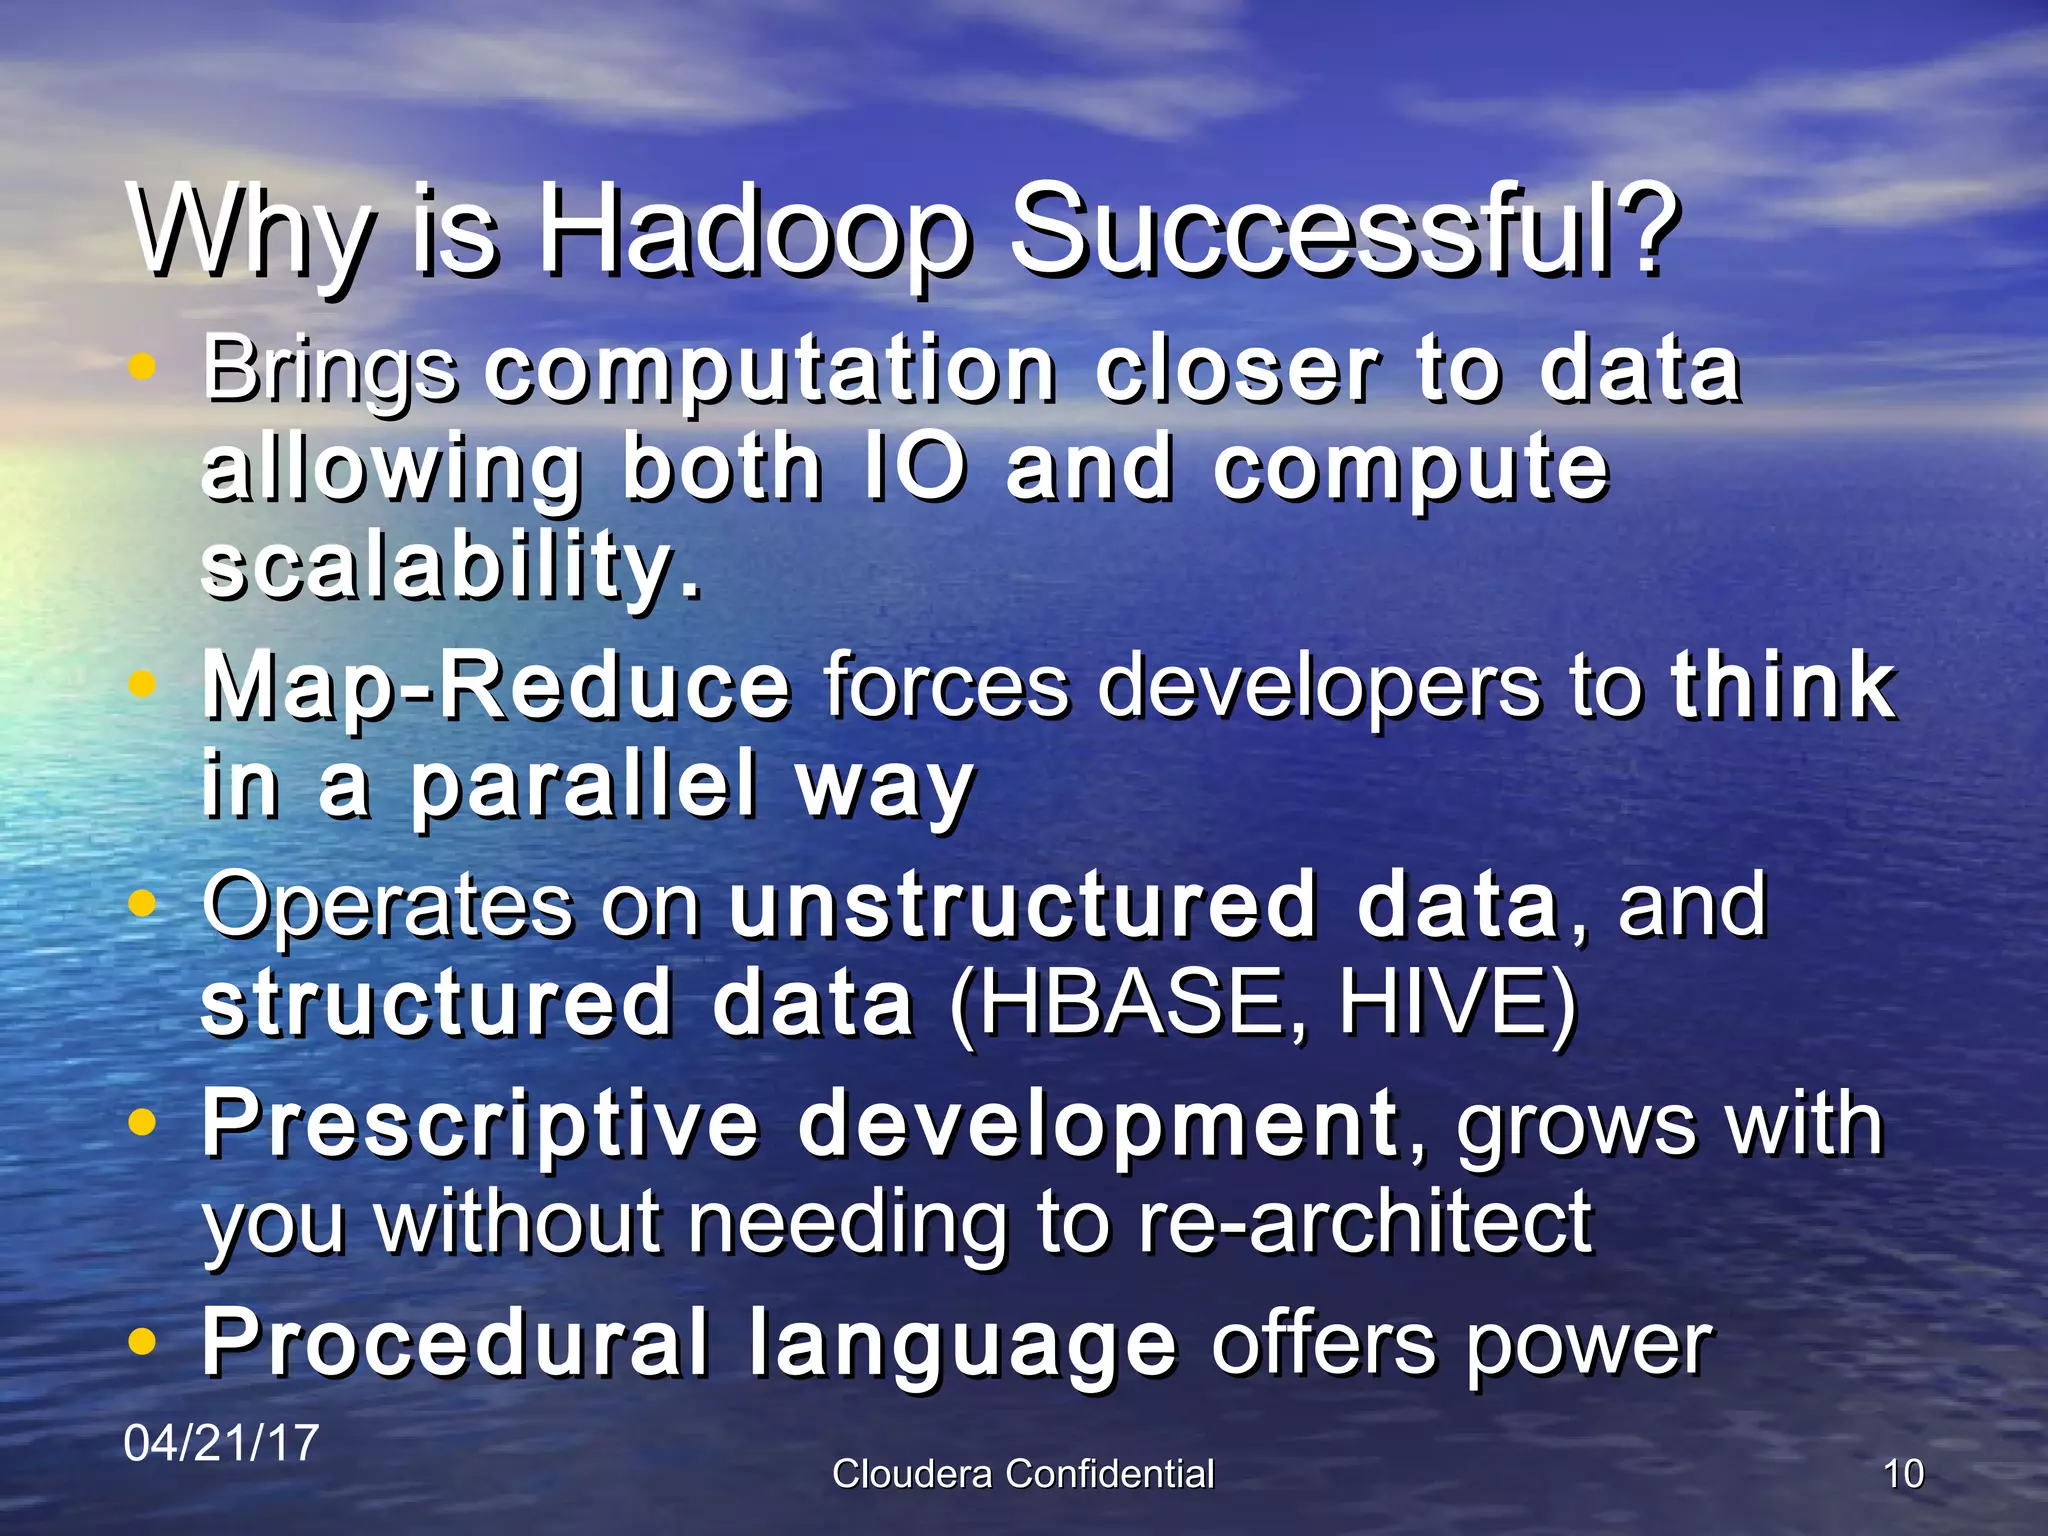
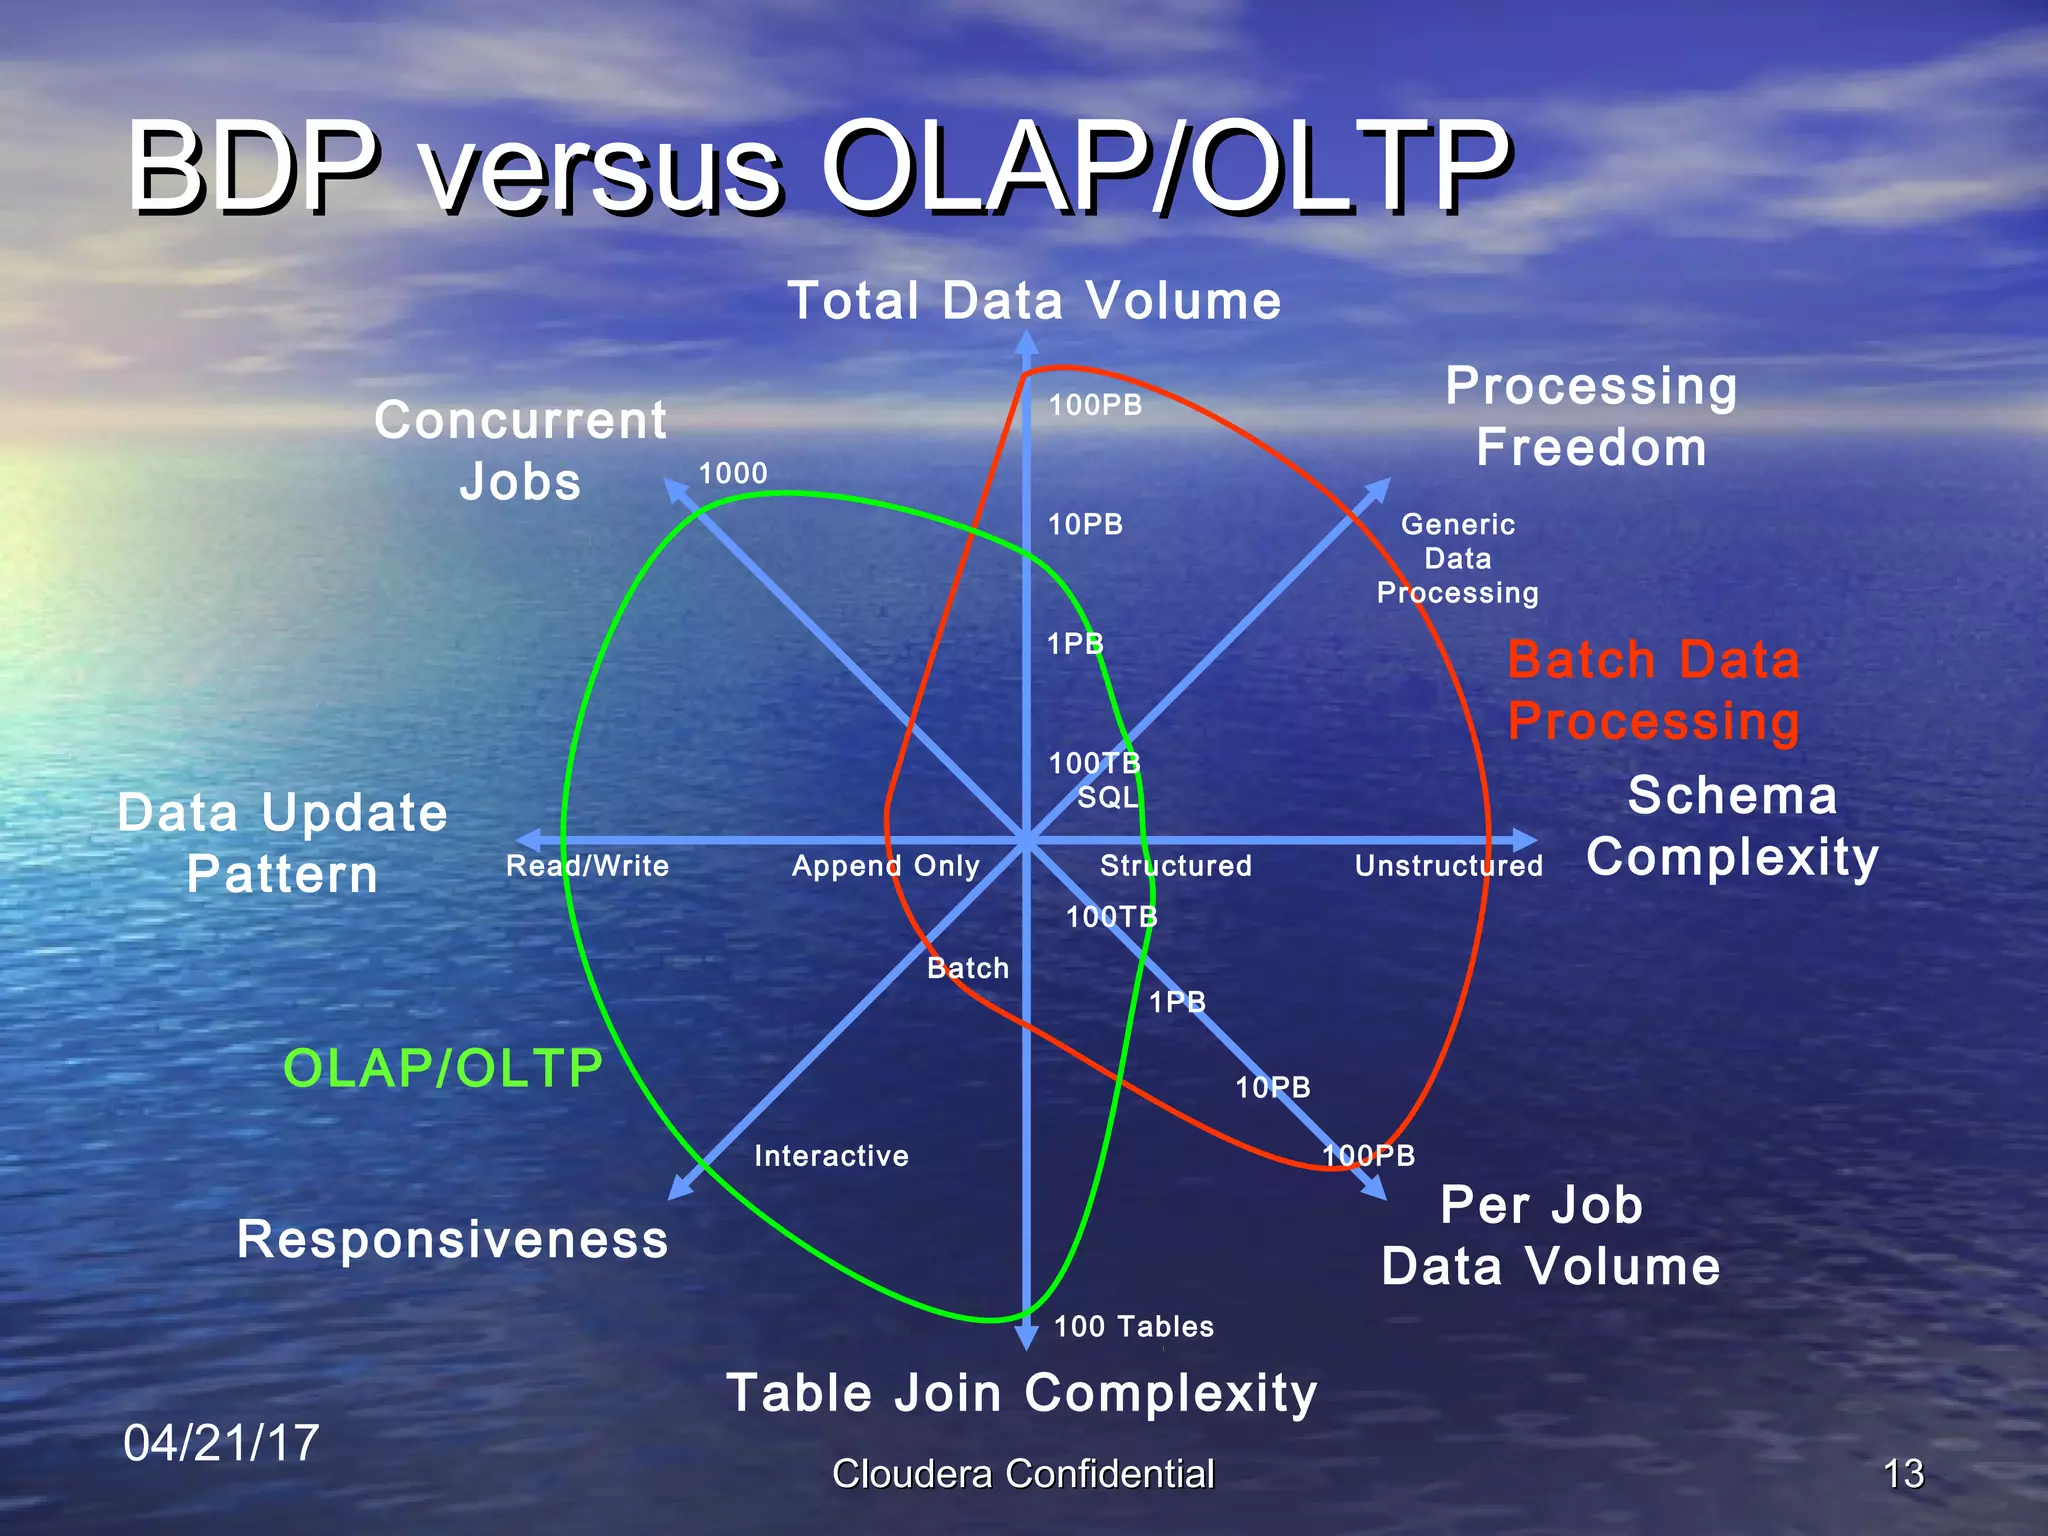
  • Technical vs incumbents: Hadoop (open-source) vs traditional data warehouses (Teradata, Netezza). Position: Hadoop is cheaper, scales to raw/unstructured data, and allows different processing paradigms (MapReduce).
  • Differentiators (Slide 15): multi-tenant/hard enterprise features (concurrency, priority, namespace/performance isolation), monitoring, resilience & fast recovery, IDE tooling, integrations with analytics and connector certification.
  • Licensing strategy: embrace Apache core to drive adoption; monetize via closed-source, enterprise add-ons (“open core”).

Team

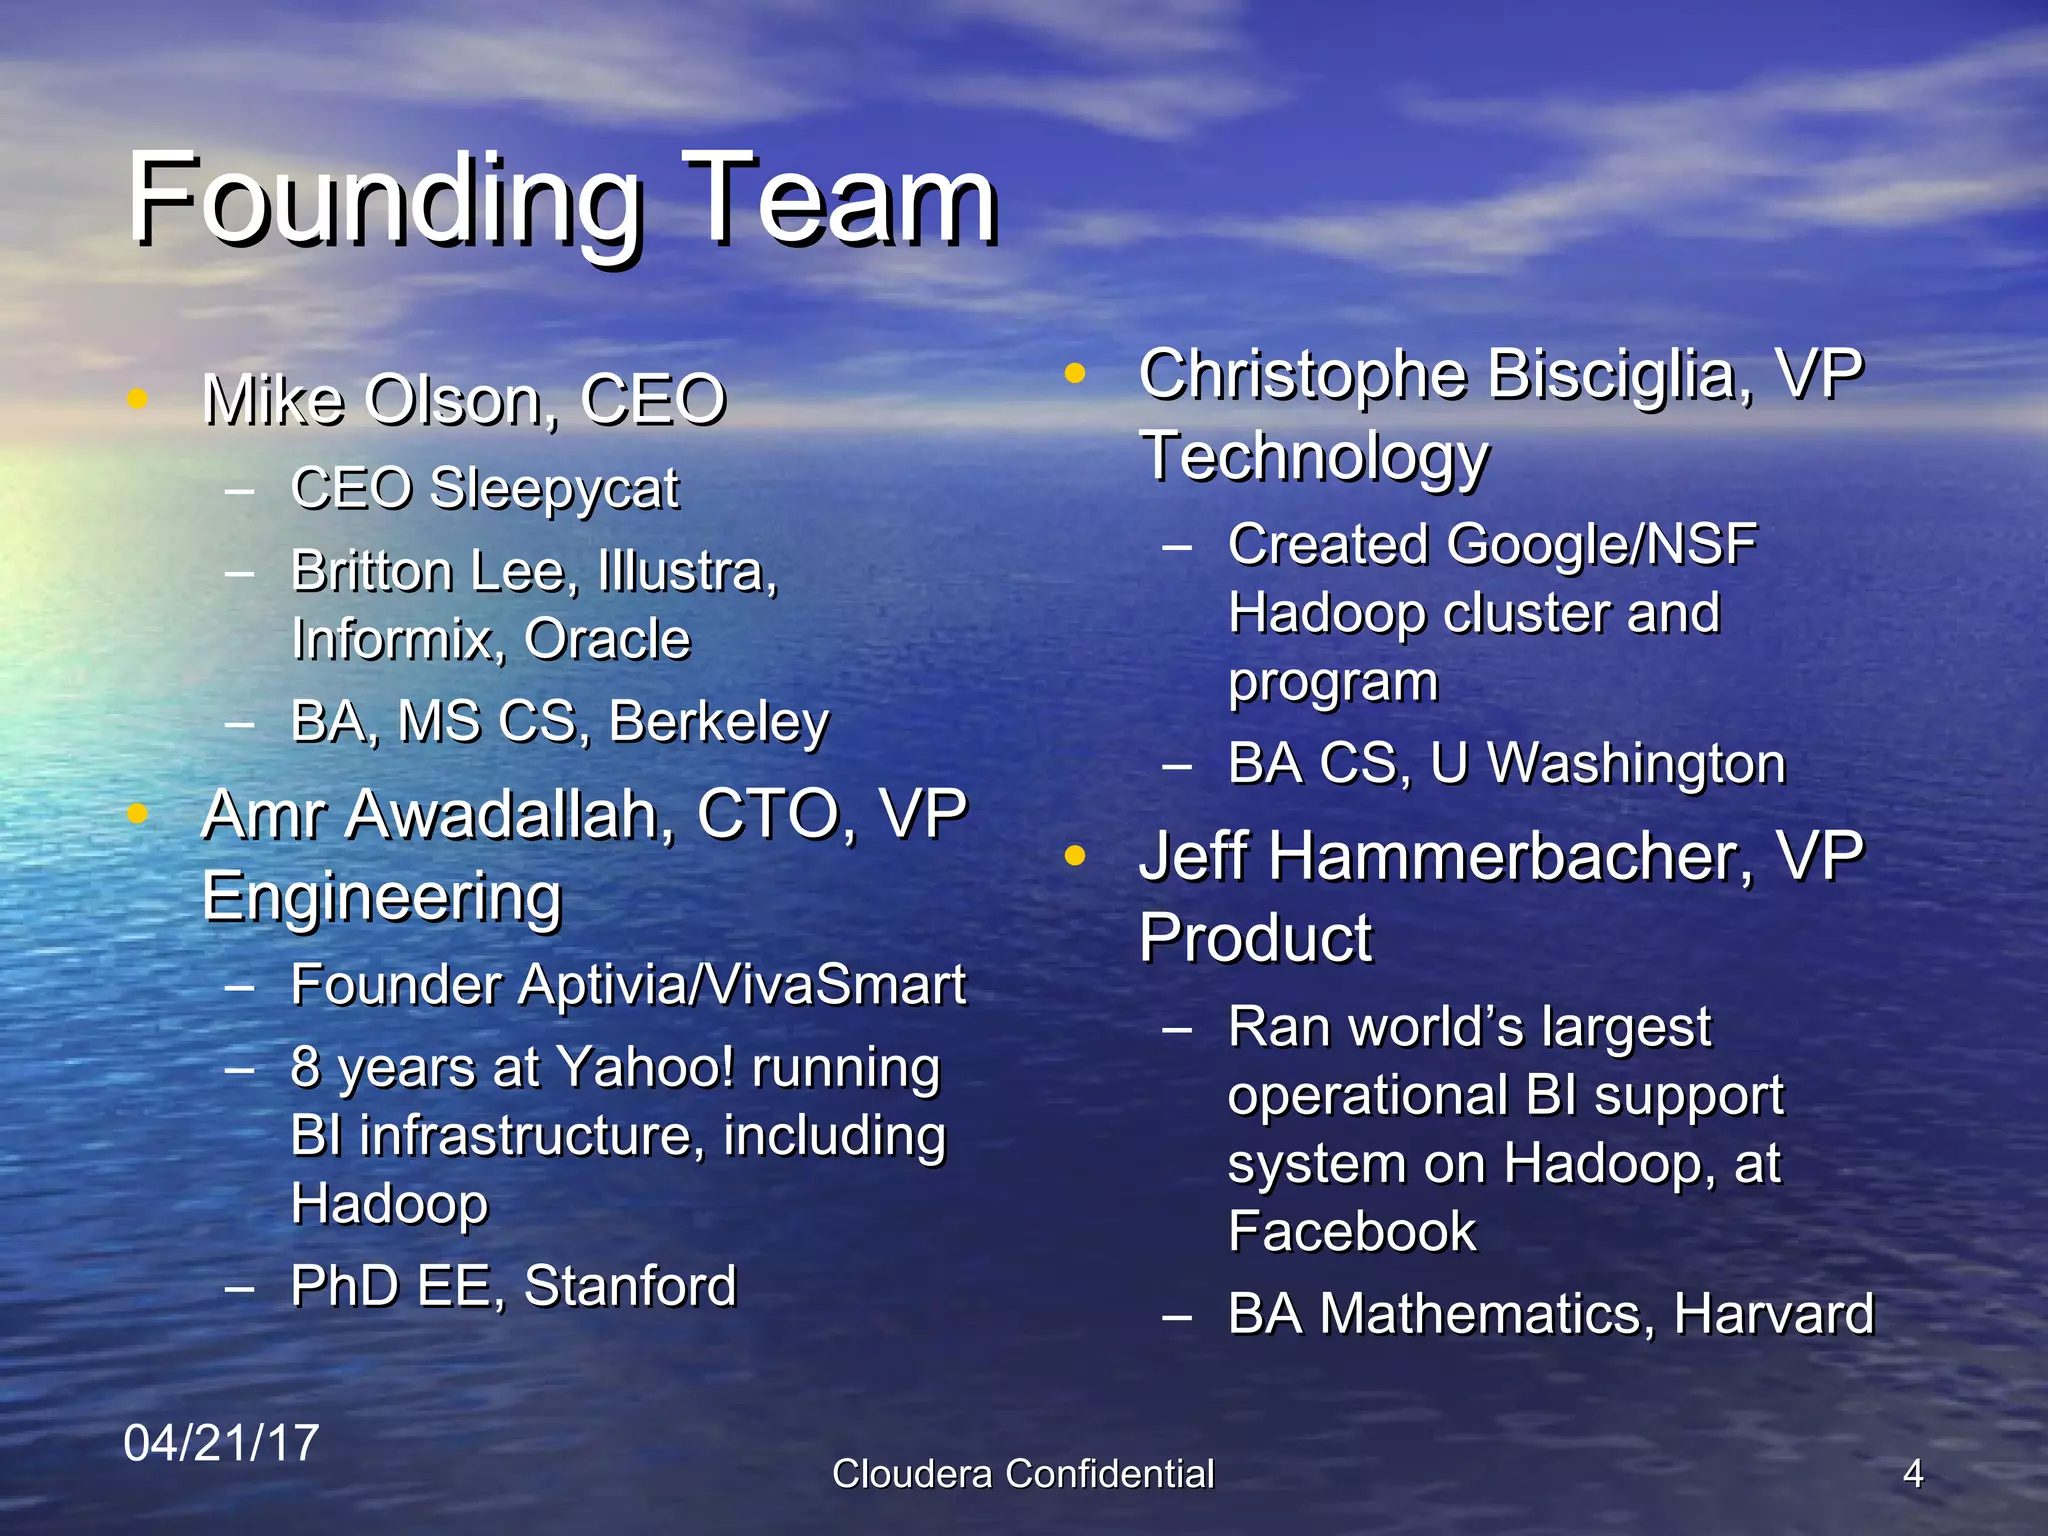
  • Slide 4 (Founding Team):
    • Mike Olson, CEO — prior CEO of Sleepycat; experience at Britton Lee, Illustra, Informix, Oracle; BA/MS CS Berkeley.
    • Amr Awadallah, CTO / VP Engineering — founder Aptivia/VivaSmart; 8 years at Yahoo! running BI infrastructure including Hadoop; PhD EE, Stanford.
    • Christophe Bisciglia, VP Technology — created Google/NSF Hadoop cluster and program; BA CS, Univ. Washington.
    • Jeff Hammerbacher, VP Product — ran operational BI on Hadoop at Facebook; BA Mathematics, Harvard.
  • Team is heavily technical with direct Hadoop/BI experience at major early-adopter companies (Yahoo!, Google, Facebook) and veteran database/enterprise product backgrounds.

Go-to-Market Strategy

  • Implied enterprise sales and partnerships: focus on enterprises needing scalable analytics and data warehousing alternatives; target large web companies and enterprises using data warehouses today.
  • “Open core” adoption play: build adoption via open-source, then convert enterprises to paid support/features.
  • Emphasizes connector certification and integration with existing analytics tools (R, Weka, SAS, SPSS) to ease adoption.

The Ask

  • Raise: Series A, $5M (this is the stated round).
  • Use of funds: not explicitly detailed; implied allocation toward building enterprise product features (multi-tenant architecture, monitoring, fast recovery, IDE), hiring engineering/sales, and go-to-market execution.

Investor Deep Dive

Executive summary, strengths & red flags

Executive Summary

This is Cloudera’s 2008 Series A deck positioning the company as the enterprise-grade vendor for Hadoop (MapReduce + distributed file system). The deck frames a fast-growing data problem, argues open-source Hadoop as the technical foundation, highlights enterprise feature gaps (multi-tenancy, monitoring, fast recovery) and shows early logos/interest and a very large market opportunity ($100B+ / $160B figure cited). It’s notable for identifying a huge structural trend early and pairing it with an experienced founding team.

Key Strengths

3 identified

1

Early and correct bet on a major structural trend — raw-event scale data and distributed compute (Slides 2, 10): the deck convincingly frames the scale problem and the limitations of incumbent approaches.

2

Strong, credible founding team with direct prior Hadoop/BI experience at Google/Yahoo/Facebook (Slide 4) — lowers execution risk for product and engineering.

3

Clear product differentiation for enterprise buyers — identifies specific enterprise gaps (multi-tenancy, monitoring, resilience, connectors) and a monetizable “open core” business model (Slides 6, 15).

Red Flags & Weaknesses

3 identified

1

Lack of concrete traction metrics / financials — no ARR, paying customer count, cluster counts, or revenue to date (Slide 7 shows logos but no metrics). Investors typically want quantifiable early traction.

2

No detailed go-to-market / sales motion or unit economics — slide-level implications but missing conversion rates, sales cycle, CAC, pricing model, or channel plan.

3

Dated / visually cluttered presentation — heavy text and ocean-background slides (design) make key facts harder to scan quickly, and there is limited product UX or demo material (no technical architecture depth, benchmarks, or case-study results).

More Pitch Decks To Study

Compare structure, fundraising context, and investor-facing story across similar startup decks.