Compare your deck to SendGrid

Compare Your Deck

SendGrid Pitch Deck (2015)

SaaS
Stage: Seed
Raised: $3M
Year: 2015
Slides: 26
Outcome: Acquired by QA (2019)

Pitch Deck

1 / 26
SendGrid pitch deck - The Opening: Clear branding and team introduction
Click to expand

Deck Analysis

This deck presents a seed-stage pitch for a cloud transactional email service (branded throughout the slides as SendGrid). It walks an investor through the problem (fragile deliverability and scaling of transactional email), demonstrates product-led solutions (filters, monitoring, before/after enhancements), and provides market sizing, pricing tiers and early traction. The deck is notable for its clear problem → solution arc, concrete visual before/after examples, and inclusion of measurable benefits (deliverability uplift, daily email volumes) that buyers and investors care about.

The Opening: Clear branding and team introduction

The Opening: Clear branding and team introduction

Slide 1 functions as a clean, uncluttered cover. It immediately places the SendGrid logo front-and-center and lists key founders, which establishes both the product identity and the team accountability. The visual style is simple and professional, which is appropriate for enterprise-facing infrastructure services where clarity and trust matter more than flashiness.

What founders can learn: a cover slide should do three things quickly — show the product, the promise (implicit here: "We make email delivery easy"), and the responsible humans behind it. This builds immediate credibility and orients the audience for the technical, metric-driven story that follows.

Key Takeaway: Use the cover to establish product identity, one-line value proposition, and team credibility — no extraneous copy.
Problem framing: Who is affected and where the product fits

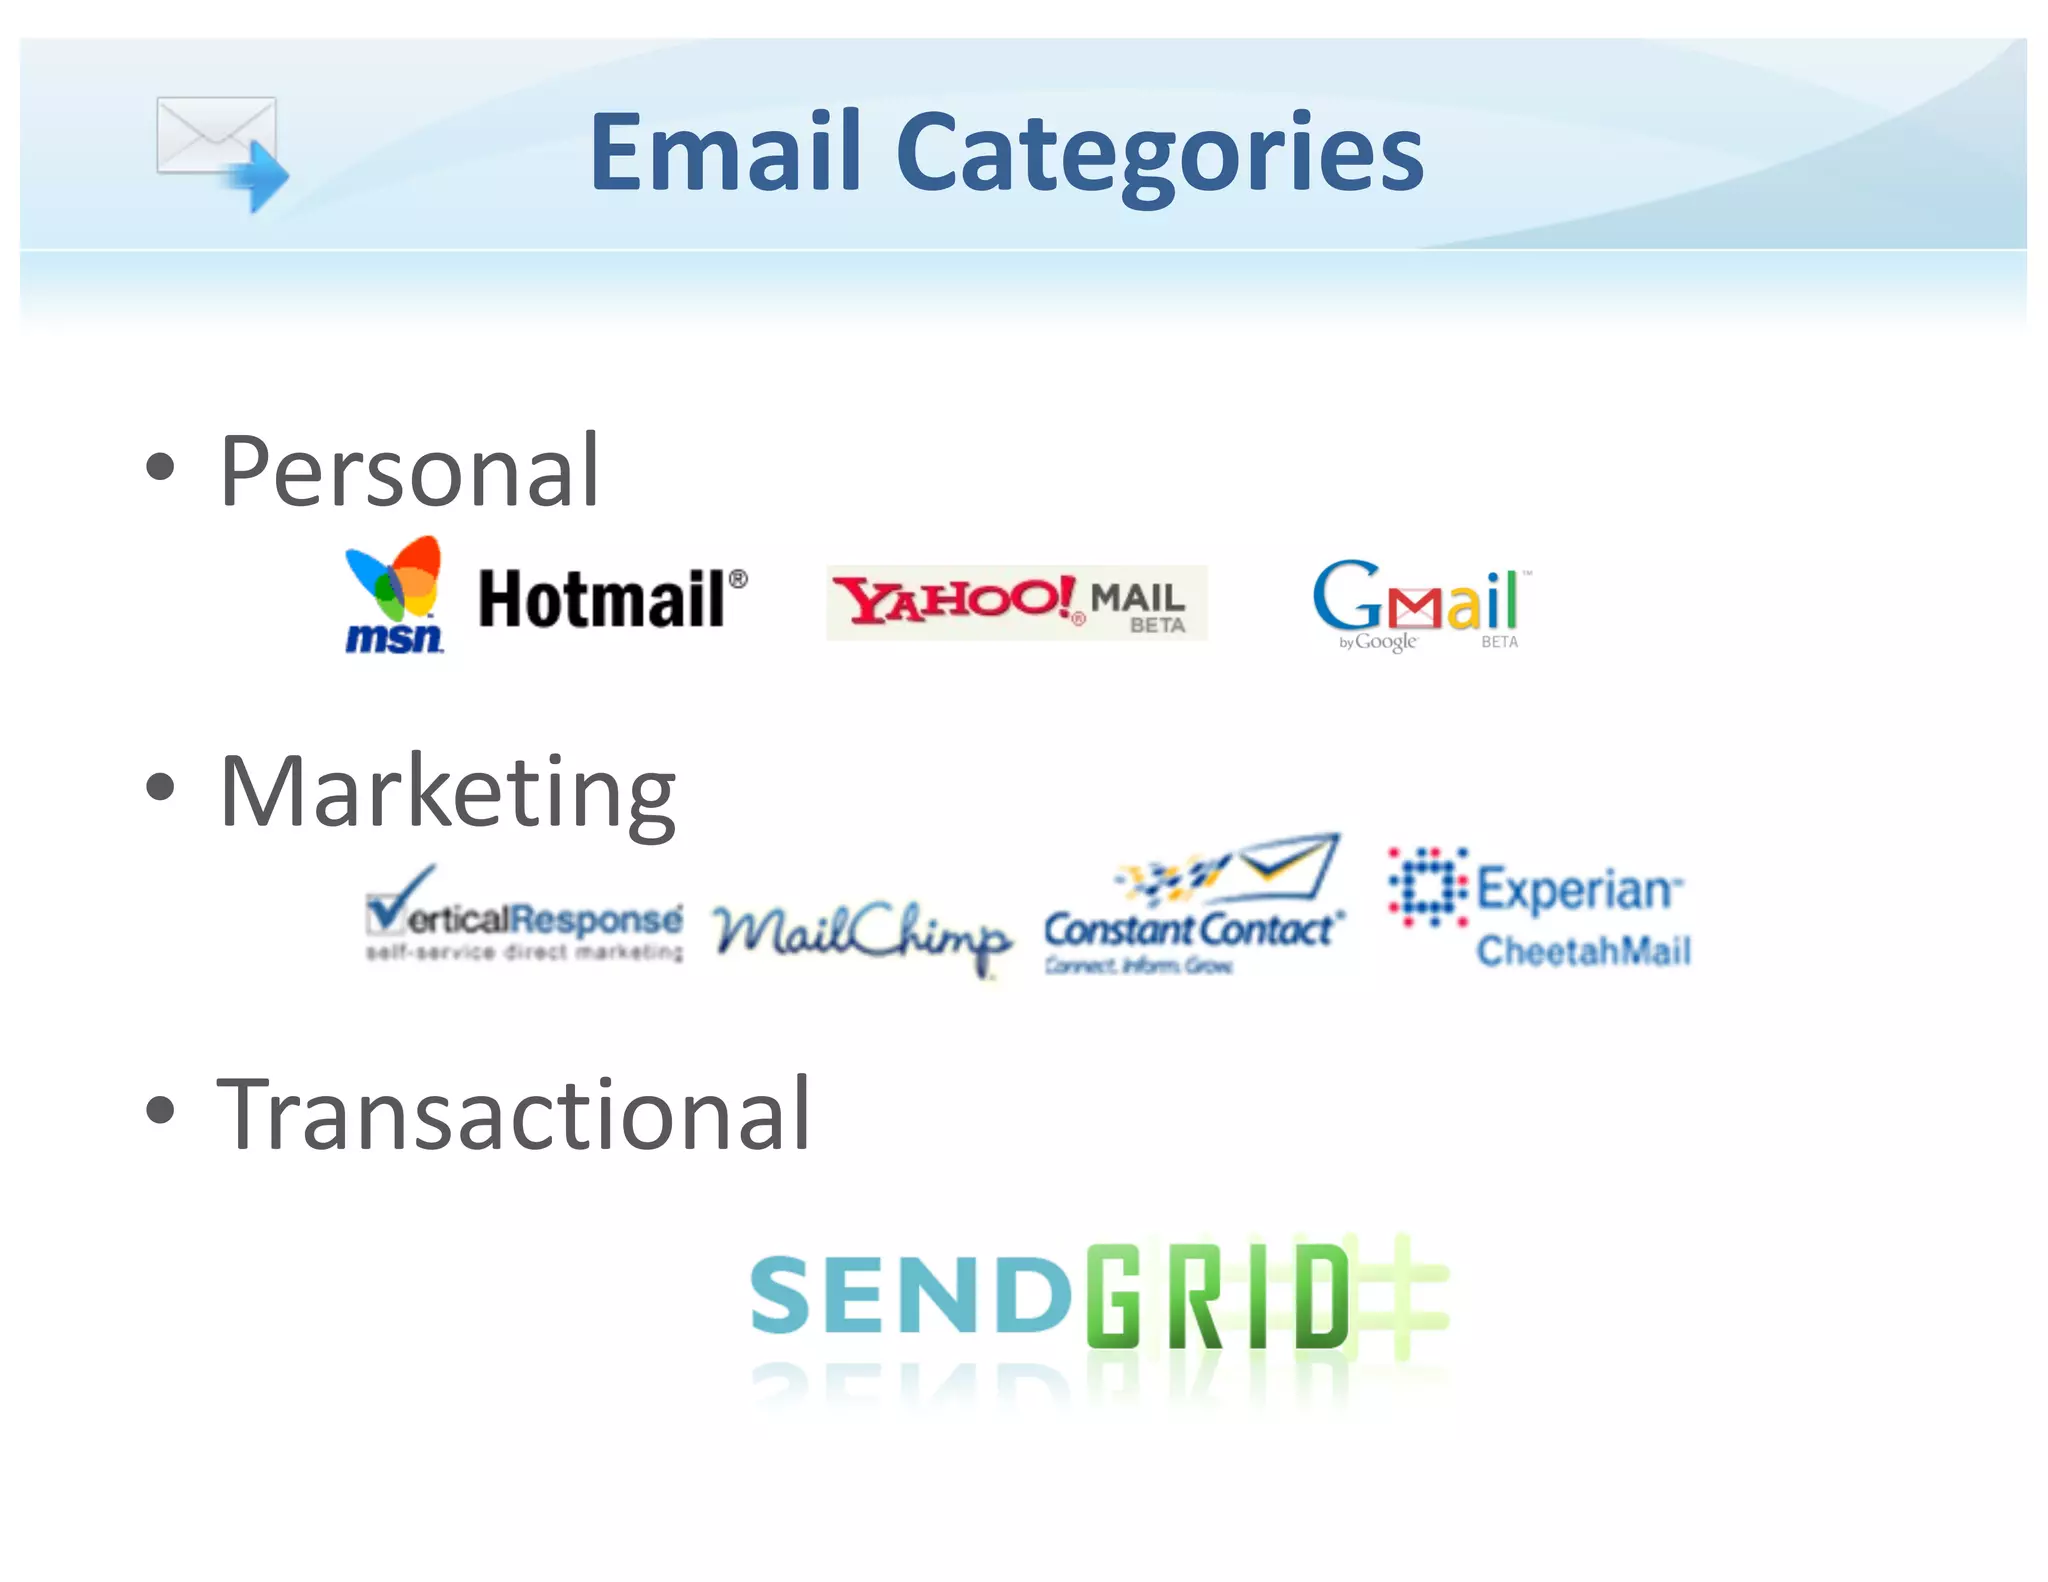
Problem framing: Who is affected and where the product fits

Slide 2 categorizes email markets into personal, marketing, and transactional, visually separating SendGrid into the transactional niche. This is effective because it narrows the market focus and avoids the trap of overpromising. The use of familiar logos (Gmail, Yahoo, MailChimp, etc.) communicates market context quickly and helps investors understand competitive boundaries.

Founders should note how defining the domain early prevents confusion later in the deck. By positioning as the specialist for transactional emails (password resets, receipts, notifications), the deck sets expectations about unit economics, SLAs, and integration needs that differ from bulk marketing platforms.

Key Takeaway: Explicitly define your target sub-market early to focus product positioning and addressable-market assumptions.
Pain points: Quantifying operational challenges

Pain points: Quantifying operational challenges

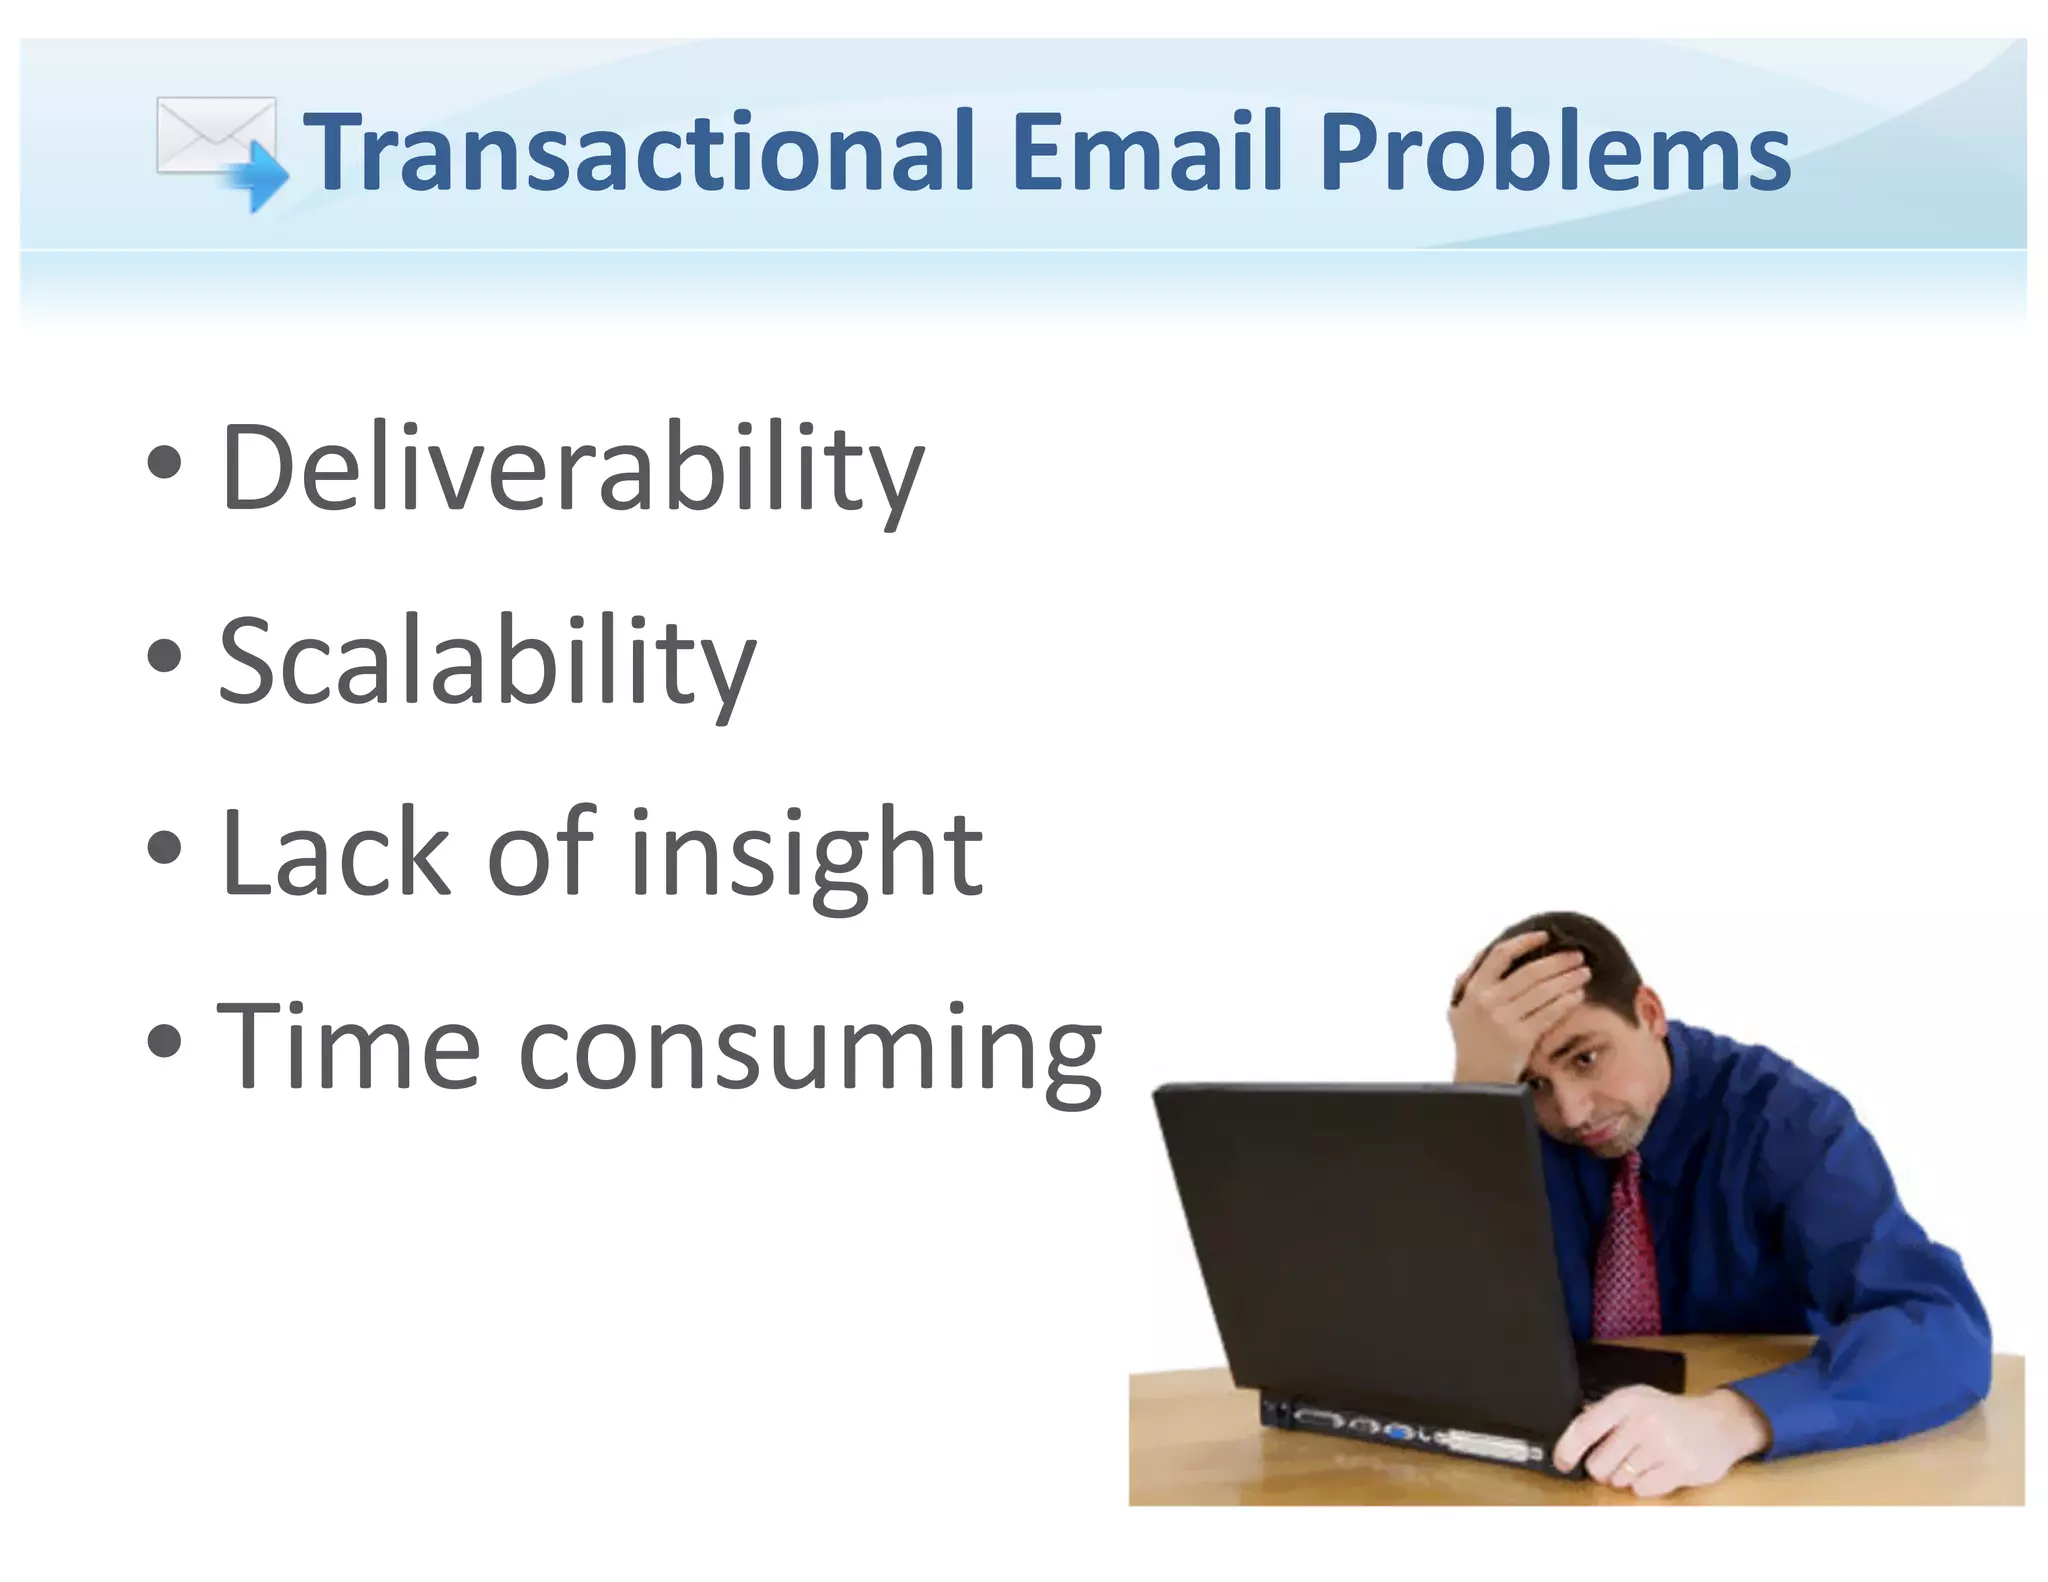
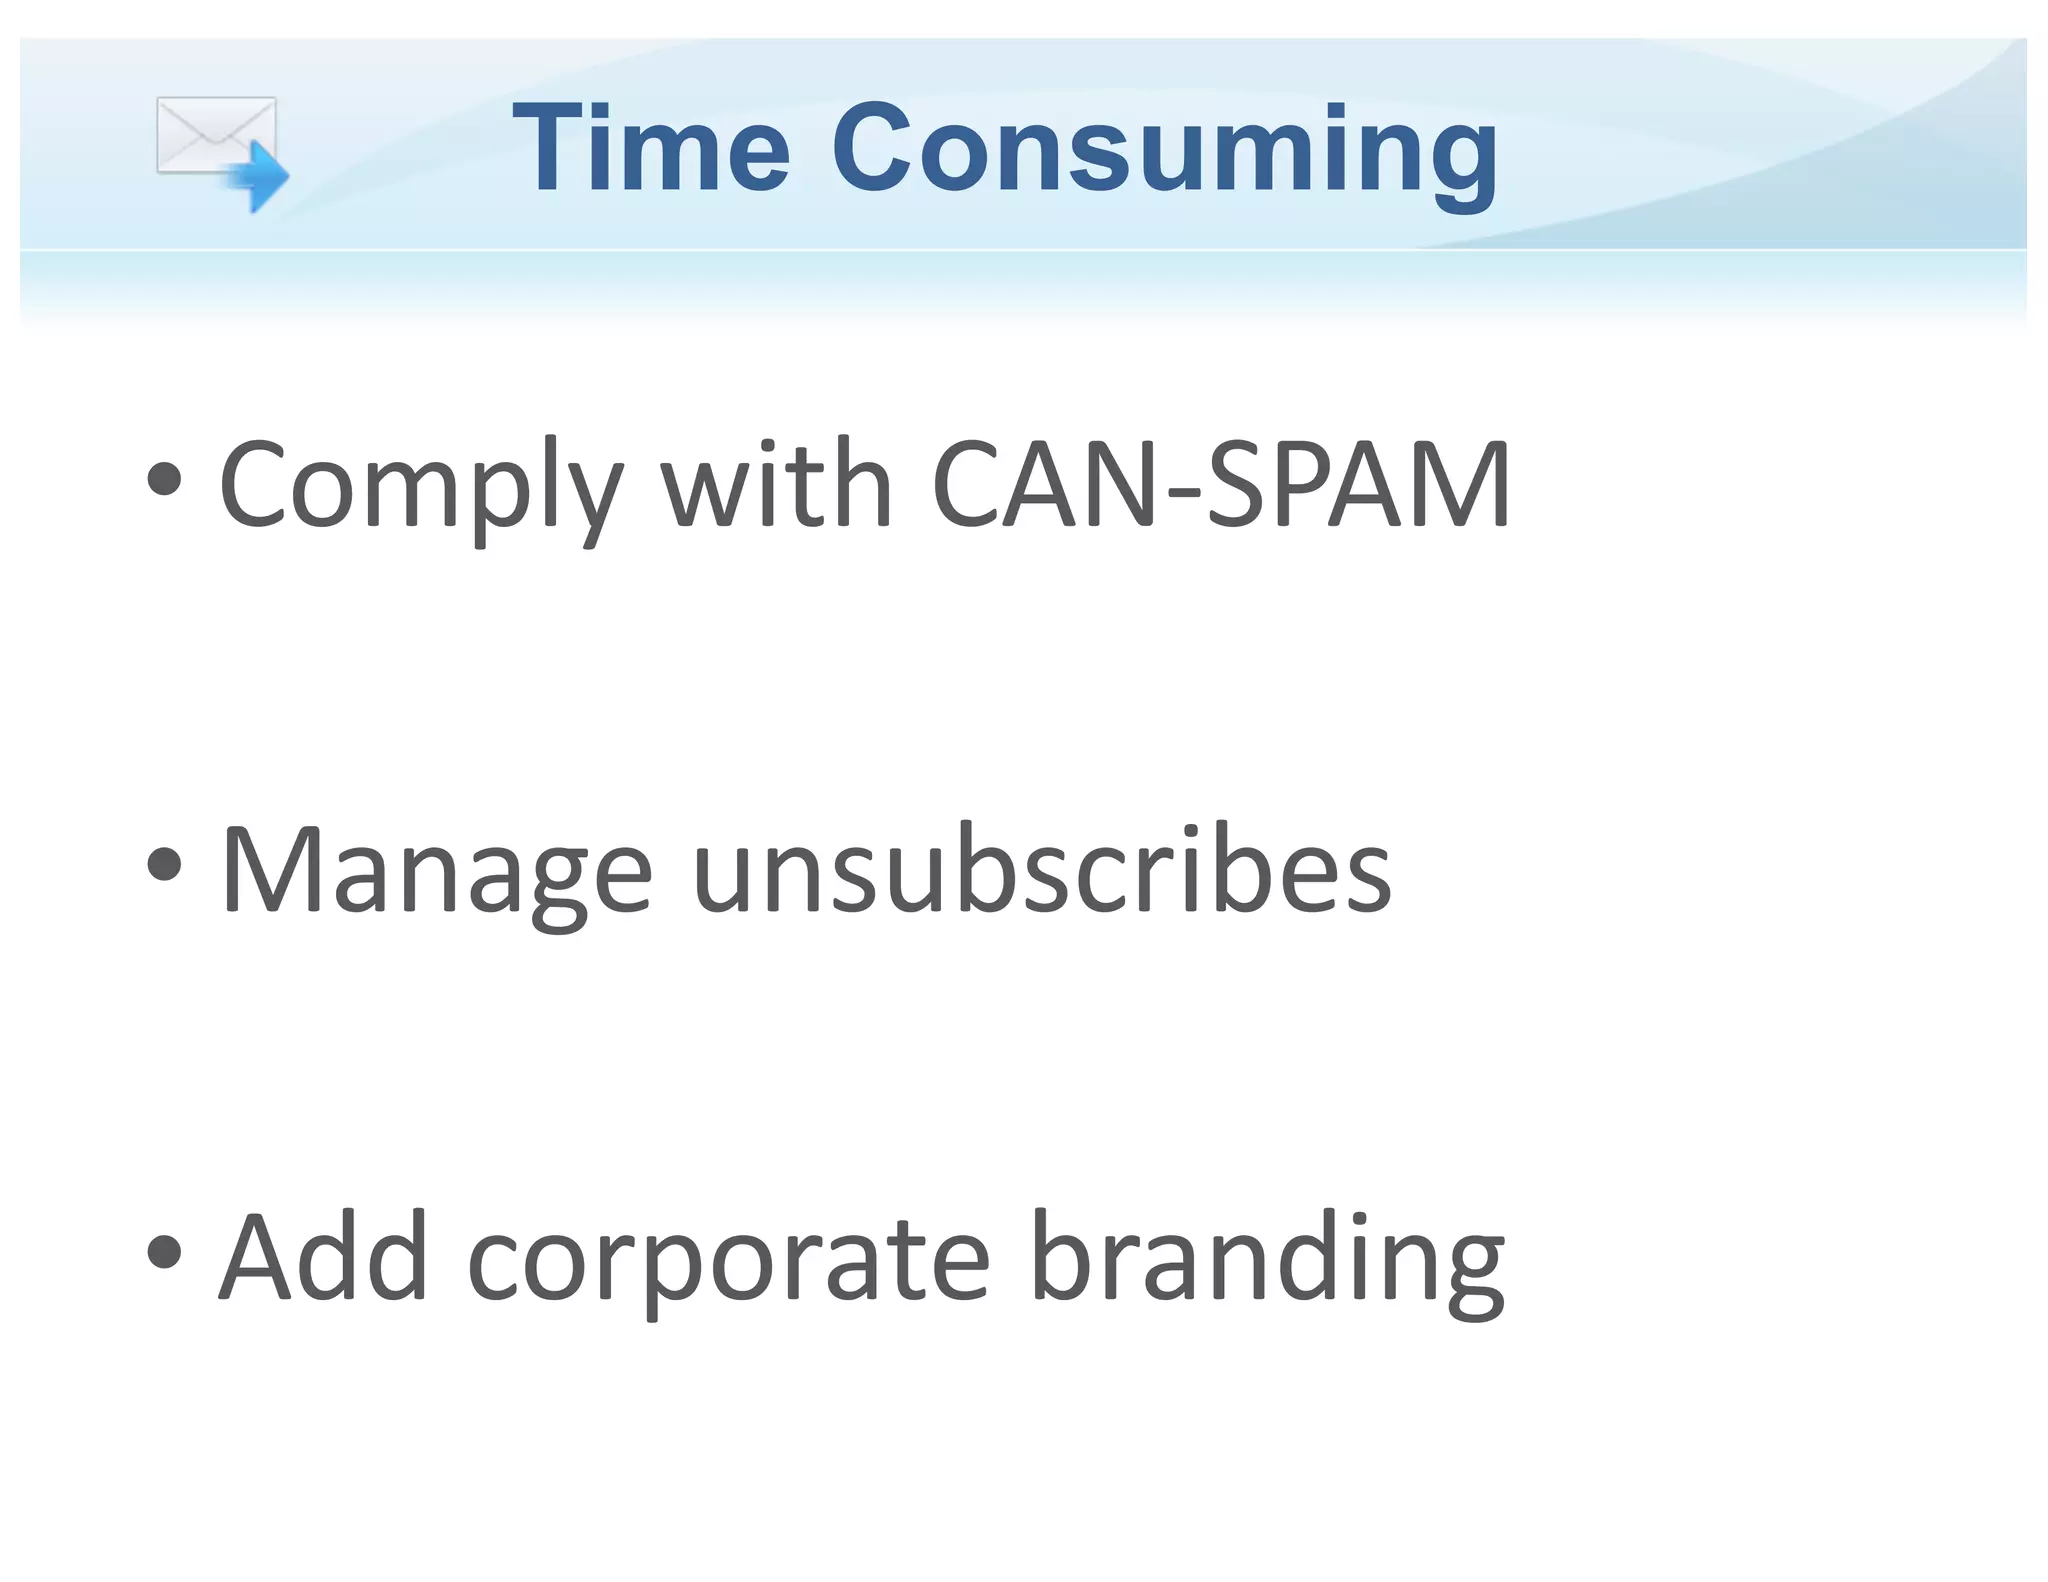
Slide 7 lists transactional email problems — deliverability, scalability, lack of insight, and time consuming operations — in a straightforward way with a relatable visual (frustrated operator). This slide is effective because it names both technical and operational pain points for engineering and business stakeholders. That duality helps justify both the product's technical features and the business value (reduced churn, recovered revenue).

For founders the lesson is to connect product features to the real, often expensive pain they relieve. Naming the costs (time, missed revenue) prepares the ground for later slides that quantify impact and ROI — crucial for investor and buyer persuasion.

Key Takeaway: Spell out both technical and business pains in plain language so later feature slides can directly map to tangible ROI.
Illustrating impact: Deliverability as a revenue problem

Illustrating impact: Deliverability as a revenue problem

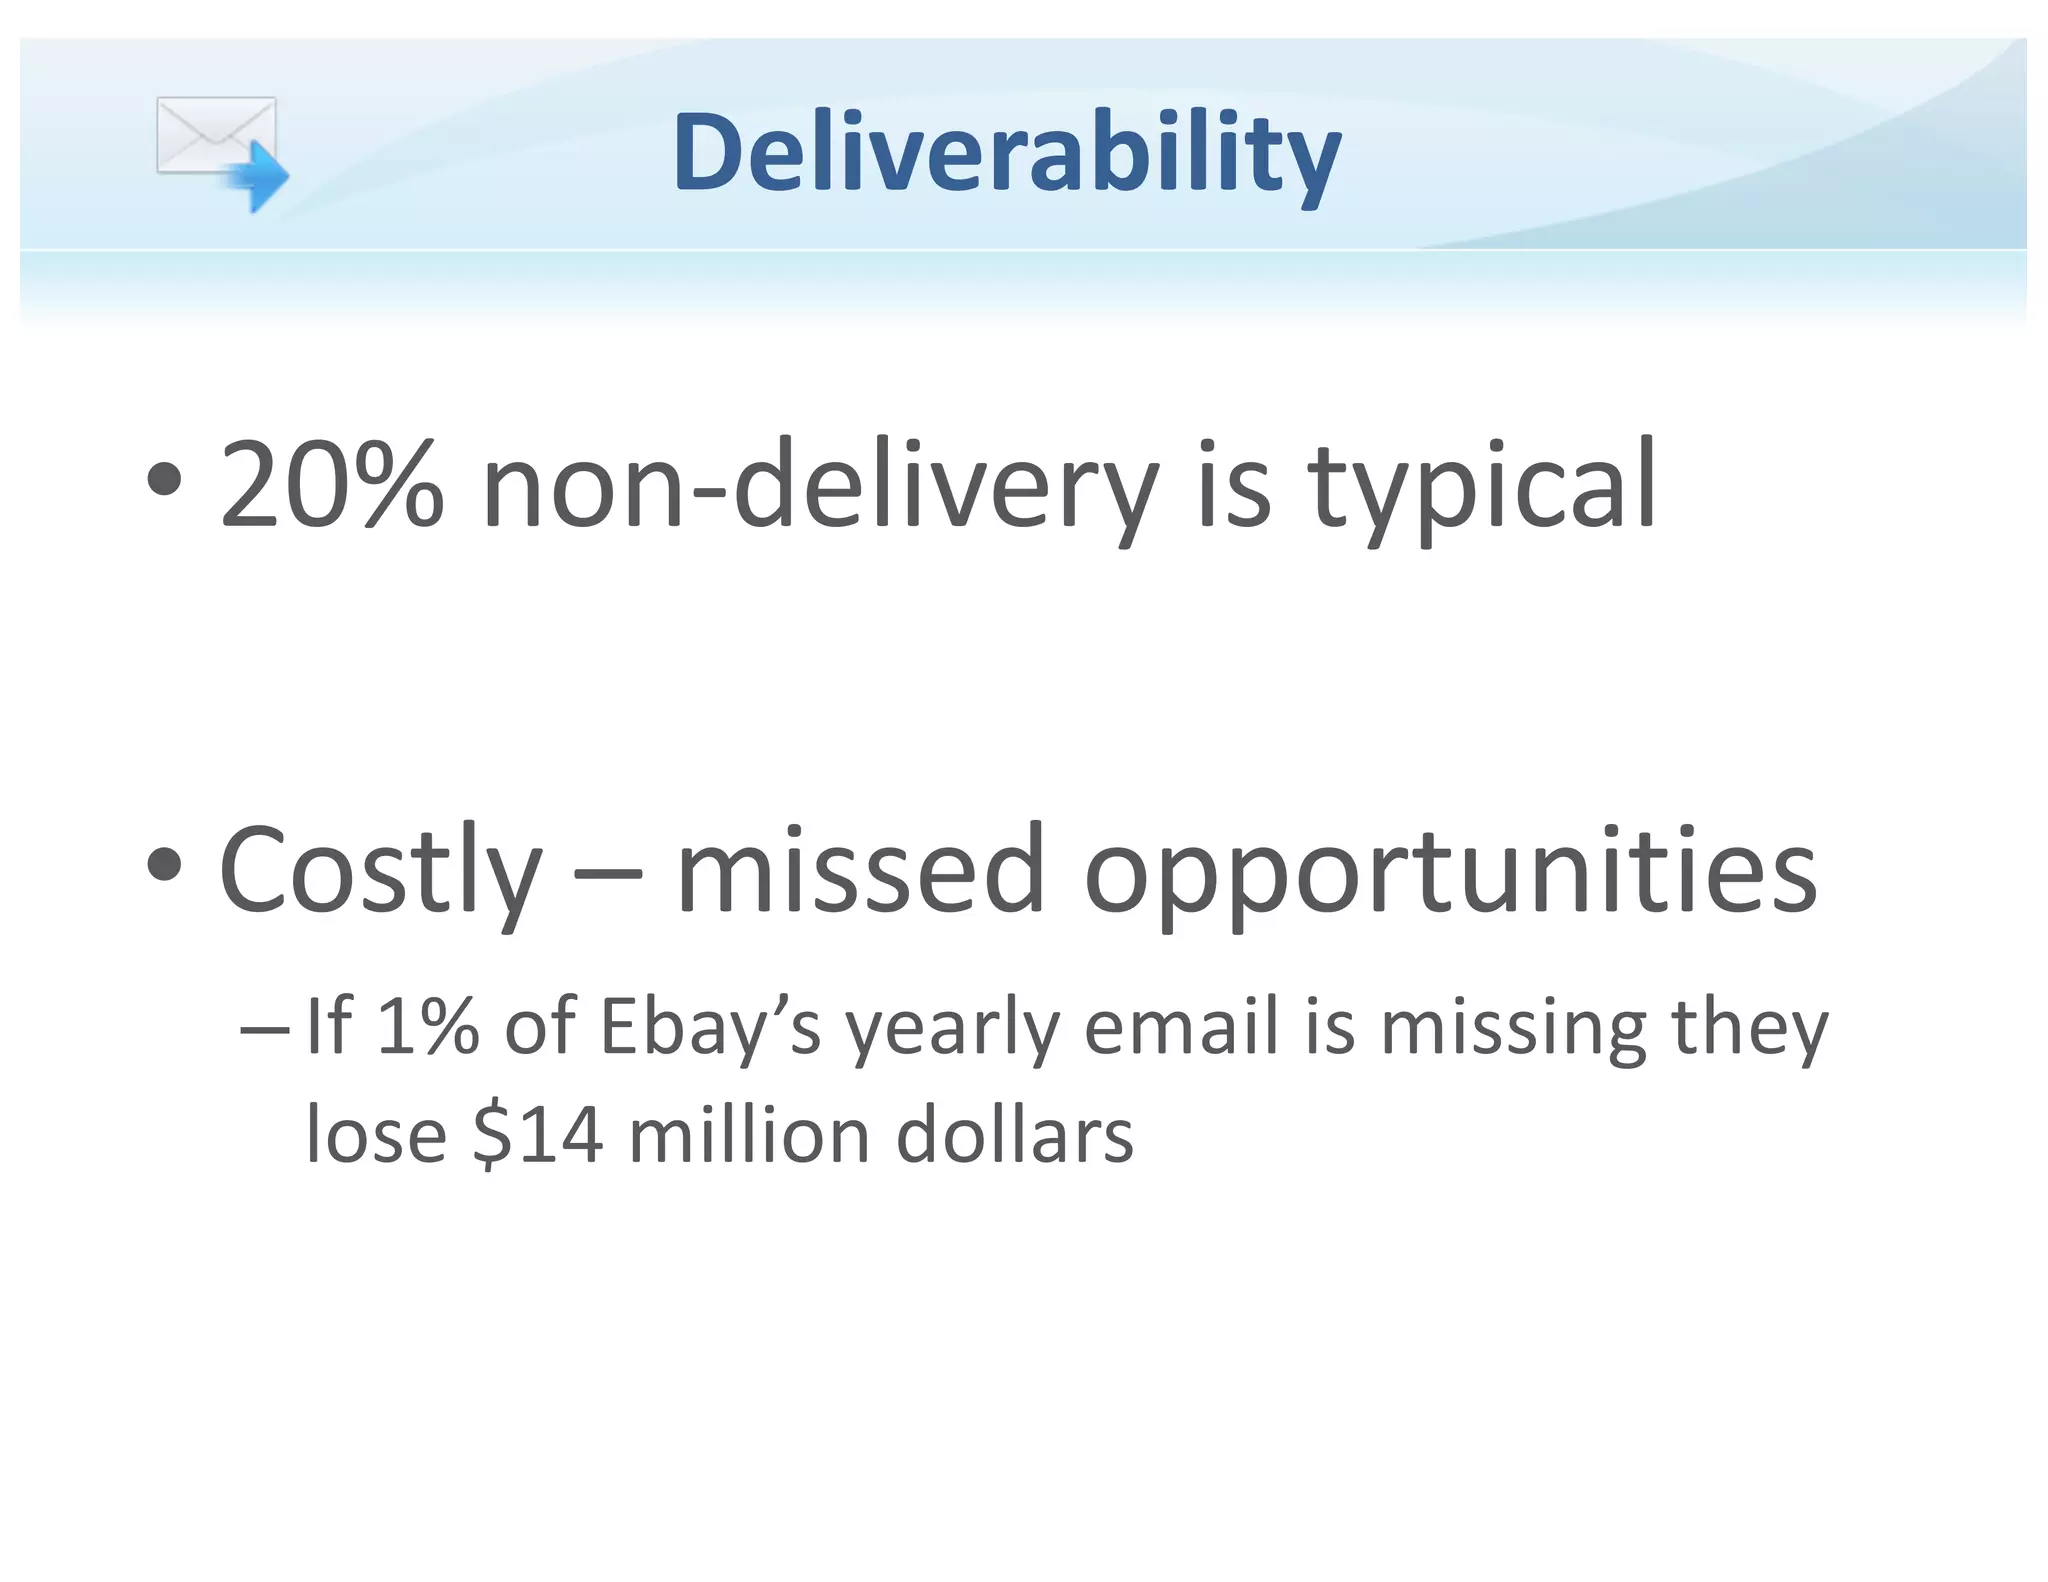
Slide 10 quantifies deliverability issues ("20% non-delivery is typical") and attaches a dollar-cost example (eBay losing $14M if 1% of yearly email is missing). This is an effective investor play — turning a technical metric into a business outcome. Investors respond to clear dollarized harm because it makes the market urgency and value proposition tangible.

Founders should emulate this approach: measure the key reliability and engagement metrics for your product, and translate them into conservative revenue or cost impacts for representative customers. That makes it possible to claim a defensible ROI from improvements your product enables.

Key Takeaway: Convert technical failure modes into conservative dollar impacts for customers to make the value proposition visceral for investors.
Solution summary: How the product addresses deliverability

Solution summary: How the product addresses deliverability

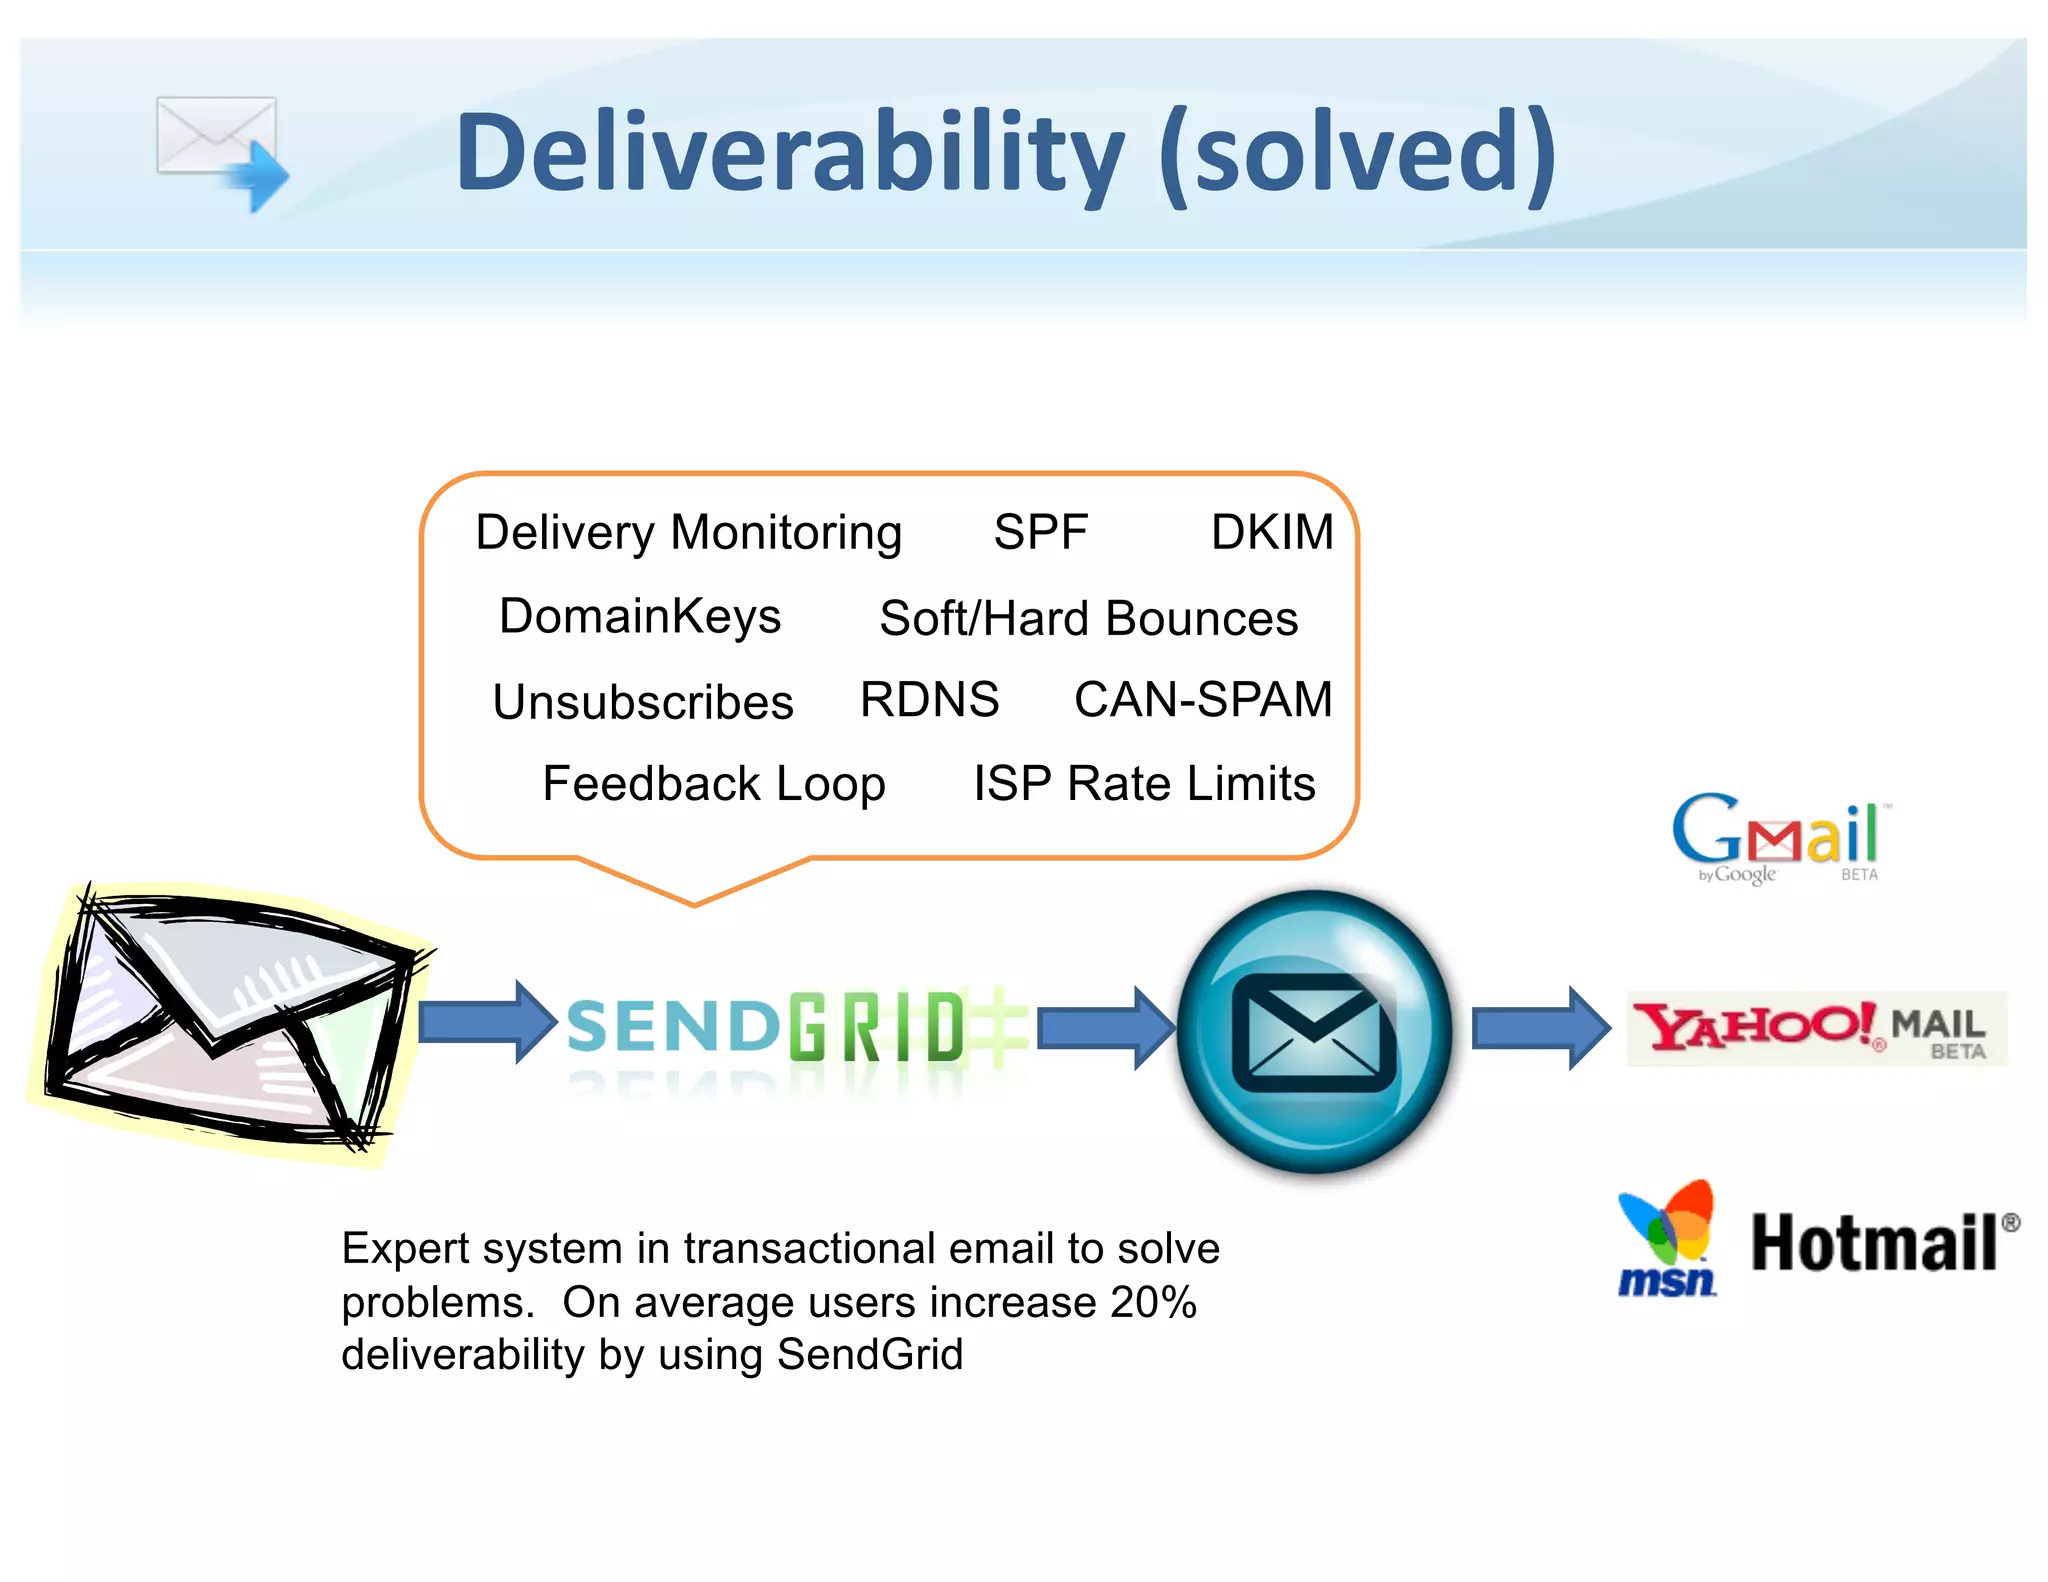
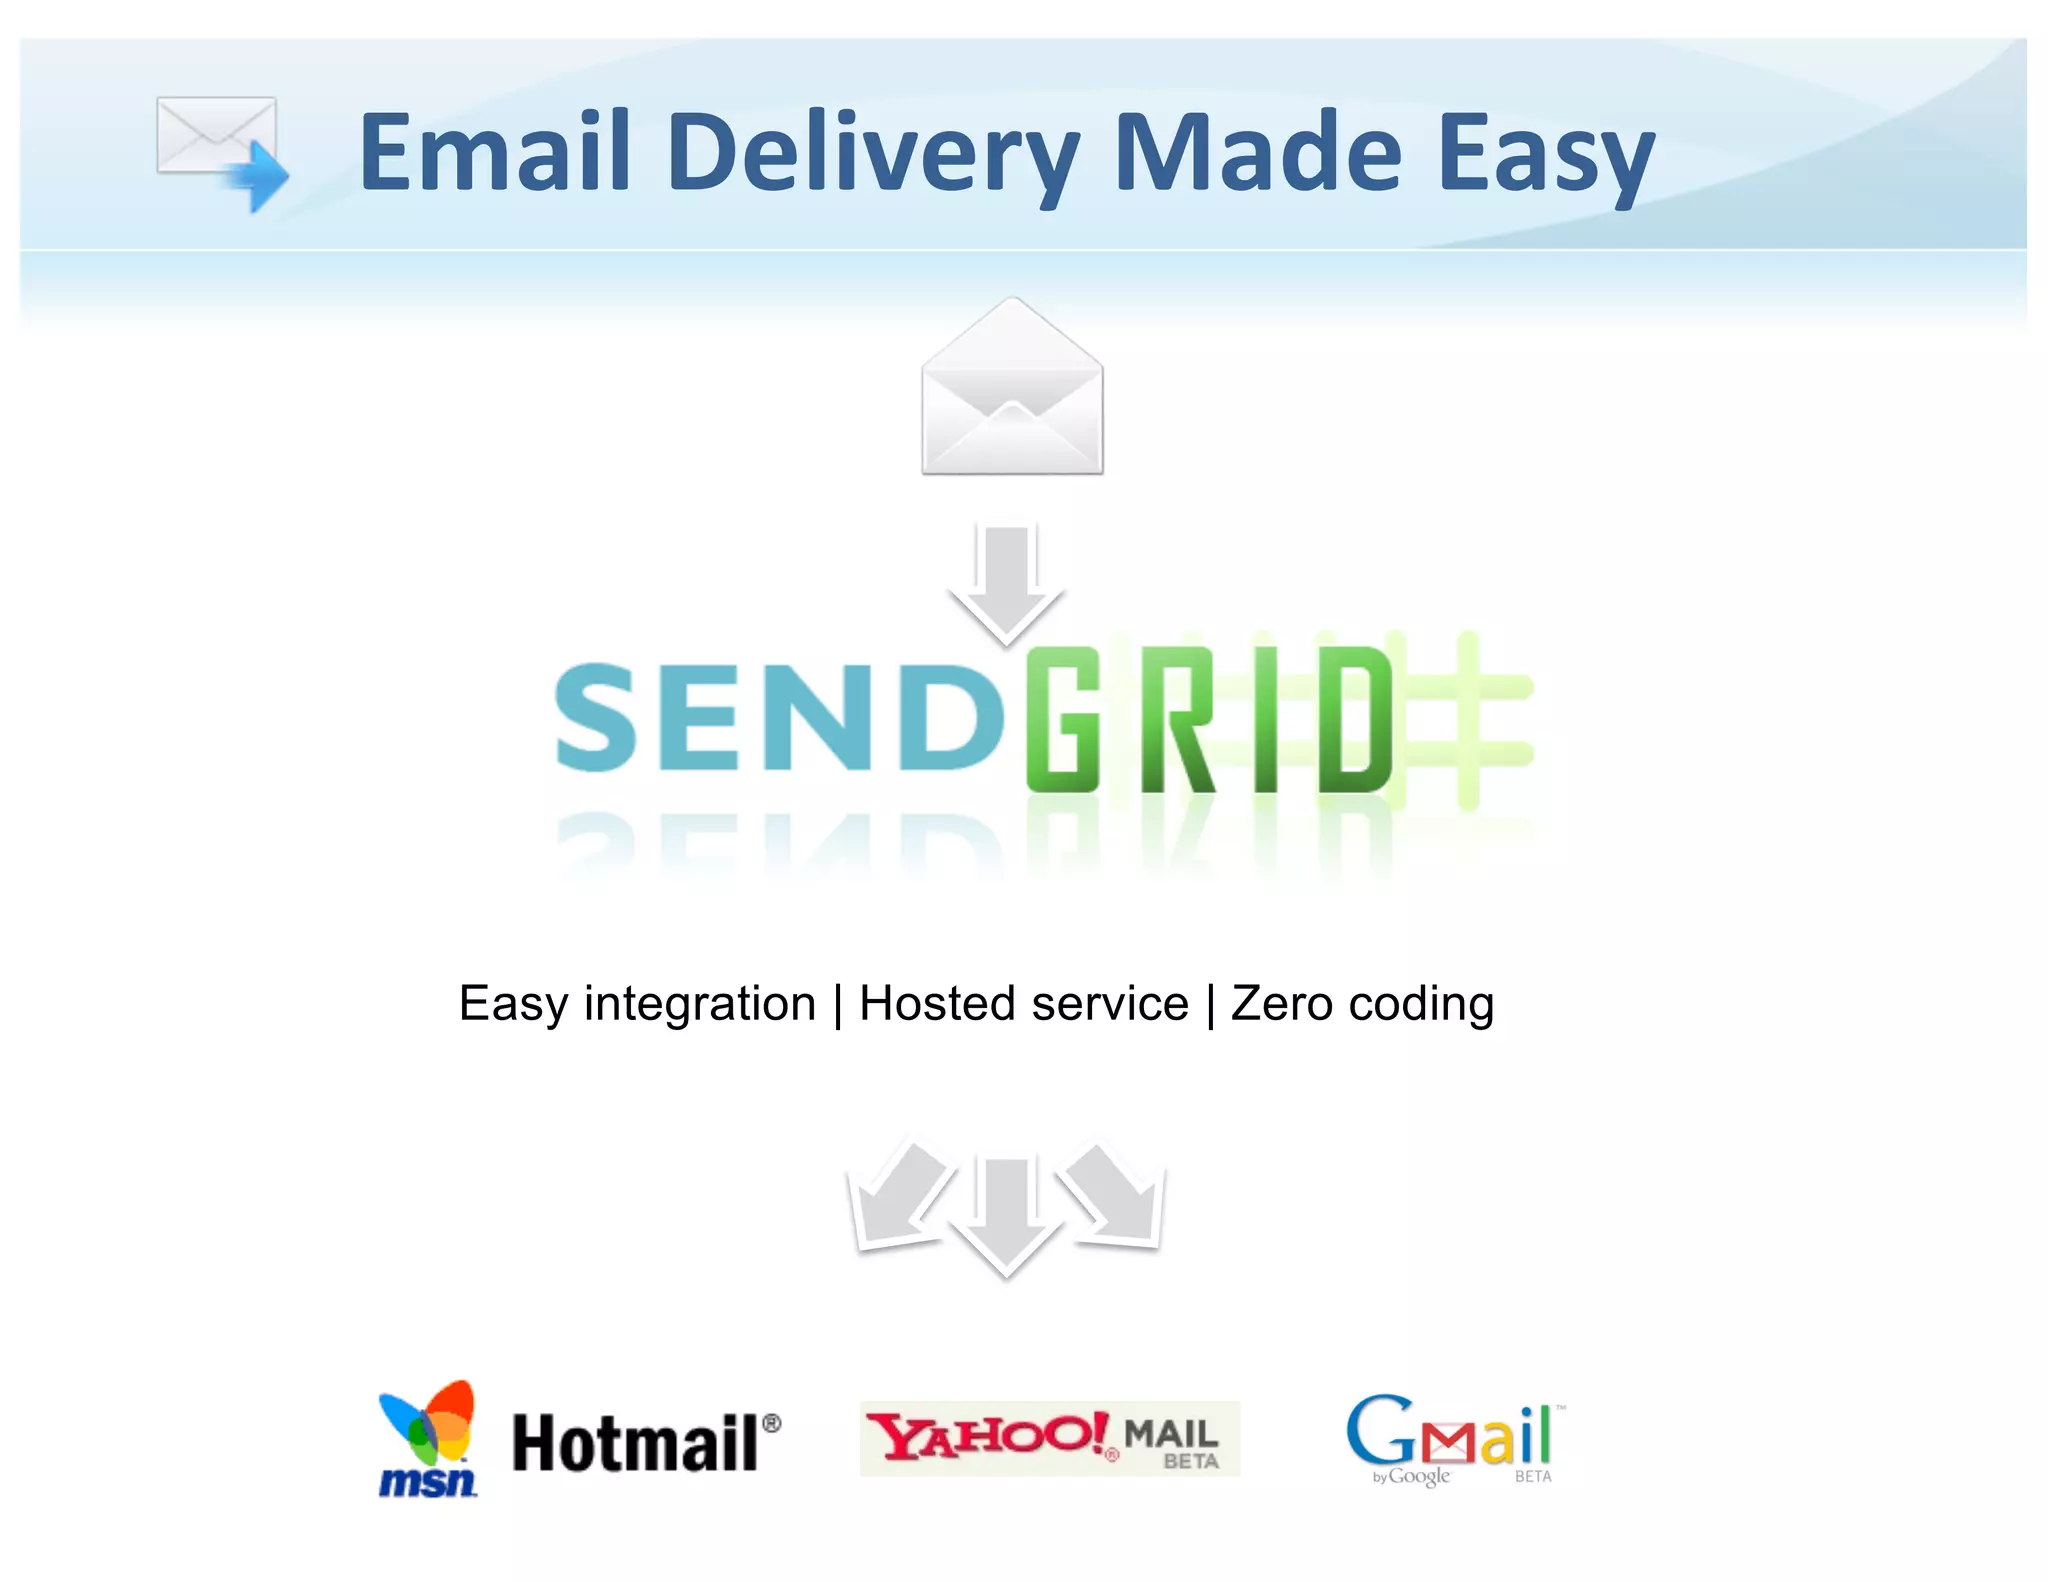
Slide 11 lays out the components that Solve deliverability — SPF, DKIM, domain keys, bounce handling, feedback loops, ISP rate limits, plus active monitoring — and uses a simple infographic flow (email → SendGrid → mailbox). This balances technical depth with an accessible diagram showing how the service interposes itself to mitigate problems. Highlighting a concrete set of tactics reassures technically literate investors and potential customers that the team understands operational complexity.

Founders should learn to present a solution with both the high-level architecture and the operational levers that drive outcomes (monitoring, feedback, policy handling). It’s not enough to say "we increase deliverability" — show the levers and why they work against the specific ISP and spam-fighting mechanisms.

Key Takeaway: Show both architecture and the operational levers (monitoring, policies, protocol compliance) that produce measurable improvements.
Scalability messaging: Cloud-as-a-service advantage

Scalability messaging: Cloud-as-a-service advantage

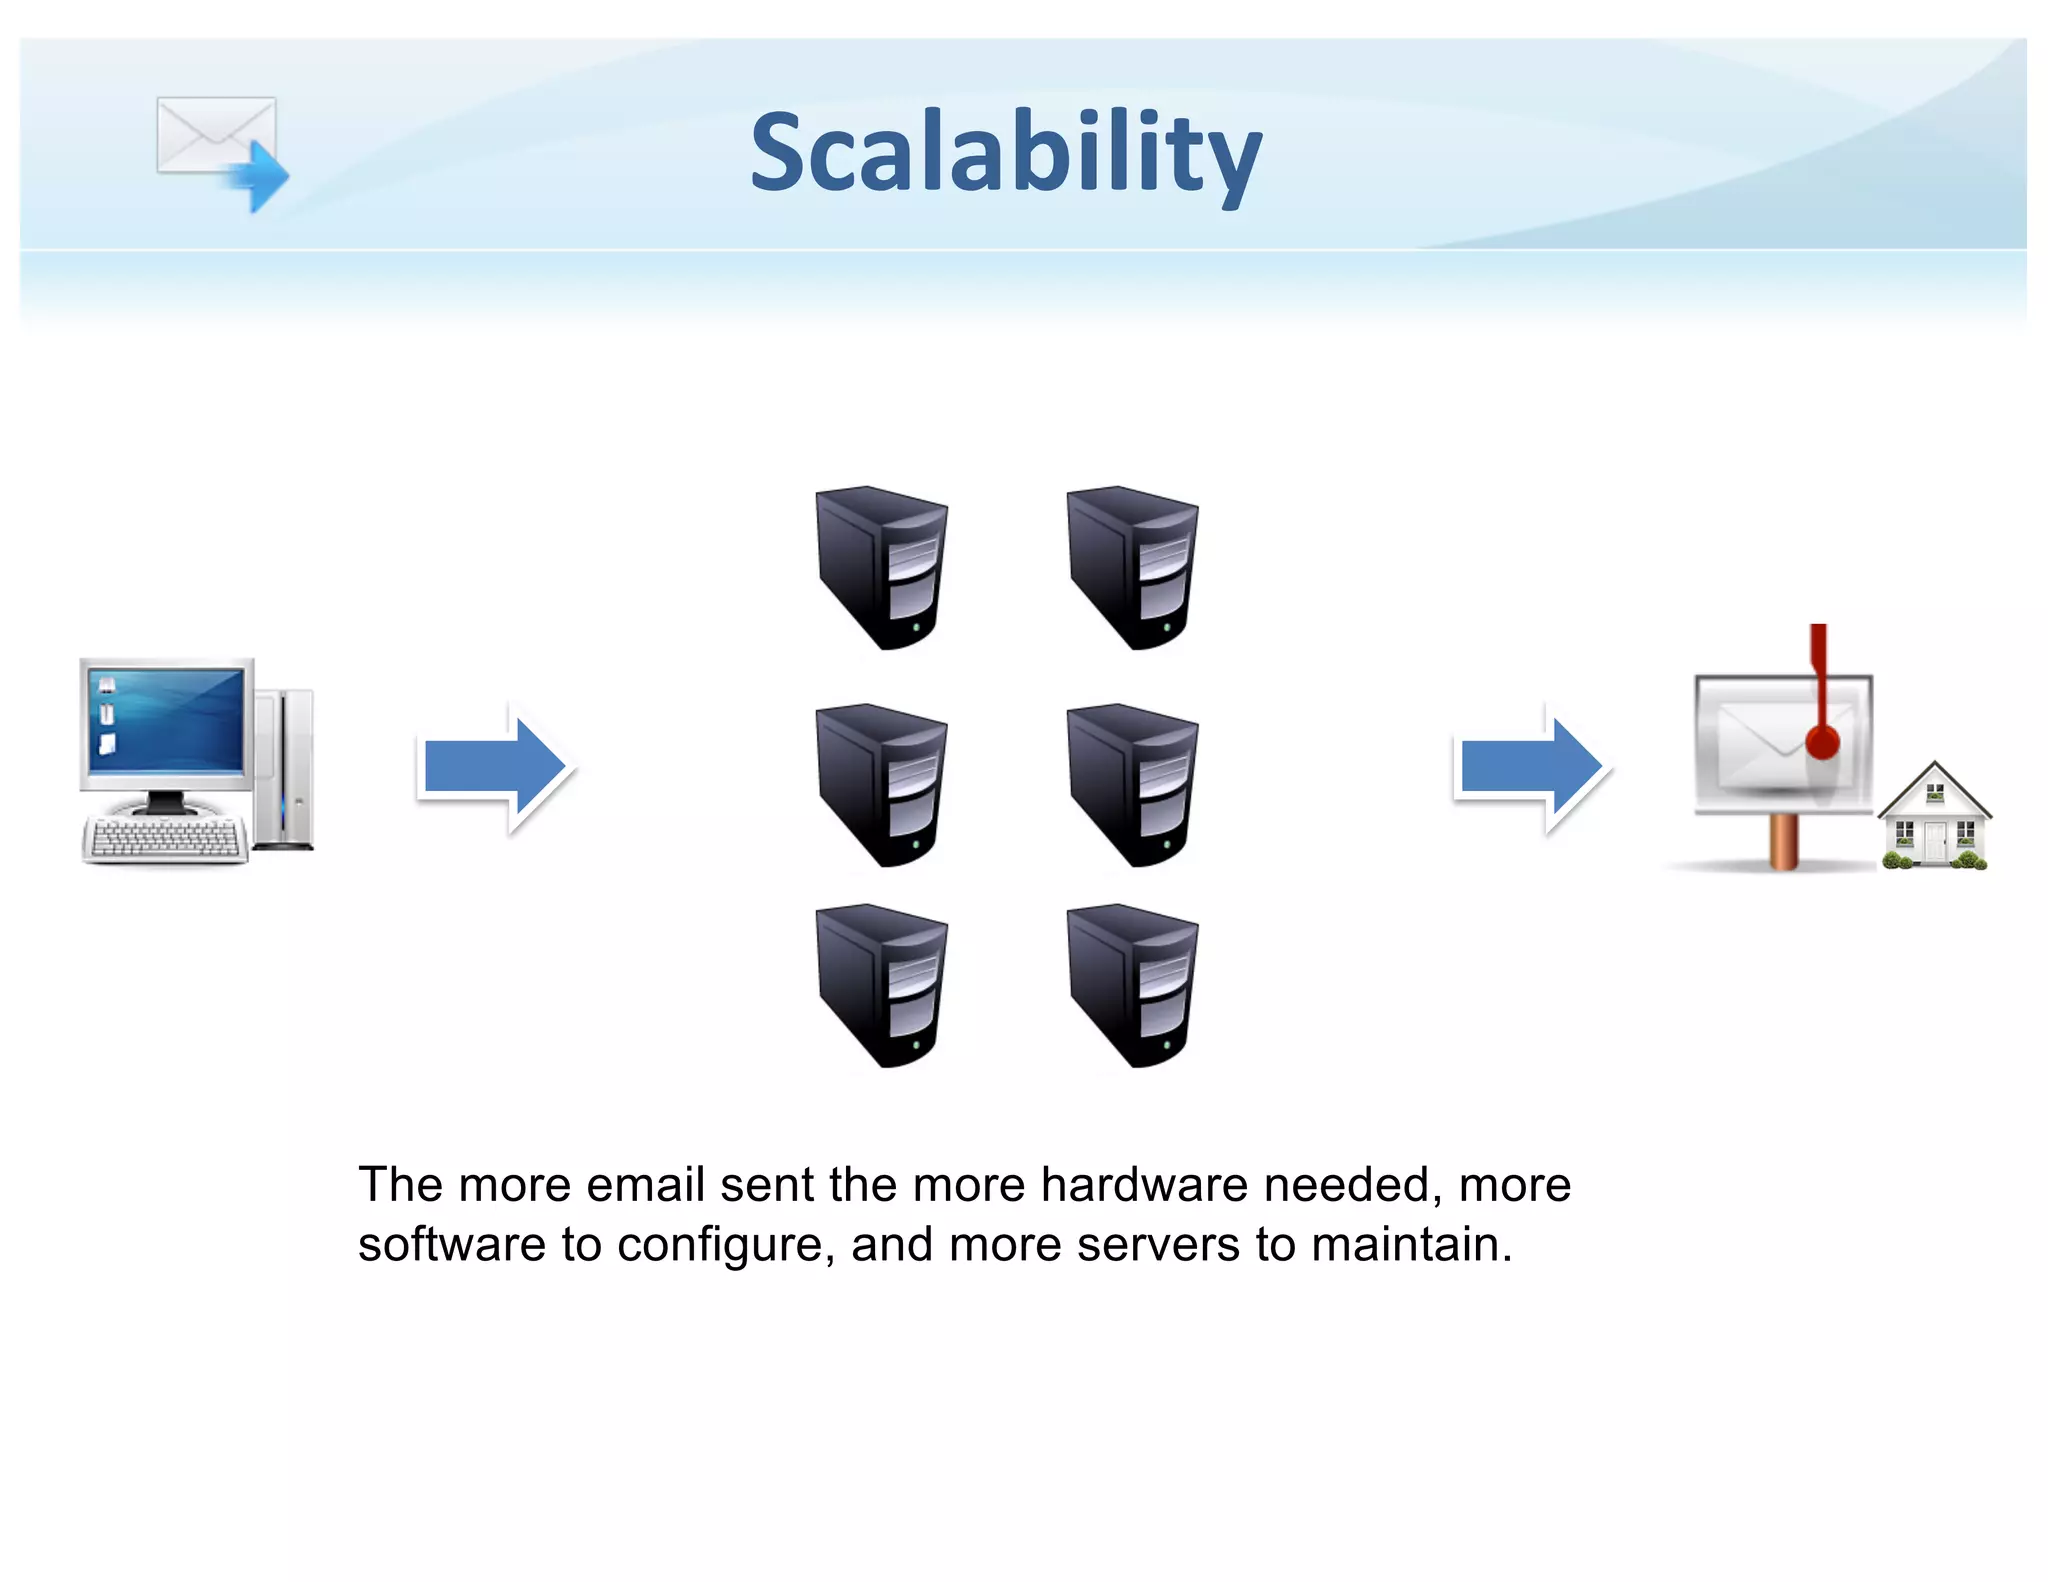
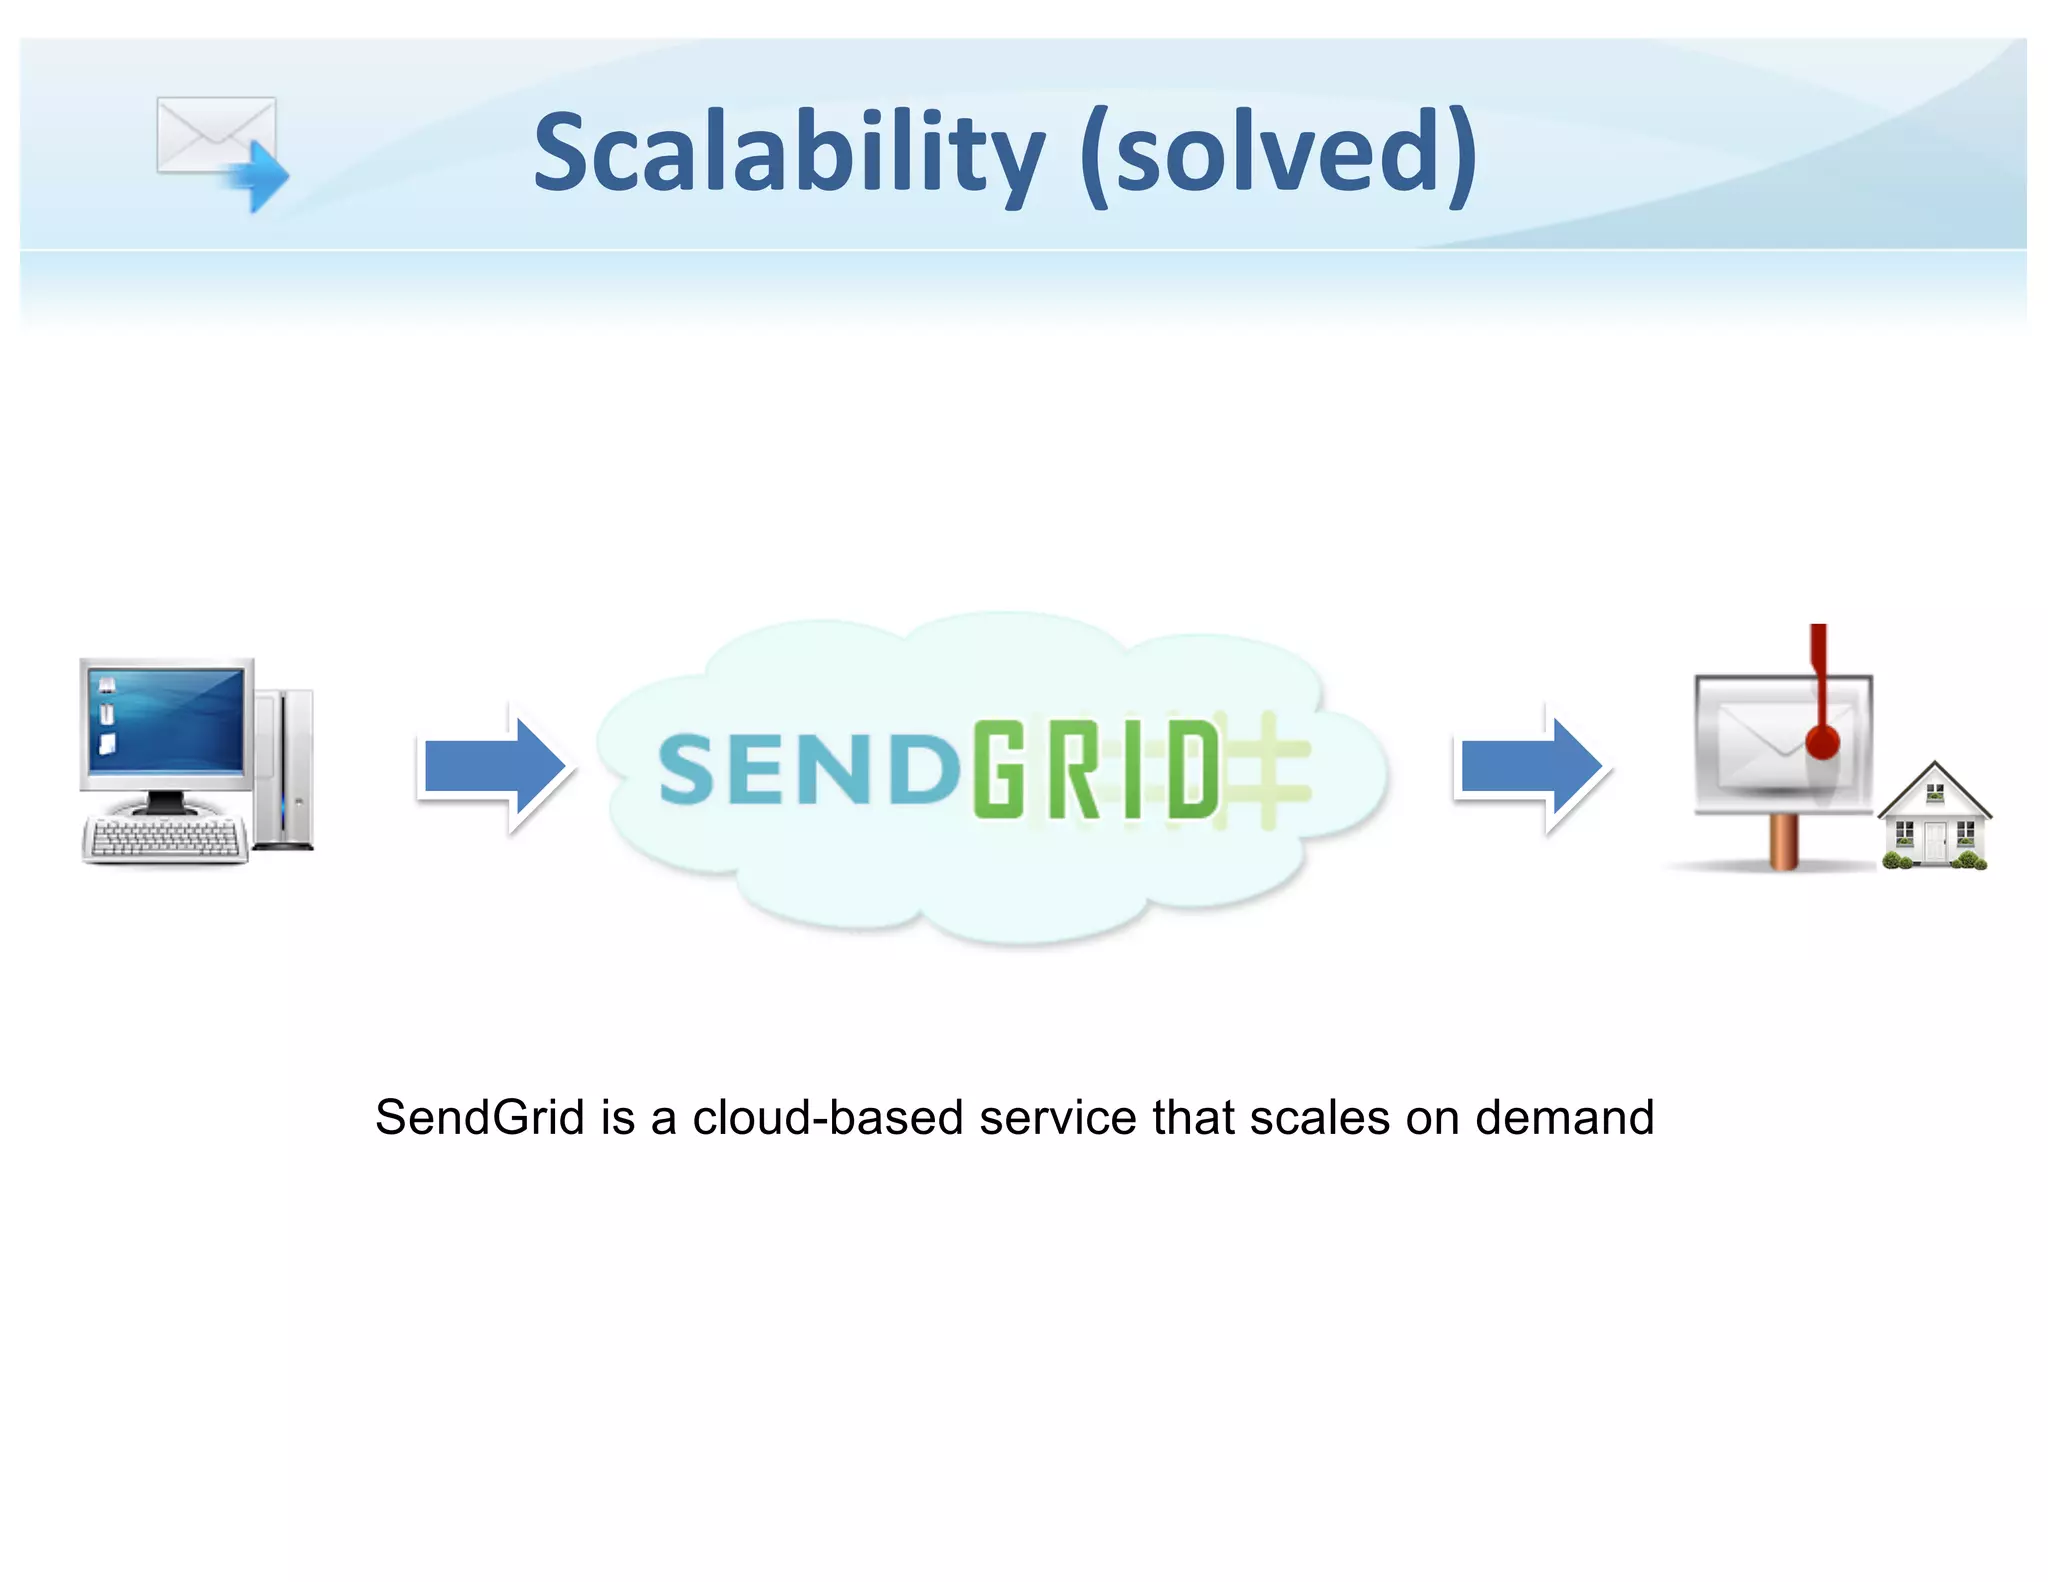
Slides 12 (Scalability) and 13 (Scalability solved) contrast the traditional approach (many servers, maintenance) with a cloud provider model that scales on demand. The visual shift from stacked servers to a cloud logo conveys dramatic simplification. This is a strong business argument: operational simplification plus predictable pricing is core to SaaS adoption by engineering teams that need reliability without adding headcount.

Founders should quantify the operational costs avoided by customers — not just in hardware, but in staffing, ops time, and risk. Presenting both the pain (infrastructure complexity) and the cloud-native fix helps justify subscription pricing and customer stickiness.

Key Takeaway: Make the operational economics explicit: show how cloud delivery reduces hardware, staffing, and complexity for customers.
Market size and opportunity: Transactional vs marketing email

Market size and opportunity: Transactional vs marketing email

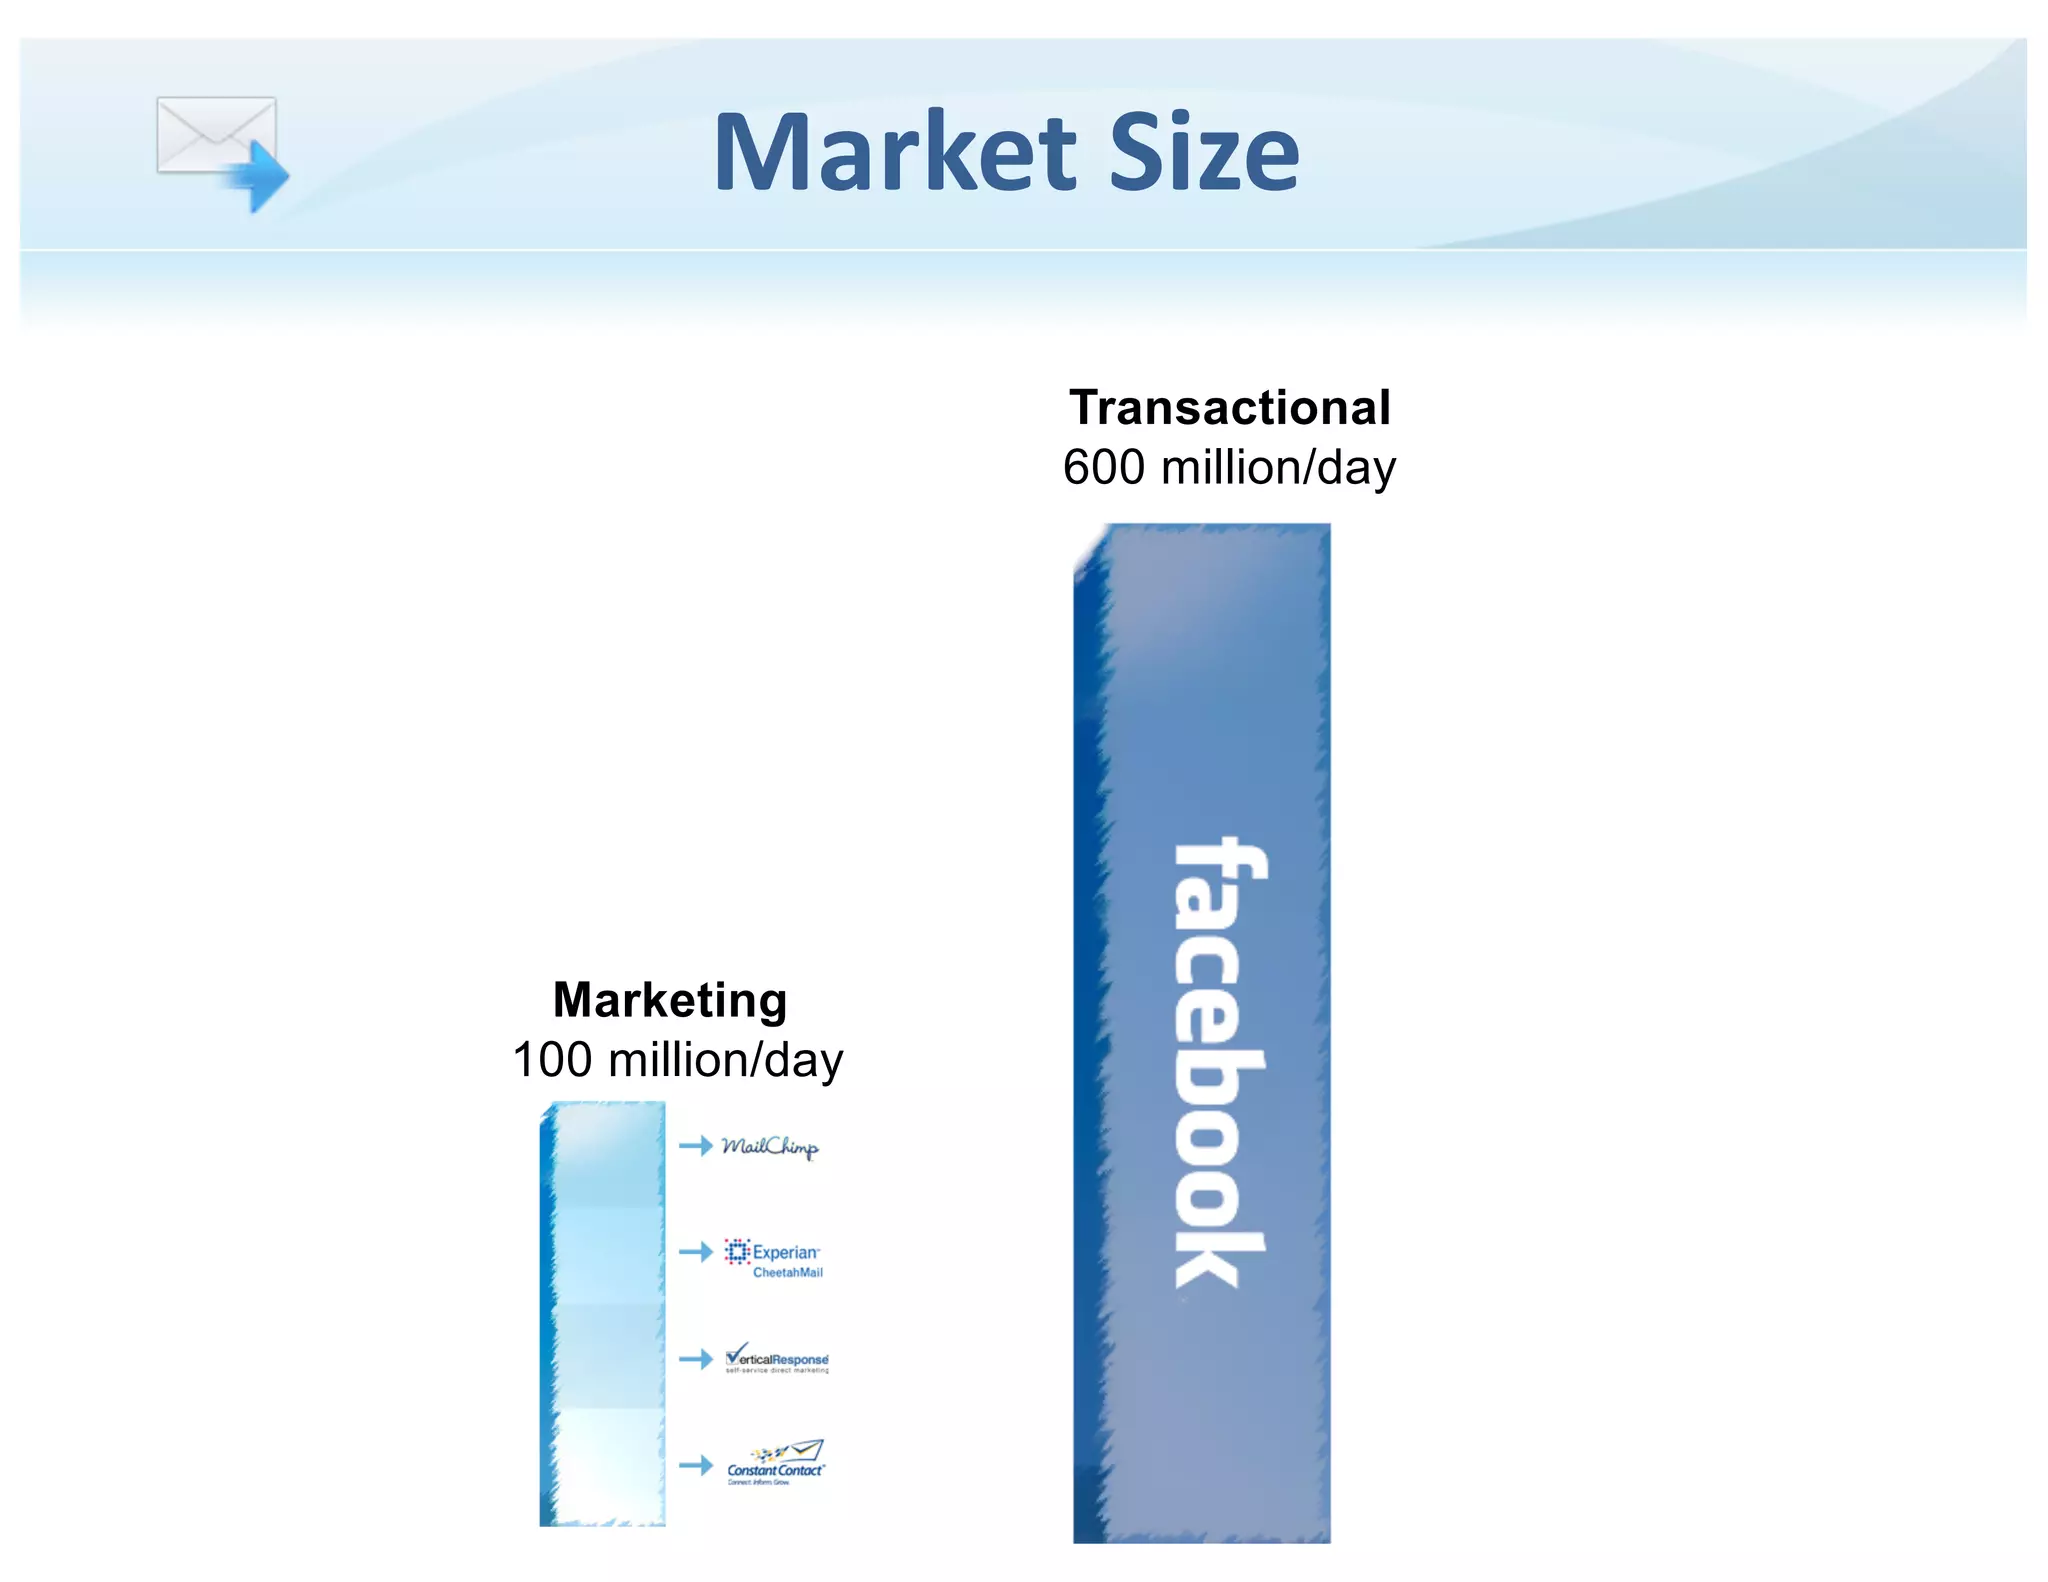
Slide 19 provides a comparative market sizing: marketing email (~100M/day) vs transactional (~600M/day) emphasizing the larger volume opportunity for transactional services. Using a recognizable anchor (Facebook) amplifies scale visually. This is persuasive because it reframes the startup’s niche as not just defensible, but sizable and growing, supporting ambitious revenue projections.

Founders should ensure market figures are sourced and conservative; visual comparisons like these are powerful but must be defensible during due diligence. Also, segmenting TAM (total addressable market) into use cases helps prioritize product features and GTM strategy — e.g., prioritize platforms with the highest transactional volumes.

Key Takeaway: Use conservative, sourceable market comparisons to justify ambition — and segment the TAM to show where you will win first.

Conclusion: Key Lessons

This pitch deck succeeds by combining a crisp problem statement (deliverability + scaling), a focused product position (transactional email), concrete before/after examples and metrics (deliverability % and revenue impact), and practical operational detail (protocols, filters, monitoring). Founders should emulate the clear problem → solution → impact arc: show who you serve, why current solutions fail, how your product fixes it, and the measurable business outcome.

Actionable advice: 1) lead with a concise value statement and team credibility; 2) translate technical metrics into dollarized customer impact; 3) include before/after visuals or case examples that demonstrate product efficacy; 4) provide defensible market sizing and transparent pricing tiers; and 5) show operational levers (protocols, monitoring) that justify reliability claims. These elements together build the credibility investors need for a seed round in infrastructure or enterprise SaaS.

Full Deck Analysis

11 sections

Overview

Company: CloudAcademy (context provided)
Round: Seed ($3M)
Year: 2015
Outcome: Acquired by QA (2019)

Deck actually shown / analyzed below: a Seed pitch for a transactional email delivery service (SendGrid-style).


Executive Summary

This deck frames a clear operational problem for product teams and web services: transactional emails (friend requests, shipping alerts, notifications) are mission-critical but difficult to deliver reliably and at scale. The solution is a hosted, cloud-based transactional email platform that solves deliverability, scalability, and monitoring (deliverability features, filters, analytics). The deck is notable for concrete market sizing and clear pricing tiers plus early traction figures.


Problem Statement

How the deck articulates the problem (slides referenced):

  • Slide 7: Lists four major pain points for businesses that send transactional email — Deliverability, Scalability, Lack of insight, and Time consuming. This succinctly catalogs the operational and business risks.
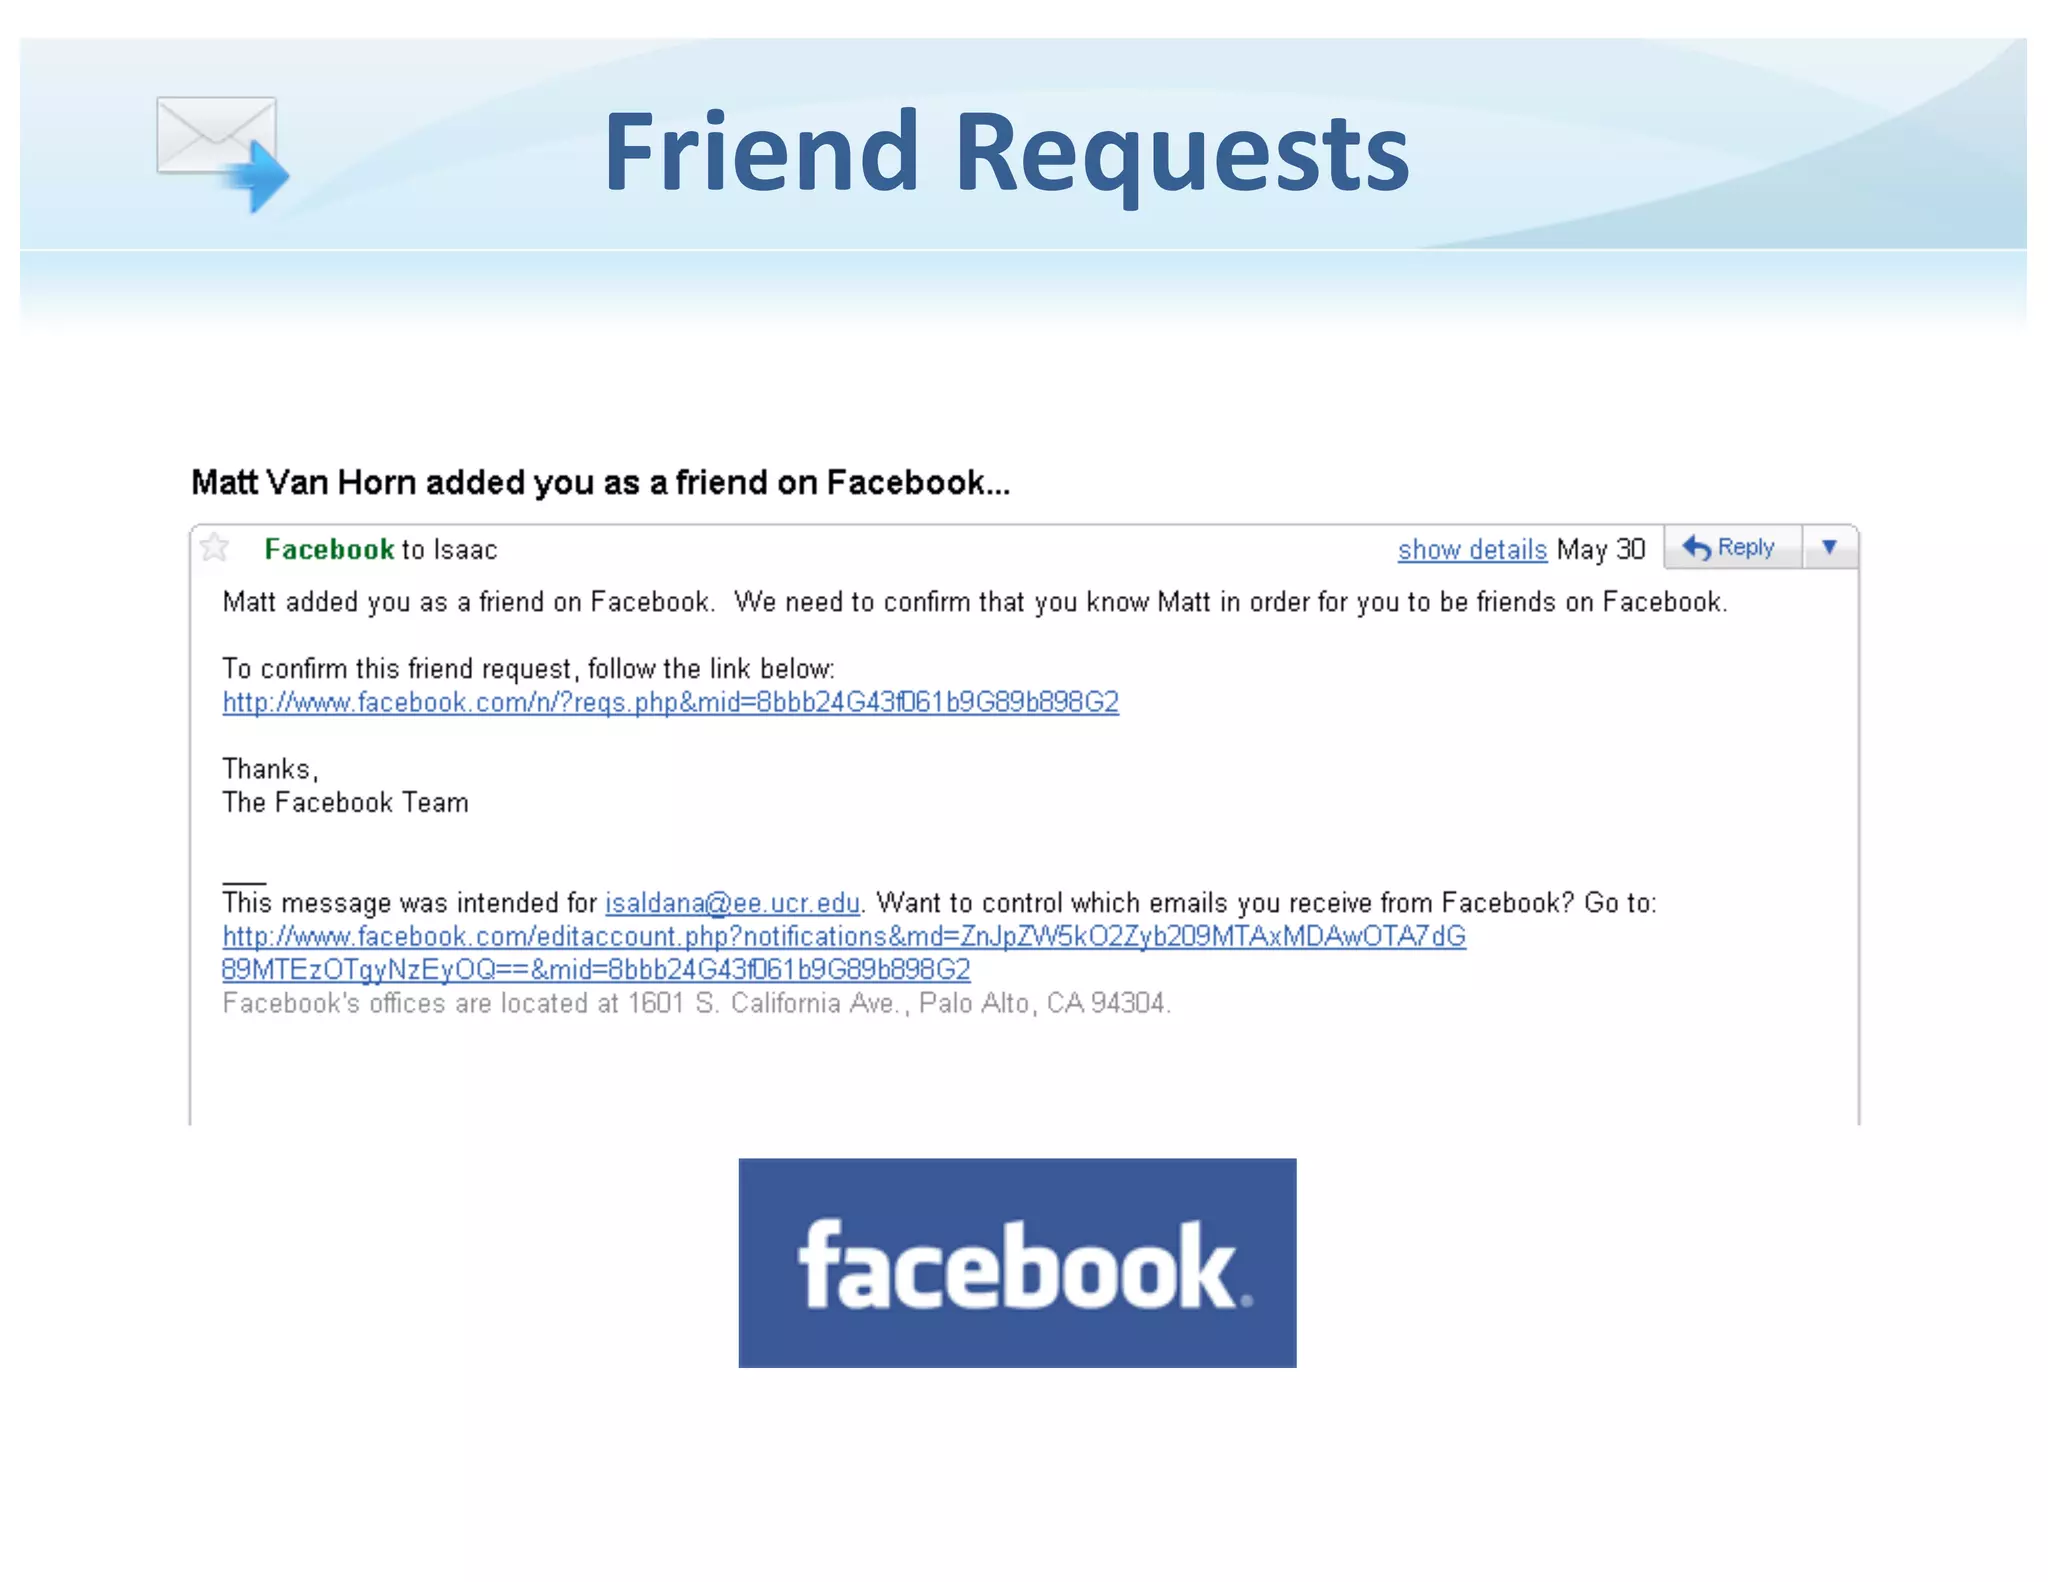
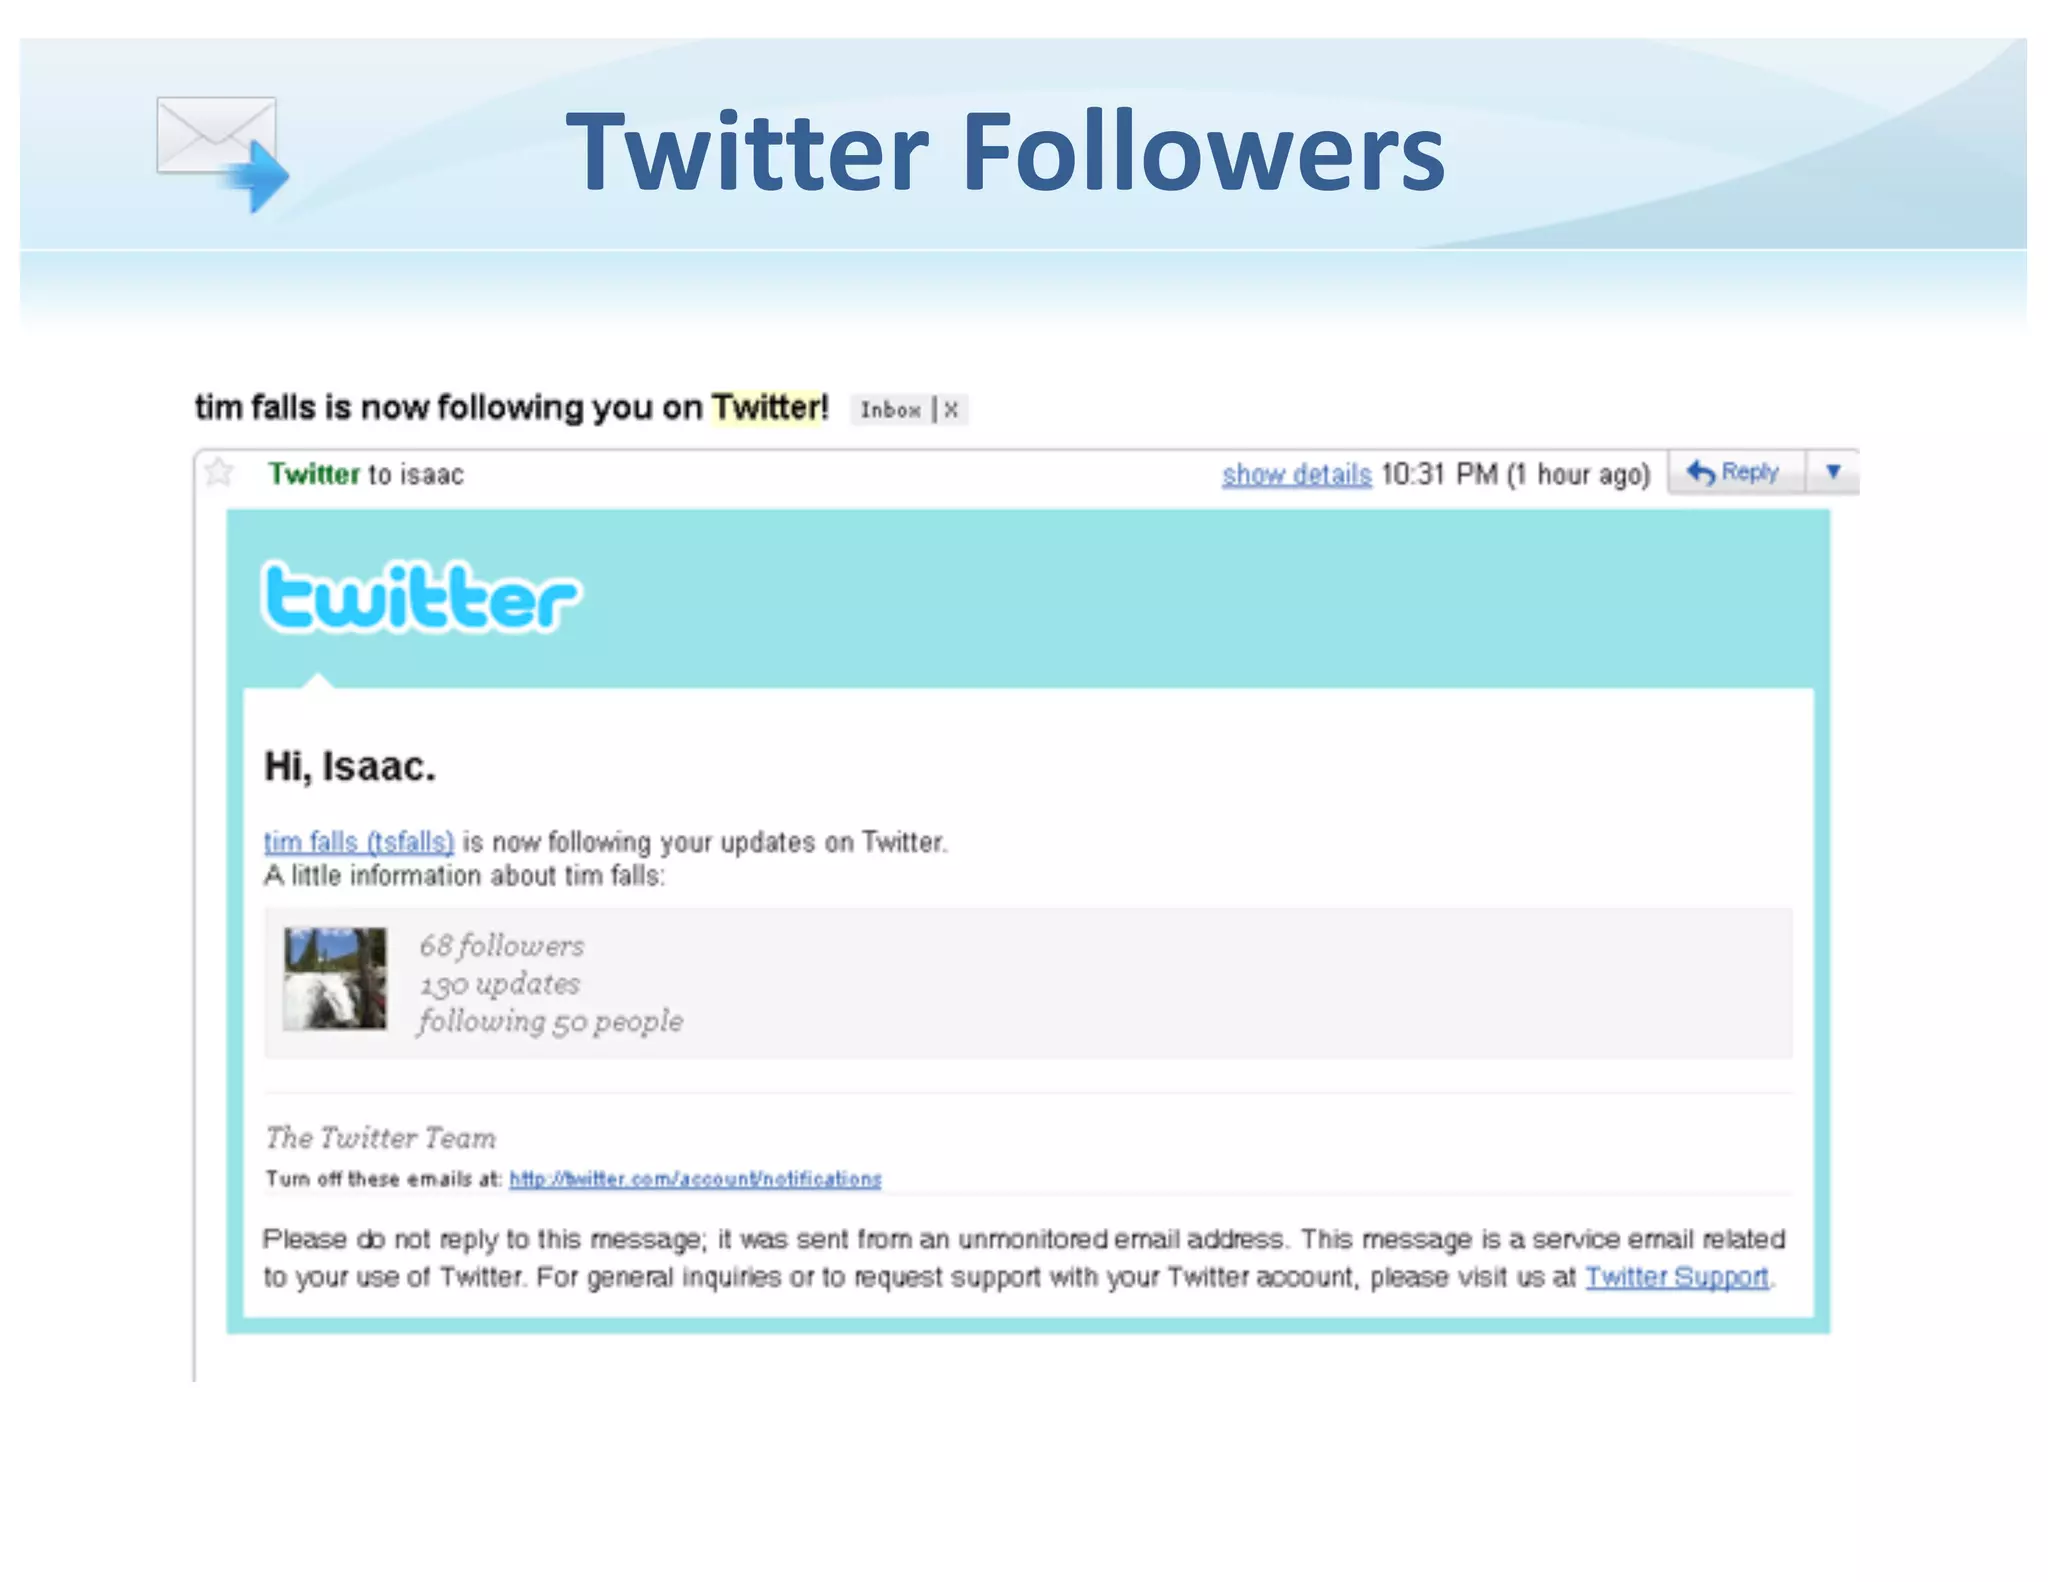
  • Slides 3–6: Provide concrete examples of transactional email types (friend requests, Twitter followers, shipping alerts) to show how ubiquitous and user-facing these messages are — emphasizing the consequences of failure (user confusion/lost revenue).
  • Slide 9: Quantifies the impact of poor deliverability (“20% non-delivery is typical”) and gives a cost example (if 1% of eBay’s yearly email is missing, they would lose $14M) to tie the problem to hard dollars.

Solution

How the deck positions the solution:

  • Slide 8 and 12: Present a cloud-hosted service (SendGrid) that acts as an email delivery layer: easy integration, hosted service, “zero coding” and scales on demand (cloud delivery solves scalability).
  • Slide 11: Lists the deliverability toolkit (SPF, DKIM, DomainKeys, RDNS, feedback loops, bounce handling, CAN-SPAM compliance, ISP rate limits) — an “expert system” claim for improving inbox placement.
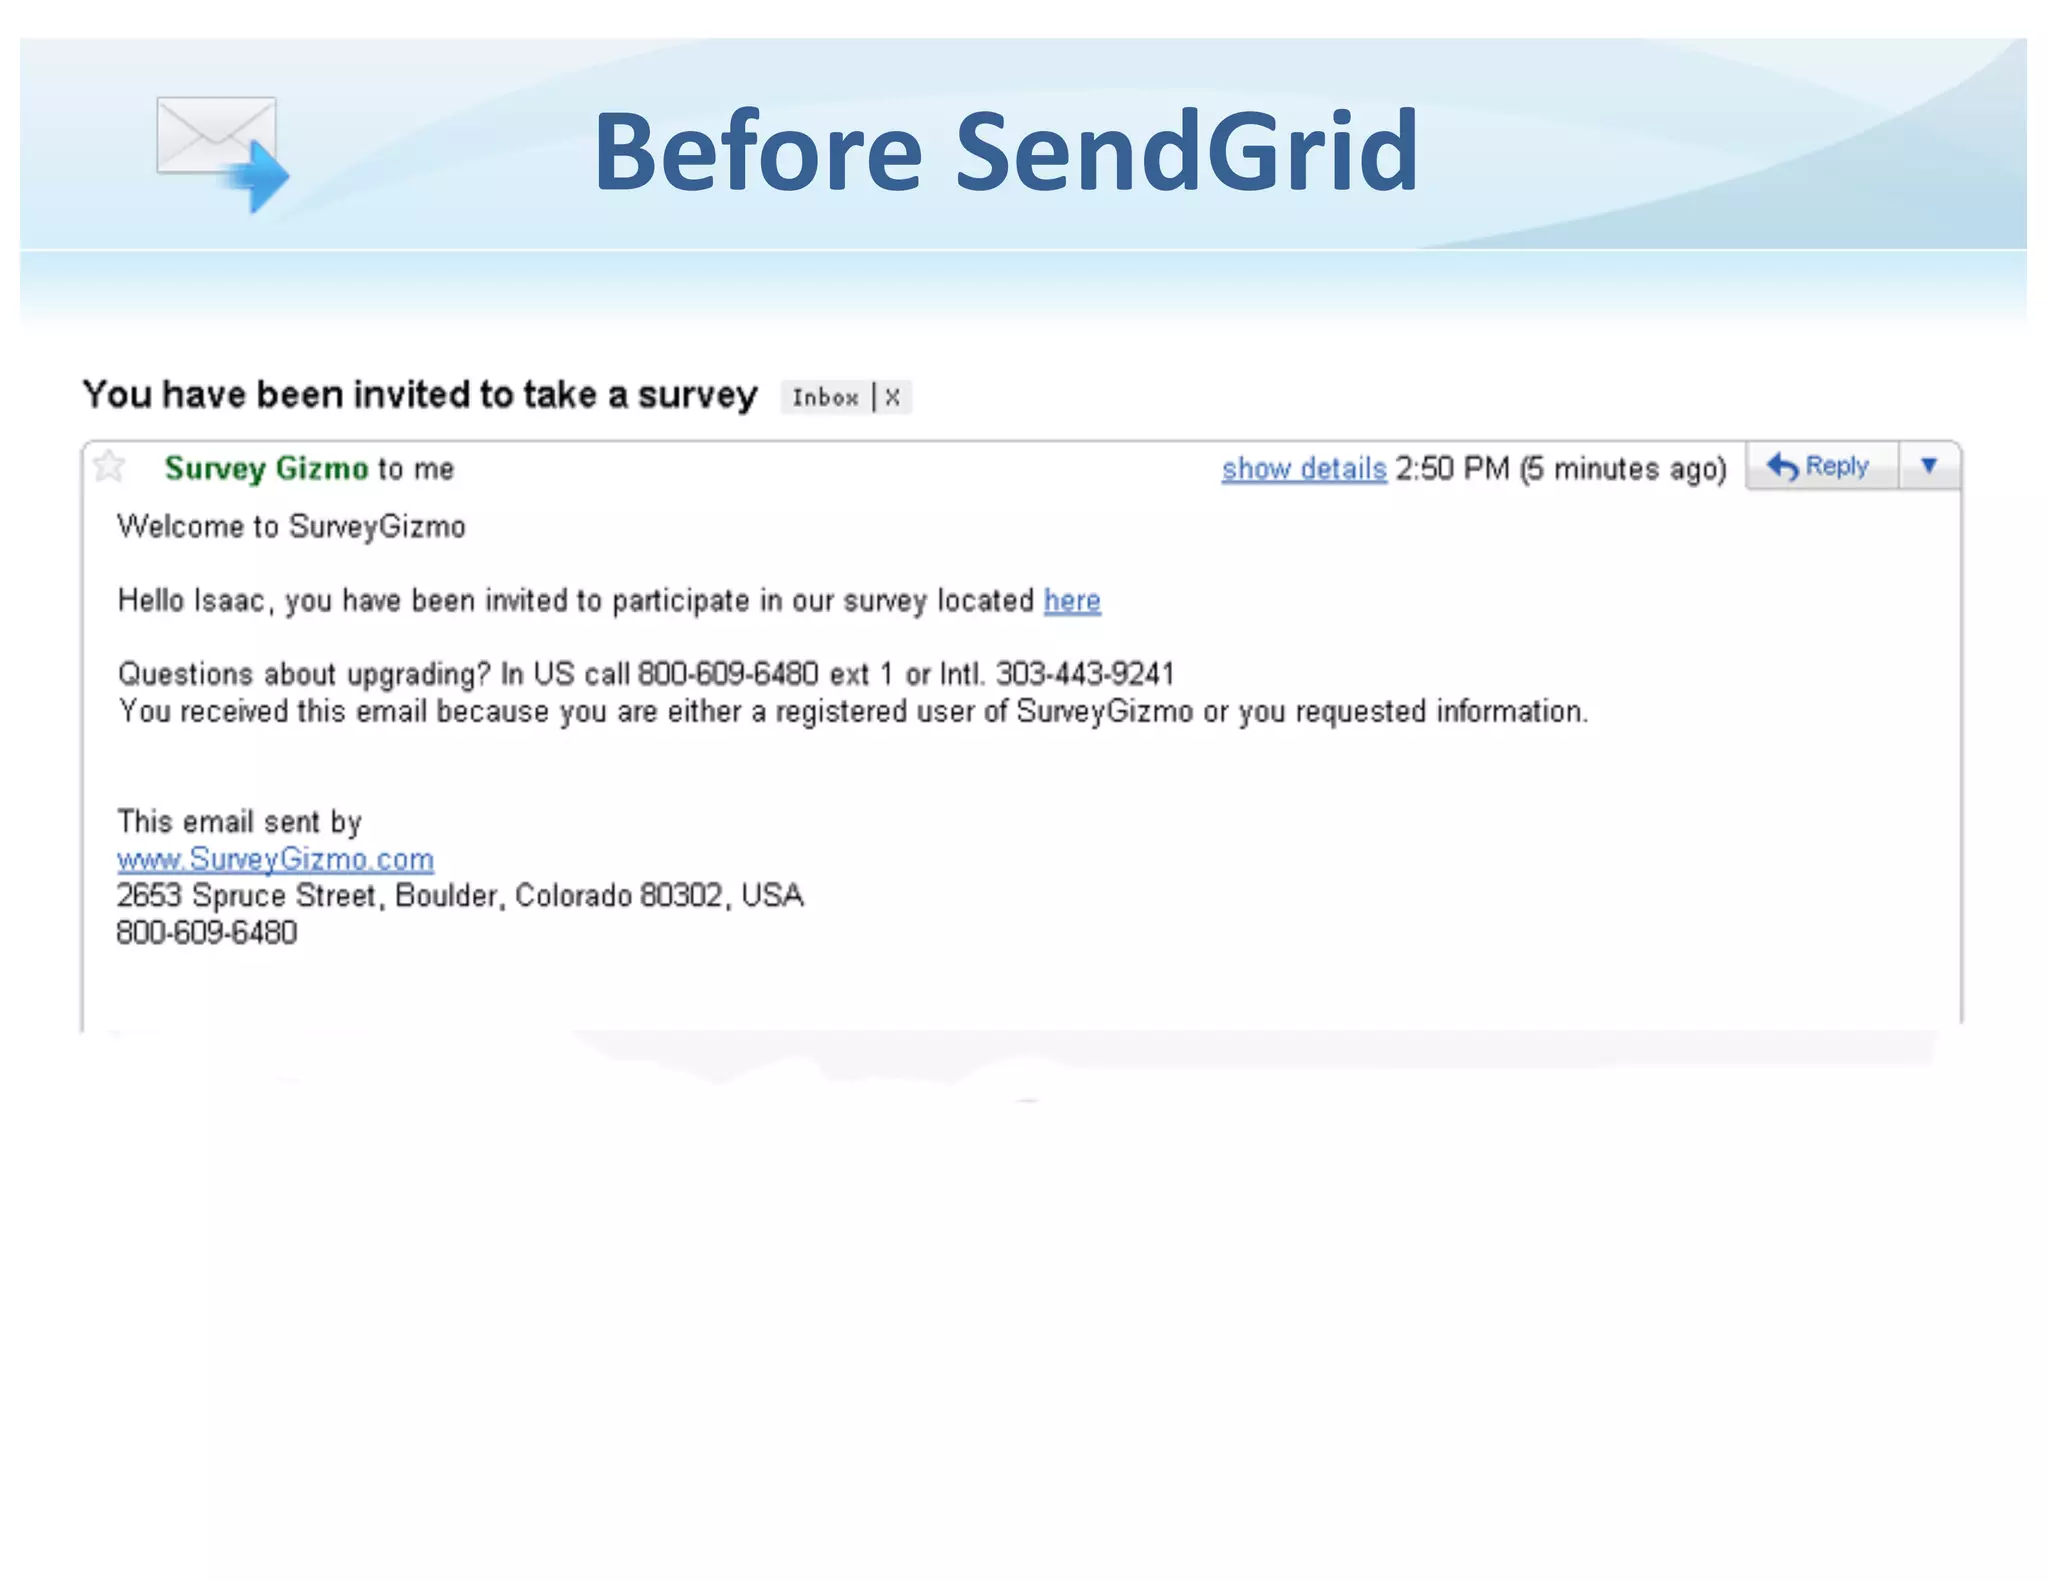
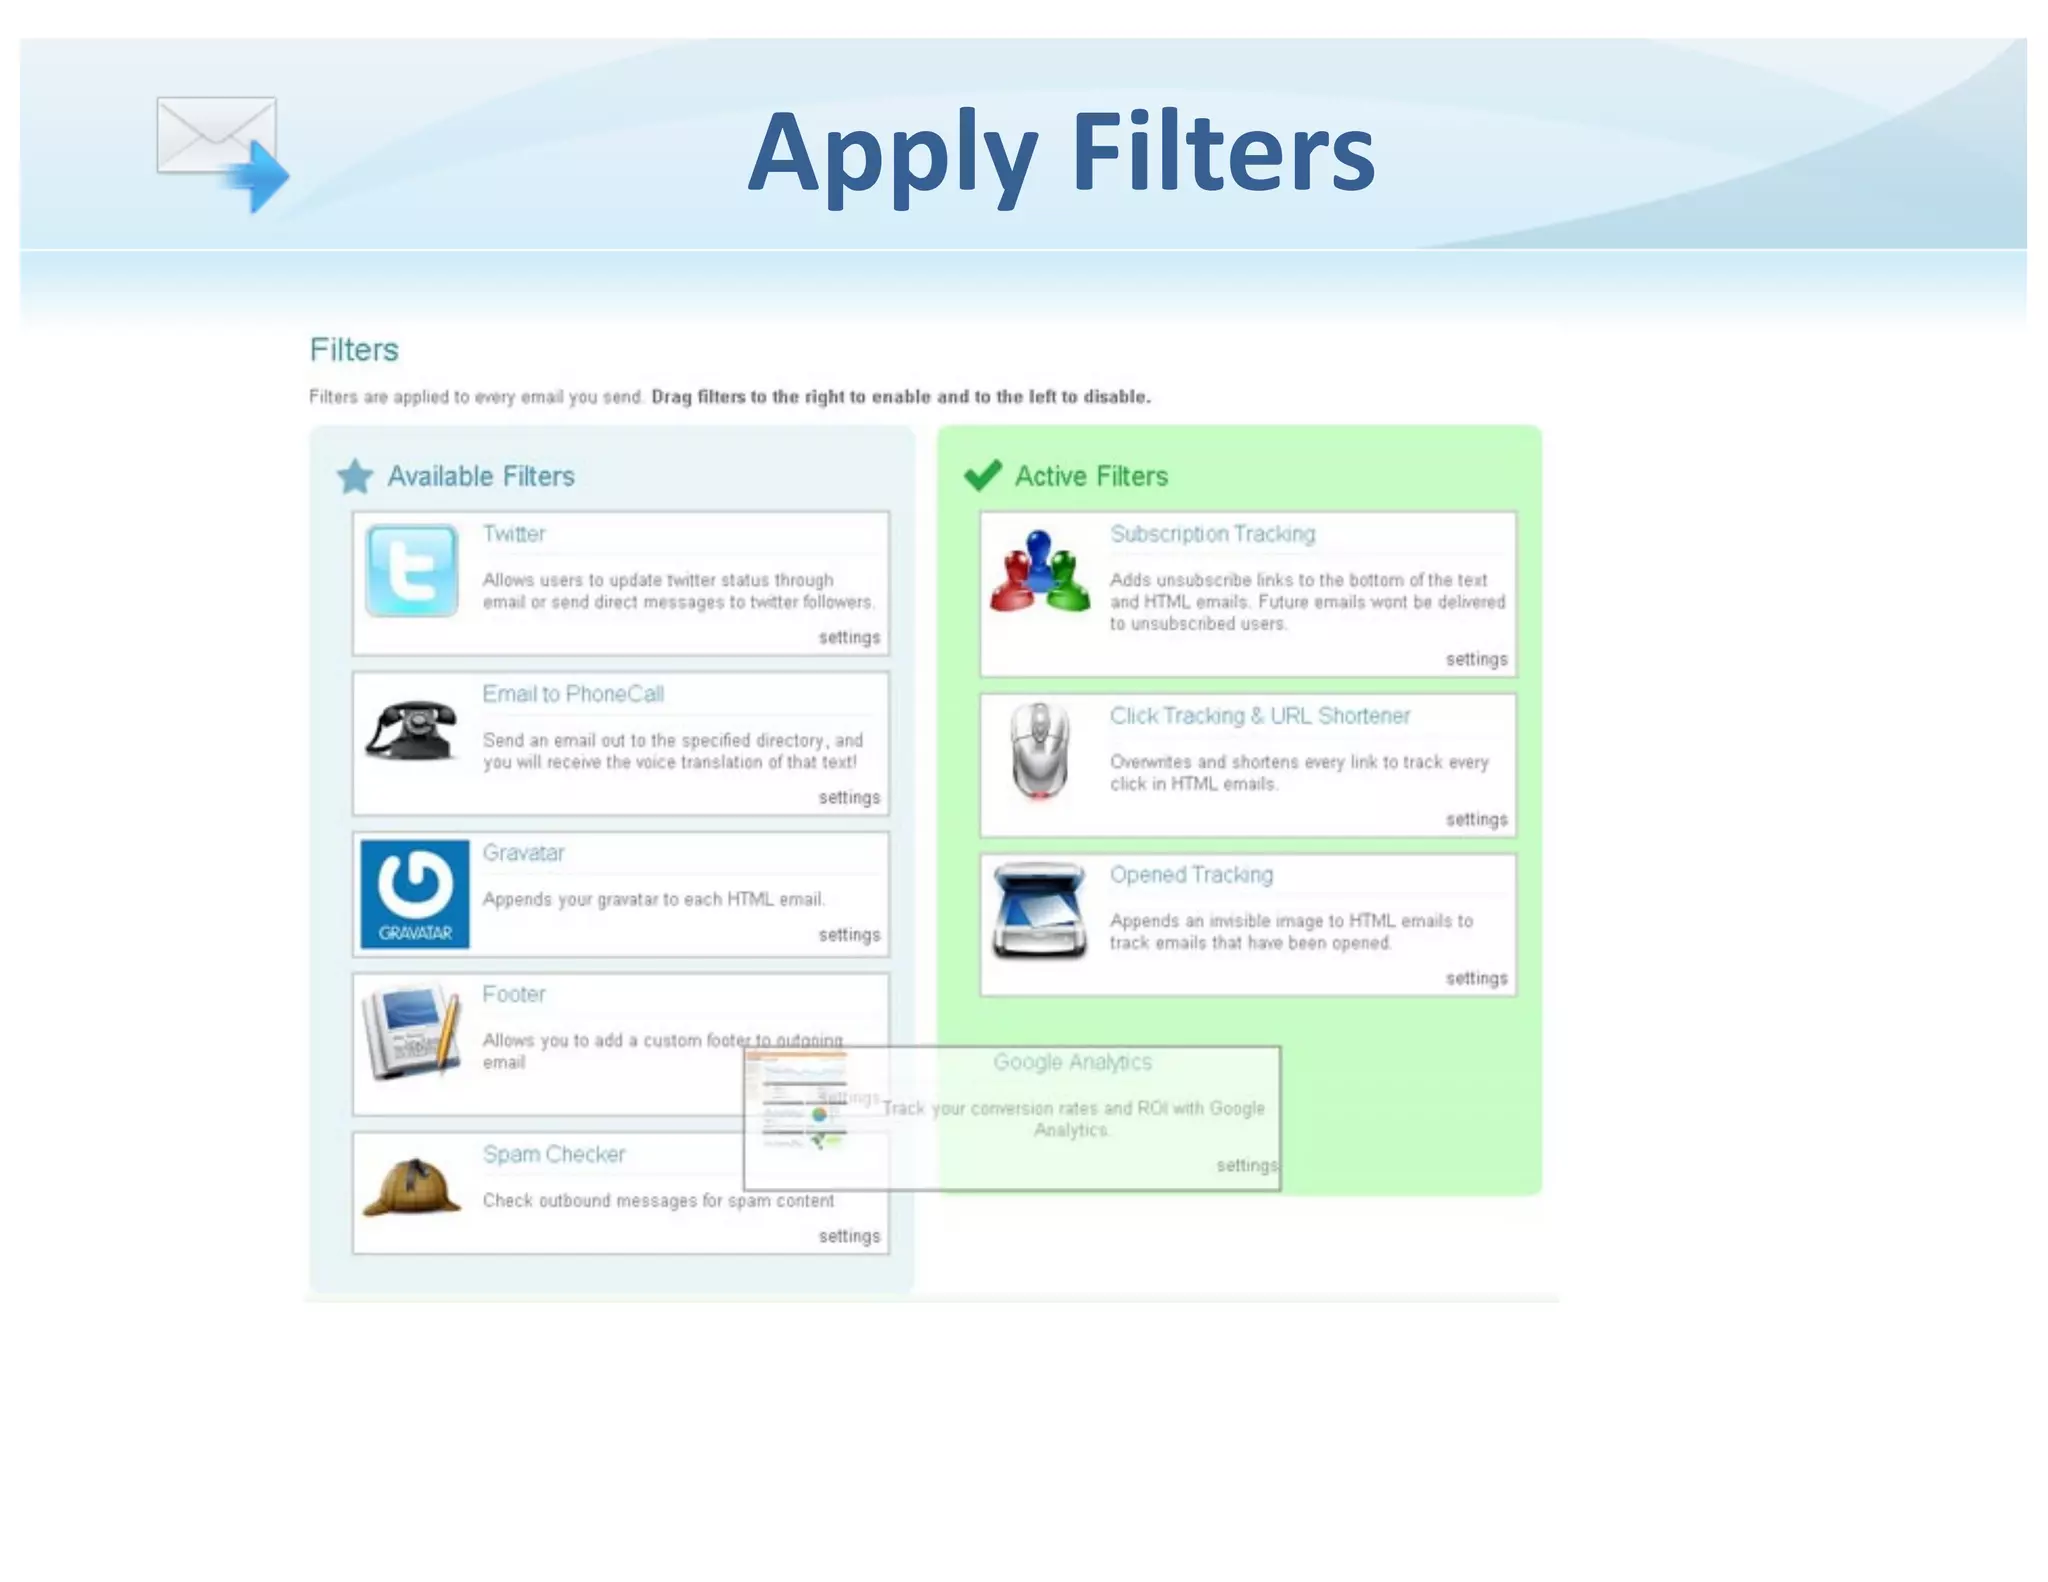
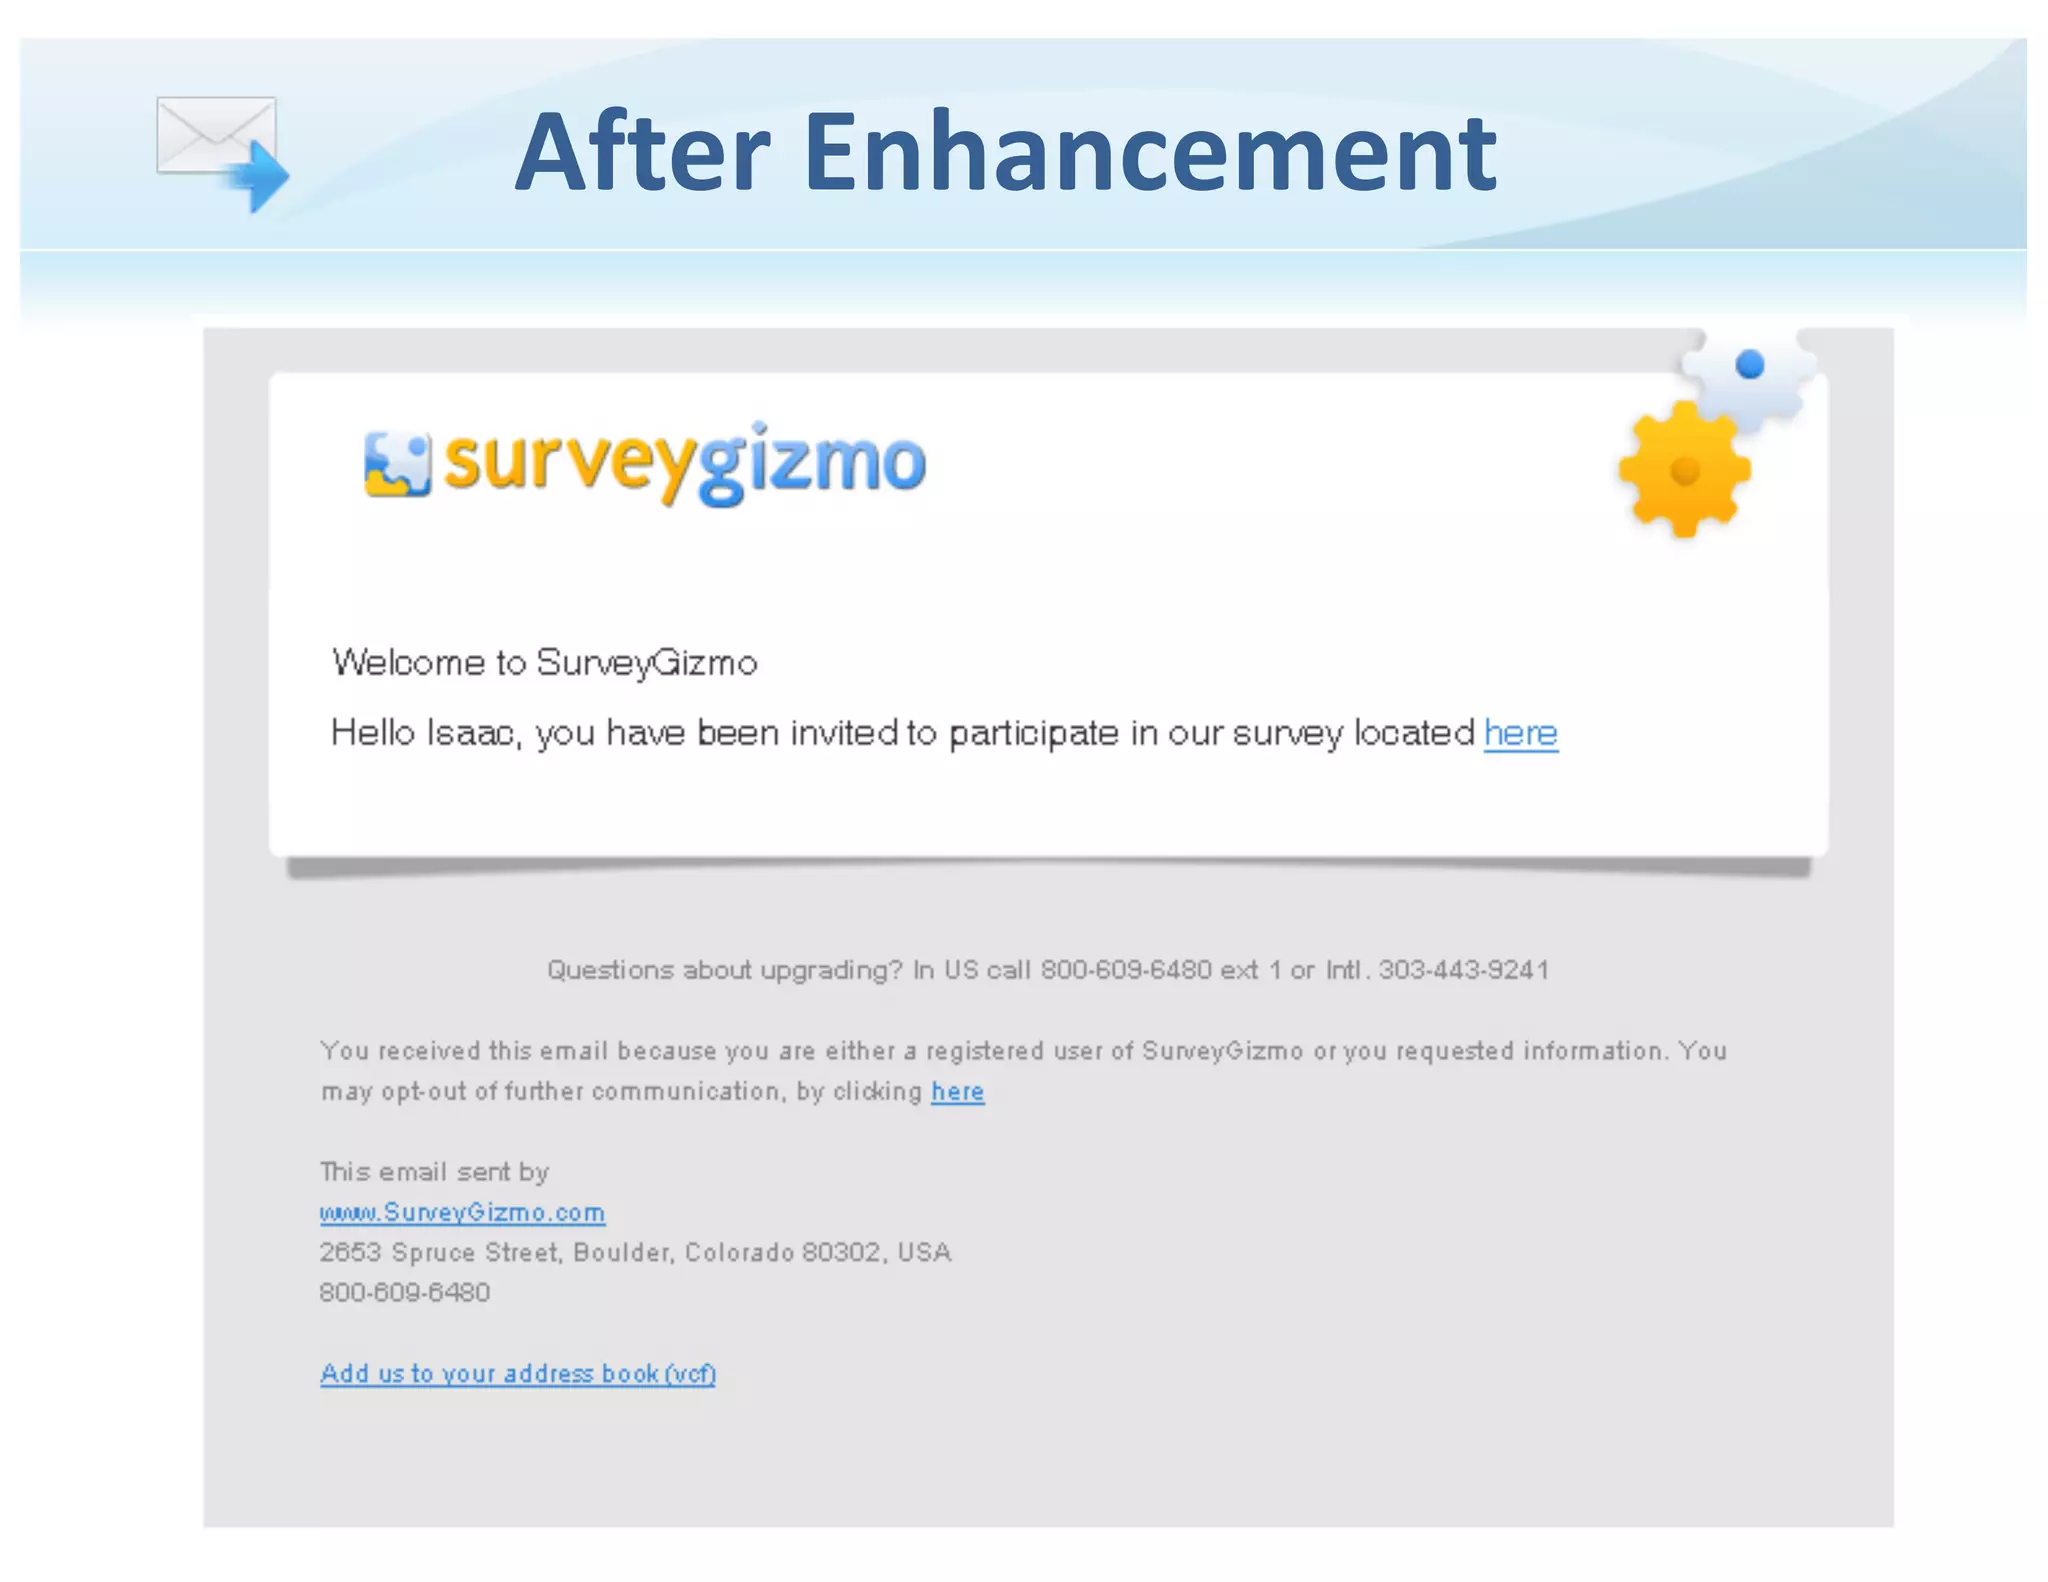
  • Slides 17–18: Demonstrate product enhancements and filters (unsubscribe handling, click/open tracking, footers, Google Analytics integration) to add value beyond raw delivery.
  • Slide 10–15: Metrics and dashboard screenshots to show monitoring / insight capability.

Net positioning: a managed, turnkey, deliverability-first transactional email platform with analytics and inbox-placement expertise.


Market Opportunity

  • Slide 20: Market-size visuals present two buckets:
    • Marketing email: ~100 million/day (visual)
    • Transactional email: ~600 million/day (visual, with a large Facebook bar)
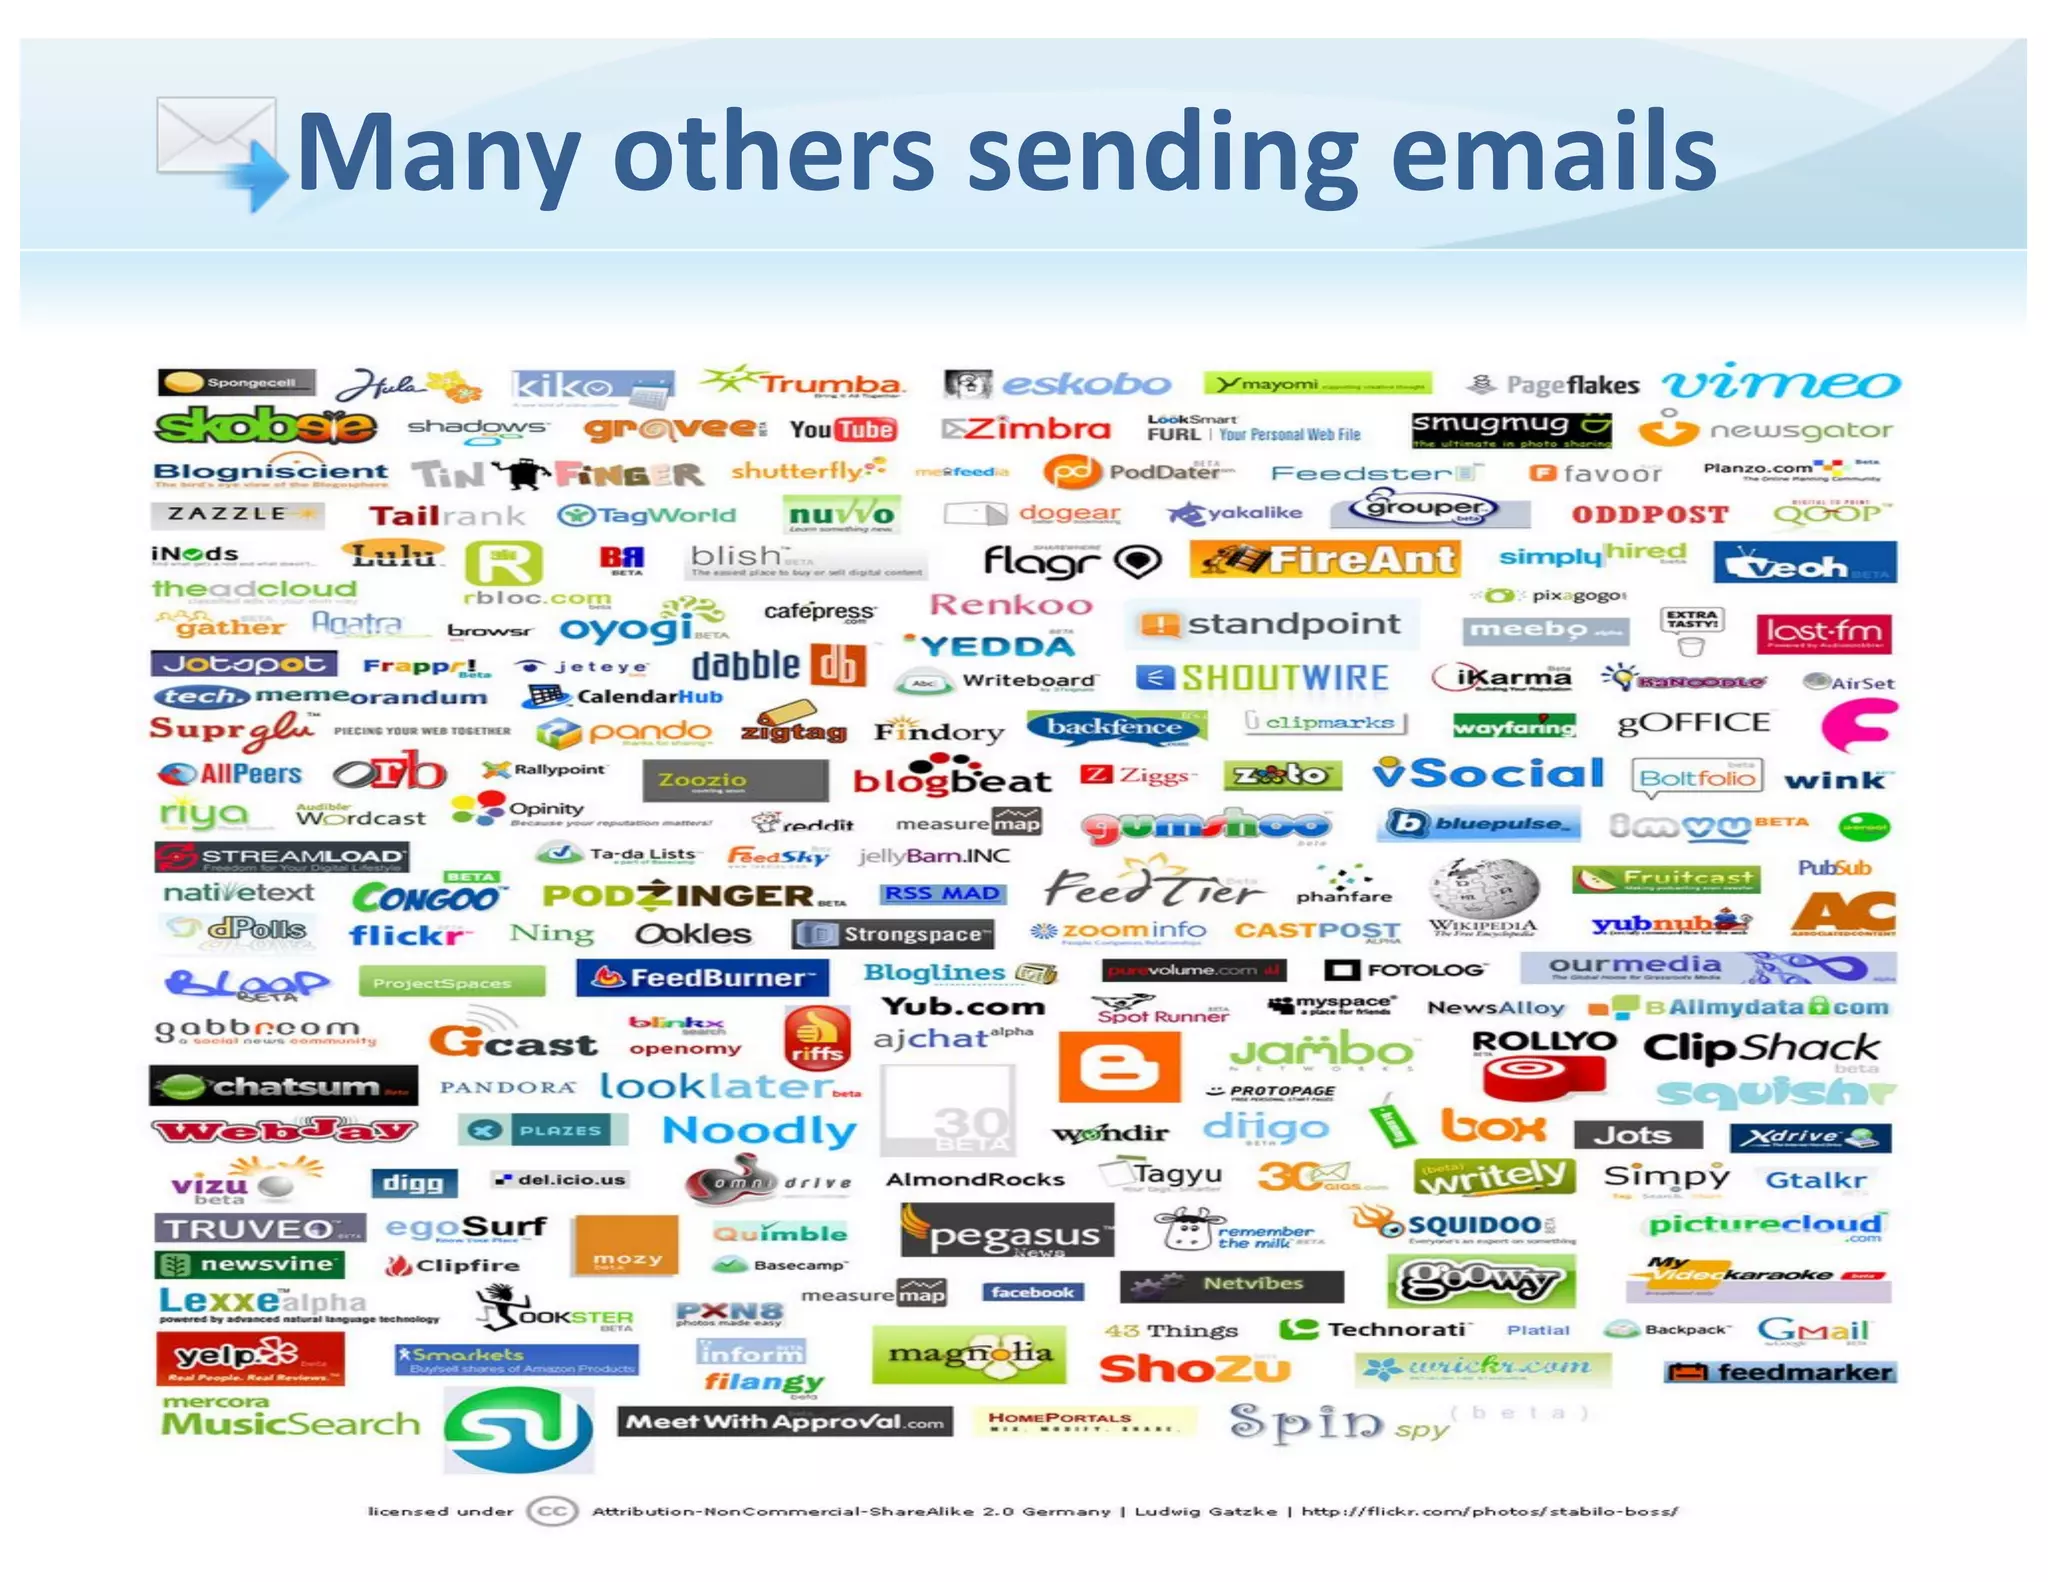
  • Slide 21: Many third-party services and apps send email — signalling broad TAM and many potential customers (platforms, hosting companies, SaaS apps).
  • Implication: the deck claims a very large volume (hundreds of millions daily) and a broad customer base (platforms, apps, hosters) — implying a large TAM for transactional email delivery services.

No formal TAM/SAM/SOM breakdown beyond the above figures; the presentation uses daily message volumes to imply scale. Investors would expect a clearer revenue-side TAM (dollars) rather than only message counts.


Business Model

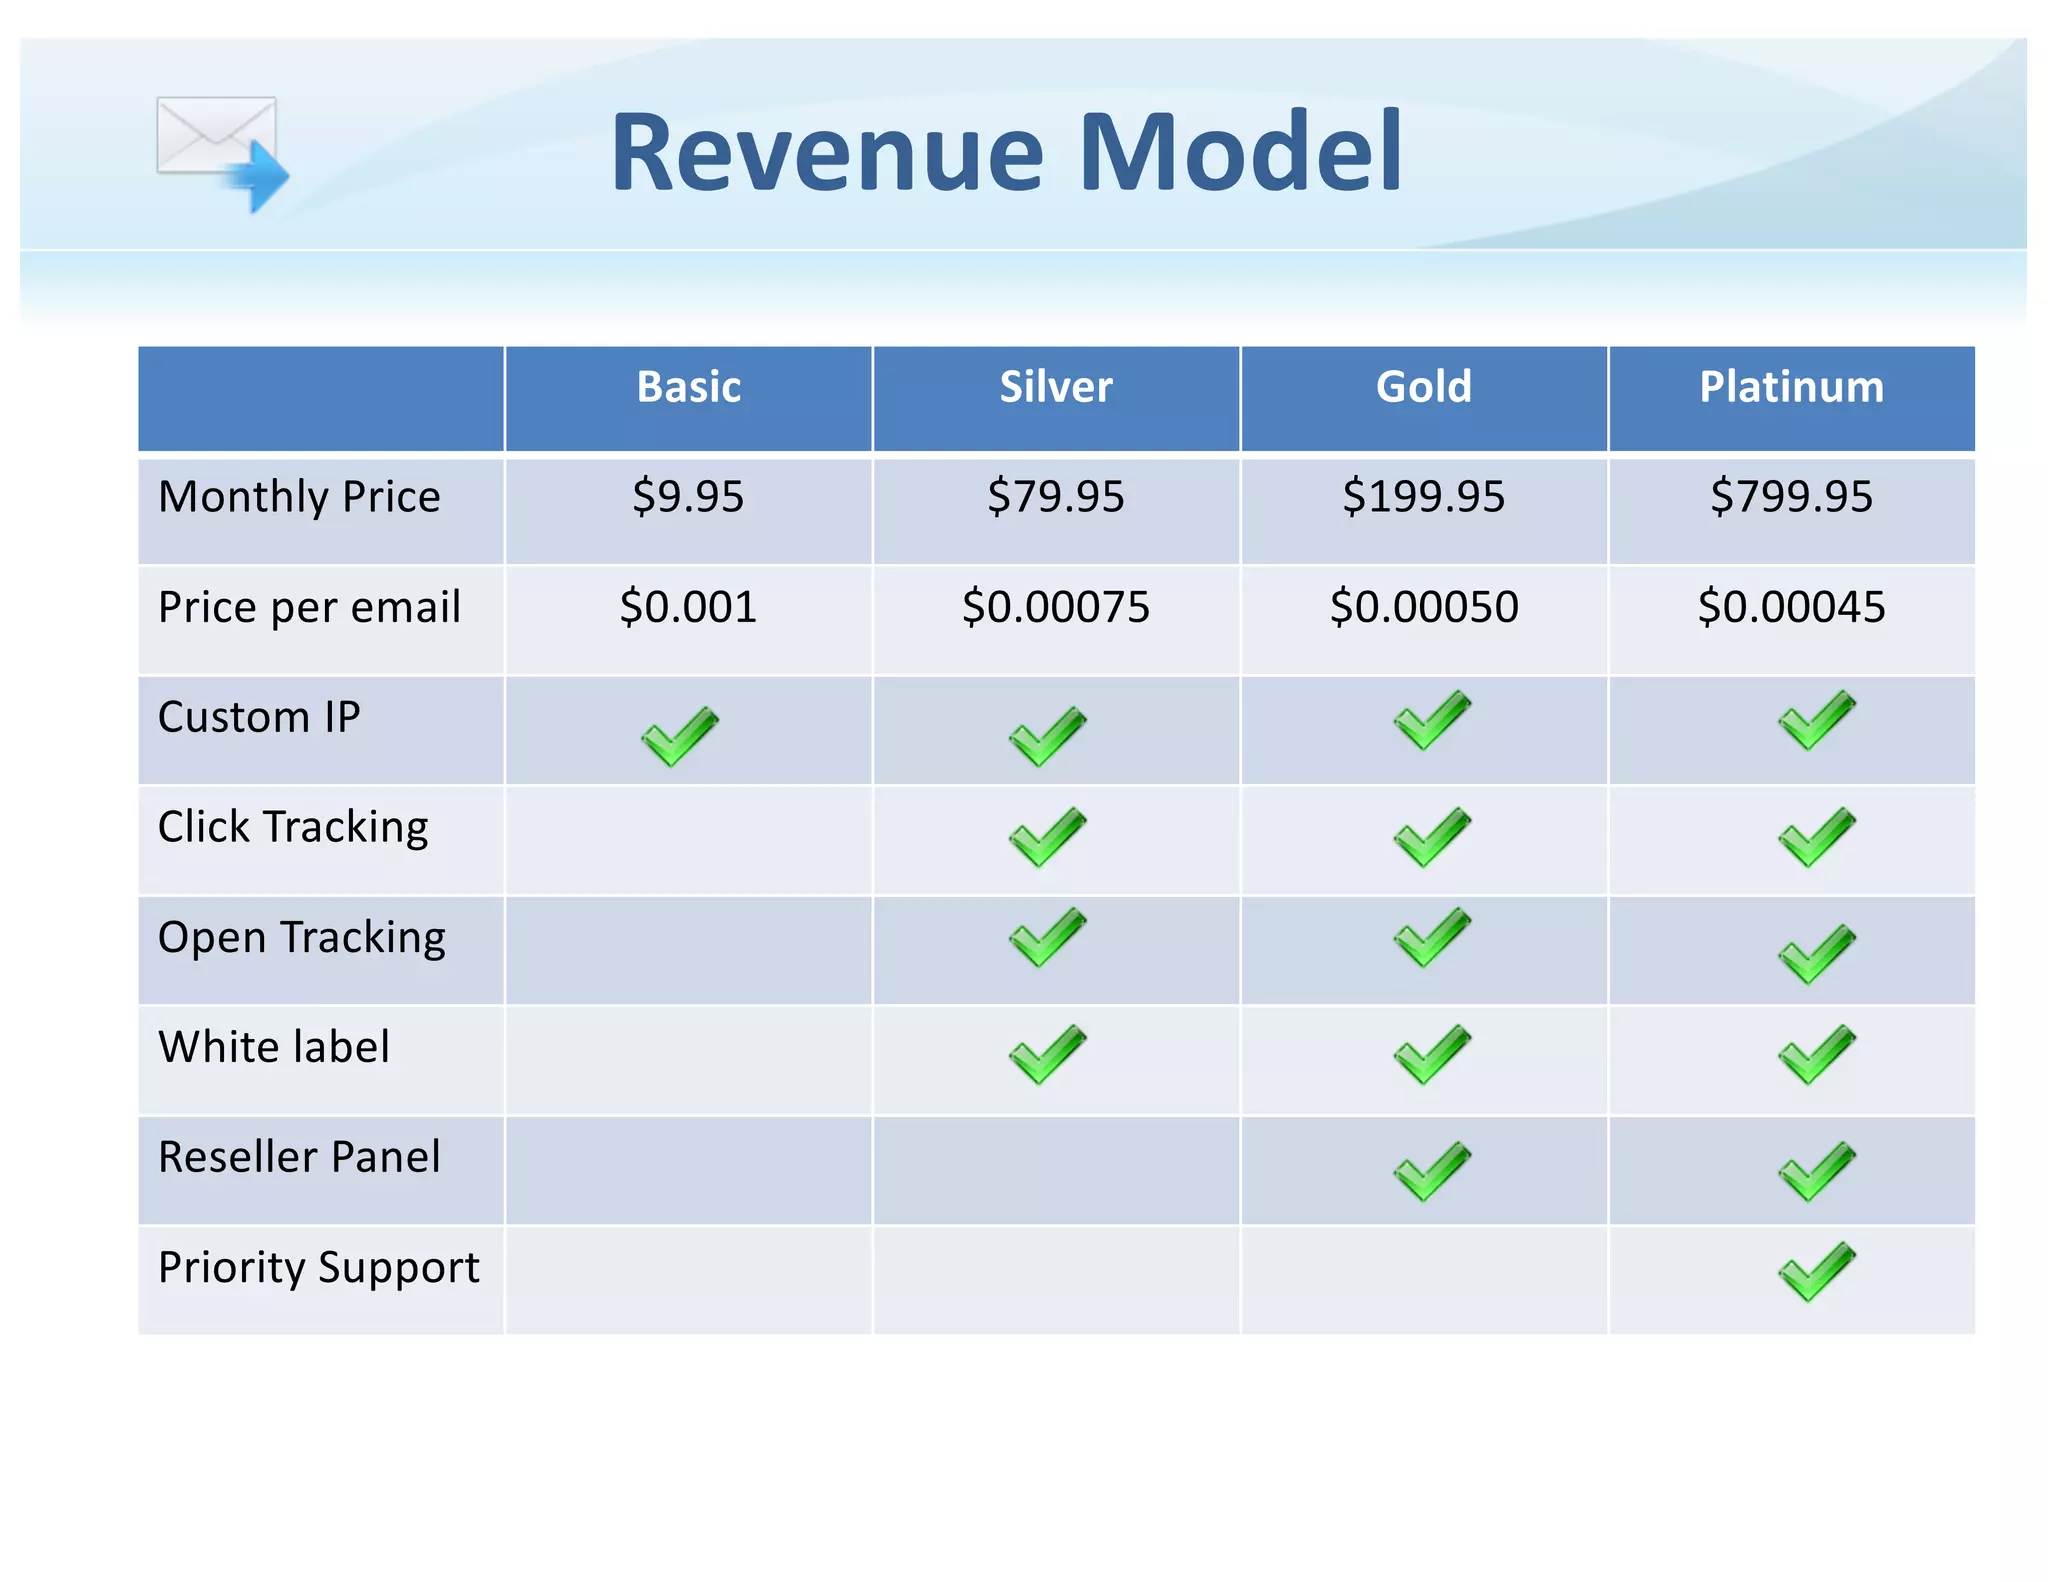
  • Slide 23 (Revenue Model): Subscription tiering + per-email pricing:
    • Monthly plans: Basic $9.95, Silver $79.95, Gold $199.95, Platinum $799.95.
    • Price per email shown: Basic $0.001, Silver $0.00075, Gold $0.00050, Platinum $0.00045.
    • Higher tiers add features: custom IP, click/open tracking, white label, reseller panel, priority support.
  • Unit economics visible: per-email cost decreases with higher tier (volume pricing); custom IP and premium features drive upsell.
  • Revenue drivers: monthly subscriptions, usage (per-email) fees, higher-priced enterprise tiers with premium features.

Traction & Metrics

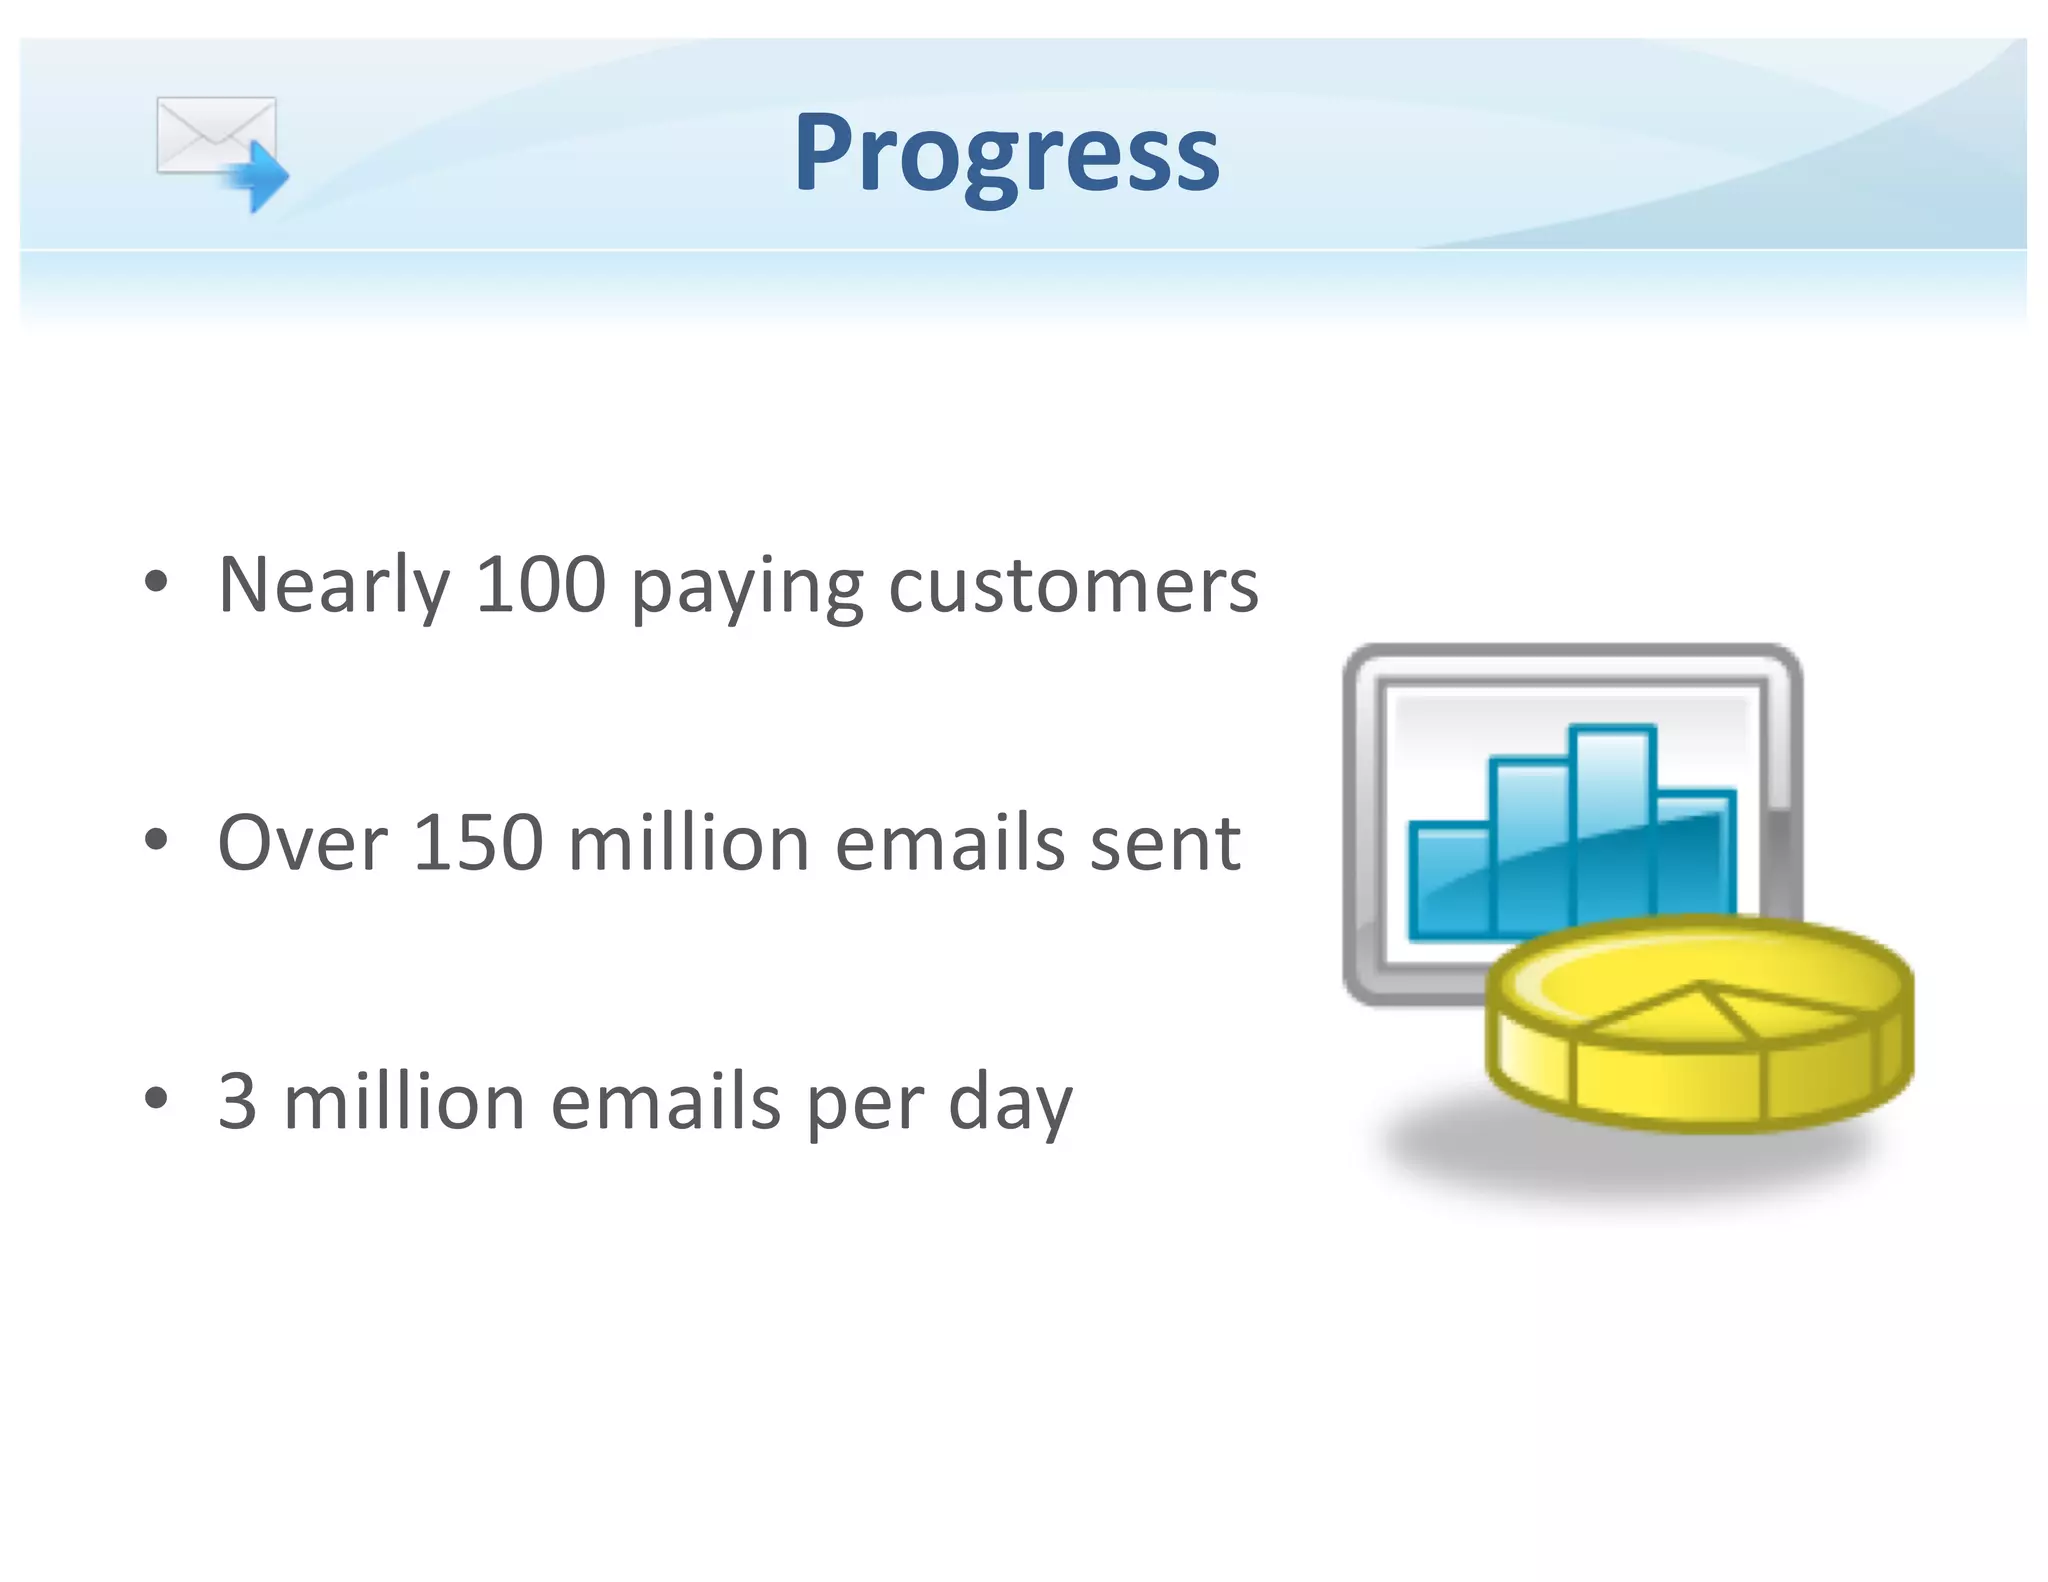
  • Slide 25 (Progress / Traction): Key proof points shown:
    • “Nearly 100 paying customers”
    • “Over 150 million emails sent”
    • “3 million emails per day”
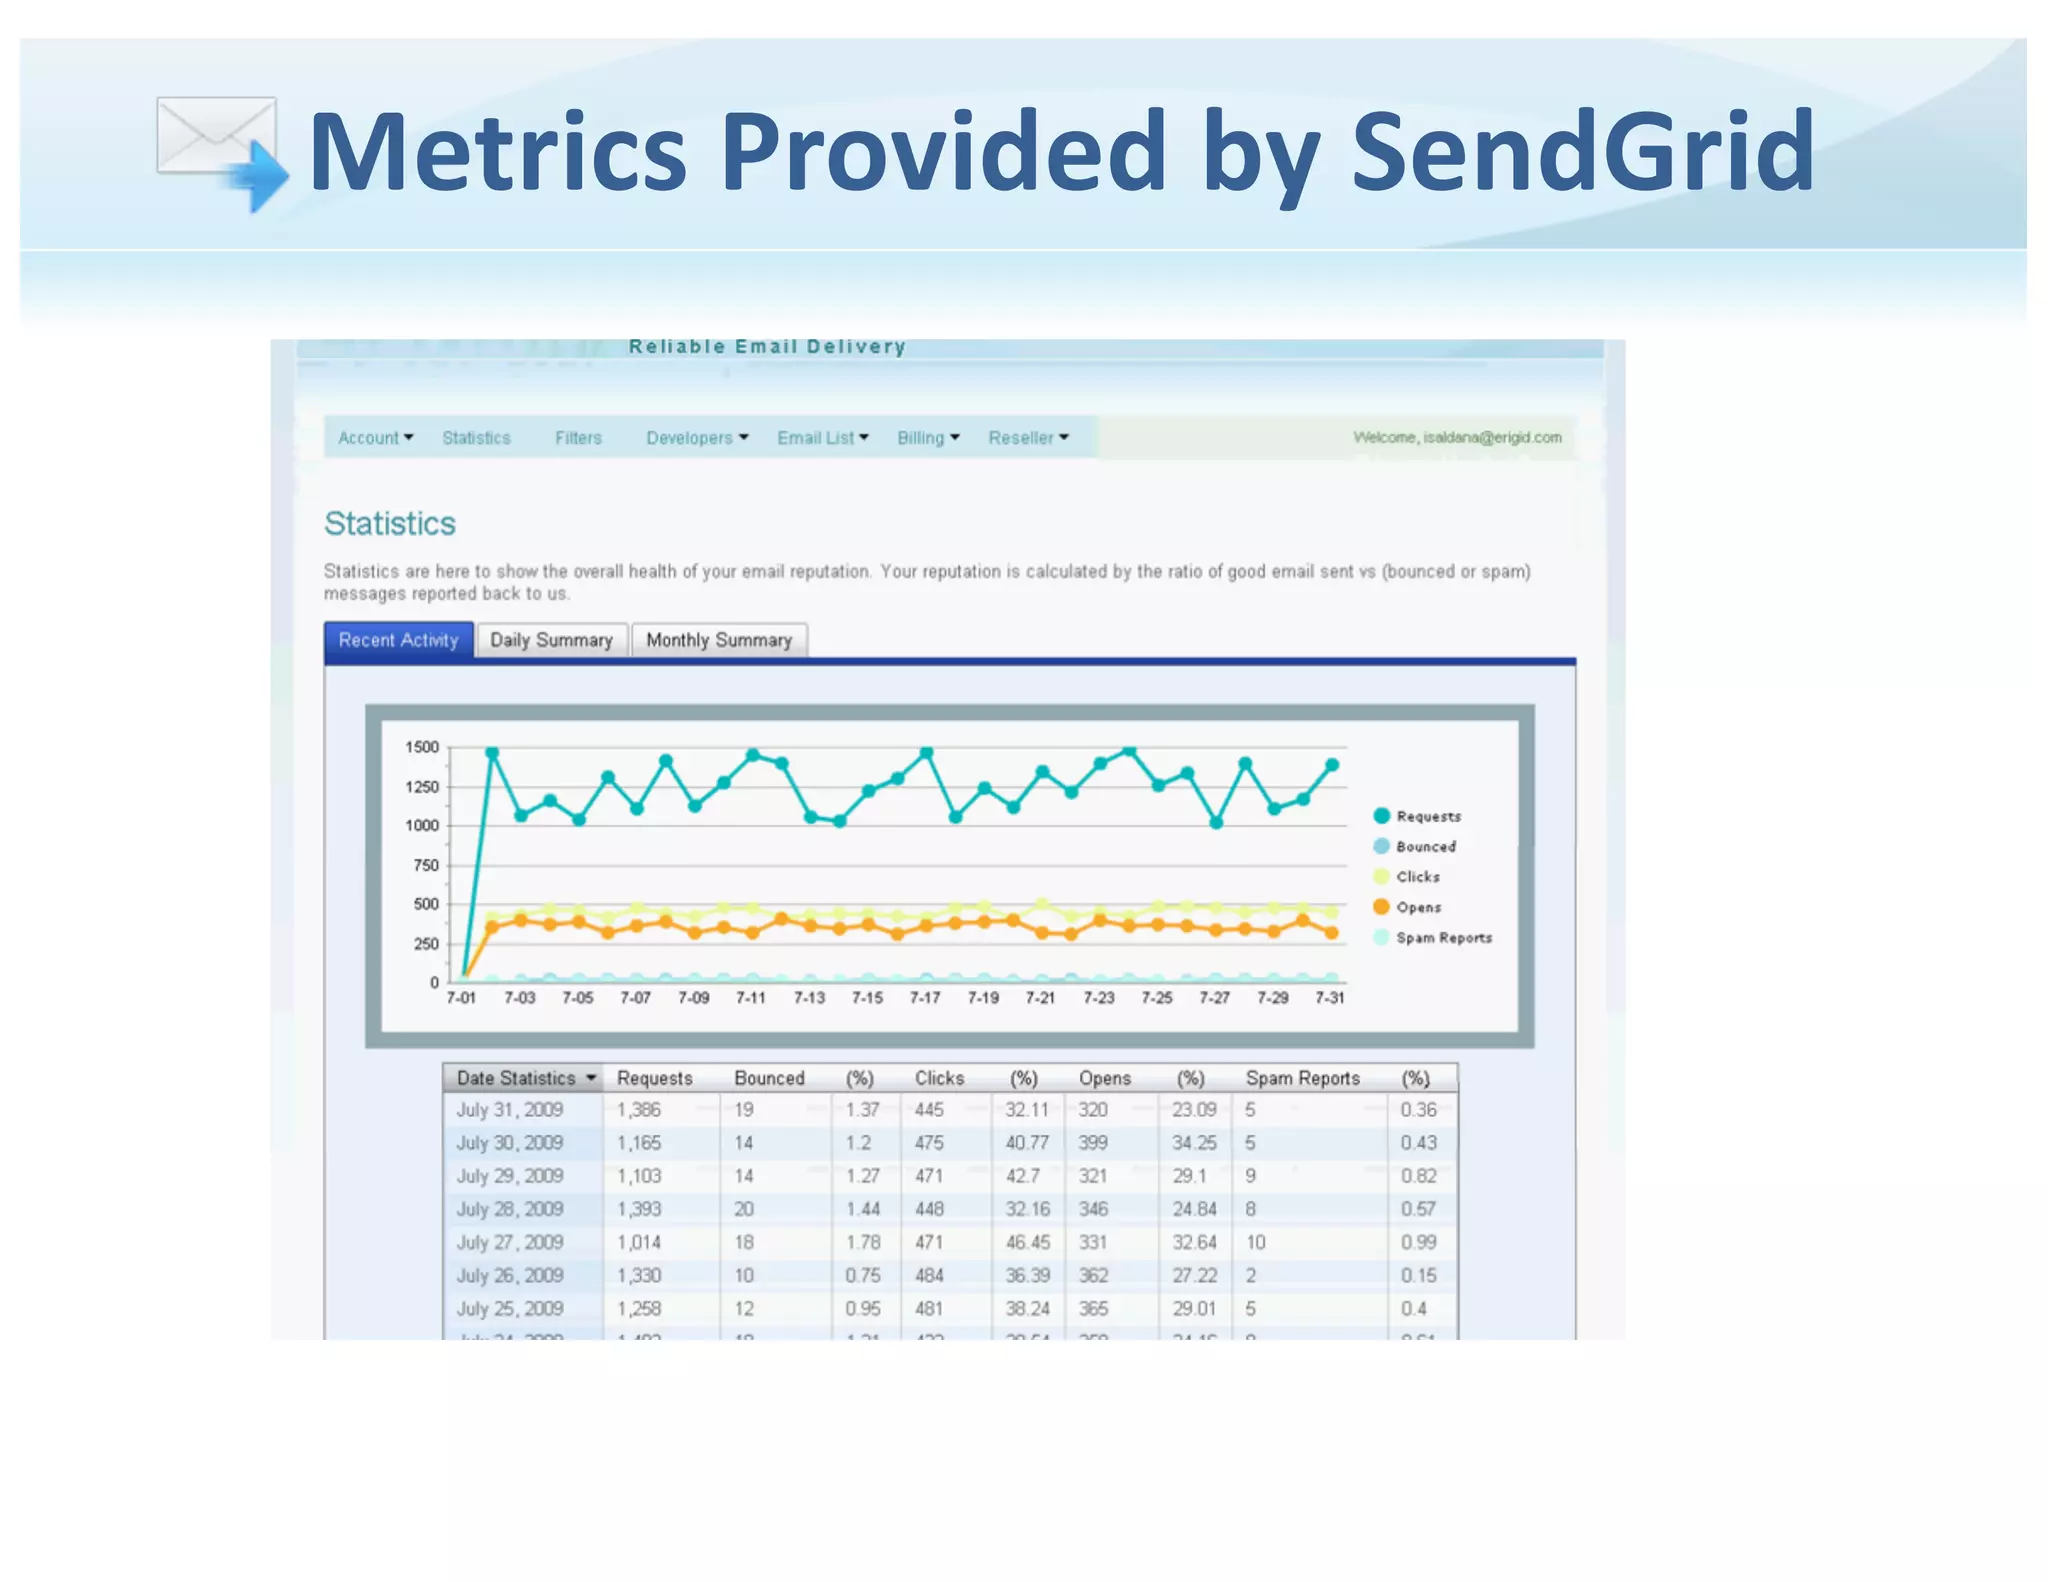
  • Slide 14 (Metrics Provided): Dashboard screenshot shows requests, bounces, clicks, opens, and spam reports — indicating the product tracks engagement and health.
  • Slide 11 (Deliverability claim): “On average users increase 20% deliverability by using SendGrid” — a performance claim (but needs backing data/methodology).

These are solid early-stage traction signals: paying customers, meaningful message volume, and an operational metric (deliverability improvement claim). Missing: ARR/MRR numbers, churn, LTV/CAC, precise revenue to support credibility of ARR growth.


Competitive Positioning

How they differentiate:

  • Core differentiation is deliverability expertise and execution: deliverability monitoring, authentication (SPF, DKIM), ISP relations, feedback loops, and handling of bounces — framed as an “expert system” (Slide 11).
  • Product differentiators (Slides 17–18): Filters, tracking, template/branding capabilities, ease of integration.
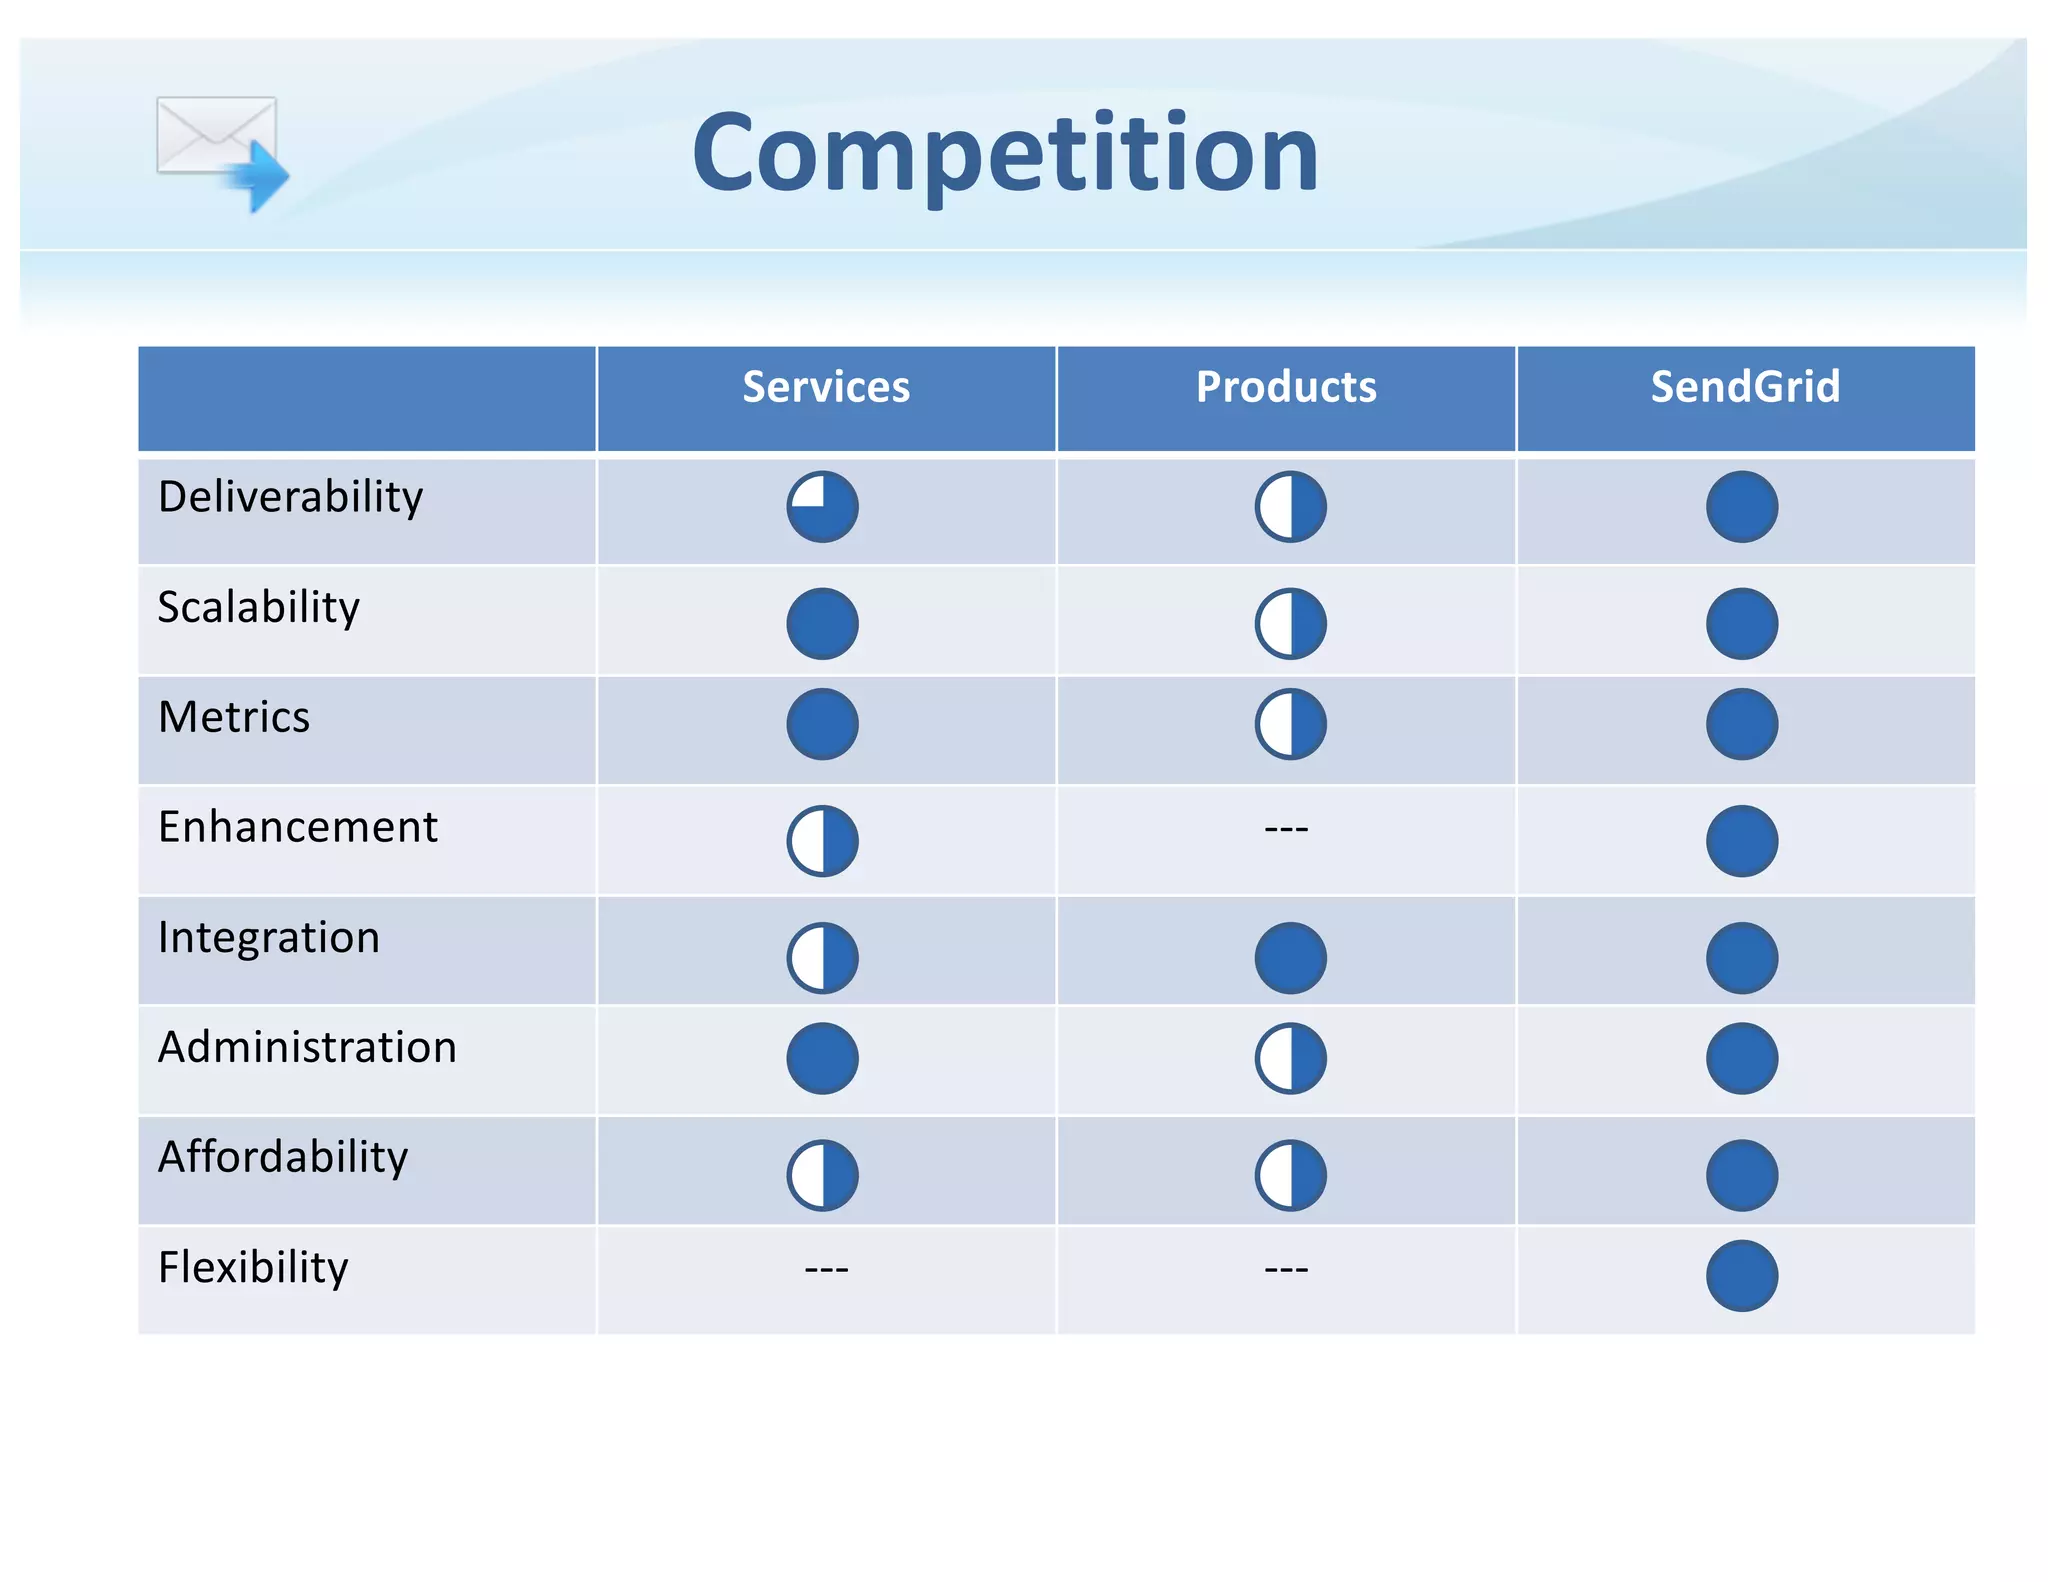
  • Competitive matrix (Slide 22): Compares Services vs Products vs SendGrid across dimensions — SendGrid shows strong across Deliverability, Scalability, Metrics, Enhancement, Integration, Administration, Affordability, Flexibility.
  • Market context (Slides 19–21): Positioning as the specialized transactional provider in a space where marketing/e-mail tools exist but lack transactional focus.

Team

  • Slide 1 lists team names: Isaac Saldana, Jose Lopez, Tim Jenkins, Kyle Kermgard (presenters/lead team).
  • No extended bios shown in the 26 slides (no explicit prior exits / domain backgrounds presented). The presence of names and an identifiable CEO is helpful, but the deck lacks CV-level credibility detail (no LinkedIn highlights, years of email/ISP experience, or CTO engineering bios).

Go-to-Market Strategy

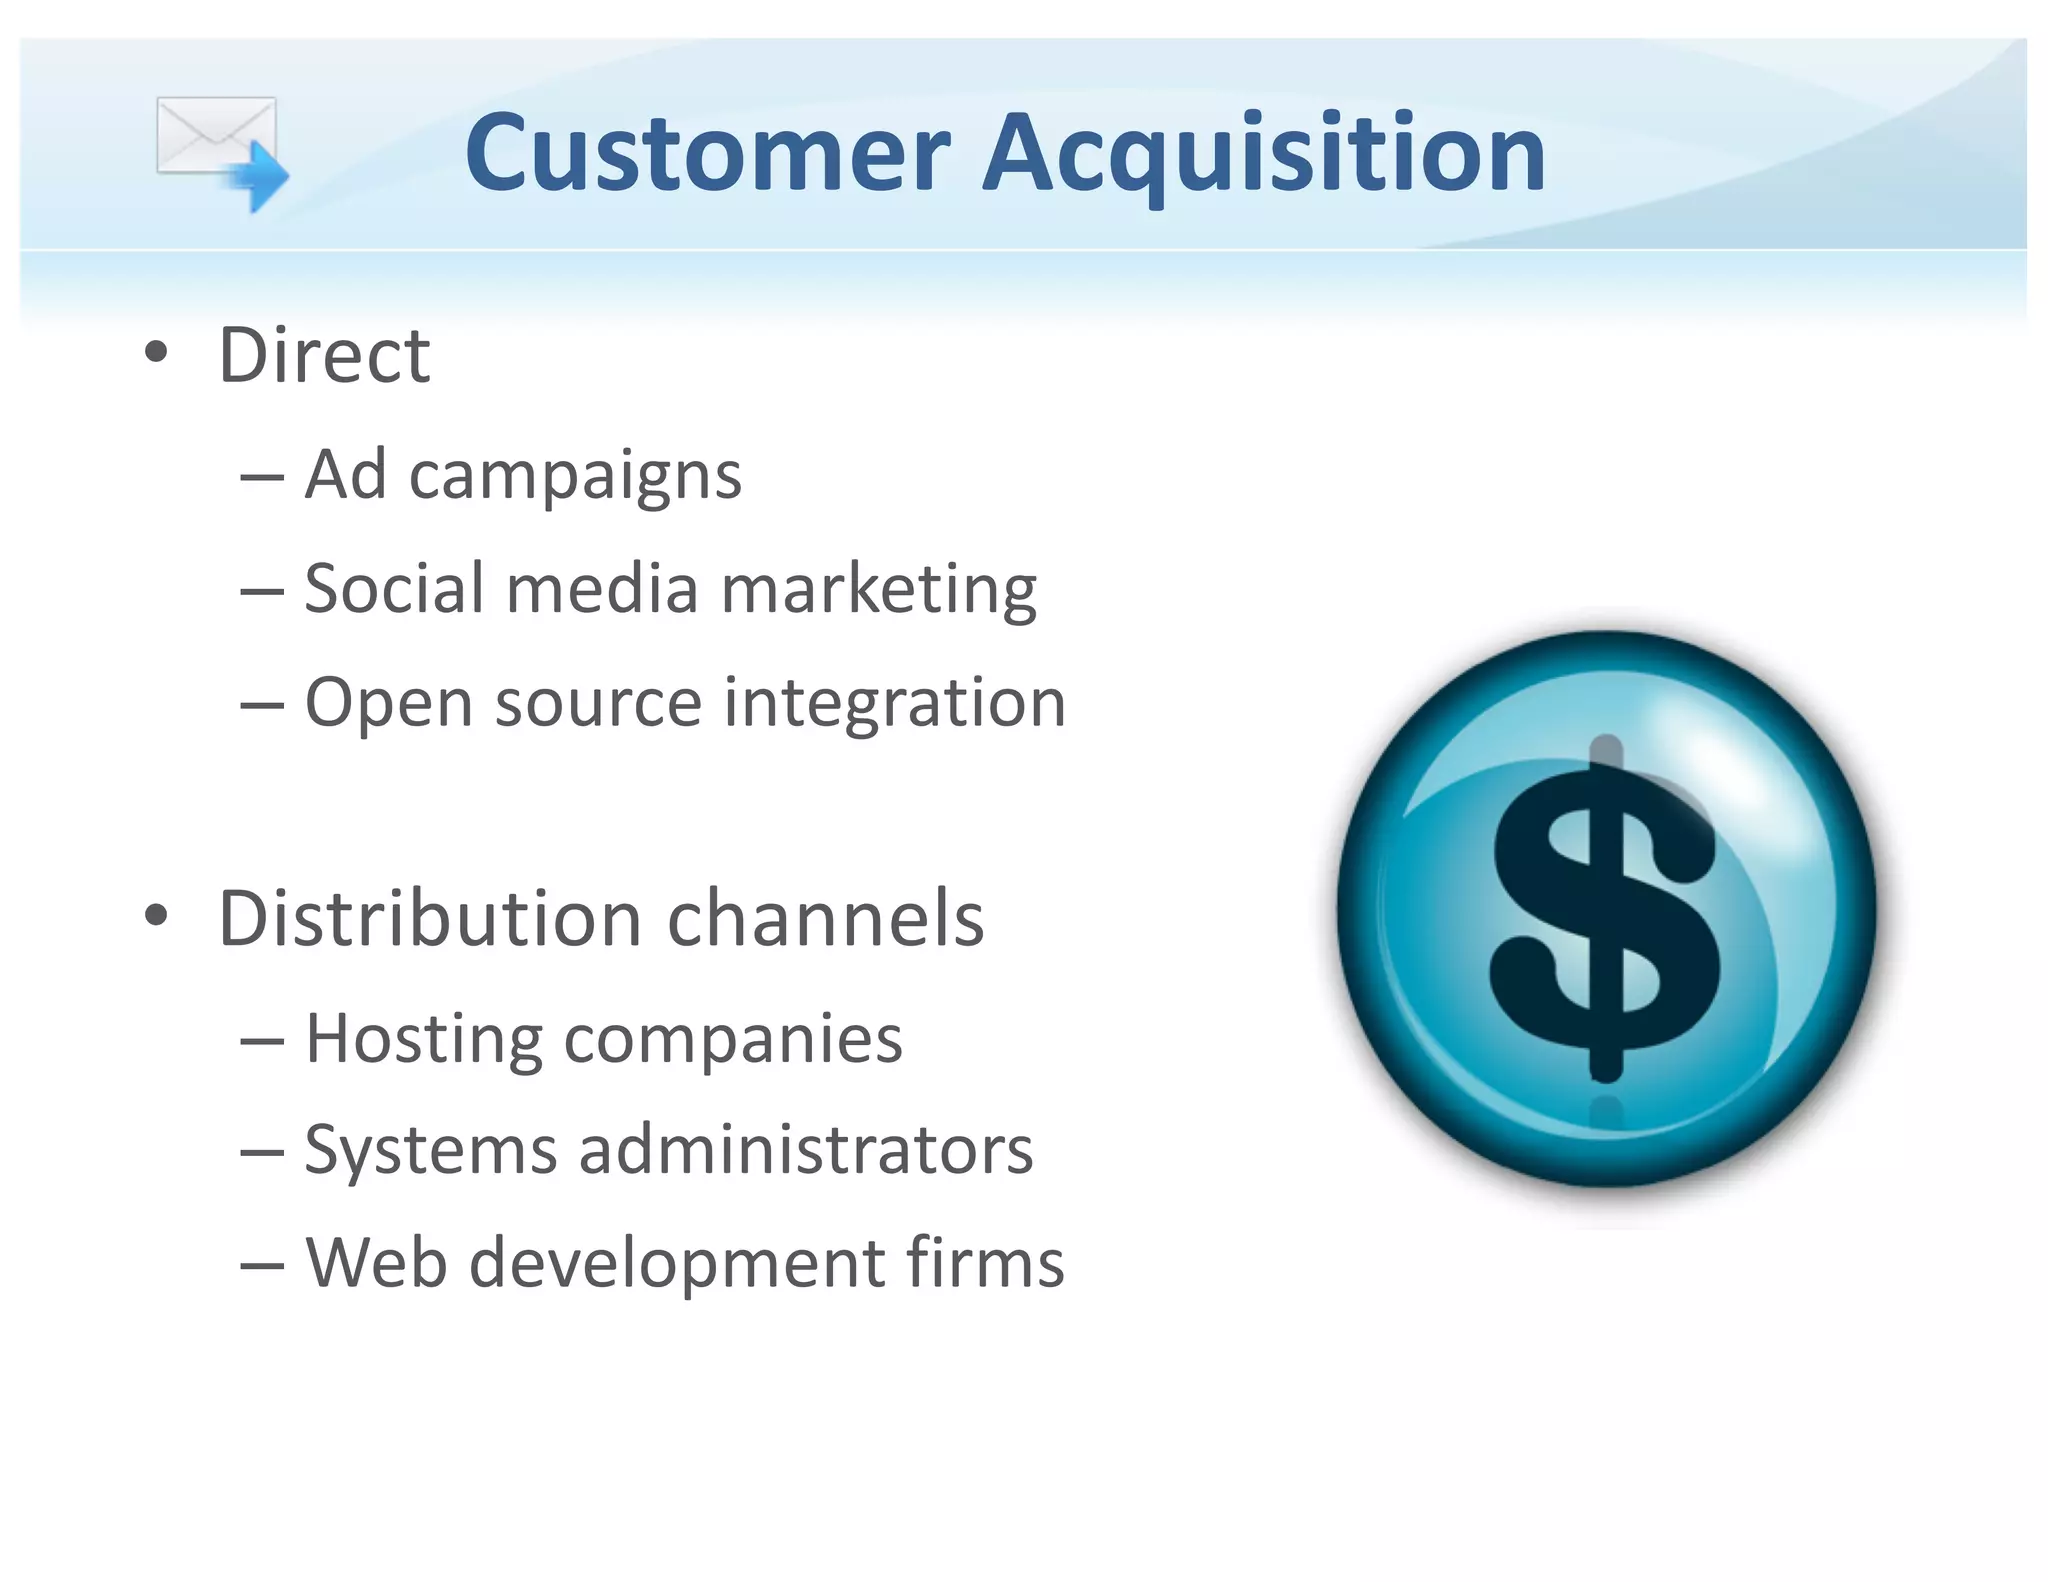
  • Slide 24 (Customer Acquisition) outlines:
    • Direct: Ad campaigns, social media marketing, open source integration.
    • Distribution channels: Hosting companies, systems administrators, web development firms.
  • Slide 21 implies inbound via integrations and broad platform partnerships (many logos).
  • Overall GTM mixes direct online acquisition + channel partnerships (resellers/hosters) + developer integrations.

Missing: conversion funnel metrics (trial-to-paid), CAC estimates, and examples of early channel partnerships or customer case studies.


The Ask

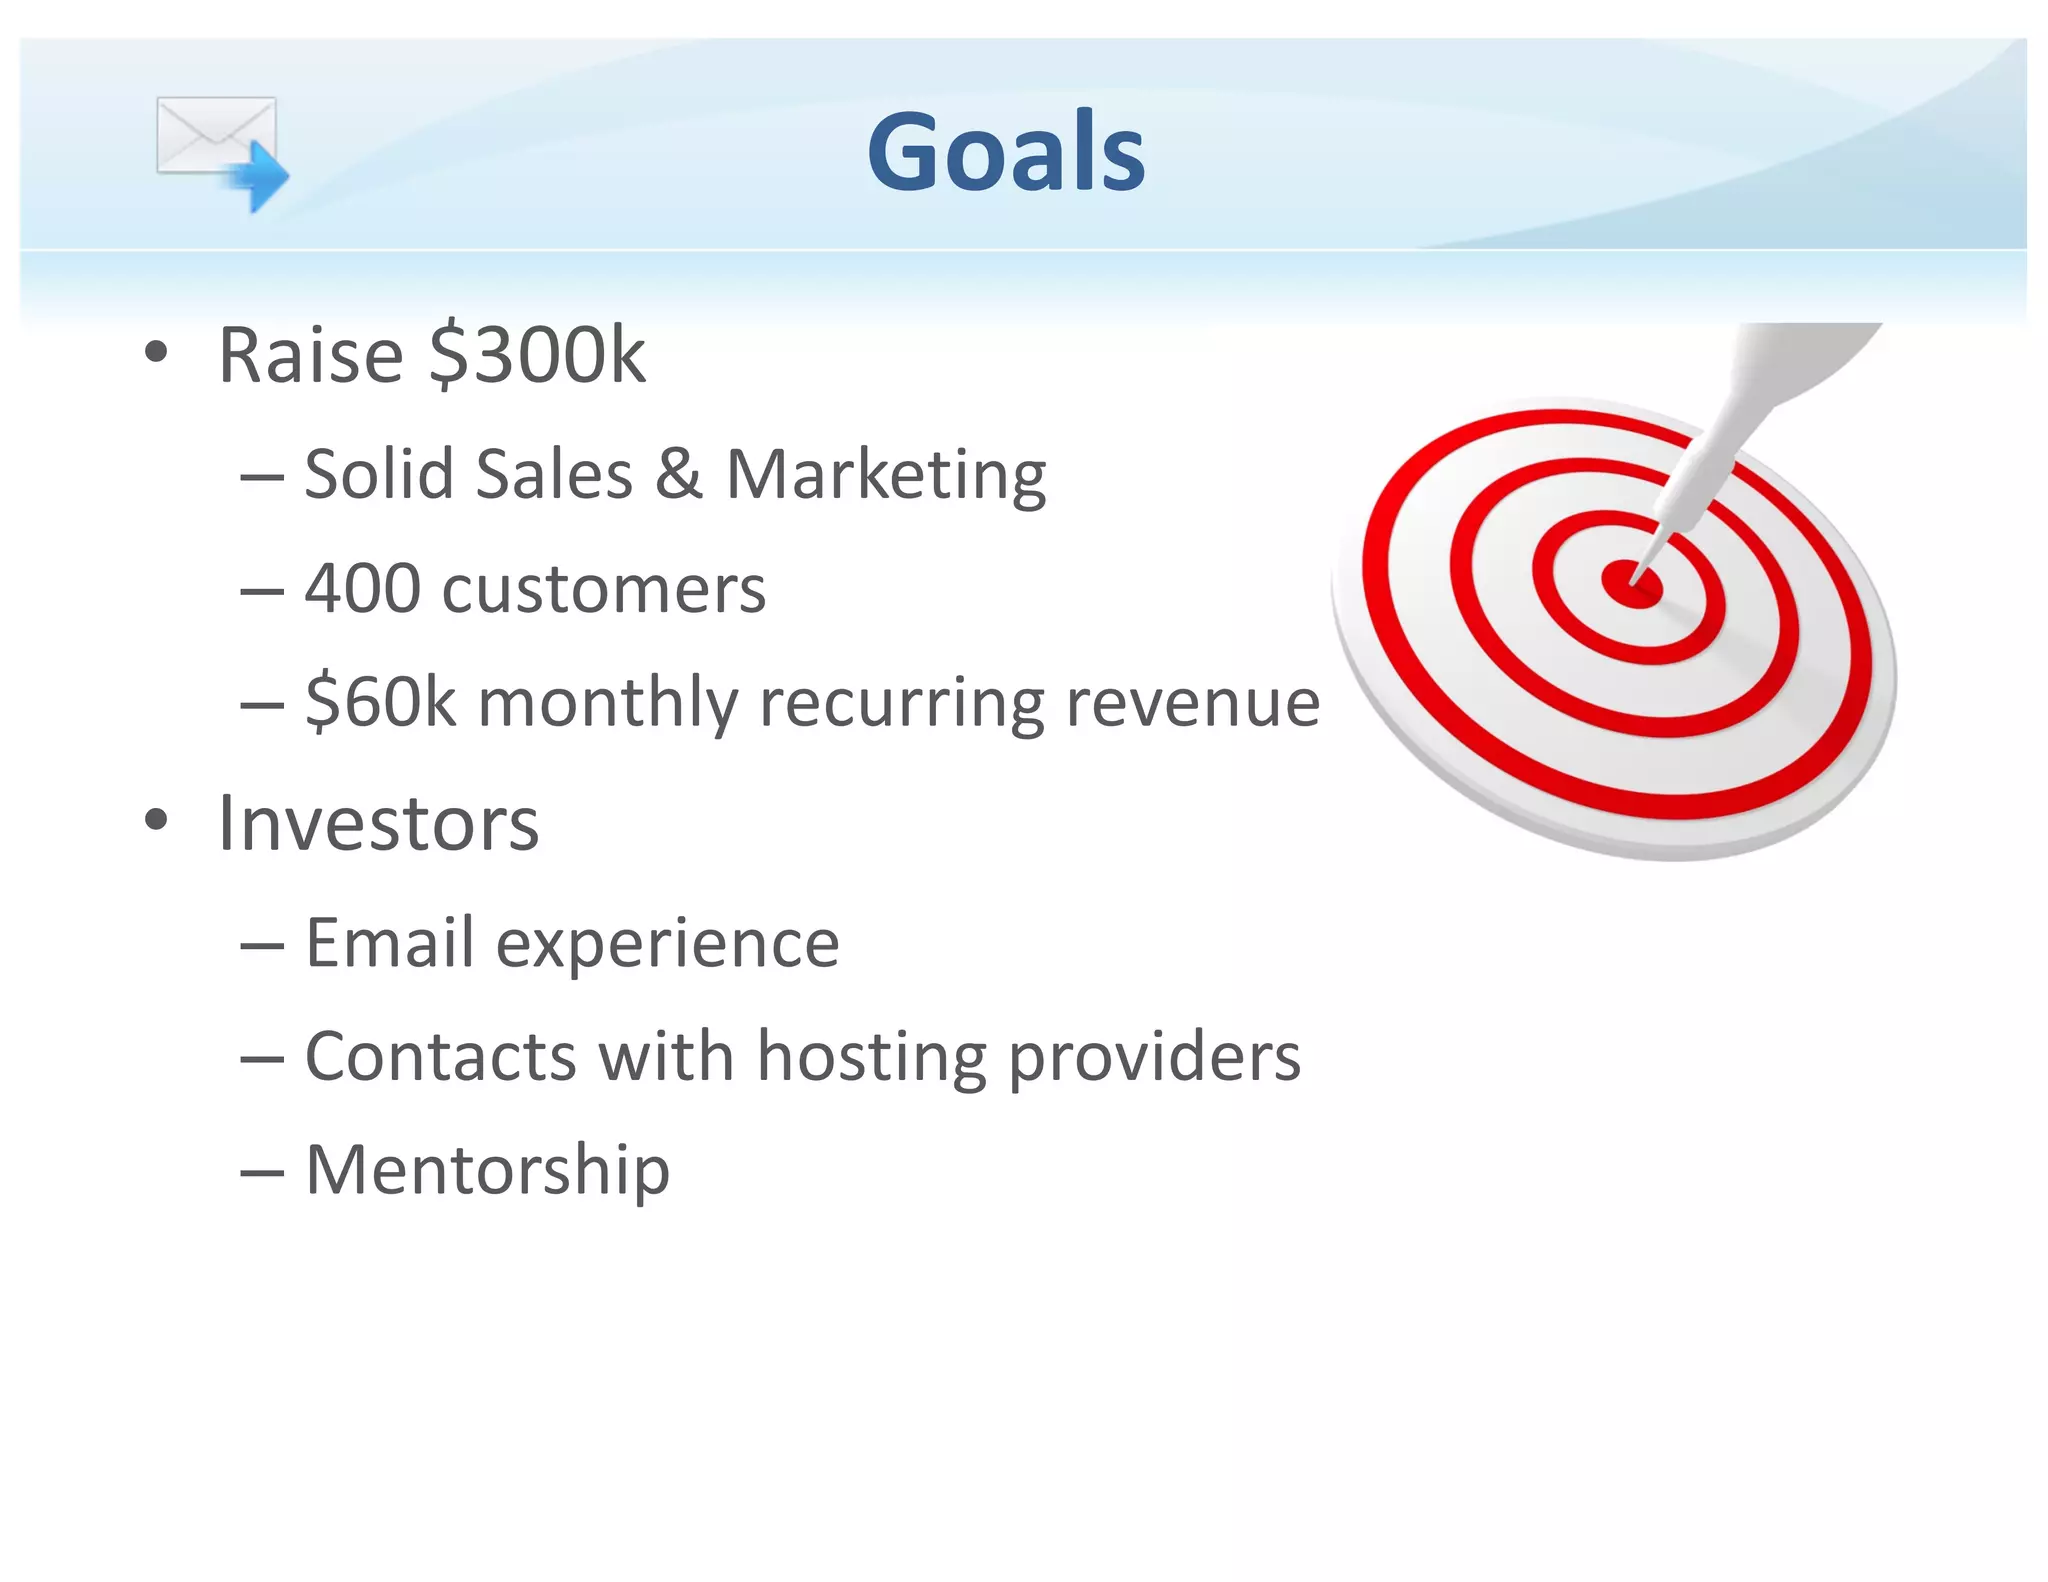
  • Slide 25 (Goals) explicitly states: “Raise $300k”
    • Use of funds: “Solid Sales & Marketing”, target: 400 customers, $60k monthly recurring revenue.
  • Note: your context said CloudAcademy Seed was $3M (2015). The shown deck (SendGrid-style) requests $300k. These differ — be explicit with investors about which number applies.

Investor Deep Dive

Executive summary, strengths & red flags

Executive Summary

This deck frames a clear operational problem for product teams and web services: transactional emails (friend requests, shipping alerts, notifications) are mission-critical but difficult to deliver reliably and at scale. The solution is a hosted, cloud-based transactional email platform that solves deliverability, scalability, and monitoring (deliverability features, filters, analytics). The deck is notable for concrete market sizing and clear pricing tiers plus early traction figures.

Key Strengths

3 identified

1

Clear problem + real, costly examples (slides 3–9) — connects operational email failures to revenue loss with an eBay example, making the pain immediate and actionable.

2

Concrete product/feature set tailored to the problem (slides 11, 17–18, 12) — deliverability mechanics, monitoring dashboard, and developer-friendly integrations are convincing for technical buyers.

3

Early traction and measurable results (slides 14, 25) — paying customers, 150M+ emails sent, 3M/day, and claimed +20% deliverability lift are strong early indicators.

Red Flags & Weaknesses

3 identified

1

Financial detail gap — no ARR/MRR, no CAC/LTV, no unit economics beyond per-email prices. Investors need revenue run-rate and economics to model returns.

2

Team depth / bios lacking — slide deck lists names but does not spell out founders’ track records, domain credibility, or hiring needs (especially product/ops to manage deliverability relationships).

3

Market sizing is message-volume centric, not revenue-centric — the deck shows “600M/day transactional” but does not translate to addressable dollar TAM/SAM/SOM or realistic go-to-market penetration assumptions.

More Pitch Decks To Study

Compare structure, fundraising context, and investor-facing story across similar startup decks.