Compare your deck to Chargebee

Compare Your Deck

Chargebee Pitch Deck (2012)

SaaS
Stage: Seed
Raised: $370K
Year: 2012
Slides: 10
Outcome: Valued at $3.5B after Series G (2022)

Pitch Deck

1 / 10
Chargebee pitch deck - The Opening: Establishing urgency and context
Click to expand

Deck Analysis

This is an early seed pitch deck from Chargebee (2012) that frames the business around enabling companies to adapt their business models in an era of fast, exponential change. The deck opens with a broad market context, narrows to a simple framework for adaptability, then connects that strategy to product capabilities, proof points, and short case studies. Notable because it communicates a clear problem (rapid change), a differentiated value proposition (billing + experimentation for subscription models), and pairs that with tangible customer outcomes — a pattern that likely helped the company raise a small seed and scale to a multi-billion valuation.

The Opening: Establishing urgency and context

The Opening: Establishing urgency and context

Slide 1 (slide_01.jpg) uses a strong visual and a short, punchy headline: "Yesterday was NOTHING like today" followed by "So how can businesses be READY FOR TOMORROW?" The split-screen image (cityscape vs. reflective grid) visually contrasts old and new worlds and immediately sets an emotional tone of disruption. This is effective because it quickly orients investors to a strategic problem rather than a product-level feature set — it promises a high-level thesis worth listening to.

Founders can learn from this direct framing: start by articulating the macro trend and the urgency it creates. Keep the slide visually simple, use bold typography for the key claim, and finish with a single, explicit question that primes the audience for the solution you’ll present next.

Key Takeaway: Lead with a concise problem statement that creates urgency and frames your product as the necessary response.
Market validation through disruption examples

Market validation through disruption examples

Slide 2 (slide_02.jpg) translates the opening thesis into concrete disruption examples — TV -> Netflix, Taxi -> Uber, Superstore -> Amazon — and pairs that with a bold stat about S&P 500 turnover. This makes the abstract idea of "exponential change" tangible and familiar for investors. By aligning with well-known winners, the deck signals that the authors understand how industries can be remade and positions their solution as part of that reconfiguration.

The slide is effective because it balances a sweeping claim with recognizable evidence. Founders should emulate this by using crisp analogies and a few memorable examples to prove the change is real and not just rhetorical. Avoid clutter: a few well-chosen comparisons and one strong statistic beat a long list of generic trends.

Key Takeaway: Use a handful of iconic analogies plus a hard statistic to make broad market shifts feel concrete and urgent.
Framework: Where the product fits in the business model

Framework: Where the product fits in the business model

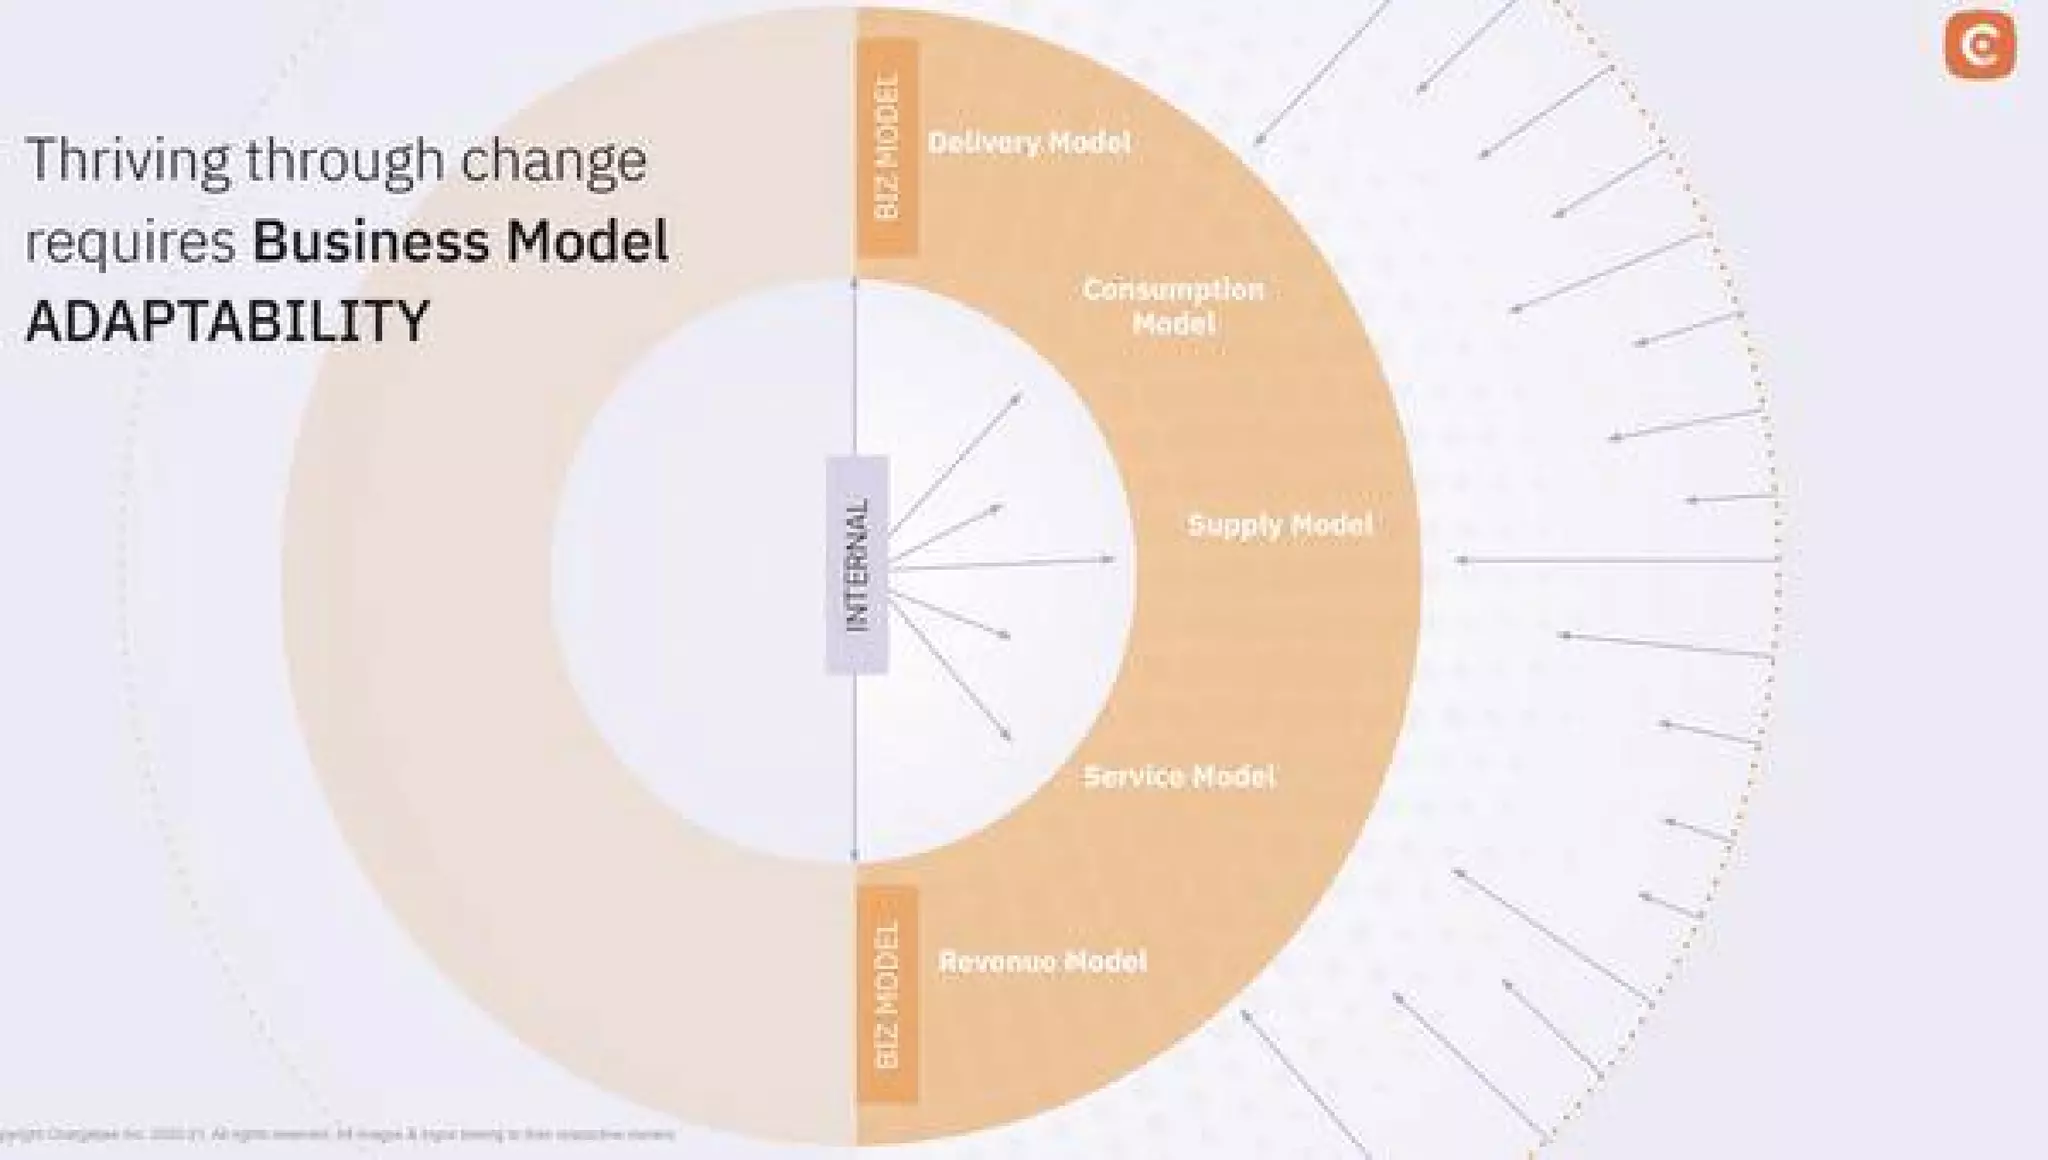
Slide 3 (slide_03.jpg) introduces a conceptual diagram that maps "internal" capabilities to external business model levers (delivery, consumption, supply, service, revenue). This visual framework elevates the conversation from feature lists to strategic levers — it shows investors the dimensions along which customers might need to adapt and implies where Chargebee can exert influence. The concentric/segmented visualization communicates complexity while still being scannable.

For founders, a framework slide like this is powerful because it frames your product’s scope and boundary conditions. It clarifies how your offering interacts with customer business models and creates a repeatable narrative for different buyer personas. When building such a slide, ensure each labeled segment maps clearly to a capability you can demonstrate later in the deck.

Key Takeaway: Present a simple framework that maps your product to the strategic levers customers care about — it turns features into business outcomes.
Product positioning: features tied to adaptability

Product positioning: features tied to adaptability

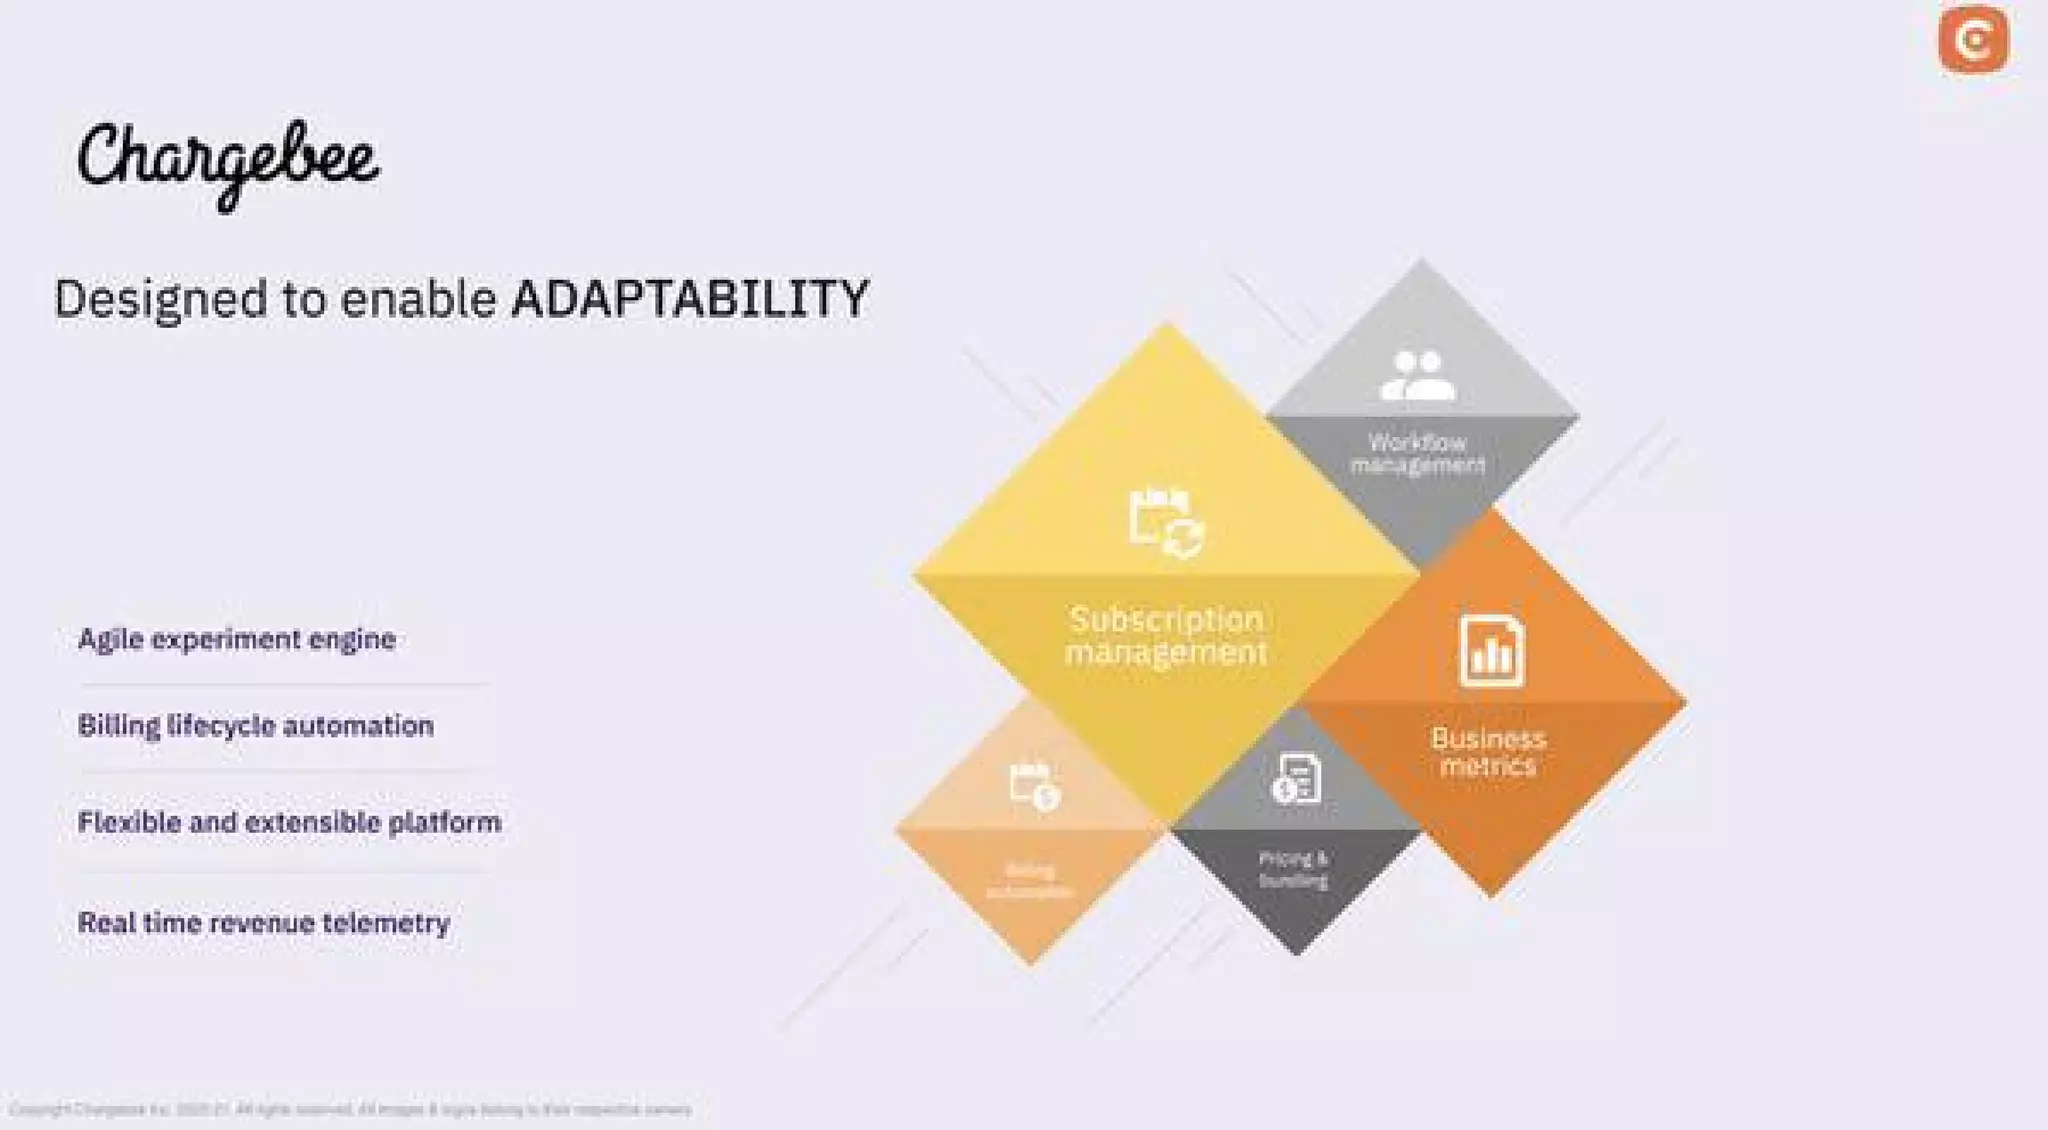
Slide 6 (slide_06.jpg) is the product/value proposition slide: "Designed to enable ADAPTABILITY" with core components (subscription management, business metrics, pricing & taxes, workflow management) and supporting bullets (agile experiment engine, billing lifecycle automation, extensible platform, real-time revenue telemetry). The visual uses diamond shapes to map capabilities and the left column ties product attributes to the adaptability thesis introduced earlier.

This slide is effective because it directly connects product functionality to the strategic problem (adaptability) rather than listing disconnected features. Founders should mirror this approach: prioritize describing how product capabilities translate into the customer’s ability to experiment and scale, and keep the language outcome-focused (e.g., "experiment engine" rather than just "A/B tests").

Key Takeaway: Tie each core feature to a specific business outcome (e.g., faster experiments, automated billing) so investors see how product enables the thesis.
Traction & social proof: metrics plus recognizable customers

Traction & social proof: metrics plus recognizable customers

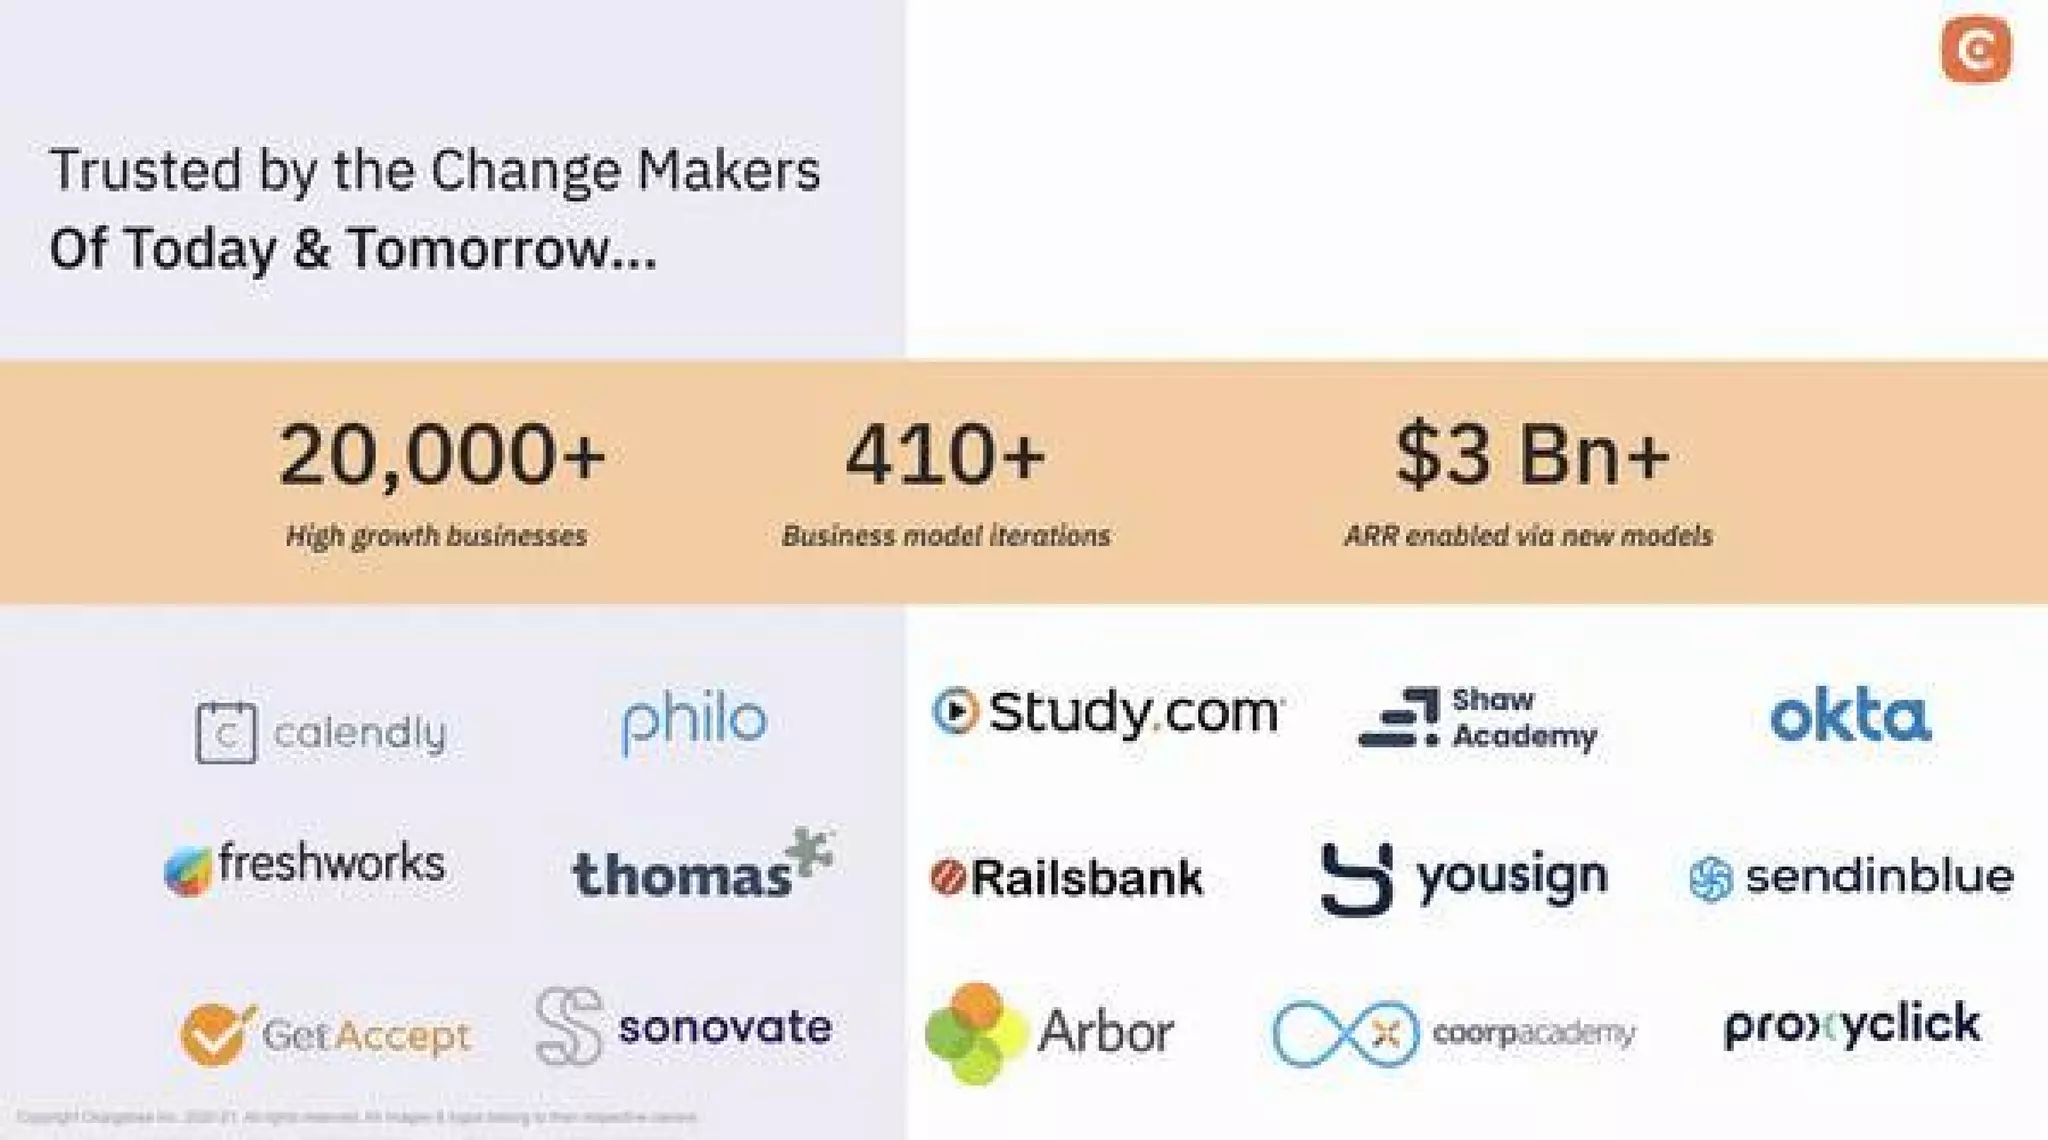
Slide 7 (slide_07.jpg) combines quantitative traction (20,000+ customers, 410+ business model iterations, $3Bn+ ARR enabled) with a grid of customer logos. This is a classic and effective one-two punch: metrics show scale and momentum, logos show market validation and credibility. The choice of metrics is smart — not just revenue or users, but a metric aligned to the product thesis (number of business model iterations) which reinforces Chargebee’s theme of adaptability.

Founders should emulate this slide by selecting a few high-leverage metrics that directly back their value proposition, and pairing them with customer logos. Be honest and specific: numbers that align to your core narrative (e.g., ARR enabled, churn reduction, time-to-launch) are more persuasive than generic vanity metrics.

Key Takeaway: Showcase 2–3 metrics that directly support your thesis and back them with credible logos to convert claims into trust.
Case studies: structured storytelling with measurable outcomes

Case studies: structured storytelling with measurable outcomes

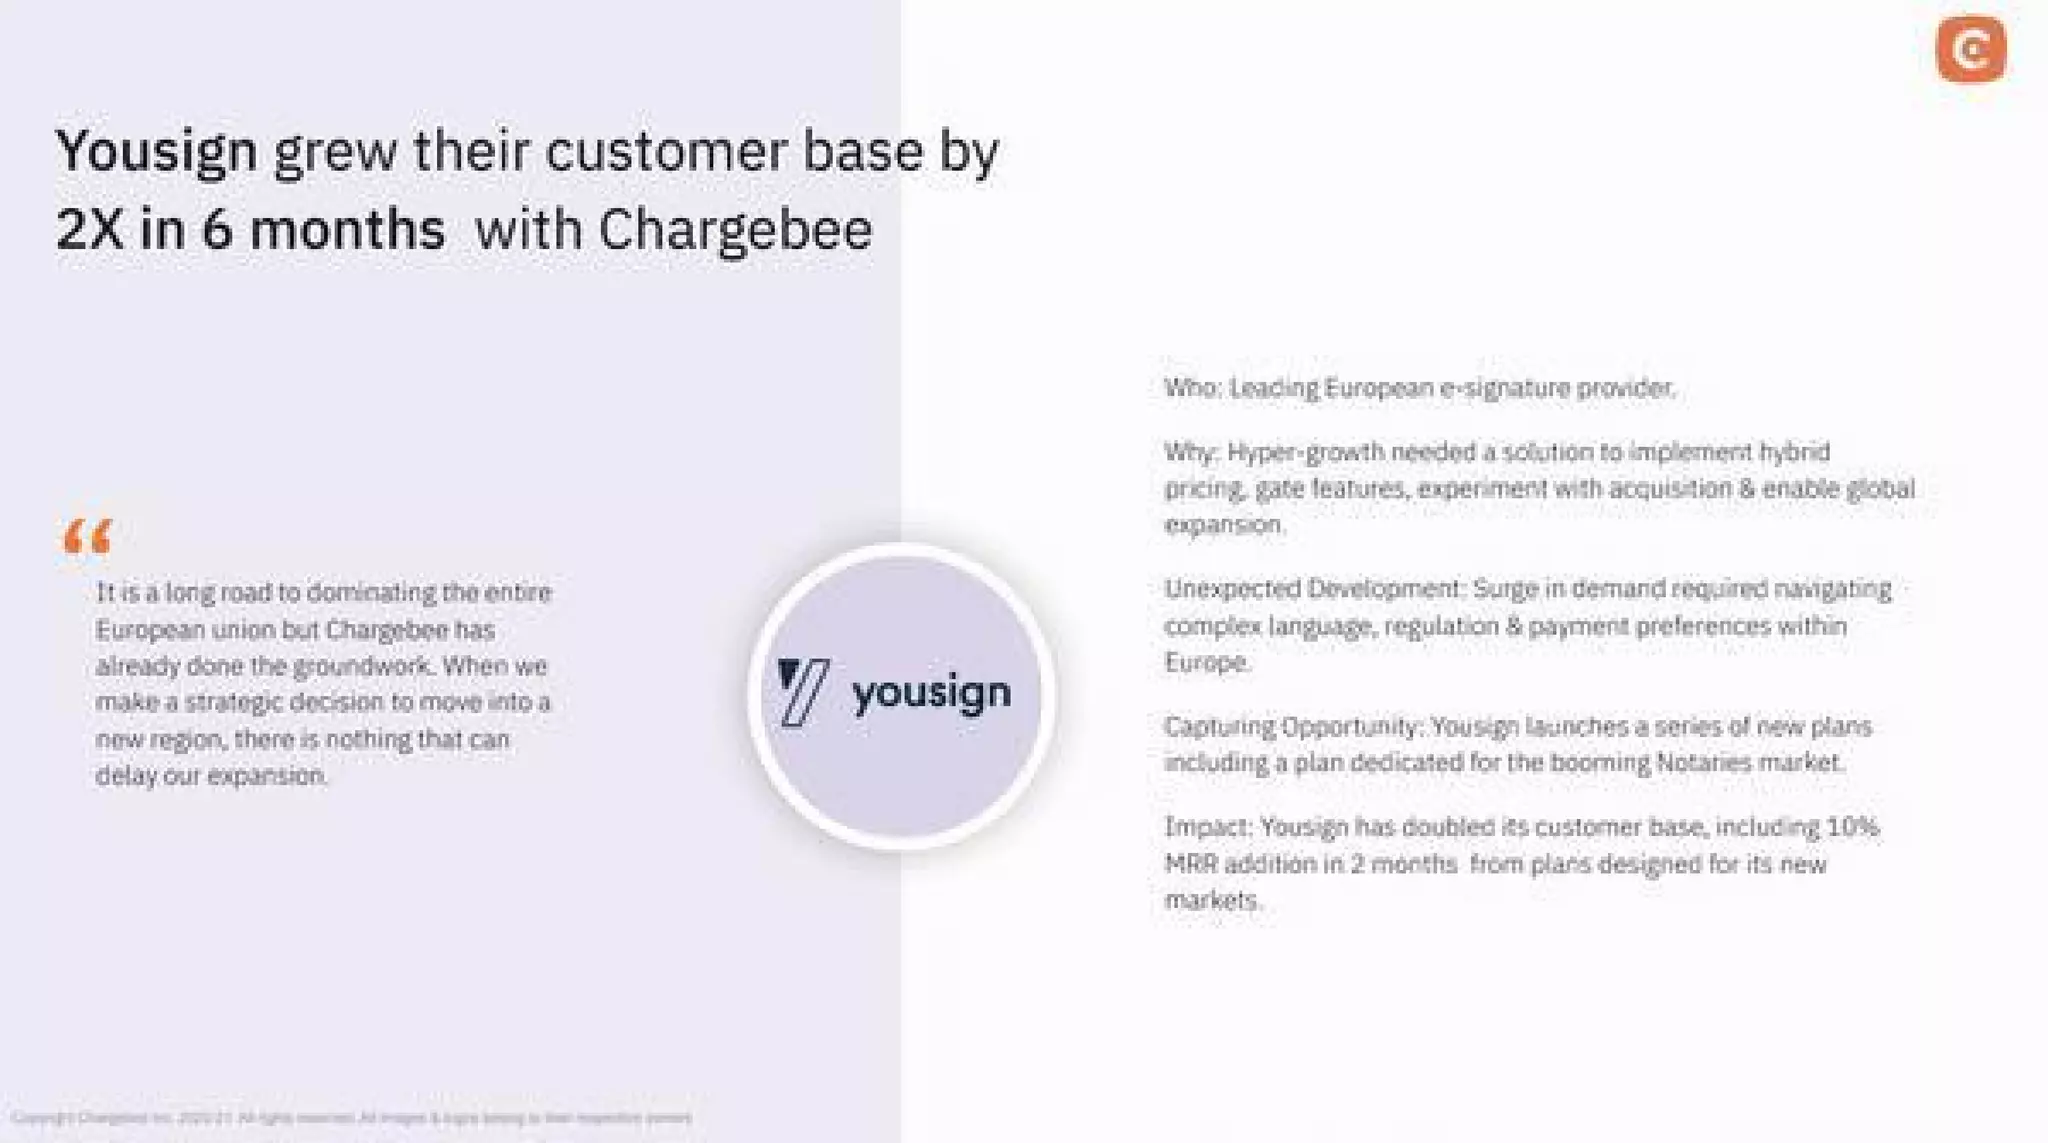
Slide 9 (slide_09.jpg) presents a compact case study (Yousign) with a structured layout: who the customer is, why they needed Chargebee, unexpected developments, how they captured the opportunity, and the measurable impact (2x customer base in 6 months). The slide also includes a short customer quote. This format makes it easy for investors to see a repeatable use case and the mechanistic connection between product and outcome.

The takeaway for founders is to use tightly structured case studies to demonstrate causality — not just that customers succeeded, but how the product enabled that success and what unexpected variables were handled. Quantify impact where possible and include a short customer quote to add authenticity.

Key Takeaway: Use short, structured case studies with clear before/after metrics and a customer quote to demonstrate repeatable impact.

Conclusion: Key Lessons

Chargebee's seed deck is a strong example of narrative-first fundraising: it establishes a broad market problem, presents a simple framework for how adaptation matters, ties that framework to product capabilities, and then validates the story with metrics and case studies. The deck balances high-level vision and tactical evidence, staying visually spare and using a few well-chosen examples and numbers to build credibility.

Actionable advice for founders: open with a clear, urgent problem; use 1–2 visuals or frameworks to show where your product sits strategically; make product features outcome-oriented; highlight a small set of metrics that directly support your thesis; and include compact case studies that show causality and measurable impact. Keep slides uncluttered and align every element to the central narrative — problem, solution, proof.

Full Deck Analysis

11 sections

Overview

Company: Chargebee
Round: Seed ($370K)
Year: 2012
Outcome: Valued at $3.5B after Series G (2022)

Executive Summary

This 10‑slide seed deck frames Chargebee as a SaaS platform that enables businesses to rapidly experiment with and iterate on subscription/business models (pricing, bundles, revenue models) so they can adapt in times of exponential change. It uses a problem→solution→proof narrative with market disruption examples, product pillars, customer logos and two short case studies — but it omits detailed financials, team bios and explicit TAM figures.

Problem Statement

How the deck articulates the problem:

  • Slide 1–2: Macro thesis — “Yesterday was NOTHING like today” and “We are living in times of Exponential Change.” Slide 2 uses clear examples of market disruption (TV→Netflix, Taxi→Uber, Superstore→Amazon, University→Coursera, Location→Zoom, Email→Slack, Person→Alexa) to show incumbents are being replaced.
  • Slide 3: Argues businesses must be able to change their business model (delivery, consumption, supply, service, revenue) to survive.
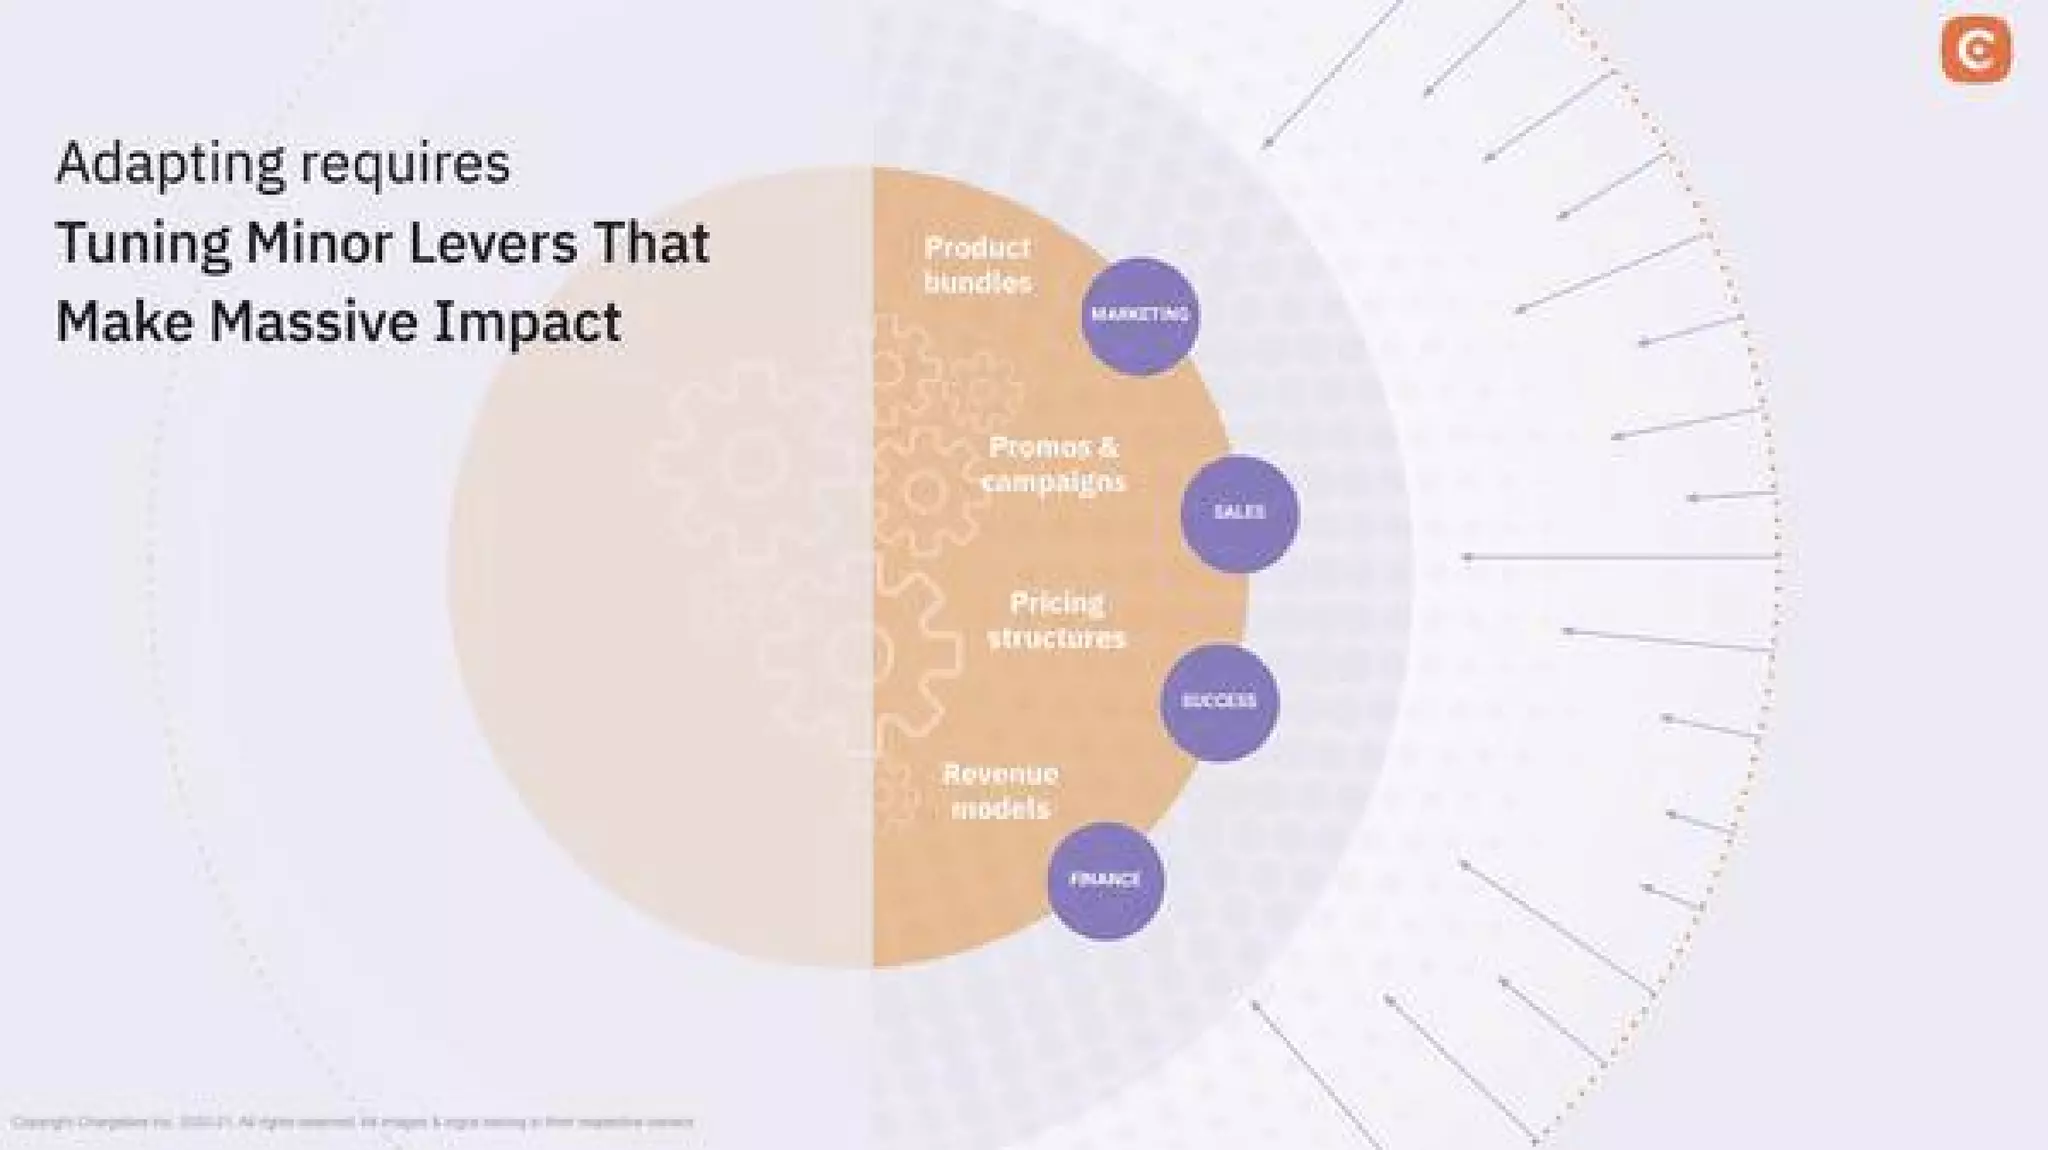
  • Slide 4: Breaks the problem down into tactical levers that are hard to iterate manually — product bundles, promotions & campaigns, pricing structures, revenue models — implying existing billing and finance systems are rigid and slow.

Solution

How the deck positions the solution:

  • Slide 6 (product slide): Chargebee is presented as the platform that enables “Business Model ADAPTABILITY.” Core capabilities highlighted: Subscription management, Billing & payment automation, Workflow management, Business metrics and real‑time revenue telemetry.
  • Left column (Slide 6): Emphasizes an “Agile experiment engine,” billing lifecycle automation, extensibility and telemetry — positioning Chargebee as the plumbing that lets product/marketing/finance quickly launch and iterate new monetization strategies.

Market Opportunity

TAM/SAM/SOM analysis:

  • The deck does not provide explicit TAM/SAM/SOM numbers.
  • It leverages the large, implicit market of any business moving to subscription or requiring rapid pricing/packaging changes (examples span media, transportation, education, enterprise software).
  • External datapoints used for persuasion: Slide 5 cites The New York Times digital transformation metrics (5 Mn+ subscribers, 800 Mn+ annual digital revenues) as an exemplar of shifting revenue models — implying there’s large revenue upside available to businesses that adapt.

Business Model

Revenue model and unit economics:

  • The deck implies Chargebee is a SaaS subscription product (subscription management and billing automation).
  • No explicit pricing, ARPU, gross margins, LTV, CAC, or unit economics are shown.
  • Revenue claims are indirect: Slide 7 claims “$3 Bn+ ARR enabled via new models” (this is customer ARR enabled by Chargebee, not Chargebee’s own ARR).

Traction & Metrics

Growth metrics and proof points with specific numbers:

  • Slide 7: “20,000+ high growth businesses” (customers), “410+ Business model iterations” (product usage/experimentation stat), “$3 Bn+ ARR enabled via new models” (aggregate customer ARR enabled).
  • Slide 5: Uses NYT example: “5 Mn+ subscribers” and “800 Mn+ annual digital revenues” (third‑party example for proof of concept).
  • Slide 8 & 9: Two customer case studies:
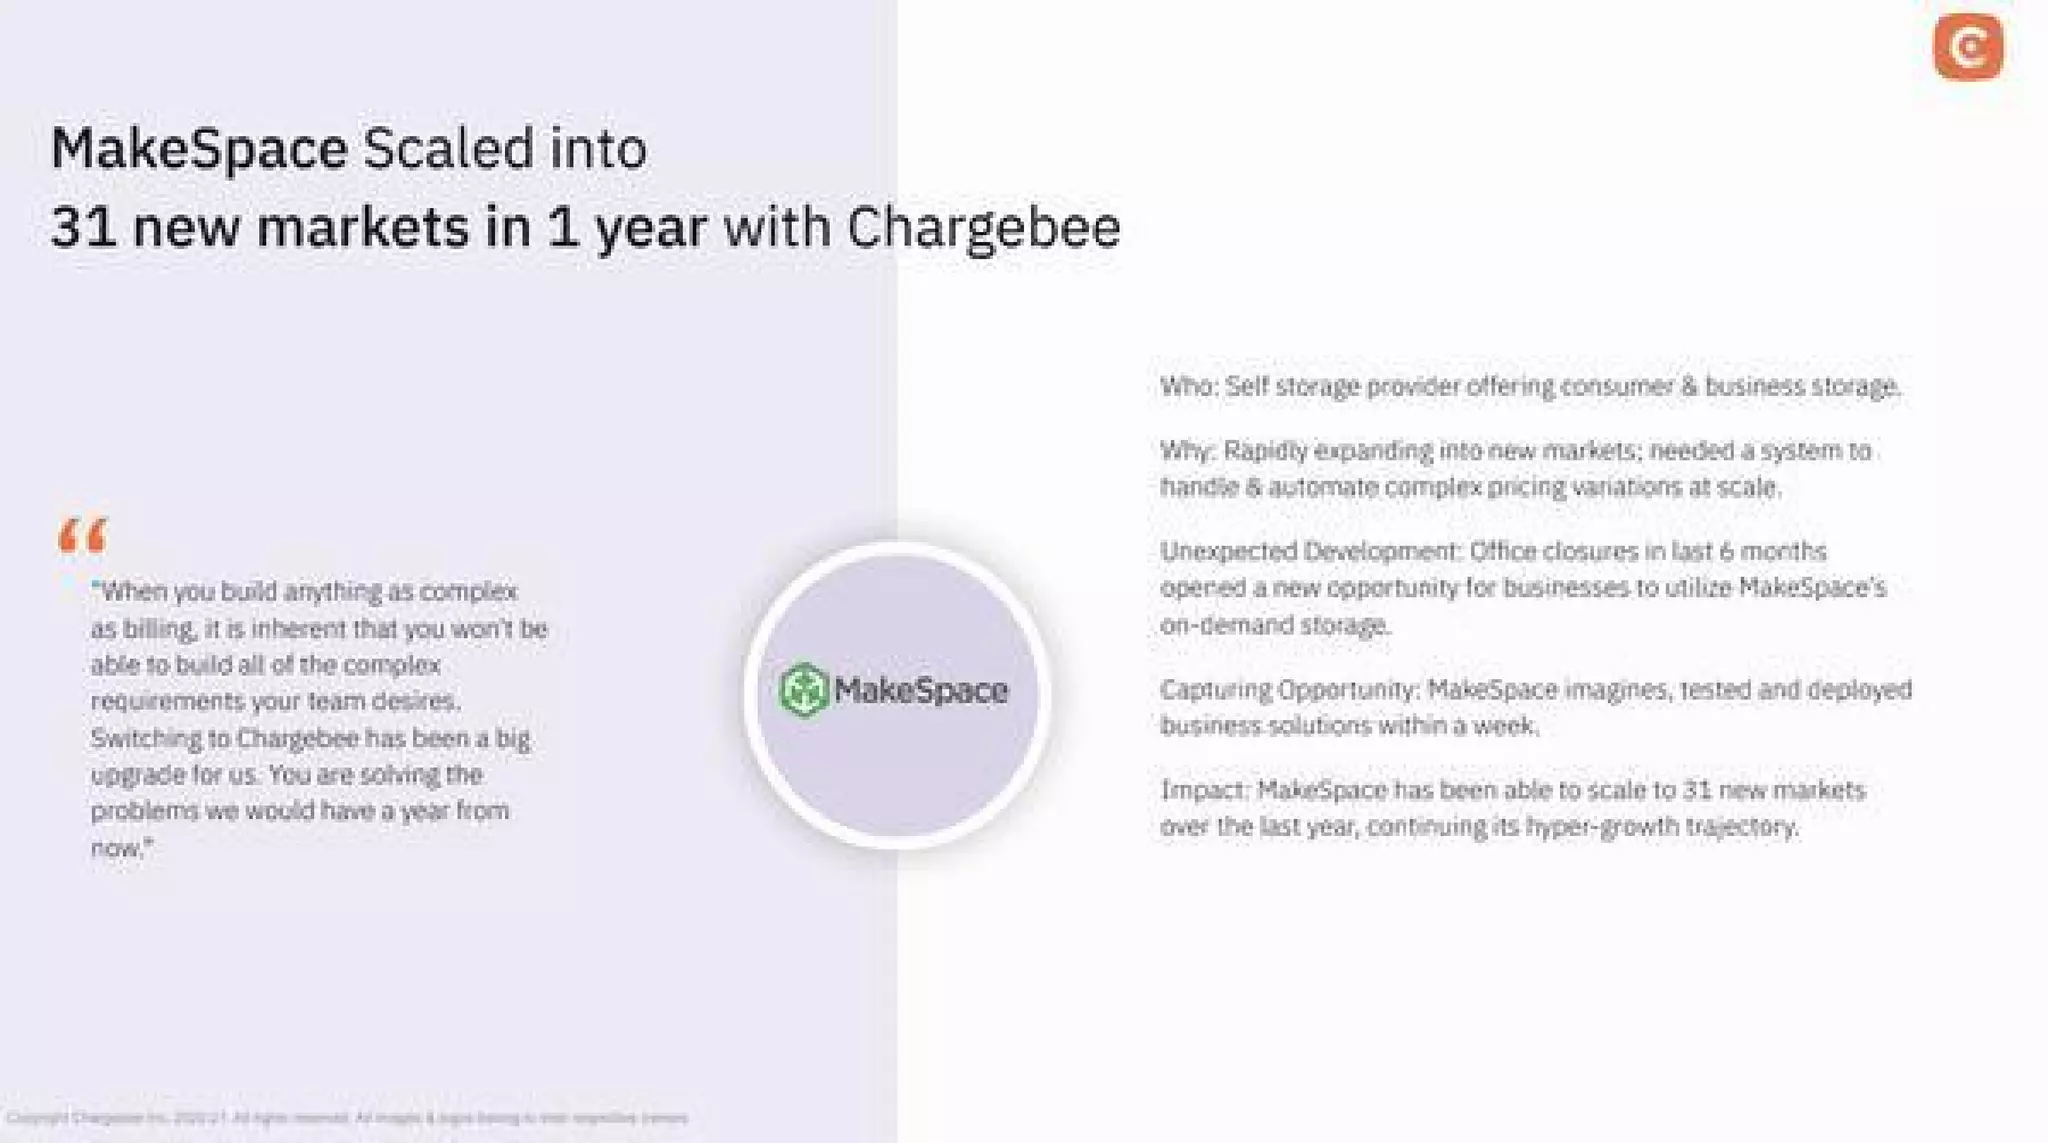
    • MakeSpace: “Scaled into 31 new markets in 1 year with Chargebee.”
    • Yousign: “Grew their customer base by 2X in 6 months.”
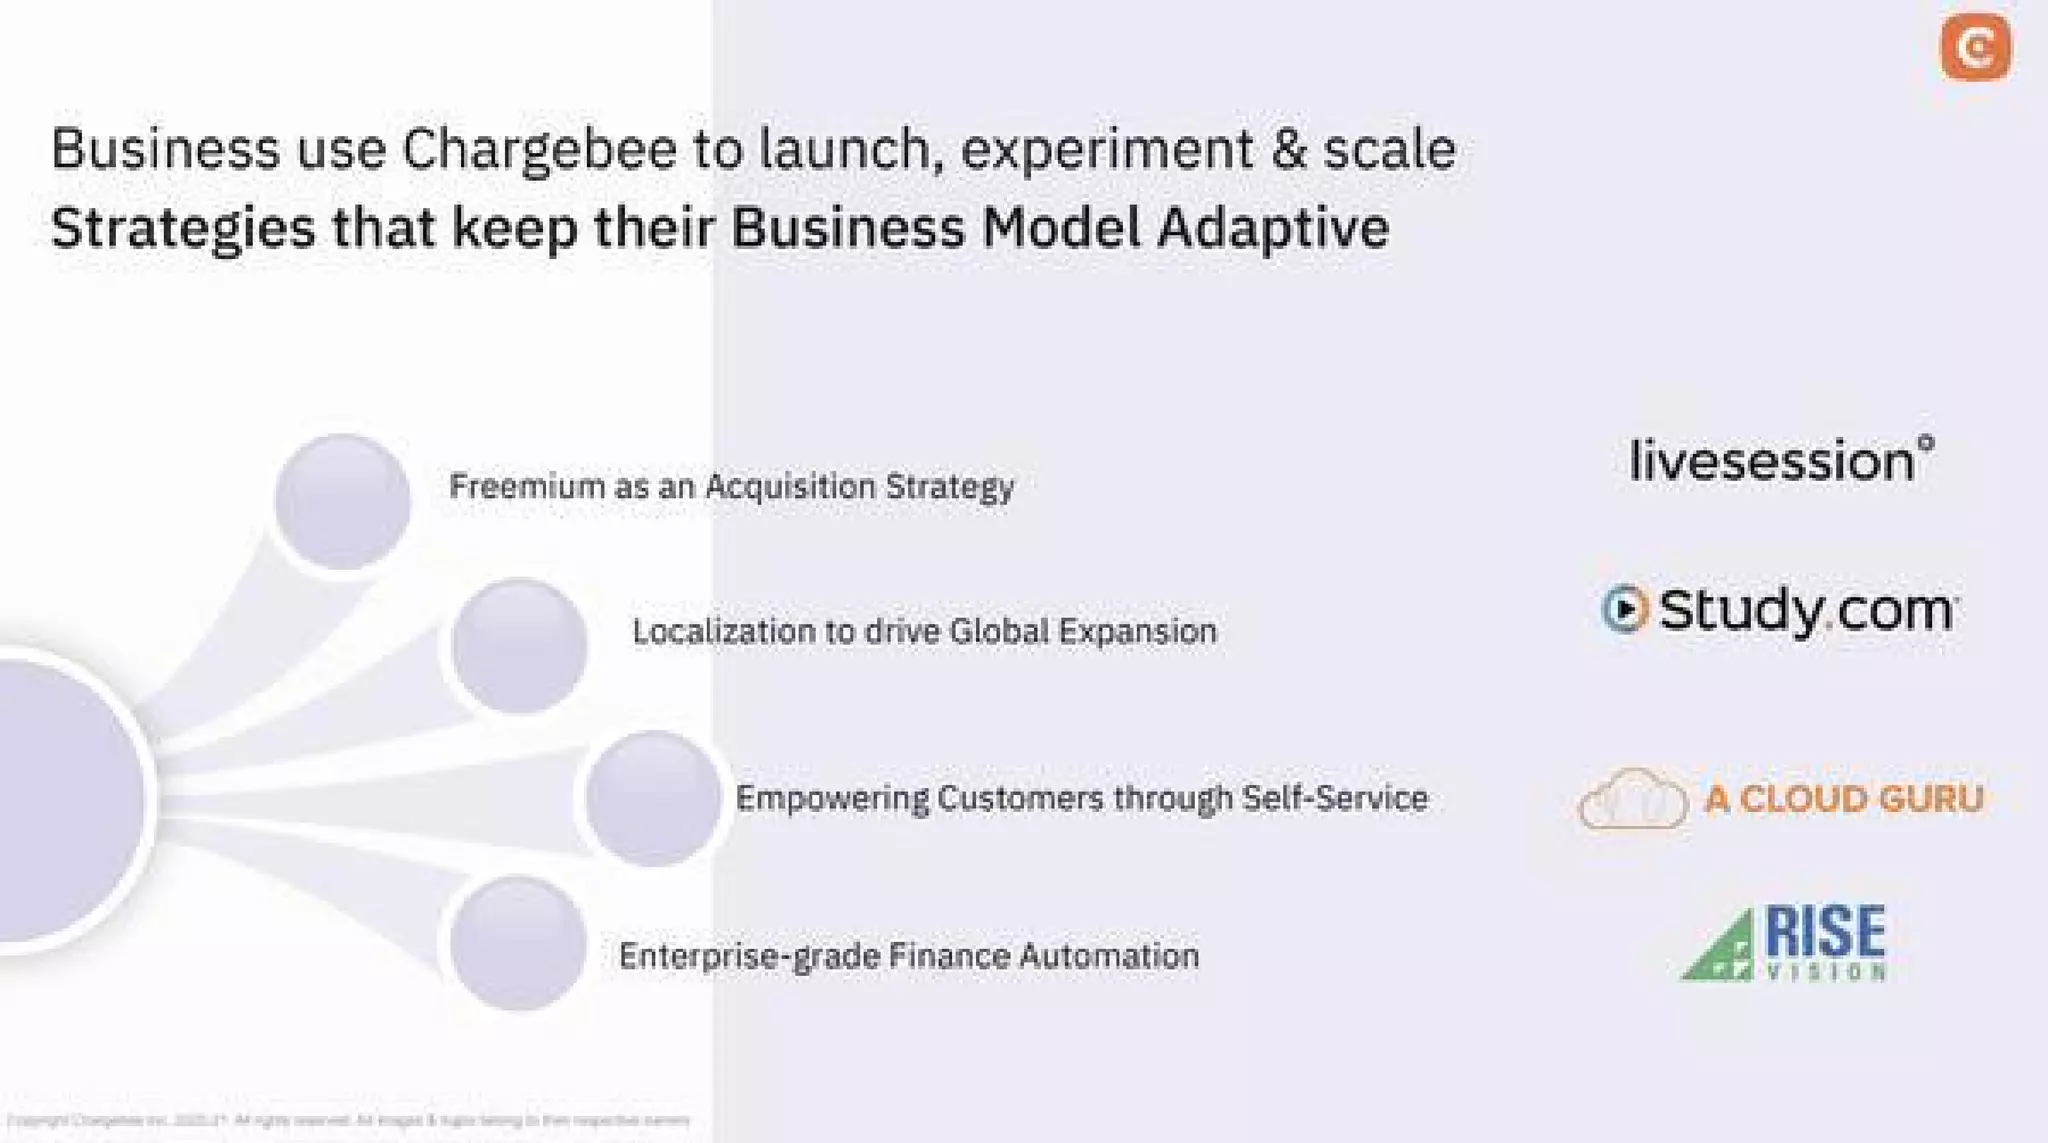
  • Slide 10: Client logos and use cases (freemium, localization, self‑service, enterprise finance automation).

Note: Metrics are high‑level and aggregate; there is no company MRR/ARR, churn, growth rate or cohort data.

Competitive Positioning

How they differentiate:

  • Positioning is centered on enabling “business model adaptability” rather than being just another billing system.
  • Differentiators called out: agile experimentation engine, billing lifecycle automation, flexible/extensible platform, real‑time revenue telemetry.
  • Uses customer logos (Calendly, Freshworks, Okta, etc.) and case studies to show credibility and breadth across verticals.
  • No explicit competitor map or feature‑by‑feature comparison versus other billing platforms is provided.

Team

Team credentials:

  • The deck does not include a team slide or founder bios in the 10 slides shown. Team credibility is therefore missing from the visible deck.

Go-to-Market Strategy

Distribution approach if shown:

  • The deck does not present an explicit GTM playbook (no channel motion, sales model, pricing tiers, enterprise vs SMB motion).
  • Implied GTM elements:
    • Targeting high‑growth SaaS and subscription businesses (logos and case studies).
    • Use cases: freemium/acquisition, localization, self‑service and enterprise finance automation (Slide 10) suggest a mix of product‑led growth + targeted enterprise sales for larger customers.

The Ask

What they were raising and use of funds:

  • The deck itself (as provided) does not include a visible “ask” slide or use‑of‑funds breakdown.
  • Historical note: the actual seed raise was $370K (2012). No explicit allocation of proceeds is provided in the slides.

Investor Deep Dive

Executive summary, strengths & red flags

Executive Summary

This 10‑slide seed deck frames Chargebee as a SaaS platform that enables businesses to rapidly experiment with and iterate on subscription/business models (pricing, bundles, revenue models) so they can adapt in times of exponential change. It uses a problem→solution→proof narrative with market disruption examples, product pillars, customer logos and two short case studies — but it omits detailed financials, team bios and explicit TAM figures.

Key Strengths

3 identified

1

Clear narrative that ties macro disruption to a concrete product need — strong storytelling from Slide 1→Slide 4 (why business model adaptability matters).

2

Credibility via customers and case studies — prominent logos, two specific customer stories with measurable outcomes (31 markets, 2x customers), and a large aggregate metric (20k+ customers).

3

Product positioning focused on experimentation & telemetry — differentiates from generic billing players by emphasizing iterative experimentation and real‑time revenue insights.

Red Flags & Weaknesses

3 identified

1

No team slide or founder background — at seed stage this is a critical omission; investors want founder experience and domain expertise up front.

2

Lack of financial and unit economics detail — no MRR/ARR for Chargebee itself, no churn, LTV, CAC, gross margin, runway or revenue projections.

3

Ambiguous metrics and claims — “$3 Bn+ ARR enabled” is an aggregate vanity metric that doesn’t translate to company revenue; “20,000+ customers” lacks segmentation and ARPU context. No defensibility/technical differentiation detail.

More Pitch Decks To Study

Compare structure, fundraising context, and investor-facing story across similar startup decks.