Compare your deck to Buffer

Compare Your Deck

Buffer Pitch Deck (2011)

SaaS
Stage: Seed
Raised: $500K
Year: 2011
Slides: 13
Outcome: Bootstrapped, $20M ARR

Pitch Deck

1 / 13
Buffer pitch deck - Opening: Strong Brand and Visual Identity
Click to expand

Deck Analysis

This seed pitch deck from Buffer (2011) is a concise, design-forward presentation that quickly establishes a large market trend (social sharing), explains a simple product value (scheduled sharing), and backs it with concrete traction and financial reasoning. Notable for its visual clarity and metrics-first approach, the deck leans heavily on a few big ideas: social is growing fast, scheduling improves engagement, and a freemium model with predictable unit economics can scale. Founders can learn how to communicate product simplicity, early momentum, and path-to-revenue in a compact, investor-friendly format.

Opening: Strong Brand and Visual Identity

Opening: Strong Brand and Visual Identity

The first slide is a full-bleed logo that establishes an immediate visual identity. Starting with the brand alone communicates confidence and helps the audience remember the company name before any details are presented. The minimal design also sets the tone for the rest of the deck: clean, focused, and product-driven.

By opening with a simple, polished logo slide the founders remove noise and let subsequent slides carry the narrative. Founders should recognize the value of a strong visual anchor — it primes investors and creates cohesion across later slides that emphasize growth and product. A clear brand-first opening also signals design and product sensibility, which is especially important for B2C/SaaS products where UX matters.

Key Takeaway: Lead with a strong visual identity to set the tone and build memorability before diving into data.
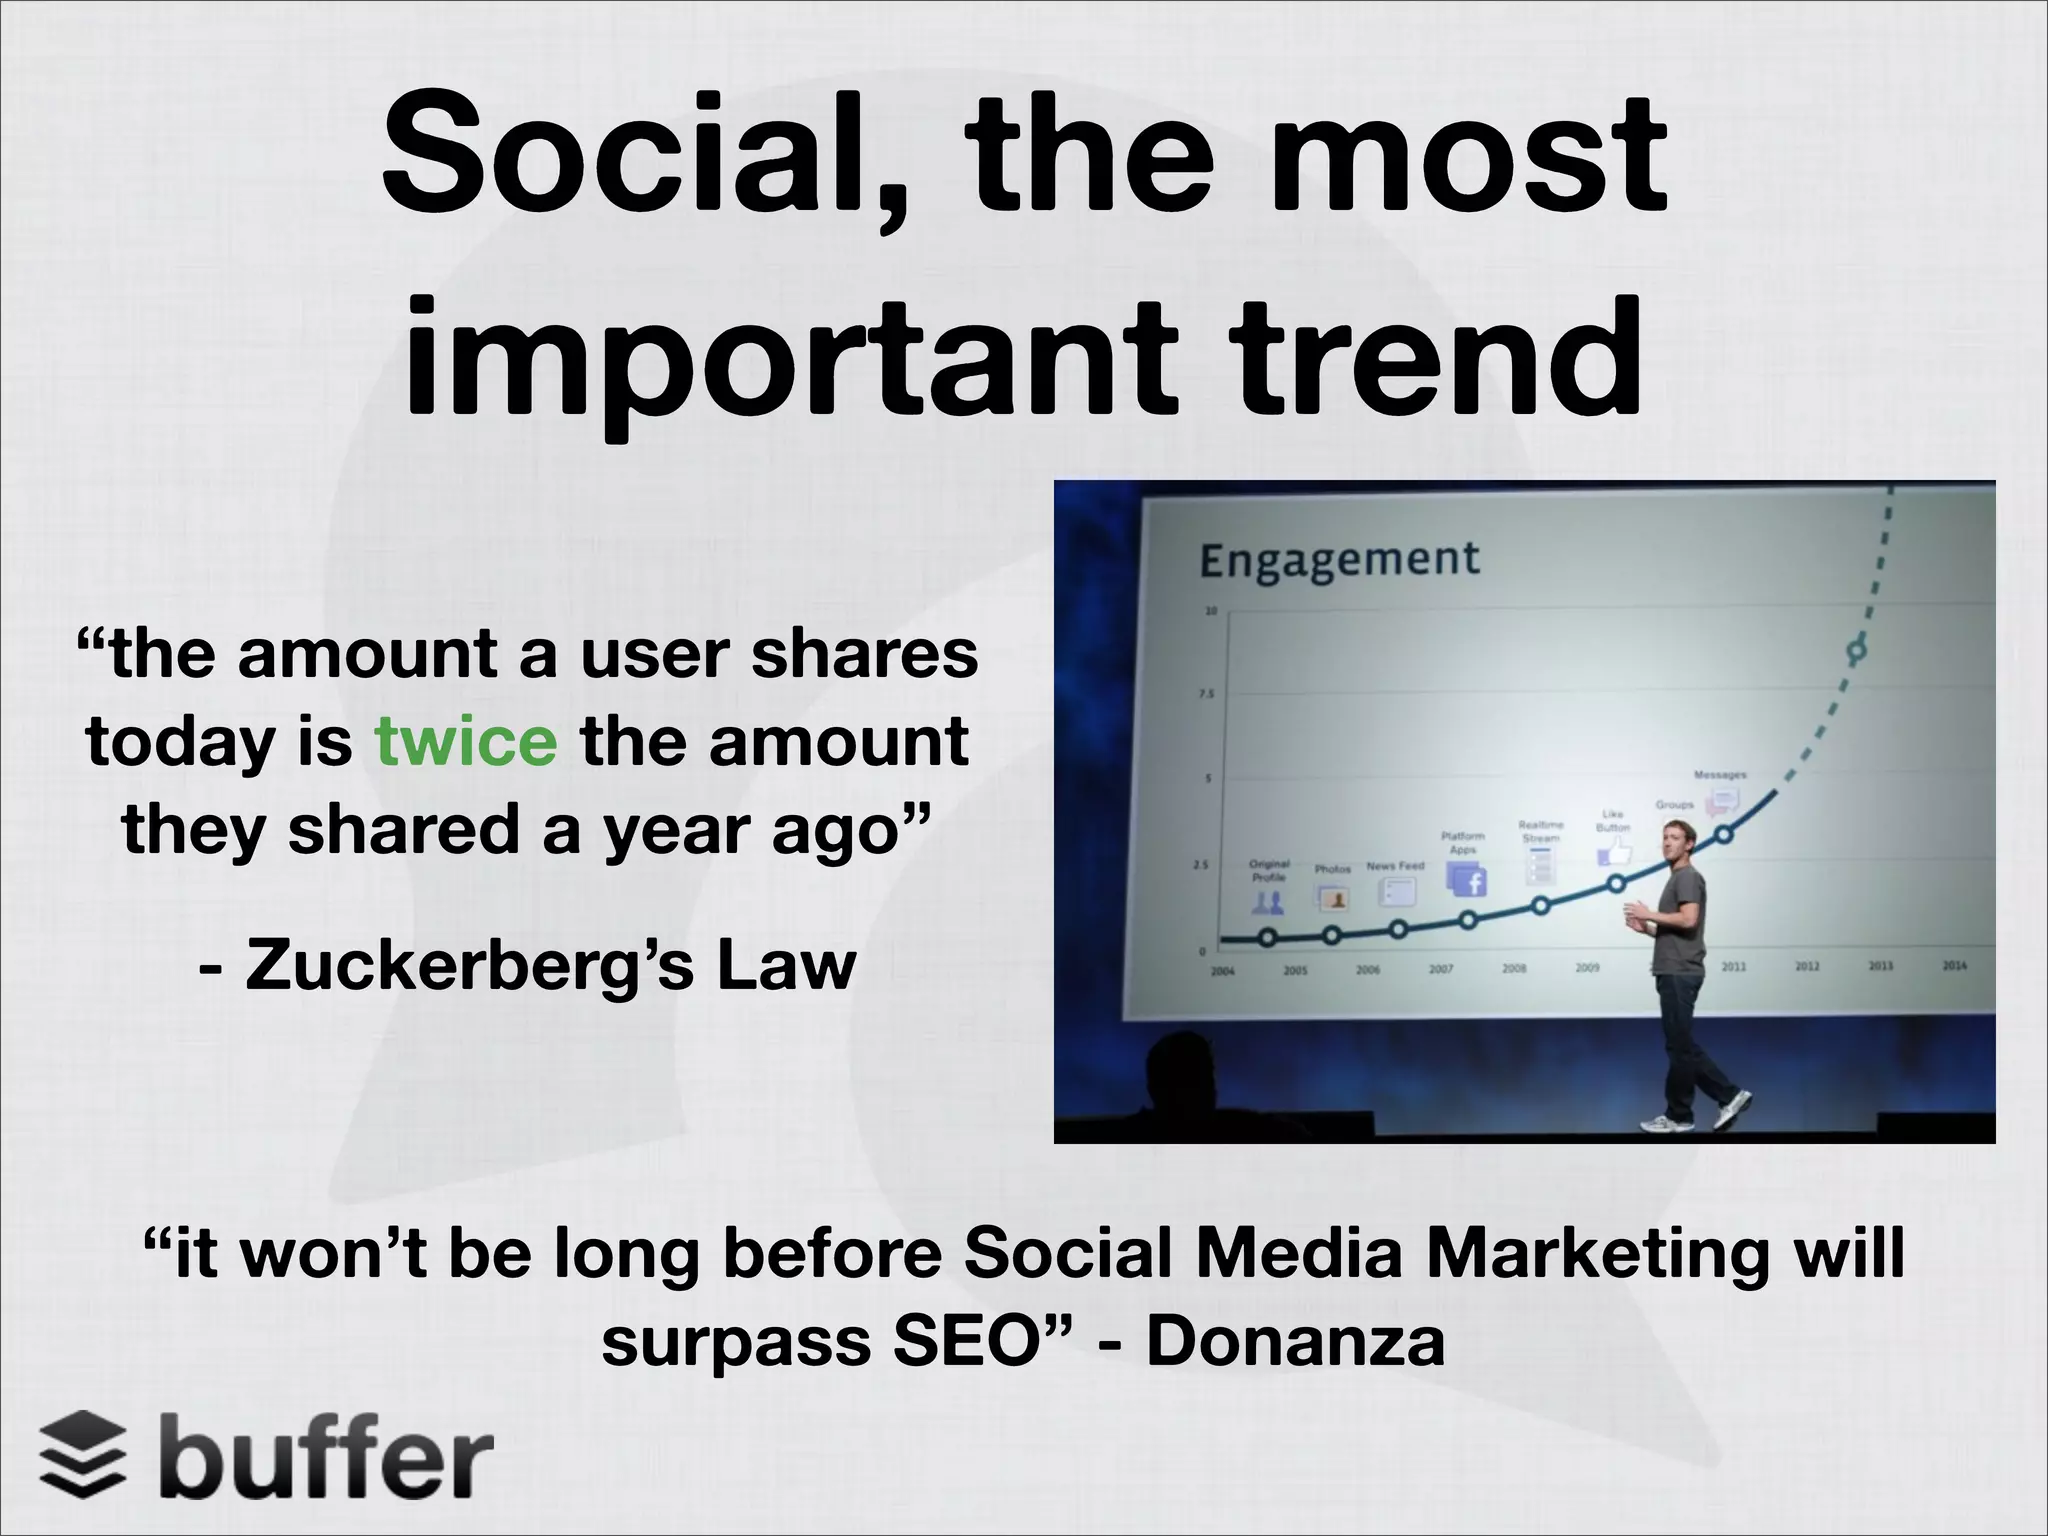
Market Context: Establishing a Trend (Zuckerberg's Law)

Market Context: Establishing a Trend (Zuckerberg's Law)

Slide 2 frames the opportunity by citing social sharing growth and a memorable rule — "the amount a user shares today is twice the amount they shared a year ago" — paired with a visual of exponential engagement. This slide connects the product to an obvious macro trend (massive growth in social sharing and link-sharing behavior), justifying why a scheduling and sharing product is strategically relevant.

The slide is effective because it blends a qualitative quote, an authoritative name, and a related visual to quickly make the market case. Founders should emulate this by using a few simple, high-impact facts or quotes that show why the market dynamics favor their product, rather than overwhelming investors with exhaustive market research at the outset.

Key Takeaway: Tie your product to a clear, data-backed trend early to justify market timing and urgency.
Product Demonstration: Show the Core Experience (Queue Your Updates)

Product Demonstration: Show the Core Experience (Queue Your Updates)

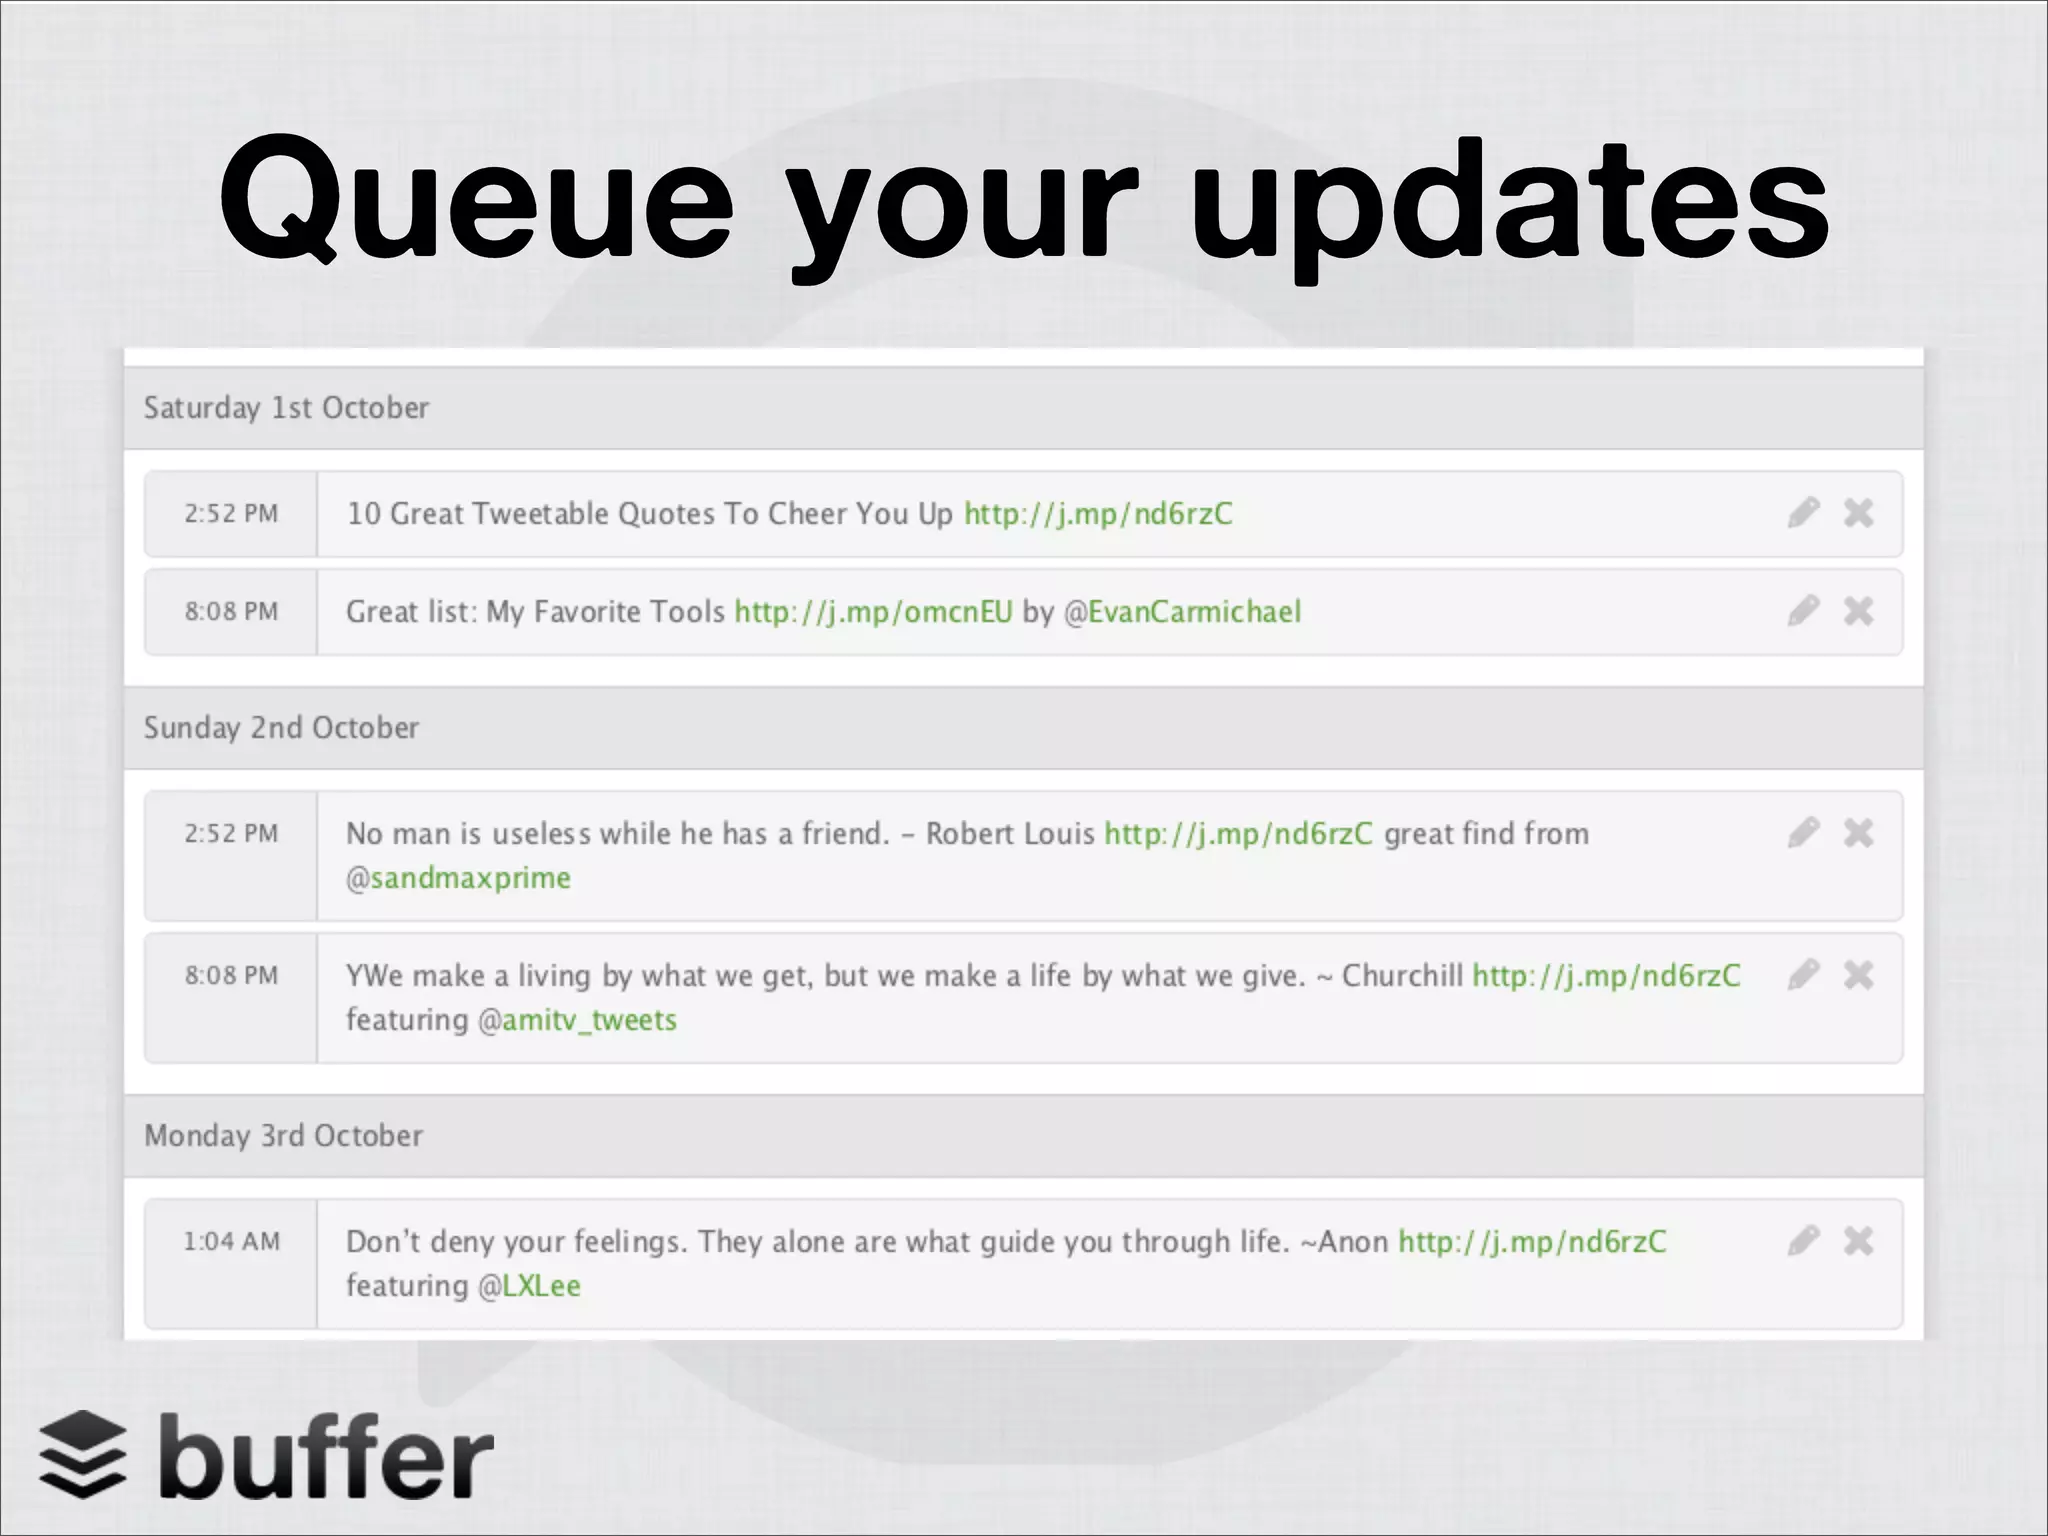
Slide 4 uses a single, large screenshot of the product queue with a succinct headline: 'Queue your updates.' It demonstrates the core value — scheduling and queuing posts — without technical jargon. The visual shows the interface and the workflow, making it obvious what users do and why it’s helpful. This approach keeps the message focused on functionality and user benefit rather than feature lists.

This slide teaches founders the power of a single, well-shot product screenshot: it communicates utility, reduces cognitive load, and lets investors imagine the user flow. If your product’s primary differentiator is UX or workflow, show it early and prominently; images beat bullet points for explaining how a product is used in practice.

Key Takeaway: Use one clear product screenshot to convey the core user workflow and value proposition instantly.
Traction: Metrics That Build Credibility

Traction: Metrics That Build Credibility

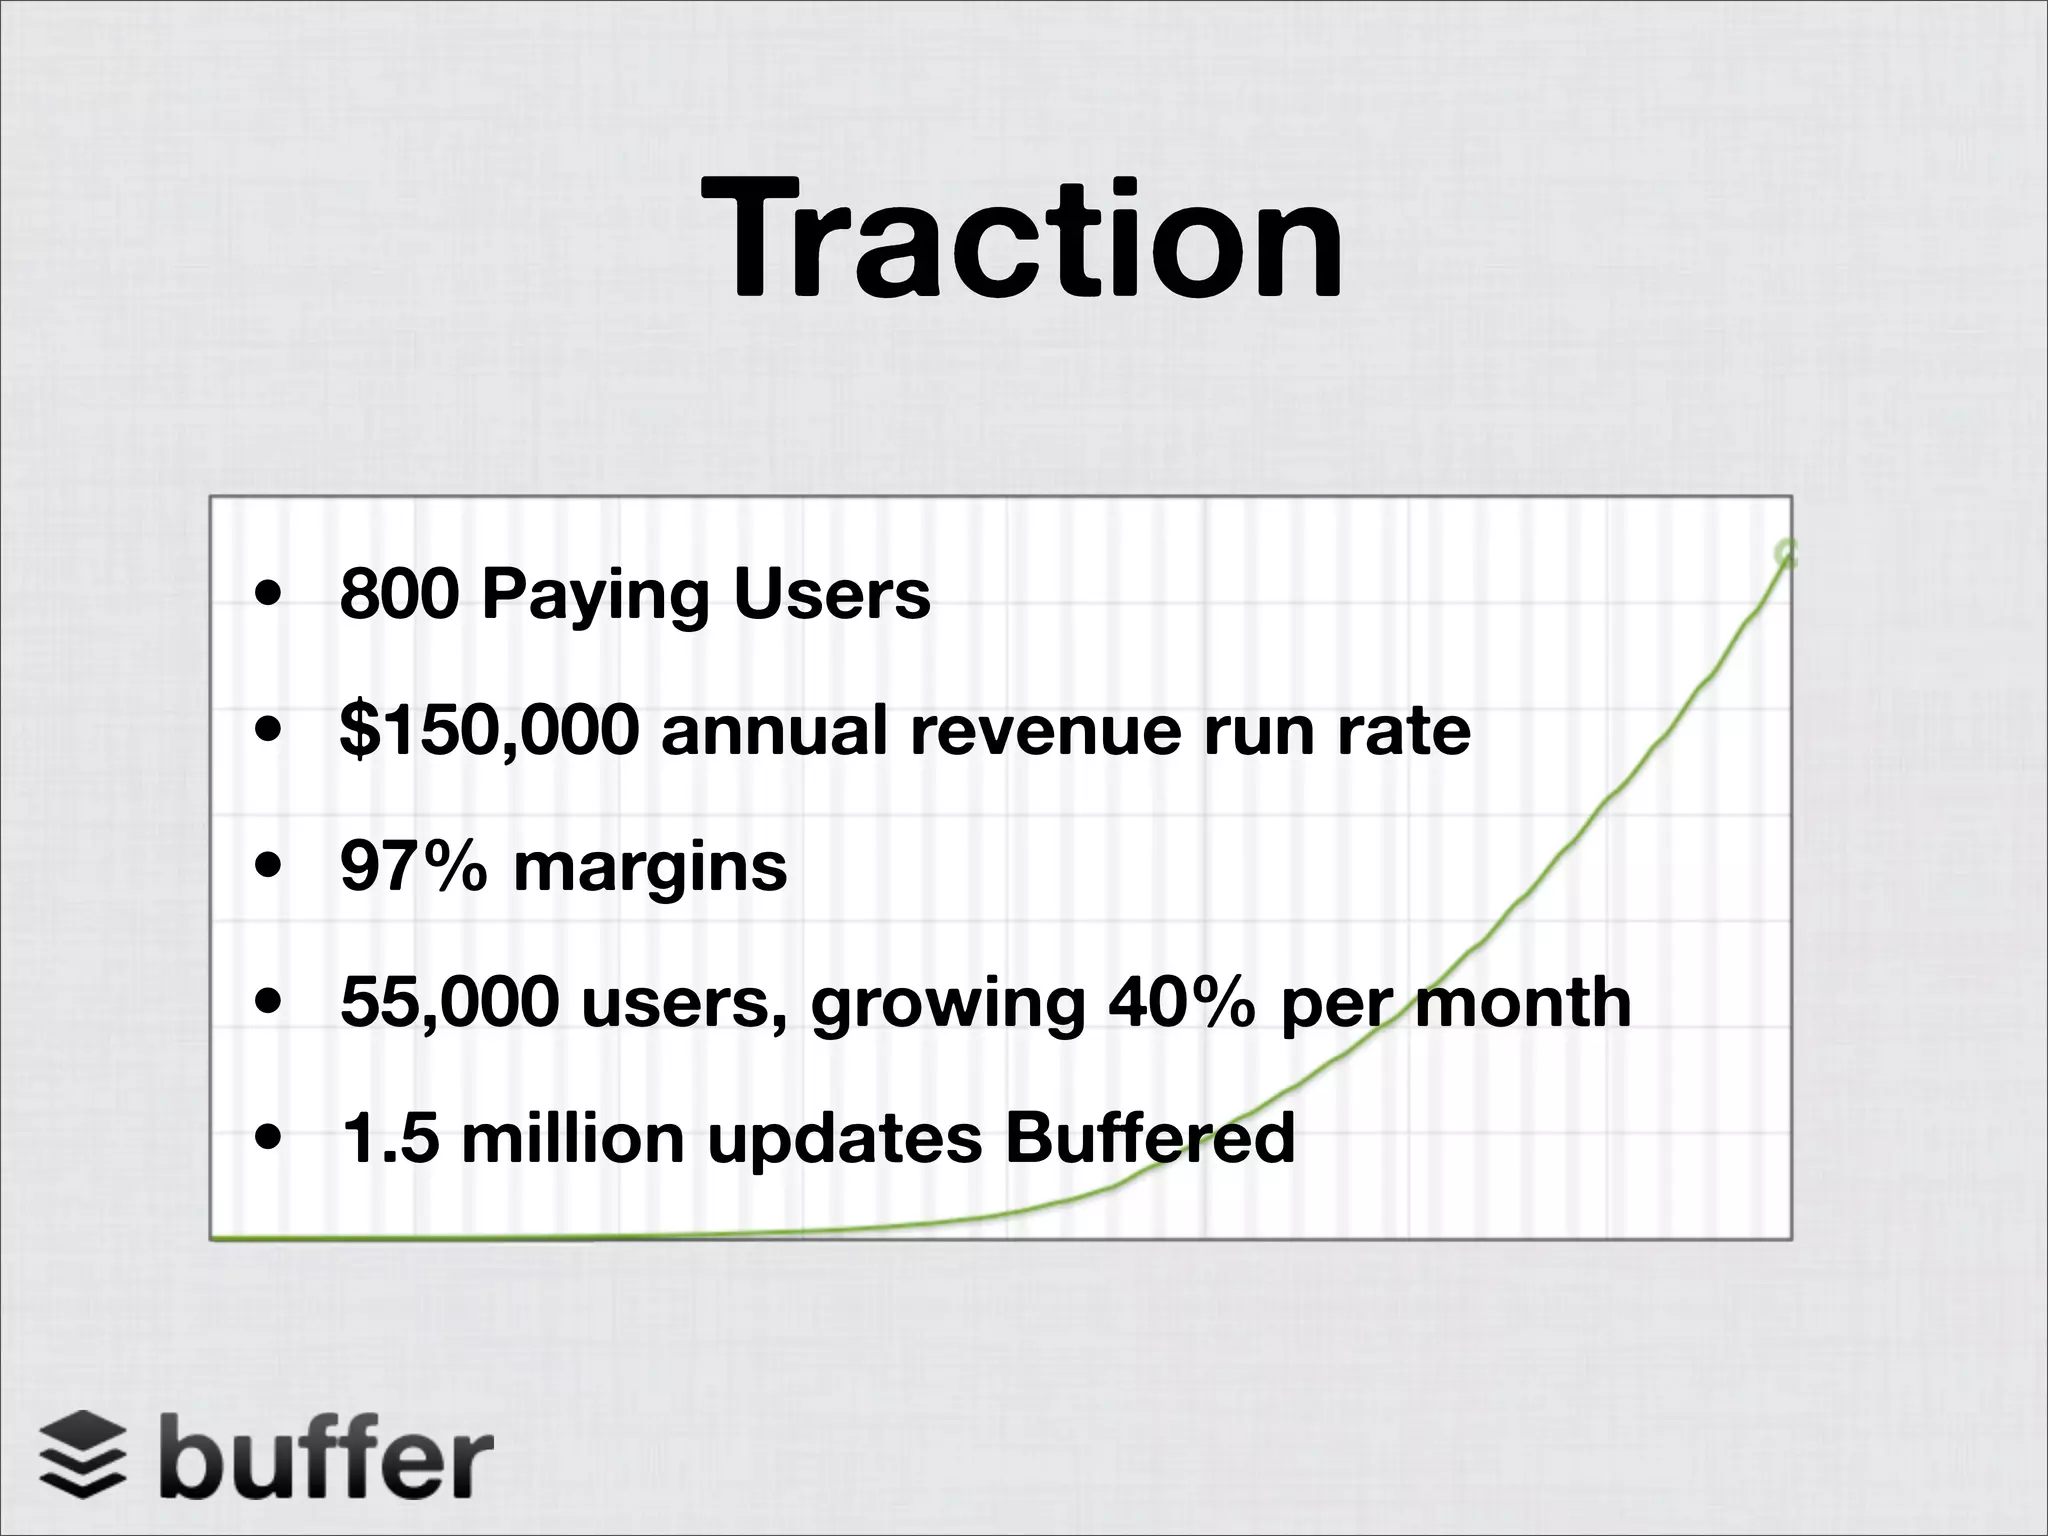
Slide 6 lists crisp, investor-oriented traction metrics: paying users, annual run rate, margins, total users and growth rate, and number of updates. These are the exact KPIs VCs want to see for a SaaS company and they’re presented plainly on top of an upward curve graphic. The slide balances revenue, user growth, and operational efficiency (margins), creating a compelling snapshot of business momentum.

Founders should note the combination of absolute numbers (55,000 users) with growth rates (40% per month) and unit economics (97% margins). Presenting both top-line and unit metrics together answers many investor questions proactively and signals that the team understands what matters to scale a SaaS business.

Key Takeaway: Lead with a handful of clear, high-leverage metrics (users, growth rate, revenue, margins) to convey product-market fit and momentum.
Roadmap & Milestones: Showing Rapid Progression

Roadmap & Milestones: Showing Rapid Progression

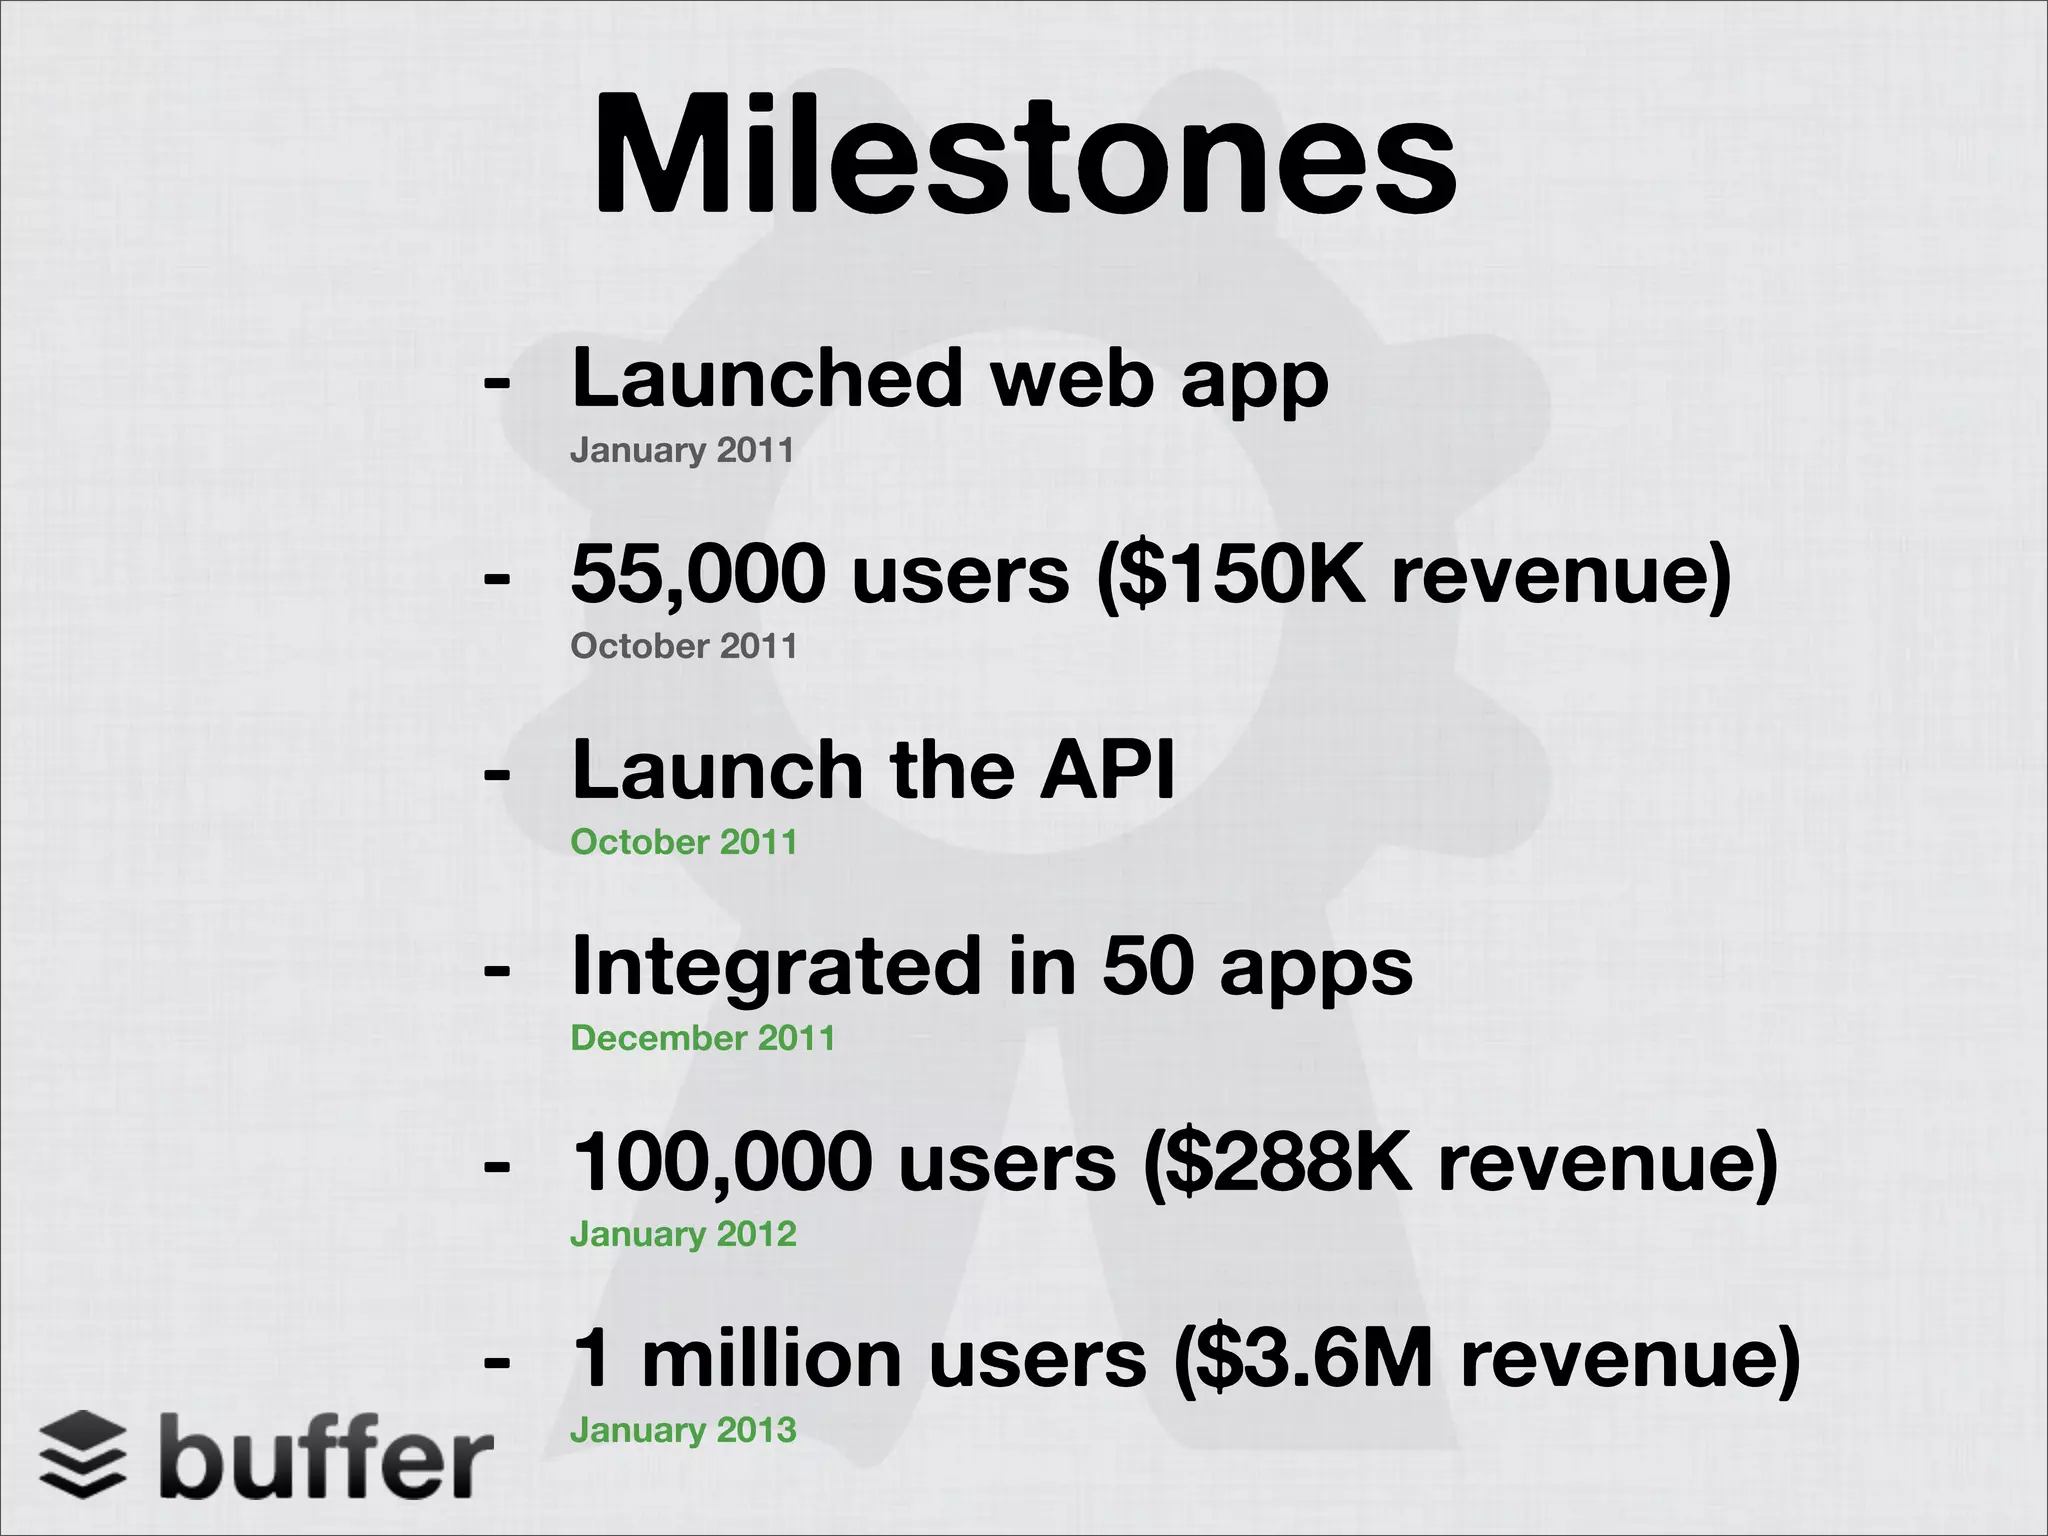
Slide 7 outlines milestones with dates: web app launch, user and revenue milestones, API launch, integrations, and long-term user projections. This timeline demonstrates a cadence of execution and product development that maps to user growth and monetization. It reassures investors that the team has delivered tangible milestones in short order and has a roadmap for continued scaling.

The lesson for founders is to present milestones that combine product launches, partnerships, and measurable outcomes. Dates and dollar figures make progress verifiable and help investors see the trajectory from idea to revenue to scaling. A clear timeline also enables a conversation about what will happen next and what resources are required to accelerate.

Key Takeaway: Use a dated milestone timeline with concrete user/revenue outcomes to show repeatable execution and near-term roadmap.
Business Model: Unit Economics and Acquisition Levers

Business Model: Unit Economics and Acquisition Levers

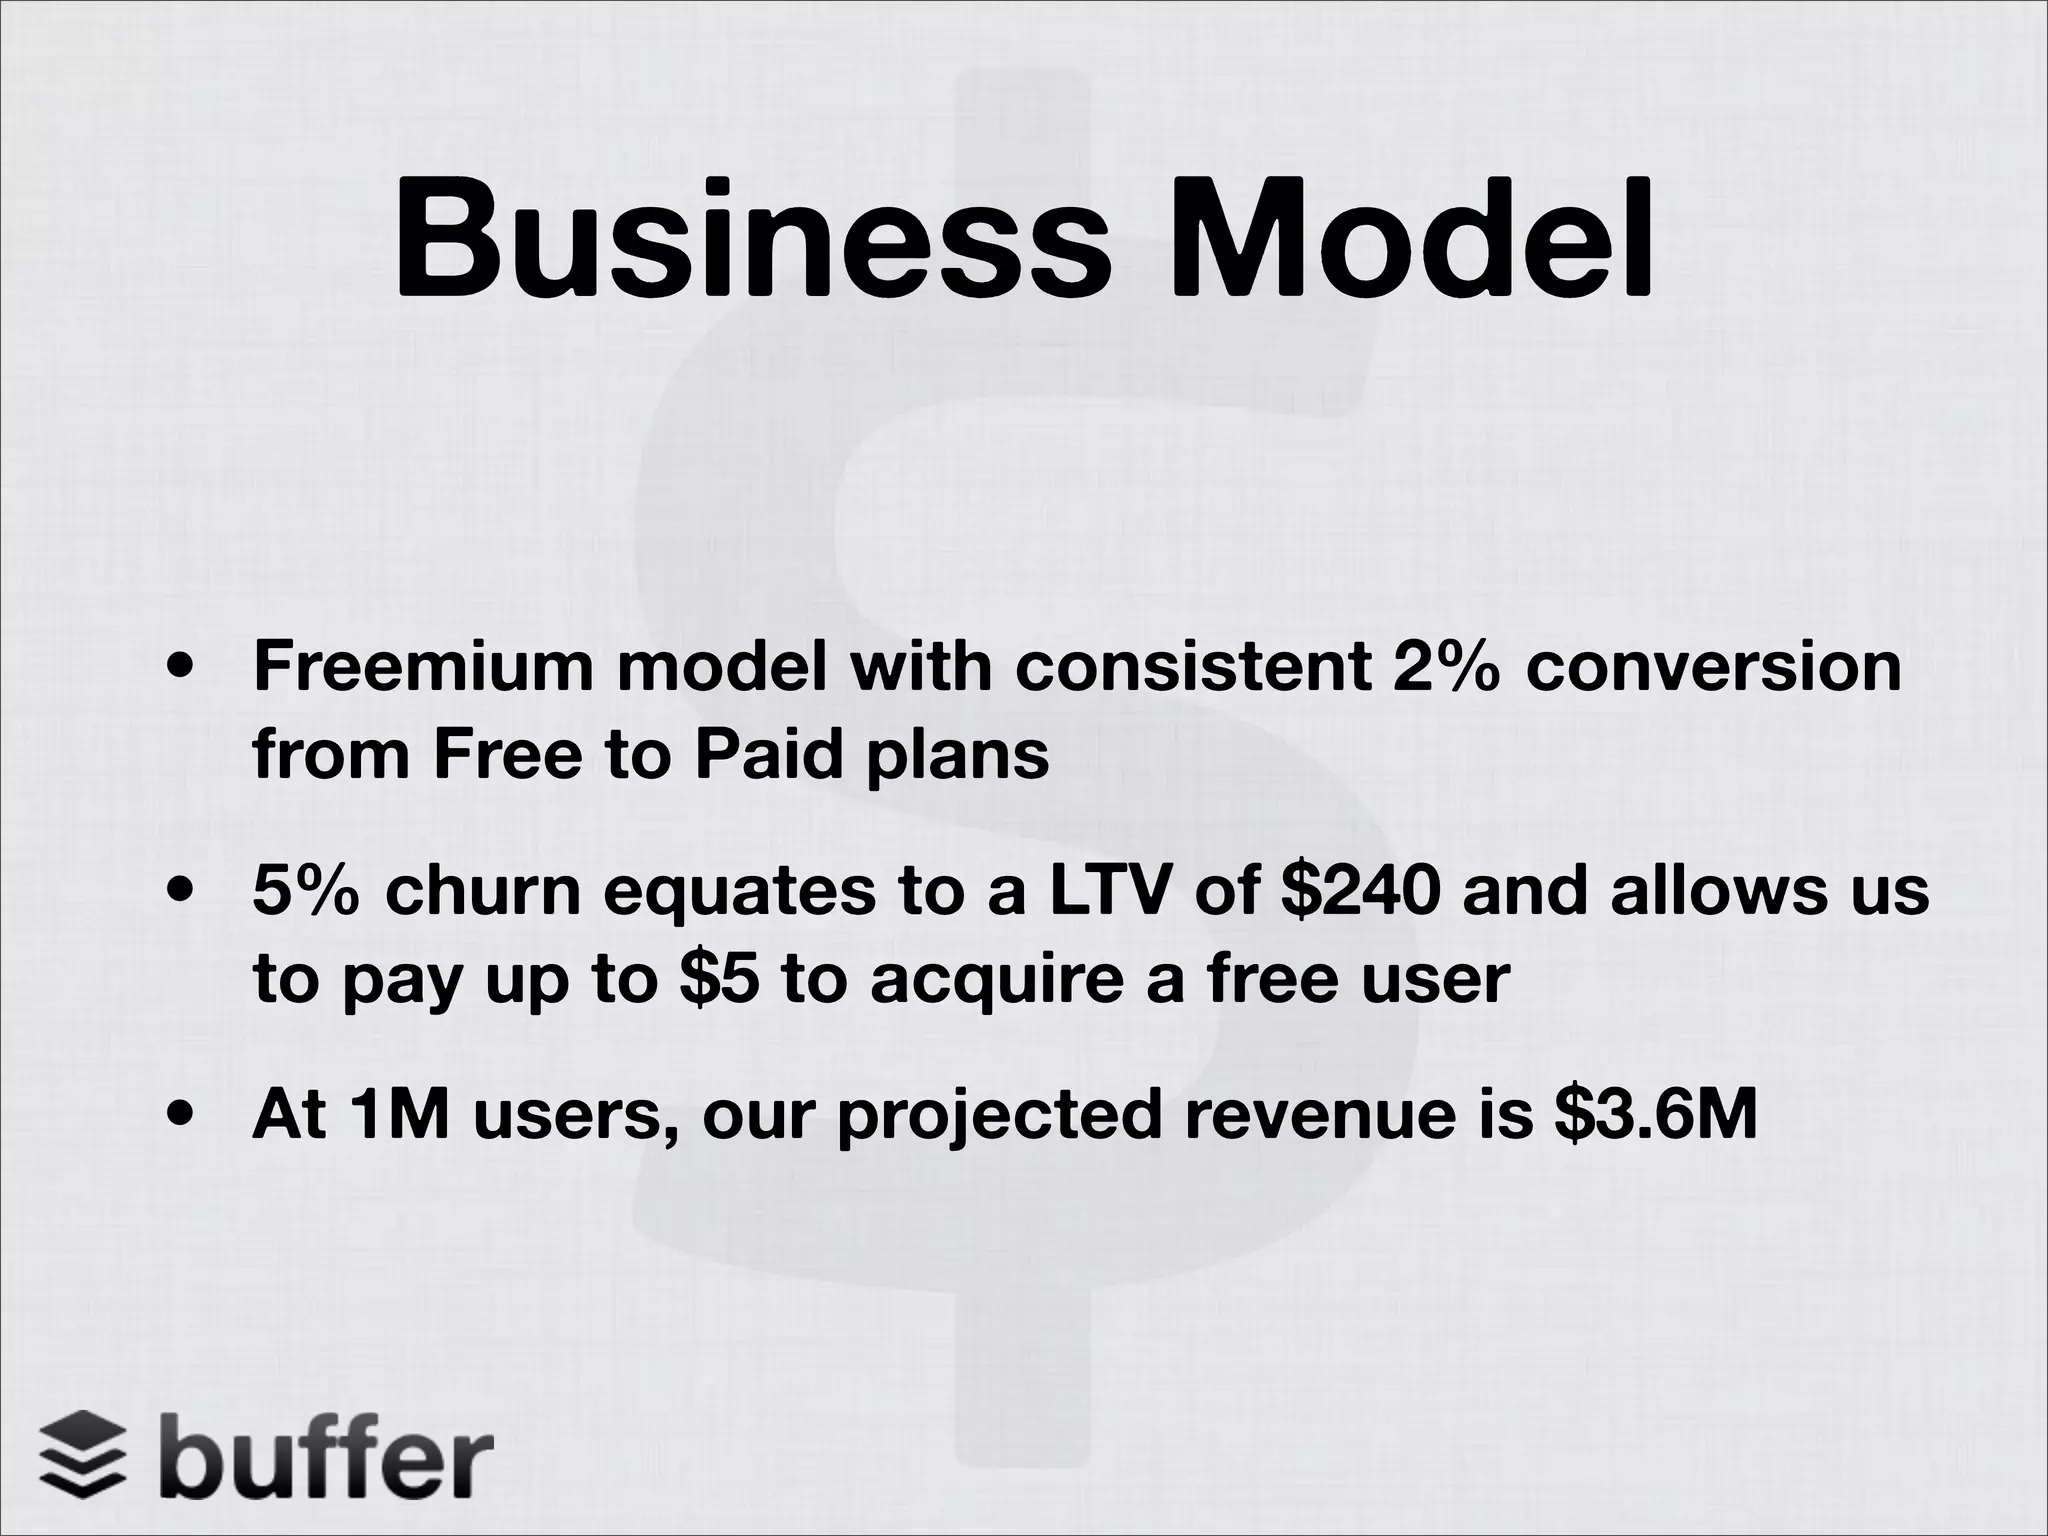
Slide 8 succinctly explains the freemium model, conversion rate, churn, LTV, and how much they can pay to acquire a free user. The slide ties product usage to a monetization model and shows the math that justifies customer acquisition investments. Presenting LTV and allowable CAC demonstrates an understanding of scalable economics and capital efficiency.

Founders should copy this clarity: spell out your pricing model, conversion assumptions, churn, LTV, and CAC. Investors want to see defensible unit economics and an explanation of how acquisition spend converts into predictable revenue. Even rough, realistic figures are better than vague claims — they enable informed follow-up questions and build credibility.

Key Takeaway: Expose your core unit economics (conversion, churn, LTV, allowable CAC) so investors understand how growth translates to revenue.
Team & Credibility: Founders, Advisors and Investors

Team & Credibility: Founders, Advisors and Investors

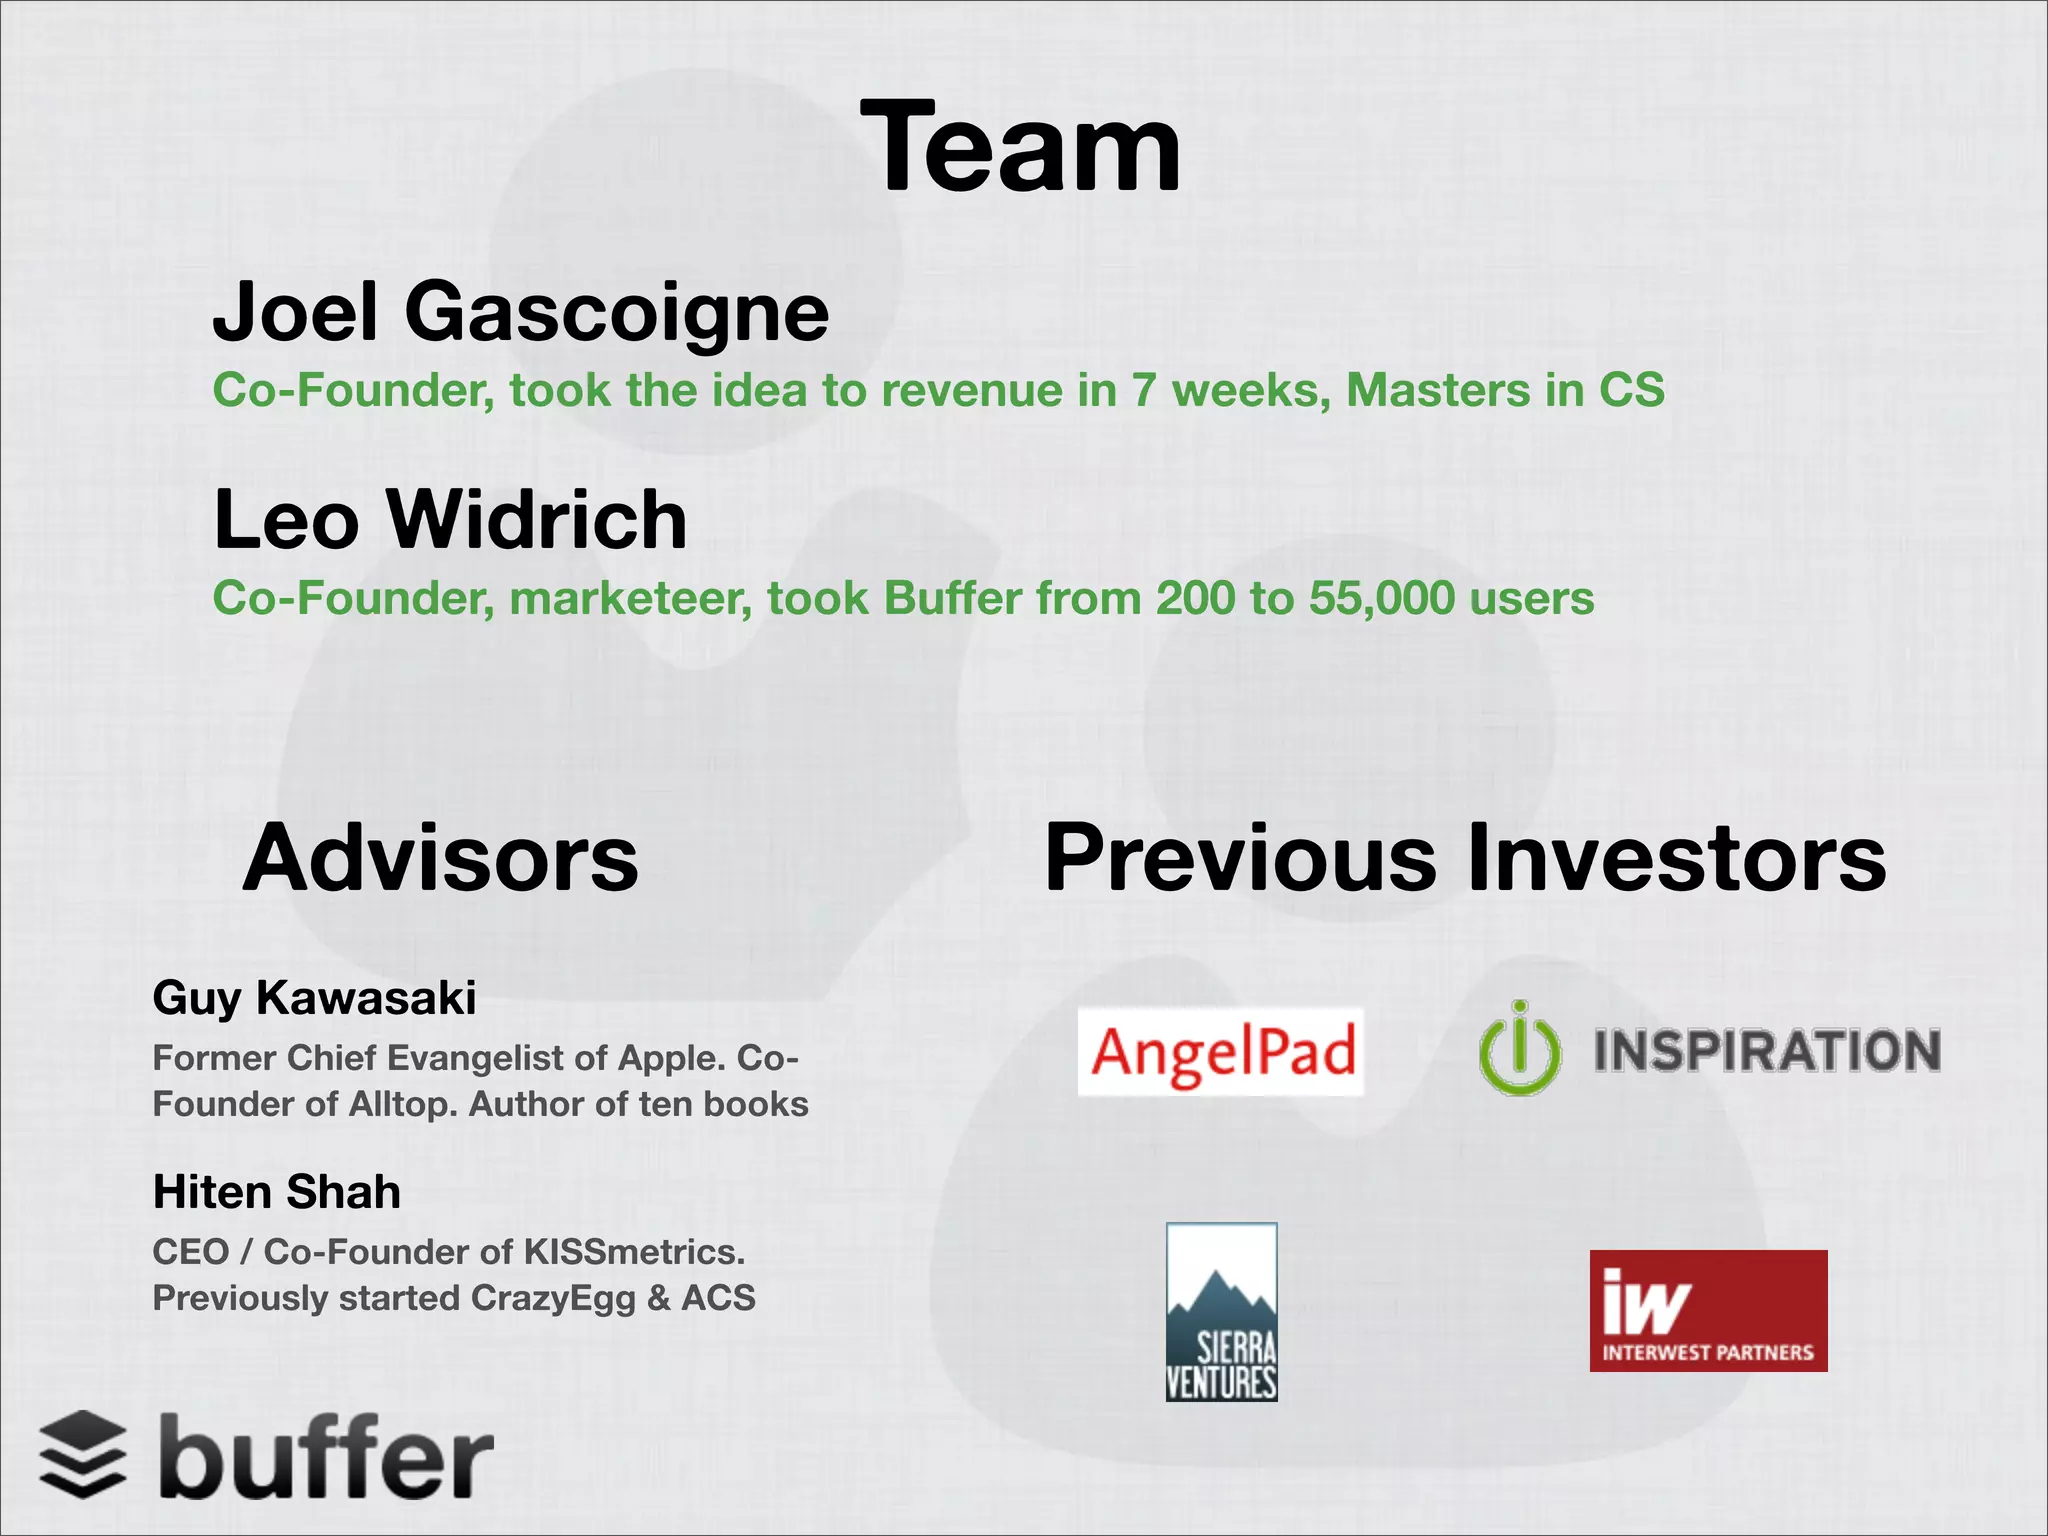
Slide 13 presents the founding team, short bios, notable advisors, and previous investors. It highlights functional roles (technical co-founder, marketer) and early validation via well-known advisors and angel programs. This slide balances bios with social proof, which helps investors evaluate execution risk and access to networks or distribution channels.

For founders, the takeaway is to present a compact team narrative: who does what, what they’ve already achieved, and which credible advisors or investors back the effort. Strong, relevant advisors and prior investor logos can materially increase perceived credibility — but they should be presented as supplements to, not replacements for, clear founder accomplishments.

Key Takeaway: Briefly explain each founder's role and highlight a few credible advisors or investors to reduce execution risk and signal network access.

Conclusion: Key Lessons

Buffer’s seed deck is a compact example of clarity and focus: it ties a simple product to a big market trend, demonstrates real product usage, and backs claims with crisp metrics and unit economics. The visual design is clean and consistent, allowing investors to quickly absorb the core narrative without distraction. The deck prioritizes what matters early — product, traction, model, team — and leaves room for discussion.

Actionable advice for founders: keep slides minimal and visual, lead with the market trend and the core user experience, present a small set of high-impact metrics that prove momentum, and show the economics that make growth scalable. Use milestones and trusted advisors to demonstrate execution capability, and always prepare to back each claim with data or a demo during follow-up conversations.

Full Deck Analysis

11 sections

Overview

Company: Buffer
Round: Seed ($500K)
Year: 2011
Outcome: Bootstrapped, $20M ARR


Executive Summary

Buffer’s 2011 seed pitch deck is a masterclass in demonstrating product-market fit through concrete traction metrics and disciplined unit economics. The deck successfully articulates a clear problem (managing social media distribution at scale), showcases a working product with 55,000 users and $150K ARR, and positions the company as infrastructure for the social media ecosystem through strategic API partnerships. What makes this deck notable is its balance of aggressive growth projections (40% MoM) with conservative, achievable milestones, combined with exceptional advisor credibility (Guy Kawasaki, Hiten Shah) that validates the founders’ execution capability.


Problem Statement

Slide 3: “How do you use social to drive traffic?”

The deck opens with a rhetorical question that frames the core problem: marketers and content creators struggle with strategic social media distribution. This is supported by:

  • Slide 2: Market context showing Zuckerberg’s Law (sharing volume doubles year-over-year) and Donanza’s prediction that social media marketing will surpass SEO
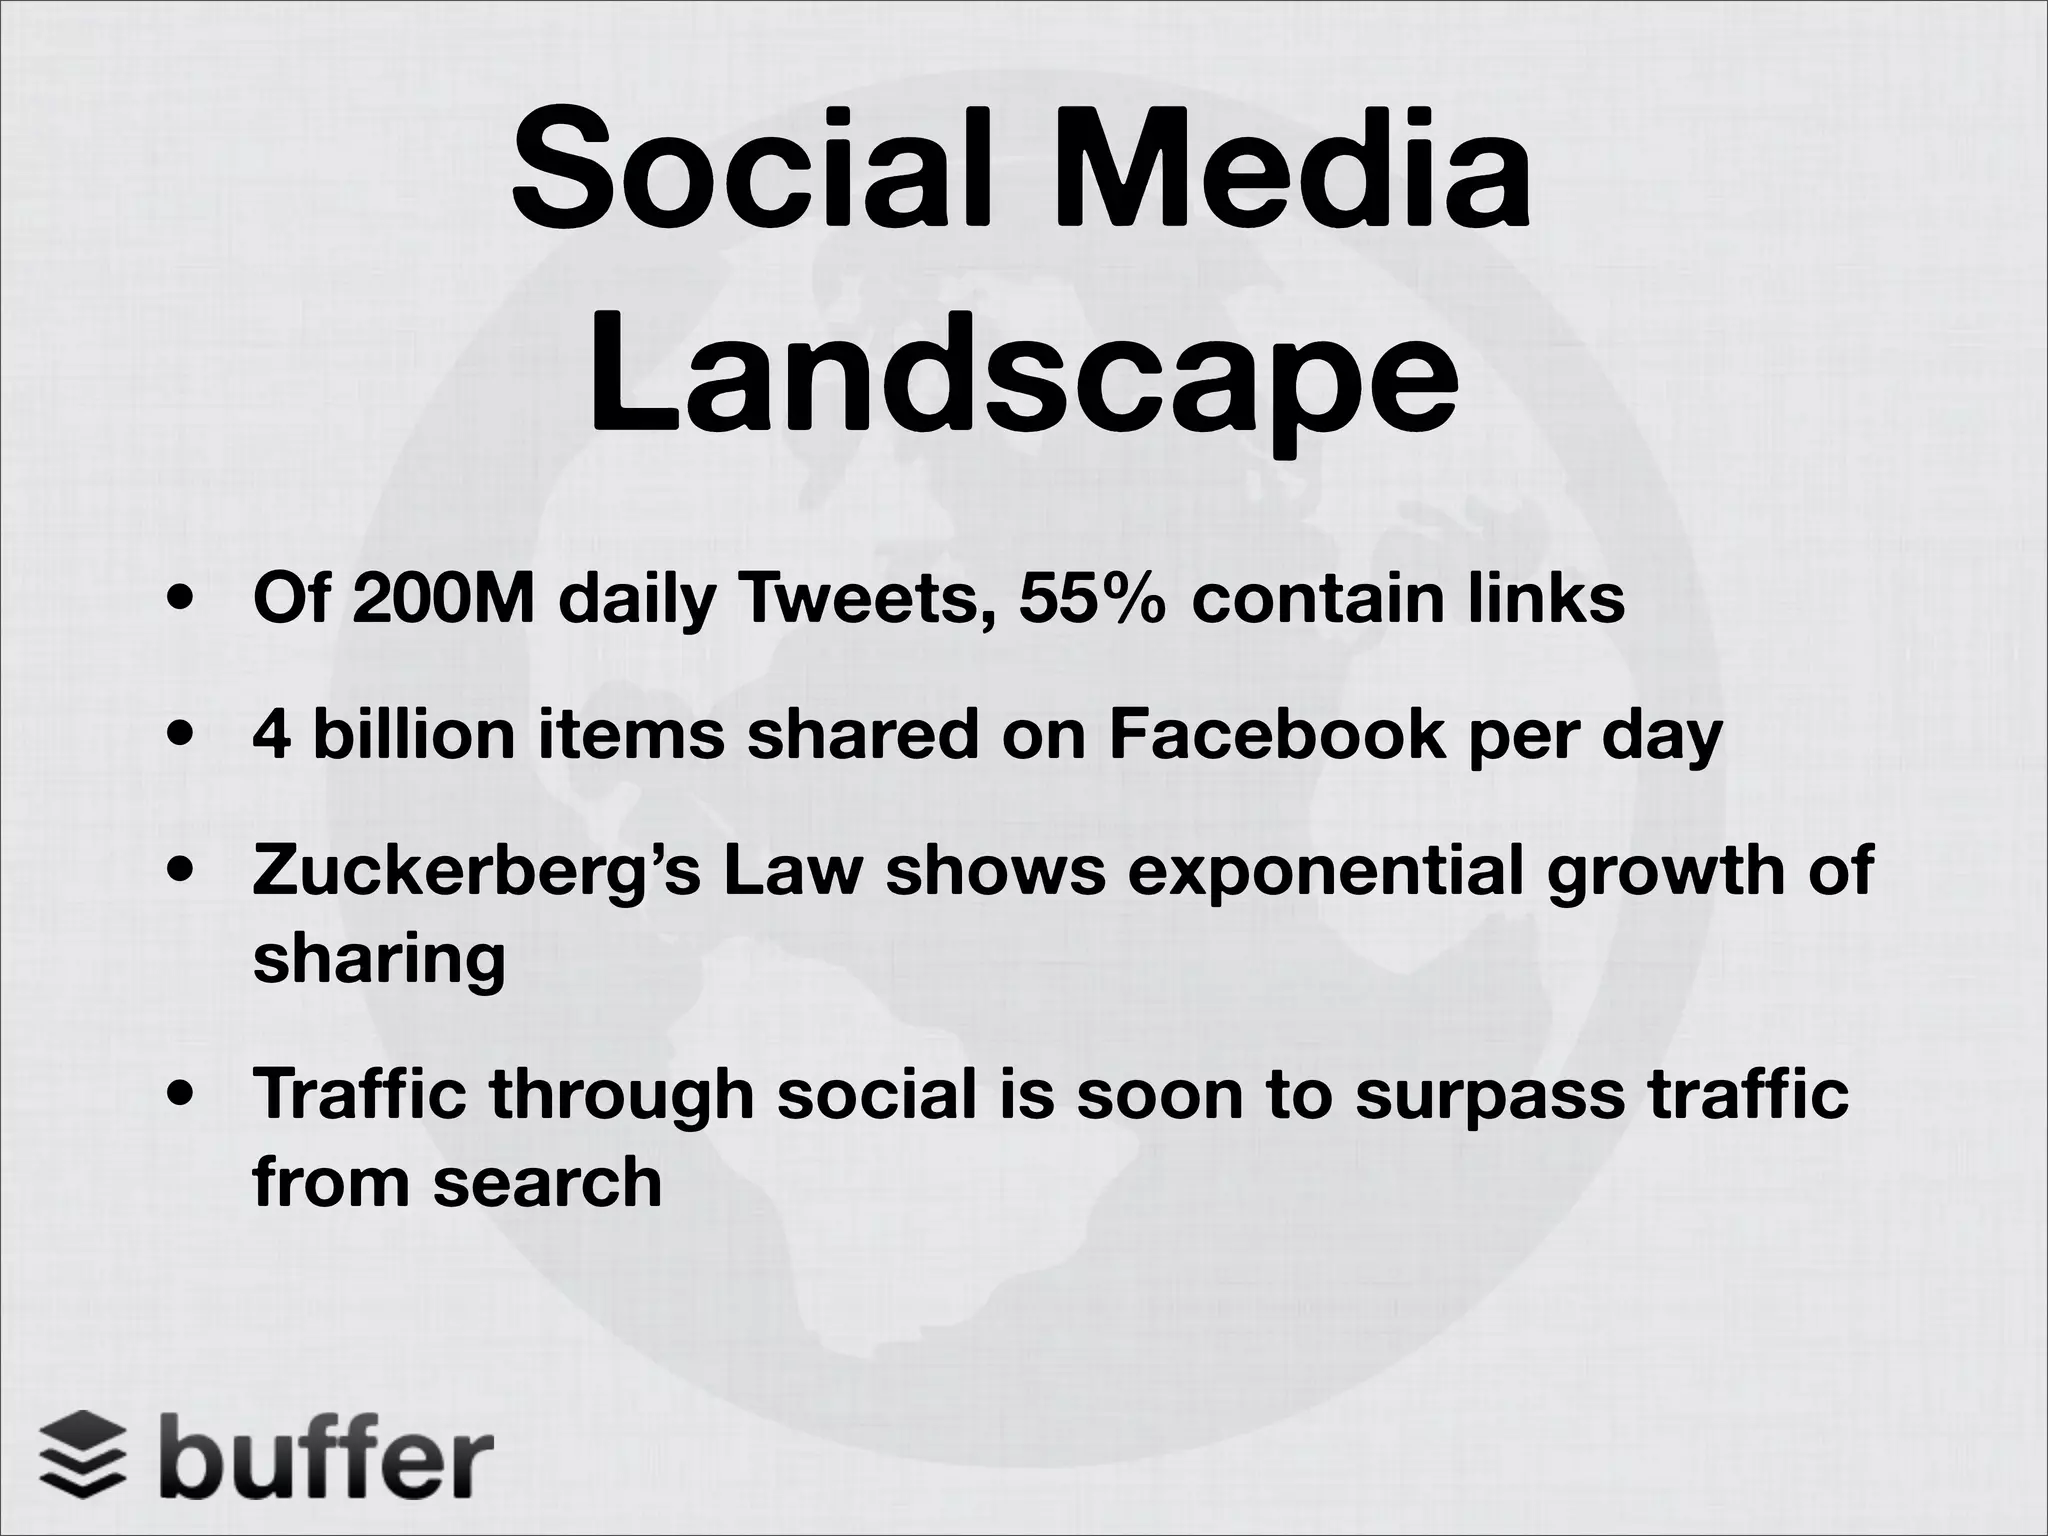
  • Slide 8: Specific market data—200M daily tweets (55% contain links), 4B daily Facebook shares—demonstrating massive volume of content that needs strategic distribution

The problem is implicit rather than explicitly stated: users are sharing more content than ever, but doing so reactively rather than strategically, missing optimal posting times and audience engagement windows.


Solution

Slide 4: “Queue your updates”

Buffer solves the problem through a simple, elegant product: a content scheduling queue that allows users to batch-prepare social media posts and distribute them at optimal times across multiple platforms.

Core Value Proposition:

  • Schedule tweets, Facebook posts, LinkedIn updates in advance
  • Organize by date and time
  • Edit/delete posts before publishing
  • Distribute consistently throughout the day/week without manual posting

Slide 9 validates the solution’s impact with a third-party claim: “Buffer Finds Tweet Scheduling Can Increase Clicks by 200%” (ReadWriteWeb), directly connecting the feature to business outcomes (traffic/engagement).


Market Opportunity

TAM/SAM/SOM Analysis:

The deck does not explicitly quantify TAM, SAM, or SOM, but provides directional market data:

Market Size Indicators (Slide 8):

  • 200M daily tweets (55% contain links) = ~110M link-containing tweets/day
  • 4B items shared on Facebook per day
  • Zuckerberg’s Law: sharing volume doubles year-over-year (exponential growth)
  • Social traffic soon to surpass search traffic (directional shift in marketing spend)

Implied Market Opportunity:

  • Target: Content creators, marketers, small businesses, agencies managing social presence
  • Growth Driver: Shift from SEO to social media as primary traffic source
  • Timing: 2011 was early in social media marketing maturity—first-mover advantage in scheduling tools

What’s Missing:

  • No explicit TAM calculation (e.g., “X million marketers × Y average spend = $Z market”)
  • No SAM/SOM breakdown by segment
  • No competitive market share analysis
  • No geographic or vertical segmentation

Business Model

Slide 7: “Business Model”

Monetization Strategy: Freemium SaaS

Key Unit Economics:

  • Free-to-Paid Conversion Rate: 2% (consistent)
  • Monthly Churn Rate: 5%
  • Lifetime Value (LTV): $240
  • Maximum CAC Budget: $5 per user
  • LTV:CAC Ratio: 48:1 (excellent)

Revenue Scaling:

  • At 1M users, projected revenue = $3.6M
  • Implied ARPU: ~$20/year (from LTV calculation)

Financial Discipline:
The 48:1 LTV:CAC ratio demonstrates sophisticated unit economics understanding. The $5 CAC budget is conservative relative to LTV, suggesting sustainable growth.

Mathematical Inconsistency (Red Flag):

  • Slide 5 shows: 800 paying users from 55K total = 1.45% conversion, $150K ARR = $187.50 ARPU
  • Slide 7 implies: $240 LTV ÷ 5% monthly churn = ~$20/year ARPU
  • Discrepancy: ARPU math doesn’t align across slides. Either (a) conversion rates are improving over time, (b) pricing is increasing, or (c) LTV assumptions differ from actual data.

Traction & Metrics

Slide 5: “Traction” (as of October 2011)

Metric Value Significance
Paying Users 800 Validates monetization
Total Users 55,000 Demonstrates scale
Monthly Growth Rate 40% Exceptional for seed stage
Annual Revenue Run Rate $150,000 Proof of revenue model
Gross Margins 97% Highly scalable SaaS model
Total Updates Buffered 1.5M Product usage validation

Growth Trajectory:

  • Launched web app: January 2011
  • Reached 55K users in 9 months (40% MoM growth)
  • Implies: 200 users → 55K users in 9 months = 275x growth

Conversion Metrics:

  • Free-to-paid conversion: 1.45% (800 paying ÷ 55K total)
  • This is relatively low but not unusual for freemium SaaS in 2011

What’s Missing:

  • No retention/churn data by cohort
  • No CAC breakdown by channel
  • No LTV validation against actual customer data
  • No monthly recurring revenue (MRR) vs. ARR clarification

Competitive Positioning

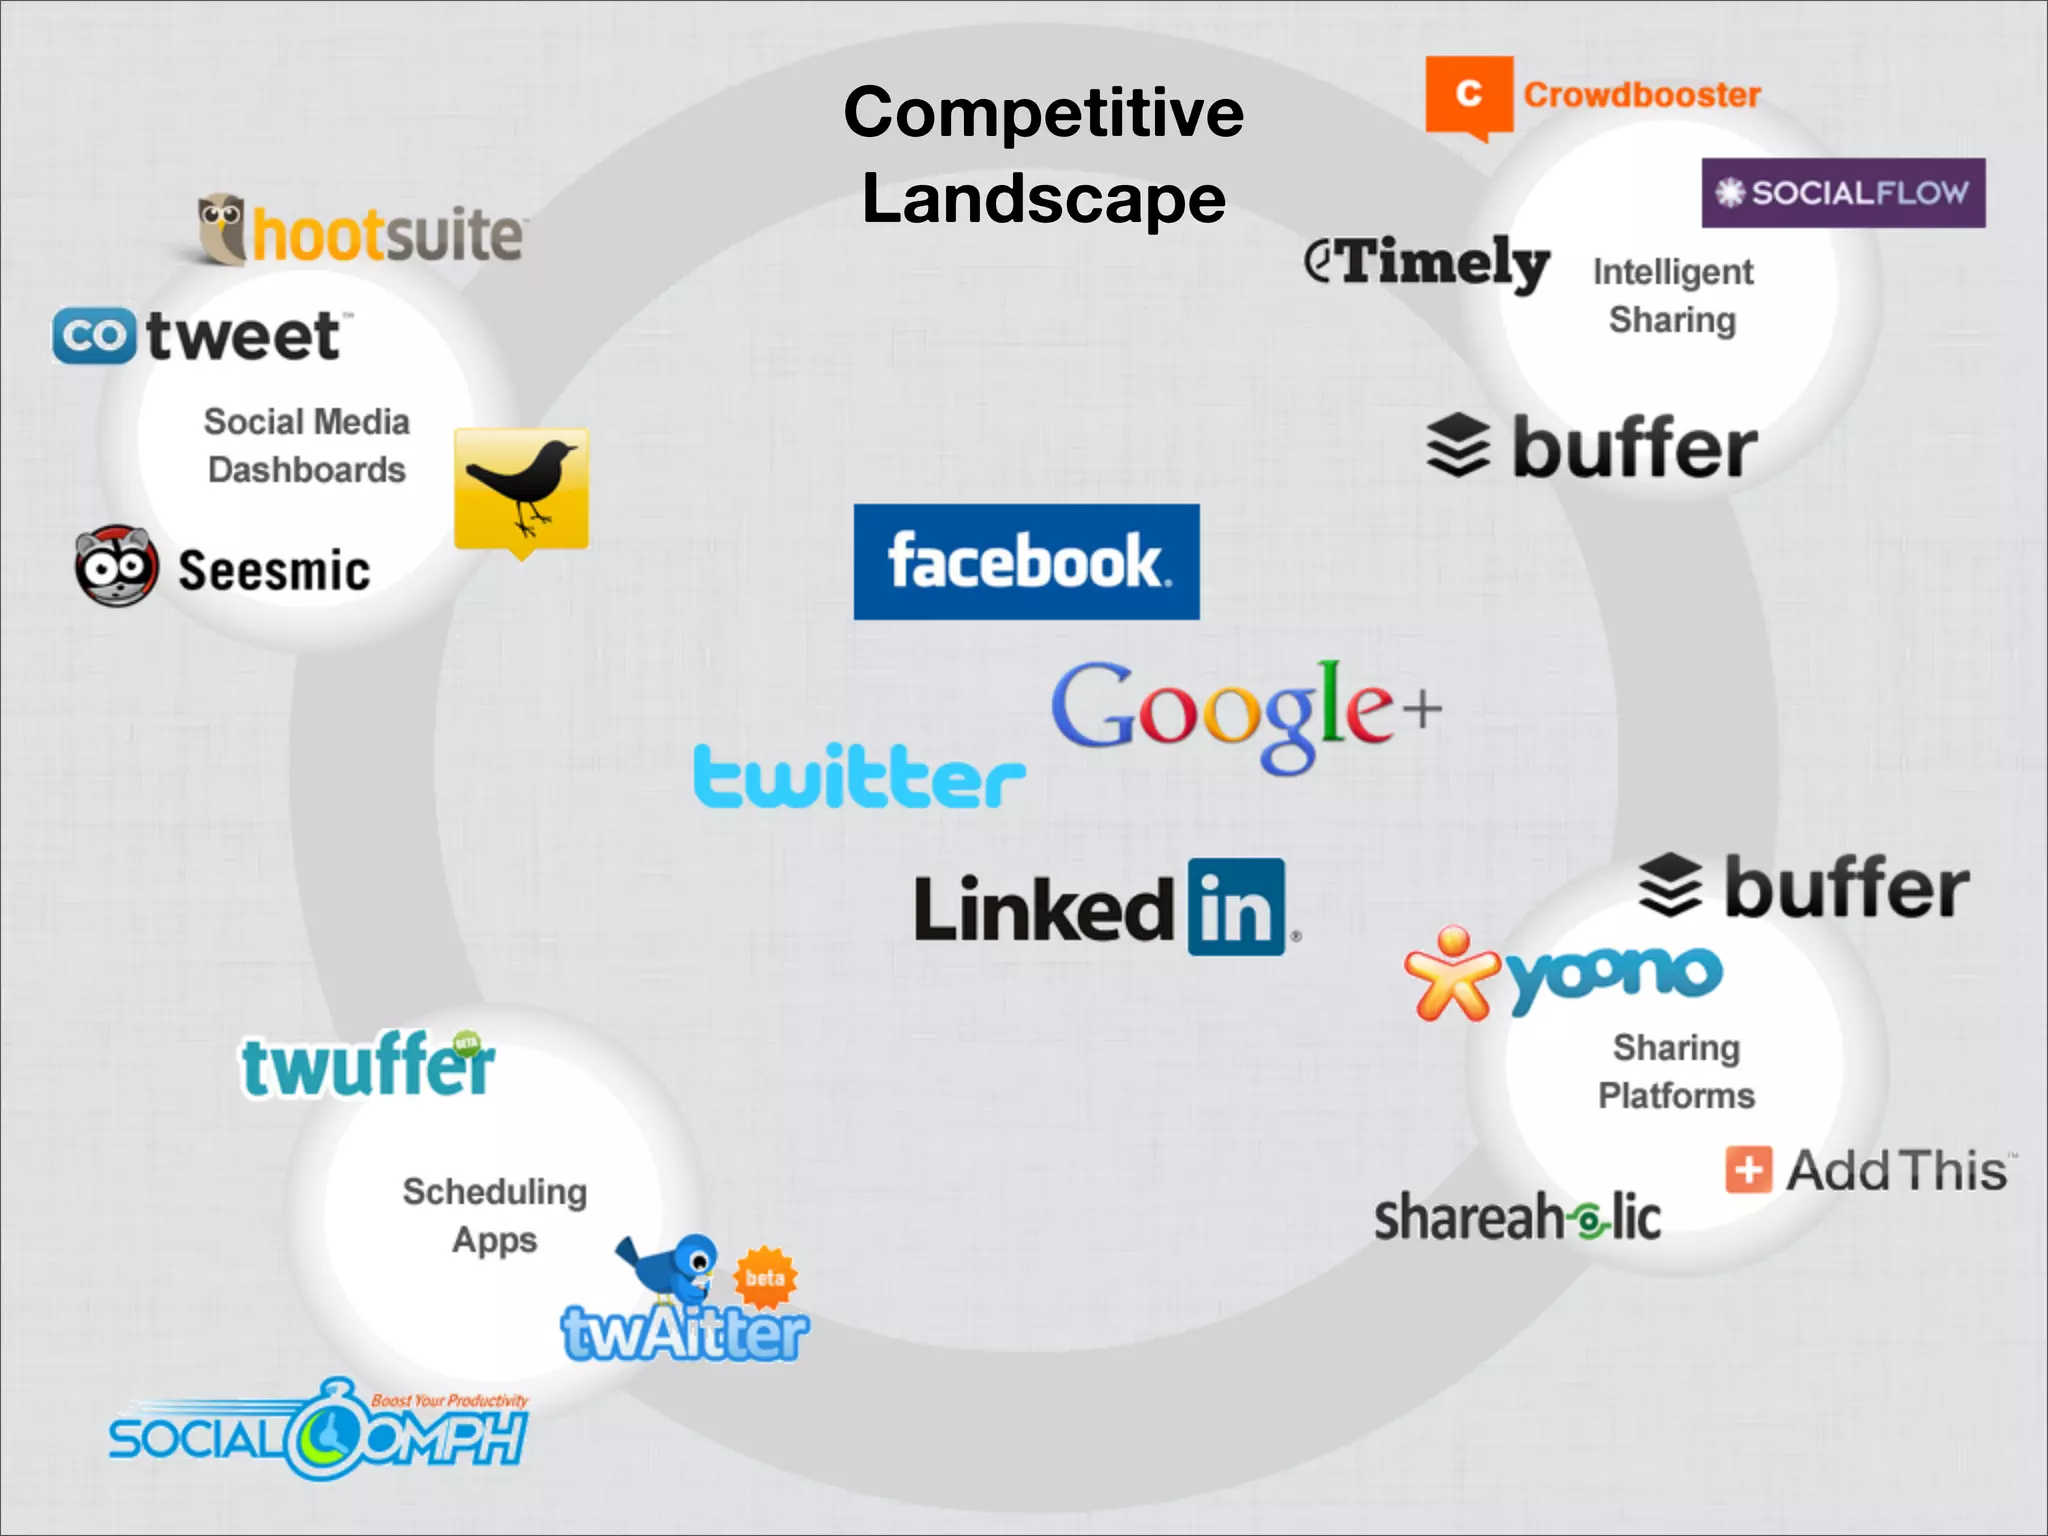
Slide 11: “Competitive Landscape”

Competitive Categories Identified:

  1. Social Media Dashboards (full-featured, complex)
    • Hootsuite, CoTweet, Seesmic
    • Positioning: All-in-one management platforms
  2. Scheduling Apps (focused, simple)
    • Twuffer, twAitter, SocialComph
    • Positioning: Lightweight scheduling tools
  3. Intelligent Sharing (AI-driven optimization)
    • Timely, Socialflow
    • Positioning: Optimal timing recommendations
  4. Sharing Platforms (browser extensions, integrations)
    • Yoono, AddThis, Shareaholic
    • Positioning: Distribution infrastructure
  5. Platforms (native capabilities)
    • Twitter, Facebook, LinkedIn, Google+
    • Positioning: Built-in scheduling (future threat)

Buffer’s Positioning:
Buffer appears to occupy the space between “Intelligent Sharing” and “Scheduling Apps”—simple, focused scheduling with some optimization features.

Differentiation Claims (Implicit):

  • Simpler than Hootsuite (dashboard complexity)
  • More integrated than standalone scheduling tools (API partnerships)
  • Becoming “default sharing standard” across apps (platform strategy)

What’s Missing:

  • No explicit competitive advantages articulated
  • No pricing comparison
  • No feature comparison matrix
  • No explanation of why Buffer wins vs. Hootsuite, Timely, or native platform features
  • Major Risk Underplayed: Doesn’t address that Twitter/Facebook could build scheduling natively (which they eventually did)

Team

Slide 12: “Team”

Co-Founders:

  1. Joel Gascoigne (Technical)
    • Role: Co-Founder
    • Background: Masters in Computer Science
    • Key Achievement: Took idea to revenue in 7 weeks
    • Implication: Fast execution, technical depth, product sense
  2. Leo Widrich (Growth/Marketing)
    • Role: Co-Founder
    • Background: Marketer
    • Key Achievement: Grew Buffer from 200 to 55,000 users
    • Implication: Exceptional growth execution, marketing acumen

Complementary Skills: Technical founder + marketing founder = strong founder pairing

Advisors:

  1. Guy Kawasaki
    • Former Chief Evangelist of Apple
    • Co-Founder of Alltop
    • Author of ten books
    • Significance: Legendary tech evangelist, credibility with investors and media
  2. Hiten Shah
    • CEO/Co-Founder of KISSmetrics
    • Previously founded CrazyEgg & ACS
    • Significance: Successful serial entrepreneur, SaaS expertise, analytics domain knowledge

Team Credibility Assessment:

  • Founder Execution: Exceptional (7 weeks to revenue, 275x user growth)
  • Advisor Pedigree: Outstanding (Kawasaki + Shah are heavyweight validators)
  • Previous Investor Validation: Strong (AngelPad, Sierra Ventures, InterWest Partners)

What’s Missing:

  • No mention of current team size or hiring plans
  • No organizational structure or role clarity (CEO/CTO)
  • No information on how $500K will be allocated to team expansion
  • No diversity representation mentioned
  • Limited background on Leo beyond “marketer”
  • No explanation of advisor involvement level or commitment

Go-to-Market Strategy

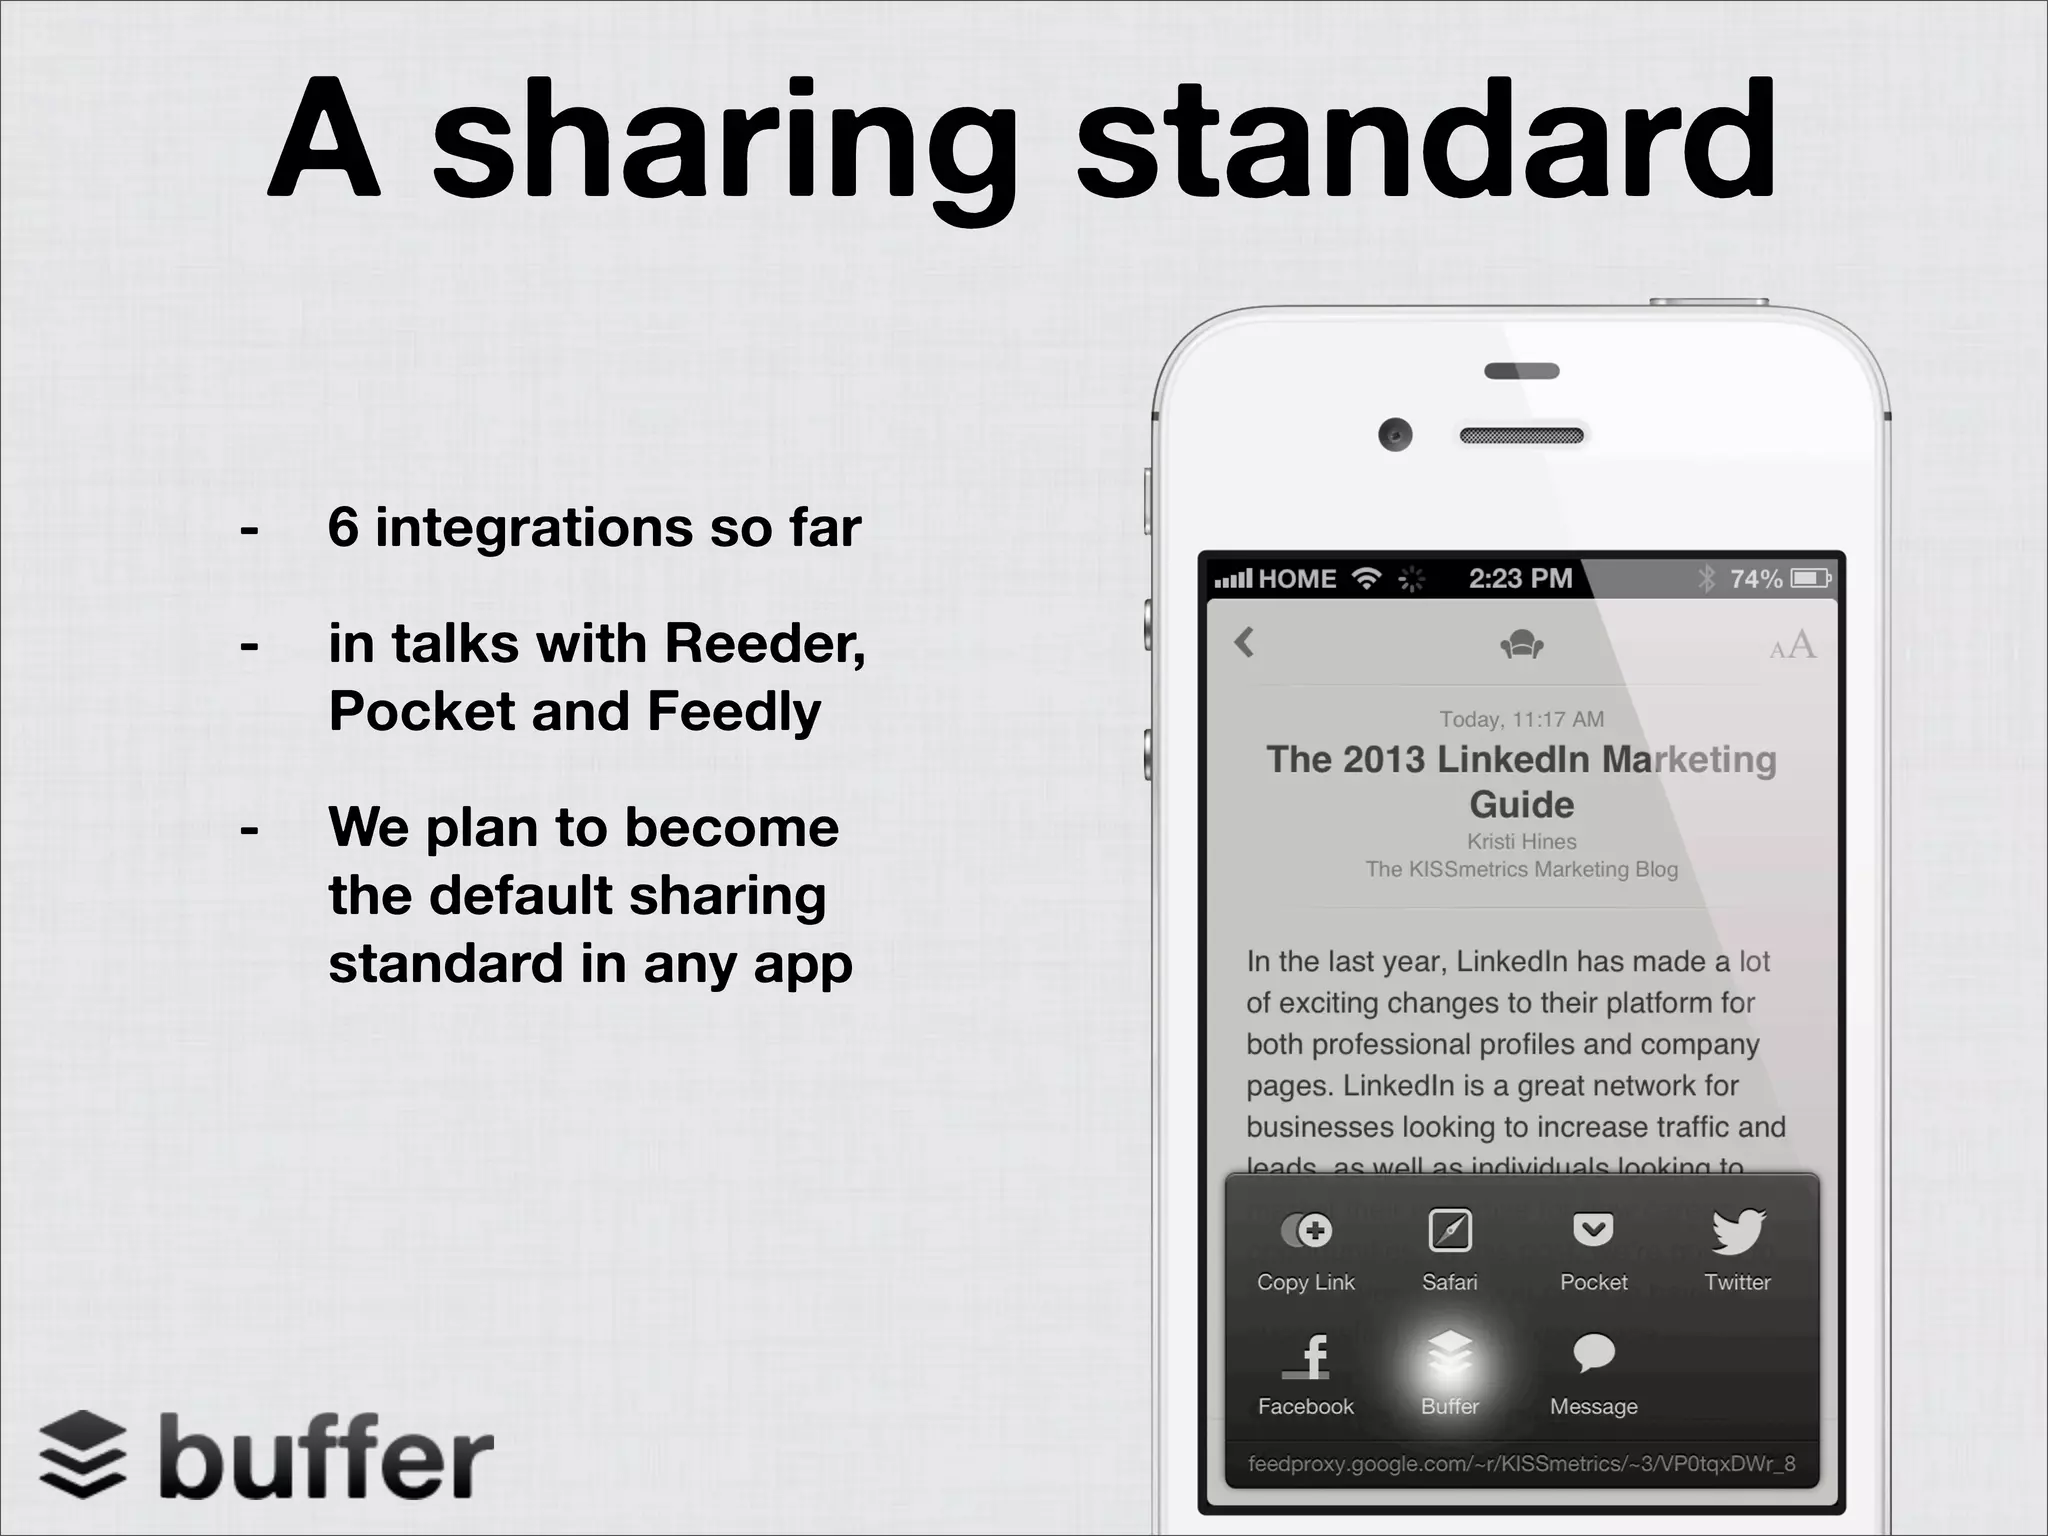
Slide 10: “A sharing standard”

Distribution Strategy: Platform Integration

Rather than relying solely on direct user acquisition, Buffer pursues a platform strategy:

Current Integrations (6):

  • Integrated into iOS share sheet
  • Appears alongside native sharing options (Twitter, Facebook, Pocket, Safari, Message)

Prospective Partnerships:

  • Reeder (RSS reader)
  • Pocket (read-it-later app)
  • Feedly (RSS reader)

Strategic Vision:
“We plan to become the default sharing standard in any app”

Rationale:

  • Places Buffer at the point of content discovery/sharing decision
  • Reduces friction (one-tap sharing vs. separate app)
  • Creates distribution channels beyond direct marketing
  • Builds network effects (more apps = more users = more value)

Execution Evidence:

  • iOS share sheet integration already live (visual proof on Slide 10)
  • 6 integrations achieved by October 2011
  • Demonstrates feasibility of partnership strategy

What’s Missing:

  • No CAC comparison: direct acquisition vs. partnership-driven acquisition
  • No retention data: do integrated users have better/worse retention?
  • No revenue impact: what % of users come through integrations?
  • No timeline: when will Pocket/Feedly/Reeder integrations launch?
  • No exclusivity: why would partners choose Buffer over competitors?

The Ask

Explicit Ask: Not clearly stated in the deck

Implied Ask (from context):

  • Amount: $500K seed round
  • Use of Funds: Not specified in the deck

What Should Have Been Included:

  • Explicit statement: “We are raising $500K to…”
  • Use of funds breakdown (e.g., 50% engineering, 30% marketing, 20% operations)
  • Hiring plan (how many people, what roles)
  • Runway: how long will $500K last?
  • Valuation/equity offered
  • Timeline for next round

Investor Materials Provided:

  • Previous investors: AngelPad, Sierra Ventures, InterWest Partners (social proof)
  • Contact: [email protected]

Investor Deep Dive

Executive summary, strengths & red flags

Executive Summary

Buffer's 2011 seed pitch deck is a masterclass in demonstrating product-market fit through concrete traction metrics and disciplined unit economics. The deck successfully articulates a clear problem (managing social media distribution at scale), showcases a working product with 55,000 users and $150K ARR, and positions the company as infrastructure for the social media ecosystem through strategic API partnerships. What makes this deck notable is its balance of aggressive growth projections (40% MoM) with conservative, achievable milestones, combined with exceptional advisor credibility (Guy Kawasaki, Hiten Shah) that validates the founders' execution capability.

Key Strengths

5 identified

1

Exceptional Traction Metrics

55,000 users, 40% MoM growth, $150K ARR, 97% margins, 1.5M updates buffered (Slide 5)

2

Complementary Founder Team with Proven Execution

Joel (7 weeks to revenue, CS degree) + Leo (200→55K user growth) + advisor credibility (Kawasaki, Shah) (Slide 12)

3

Clear Product-Market Fit with Quantified Impact

Product demo (Slide 4) + ReadWriteWeb validation: "200% increase in clicks" (Slide 9)

4

Disciplined Unit Economics with Sustainable Growth Model

2% conversion, 5% churn, $240 LTV, $5 CAC budget, 48:1 LTV:CAC ratio (Slide 7)

5

Platform Strategy for Scalable Distribution

6 integrations, iOS share sheet integration live, partnerships with Pocket/Feedly/Reeder in progress (Slide 10)

More Pitch Decks To Study

Compare structure, fundraising context, and investor-facing story across similar startup decks.