Compare your deck to Amplitude

Compare Your Deck

Amplitude Pitch Deck (2017)

SaaS
Stage: Series C
Raised: $30M
Year: 2017
Slides: 8
Outcome: IPO at $5B valuation

Pitch Deck

1 / 8
Amplitude pitch deck - The Opening: Strong branding and a clear mission
Click to expand

Deck Analysis

This Series C pitch deck from Amplitude (2017) positions the company as the product analytics platform that helps enterprise product teams "build better products." The deck pairs clear market framing — the digital transformation of all industries — with concrete proof points: marquee customers, a steep ARR growth chart, and product capabilities that address complex, behavioral questions. What makes it notable is the combination of storytelling (why the market needs a new class of analytics) and tactical product positioning (real-time behavioral queries, scalability, and collaboration) that foreshadowed Amplitude's later success and eventual IPO.

The Opening: Strong branding and a clear mission

The Opening: Strong branding and a clear mission

Slide 1 is a classic example of how to open a deck: single, clean visual with the logo, a short, memorable tagline (“Build Better Products”), and a date. The slide sets tone and audience expectations without distracting details — investors immediately know this is a product-focused company and that the deck will be about enabling product teams. The background cityscape and consistent color palette also establish brand identity and professionalism.

Founders can learn from this restraint: a title slide should establish the mission and brand cadence, not cram in metrics or team bios. That one-line mission gives the rest of the presentation a through-line, so every subsequent slide can be judged against whether it helps teams “build better products.”
Key Takeaway: Open with a concise mission and clean brand presentation that sets the narrative for the rest of the deck.
Traction & credibility: customers, team, and growth

Traction & credibility: customers, team, and growth

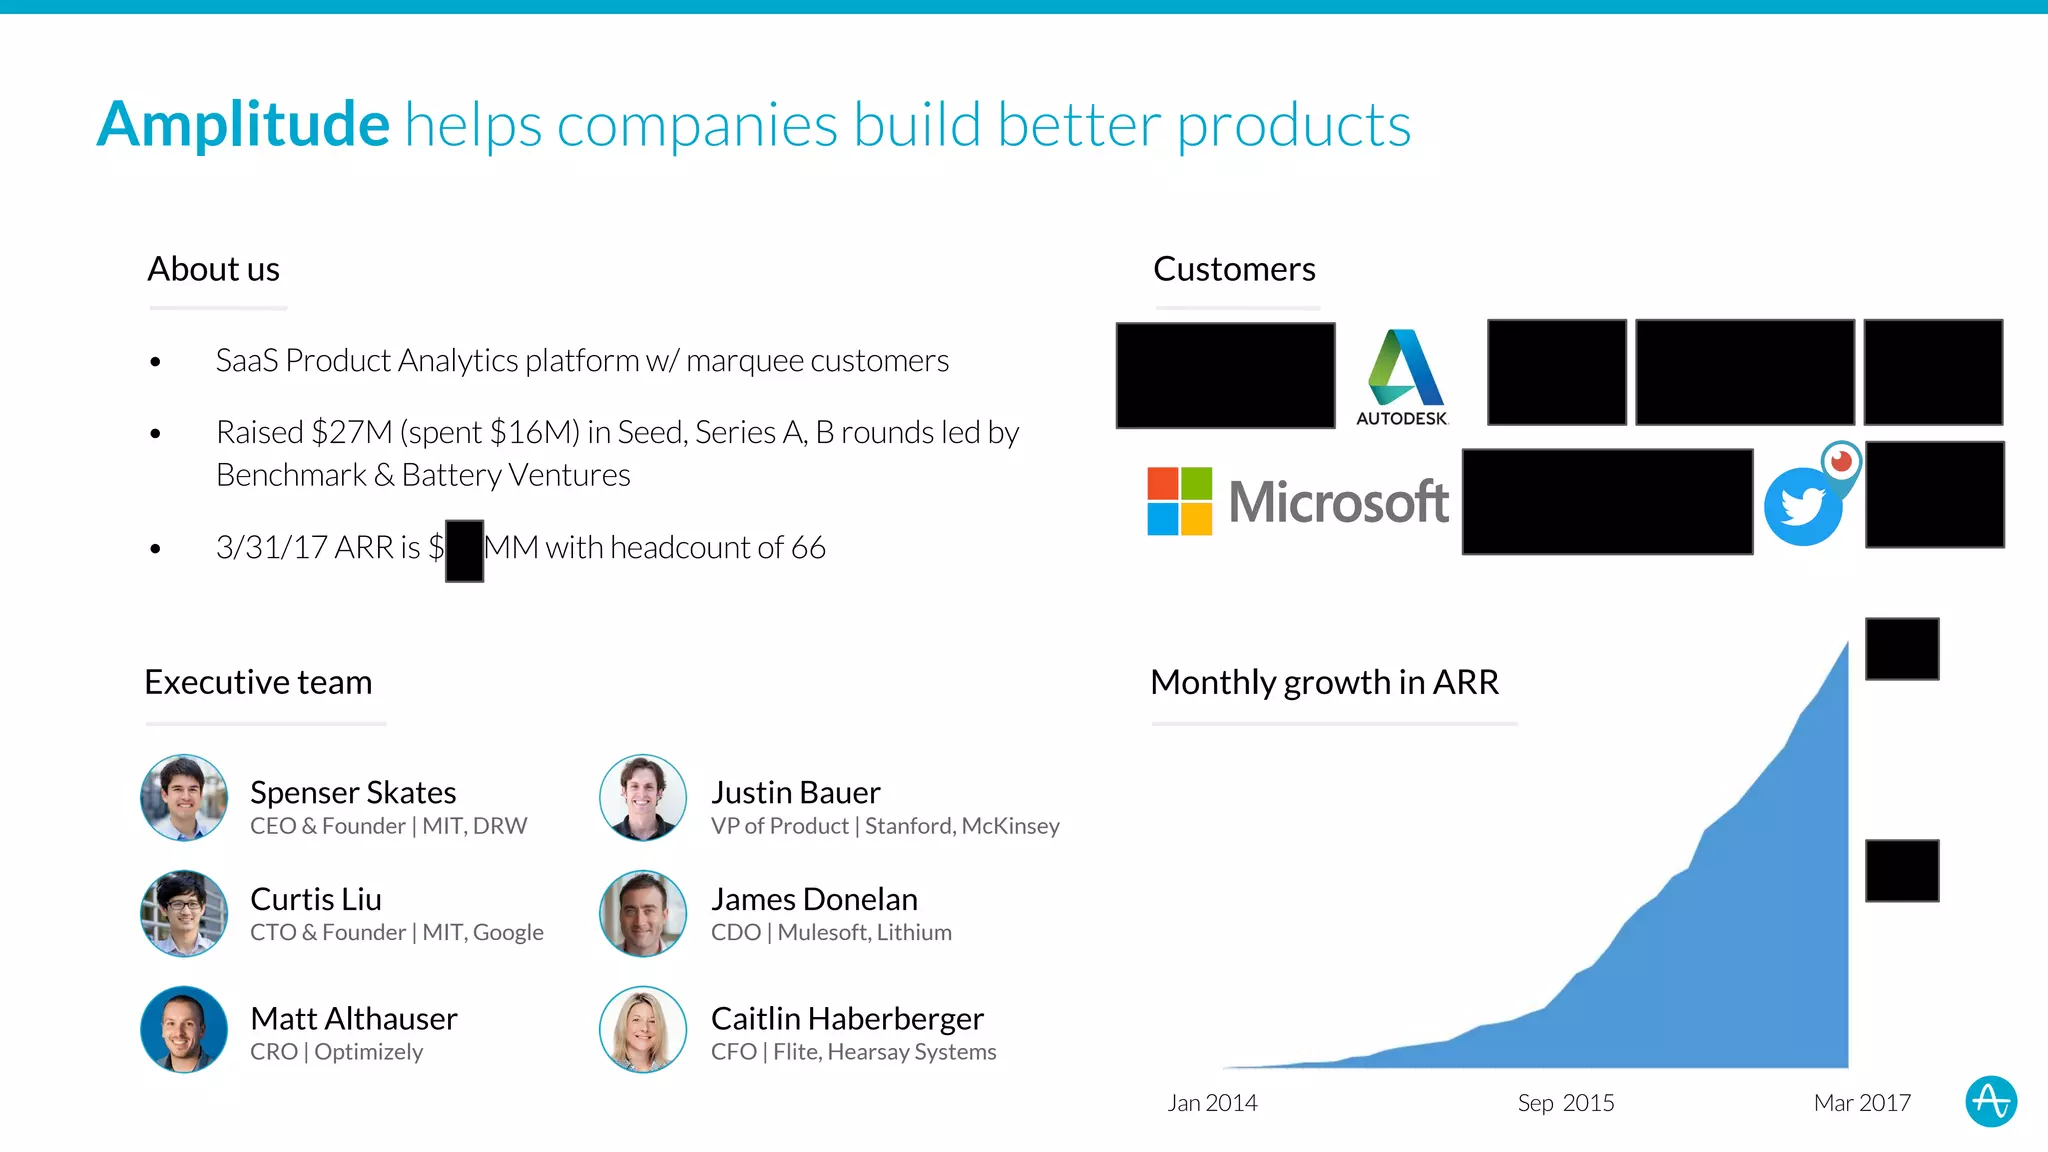
Slide 2 packs several investor-critical elements: a short ‘About us’ summary, financing history, ARR and headcount (ARR partially redacted here), marquee customers (logos), executive team photos/bios, and a clear chart of ARR growth. This slide balances social proof (Microsoft, Autodesk, Twitter icons) with operational evidence (rapid ARR curve and a headcount metric). Showing the executive team with affiliations (MIT, Stanford, McKinsey, Optimizely) reinforces that the company has relevant domain and execution experience.

The design is effective because it consolidates trust signals that VCs look for at a Series C: repeatable revenue trajectory, endorsements from recognizable customers, and a strong leadership bench. Founders should note the order — customers and growth are prominent — and that high-quality visuals (portraits, logos, and a simple growth area chart) communicate maturity faster than text-heavy slides.

Key Takeaway: Combine a concise summary of traction with recognizable customers and a clean growth chart to quickly demonstrate momentum and credibility.
Market narrative: everyone is becoming a digital product business

Market narrative: everyone is becoming a digital product business

Slide 3 delivers the core market insight in a single, emphatic sentence: “All companies are turning into digital product businesses.” It’s a crisp macro thesis that creates urgency and frames the addressable market. By making this the anchor, Amplitude primes investors to interpret subsequent slides through the lens of widespread digital transformation rather than a niche analytics play.

This approach teaches founders to lead with a broad, intuitive market shift that justifies a large opportunity. The simpler and more universal the statement, the easier it is for investors to map industry trends (mobile, SaaS, IoT) onto the product’s value proposition. A one-line market thesis is especially powerful when followed immediately by concrete examples and customer evidence.

Key Takeaway: Lead with a single, memorable market thesis that explains why demand for your product will scale across industries.
Contextualizing change: historical shifts that make product the channel

Contextualizing change: historical shifts that make product the channel

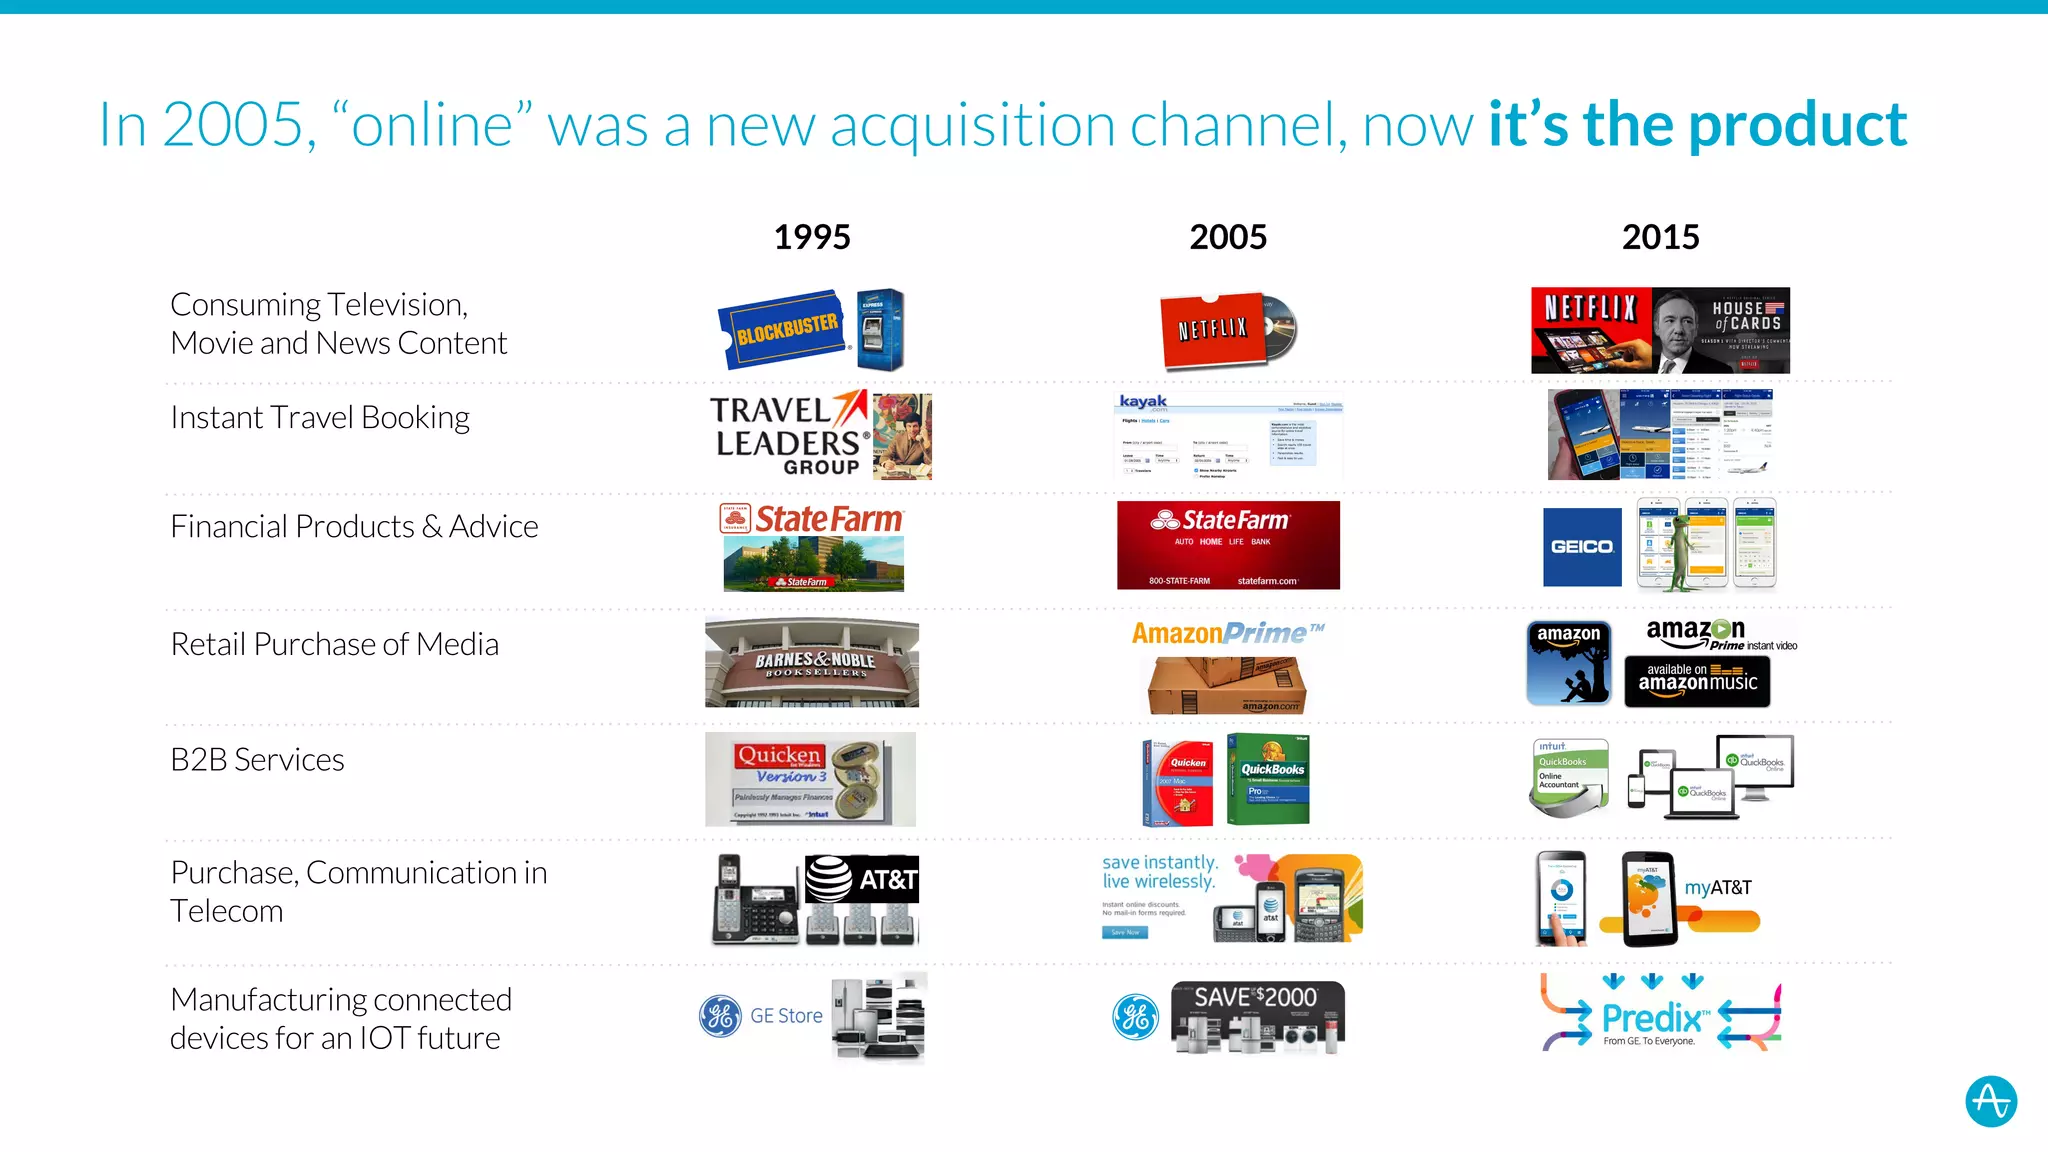
Slide 4 uses a three-column timeline (1995, 2005, 2015) across multiple verticals to show how digital channels evolved into product experiences (e.g., Netflix, Amazon, GE Predix). This visual mapping is persuasive: it converts an abstract trend into tangible, familiar examples and demonstrates that what were once marketing or distribution innovations are now core product experiences. It’s effective because it educates the investor and strengthens the claim that product analytics is now mission-critical.

Founders can replicate this by grounding big market claims with simple historical comparisons and industry logos that highlight progress over time. The slide also implicitly argues that incumbent approaches (legacy analytics) are obsolete — a gentle setup for introducing a differentiated solution.

Key Takeaway: Use historical, cross-industry examples to make the market transition tangible and justify the need for a new category of product tools.
Problem definition: product teams need to measure complex behavior

Problem definition: product teams need to measure complex behavior

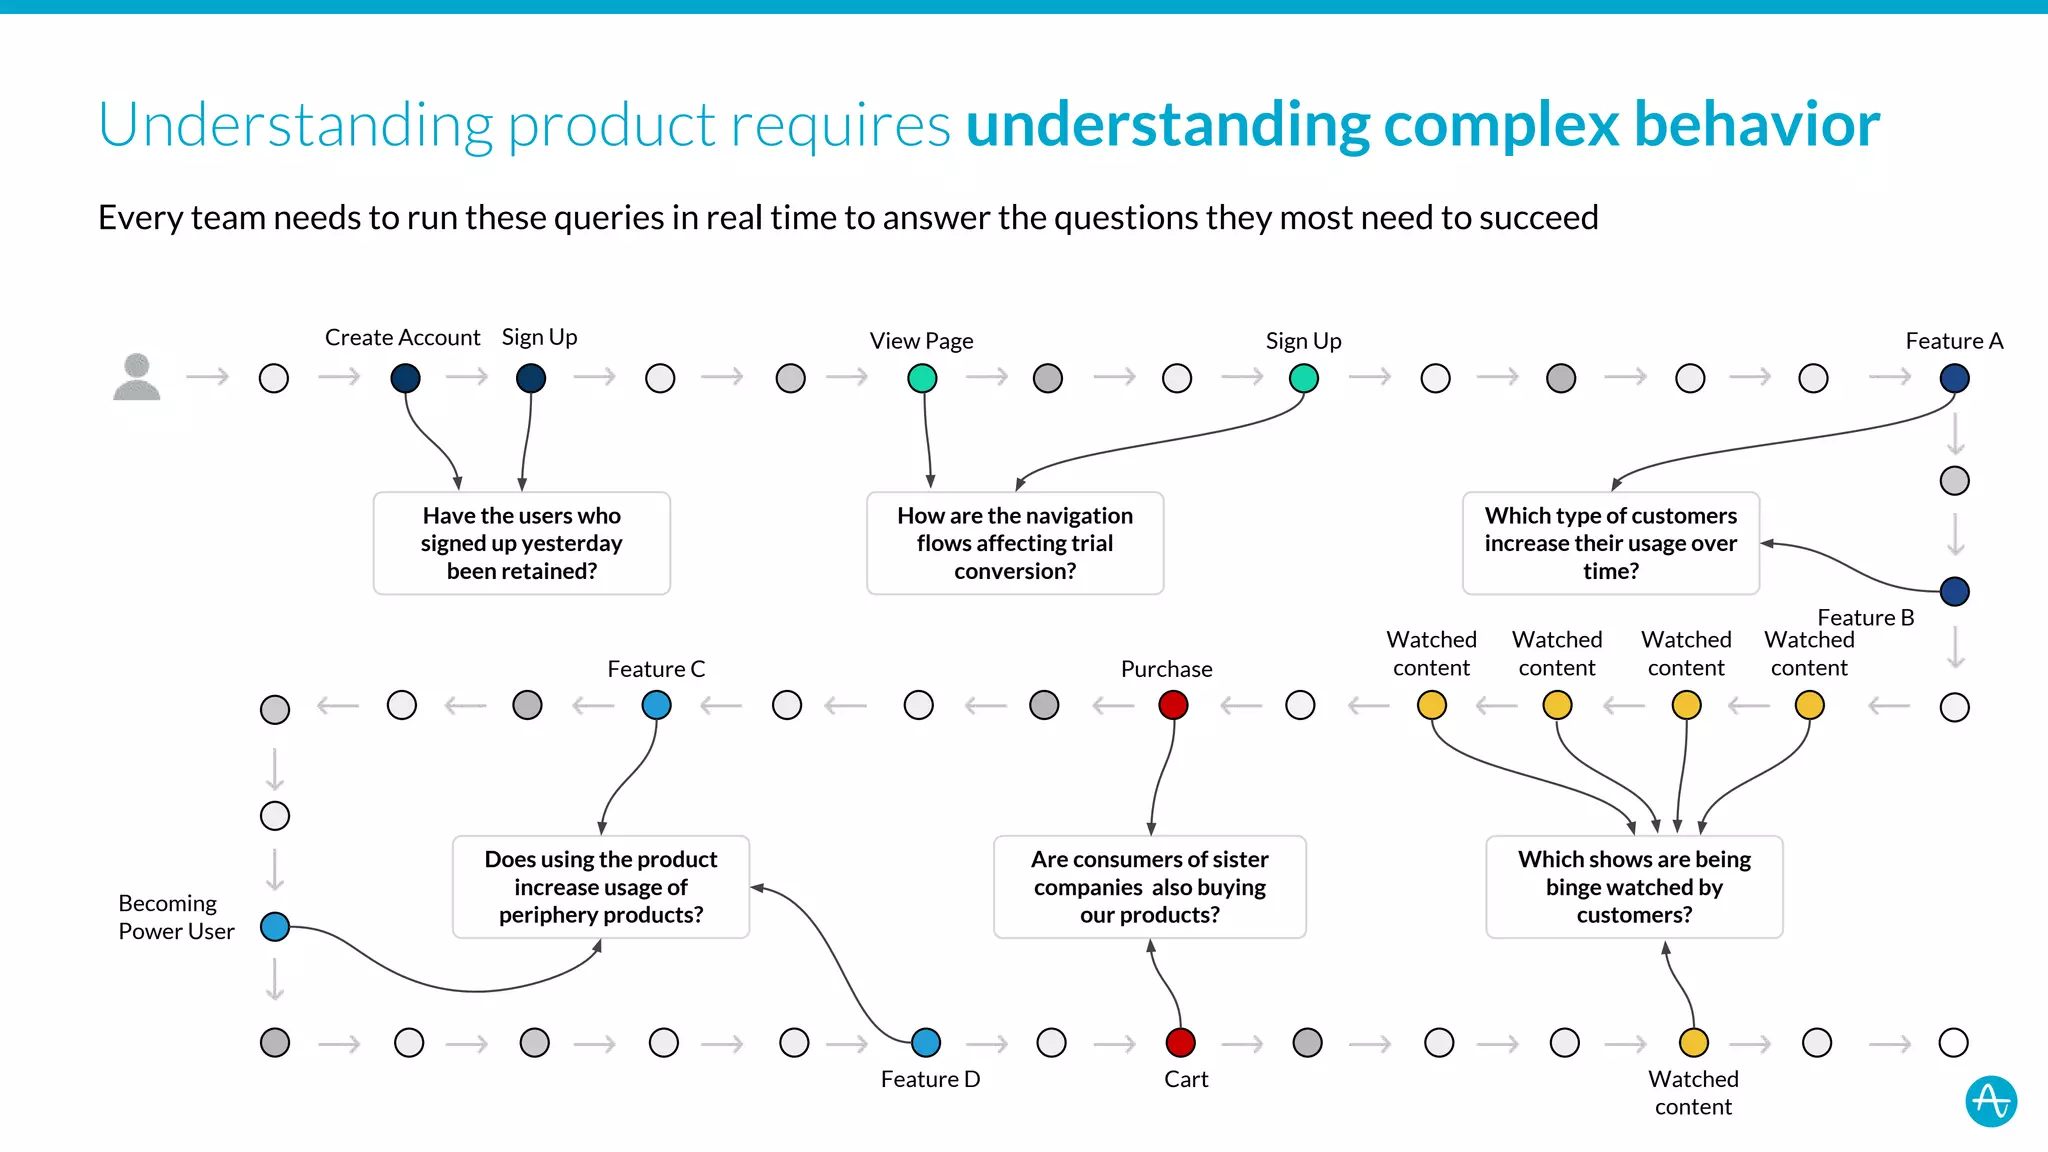
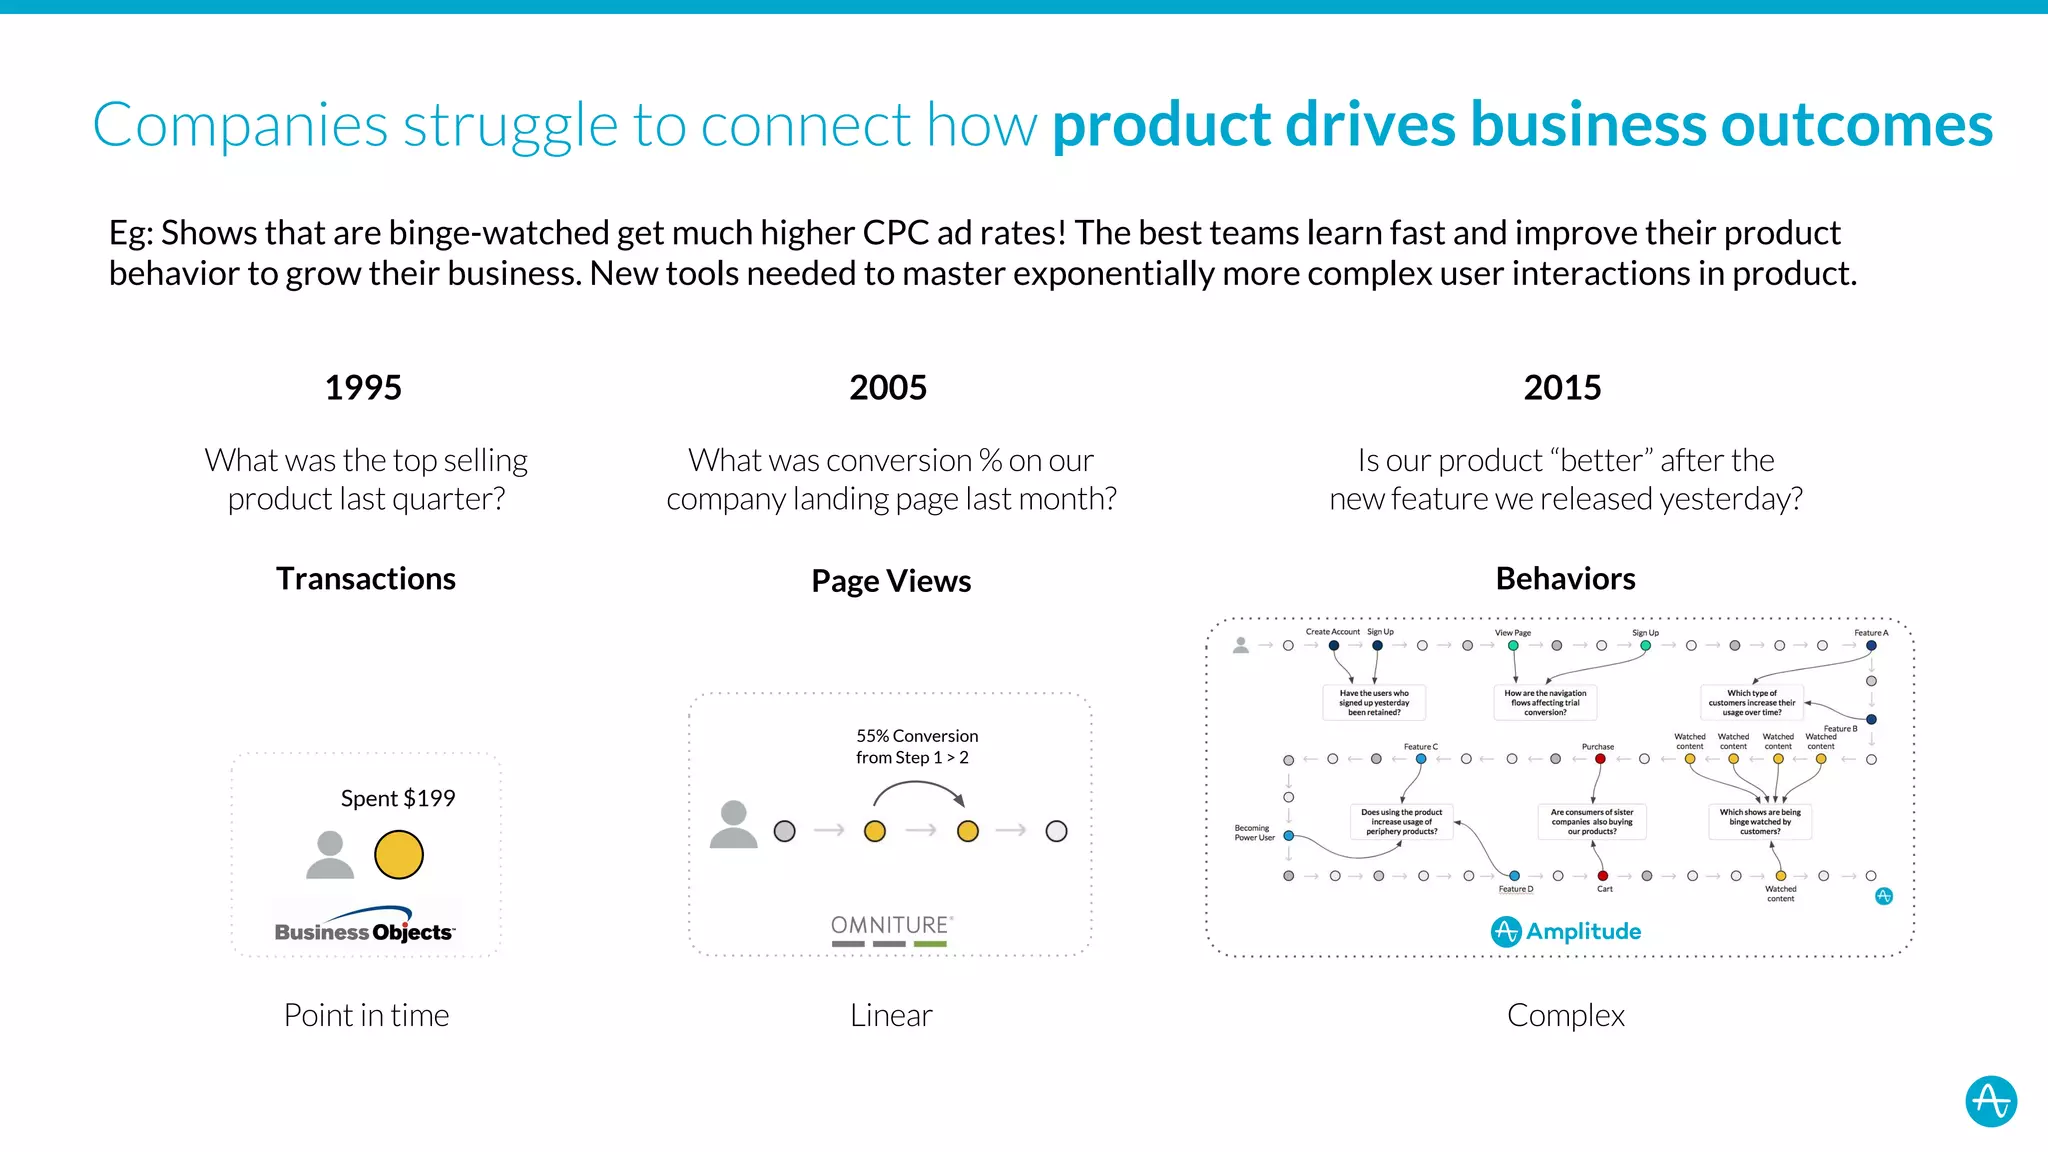
Slide 6 frames the technical and operational challenge: understanding product requires understanding complex, multi-step user behaviors and being able to run those queries in real time. The slide contrasts prior eras (point-in-time transactions, linear page views) with modern behavioral complexity, making it clear why legacy BI and marketing analytics fall short. It articulates the pain point in user and team language — not just technical jargon — which helps non-technical investors grasp product-market fit.

This is an instructive example of problem-first storytelling. By demonstrating the kinds of questions product teams actually ask (retention of yesterday’s signups, conversion flows, which customers increase usage), the deck signals that Amplitude’s feature set was purpose-built. For founders, the lesson is to present the precise, job-to-be-done for customers and show why incumbents can’t solve it — then align product capabilities directly to those jobs.

Key Takeaway: Spell out the concrete, modern customer problems that incumbents can’t solve and map them to real user questions product teams ask.
Product & GTM: capabilities that match the problem

Product & GTM: capabilities that match the problem

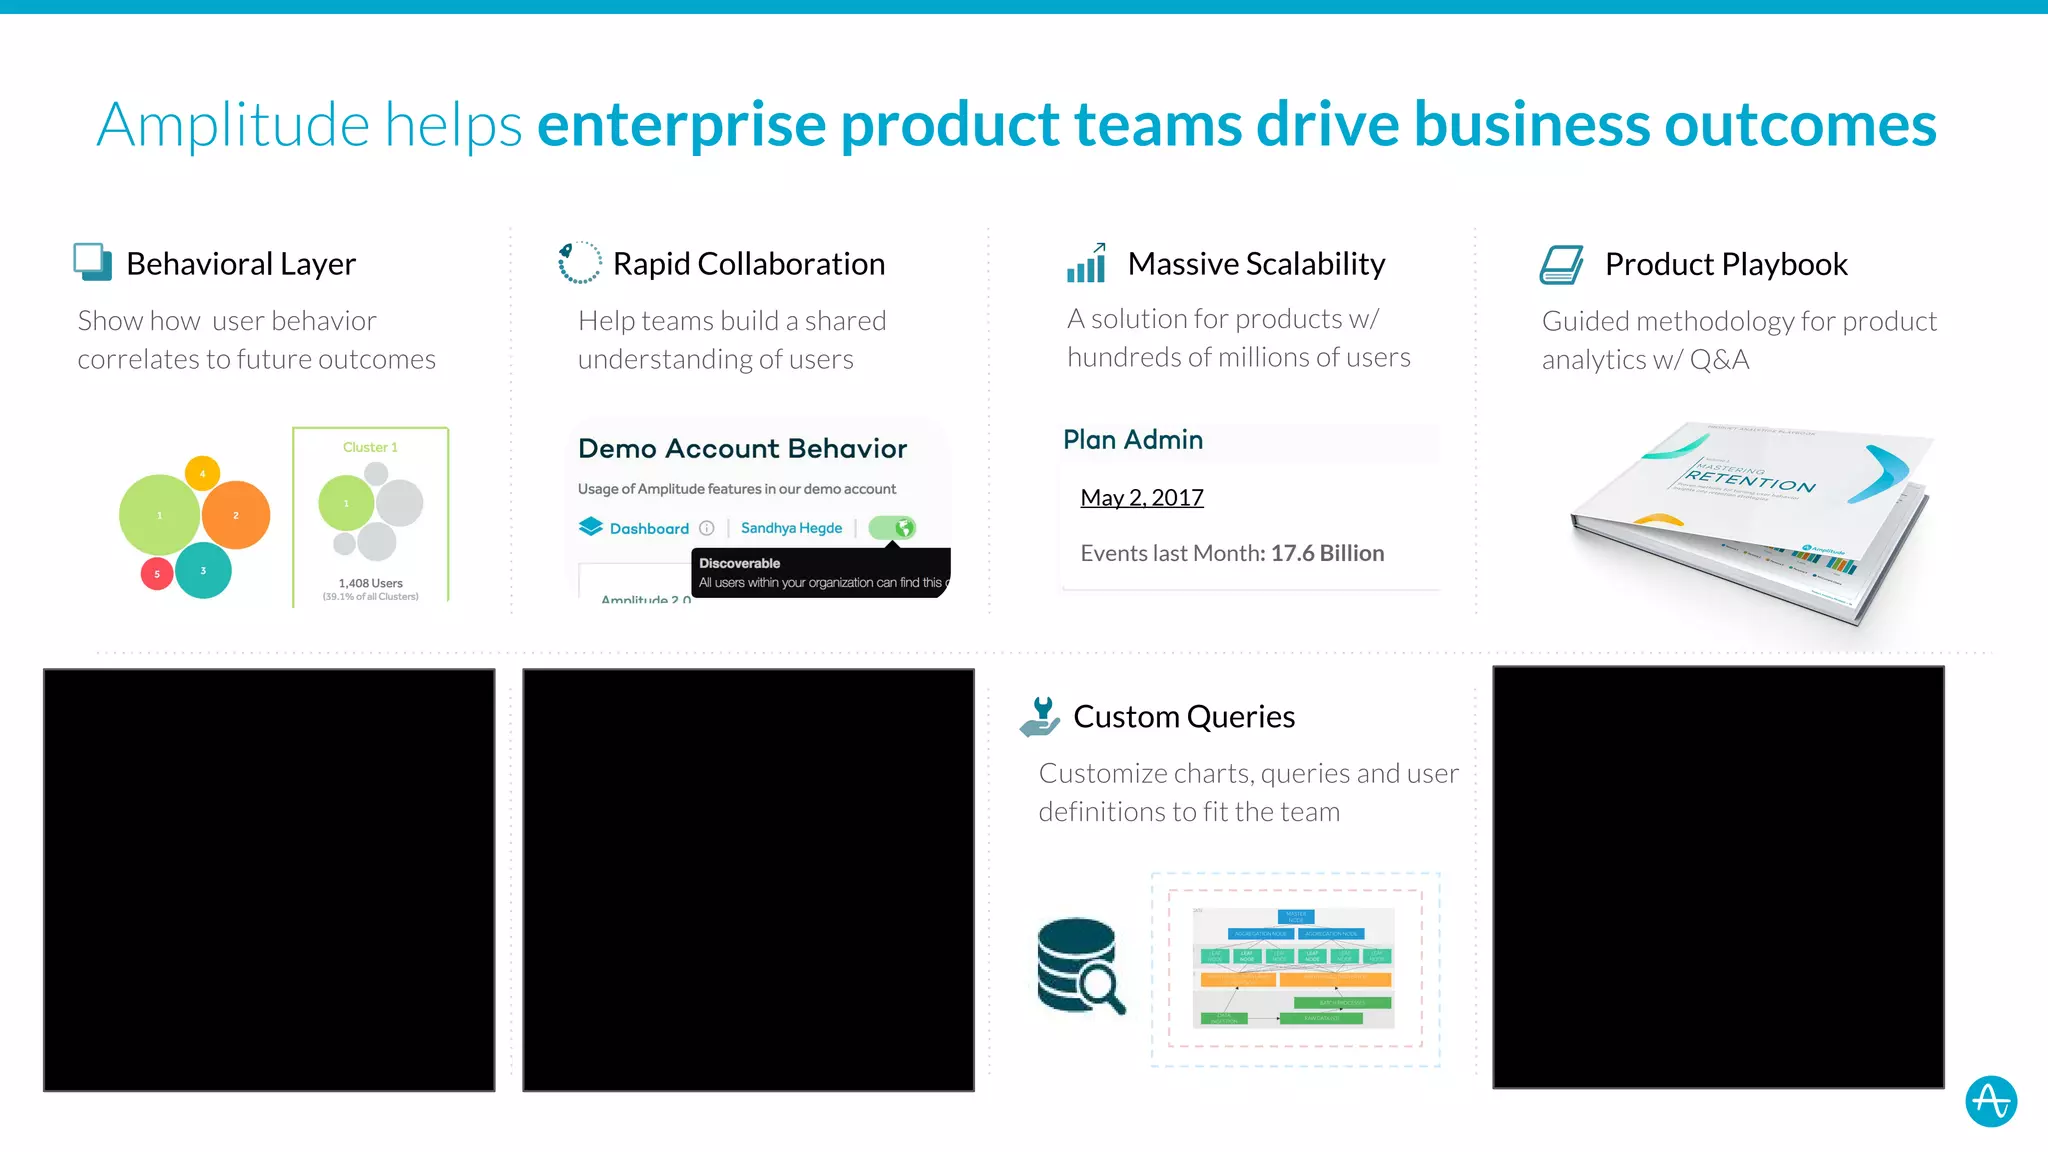
Slide 8 transitions to solution and value props: Behavioral Layer, Rapid Collaboration, Massive Scalability, Product Playbook, and Custom Queries. Each capability maps neatly back to the problems earlier slides described — showing causality between need and feature. The inclusion of an example metric (events last month: 17.6B) and the emphasis on collaboration and playbooks indicate Amplitude’s focus on enterprise customers, not just data teams.

This slide is effective because it moves beyond generic claims to tactical differentiators: real-time scale, team workflows, and methodology. Founders should emulate this structure when describing products: list a small set of differentiated capabilities, tie each to customer outcomes, and include at least one operational metric to prove scale.

Key Takeaway: Present a concise set of differentiated capabilities tied directly to customer outcomes and back them with a scale metric.

Conclusion: Key Lessons

Amplitude’s Series C deck is a strong example of narrative-driven pitch design: start with a crisp mission, define a broad market thesis, show credible traction, explain the specific hard problem customers face, and then present targeted capabilities that solve those problems at scale. Strengths of the deck include visual clarity, strong social proof, and a tight mapping from market insight to product features. For founders building their own decks, actionable advice is to lead with one bold market insight, use recognizable examples and logos to quantify that insight, prioritize problem-driven storytelling (real user questions), and present a short set of differentiated capabilities tied to measurable signals of scale and adoption. Finally, keep slides visually clean and use each one to advance the narrative rather than dump data — clarity and causality win minds and checks.

Full Deck Analysis

11 sections

Overview

Company: Amplitude
Round: Series C ($30M)
Year: 2017
Outcome: IPO at $5B valuation


Executive Summary

Amplitude’s Series C pitch deck presents a compelling narrative around the shift of all companies toward digital product businesses, positioning product analytics as critical infrastructure. The deck effectively combines macro market trends (20-year digital transformation across industries) with specific technical differentiation (real-time behavioral analysis at scale) and strong early traction (66 headcount, enterprise customers, 17.6B events/month). The narrative arc moves from market context → problem definition → fragmented competitive landscape → purpose-built solution, culminating in a Series C raise to accelerate growth. This deck successfully justified a $30M raise and ultimately led to a $5B IPO valuation.


Problem Statement

Core Problem: Companies struggle to connect how product behavior drives business outcomes.

How It’s Articulated:

  • Slide 3 establishes the macro trend: “All companies are turning into digital product businesses”
  • Slide 4 provides historical proof: Shows 20-year evolution across 7 industries (Netflix, Kayak, Amazon, State Farm, etc.) where “online” evolved from acquisition channel to core product
  • Slide 5 defines the specific gap: Companies can’t measure product impact in real-time
    • 1995: “What was the top selling product last quarter?” (Transactions)
    • 2005: “What was conversion % on our landing page last month?” (Page Views)
    • 2015: “Is our product ‘better’ after the new feature we released yesterday?” (Behaviors)
  • Slide 6 visualizes the complexity: Complex user journey mapping shows why simple tools fail; companies need to answer sophisticated questions about retention, conversion, cross-sell, and engagement in real-time

Root Cause: Legacy analytics tools (Business Objects, Omniture) and newer startups lack the technology to handle distributed real-time joins, behavioral complexity, and user-friendly interfaces.


Solution

Positioning: “Amplitude helps enterprise product teams drive business outcomes”

Core Value Proposition: Purpose-built product analytics platform that enables real-time behavioral analysis at enterprise scale.

Key Differentiators (Slide 8):

  1. Behavioral Layer — Correlates user behavior to future business outcomes (not just page views or transactions)
  2. Rapid Collaboration — Enables cross-functional teams (product, marketing, data science) to build shared understanding of users
  3. Massive Scalability — Handles products with hundreds of millions of users; processes 17.6B events/month
  4. Product Playbook — Guided methodology for product analytics with Q&A (consulting/enablement angle)
  5. Custom Queries — Flexible query builder for team-specific analysis

Technical Approach:

  • Real-time distributed joins (vs. slow batch processing)
  • User-friendly interface (vs. requiring data scientists)
  • Behavioral event tracking (vs. page view/transaction-only metrics)

Market Opportunity

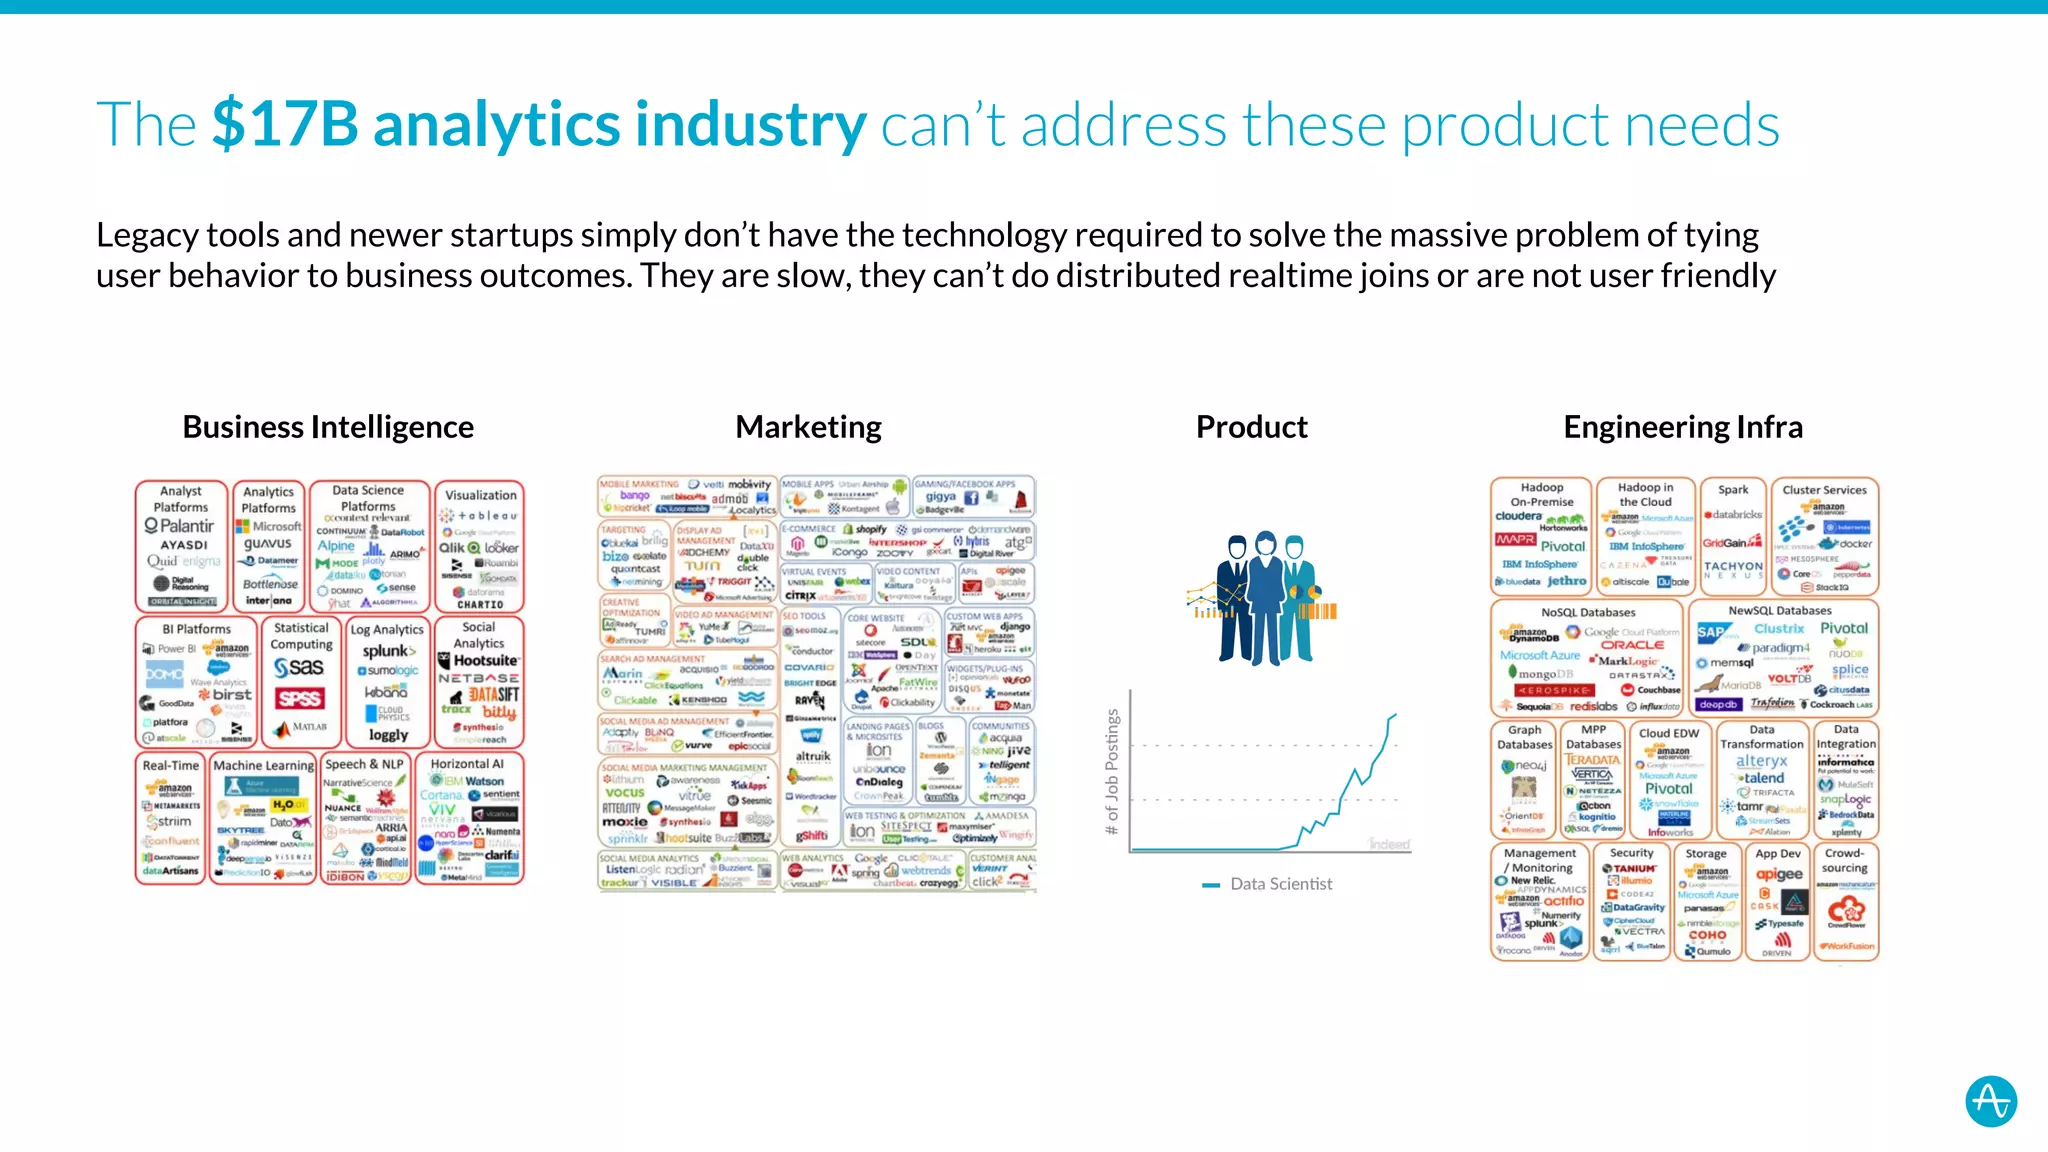
Total Addressable Market (TAM): $17B analytics industry (Slide 7)

Market Dynamics:

  • Fragmentation: Landscape includes 50+ vendors across 4 categories:
    • Business Intelligence (Tableau, Looker, Qlik, Palantir, Microsoft)
    • Marketing Analytics (HubSpot, Marketo, Salesforce, Mobileye)
    • Engineering Infrastructure (Hadoop, Spark, NoSQL/SQL databases)
    • Product Analytics (largely unaddressed by legacy tools)
  • Gap: No single tool addresses product team needs; companies forced to stitch together multiple tools
  • Tailwind: All companies becoming digital product businesses = expanding addressable market

Implied SAM/SOM: Not explicitly stated, but targeting enterprise product teams across all digital-first companies suggests significant expansion opportunity beyond 2017 baseline.


Business Model

Model Type: SaaS (Software-as-a-Service)

Pricing/Revenue Structure: Not explicitly shown in deck, but implied from context:

  • Per-event or per-user pricing (common for analytics platforms)
  • Enterprise/usage-based model (given 17.6B events/month scale)

Unit Economics: Not disclosed in deck

Customer Acquisition: Enterprise sales (implied by customer logos: Microsoft, Autodesk, Twitter)


Traction & Metrics

Funding History:

  • Total Raised (through Series B): $27M
  • Spent to Date: $16M
  • Series C Raise: $30M (implied from brief)

Revenue Metrics (as of 3/31/17):

  • ARR: $__MM (redacted on Slide 2)
  • Headcount: 66 employees

Product Metrics (as of 5/2/17):

  • Events Processed/Month: 17.6 Billion
  • Example Customer Scale: 1,408 users in demo account (38.1% of cohort)

Growth Trajectory:

  • ARR Growth: Exponential curve shown from Jan 2014 → Mar 2017 (Slide 2)
  • Timeline: 3+ years of growth from seed to Series C

Customer Proof Points:

  • Enterprise Customers: Microsoft, Autodesk, Twitter (logos visible; others redacted)
  • Marquee Status: Described as “marquee customers” on Slide 2

Competitive Positioning

Implicit Competitors:

  • Legacy BI Tools: Business Objects, Tableau, Looker, Qlik (slow, not user-friendly, designed for analysts not product teams)
  • Legacy Web Analytics: Omniture/Adobe Analytics (page view-focused, not behavioral)
  • Newer Startups: Mentioned but not named (implied: Mixpanel, Heap, others)

Why Amplitude Wins:

  1. Speed: Real-time analysis vs. batch processing
  2. Scalability: Handles 17.6B events/month (distributed real-time joins)
  3. Usability: Product-team-friendly interface vs. requiring data scientists
  4. Behavioral Focus: Correlates user actions to outcomes (not just page views)
  5. Methodology: Product Playbook provides guided approach (consulting value-add)

Positioning Strategy:

  • Positioned between legacy BI (too slow, too complex) and engineering infrastructure (too technical)
  • Targets product teams specifically (distinct from BI analysts, marketers, engineers)
  • Emphasizes that fragmented $17B industry can’t address product team needs

Team

Executive Team (Slide 2):

Name Title Background
Spenser Skates CEO & Founder MIT, DRW (trading firm)
Curtis Liu CTO & Founder MIT, Google
Matt Althauser CRO Optimizely (exit)
Justin Bauer VP Product Stanford, McKinsey
James Donelan CDO Mulesoft (exit), Lithium
Caitlin Haberberger CFO Flite, Hearsay Systems

Credibility Signals:

  • Founder Pedigree: MIT (both founders), suggesting strong technical foundation
  • Prior Exits: Matt Althauser (Optimizely), James Donelan (Mulesoft) — proven ability to scale
  • Top-Tier Experience: McKinsey, Google, Stanford — domain expertise and operational rigor
  • Functional Depth: CEO/CTO (product), CRO (sales), VP Product (product strategy), CDO (data/analytics), CFO (finance) — well-rounded leadership

Go-to-Market Strategy

Distribution Model: Enterprise sales (implied)

Evidence:

  • Customer logos are enterprise brands (Microsoft, Autodesk, Twitter)
  • Headcount of 66 suggests sales/customer success team
  • CRO (Chief Revenue Officer) hire signals sales-driven growth

Market Approach: Not explicitly detailed in deck, but implied:

  • Direct enterprise sales to product teams at large companies
  • Likely land-and-expand (start with one product team, expand across company)
  • Product Playbook suggests onboarding/enablement support

Missing Details:

  • No mention of self-serve/freemium motion
  • No partner/channel strategy shown
  • No sales cycle length or ACV (Annual Contract Value) disclosed

The Ask

Funding Round: Series C, $30M

Use of Funds: Not explicitly stated in deck, but implied:

  • Product Development: Engineering to maintain technical differentiation (real-time joins, scalability)
  • Sales & Marketing: Expand CRO-led enterprise sales motion
  • Operations: Support 66 → larger headcount
  • Product Playbook: Develop methodology/consulting offerings

Investor Context:

  • Previous Investors: Benchmark & Battery Ventures (led Seed/Series A/B)
  • Implied Valuation: Not stated, but $30M Series C into a company that IPO’d at $5B suggests strong growth trajectory

Investor Deep Dive

Executive summary, strengths & red flags

Executive Summary

Amplitude's Series C pitch deck presents a compelling narrative around the shift of all companies toward digital product businesses, positioning product analytics as critical infrastructure. The deck effectively combines macro market trends (20-year digital transformation across industries) with specific technical differentiation (real-time behavioral analysis at scale) and strong early traction (66 headcount, enterprise customers, 17.6B events/month). The narrative arc moves from market context → problem definition → fragmented competitive landscape → purpose-built solution, culminating in a Series C raise to accelerate growth. This deck successfully justified a $30M raise and ultimately led to a $5B IPO valuation.

Key Strengths

4 identified

1

Exceptional Narrative Arc & Market Timing

The deck moves from macro trend (all companies becoming digital) → specific problem (can't measure product impact) → fragmented market (50+ vendors, no solution) → purpose-built answer. This narrat...

2

Strong Proof of Execution & Traction

- 66 headcount, $27M raised, 17.6B events/month, enterprise customers (Microsoft, Autodesk, Twitter)

3

Technical Differentiation is Credible

The problem of "distributed real-time joins" and "behavioral complexity" is real and hard. The 17.6B events/month metric directly proves Amplitude solved the scalability problem that legacy tools c...

4

Enterprise Positioning is Clear

Unlike consumer-focused analytics tools, Amplitude targets enterprise product teams with complex needs. This justifies premium pricing and longer sales cycles. The Product Playbook adds consulting ...

Red Flags & Weaknesses

7 identified

1

Critical Metrics are Redacted

- ARR figure on Slide 2 is obscured ($__MM)

2

Competitive Positioning Lacks Specificity

The deck criticizes "legacy tools and newer startups" but doesn't name competitors (Mixpanel, Heap, Looker, etc.). This is a missed opportunity to directly address why Amplitude wins. The $17B mark...

3

Missing Business Model & Unit Economics

No pricing, packaging, ACV, or unit economics shown. For a Series C raise, investors want to understand:

4

Product Playbook Feels Disconnected

The "Product Playbook" (Slide 8) appears to be a book/methodology offering, but it's not integrated into the core narrative. Is this a product feature? A consulting service? A go-to-market tool? Th...

5

No Go-to-Market or Sales Strategy Shown

The deck doesn't explain:

6

Missing ROI/Business Impact Metrics

The deck shows what Amplitude measures (user behavior, retention, conversion) but not what customers achieve with it. For example:

7

Vague "Behavioral Layer" Differentiation

Slide 8 claims "Behavioral Layer" shows how user behavior correlates to future outcomes, but this is vague. What makes this different from Mixpanel's funnels or Heap's session replay? The visualiza...

More Pitch Decks To Study

Compare structure, fundraising context, and investor-facing story across similar startup decks.