Compare your deck to Agora

Compare Your Deck

Agora Pitch Deck (2014)

SaaS
Stage: Series A
Raised: $5M
Year: 2014
Slides: 12
Outcome: IPO on Nasdaq (2020); peaked at $10B+ market cap

Pitch Deck

1 / 12
Agora pitch deck - The Opening: Clear brand positioning and visual identity
Click to expand

Deck Analysis

This deck presents Agora, a social commerce startup focused on beauty that blends user-generated content, ambassador networks and a direct-to-consumer marketplace. It positions itself as a platform that turns discovery and authentic recommendations into sales by connecting consumers, content creators and brands in a cyclical network effect. Notable here is the combination of tight product visuals, early traction metrics and a fundraising-friendly roadmap that together tell a coherent growth story—culminating (in the provided metadata) in an eventual Nasdaq IPO and a multibillion-dollar valuation.

The Opening: Clear brand positioning and visual identity

The Opening: Clear brand positioning and visual identity

Slide 1 is a minimalist cover that centers the brand name and tagline (“AGORA — BEAUTY GETS REAL”) on a distinctive coral background. The simplicity communicates confidence: the visual treatment is strong, immediately signals consumer-facing fashion/beauty positioning, and primes investors for a consumer social product rather than a dry enterprise play.

Founders can learn how a cover slide sets tone. Using a bold single color, large logotype and concise tagline conveys a sizable brand ambition without overwhelming the audience. The cover is not trying to teach product details — it’s anchoring identity and emotional positioning, which helps the rest of the deck land with context.

Key Takeaway: Use a bold, uncluttered cover to convey category, tone and confidence—your brand identity should set expectations before details arrive.
Business model: Visualizing the network flywheel

Business model: Visualizing the network flywheel

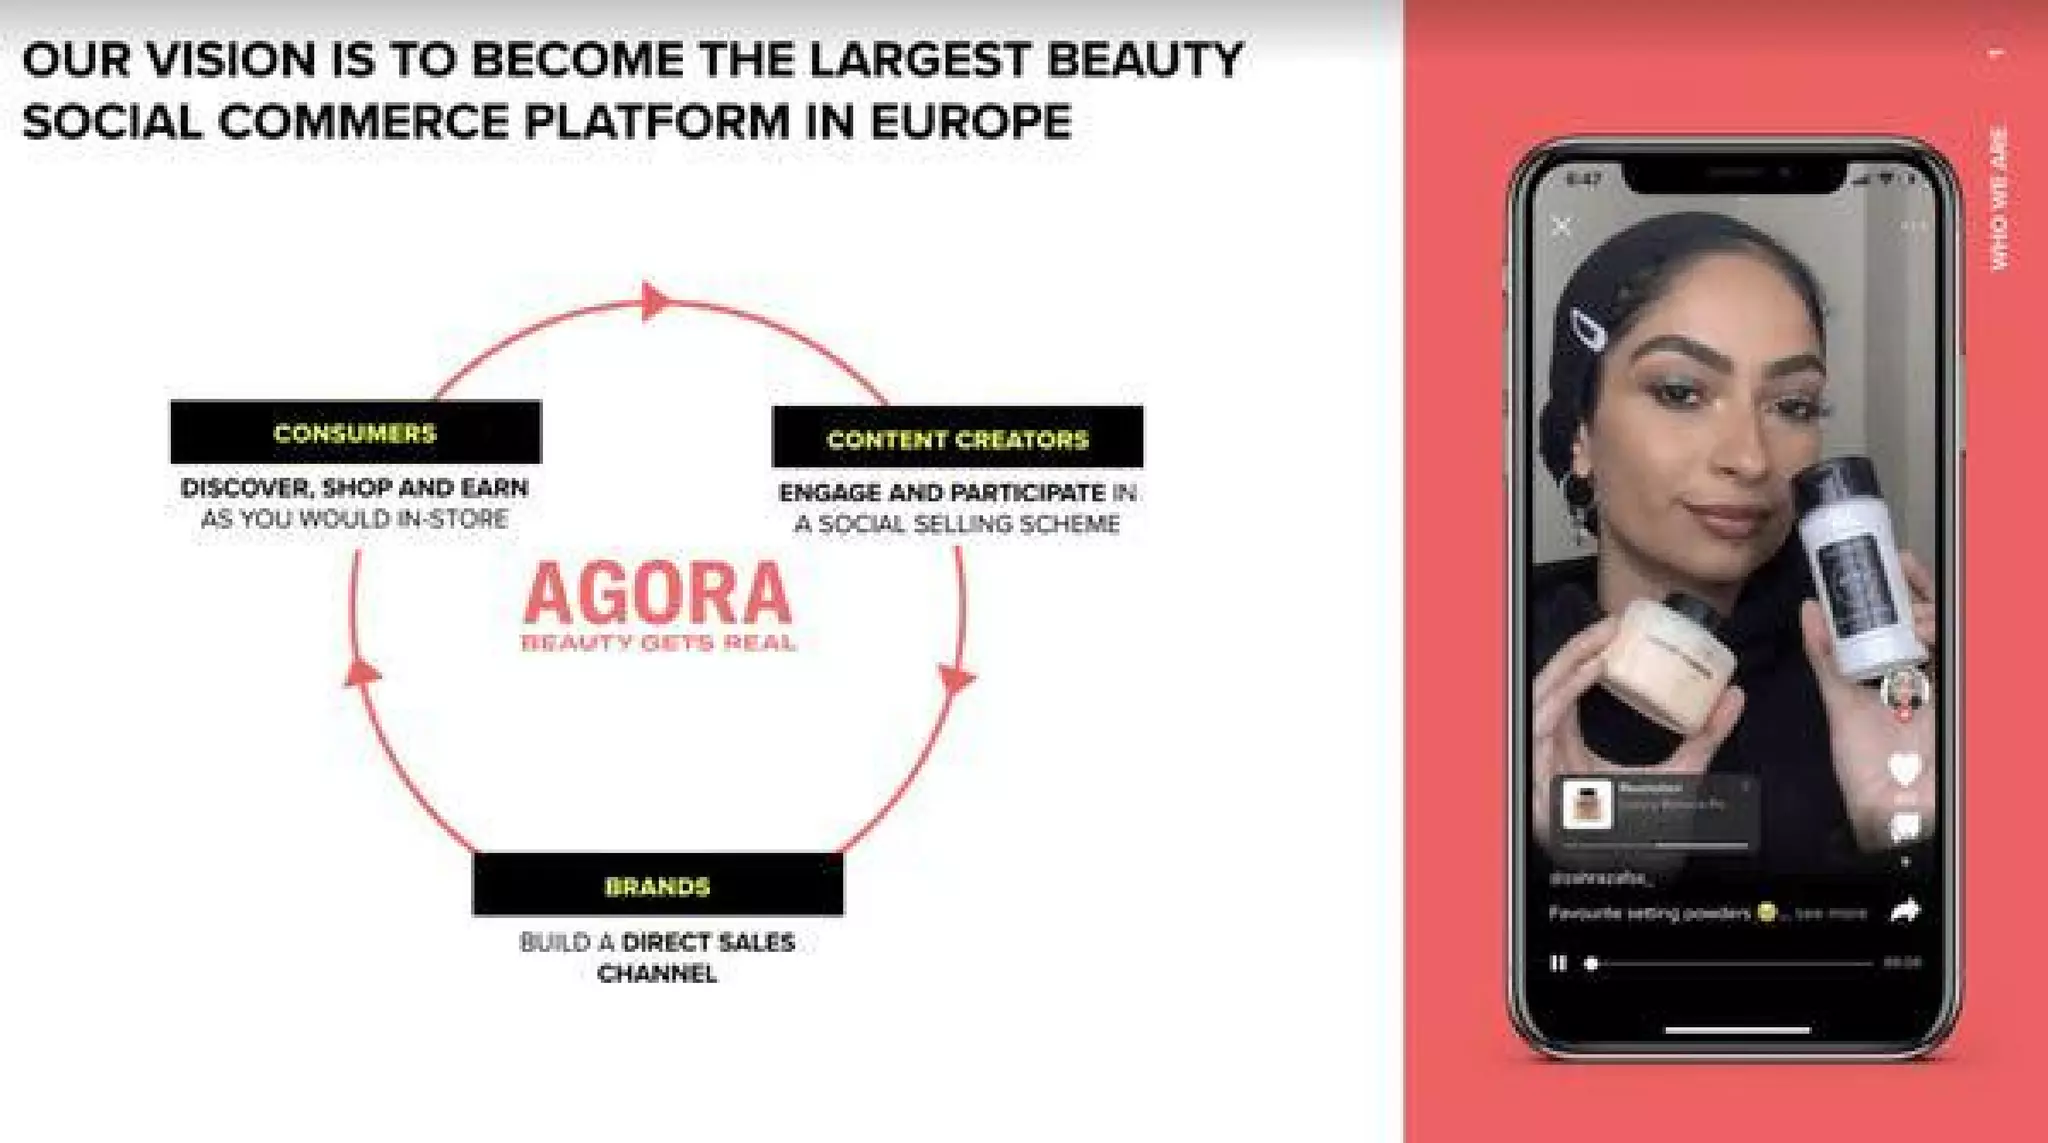
Slide 2 lays out Agora’s core flywheel: consumers discover and shop, content creators drive social selling, and brands gain a direct sales channel. The circular diagram plus a phone mockup of creator video communicates that value accrues via interactions across three groups rather than a single transaction. This emphasizes network effects (more creators → more content → more consumers → more brand adoption) which is essential for marketplace and social commerce narratives.

The slide is effective because it pairs a simple diagram with a real product image so investors can see both the strategy and how that strategy maps to product experience. Founders should emulate the clarity here: explicitly show how scarce resources (creators, data, product assortment) feed one another into sustainable growth rather than burying the mechanism in text-heavy paragraphs.

Key Takeaway: Illustrate your core flywheel visually: show the actors, the flow of value between them, and a product example so investors immediately grasp how growth self-reinforces.
Team & credibility: Press, expertise and composition

Team & credibility: Press, expertise and composition

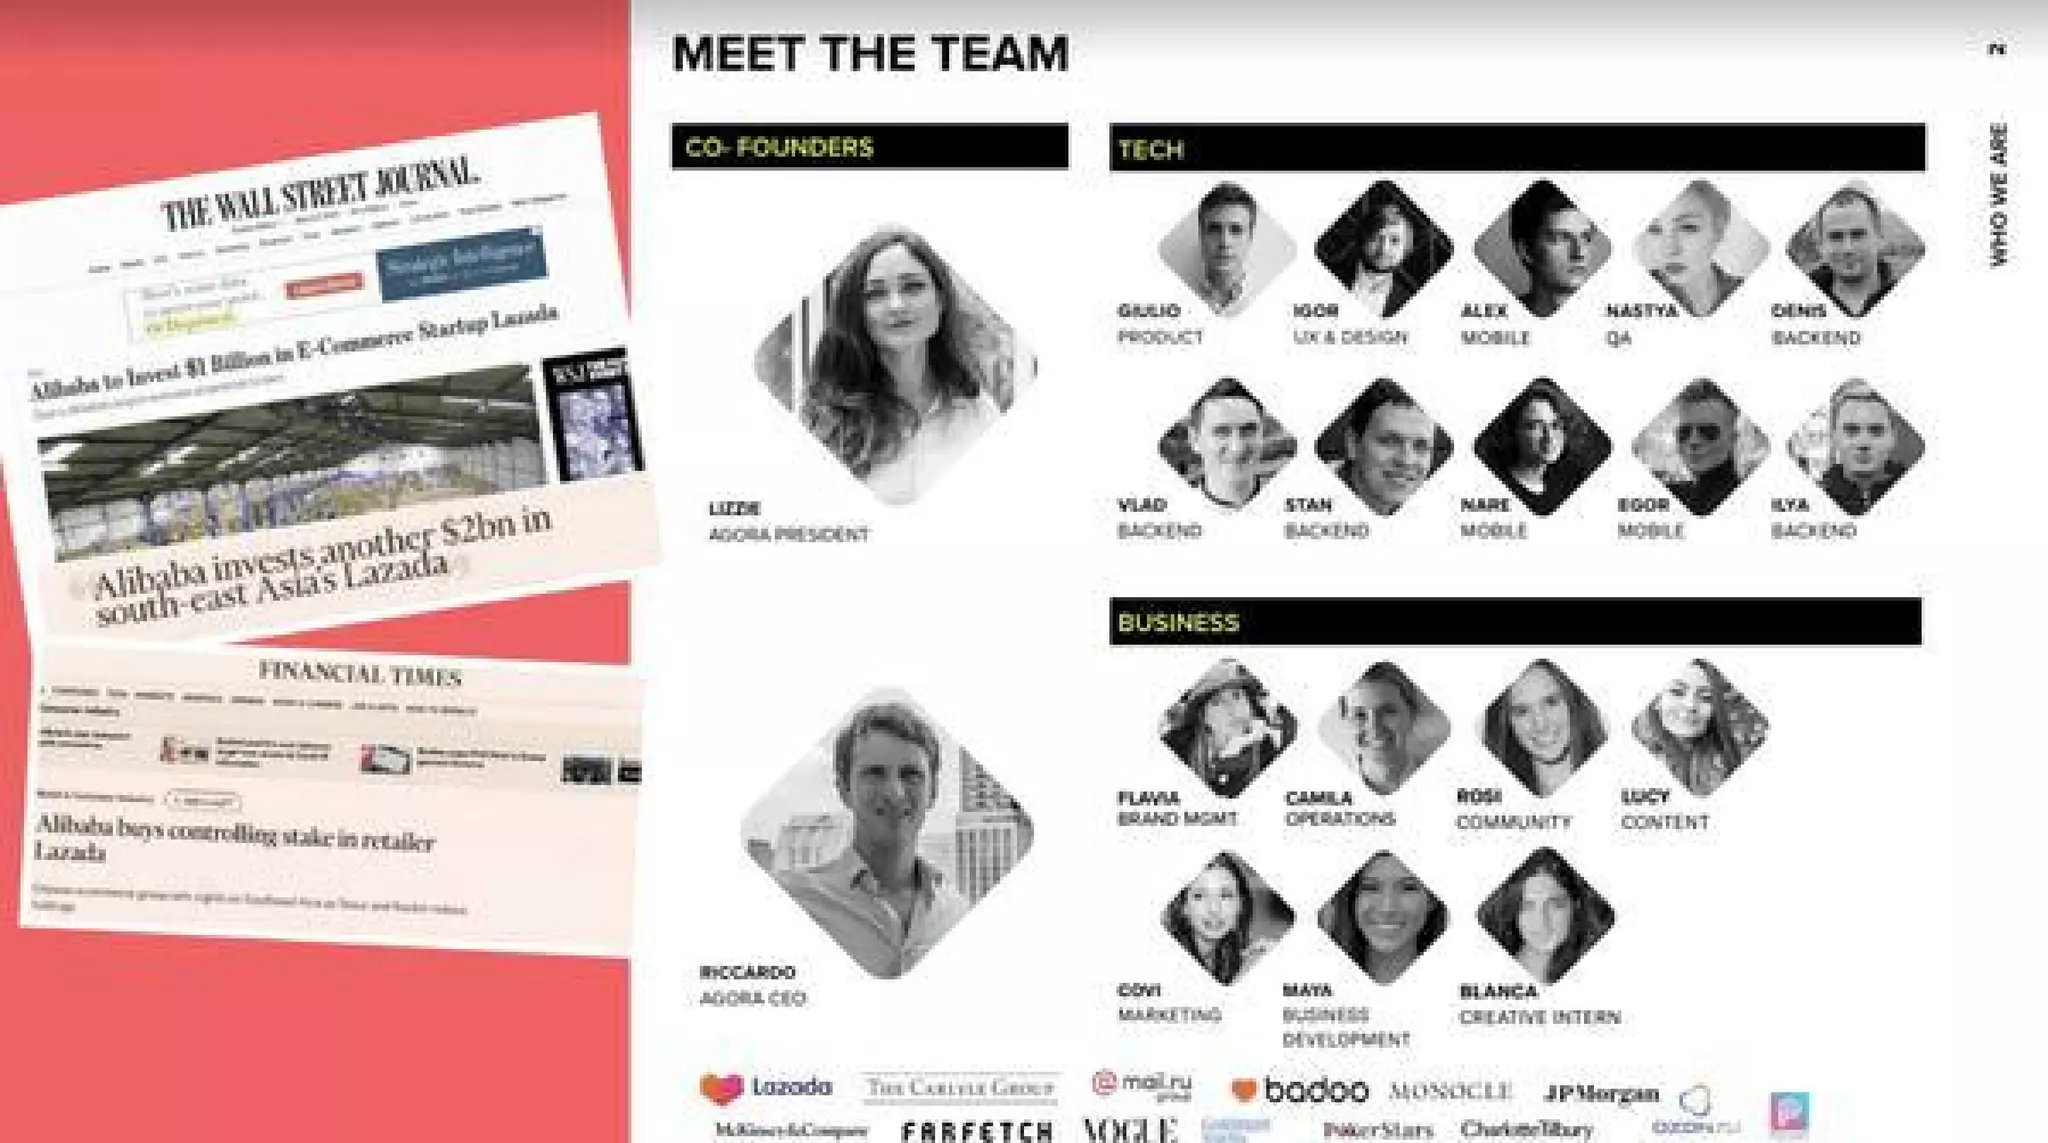
Slide 3 combines media logos, executive photos and team roles to build credibility. Featuring reputable press coverage (Wall Street Journal, Financial Times) alongside founder images and experienced technologists signals both market validation and operational capability. The slide uses recognizable institutional endorsements and a breadth of technical and business hires to assuage investor concerns about execution risk.

Founders should note the dual approach: third‑party validation (press, investors, partners) plus clearly labelled team roles reduces uncertainty. If you lack marquee press, emphasize depth: relevant experience, prior exits or domain expertise. The visual layout makes it scannable — investors can see both credibility and who will deliver the roadmap.

Key Takeaway: Pair external validation with a clear org map—investors want to see both social proof and the specific people who will execute.
Market opportunity: Quantify and contextualize TAM and growth

Market opportunity: Quantify and contextualize TAM and growth

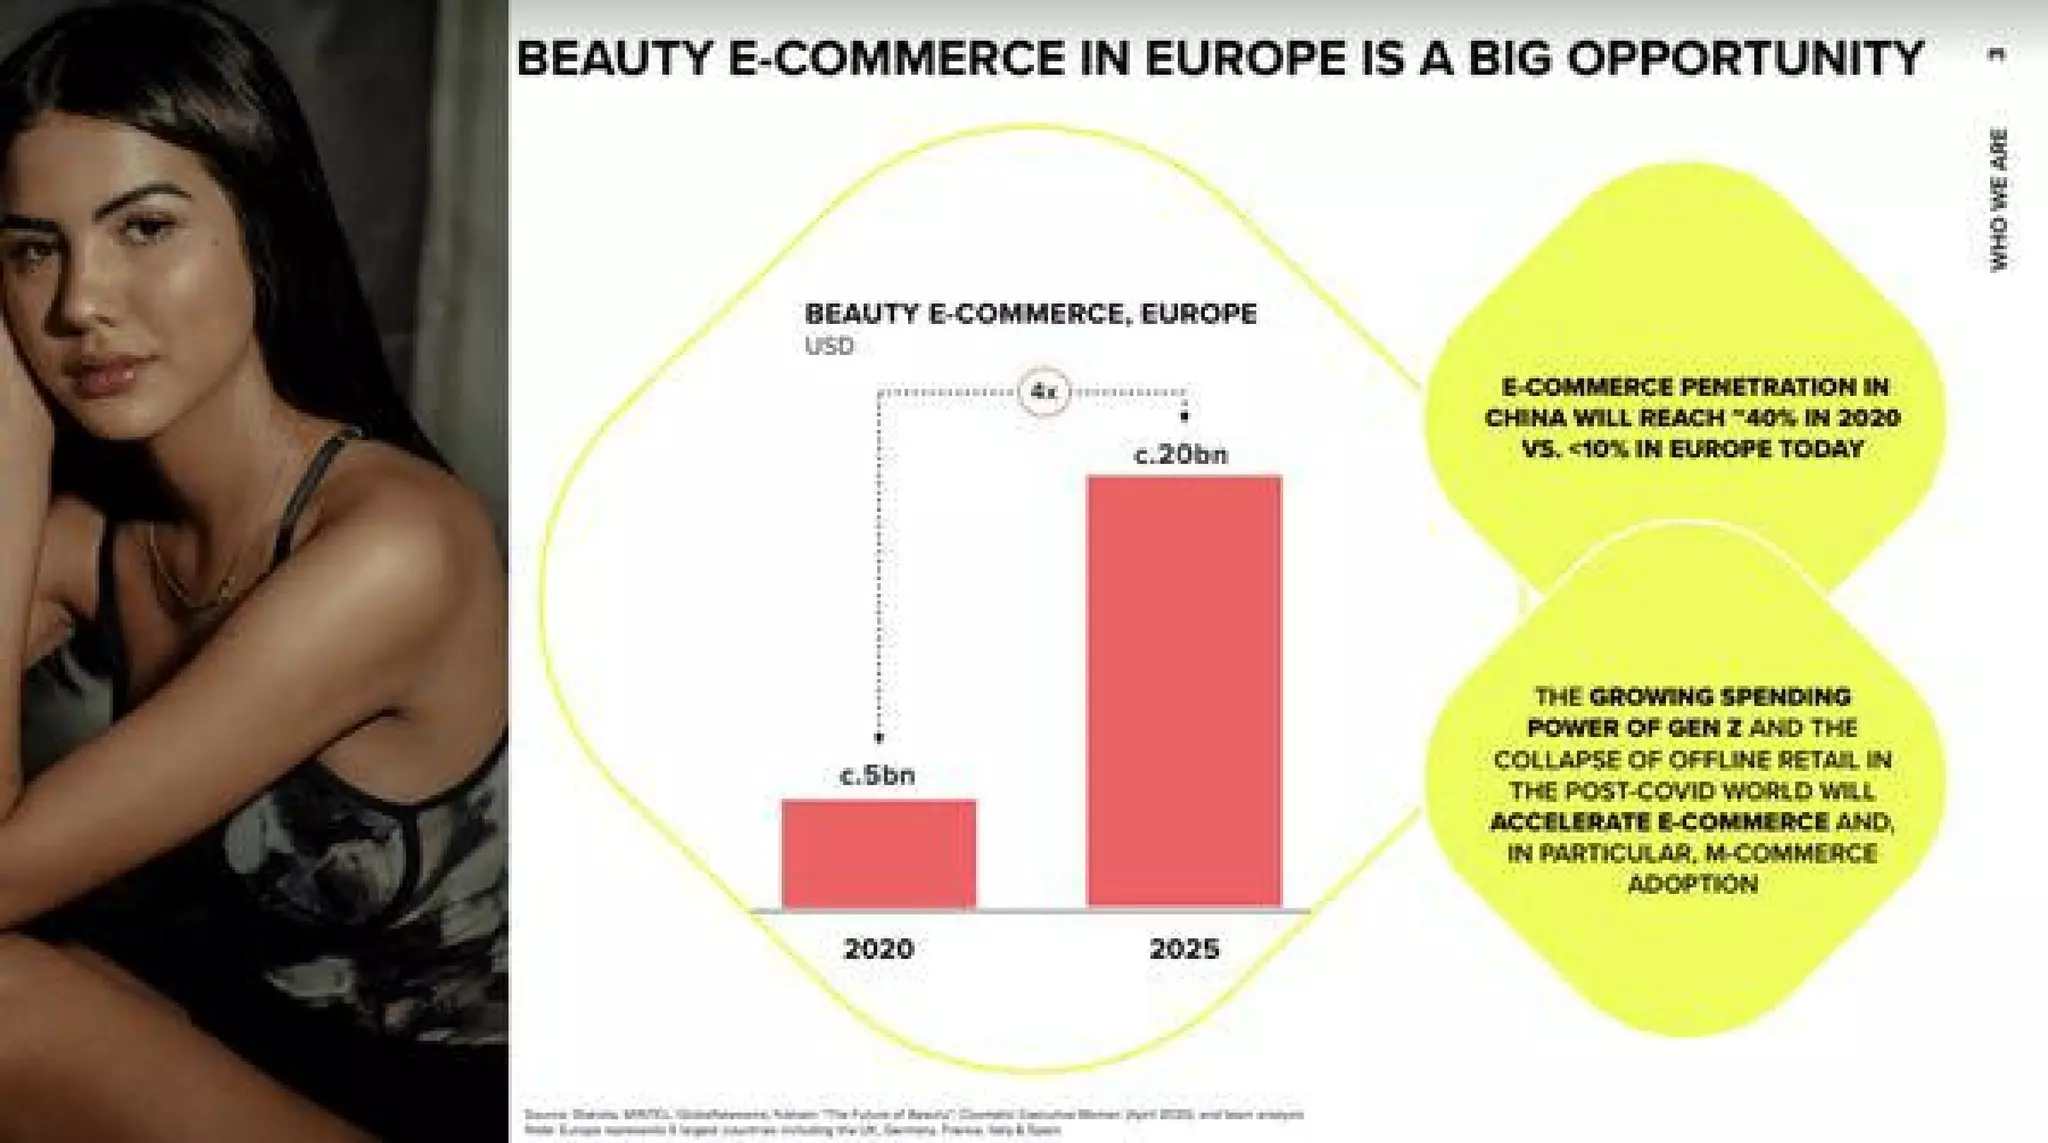
Slide 4 frames the market opportunity with a simple bar chart (c. $5bn in 2020 → c. $20bn in 2025) and contextual bullets comparing e-commerce penetration in China versus Europe. This juxtaposition makes a compelling growth story: the opportunity isn’t only the present market size but an expected multiple driven by mobile adoption and Gen Z behavior shifts. The slide uses the China benchmark to demonstrate a plausible adoption trajectory for Europe.

What works here is the combination of a numeric projection plus behavioral and structural drivers (m‑commerce adoption, Gen Z spending, offline retail collapse). Founders should always pair TAM or revenue projections with the catalysts that make those numbers realistic, and use comparable markets where relevant to justify pace of adoption.

Key Takeaway: Beyond TAM, show how structural trends and comparable markets make your growth projection credible—numbers + drivers beats numbers alone.
Roadmap & milestones: Timeline for product, fundraising and rollout

Roadmap & milestones: Timeline for product, fundraising and rollout

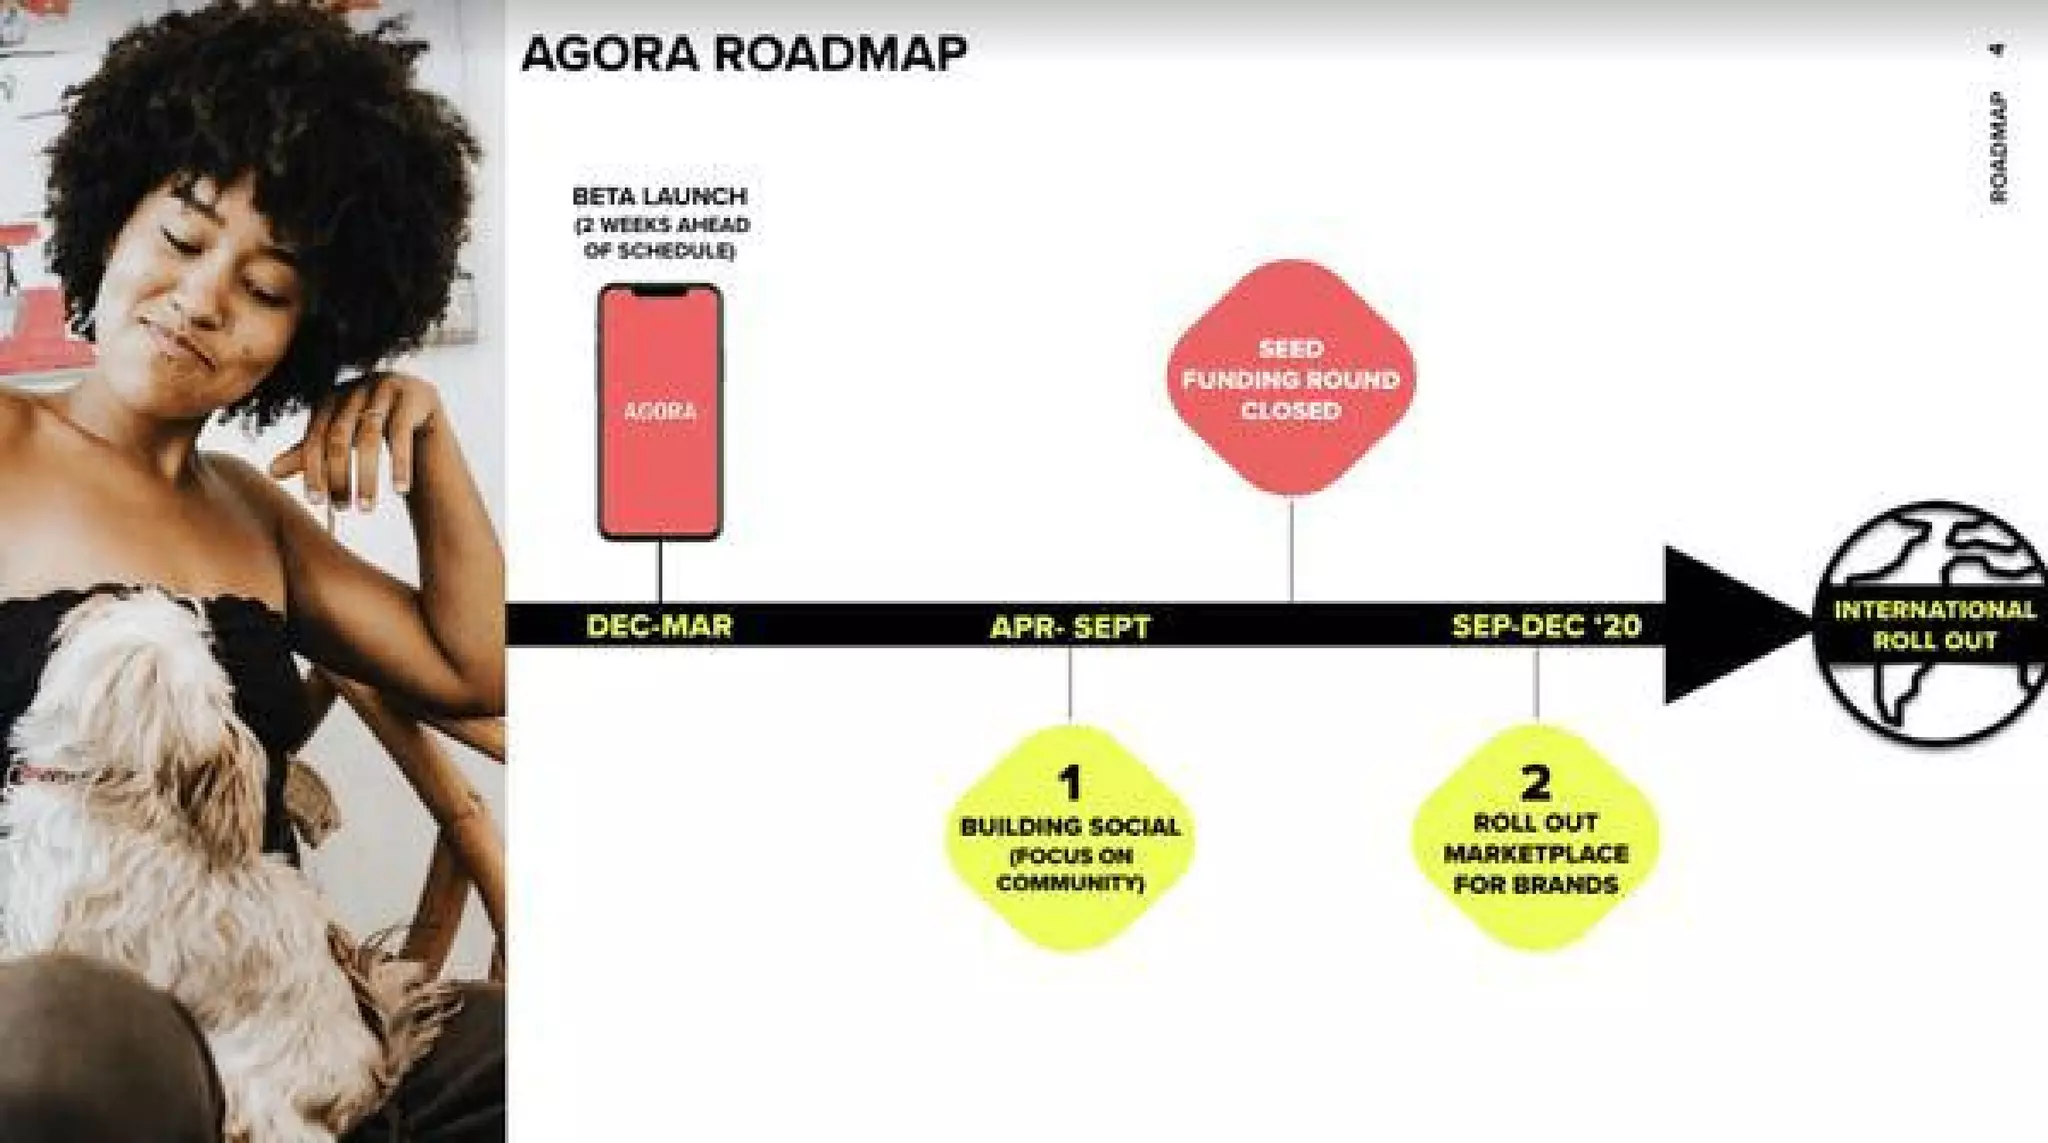
Slide 5 lays out a straightforward timeline: beta launch, a seed funding milestone, building social/community focus, marketplace rollout and international expansion. The timeline ties product milestones to fundraising and commercial expansion, which helps investors understand what the round will enable and what to expect next. It also communicates discipline—planned phases and a logical sequence from community building to monetization.

Founders should use similar milestone slides to connect dollars to deliverables. Good milestones are timebound, measurable and show how early wins will de-risk subsequent, larger bets (e.g., build engagement first, then monetize with a marketplace). Including seed/closing status reassures investors that progress and capital needs are aligned.

Key Takeaway: Use a milestone timeline that links capital to outcomes—demonstrate how each phase de-risks the next and what success looks like at each step.
Product & GTM: Two-sided solutions for brands and consumers

Product & GTM: Two-sided solutions for brands and consumers

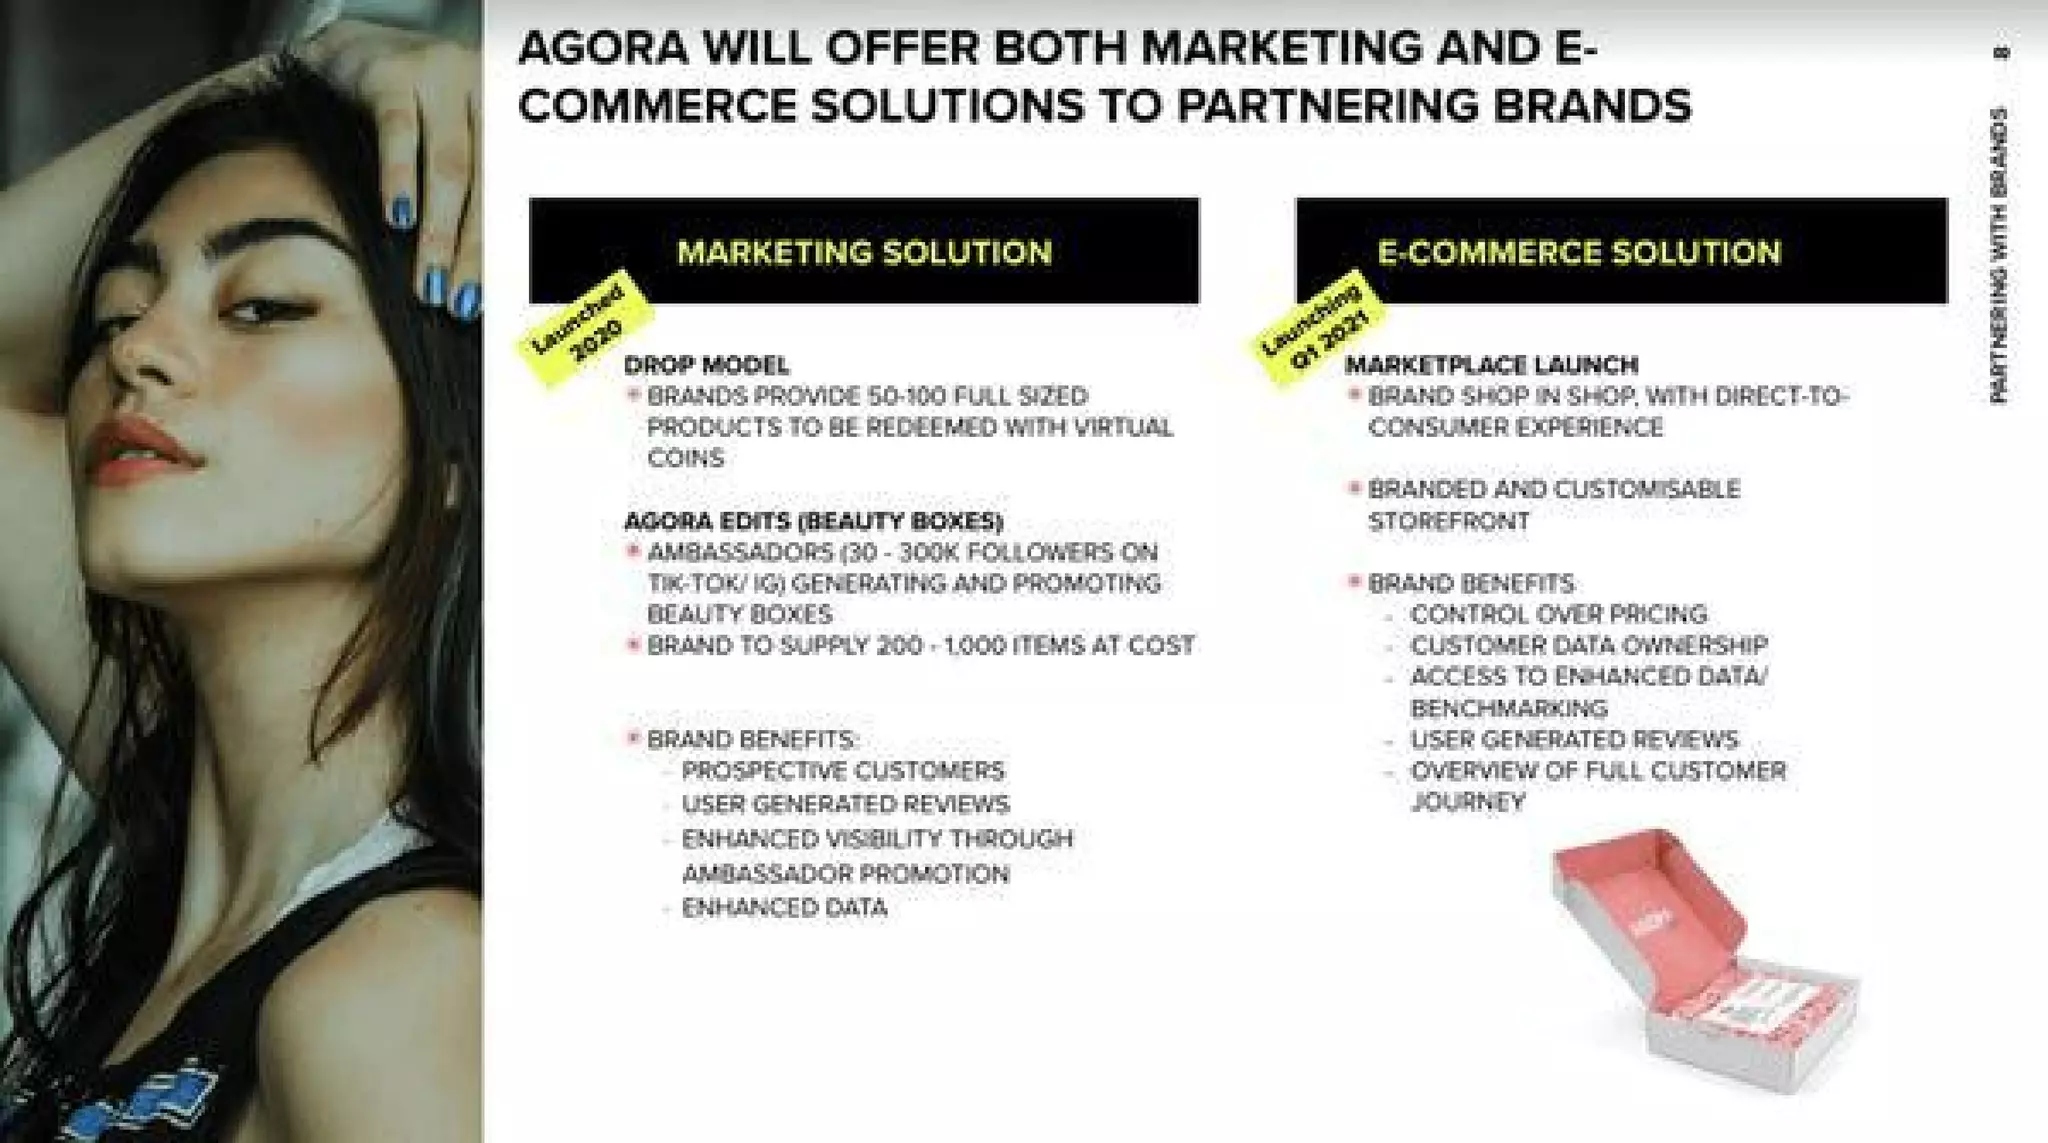
Slide 6 outlines Agora’s dual offering: a marketing solution (drop model, beauty boxes, ambassador promos) and an e-commerce solution (marketplace, brand storefronts, data ownership). This shows a thoughtful go‑to‑market that balances low-friction brand marketing programs with a longer-term commerce engine. The slide enumerates brand benefits—control of pricing, data ownership and UGC reviews—making the value proposition concrete for partners.

The lesson for founders is to present both short-term revenue levers (promotions, referral programs) and long-term scalable products (marketplace, owned storefronts). Explaining how these offerings interlink — ambassadors driving discovery, beauty boxes driving first purchase, storefronts capturing lifetime value — makes the revenue model believable and shows multiple monetization paths.

Key Takeaway: Frame short-term GTM tactics alongside long-term platform plays and list concrete benefits for partners—multiple monetization levers make fundraising asks more compelling.
Traction & community: Early metrics that demonstrate product/market fit

Traction & community: Early metrics that demonstrate product/market fit

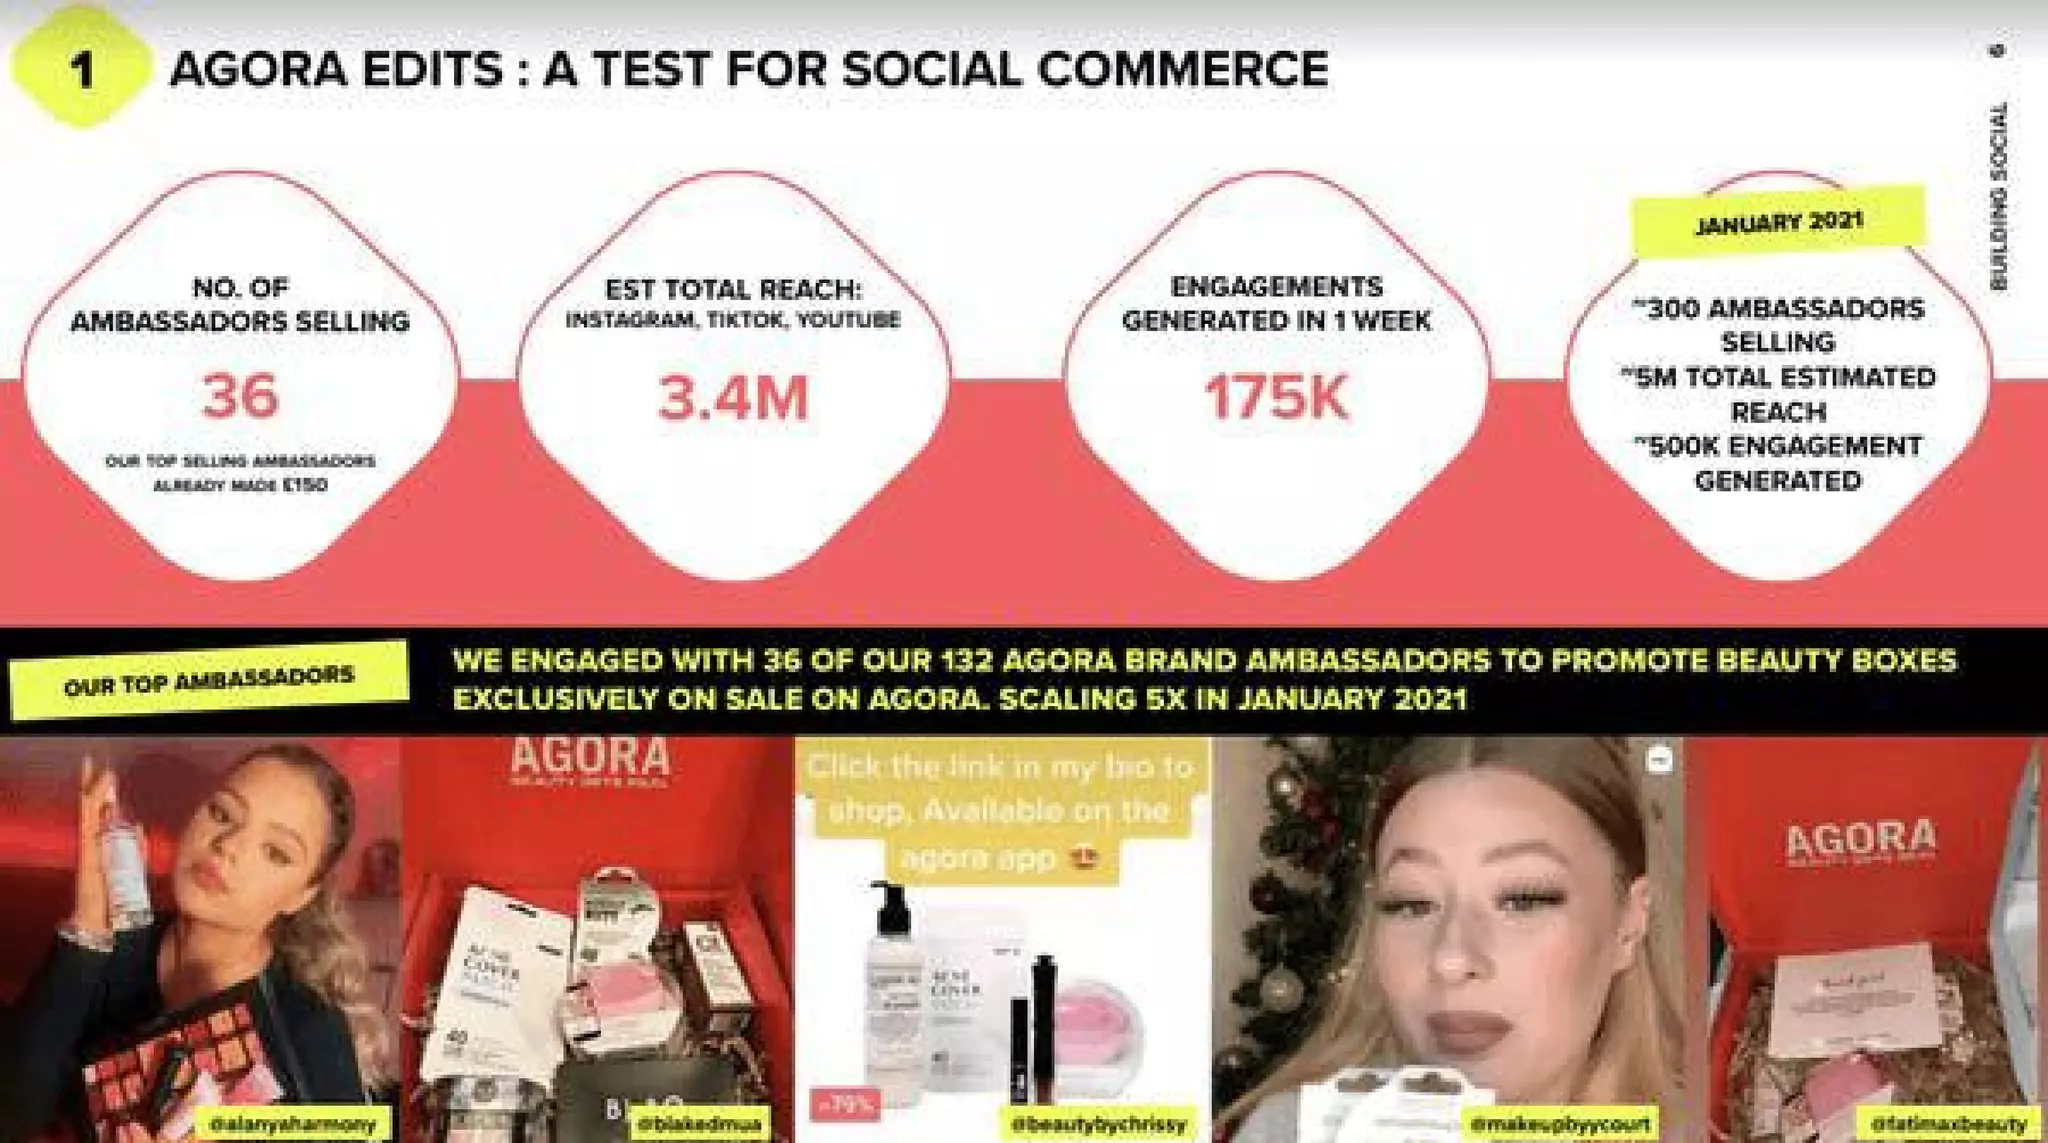
Slide 8 (Agora Edits) presents early traction: ambassadors selling, estimated reach (3.4M), engagements (175K in a week) and plans to scale ambassador activity 5x. It also showcases user posts and influencer content to prove the product-loop—UGC driving discovery and conversions. Those concrete KPIs (ambassadors, reach, engagement) are exactly the kind of early-signal metrics investors look for in consumer social startups.

This slide is effective because it ties behavioral metrics to commercial outcomes (top-selling ambassadors already made revenue) and signals how the company will scale (more ambassadors = more reach). For founders, capturing and presenting engagement, conversion and creator ROI is crucial: investors want to see not only usage but how that usage converts into monetizable actions.

Key Takeaway: Lead with action-oriented traction metrics (engagement, creator sales, conversion rates) and show how you will scale those signals into repeatable revenue.

Conclusion: Key Lessons

Agora’s deck combines strong visual branding, a clear network-driven business model and investor-friendly proofs: credible team, quantified market opportunity, a phased roadmap and measurable traction. Its strengths are coherence (every slide reinforces the same narrative), clarity (simple diagrams and concrete numbers) and GTM realism (short-term marketing products feeding a long-term commerce platform). These elements help explain how a relatively early‑stage company can justify a Series A and attract strategic partners.

For founders building their own decks: start with a bold positioning, then quickly show the flywheel that underpins defensibility and growth. Pair market size with specific adoption drivers and comparable benchmarks. Use a roadmap that ties capital to de-risking milestones, and present early traction with metrics that matter to your business model (engagement, conversion, creator ROI). Finally, balance emotional consumer visuals with hard metrics—investors need both the story and the numbers to say yes.

Full Deck Analysis

11 sections

Overview

Company: Agora
Round: Series A ($5M)
Year: 2014
Outcome: IPO on Nasdaq (2020); peaked at $10B+ market cap


Executive Summary

Agora pitched itself as a mobile-first social commerce marketplace for beauty focused on UGC (short video), ambassador-driven distribution and a dual product offering: marketing services for brands (ambassador/beauty-box drops) and an in-app marketplace (brand shop-in-shop). The deck combines consumer metrics (app usage, ambassadors, reach) with a clear roadmap to monetize via branded storefronts and marketplace fees — a thesis that ultimately scaled to a public company.


Problem Statement

How the deck articulates the problem:

  • Consumers discover beauty via social content but the current online experience lacks the social discovery + commerce loop that mimics in-store discovery (Slide 2, Slide 9).
  • Europe’s beauty e‑commerce penetration is low relative to China and fragmented; brands lack direct access to data and social-first distribution (Slide 4).
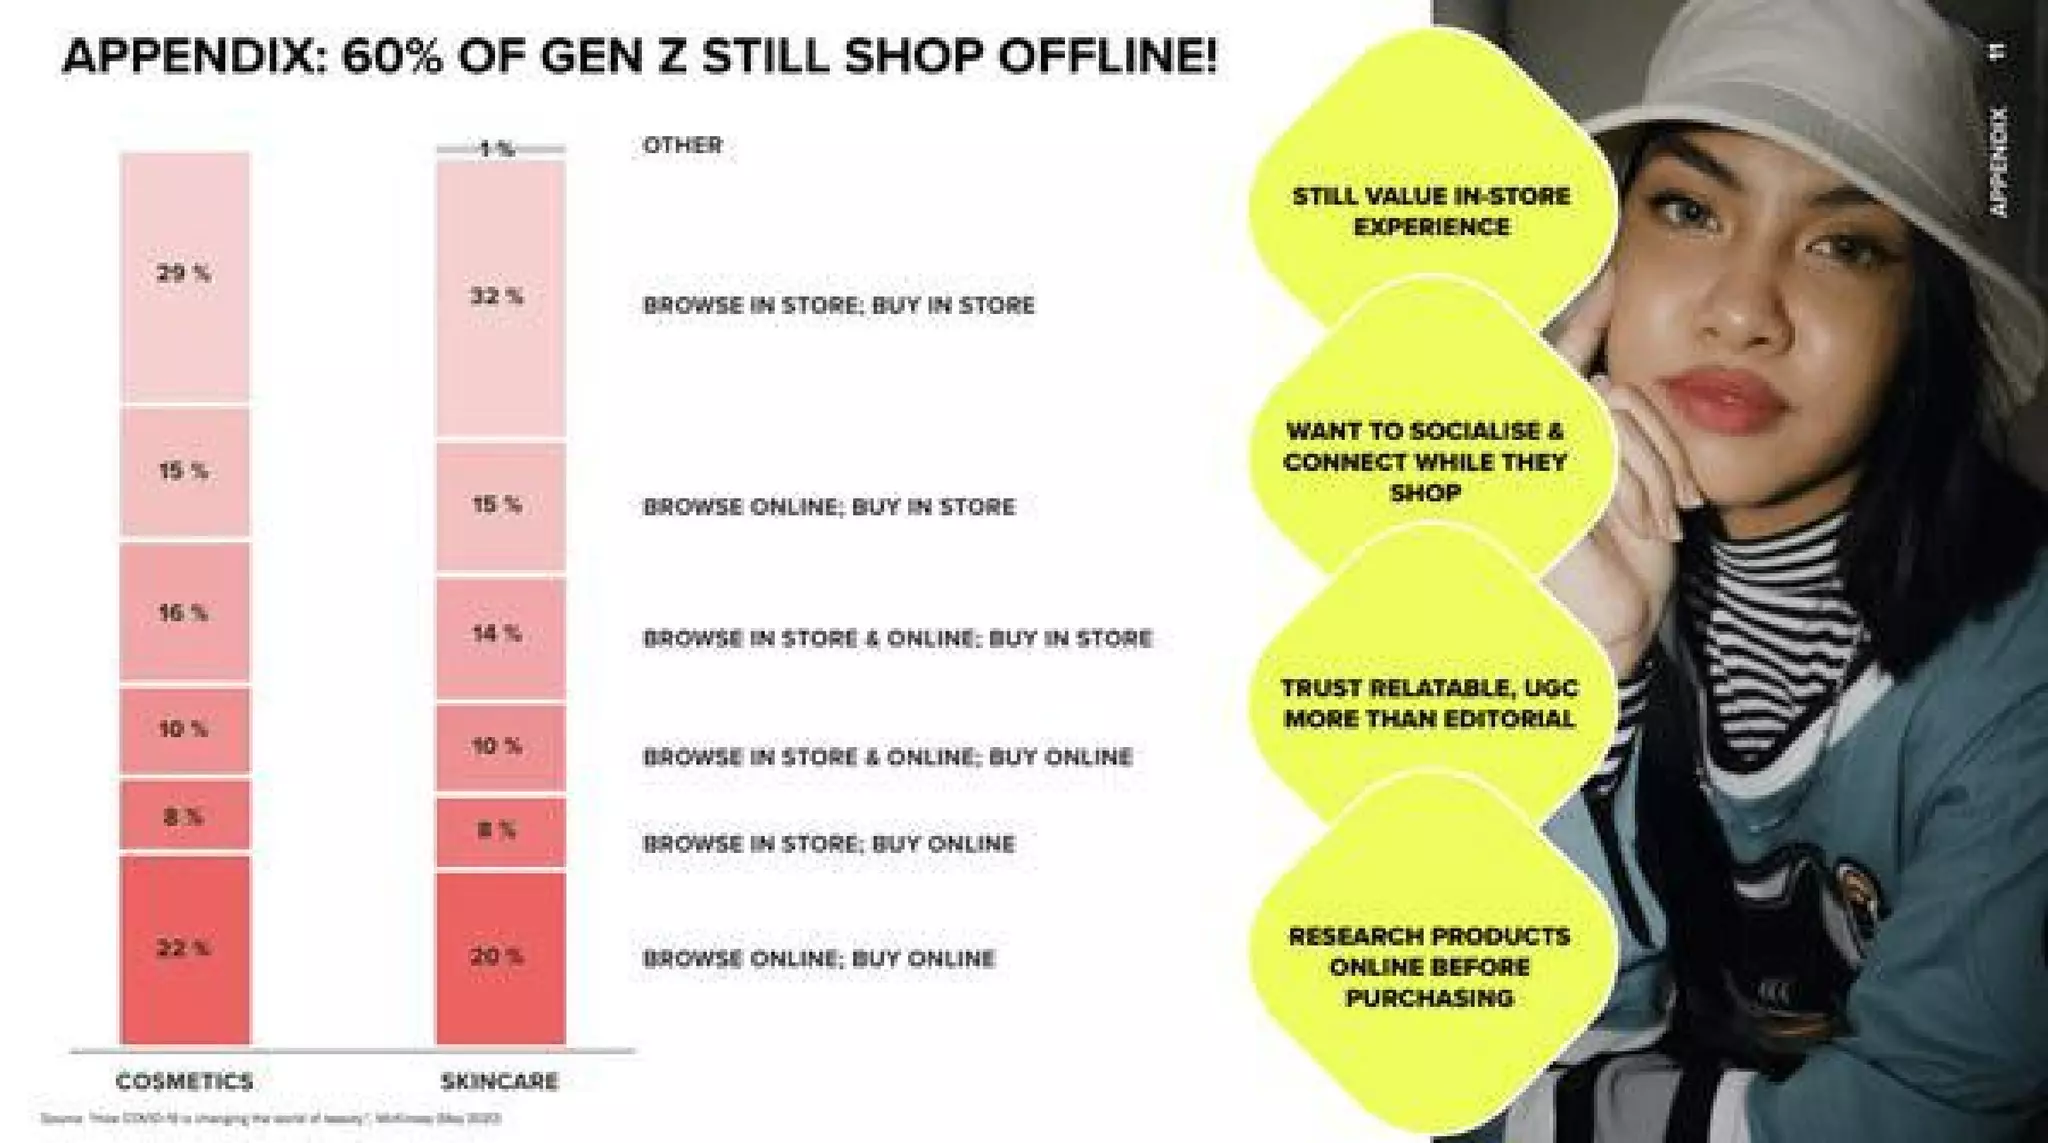
  • Gen Z and young shoppers still value in-store experience and social validation; brands need scalable ways to access social UGC and ambassador channels to reach them (Slide 12).

Slides referenced: Slide 2 (value loop: consumers / creators / brands), Slide 4 (market dynamics / e‑commerce penetration), Slide 12 (Gen Z behaviour).


Solution

How the deck positions the solution:

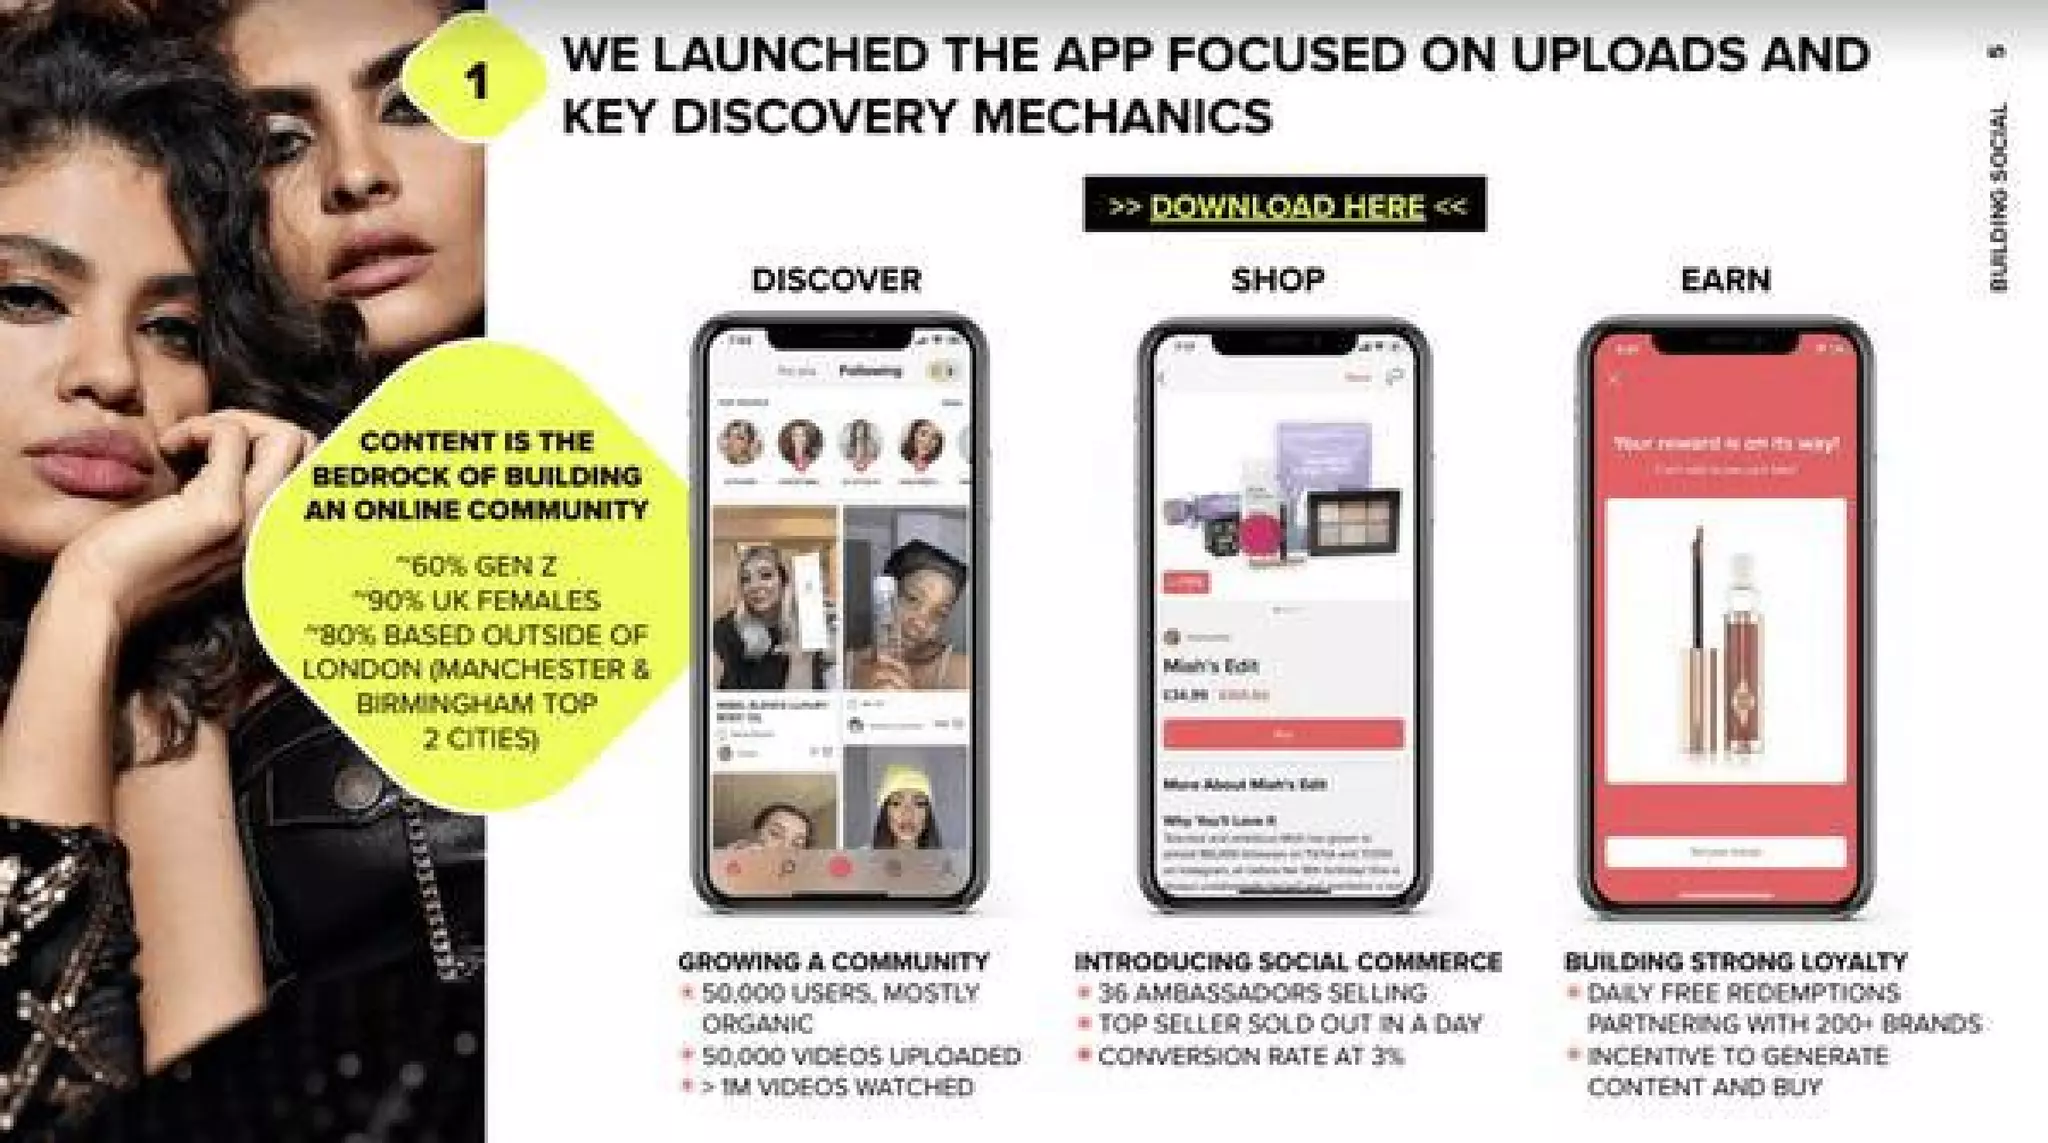
  • A mobile app that blends discover → shop → earn: users discover short-form UGC, buy products inside the app, and earn rewards (Slides 9 & 11).
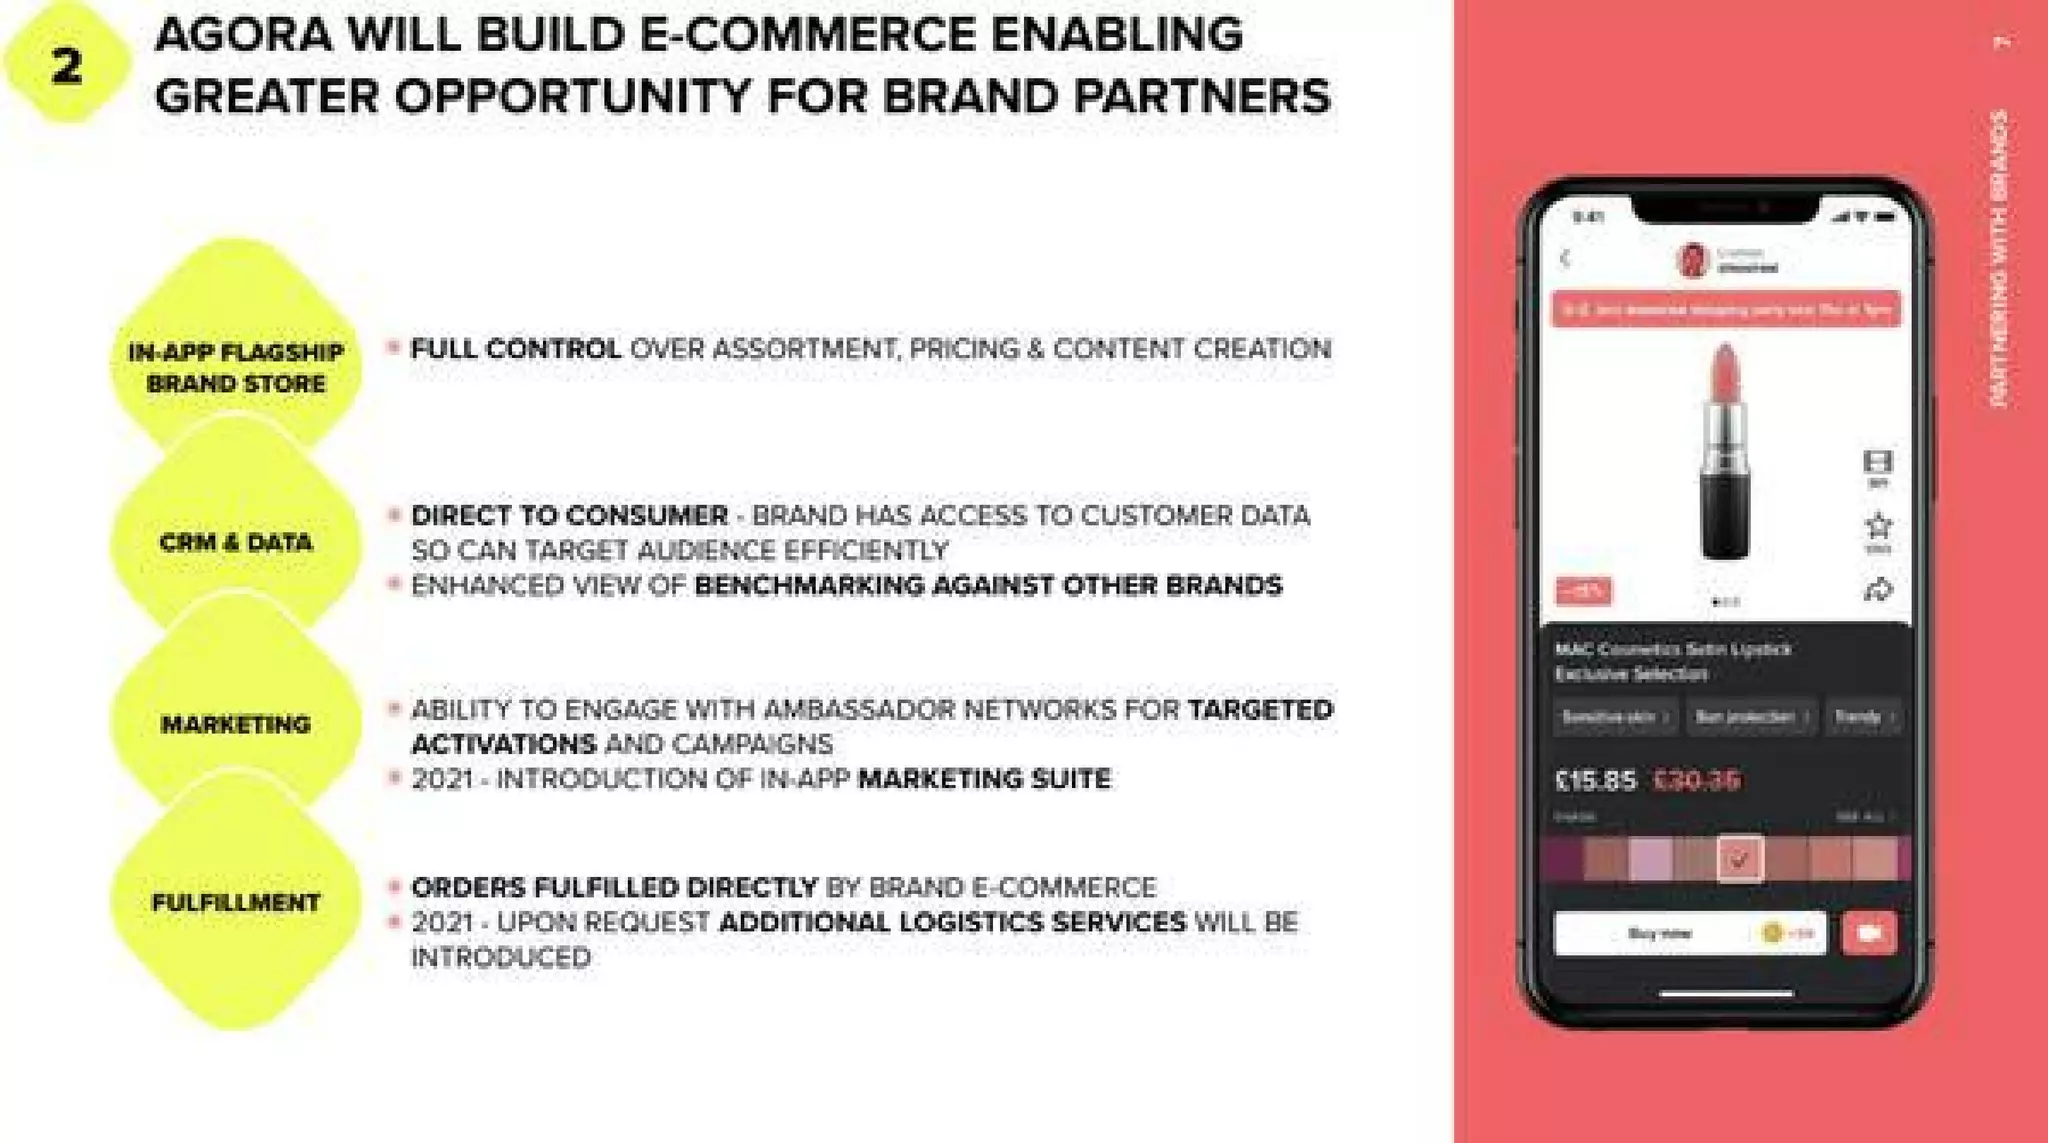
  • Two commercial products: (1) Marketing solution — ambassador-driven “drops” and “beauty boxes” to generate content and demand; (2) E‑commerce solution — brand “shop-in-shop” storefronts with direct-to-consumer functionality and data ownership for brands (Slide 6).
  • Incentives and gamification (virtual coins, daily redemptions) to drive content creation, repeat visits and ambassador participation (Slides 6, 9).

Market Opportunity

TAM/SAM/SOM and numbers shown:

  • Beauty e‑commerce Europe: shown as ~USD 5bn in 2020 → ~c.20bn by 2025 (4x growth factor) (Slide 4).
  • E‑commerce penetration context: highlighted that China is expected to reach ~40% penetration vs ~10% in Europe “today” (Slide 4).
  • User demographics: 60% Gen Z, 90% UK females; early geographic concentration outside London (Slide 11).
    Interpretation: deck frames a large upside (c.20bn e‑commerce beauty market in Europe by 2025) and positions Agora to capture m‑commerce/social-commerce share.

Business Model

Revenue model and unit economics (as presented / implied):

  • Marketing revenue: paid model for ambassador/beauty-box campaigns and drop mechanics (brands supply inventory; Agora gets promotional/placement fees or takes a margin) (Slide 6).
  • Marketplace revenue: brand shop-in-shop with direct-to-consumer experience — likely commissions, subscription/slot fees and/or value-added services (CRM, analytics, fulfillment) (Slide 6 & Slide 7).
  • Other monetization: in-app “virtual coins” mechanics (brands provide products redeemable by coins) suggest promotional commerce and potential ad/placement revenue (Slide 6).
  • Unit economics: not explicitly detailed. No CAC/LTV or take-rate numbers shown.

Traction & Metrics

Growth metrics and proof points (explicit numbers from slides):

  • App / content metrics (Slide 11):
    • 50,000 users (mostly organic)
    • 50,000 videos uploaded
    • 1M videos watched

  • Ambassador / social commerce (Slide 8):
    • Initial ambassadors selling: 36 (top seller made ~£150)
    • Estimated total reach: 3.4M (Instagram, TikTok, YouTube) for that cohort
    • Engagements generated in 1 week: 175K
    • Conversion rate cited: ~3% (Slide 9)
    • Scale projection (Jan 2021 shown as a milestone): 300 ambassadors selling → 5M estimated total reach; 500K engagement generated (Slide 8)
  • Brand partnerships: “partnering with 200+ brands” referenced (Slide 9/10)
  • Product performance: examples of top seller sold out in a day (Slide 9)

These are presented as early traction signals across content, engagement and ambassador-driven sales.


Competitive Positioning

How Agora differentiated itself:

  • Social-first product: UGC video uploads as the discovery vehicle (Slides 9 & 11).
  • Ambassador network & drop mechanics: turning ambassadors into micro-sellers and content creators (Slides 6 & 8).
  • Brand-friendly marketplace: brand-owned data, control over pricing and storefront customization (Slide 6 & 7).
  • Focus on Gen Z and mobile m‑commerce: positioning between pure social platforms (TikTok/IG) and traditional e‑commerce marketplaces (Slide 4 & 11).

Team

Team credentials (as shown on Slide 3):

  • Co-founders highlighted (Leen – Agora President; Riccardo – Agora CEO) with photos.
  • Small core tech team: product, UX & design, mobile, QA, backend engineers (several named roles).
  • Business team includes brand management, operations, marketing, community and content roles.
  • Credibility signals: press coverage (WSJ, FT clippings) and logos of partners / investors on the team slide (Slide 3).

Overall: founding team with product and brand/marketing experience plus a visible engineering bench.


Go-to-Market Strategy

Distribution approach shown:

  • Ambassador-led growth and virality: recruit ambassadors with follower bases and incentivize content + conversions (Slides 6, 8, 9).
  • Content-first organic user acquisition (UGC uploads feed discovery loop) → convert to purchases (Slide 11).
  • Brand partnerships and marketing drops to seed catalog and create scarcity (beauty-box drops) (Slide 6).
  • Roadmap: beta launch (initial months) → build social community (Apr–Sept) → roll out marketplace for brands and international expansion (Slide 5).

The Ask

  • Round being raised: Series A for $5M (document context: “Round: Series A ($5M)”).
  • Use of funds (implied from slides & roadmap): accelerate product development, scale ambassador & brand onboarding, marketing to grow users and content, expand marketplace/fulfillment capabilities and international roll-out (Slide 5 roadmap + Slide 6 product roadmap).

Investor Deep Dive

Executive summary, strengths & red flags

Executive Summary

Agora pitched itself as a mobile-first social commerce marketplace for beauty focused on UGC (short video), ambassador-driven distribution and a dual product offering: marketing services for brands (ambassador/beauty-box drops) and an in-app marketplace (brand shop-in-shop). The deck combines consumer metrics (app usage, ambassadors, reach) with a clear roadmap to monetize via branded storefronts and marketplace fees — a thesis that ultimately scaled to a public company.

Key Strengths

3 identified

1

Strong product/market fit narrative with measurable early traction — explicit metrics: 50K users, 50K videos uploaded, >1M videos watched, ambassador reach 3.4M and 175K engagements in a week (Slides 11 & 8).

2

Clear dual monetization path — marketing services (drops/beauty boxes) + marketplace (brand storefronts) gives near-term and longer-term revenue options (Slide 6).

3

Visually compelling, consumer‑facing deck that demonstrates real use cases and social proof (ambassador screenshots, brand quotes and press coverage) — builds confidence in virality and community (Slides 3, 9, 10).

Red Flags & Weaknesses

3 identified

1

Missing unit economics and financial projections — no CAC, LTV, gross margins or take-rate are shown, which are essential to validate scalability of the model.

2

Lack of detailed go‑to‑market cost model — deck shows ambassador growth and reach but does not show cost to acquire ambassadors/users or how sustainable incentives (free redemptions/virtual coins) will be long-term.

3

Limited defensibility detail — network effects are implied but not quantified; competitive threats (platforms like Instagram/TikTok or incumbent marketplaces) and retention dynamics are not addressed in depth.

More Pitch Decks To Study

Compare structure, fundraising context, and investor-facing story across similar startup decks.