Compare your deck to WeWork

Compare Your Deck
Cautionary Tale

WeWork Pitch Deck (2014)

Cautionary Tales
Stage: Series D
Raised: $335M
Year: 2014
Slides: 36
Outcome: FAILED IPO, massive writedown

Pitch Deck

1 / 36
WeWork pitch deck - Opening & Brand Positioning: Emotion first
Click to expand

Deck Analysis

This Series D pitch deck from WeWork (2014) presents a highly visual, founder-driven story: aspirational branding, rapid membership growth, a platform thesis (“Space as a Service”), and a path to monetization through services. The deck emphasizes network effects, unit-level economics, and a large addressable market while showcasing traction, pipeline and landlord partnerships. It’s notable because the presentation packages an emotional vision with crisp KPIs and bold forward projections — yet the company later failed to IPO as expected and suffered a large writedown, making the deck a useful study in persuasive storytelling versus execution and transparency.

Opening & Brand Positioning: Emotion first

Opening & Brand Positioning: Emotion first

Slide 1 is a single-image opener that sets tone more than data: a monochrome photograph with the phrase “Do What You Love,” and subtle branding. It uses emotion to create immediate alignment with the audience (investors who respond to mission-driven narratives) and primes viewers to see the product as cultural rather than purely functional. This is effective at capturing attention and framing the deck’s thesis around lifestyle, community and identity rather than just square footage or lease terms.

Founders can learn the power of a purposeful opener: a short, memorable, emotionally resonant visual that supports the company’s differentiator. However, this kind of opener works best when followed quickly by crisp evidence — growth, unit economics and defensibility — because strong emotion can otherwise obscure important operational risks.
Key Takeaway: Open with a clear emotional hook that encapsulates your mission, but immediately follow it with measurable traction and clear economic logic.
Company Overview & Traction: Data up front

Company Overview & Traction: Data up front

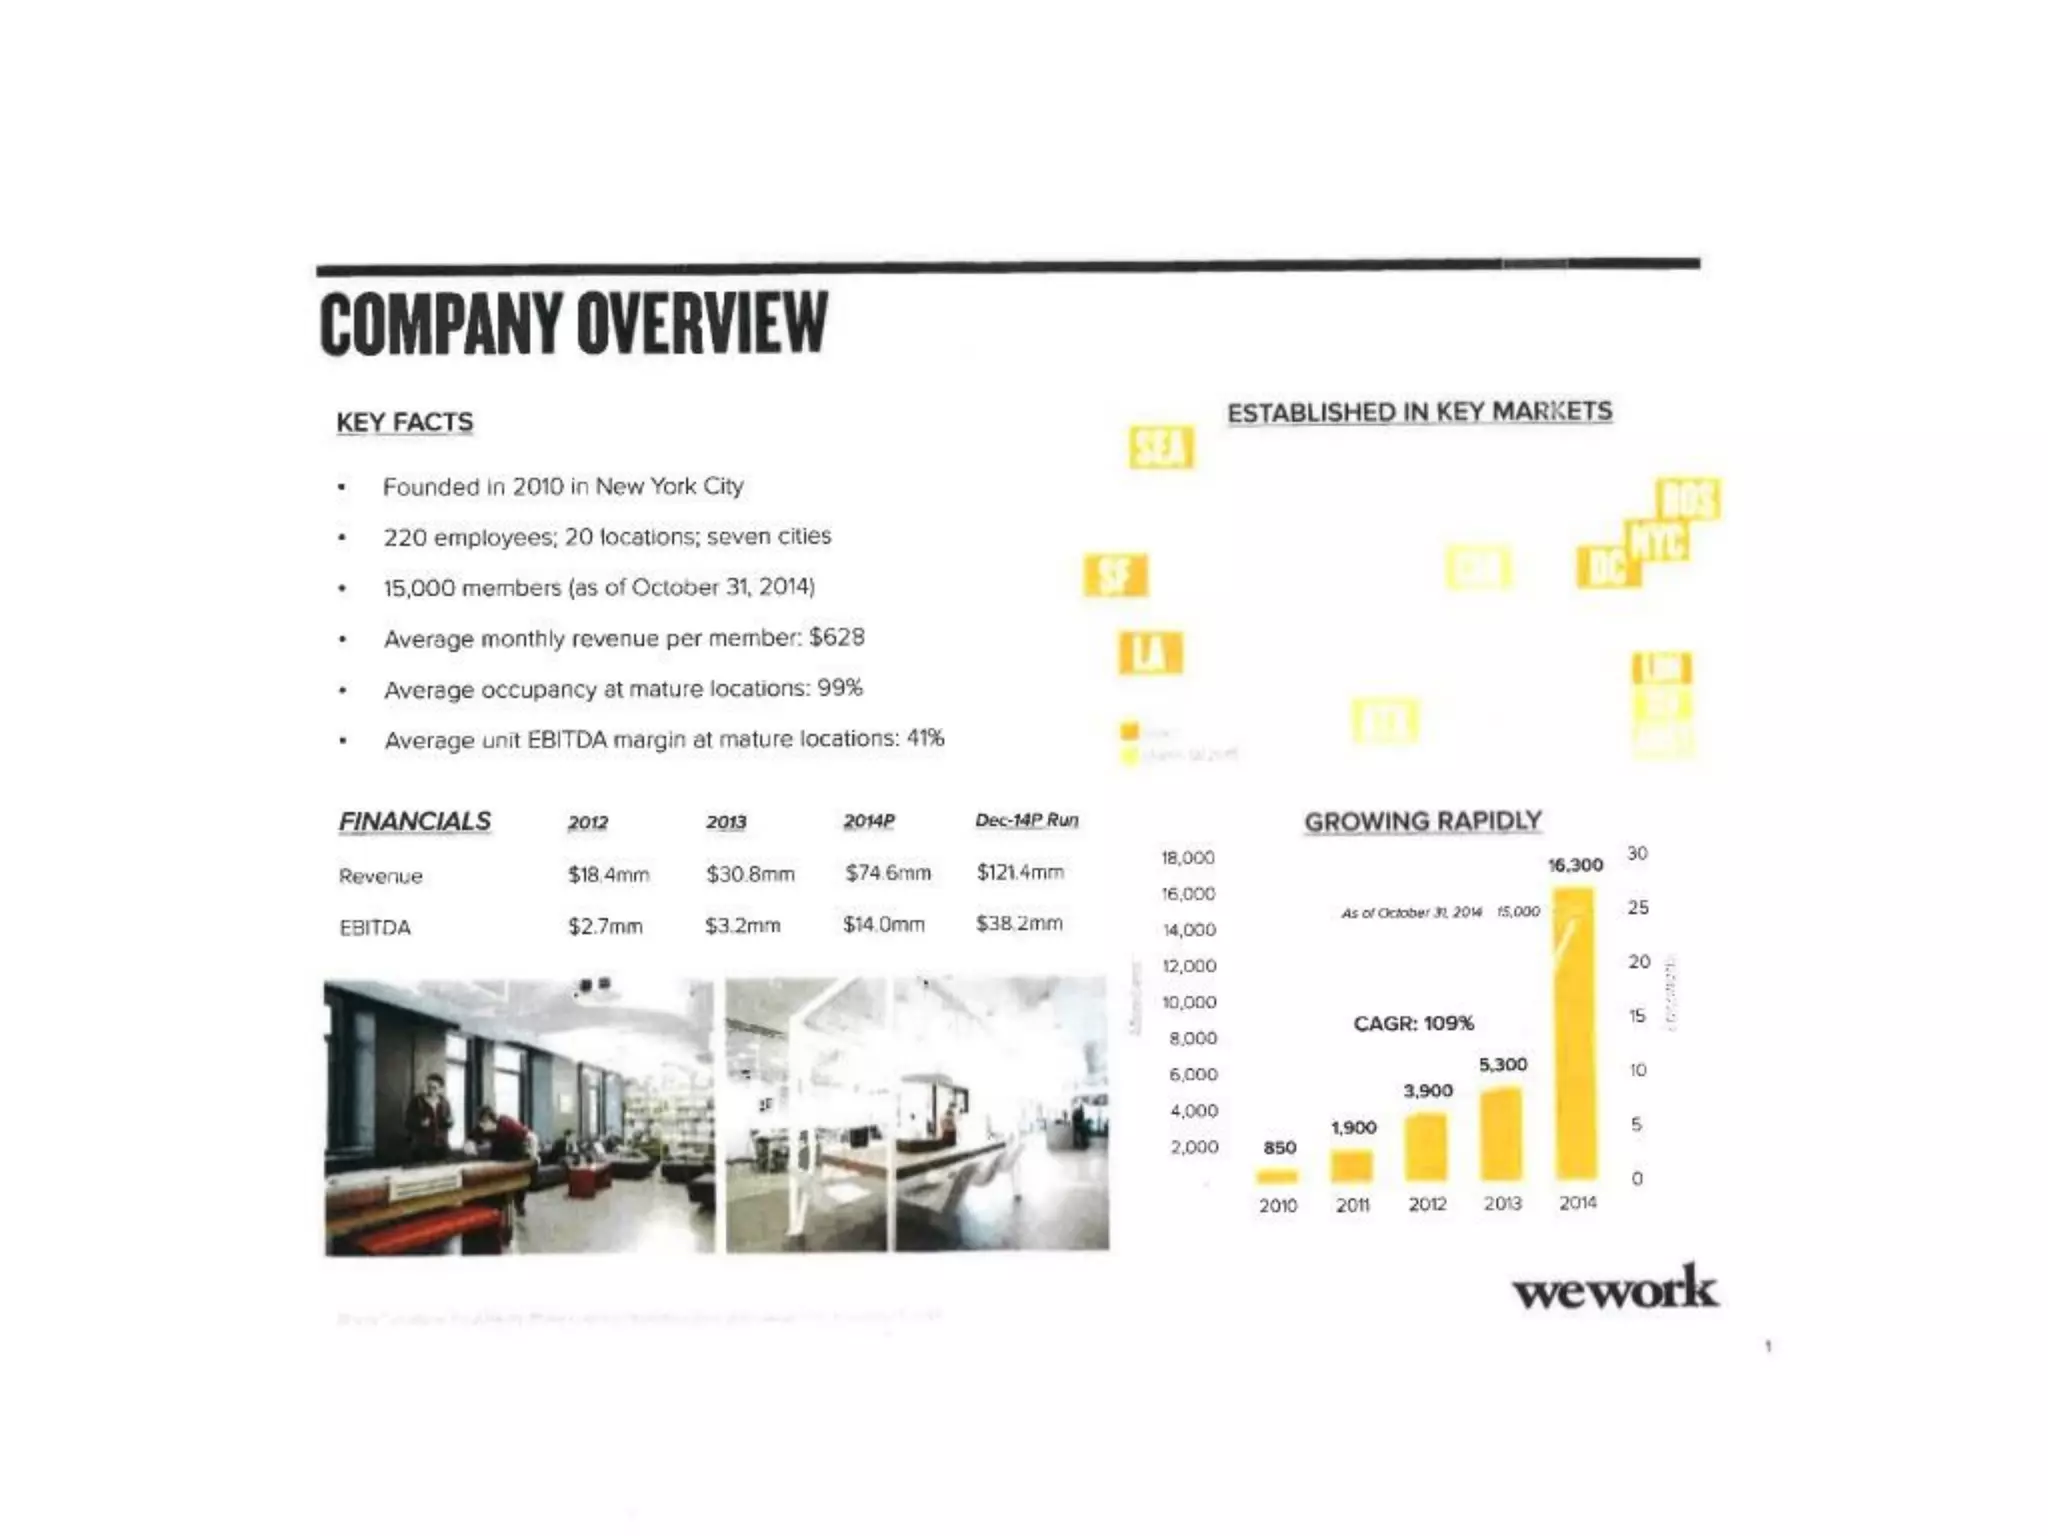
Slide 2 consolidates the most persuasive high-level facts: founding date, employees, locations, member counts, average revenue per member, occupancy rates and an abbreviated financial snapshot. There’s also a rapid-growth bar chart showing members over time. This is a classic investor-focused move — put the key metrics and growth trajectory early so investors can anchor their attention on scale and momentum.

The layout balances qualitative facts (locations, team size) with hard KPIs (ARPM, occupancy, EBITDA margin at mature locations), which helps the narrative move from mission to plausibility. Founders should emulate this by surfacing a one-page summary of the company’s most important metrics early; however, make sure those metrics are conservative and footnoted if necessary — overstated or unclear metrics will be the first thing skeptics challenge.

Key Takeaway: Lead with a concise metrics page that combines traction, unit economics and key operational data to quickly build investor confidence.
Value Proposition — ‘Space as a Service’

Value Proposition — ‘Space as a Service’

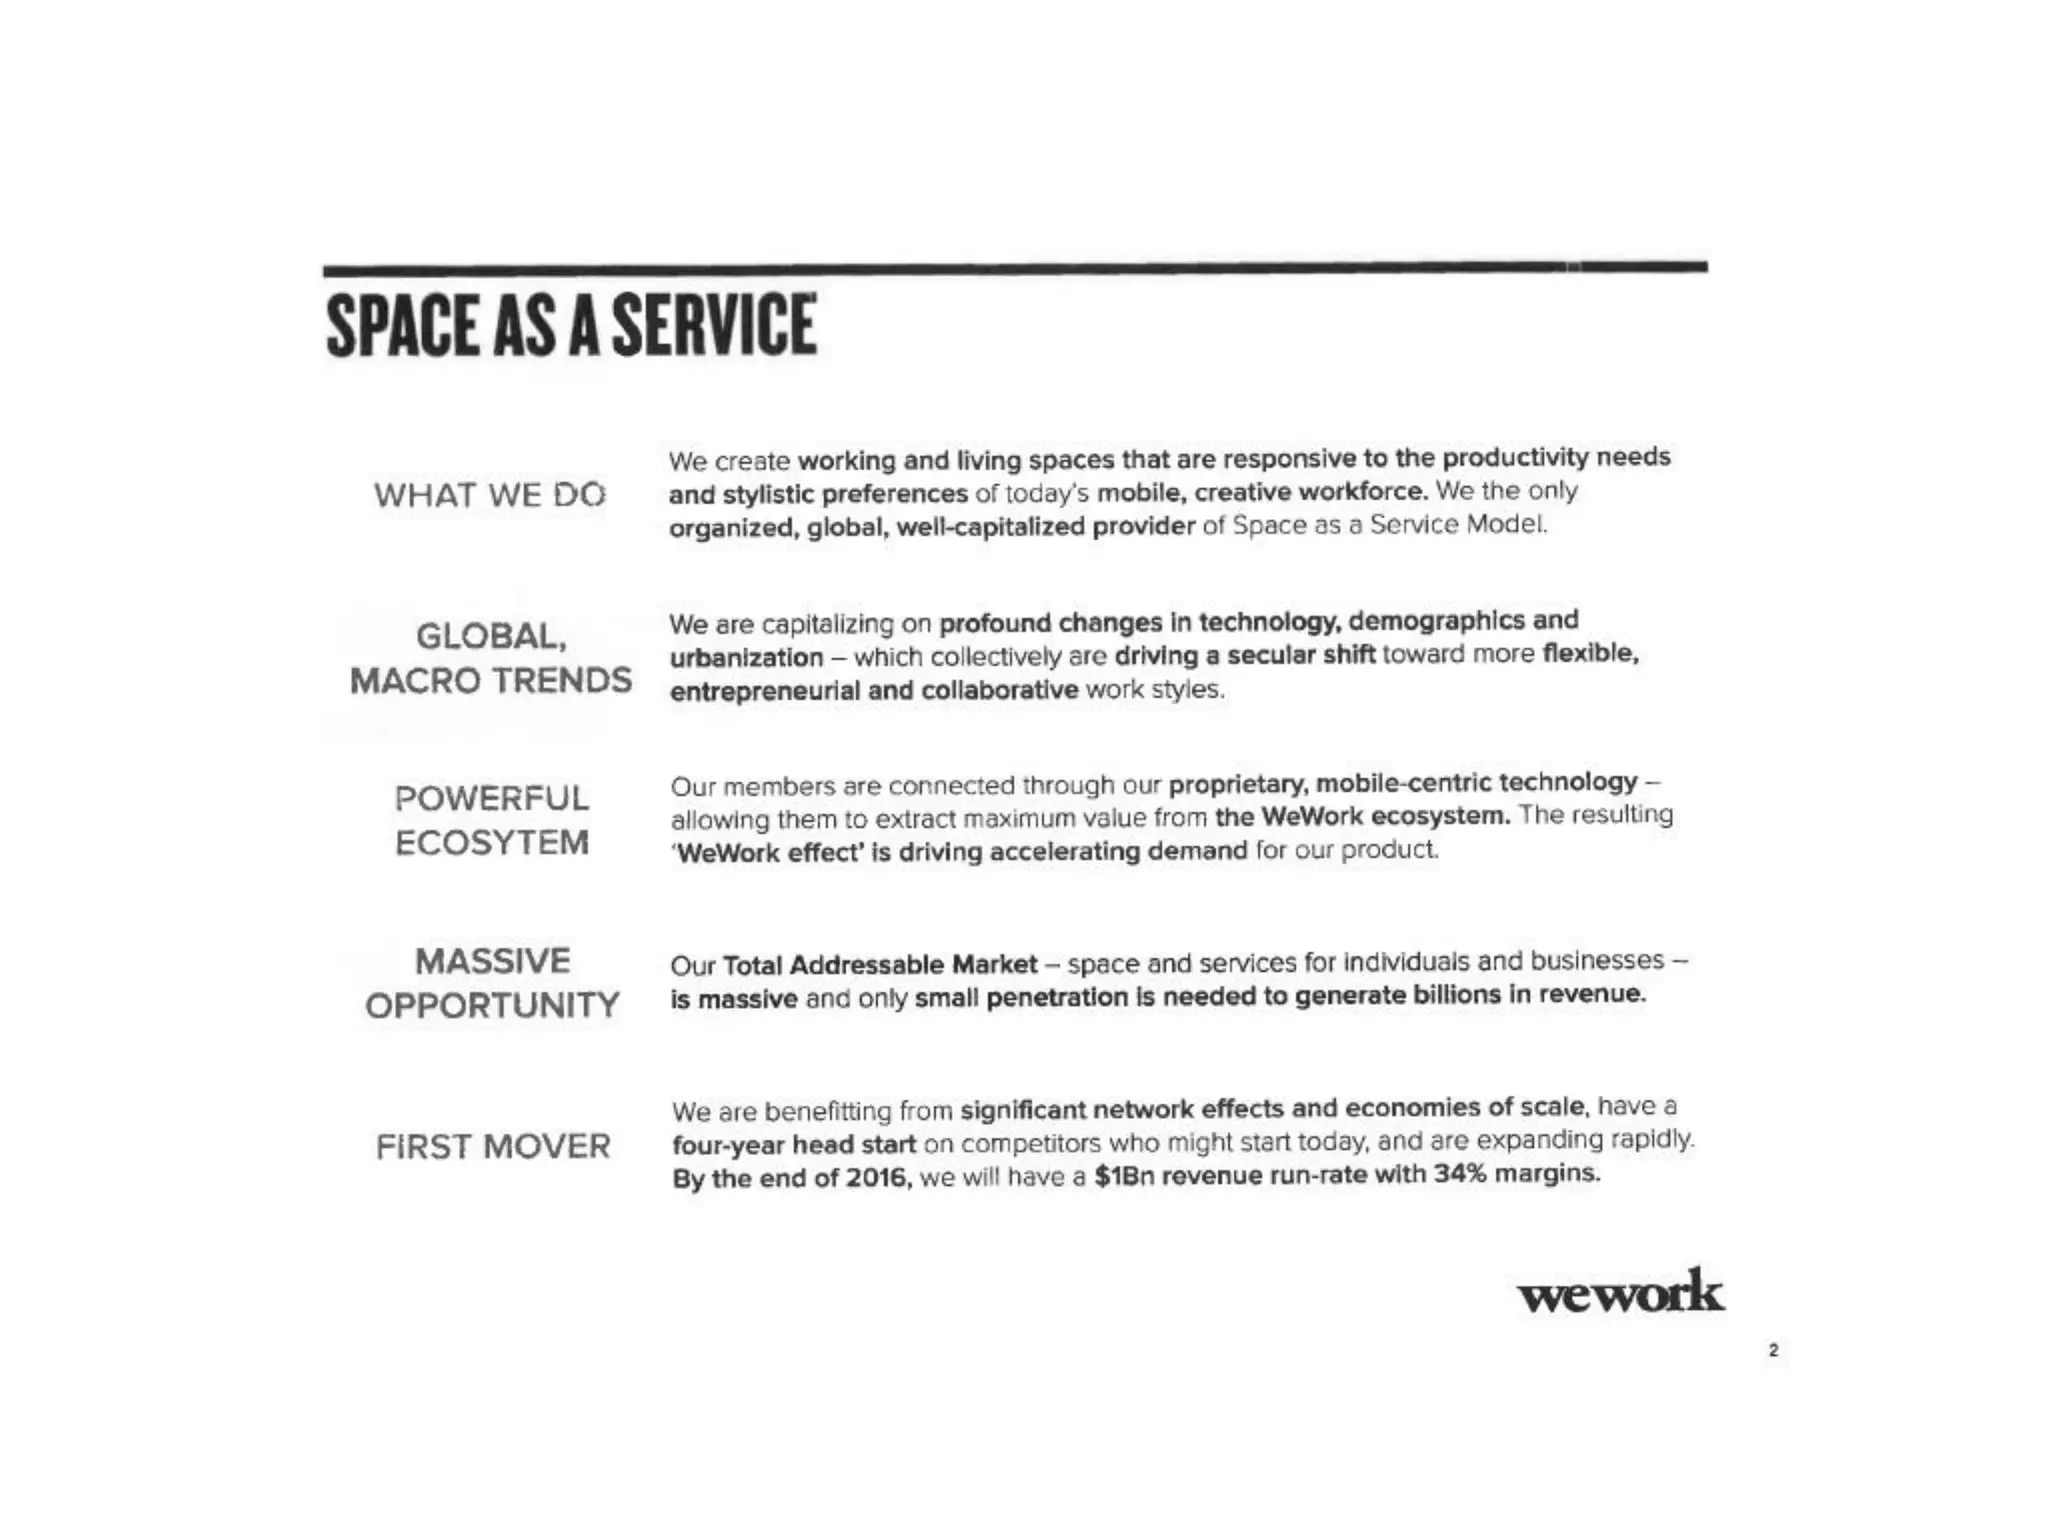
Slide 3 lays out the company’s core proposition: offering working and living spaces optimized for modern, mobile, creative workers. The slide enumerates macro trends (technology, urbanization, demographics), the company’s proprietary ecosystem and the size of the addressable market. This is effective because it connects product features to larger secular trends and articulates why demand is structural, not ephemeral.

The slide also attempts to justify scale economics and a first-mover advantage (projecting a $1B run-rate by 2016). For founders, the lesson is to pair product benefits with macro tailwinds and explain how your model captures value at scale. Be careful: strong forward-looking claims should be supported by conservative underpinnings and sensitivity analysis, since aggressive upside projections invite close scrutiny.

Key Takeaway: Frame your product around enduring macro trends and show how your model captures structural value — but temper optimistic projections with clear assumptions.
Unit Economics & Proof Points: Claimed profitability

Unit Economics & Proof Points: Claimed profitability

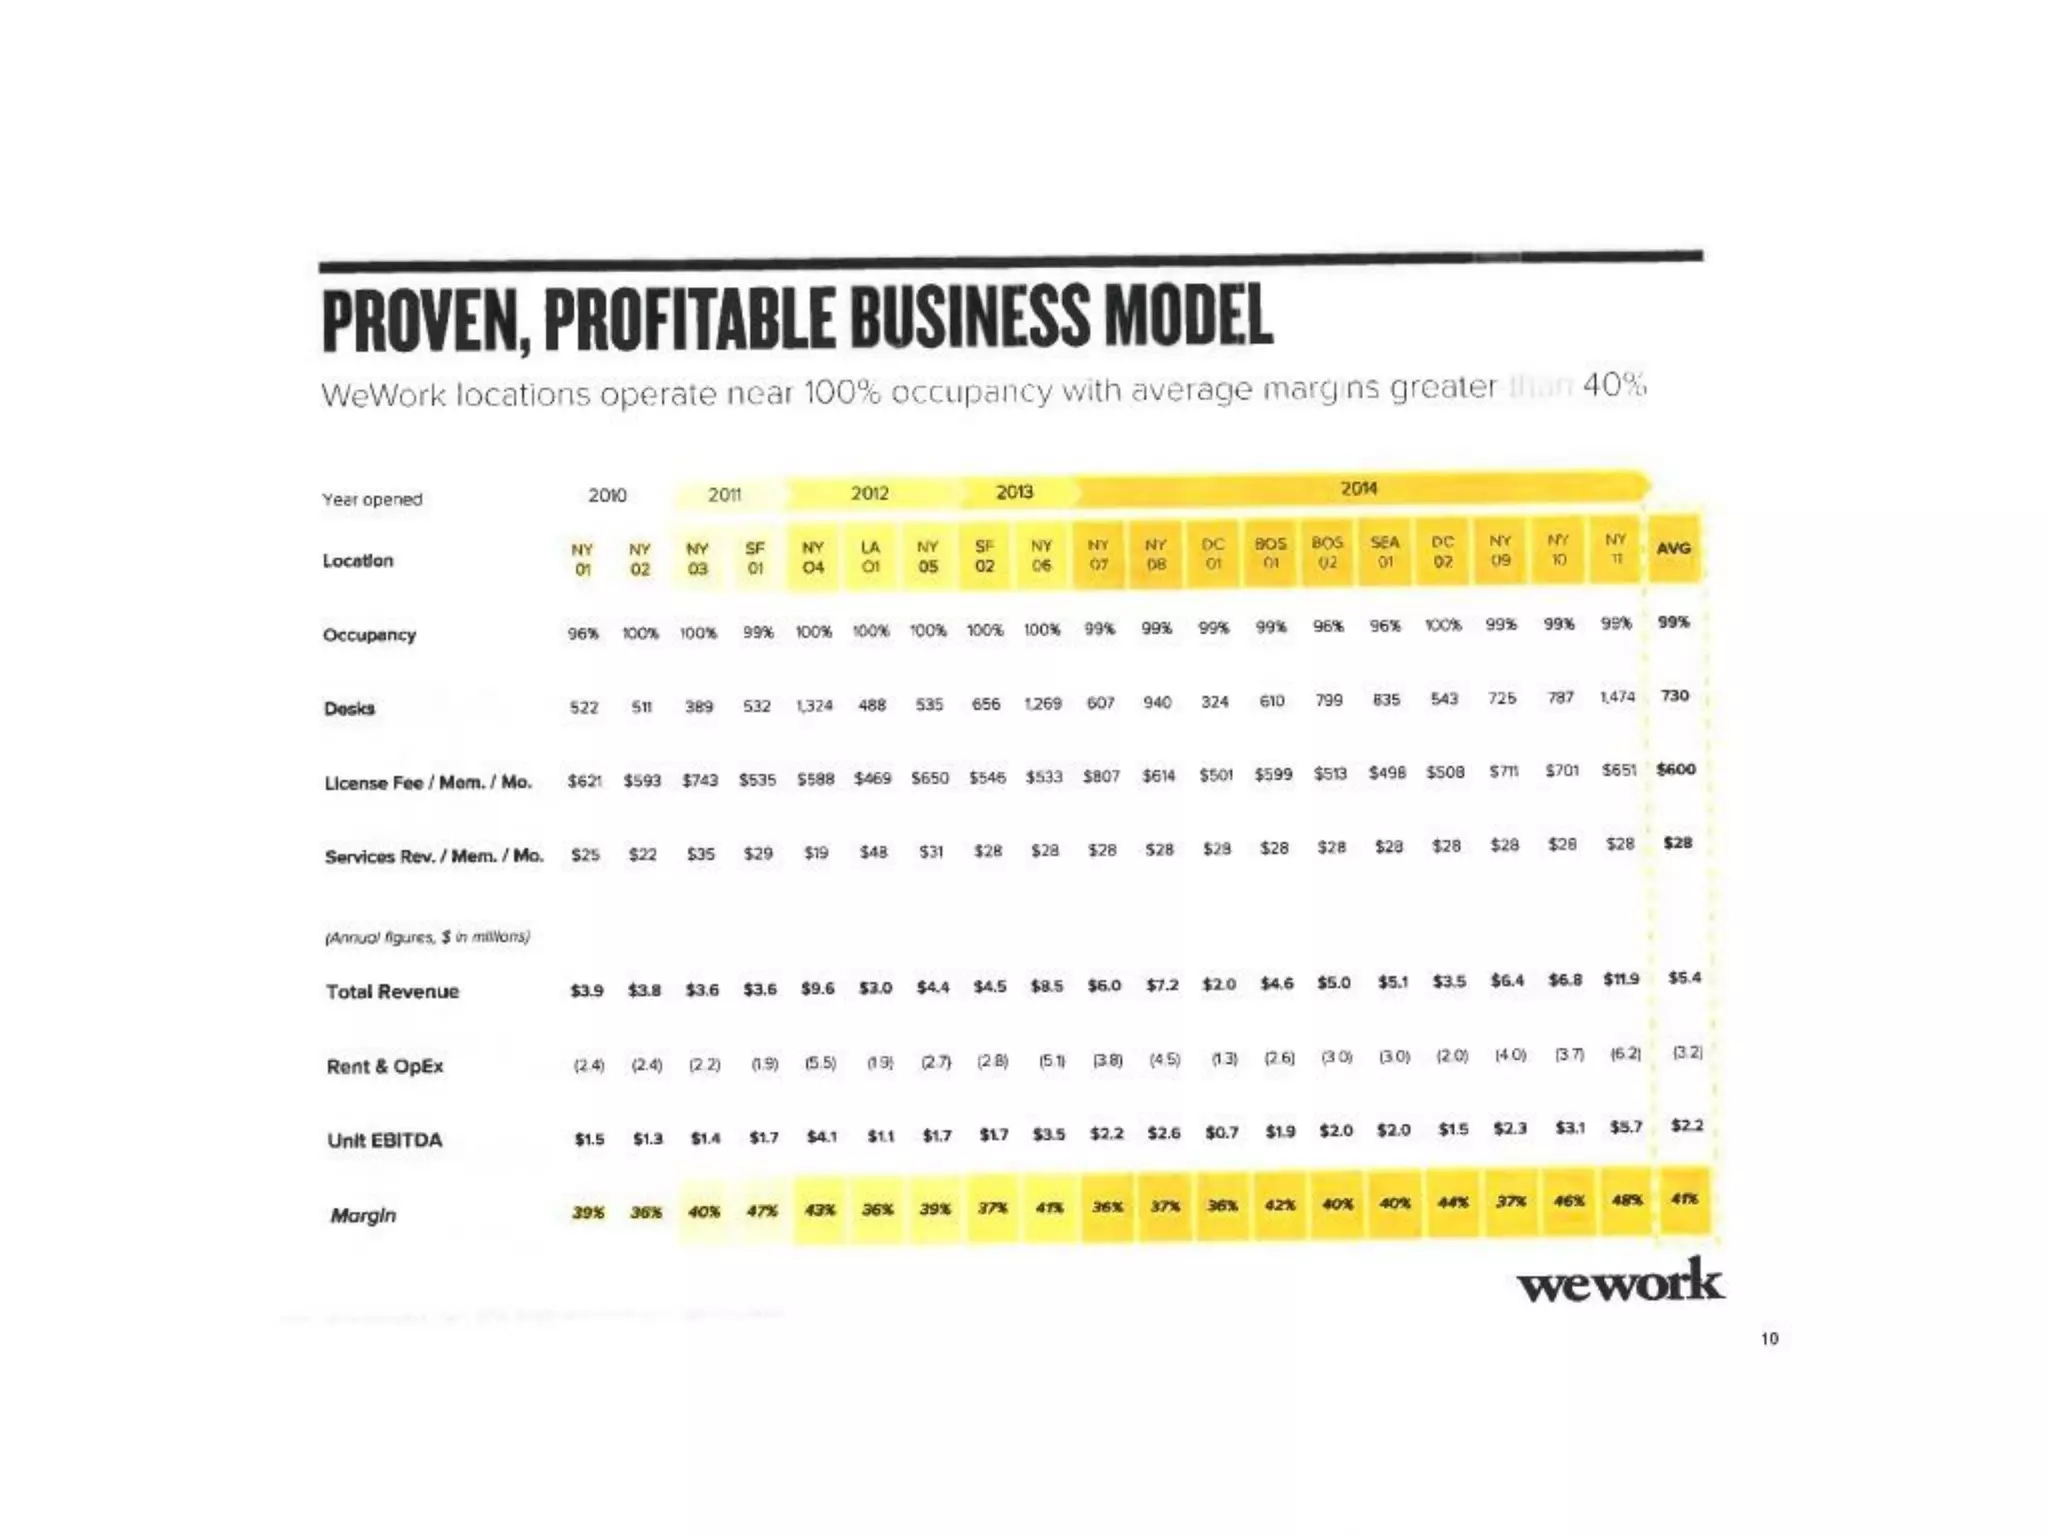
Slide 12 presents the company’s unit-level economics and claims near-100% occupancy at mature locations with average unit EBITDA margins >40%. The slide lists desks, license fees per member, service revenue per member, rent & OpEx and derives Unit EBITDA and margin by location. This is the type of slide investors pore over — it’s where the story of scalable, repeatable economics must either stand or fall.

The lesson is twofold: (1) show real, location-level P&Ls to prove economics rather than aggregate top-line numbers; (2) disclose underlying assumptions (ramp time, capex, landlord contributions). WeWork used location examples to prove the concept, which is smart, but future founders should also include sensitivity ranges and conservative scenarios because reputational risk and capital providers punish undisclosed downside sensitivities.

Key Takeaway: Back your growth story with granular, location-level economics and transparent assumptions — and include downside sensitivity to build credibility.
Growth, Pipeline & Network Effects

Growth, Pipeline & Network Effects

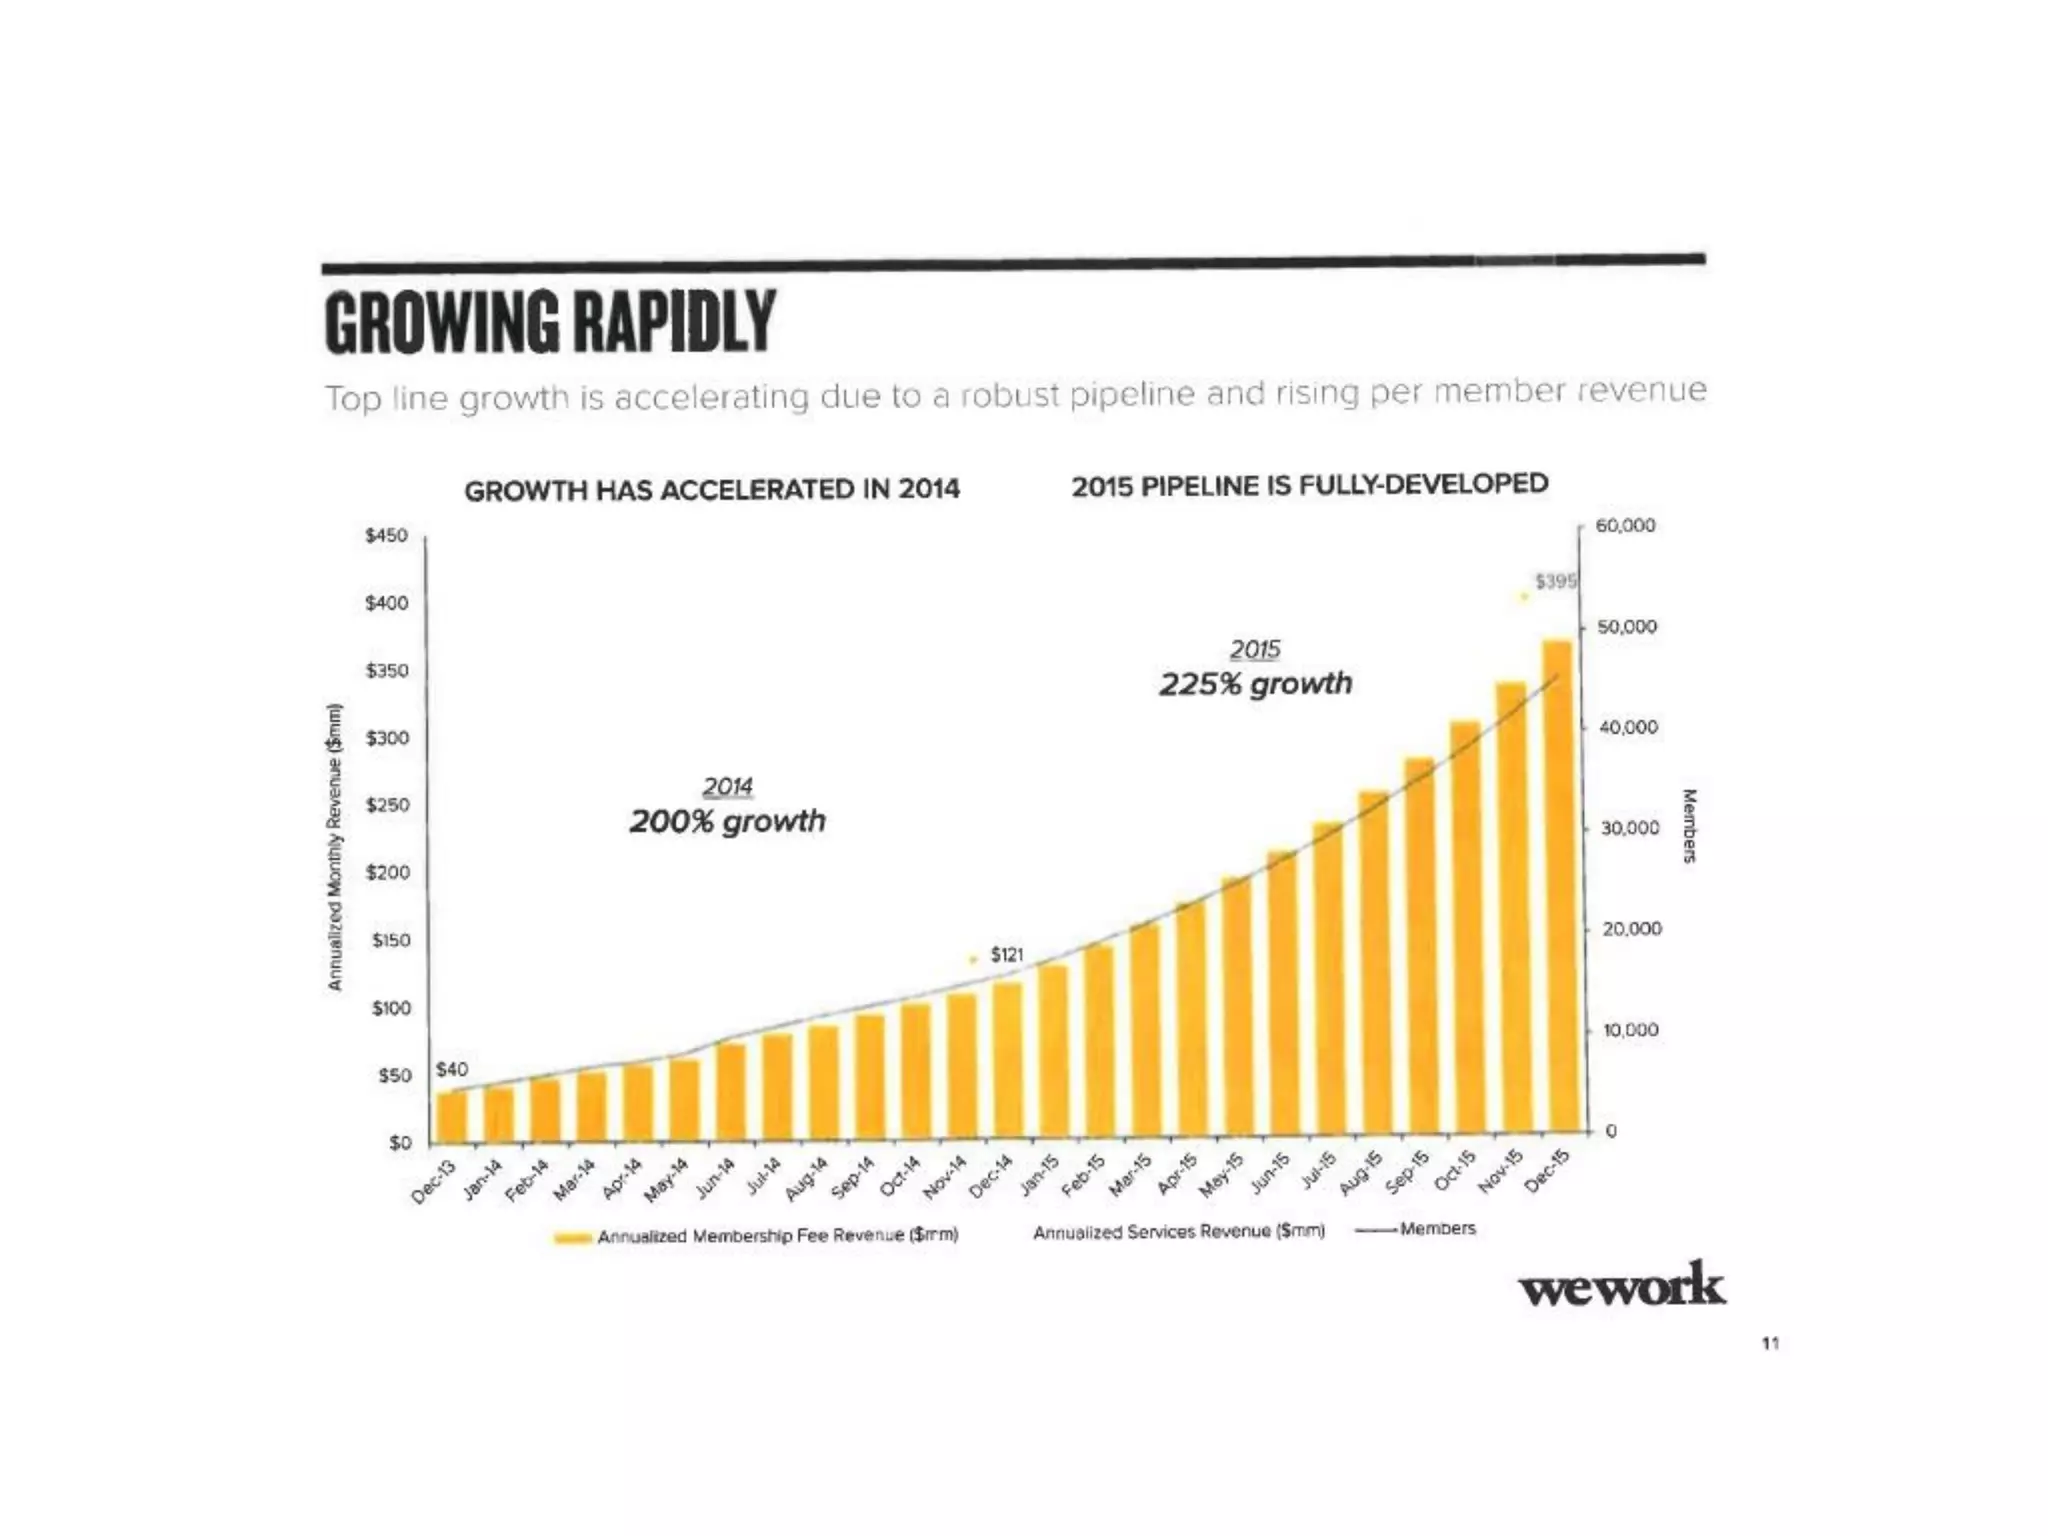
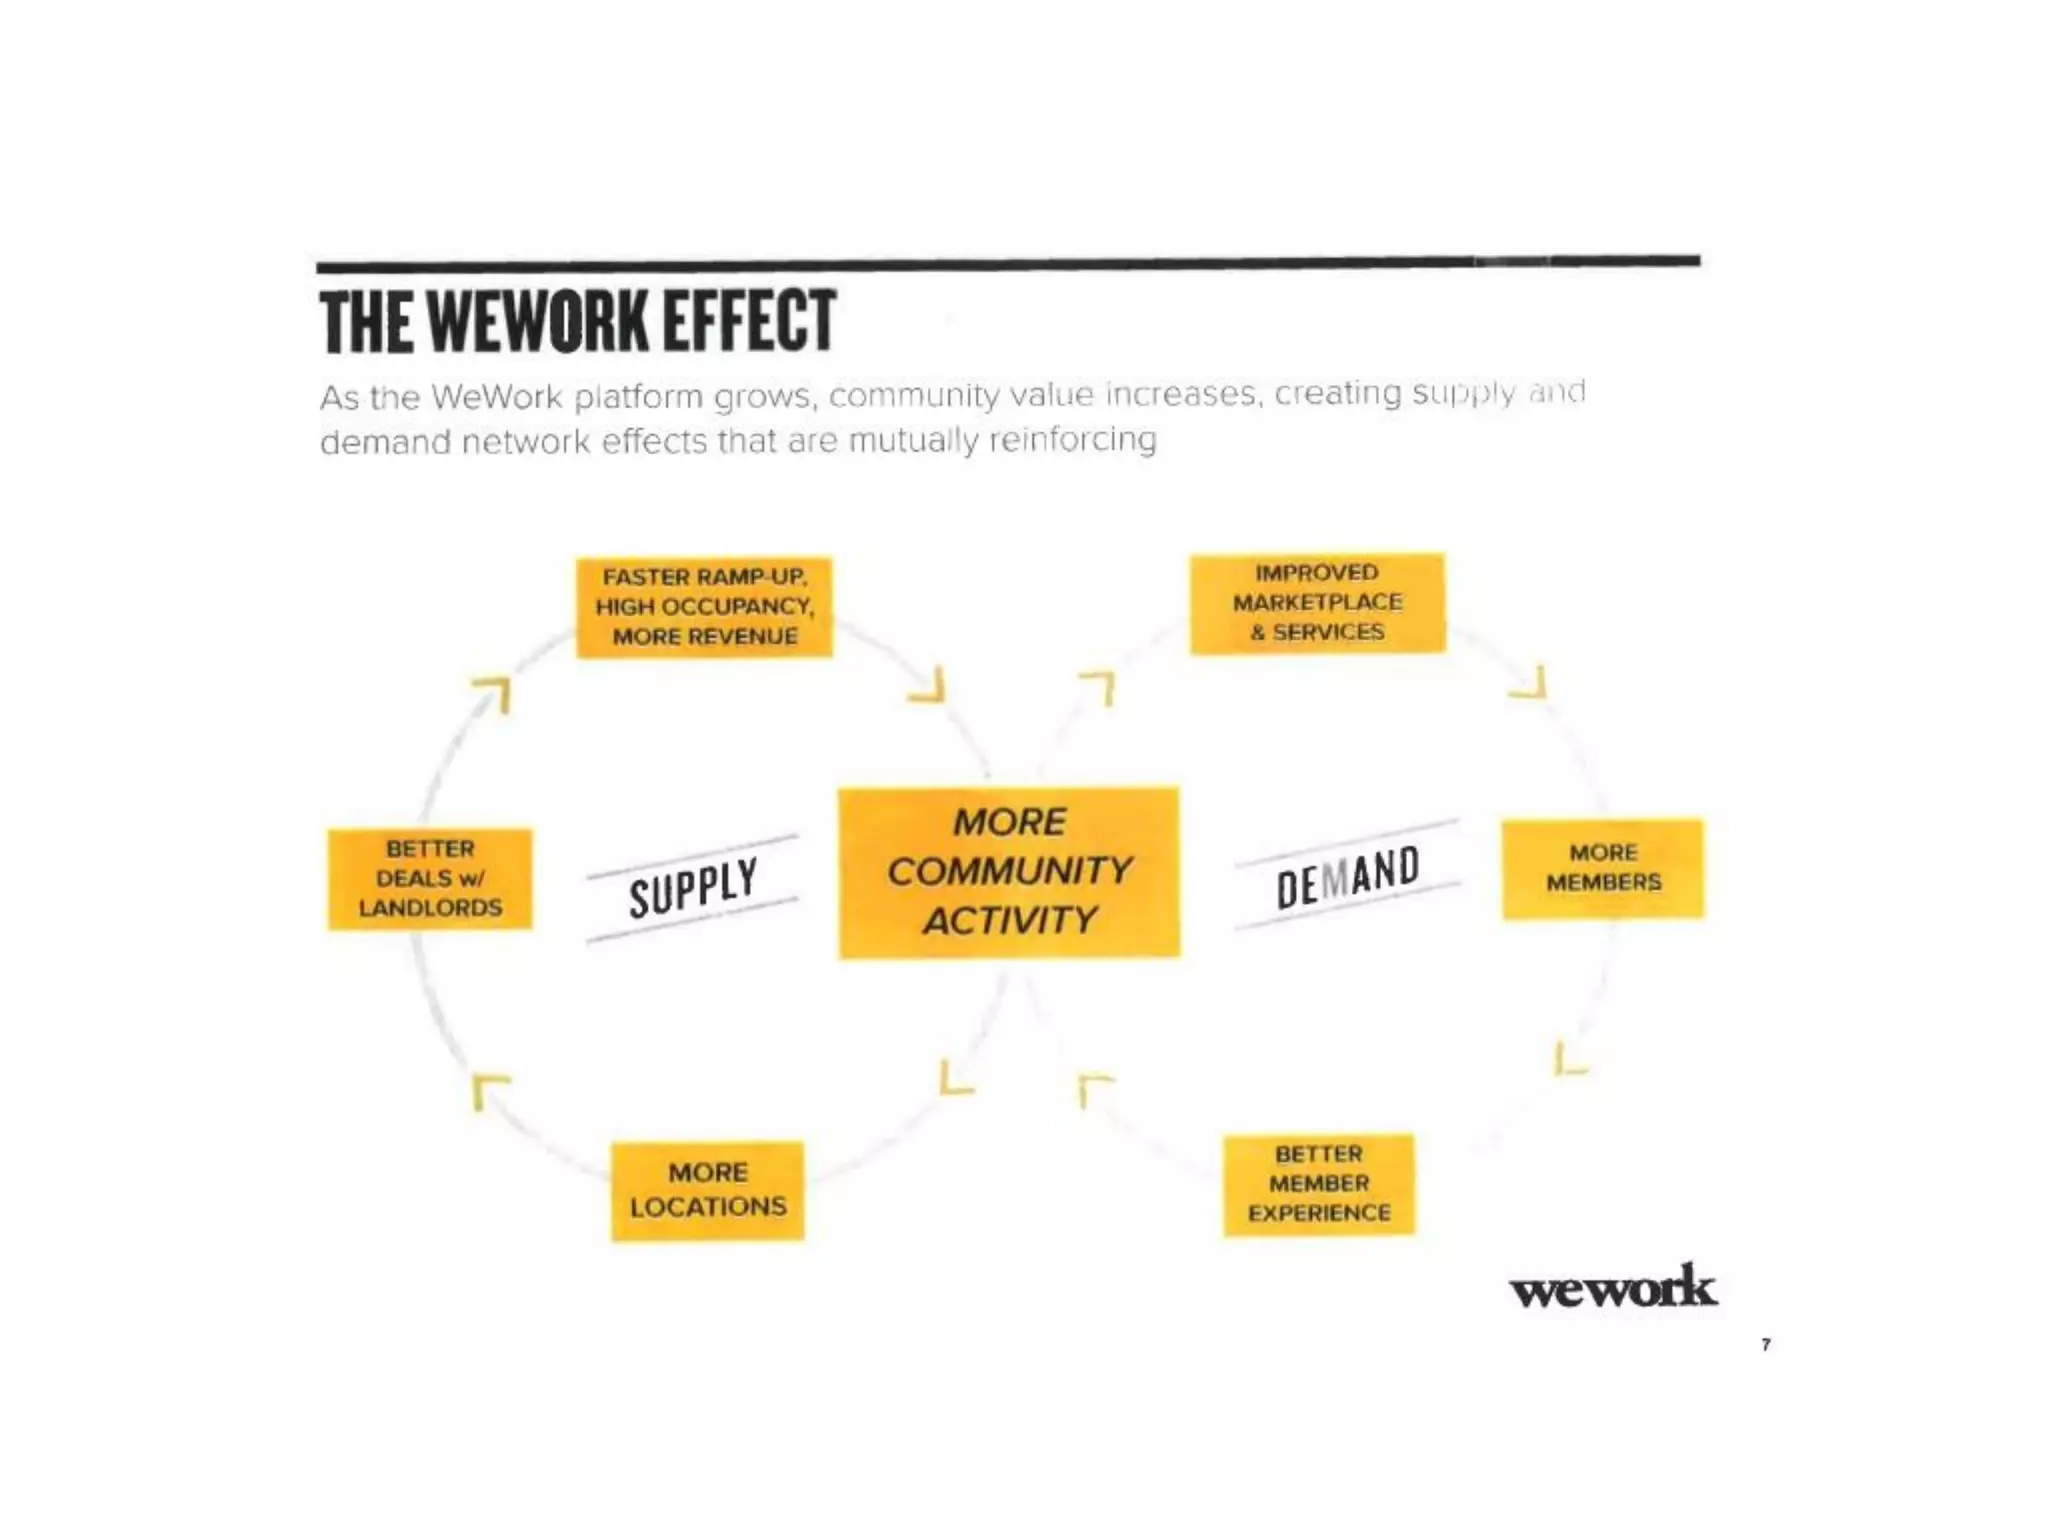
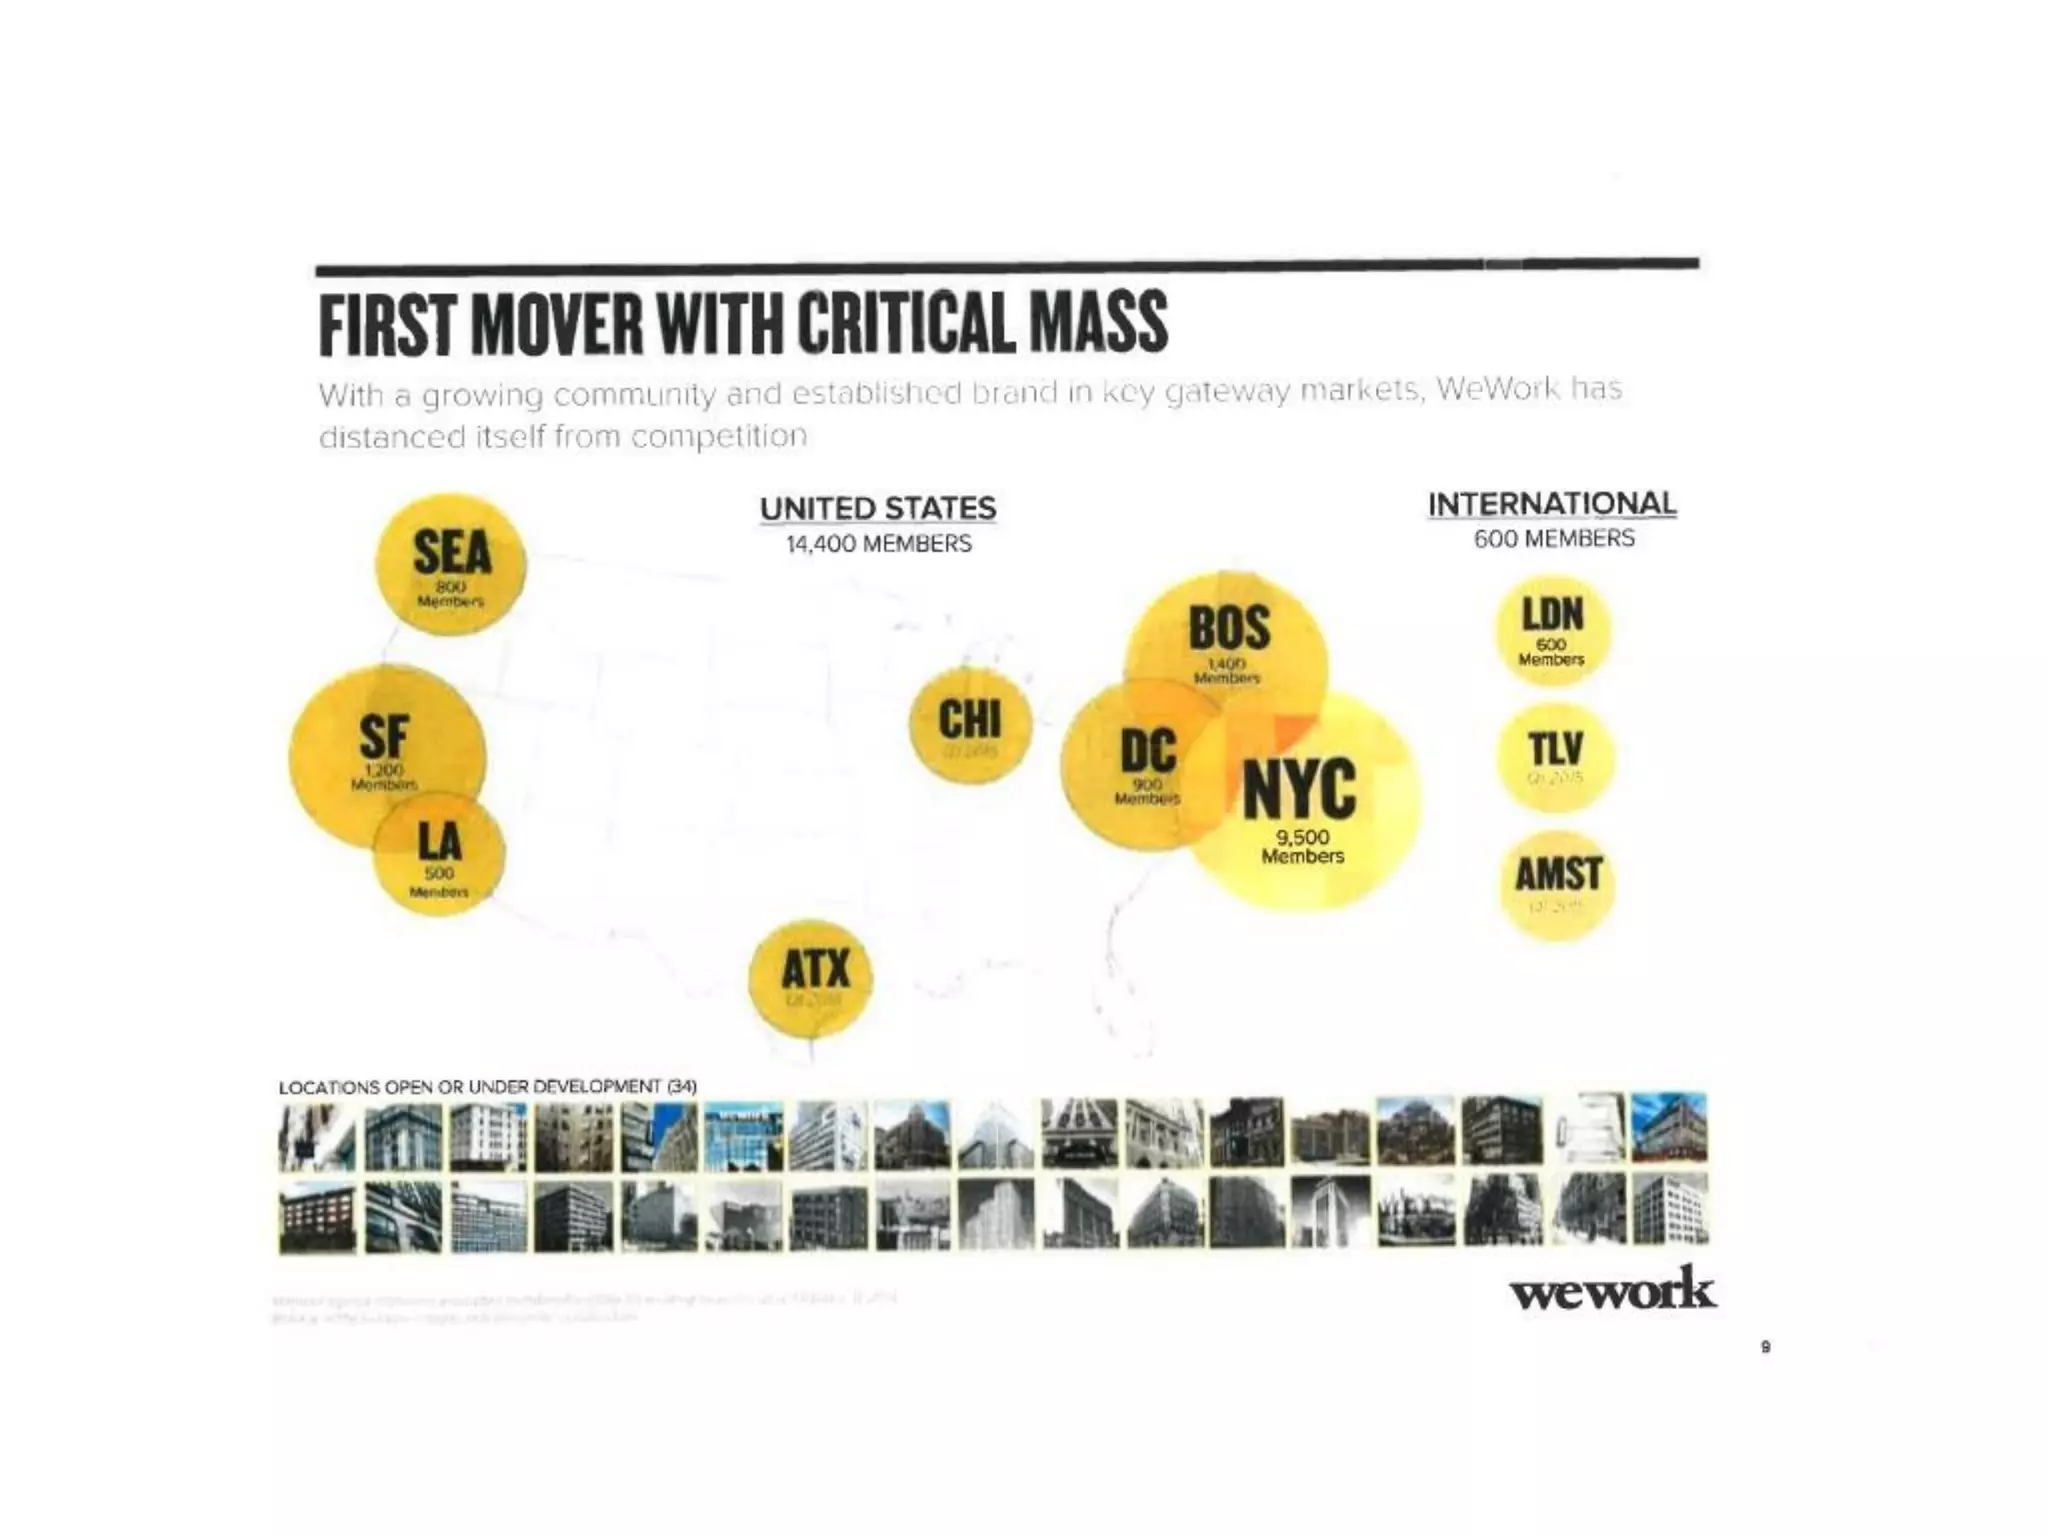
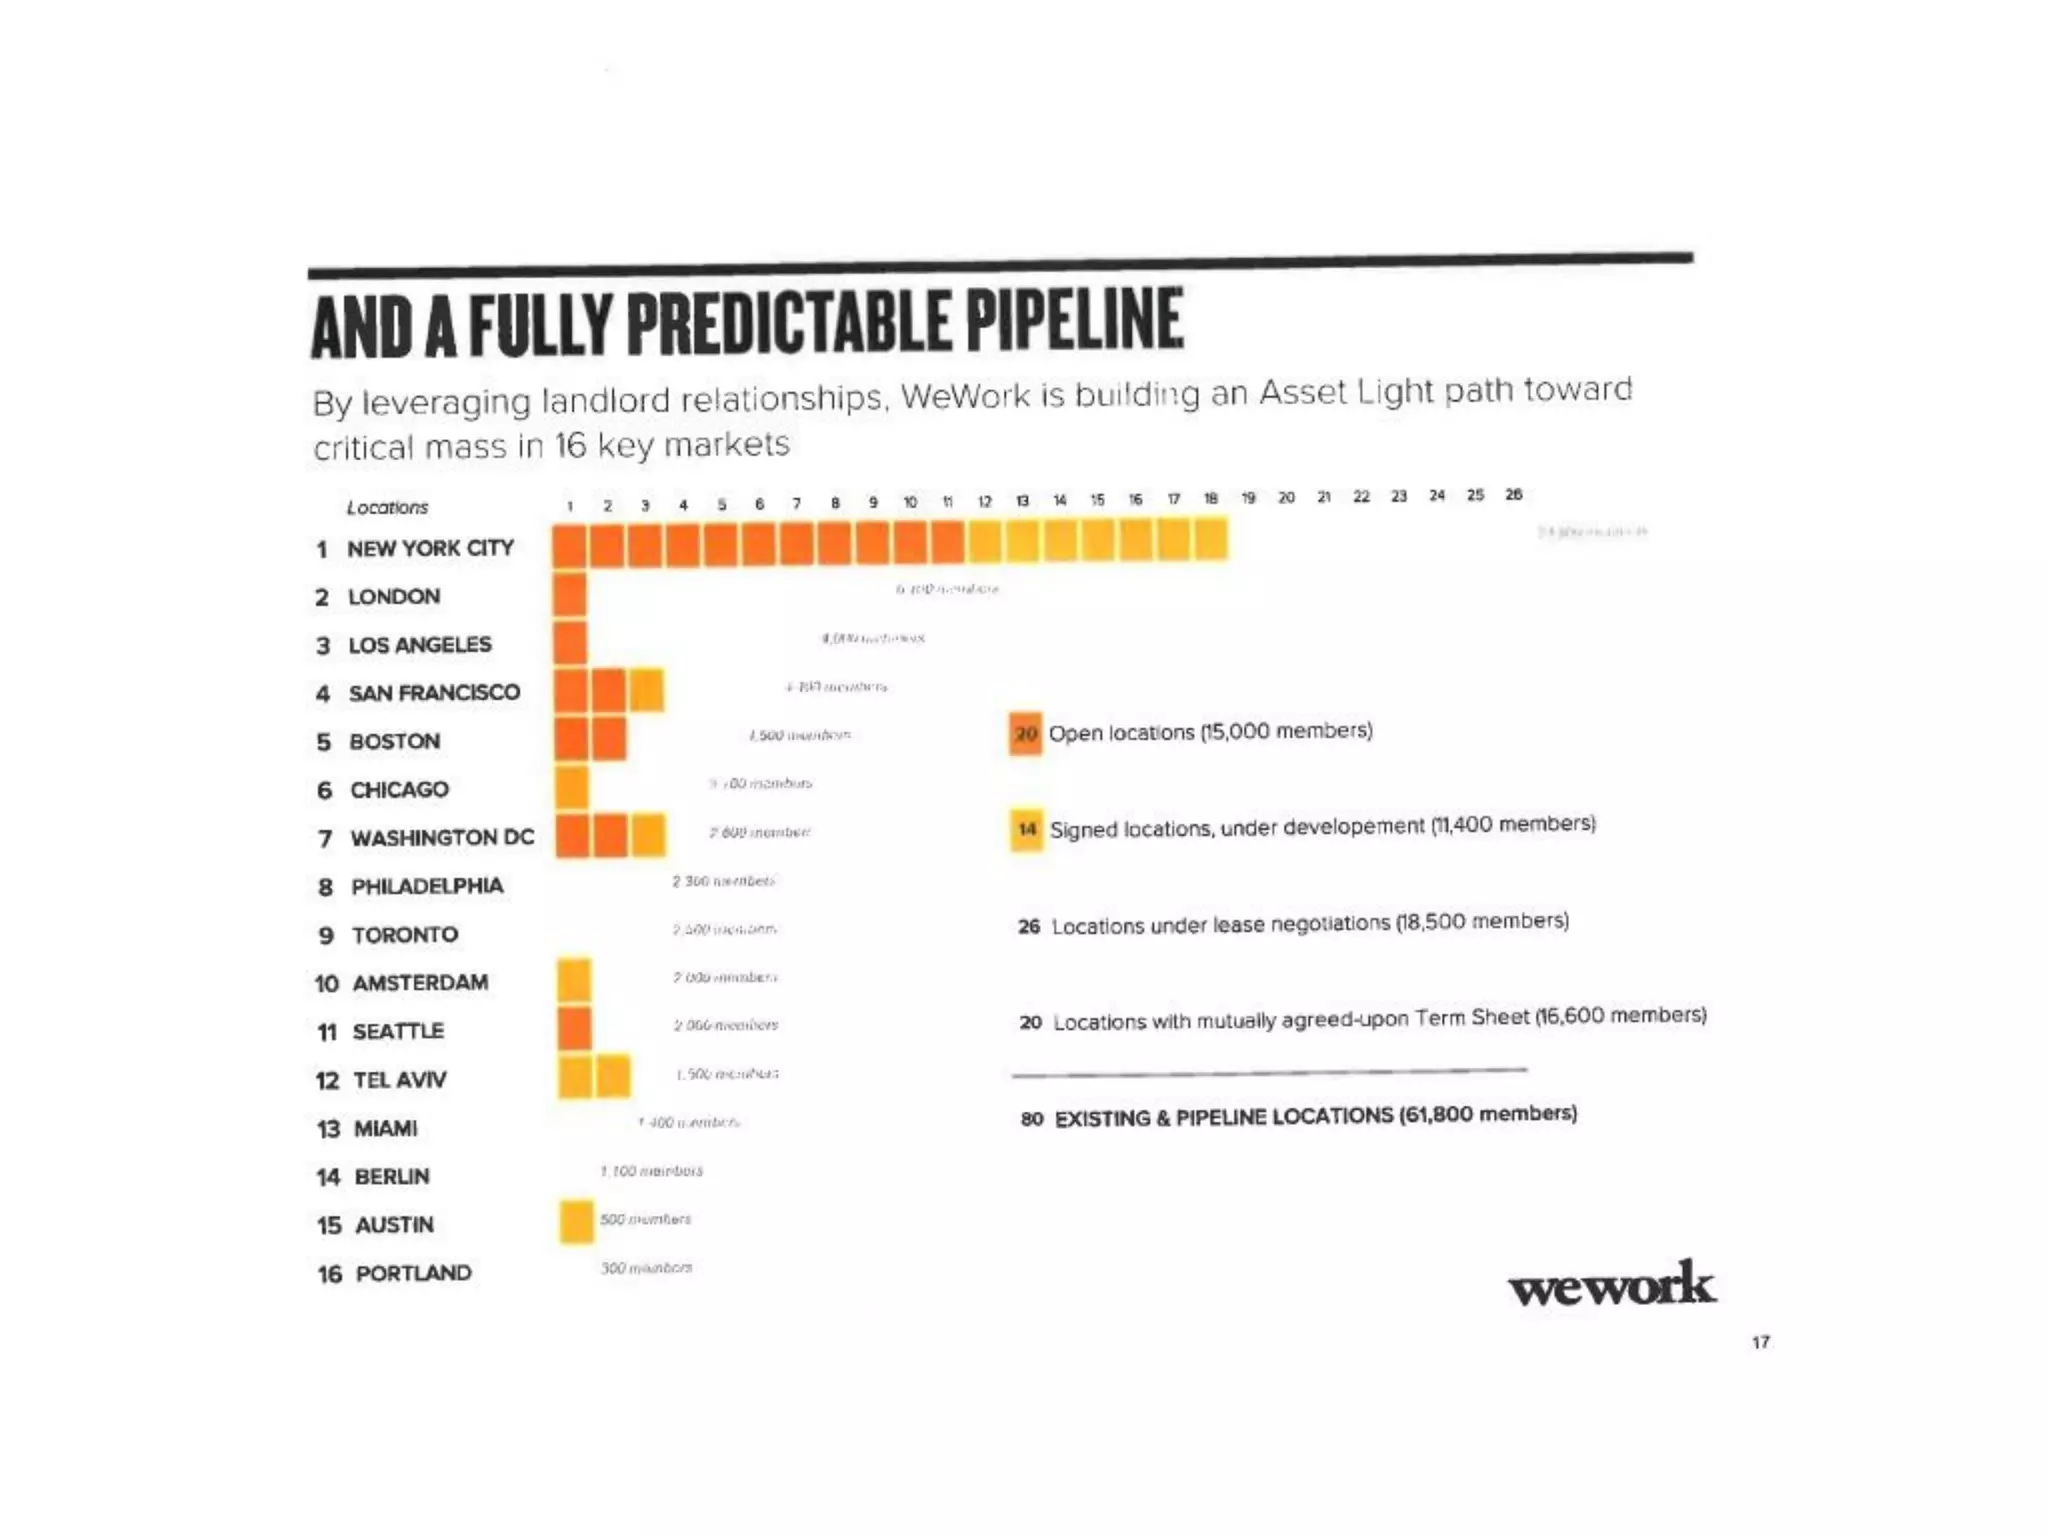
Slide 13 demonstrates rapid top-line acceleration with an annualized membership fee revenue chart and a projection of 225% growth in 2015. Nearby slides (wework effect, pipeline maps) emphasize network effects: more community activity drives both demand and supply advantages (landlord deals, more locations). Presenting both a historical growth curve and a pipeline map is powerful: it shows not just what you’ve done, but where the company will scale next.

Founders should show both realized growth and a validated, staged pipeline — including signed locations, under-development and term-sheet agreements — rather than vague ‘target’ markets. However, be realistic about conversion from pipeline to revenue. Overstating how quickly pipeline converts into operating assets is a common pitfall that can turn a persuasive growth slide into a credibility gap.

Key Takeaway: Combine historical traction with a documented, staged pipeline and explicit conversion assumptions to make growth projections believable.
Monetization & Services Roadmap

Monetization & Services Roadmap

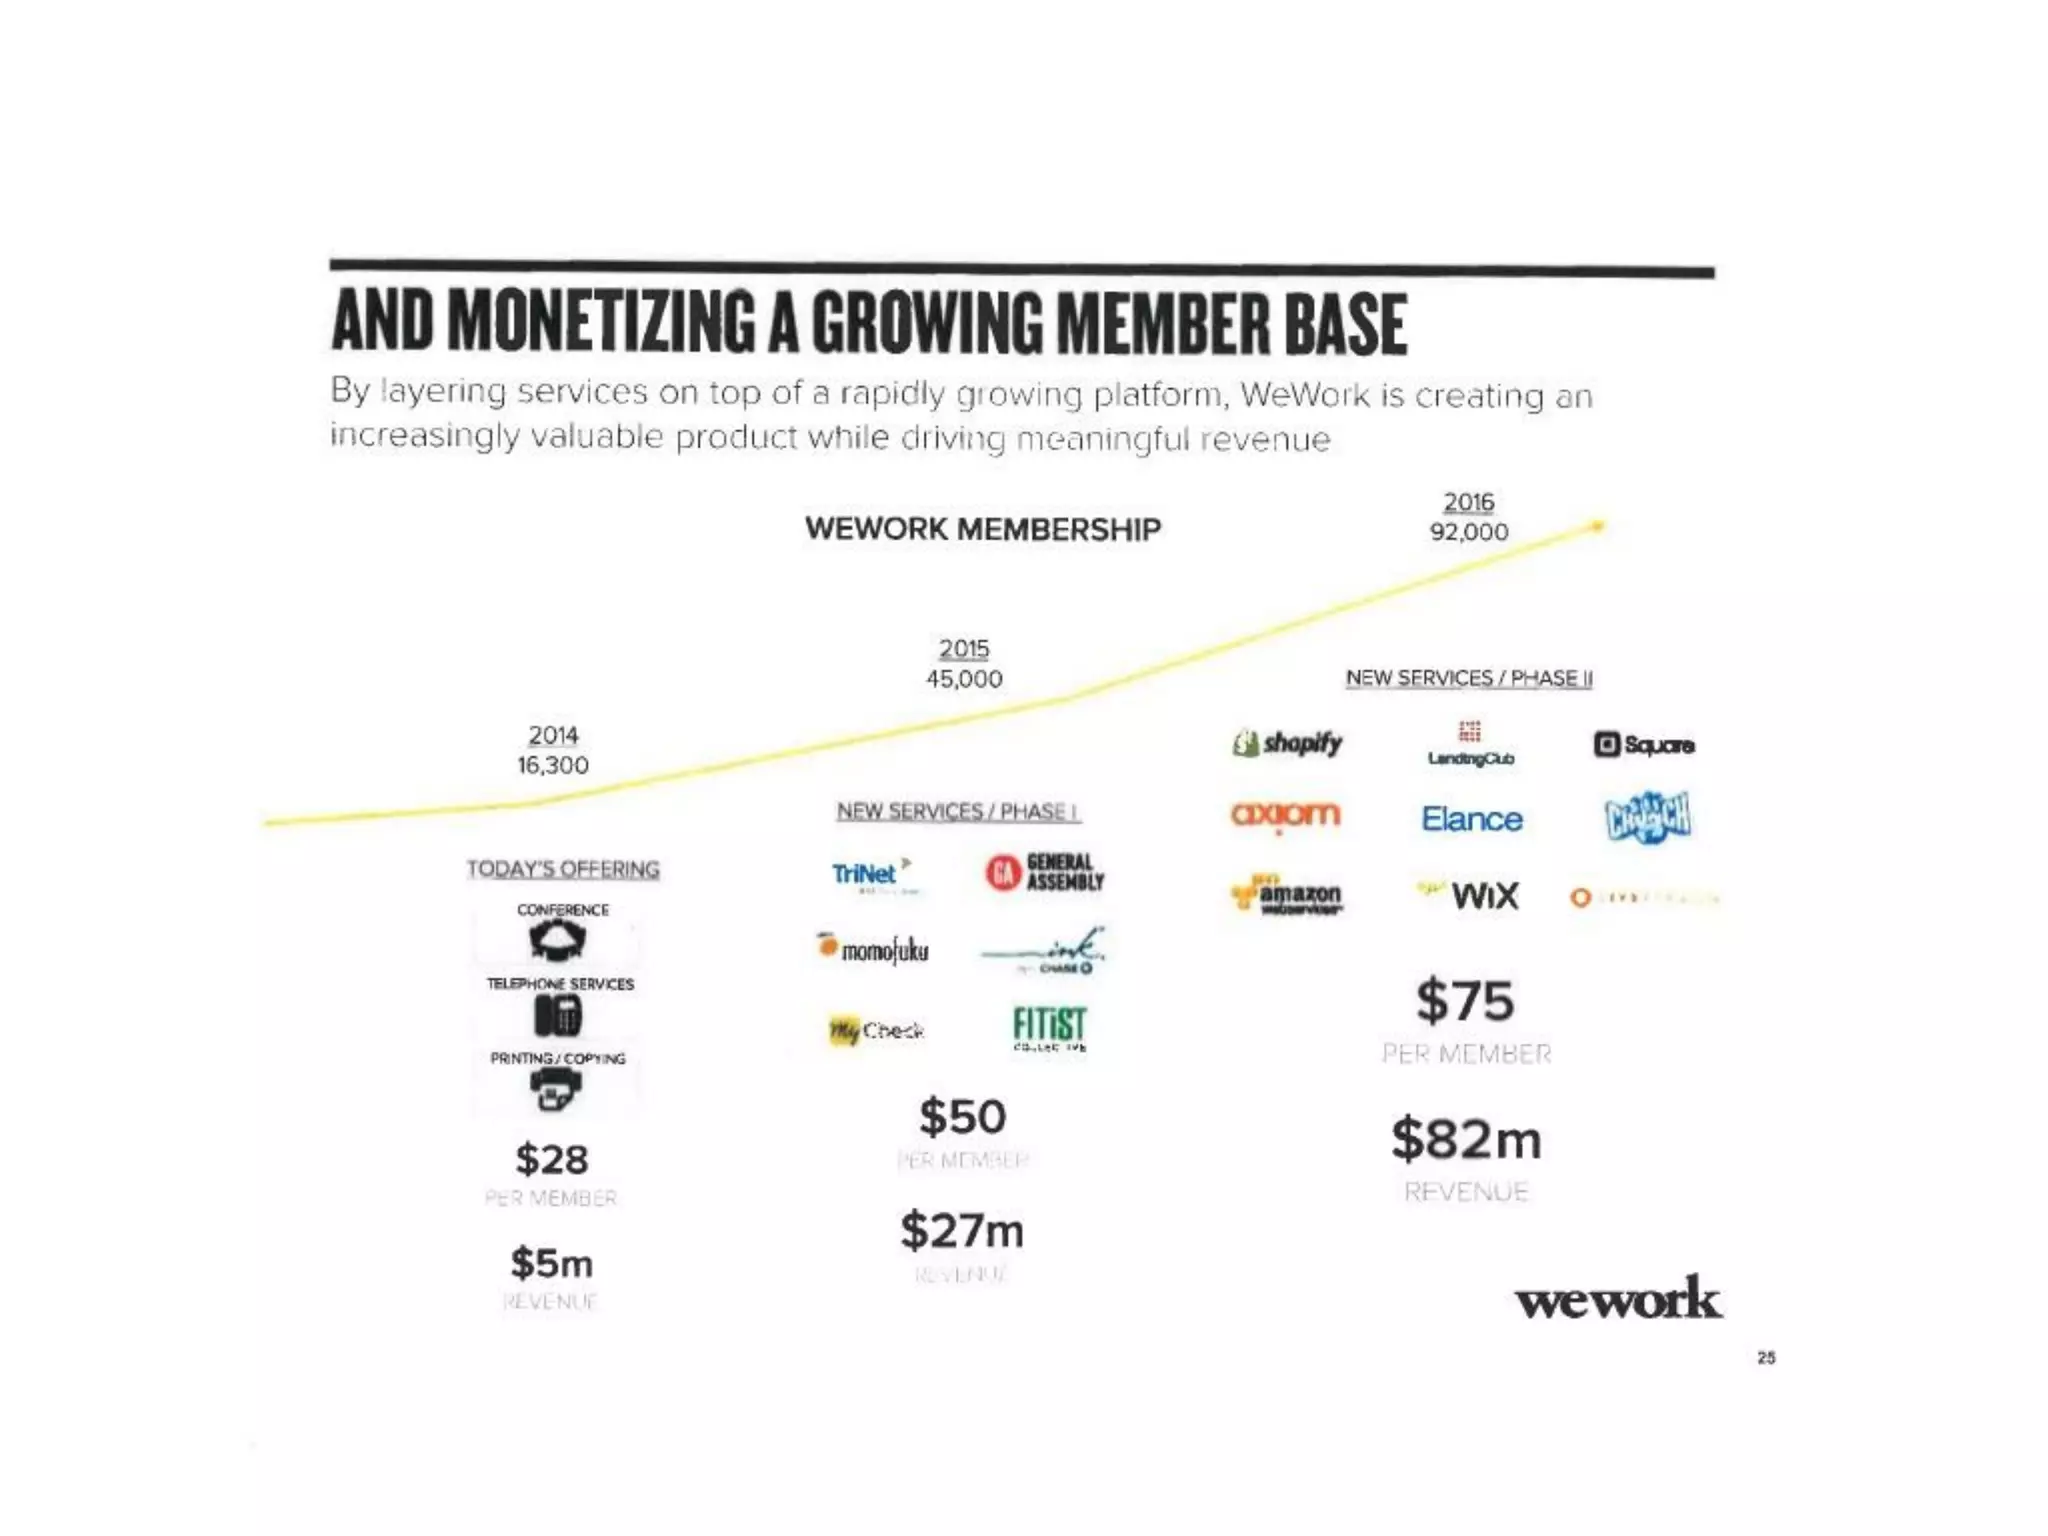
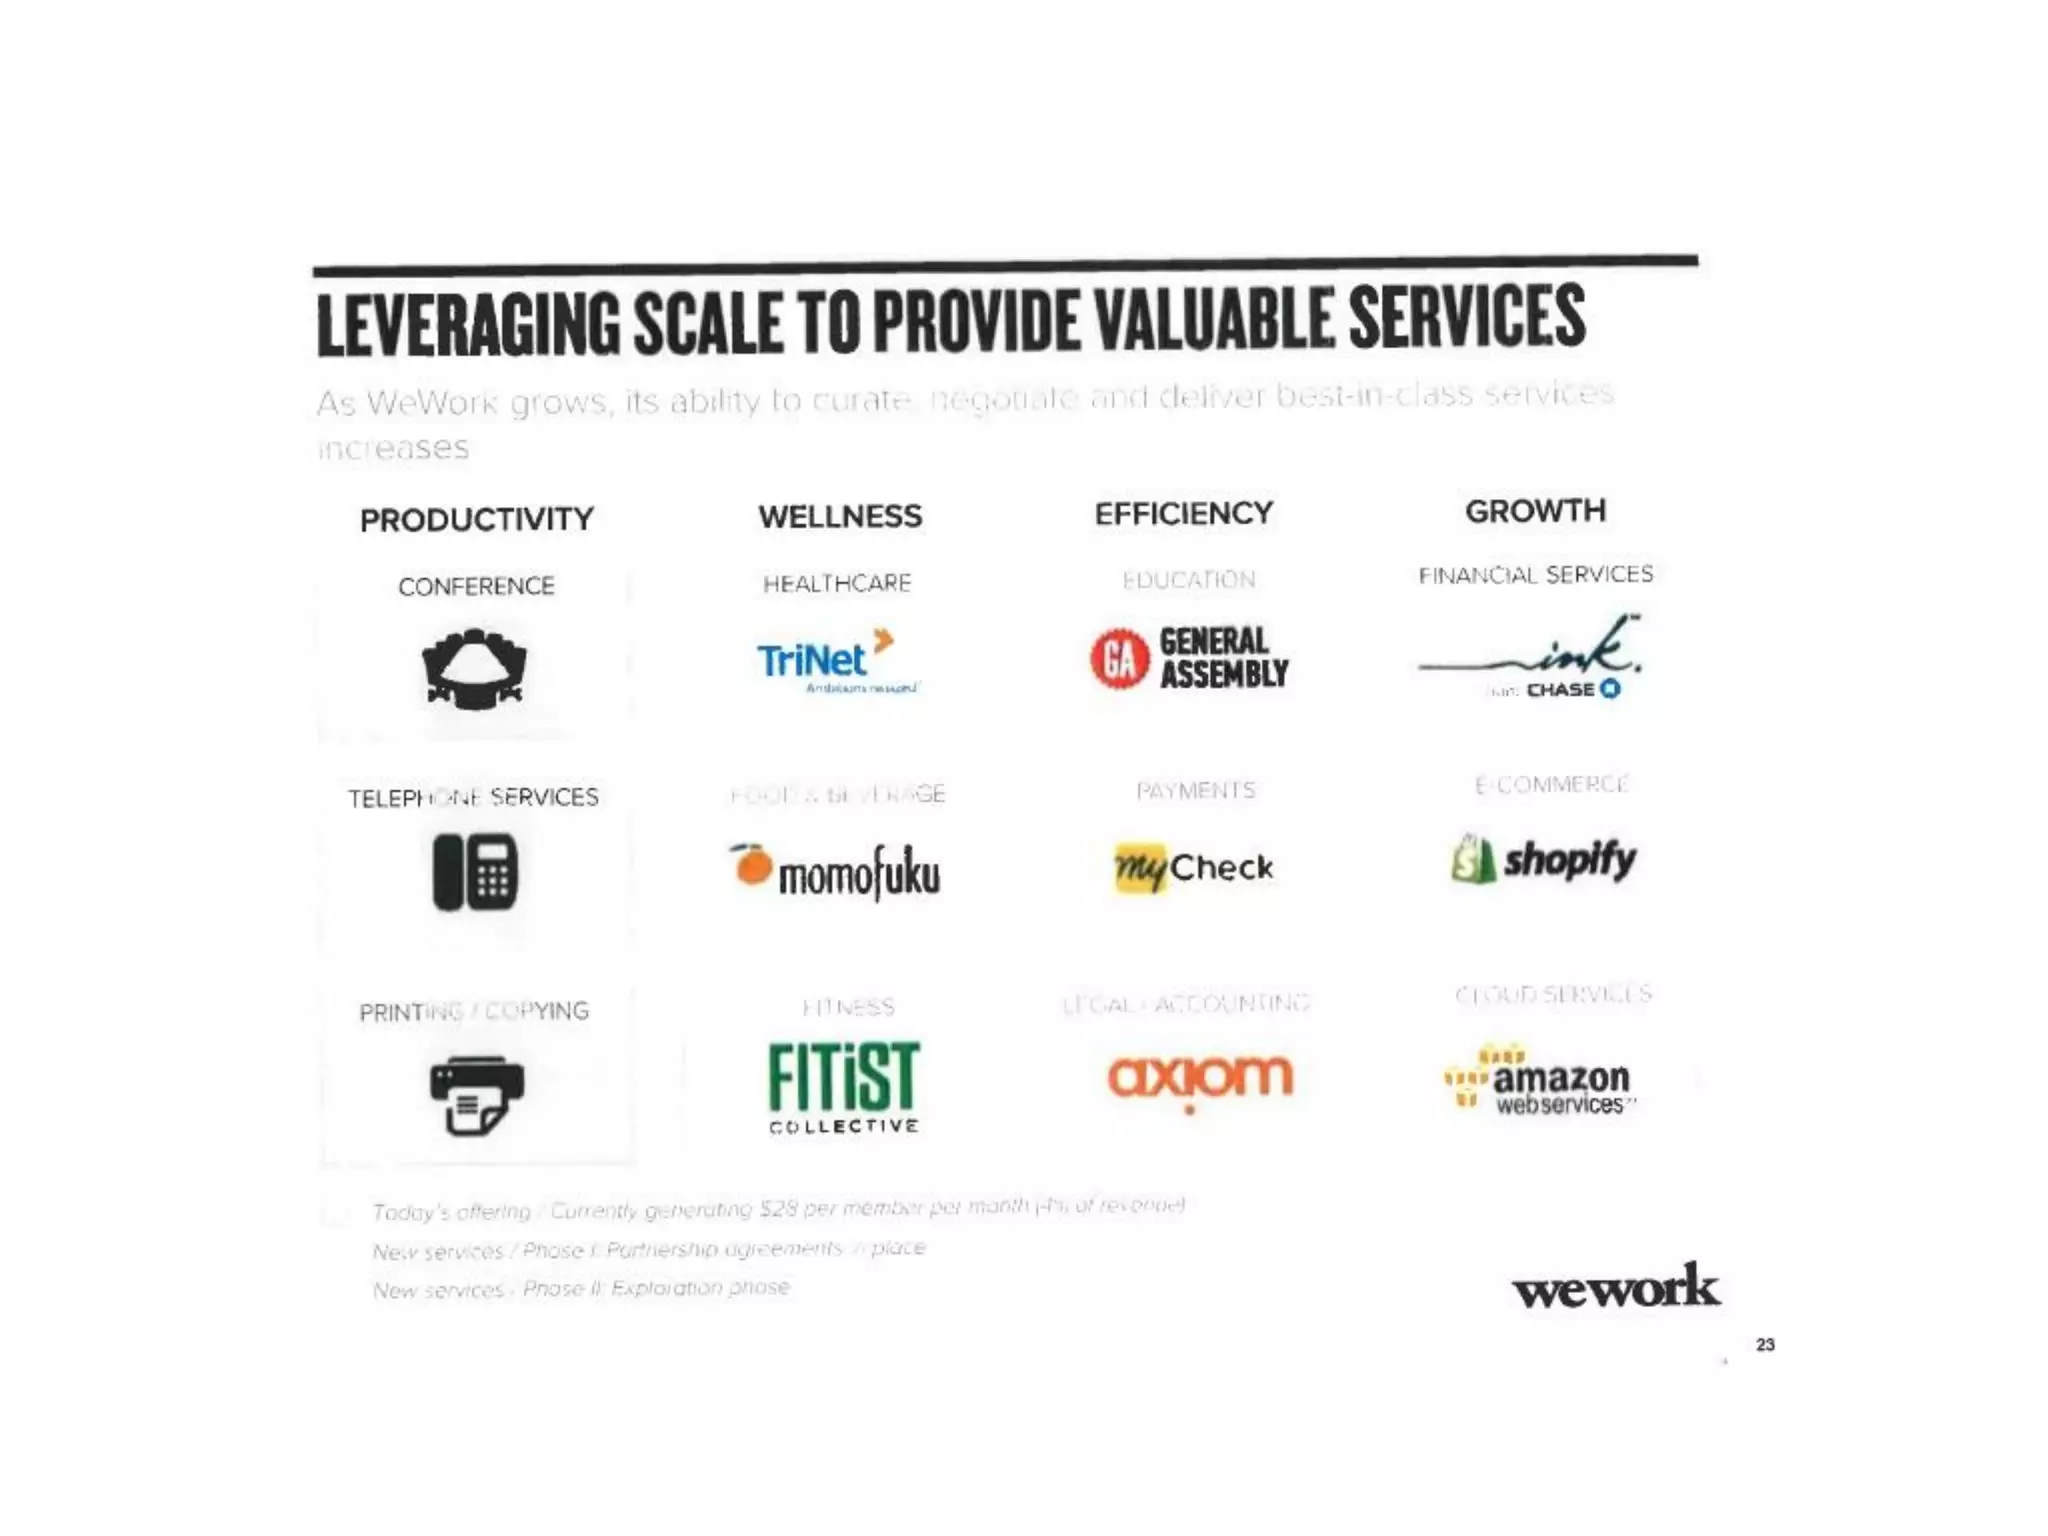
Slide 26 outlines how WeWork planned to layer services on top of membership — telephone, conference, printing today; partnerships (TriNet, GA, momofuku, etc.) and future services to increase revenue per member from $28 toward $75+ per month. The slide ties product expansion to revenue uplift and projects large service revenue outcomes tied to the member base ramp. It shows a clear product-led monetization pathway rather than relying solely on real estate appreciation.

For founders, this is a good template: show a roadmap of incremental monetization, a timeline for adoption and concrete partners who validate demand. Also demonstrate how much incremental margin each service contributes and how cross-selling scales. The danger is overestimating per-member take rates or assuming partner economics without signed agreements — make sure to show pilot results, contractual commitments or conservative uptake rates to strengthen the case.

Key Takeaway: Present a service expansion roadmap with partner validation and conservative uptake assumptions to credibly increase revenue per customer.

Conclusion: Key Lessons

WeWork’s Series D deck is a strong example of narrative-driven fundraising: it pairs a compelling brand and mission with growth metrics, unit economics and a monetization roadmap. The deck’s strengths are visual storytelling, early placement of traction metrics, and an articulated view of network effects and service expansion. These elements work together to create urgency and belief in a large, structural opportunity.

The cautionary lessons are equally important. Founders must temper ambition with transparent assumptions, granular unit economics and conservative scenarios. Bold projections and cultural narratives attract attention, but long-term credibility with investors requires disciplined disclosure (sensitivity analysis, pilot data, signed deals) and realistic timelines for pipeline conversion and capital intensity. Use emotion to open interest, but use rigorous, provable data to sustain it.

Full Deck Analysis

11 sections

Overview

Company: WeWork
Round: Series D ($335M)
Year: October 2014
Valuation: Implied $10B+ (based on growth projections)
Outcome: Failed IPO (2019), massive writedown, bankruptcy filing (2023)

This is a cautionary case study of a pitch deck that successfully raised massive capital ($335M Series D) while obscuring fundamental business model problems, unrealistic financial projections, and extreme operational risks. The deck exemplifies how sophisticated narrative construction can mask structural weaknesses.

Executive Summary

WeWork’s Series D pitch deck presents a compelling narrative of a “tech-enabled real estate platform” disrupting the commercial office market through a “Space as a Service” model, claiming 109% member CAGR, 41% unit EBITDA margins, and a path to $2.9B revenue by 2018. However, beneath the polished presentation lies a capital-intensive real estate arbitrage business with extreme landlord concentration (51% from single landlord), declining pricing power, weak community engagement (45% app adoption), and unrealistic financial projections that assume 38x revenue growth, multiple simultaneous business successes, and margin expansion contradicted by historical data. The deck is designed to position WeWork as a defensible tech company when it is fundamentally a real estate company dependent on landlord capital, vulnerable to economic cycles, and led by an inexperienced first-time CEO attempting to execute three separate businesses (WeWork, WeLive, WeWork Everywhere) simultaneously.

Problem Statement

How the deck articulates the problem (Slides 4-6):

The deck frames the problem as a massive market opportunity rather than a customer pain point:

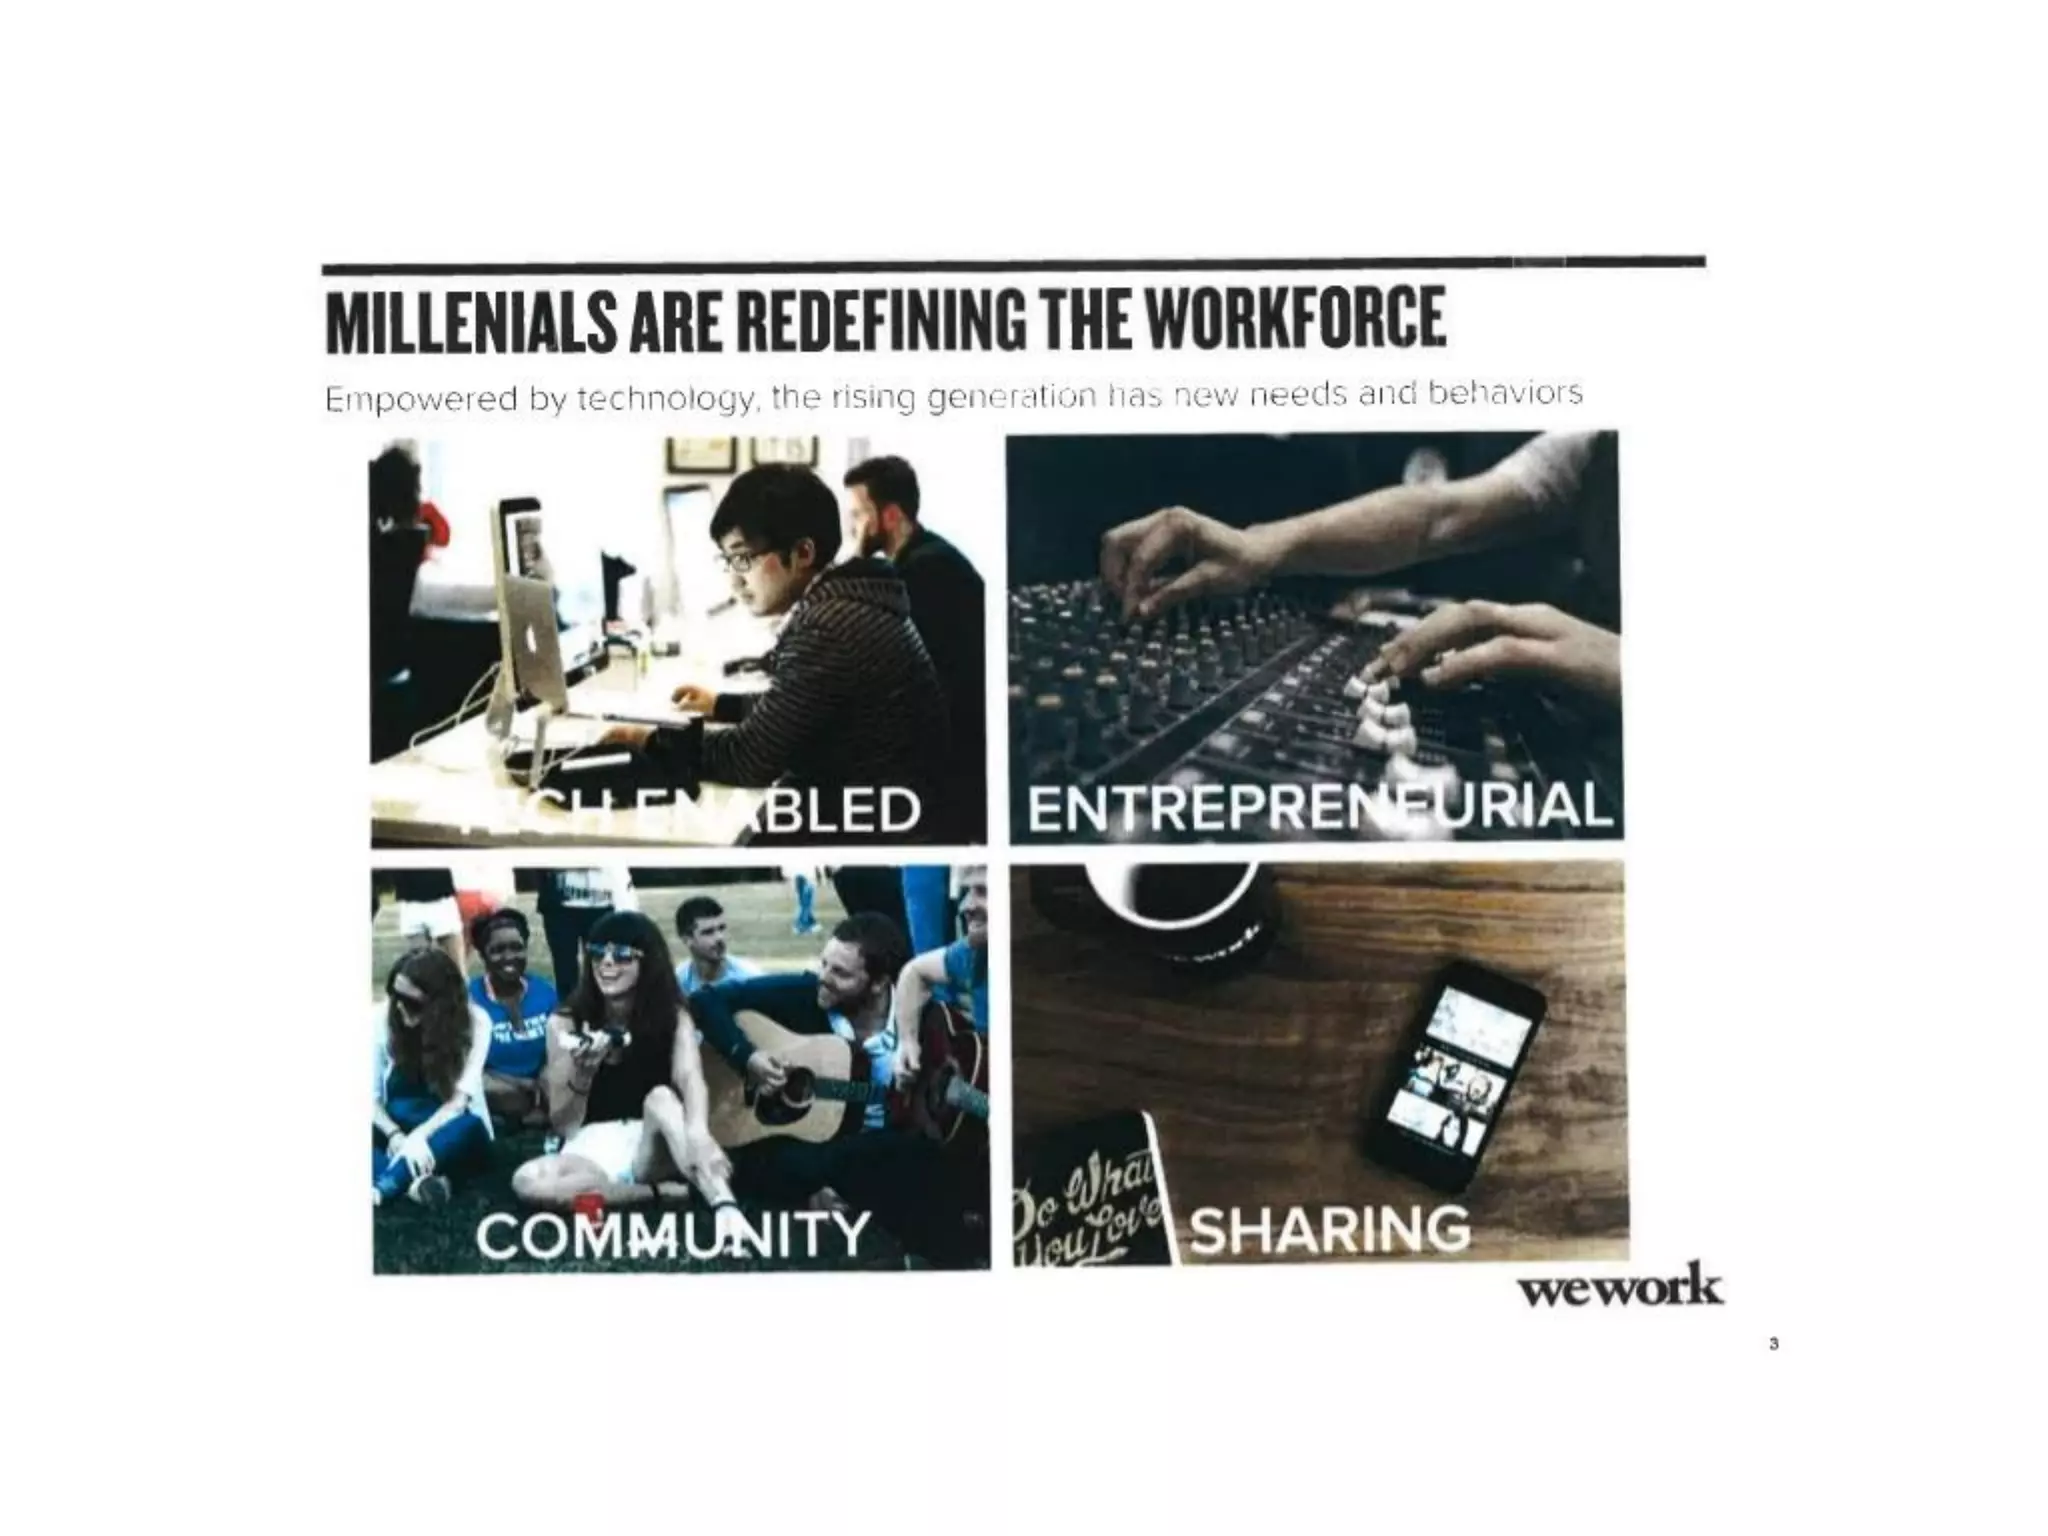
  • Slide 4: “Millennials Are Redefining the Workforce” - emphasizes demographic shift toward flexible work, with 63% of members under age 35
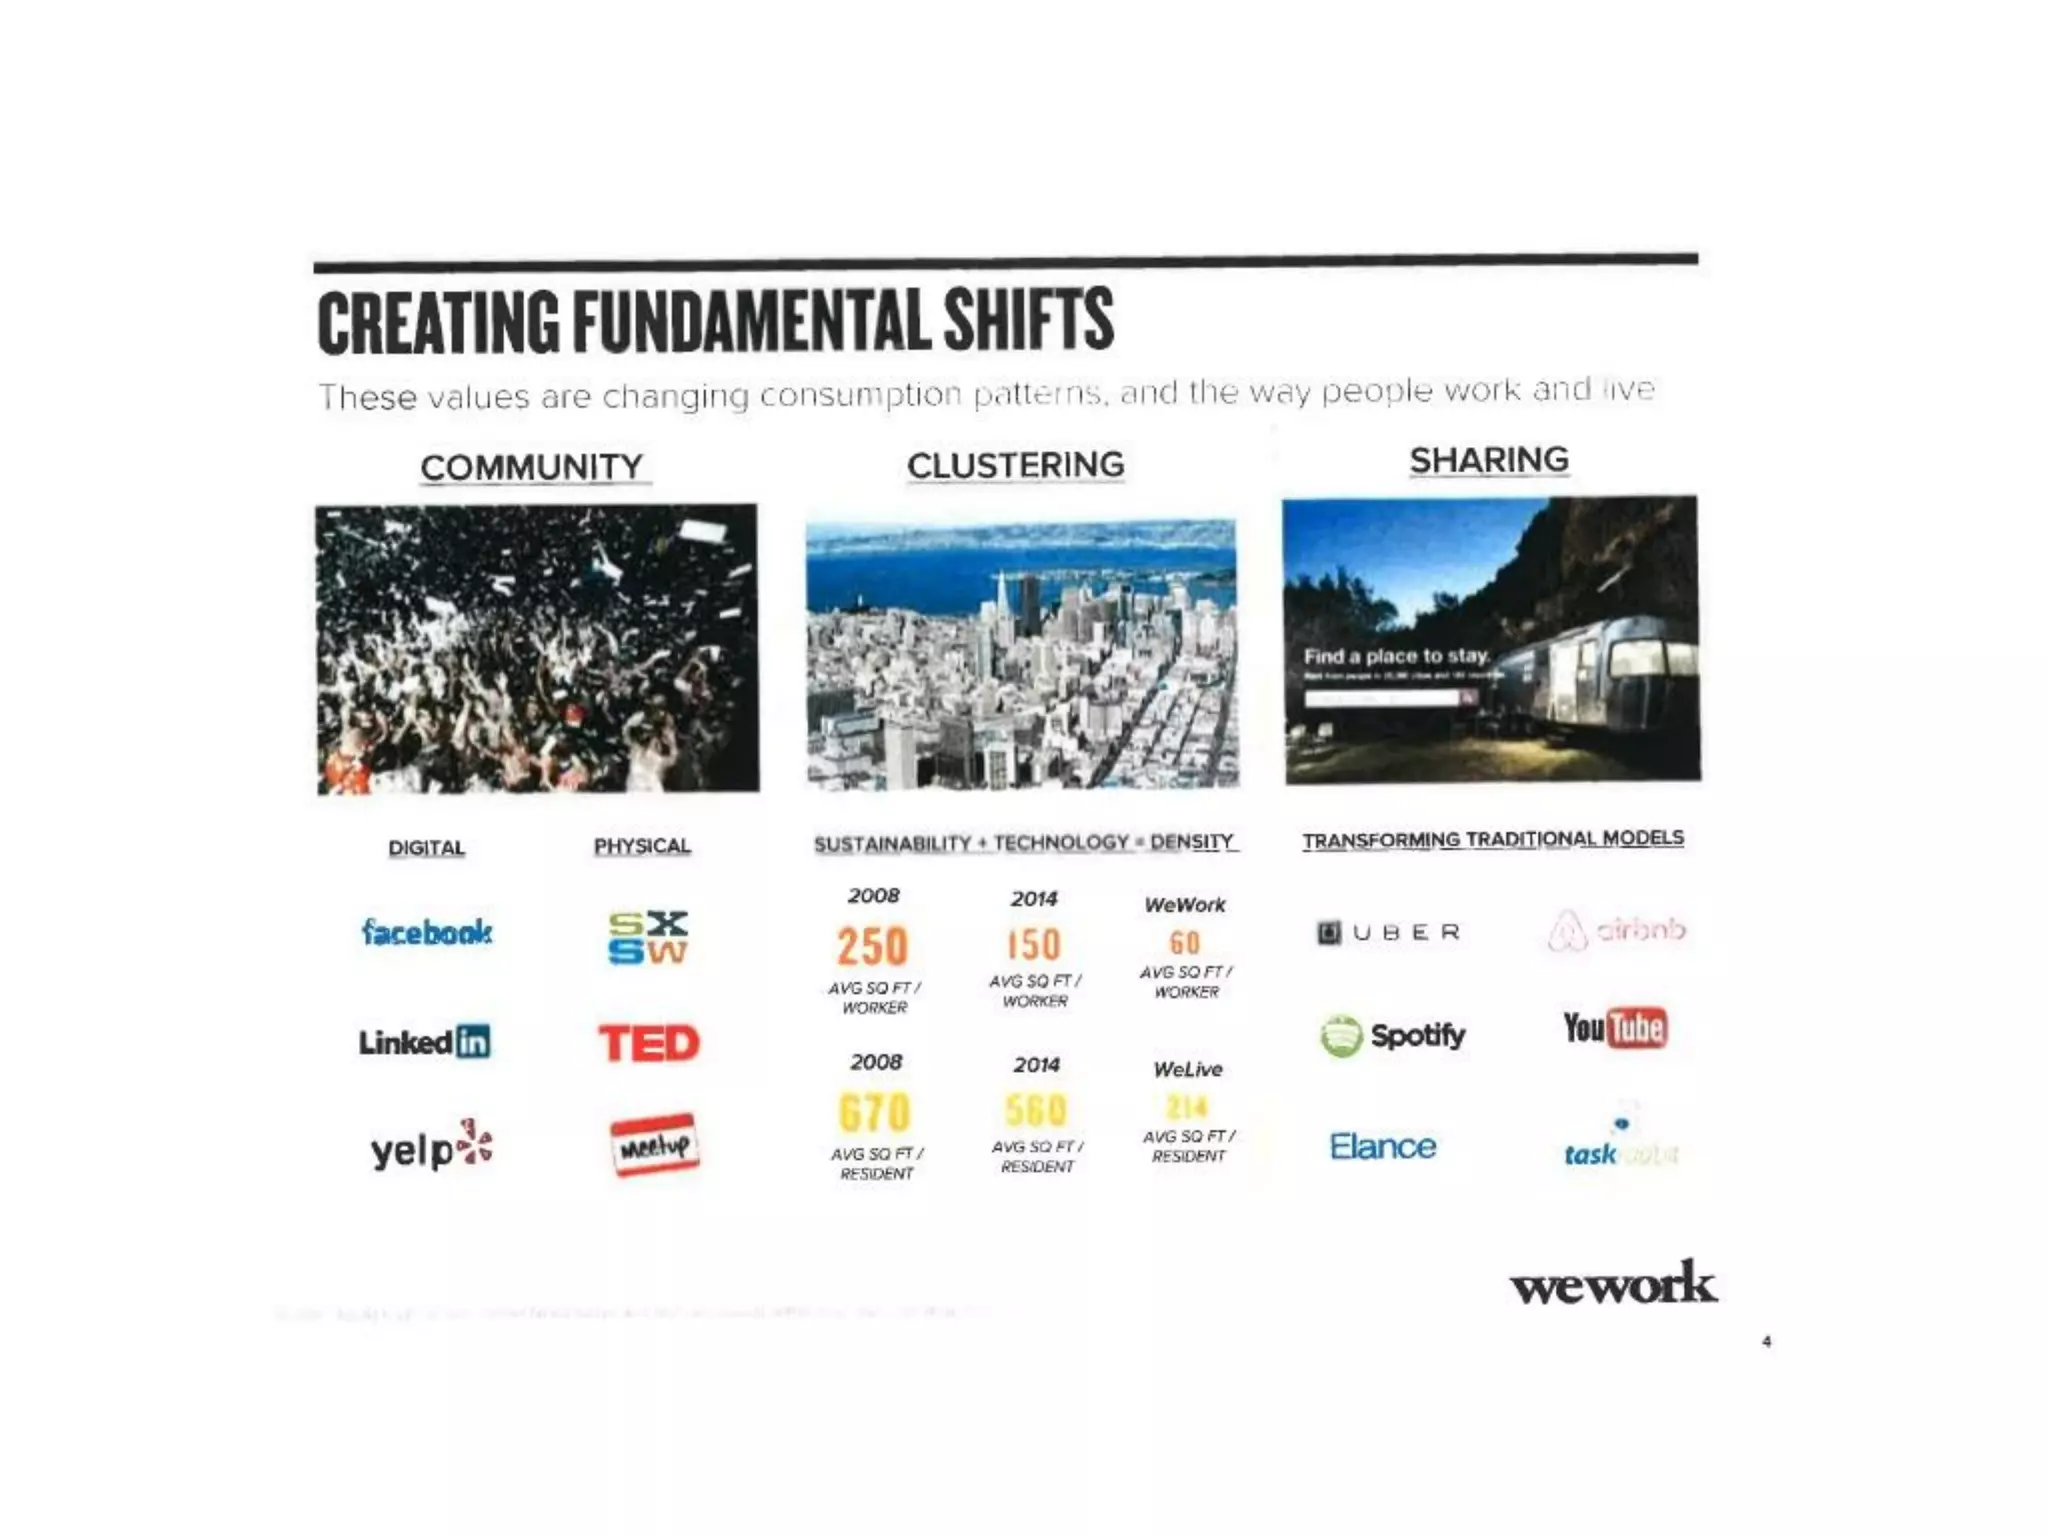
  • Slide 5: “Creating Fundamental Shifts” - positions shared economy and urbanization as macro trends
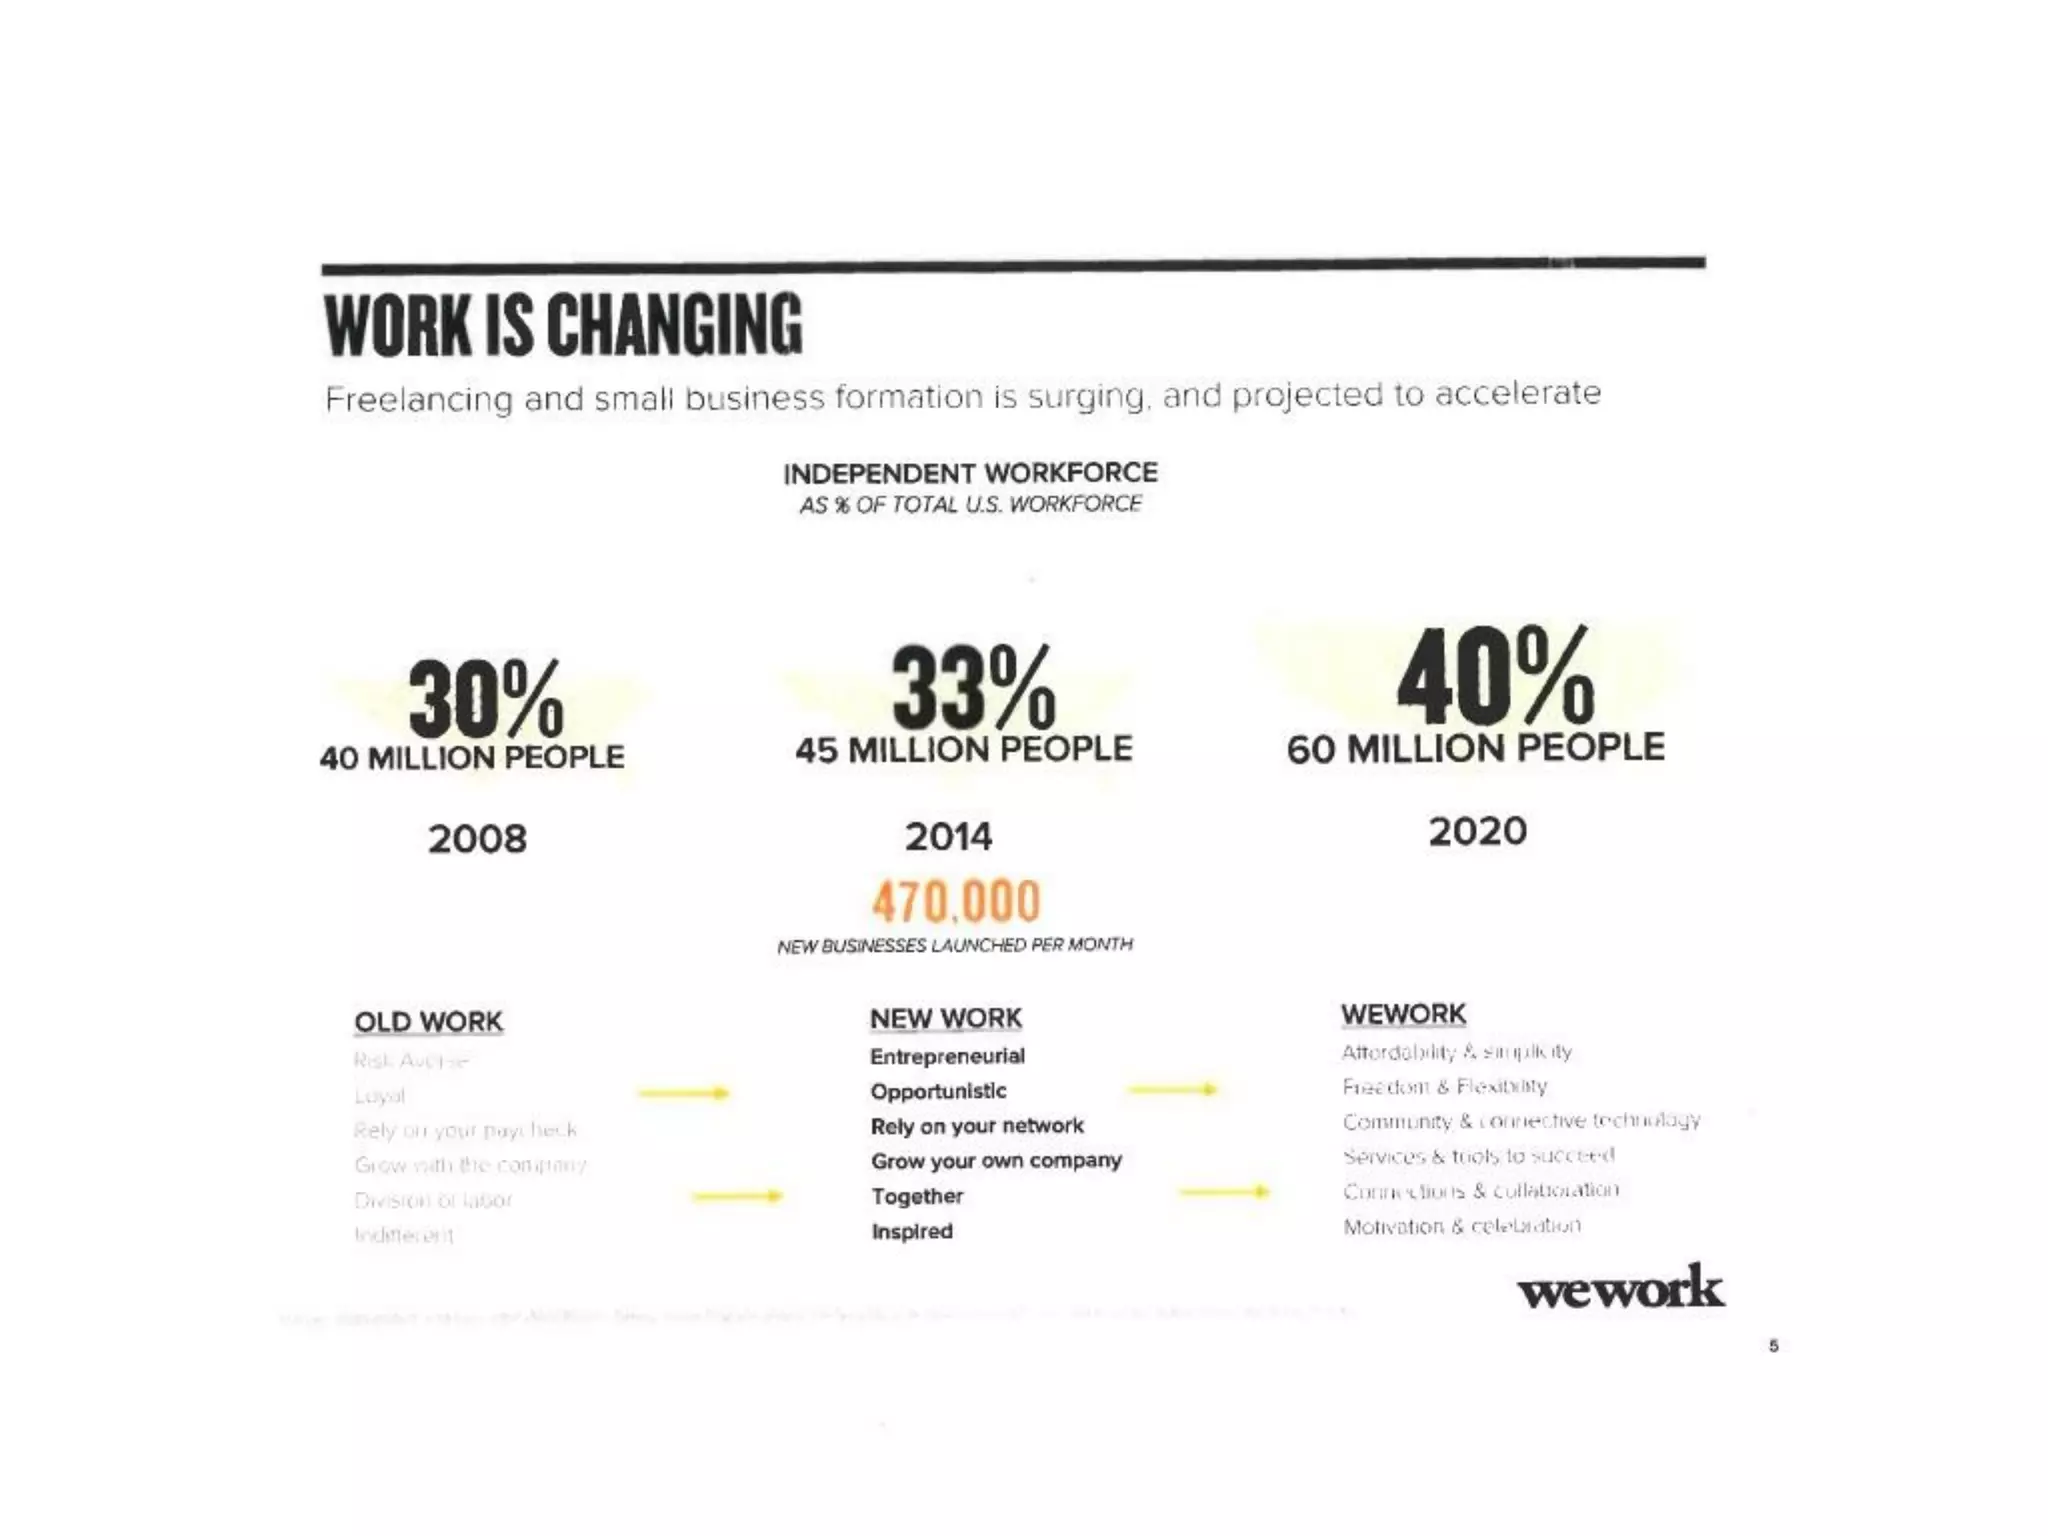
  • Slide 6: “Work Is Changing” - claims 40% of U.S. workforce will be independent by 2020 (60M people), with 470,000 new businesses launched per month

The actual problem being solved:

  • Traditional office leases require 3-5 year commitments with high upfront costs
  • Freelancers and small startups need flexible, short-term workspace
  • Independent workers lack community and professional services

Critical gap: The deck never addresses whether customers actually want the “community” and “services” that WeWork emphasizes, or if they simply want cheap, flexible desk space.

Solution

How the deck positions the solution (Slides 3, 7, 27):

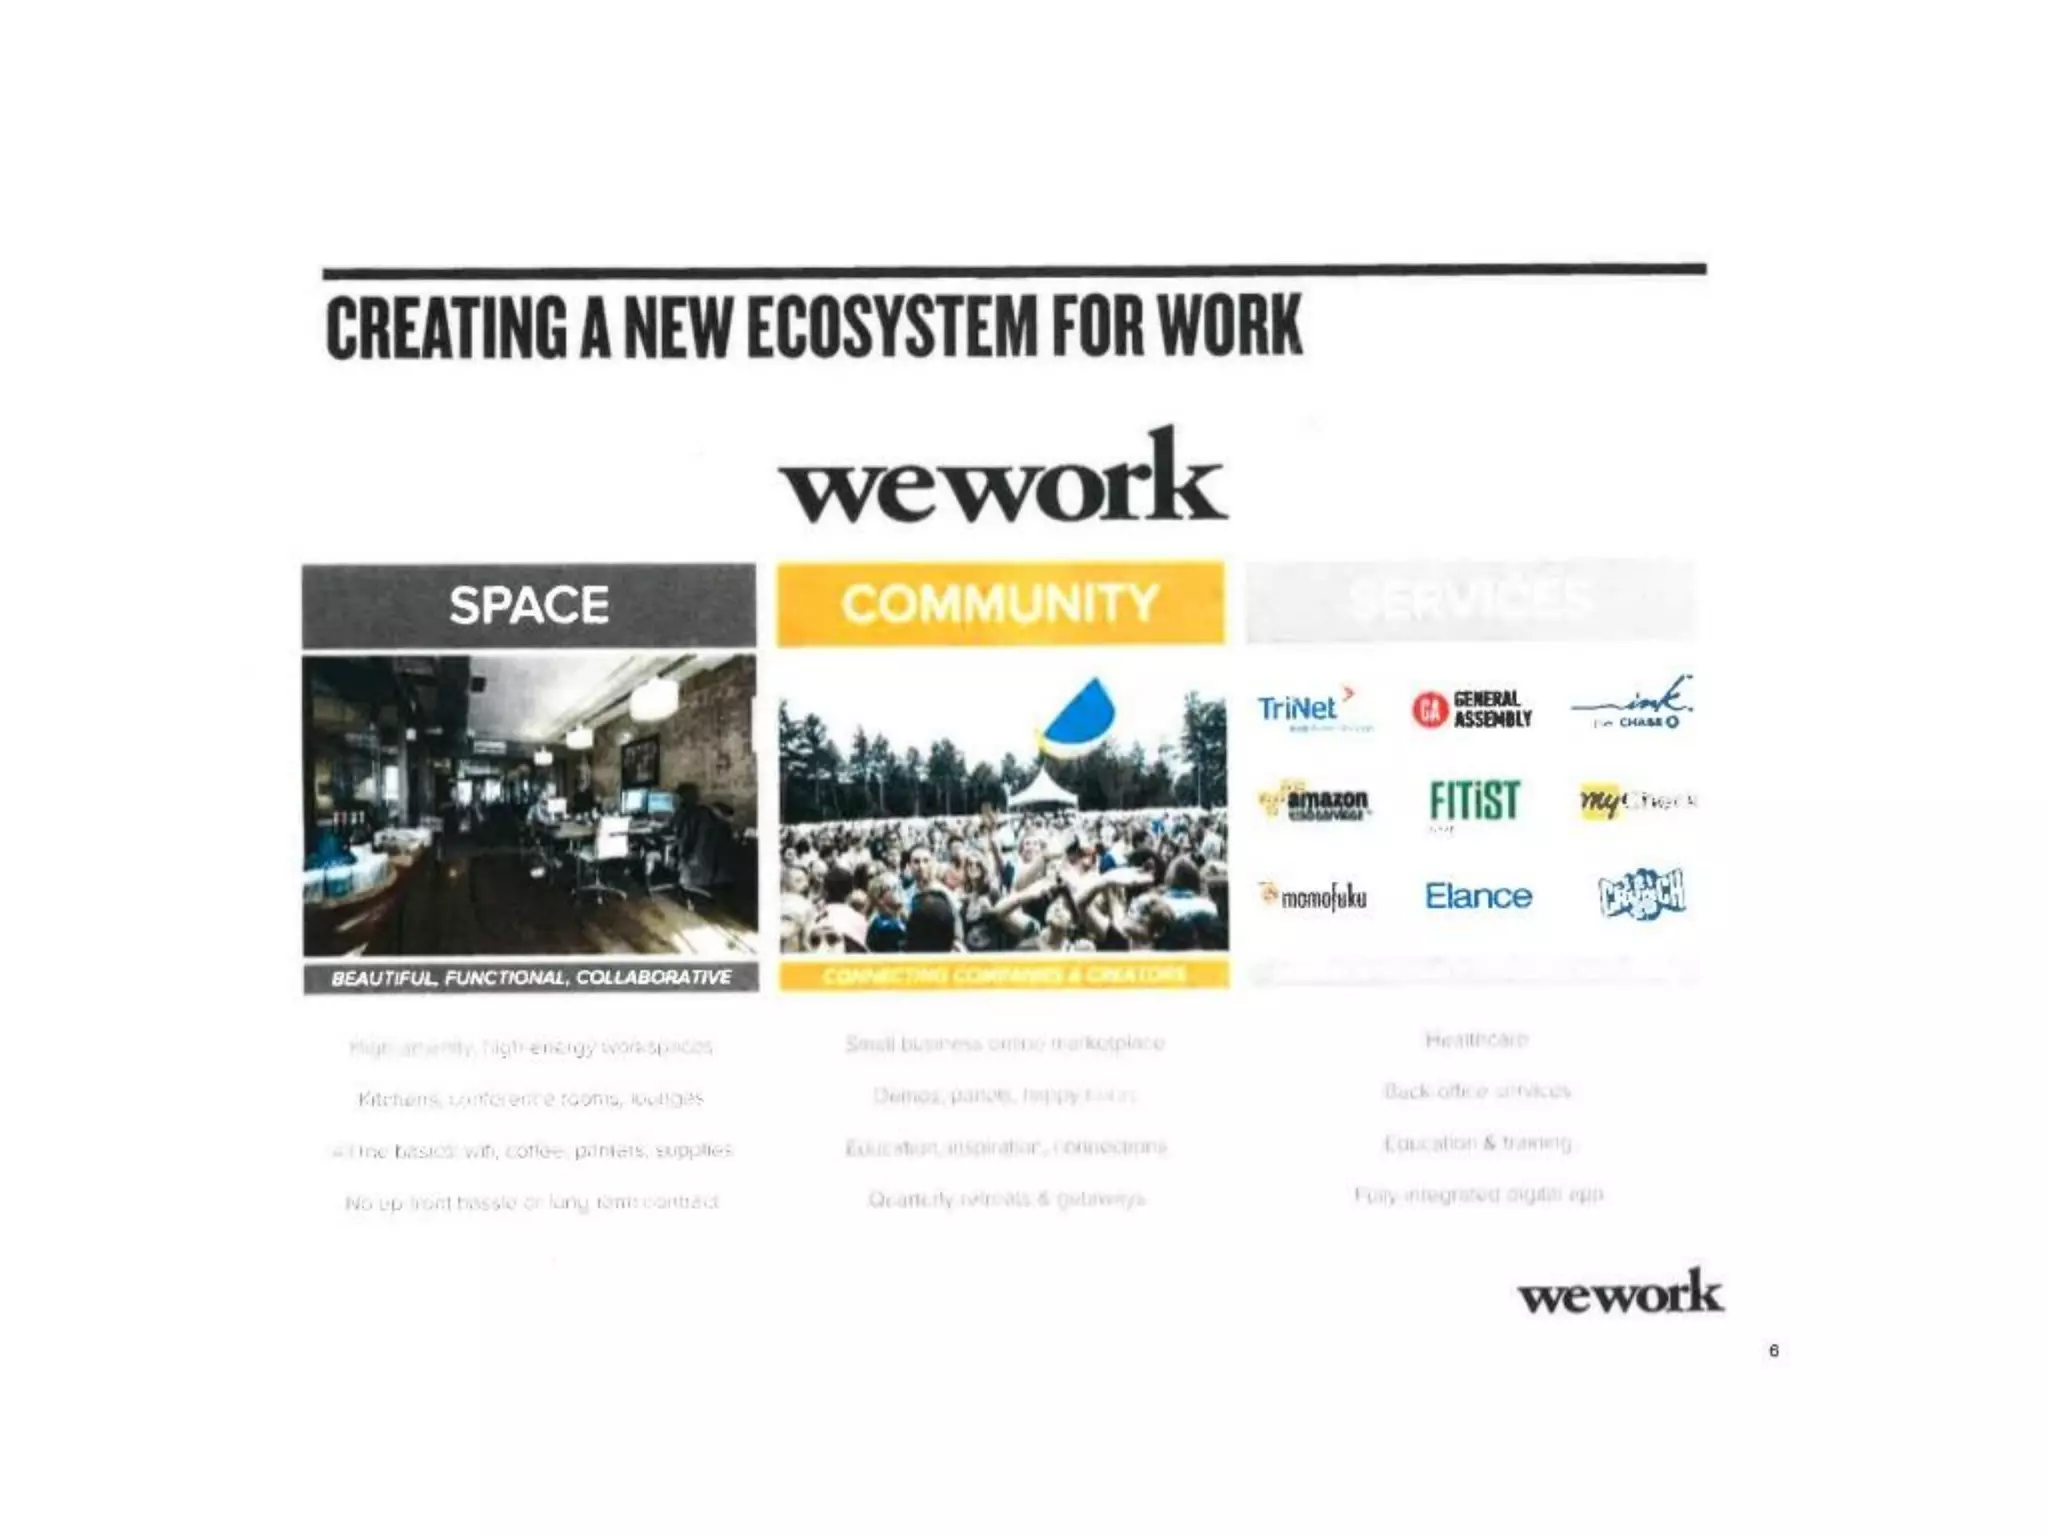
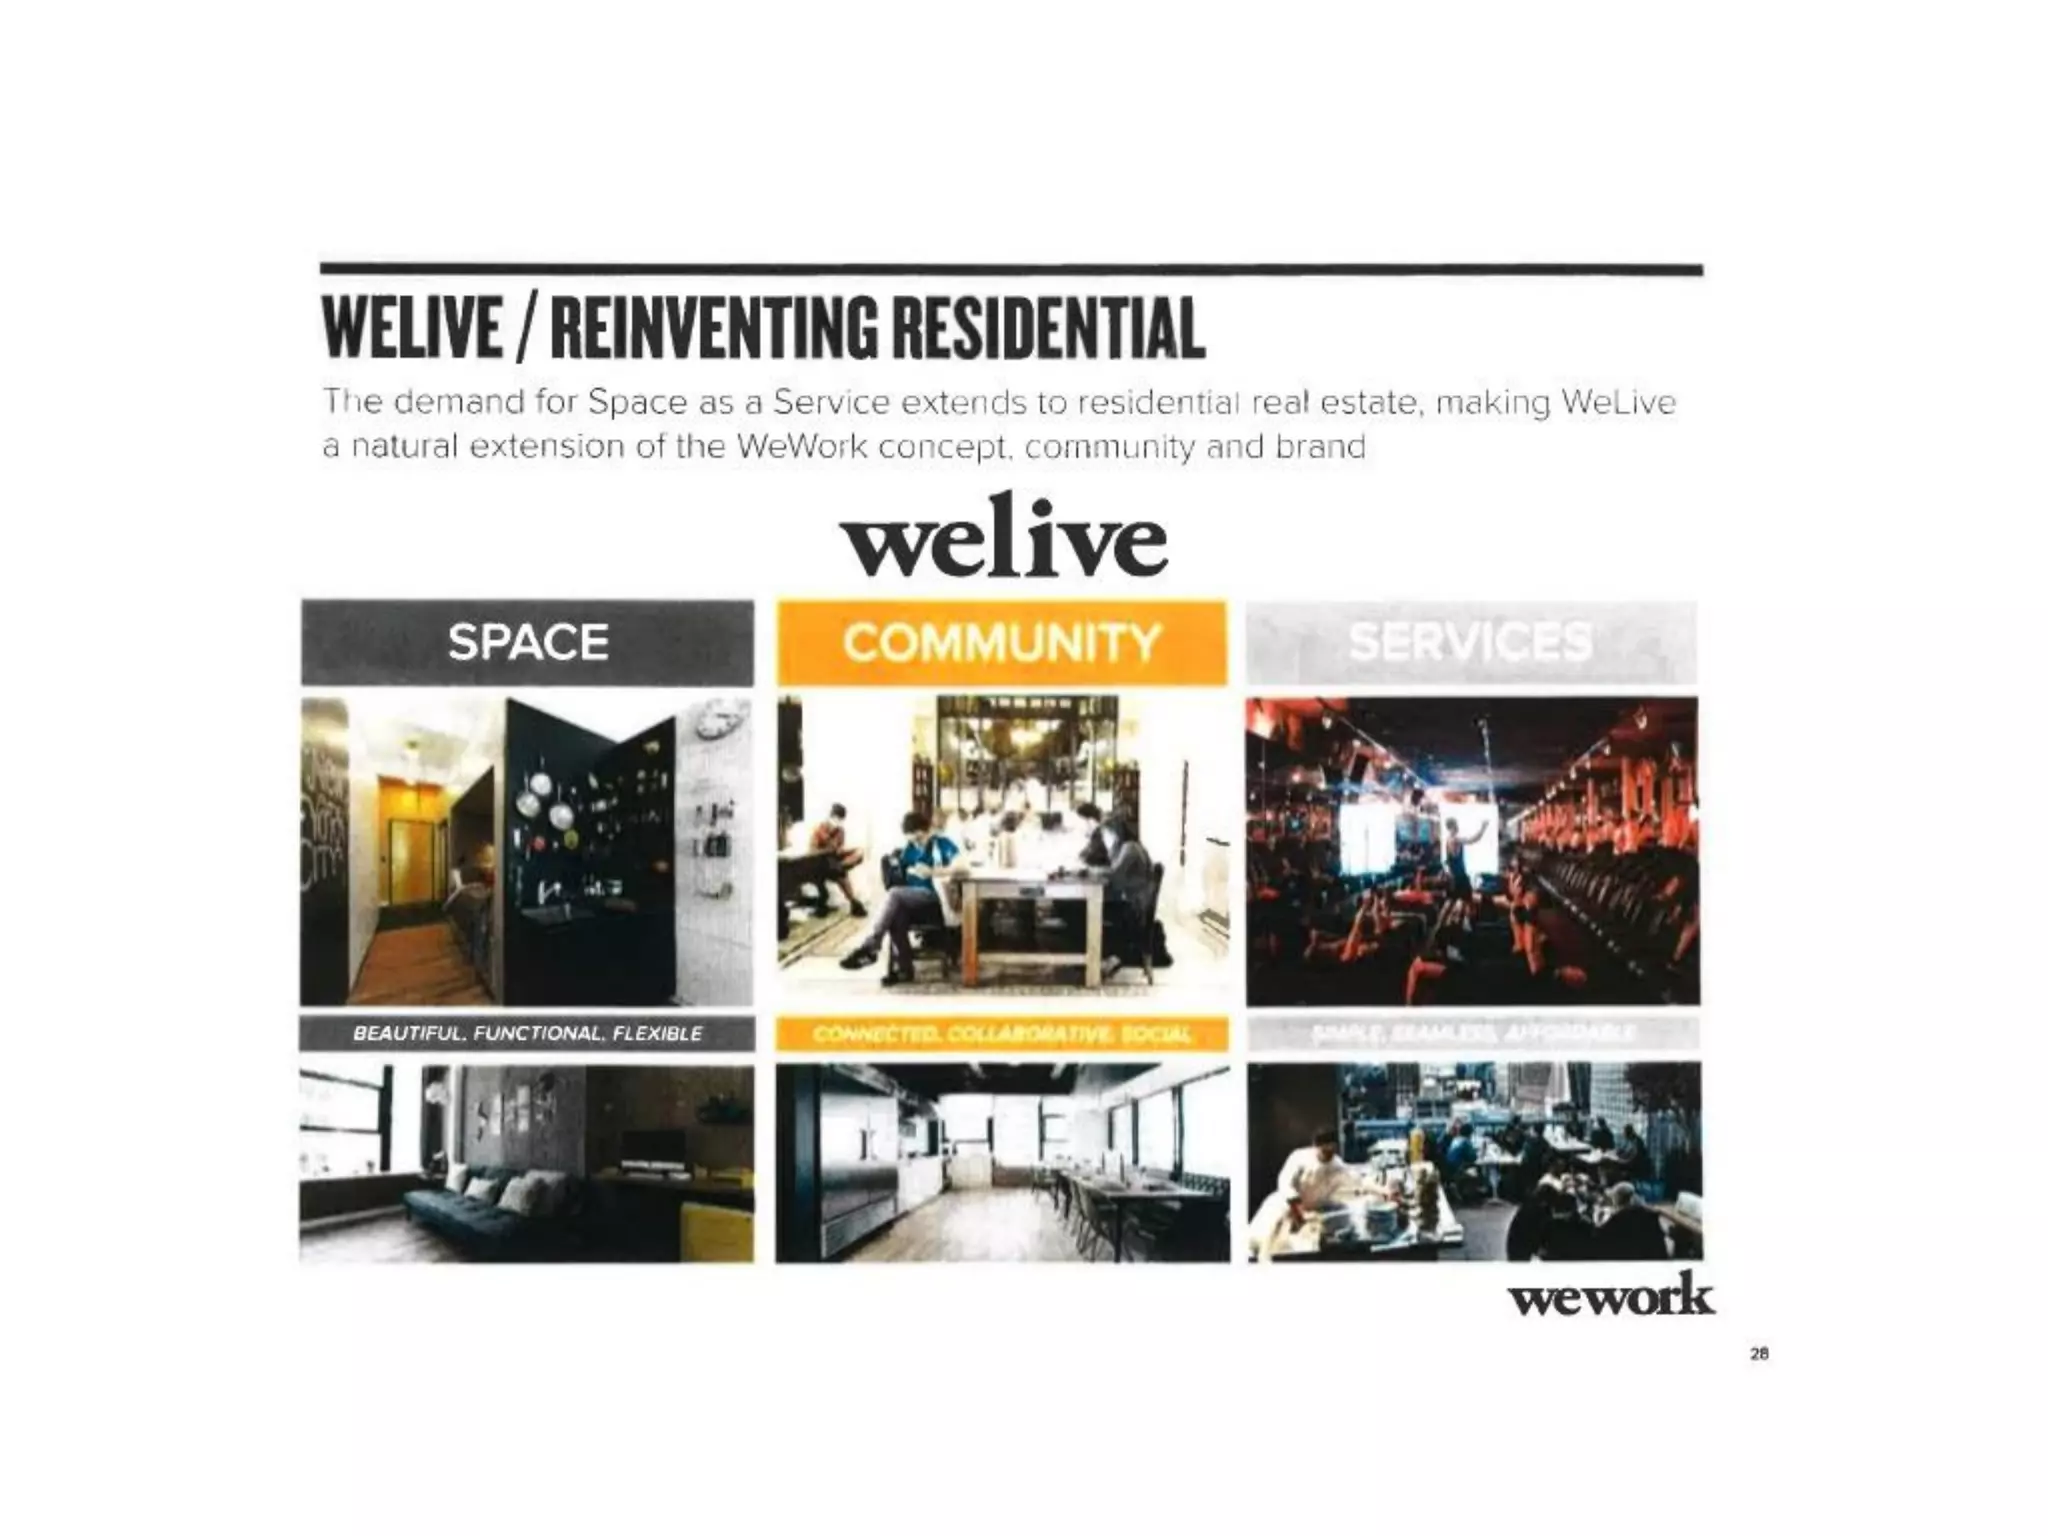
WeWork positions itself as “Space as a Service” - a platform combining three elements:

1. SPACE (Core Product)

  • Beautiful, functional, flexible office spaces
  • Month-to-month leases (vs. 3-5 year traditional leases)
  • All-inclusive pricing (utilities, WiFi, furniture, cleaning)
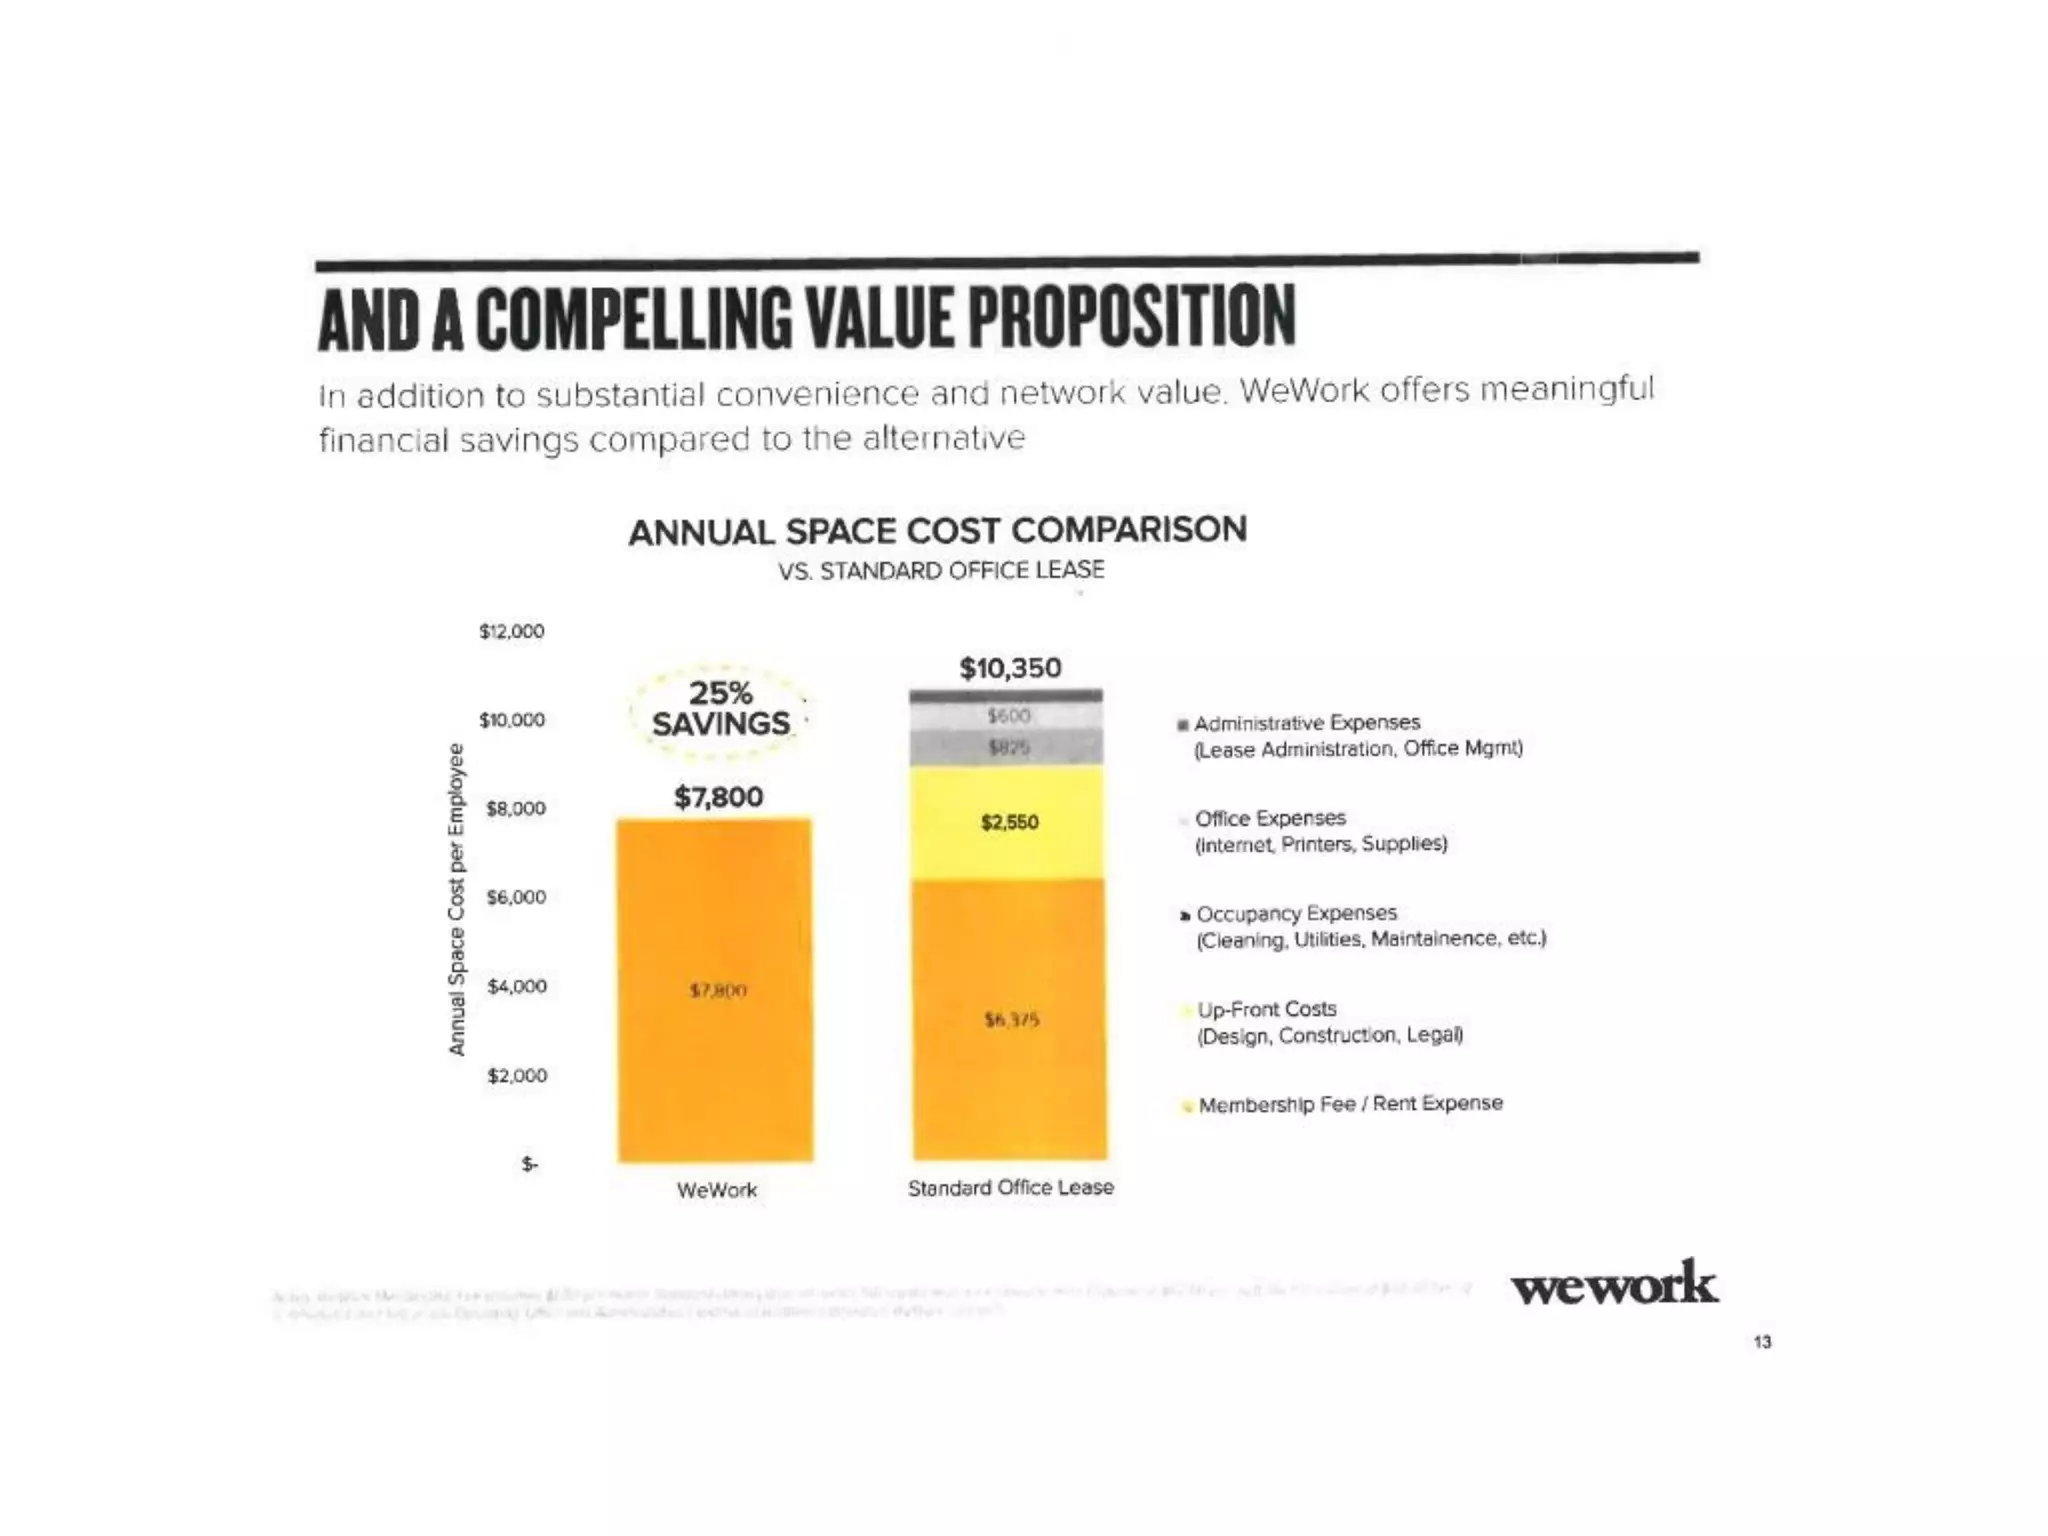
  • Claimed cost advantage: 25% cheaper than traditional office lease ($7,800/year vs. $10,350)

2. COMMUNITY (Ecosystem Layer)

  • Member networking and collaboration
  • Quarterly events and gatherings
  • “WeWork effect” - claimed network effects driving demand
  • Messaging platform connecting members
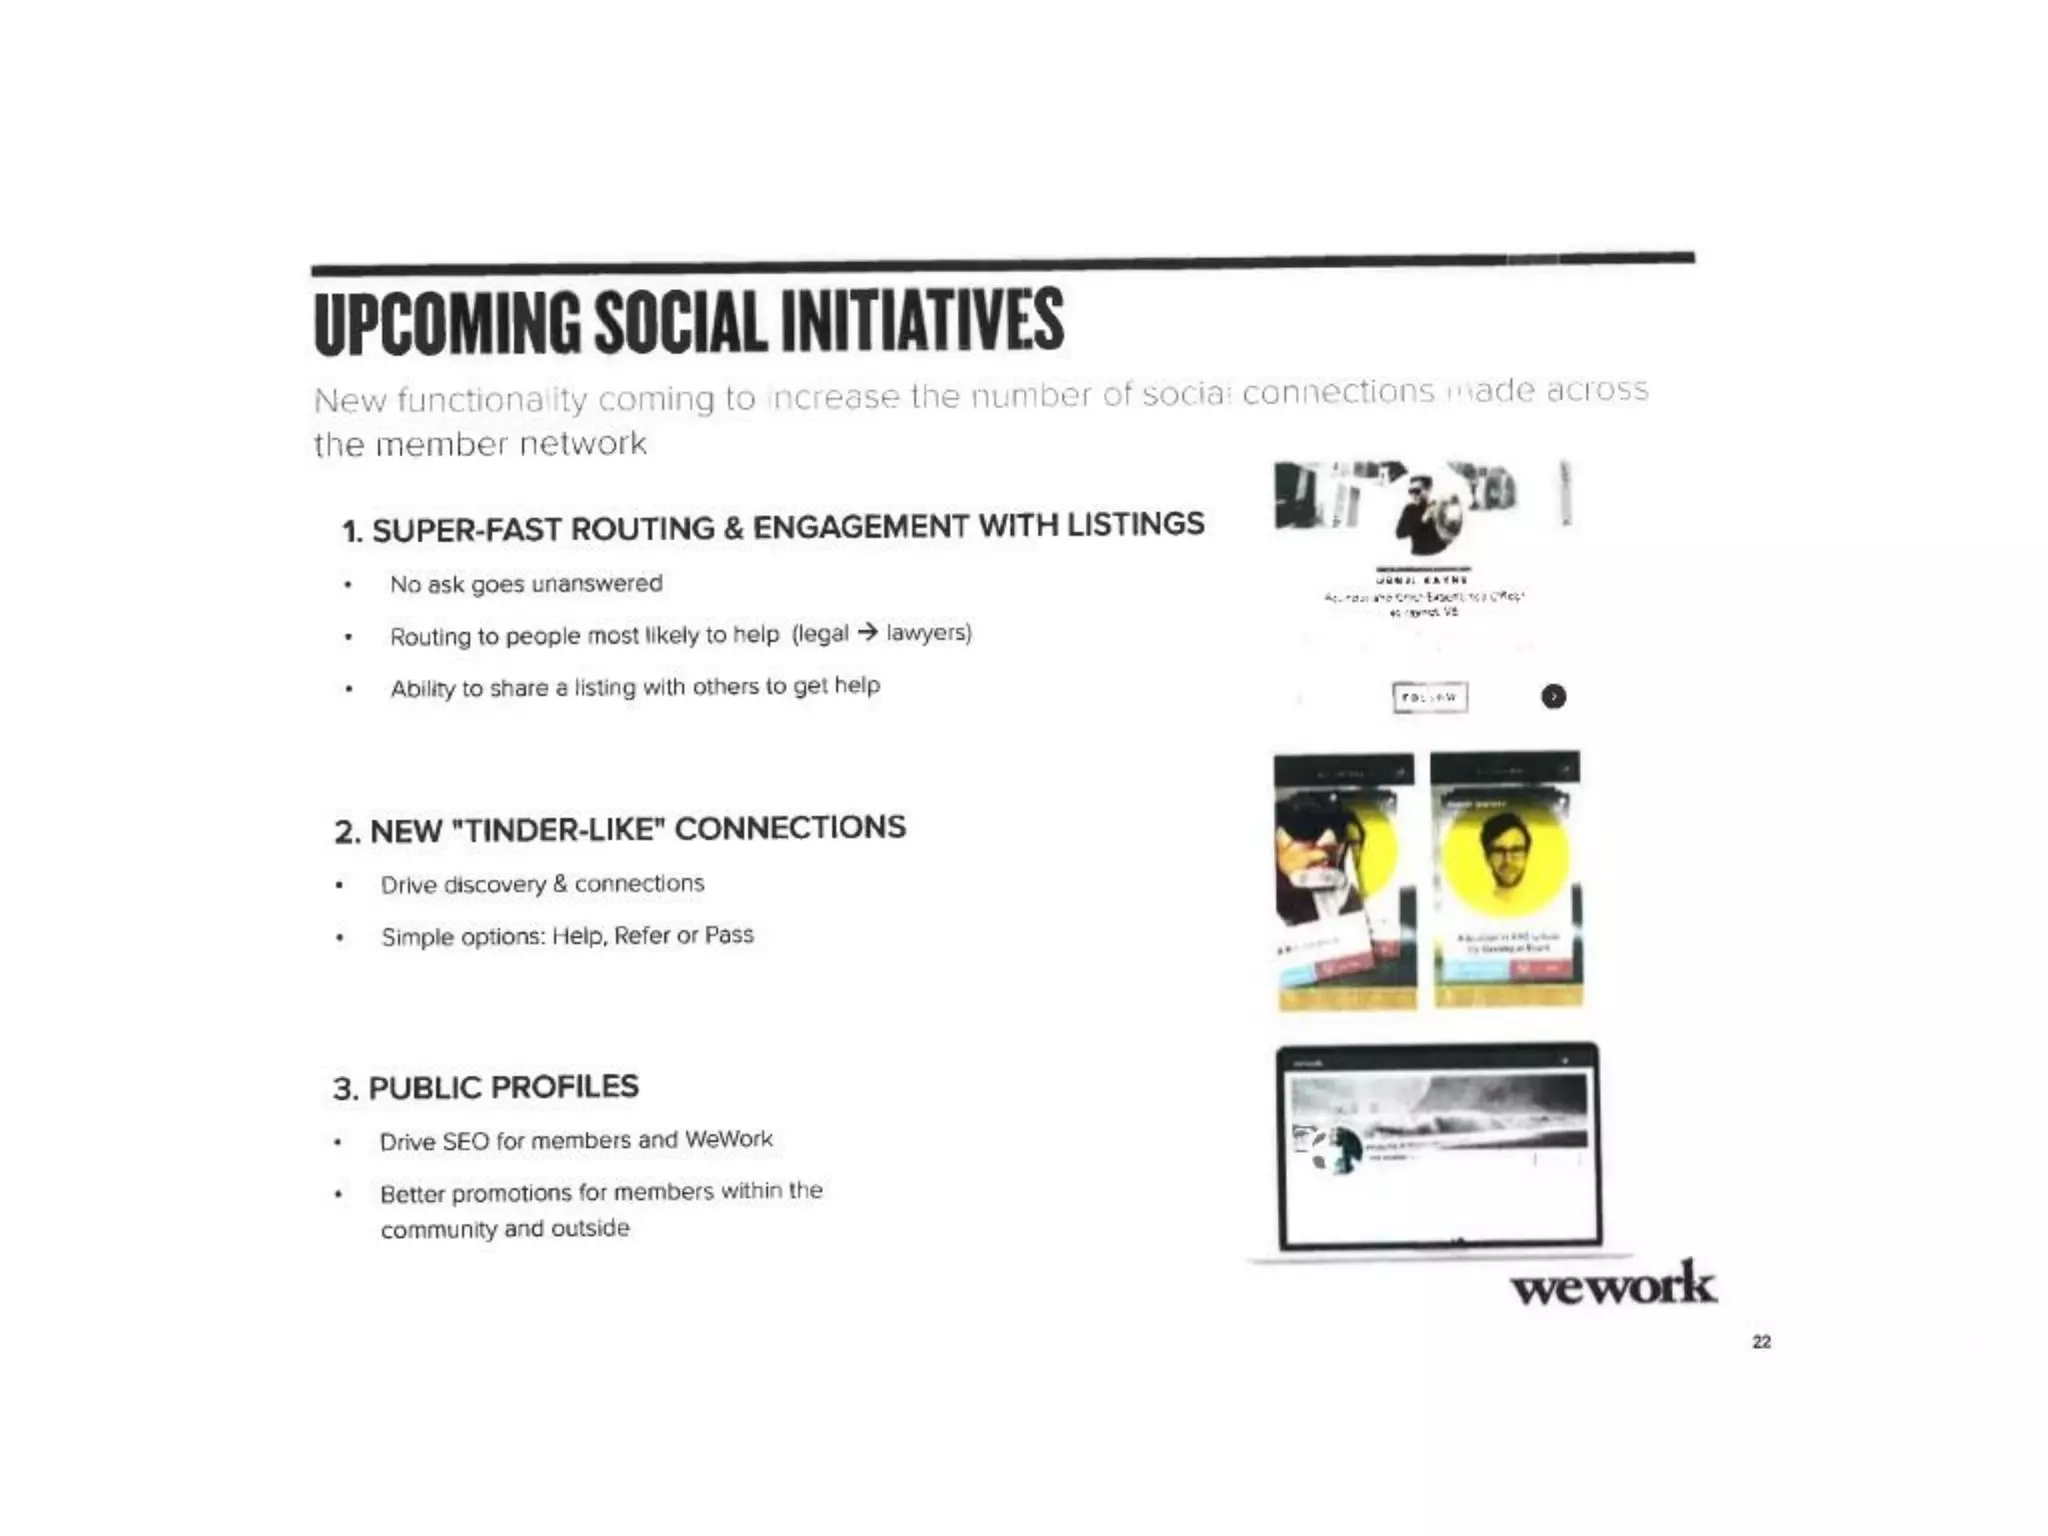
  • “Tinder-like” connection features (Slide 23)

3. SERVICES (Monetization Layer)

  • Curated partnerships (TriNet healthcare, General Assembly education, Shopify e-commerce, etc.)
  • Services revenue: $28/month per member (2014), projected to grow to $75-100/month by 2018
  • Claimed to drive member retention and increase LTV

The positioning problem: The deck conflates three fundamentally different value propositions:

  • Space is a commodity (easily replicated)
  • Community is weak (only 45% of members use app, only 39% are repeat users)
  • Services are negligible (4.6% of revenue, flat growth for 4 years)

Market Opportunity

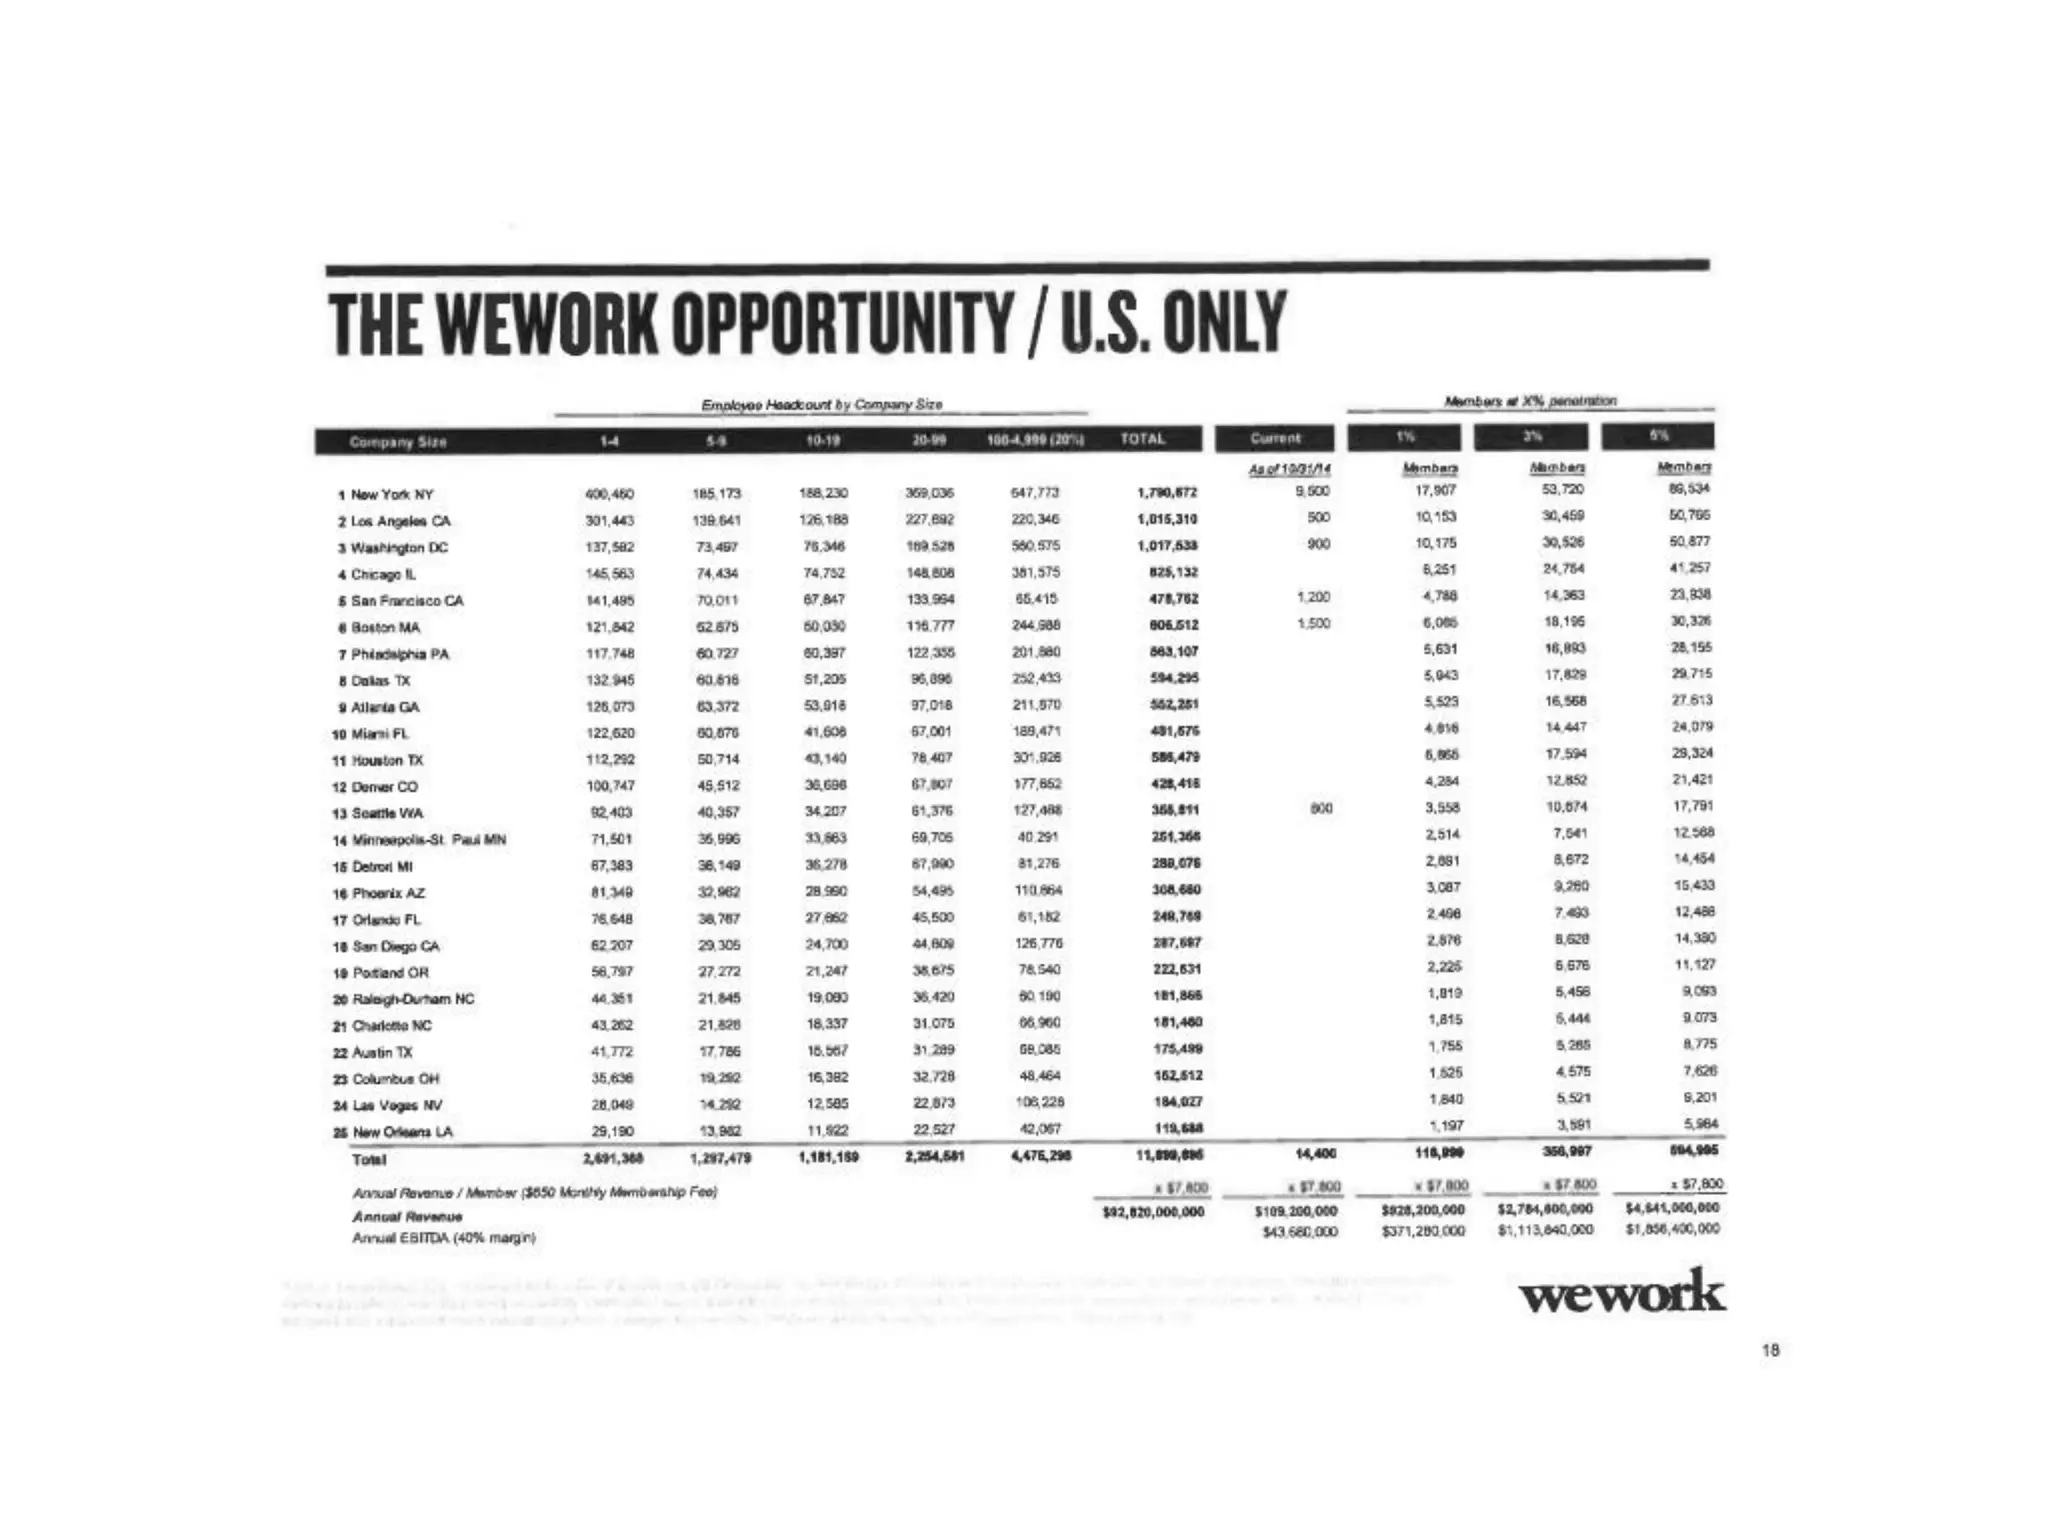
TAM Analysis (Slides 19, 33):

WeWork Opportunity (Slide 19)

  • Total Addressable Market: 14.6M U.S. employees (all company sizes)
  • Serviceable Addressable Market: ~2.5M independent workers and small business employees
  • Penetration scenarios:
    • 1% penetration: 146,000 members → $927.8M revenue
    • 3% penetration: 439,800 members → $2.8B revenue
    • 5% penetration: 730,000 members → $4.4B revenue
  • Current penetration (Oct 2014): 15,000 members = 0.1% of claimed TAM

Critical TAM problems:

  • Slide 19 includes ALL employees (14.6M), not just those who would use coworking
  • Actual addressable market is likely 2-3M (not 14.6M)
  • Assumes 5% penetration is achievable (unrealistic for commodity product)
  • No discussion of market saturation or competitive response

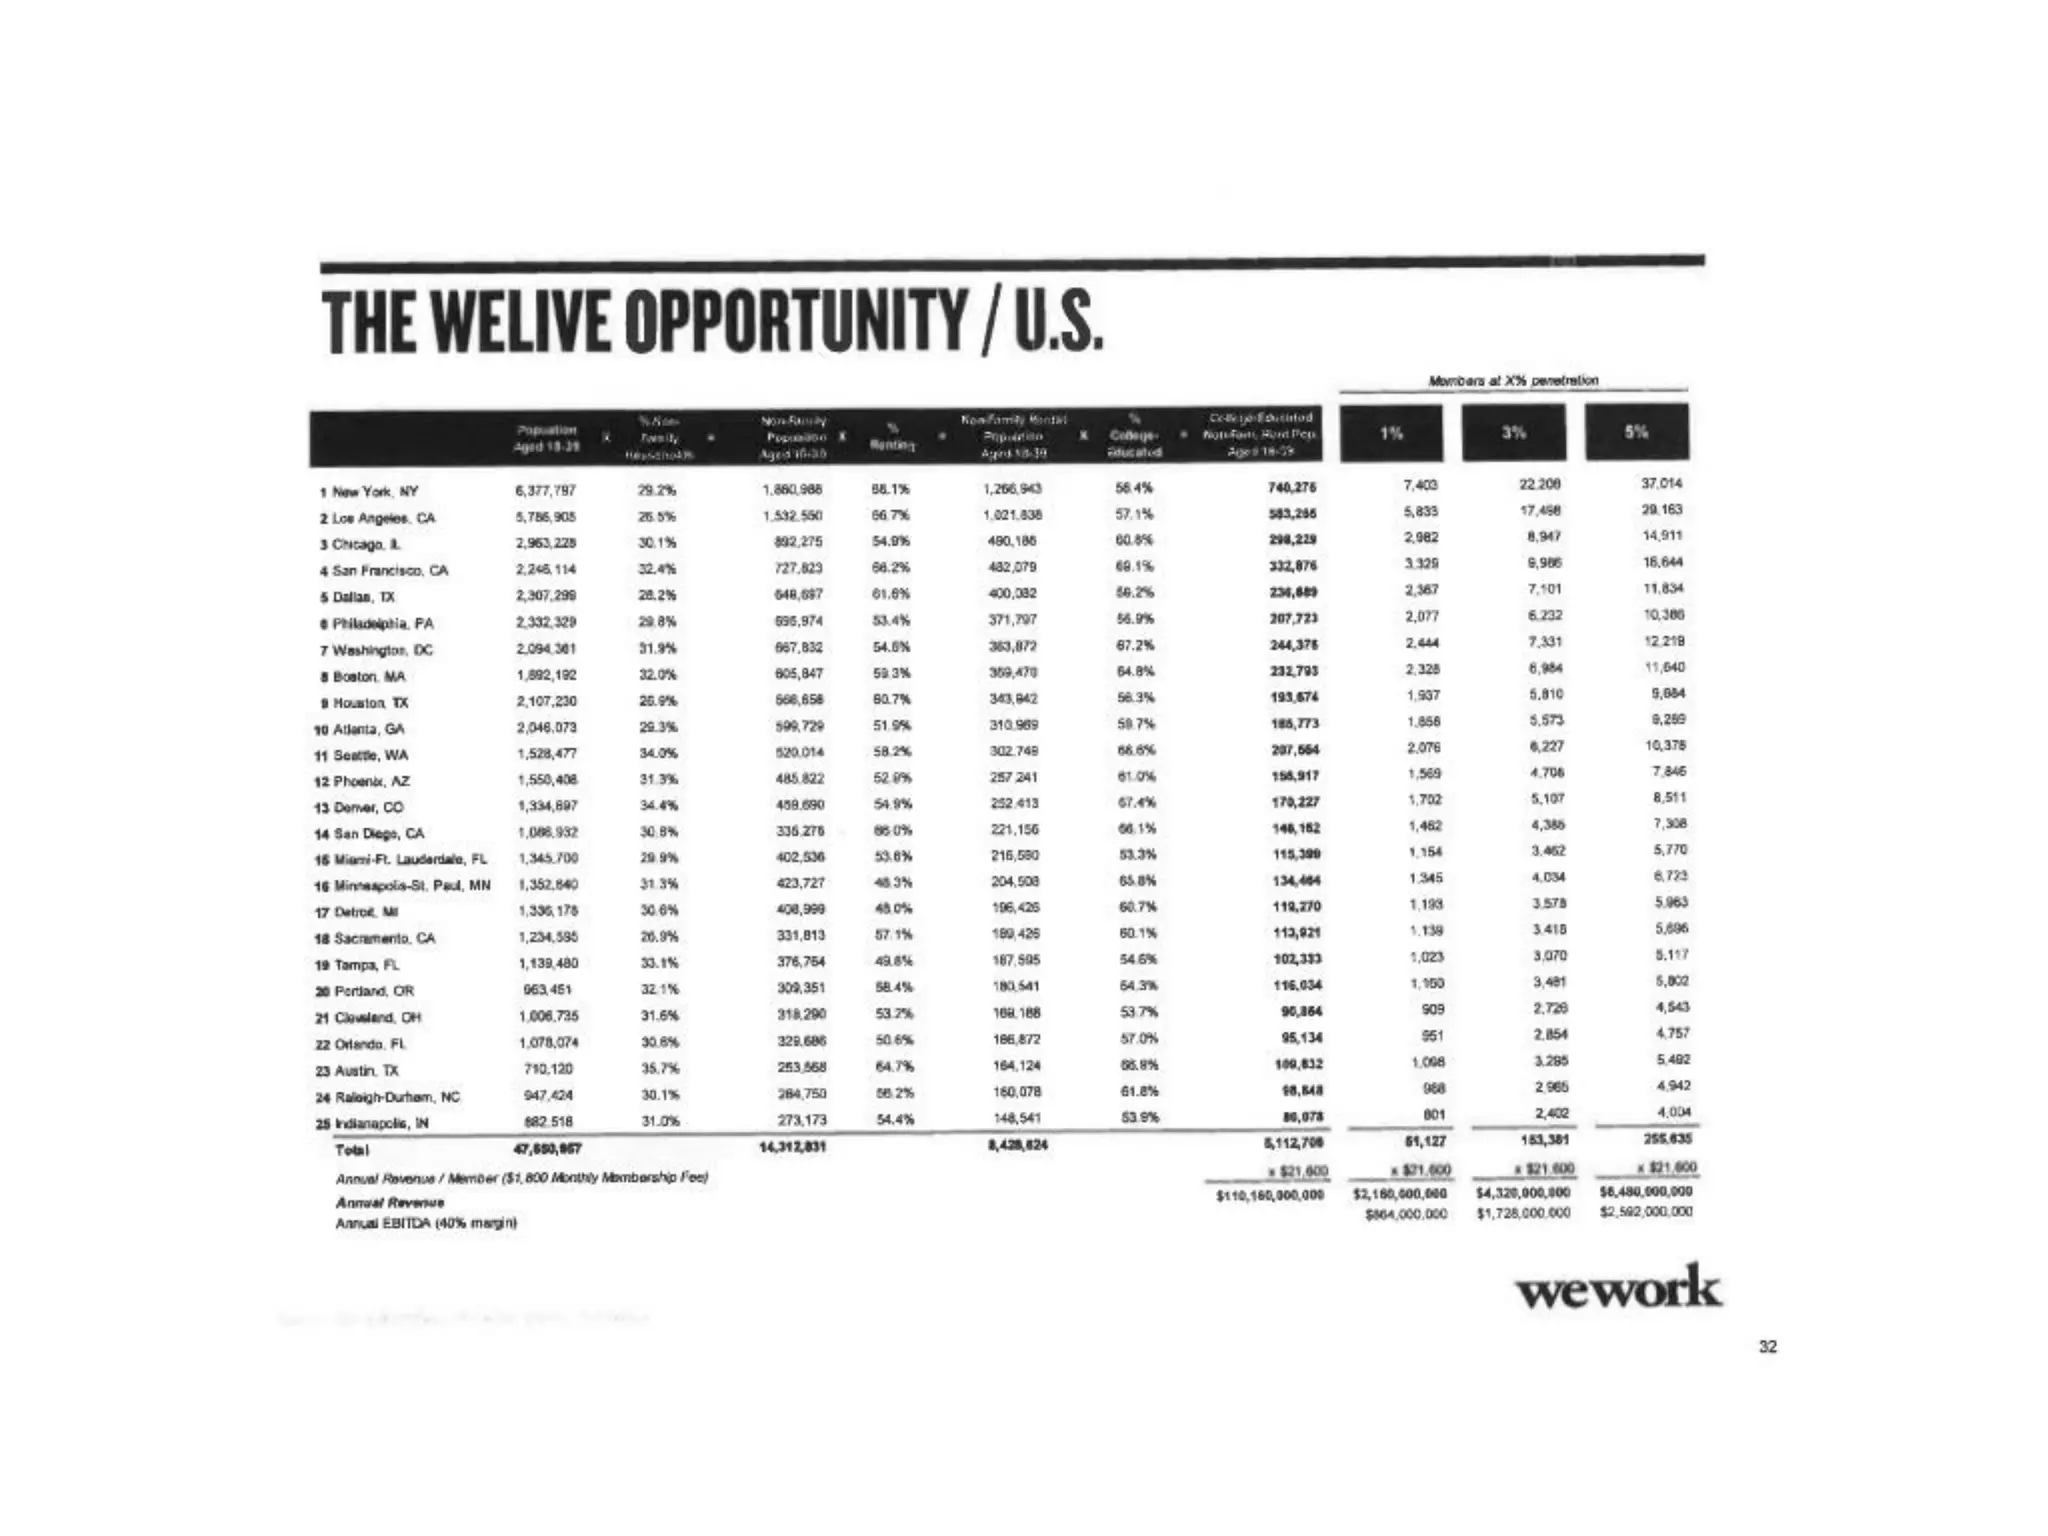
WeLive Opportunity (Slide 33)

  • Total Addressable Market: 5.4M U.S. renters age 18-35
  • Penetration scenarios:
    • 1% penetration: 91,137 members → $164M revenue
    • 3% penetration: 163,361 members → $294M revenue
    • 5% penetration: 255,830 members → $460.5M revenue
  • Current penetration (Oct 2014): 0 members (WeLive doesn’t exist yet)

Critical WeLive TAM problems:

  • Assumes all young renters are potential co-living customers (unrealistic)
  • Actual addressable market is likely 500K-1M (not 5.4M)
  • Assumes 5% penetration is achievable (unrealistic for unproven business)
  • No discussion of competitive threats or market saturation

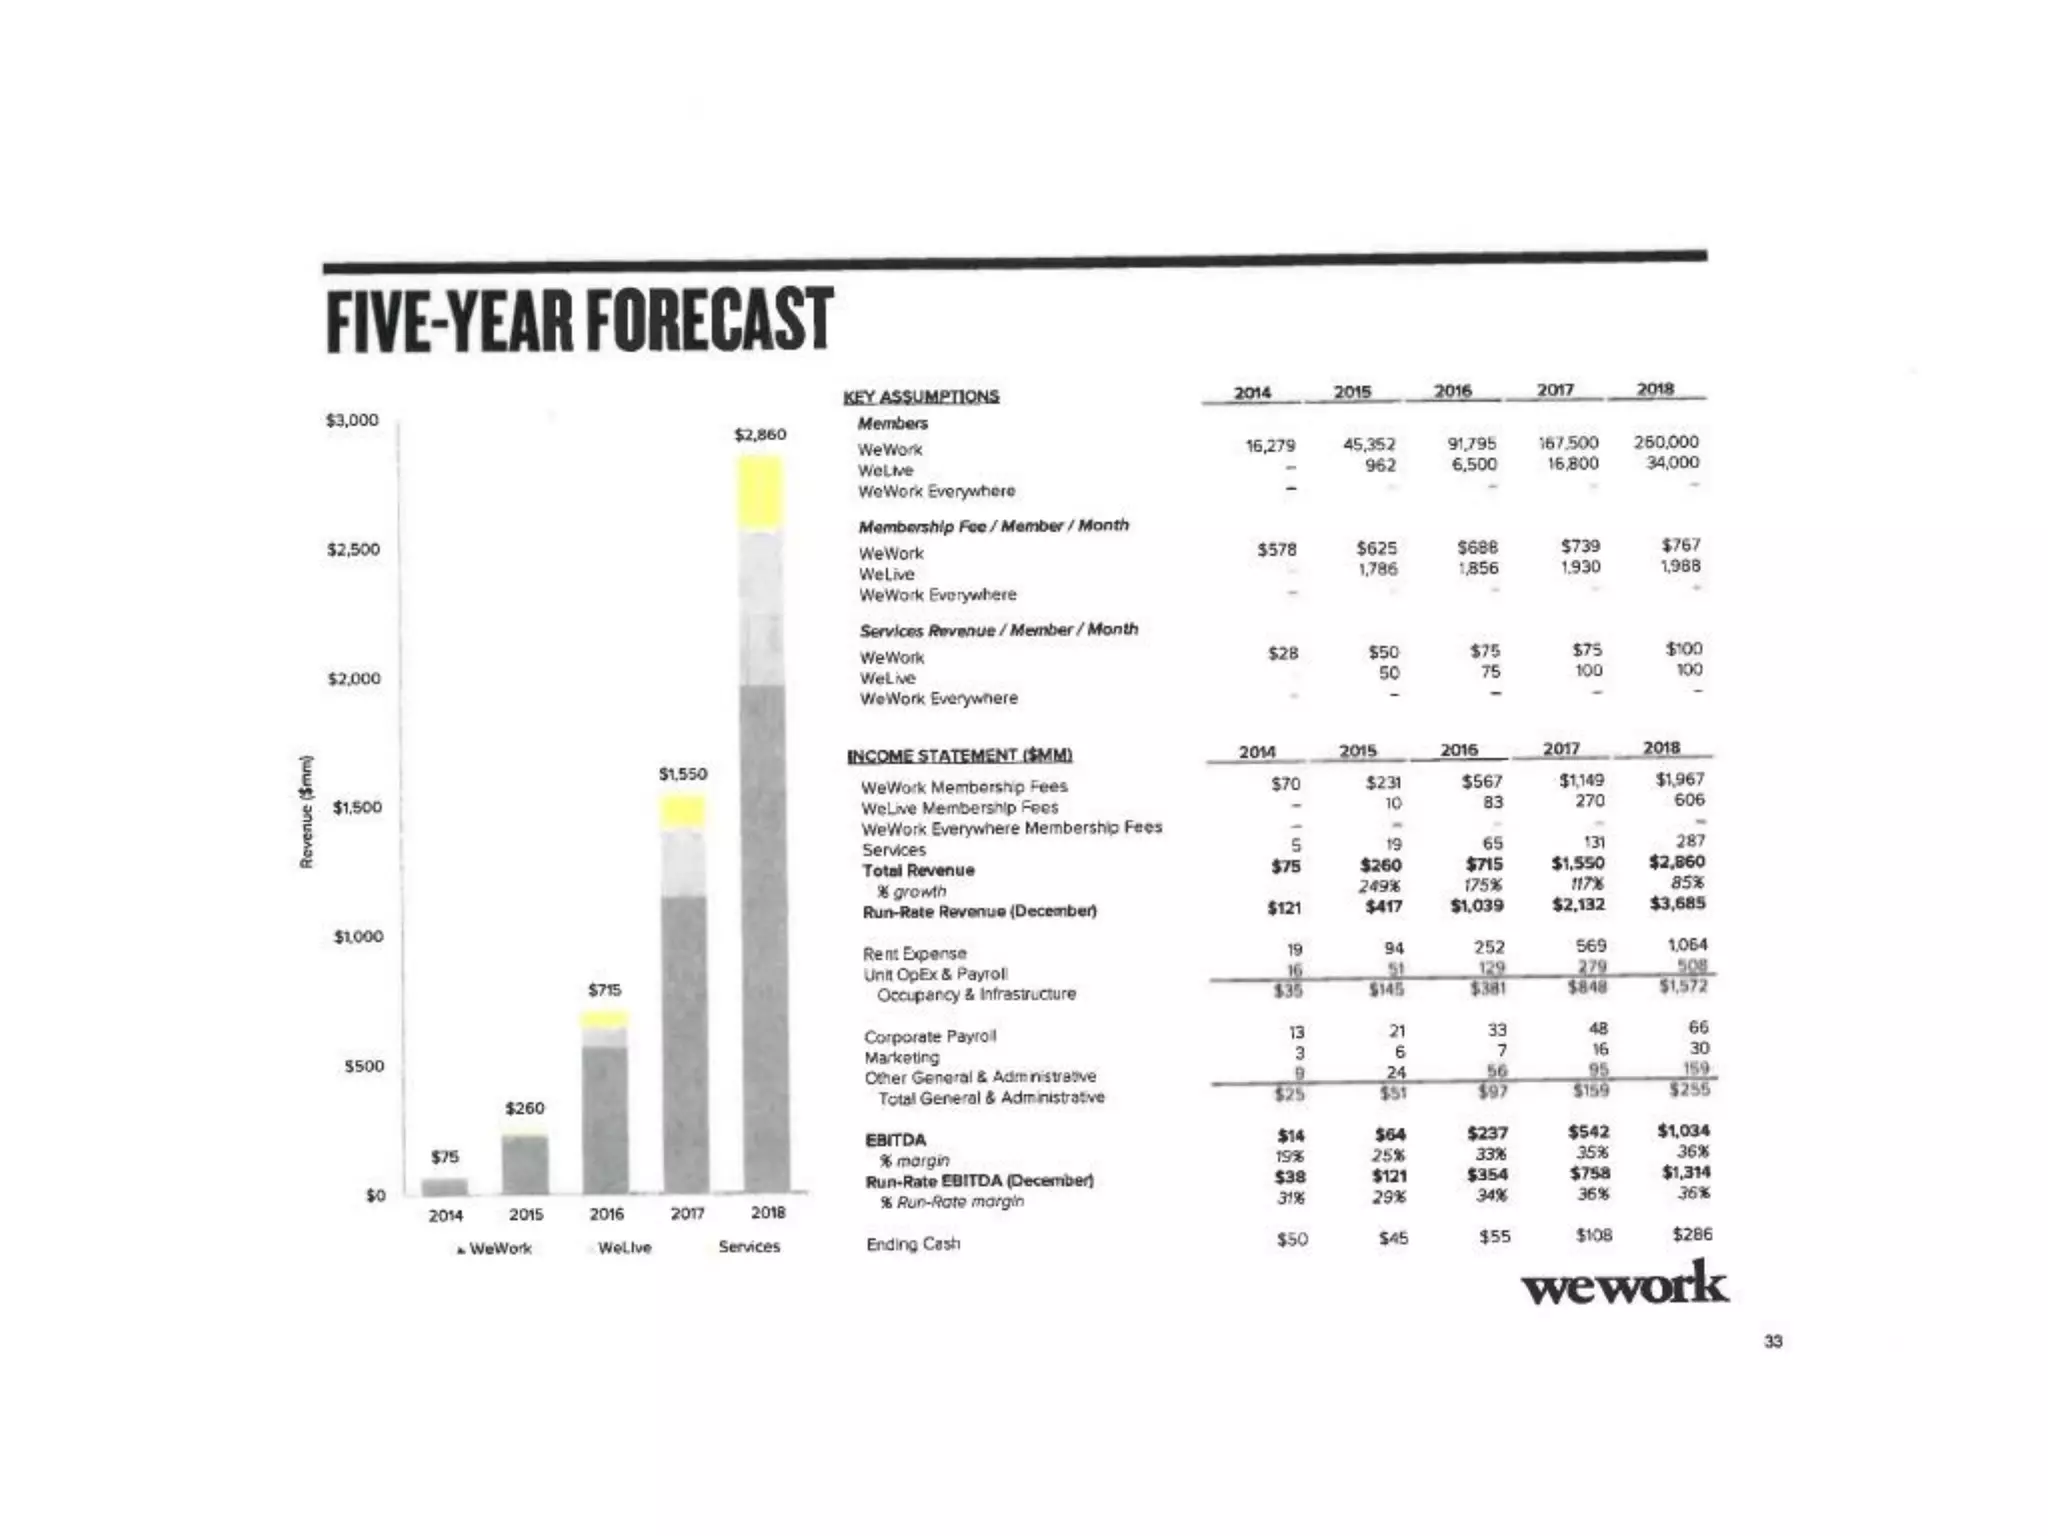
Combined Opportunity (Slide 34 Five-Year Forecast)

  • 2018 Projected Revenue: $2.86B
  • 2018 Projected EBITDA: $1.034B (36% margin)
  • Implied Valuation: $10B+ (at 10x EBITDA)

The TAM problem: The deck uses inflated TAM calculations to justify unrealistic revenue projections. The actual addressable market is likely 50% of what the deck claims.

Business Model

Revenue Model (Slides 2, 11, 26, 34):

WeWork Membership Fees

  • Per member: $600-650/month average (declining for new locations)
  • 2014 actual: $70M from 16,279 members
  • 2018 projected: $1,967M from 260,000 members

WeLive Membership Fees

  • Per member: $1,800/month (extremely low for residential)
  • 2015 projected: $10M from 962 members
  • 2018 projected: $606M from 34,000 members

Services Revenue

  • Per member: $28/month (2014), projected $50-100/month by 2018
  • 2014 actual: Negligible (included in membership fees)
  • 2018 projected: Meaningful but still secondary

Unit Economics (Slide 11 - Location-by-Location Analysis)

Mature Locations (2010-2011):

  • Revenue per location: $3.8-3.9M annually
  • Unit EBITDA: $1.3-1.5M (38-39% margin)
  • Occupancy: 100%
  • Payback period: ~22 months

Newer Locations (2014):

  • Revenue per location: $2.0-11.9M (high variance)
  • Unit EBITDA: $0.7-5.7M (36-48% margin)
  • Occupancy: 96-100%
  • Payback period: Unknown (not disclosed)

Critical unit economics problems:

  1. Variance is extreme: Unit EBITDA ranges from $0.7M to $5.7M (8x difference)
  2. New locations underperform: 2014 locations average lower margins than 2010-2011 locations
  3. Ramp-up period is long: Takes 2-3 years to reach profitability
  4. Corporate overhead is significant: Company-level EBITDA (31%) is much lower than unit EBITDA (41%)
  5. Pricing declining: New locations charge $501-599/month vs. $627-711 for mature locations

Lease Economics (Implicit from data)

WeWork’s business model:

  • Lease space long-term from landlords (3-5 year terms)
  • Sublease space short-term to members (month-to-month)
  • Pocket the spread between lease cost and member revenue

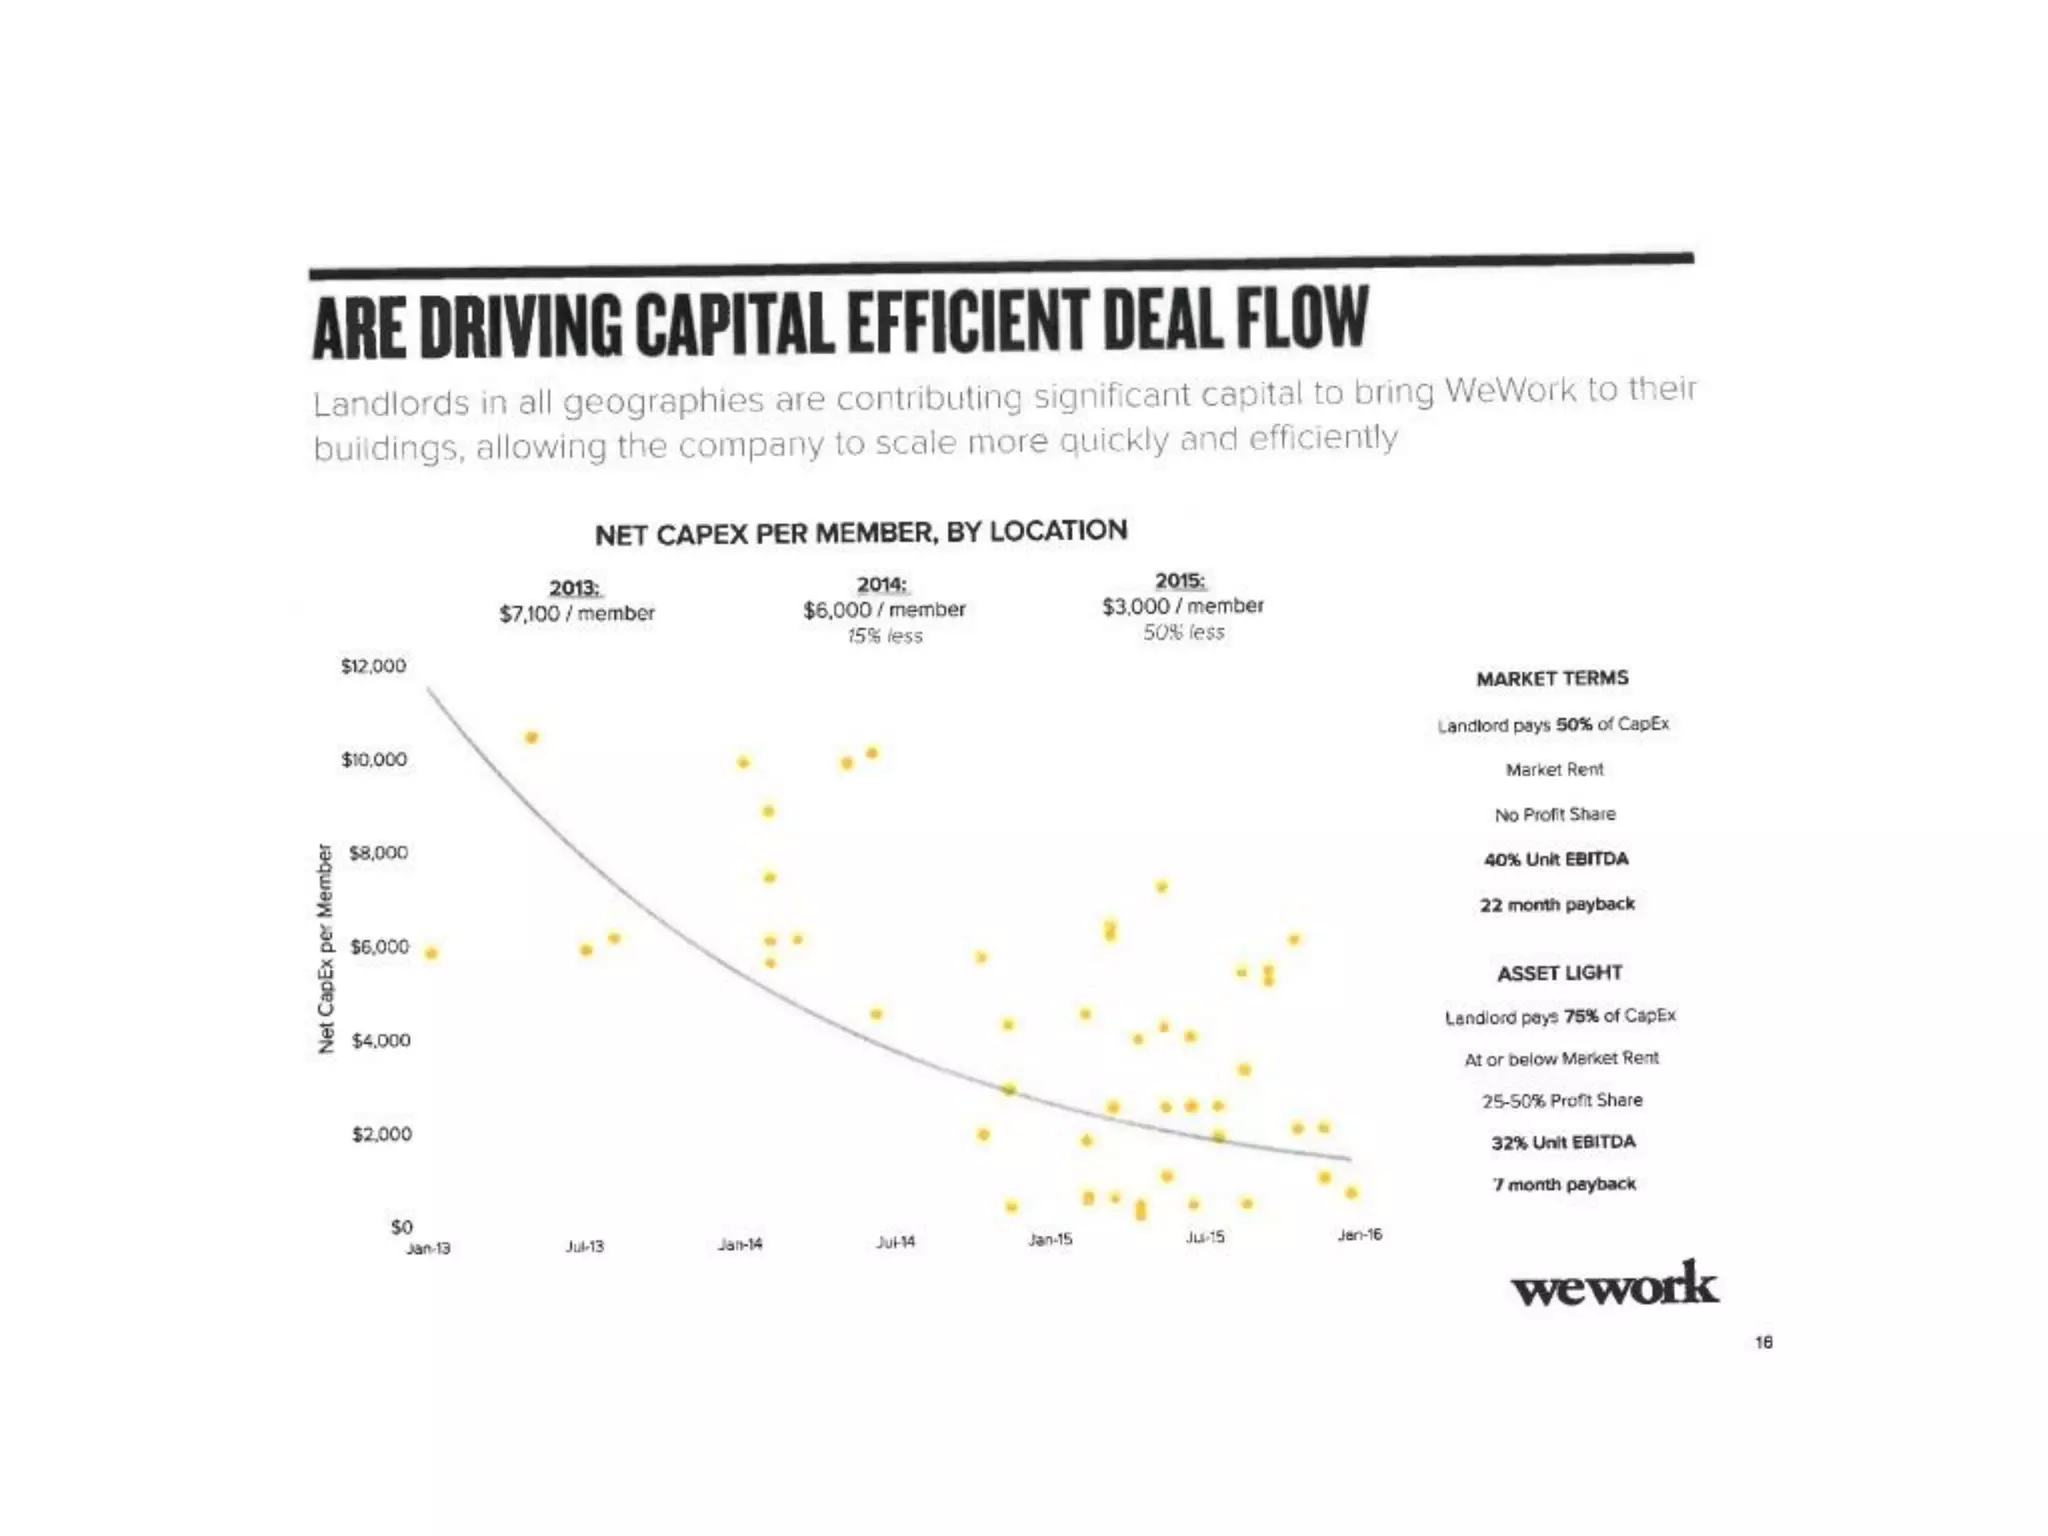
Landlord co-investment (Slide 18):

  • “Market Terms” model: Landlord pays 50% of CapEx, WeWork keeps 100% of profits
  • “Asset Light” model: Landlord pays 75% of CapEx, WeWork shares 25-50% of profits with landlord
  • Result: Declining CapEx per member ($7,100 → $6,000 → $3,000) but also declining profit share

The lease economics problem:

  • WeWork is dependent on landlord capital for expansion
  • Profit sharing with landlords reduces long-term profitability
  • Long-term lease obligations create fixed cost burden
  • If occupancy drops, WeWork is stuck with expensive leases

Traction & Metrics

Growth Metrics (Slides 2, 12, 20):

Member Growth

| Year | Members | Growth |
|——|———|——–|
| 2010 | 850 | - |
| 2011 | 1,900 | 124% |
| 2012 | 3,900 | 105% |
| 2013 | 5,300 | 36% |
| 2014 (Oct) | 15,000 | 183% |
| 2015 (Projected) | 45,000 | 200% |
| 2016 (Projected) | 91,795 | 104% |

CAGR (2010-2014): 109%

Revenue Growth

| Year | Revenue | Growth |
|——|———|——–|
| 2012 | $18.4M | - |
| 2013 | $30.8M | 67% |
| 2014 (Projected) | $74.6M | 142% |
| 2014 (Actual Run-Rate) | $121.4M | - |
| 2015 (Projected) | $391M | 222% |

Location Expansion

| Year | Locations | Growth |
|——|———–|——–|
| 2010 | 1 | - |
| 2014 | 20 | - |
| 2016 (Projected) | 80 | 300% |

Occupancy & Margins

  • Average occupancy: 99% (mature locations)
  • Average unit EBITDA margin: 41% (mature locations)
  • Company-level EBITDA margin: 31% (2014)

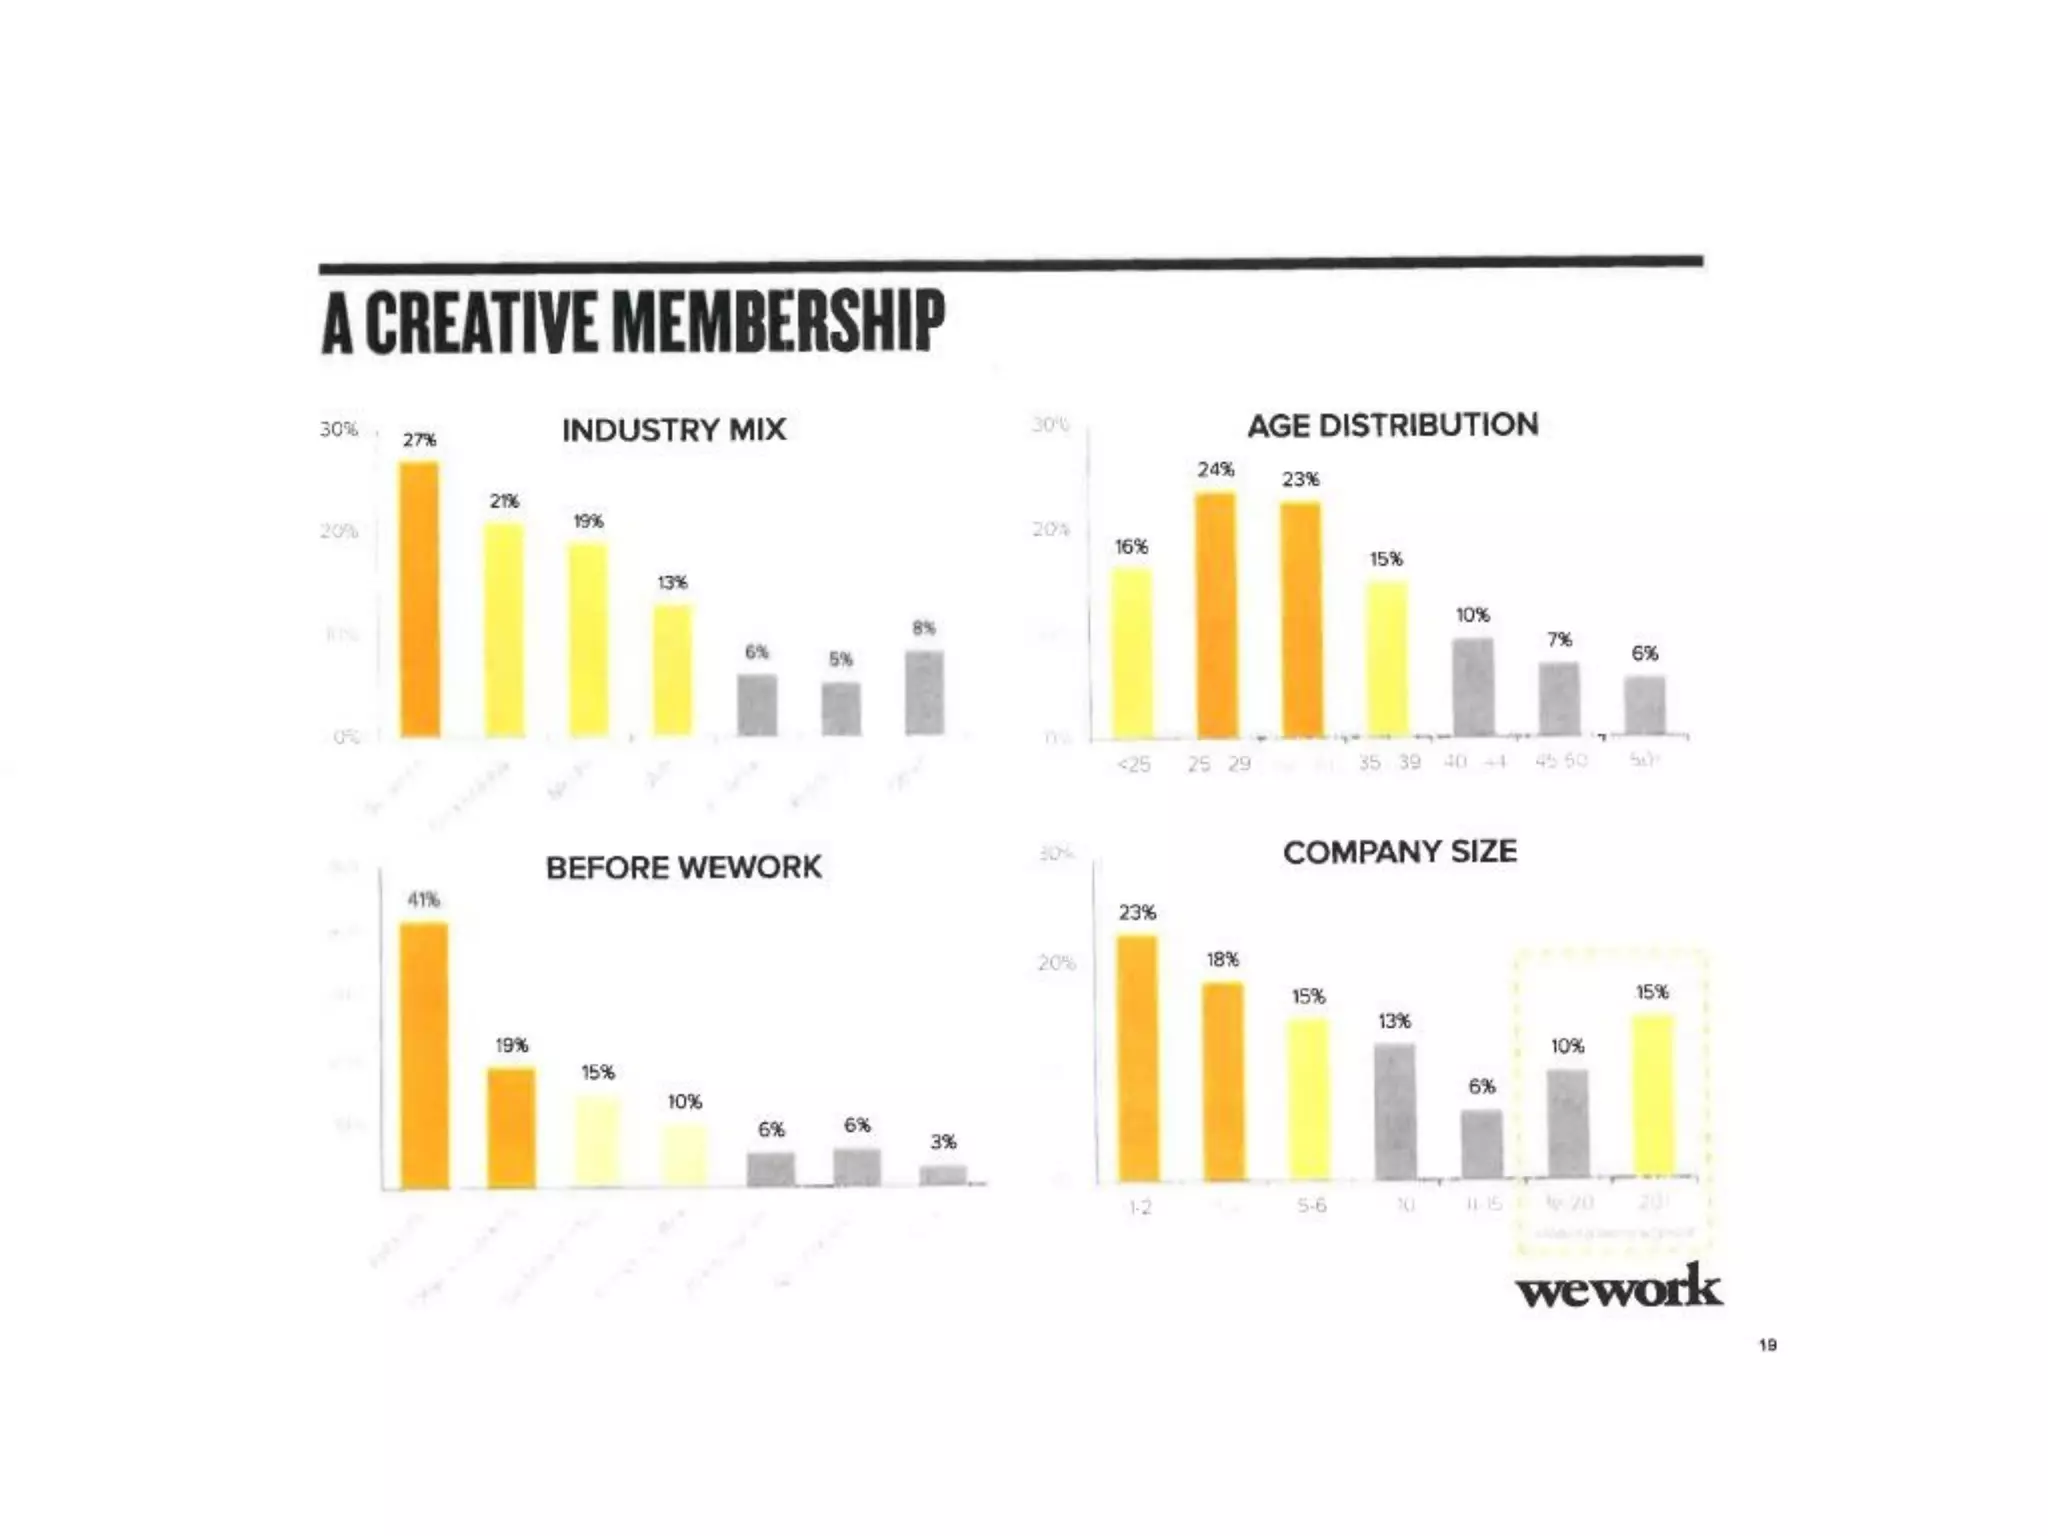
Member Demographics (Slide 20)

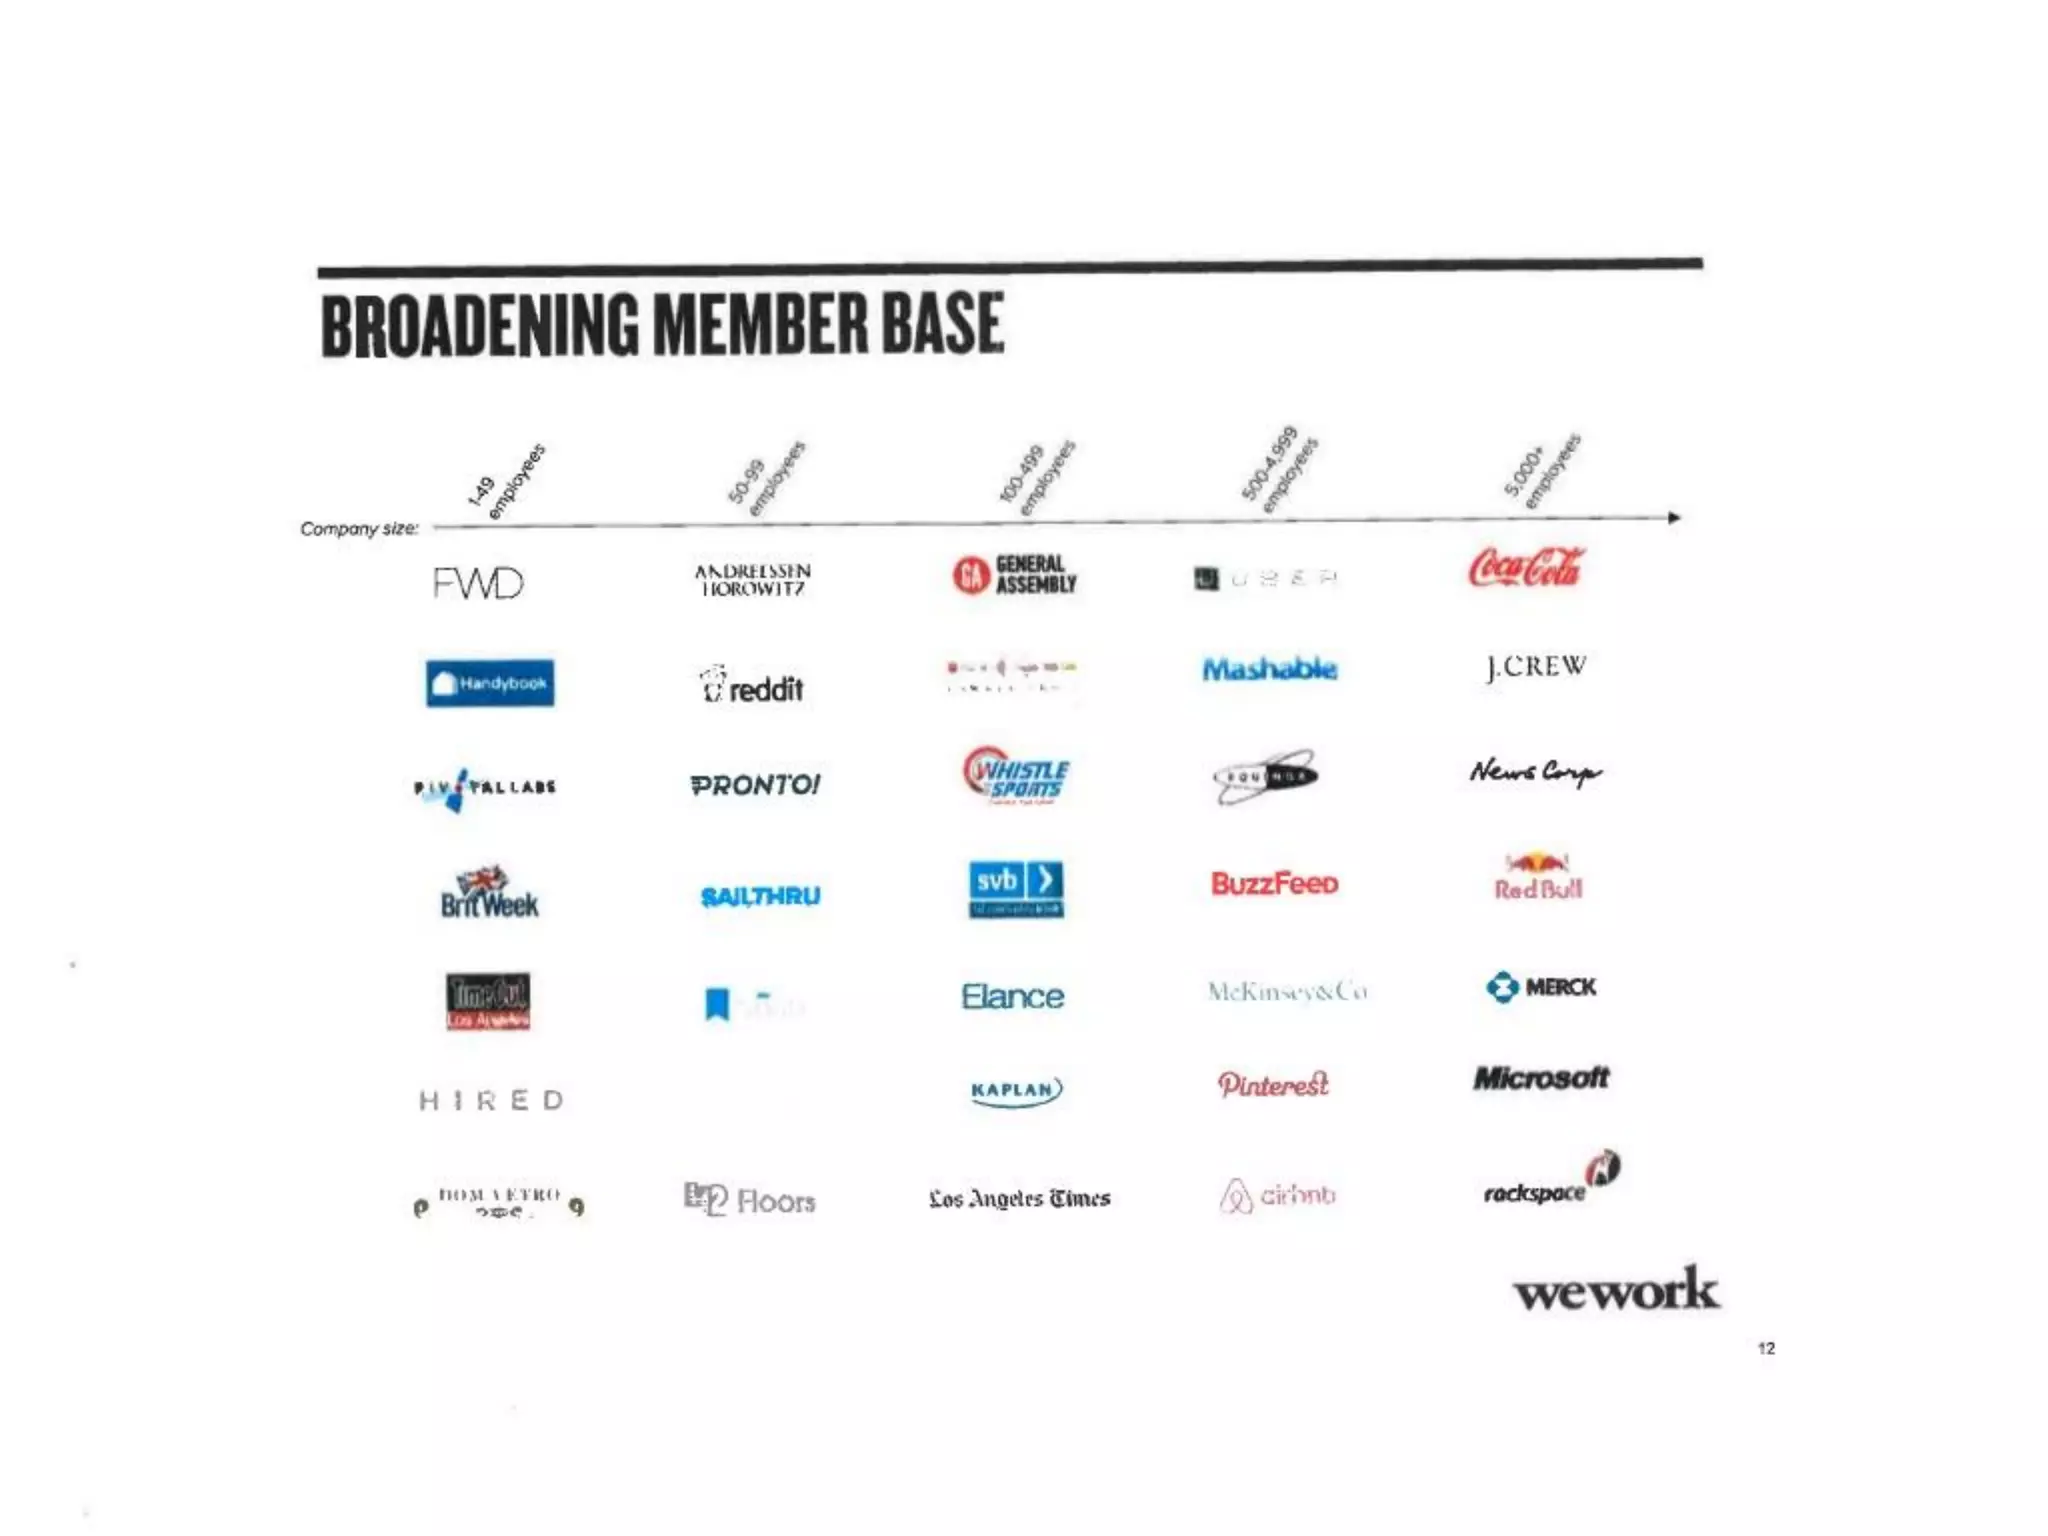
  • Industry mix: 67% from Tech/Finance/Media (concentration risk)
  • Age distribution: 63% under age 35 (concentration risk)
  • Company size: 56% of members have 1-6 employees (concentration risk)
  • Before WeWork: 41% worked from home, 19% from coffee shops, 15% from traditional offices

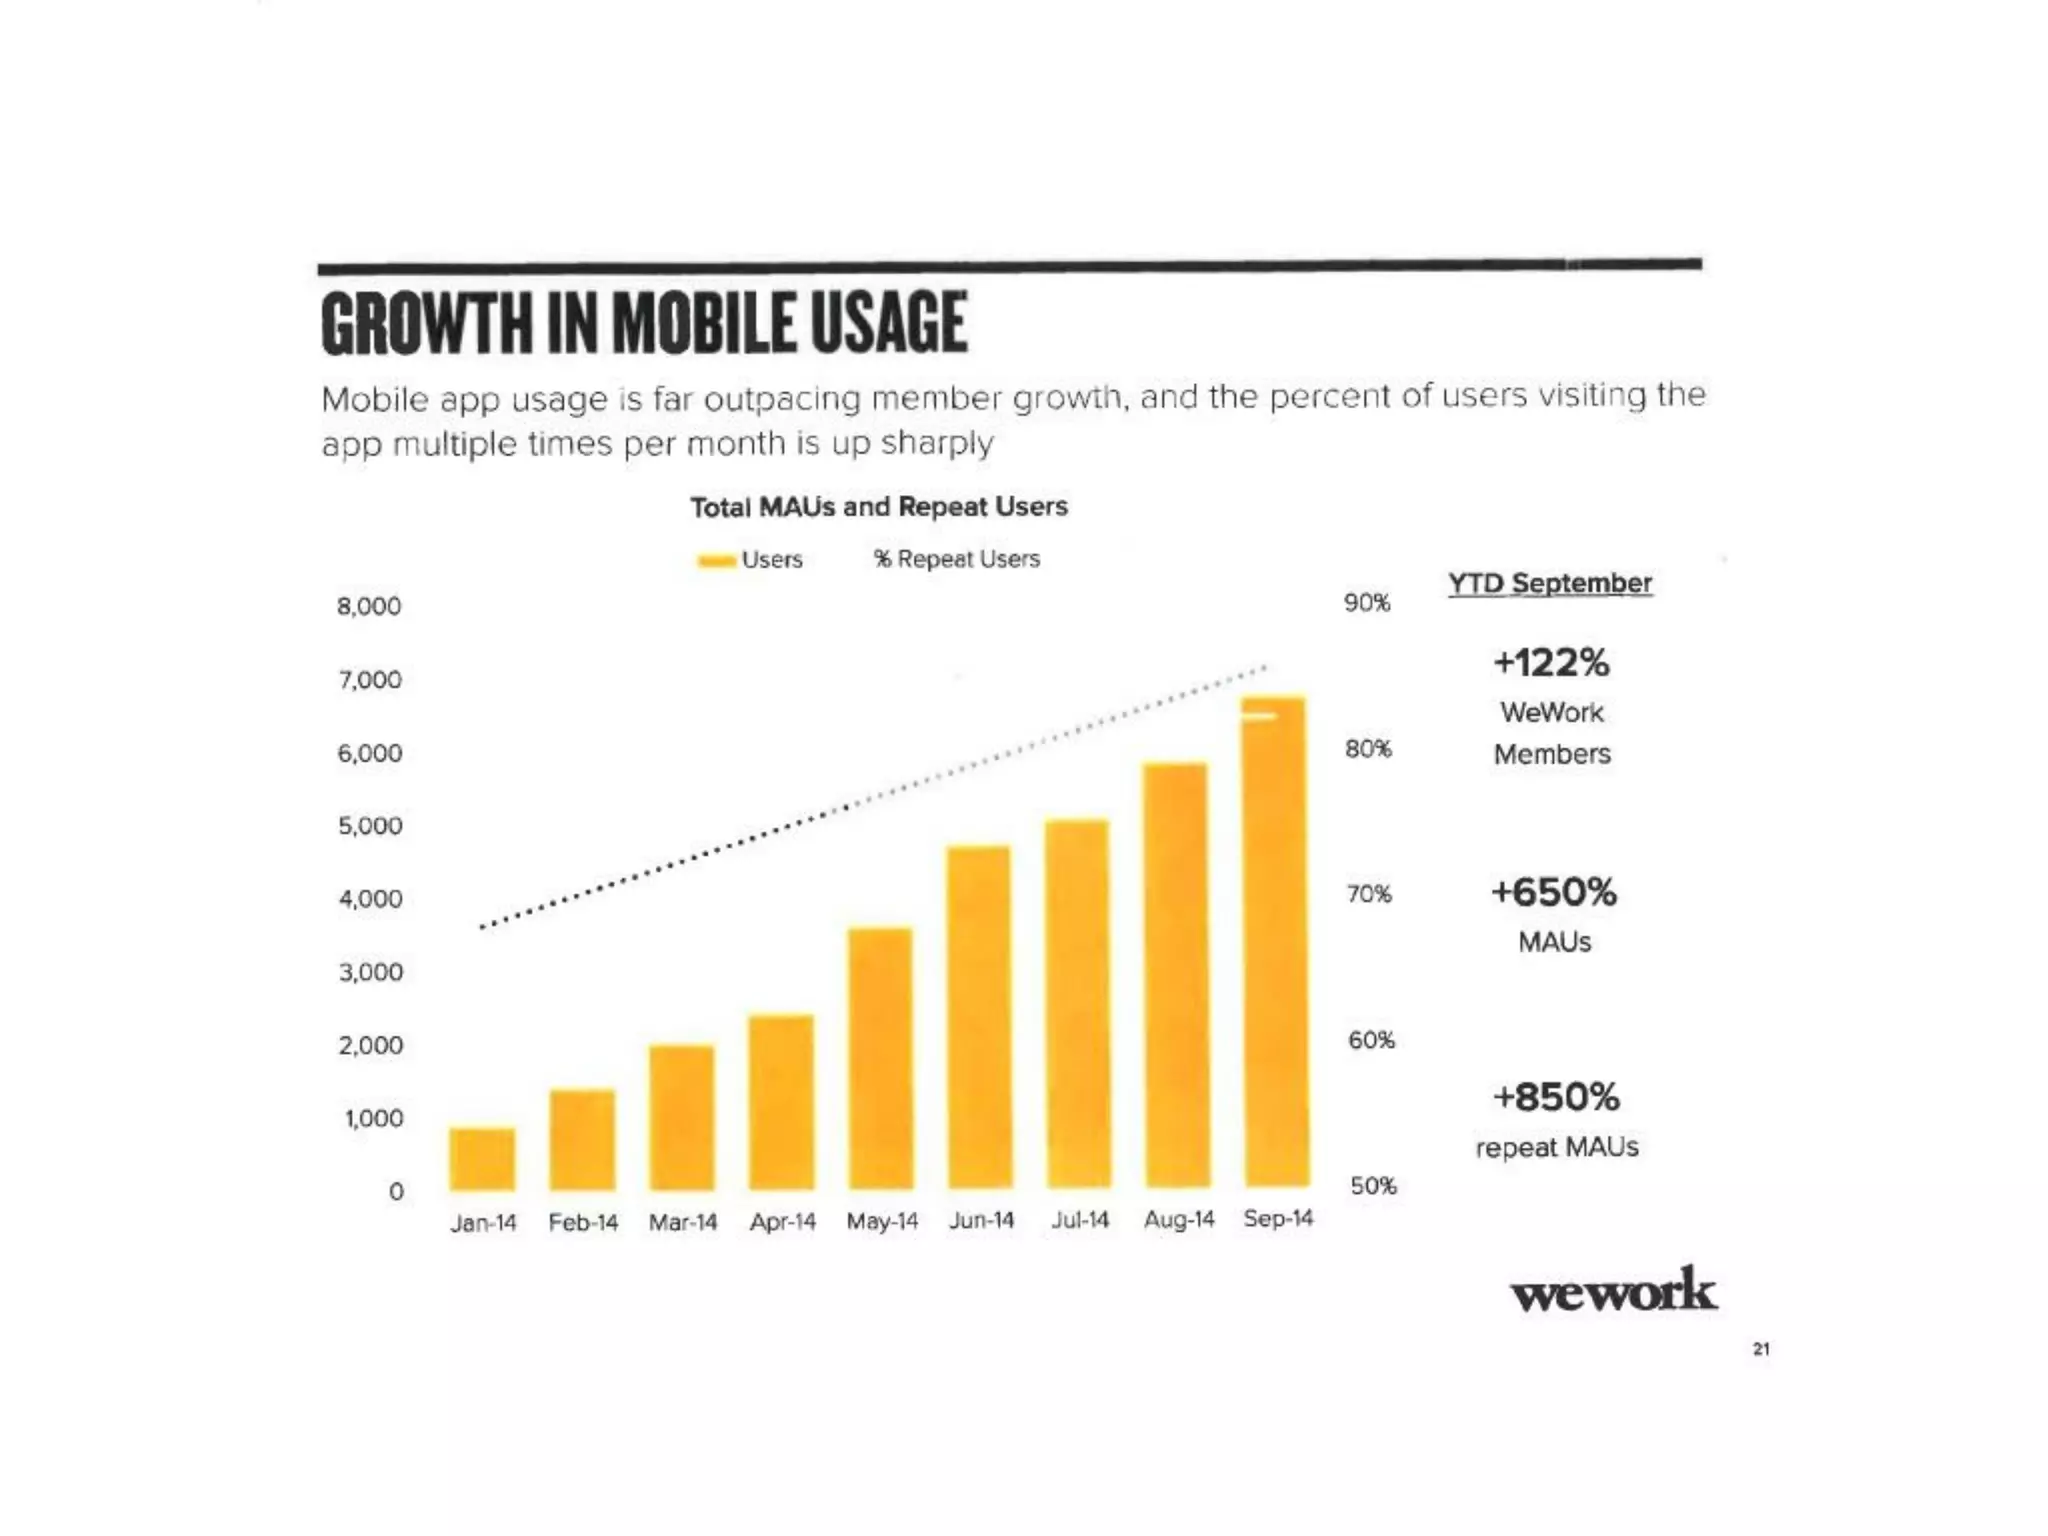
App Engagement (Slide 22)

  • Monthly Active Users (MAU): 6,800 (45% of 15,000 members)
  • Repeat users: 5,780 (39% of 15,000 members)
  • Growth: 650% MAU growth (Jan-Sep 2014)
  • Repeat user growth: 850% (Jan-Sep 2014)

Critical traction problems:

  1. Growth is decelerating: 200% growth (2014) → 222% projected (2015) is unsustainable
  2. Member concentration is extreme: 67% from 3 industries, 63% under 35, 56% with 1-6 employees
  3. App adoption is low: Only 45% of members use app monthly
  4. Enterprise adoption is minimal: Only 15% came from traditional offices
  5. Services adoption is low: Only $28/month per member despite 12 service partnerships

Competitive Positioning

How WeWork differentiates (Slides 3, 7, 8, 9, 21):

Claimed Differentiators

  1. “Space as a Service” Positioning
    • Rebrands real estate as a tech platform
    • Month-to-month flexibility vs. traditional 3-5 year leases
    • All-inclusive pricing (utilities, WiFi, furniture, cleaning)
    • Claimed 25% cost advantage vs. traditional office
  2. Ecosystem & Network Effects
    • Community of 15,000 members
    • “WeWork effect” - claimed self-reinforcing growth loop
    • Member networking and collaboration
    • Curated services and partnerships
  3. Technology & Mobile Experience
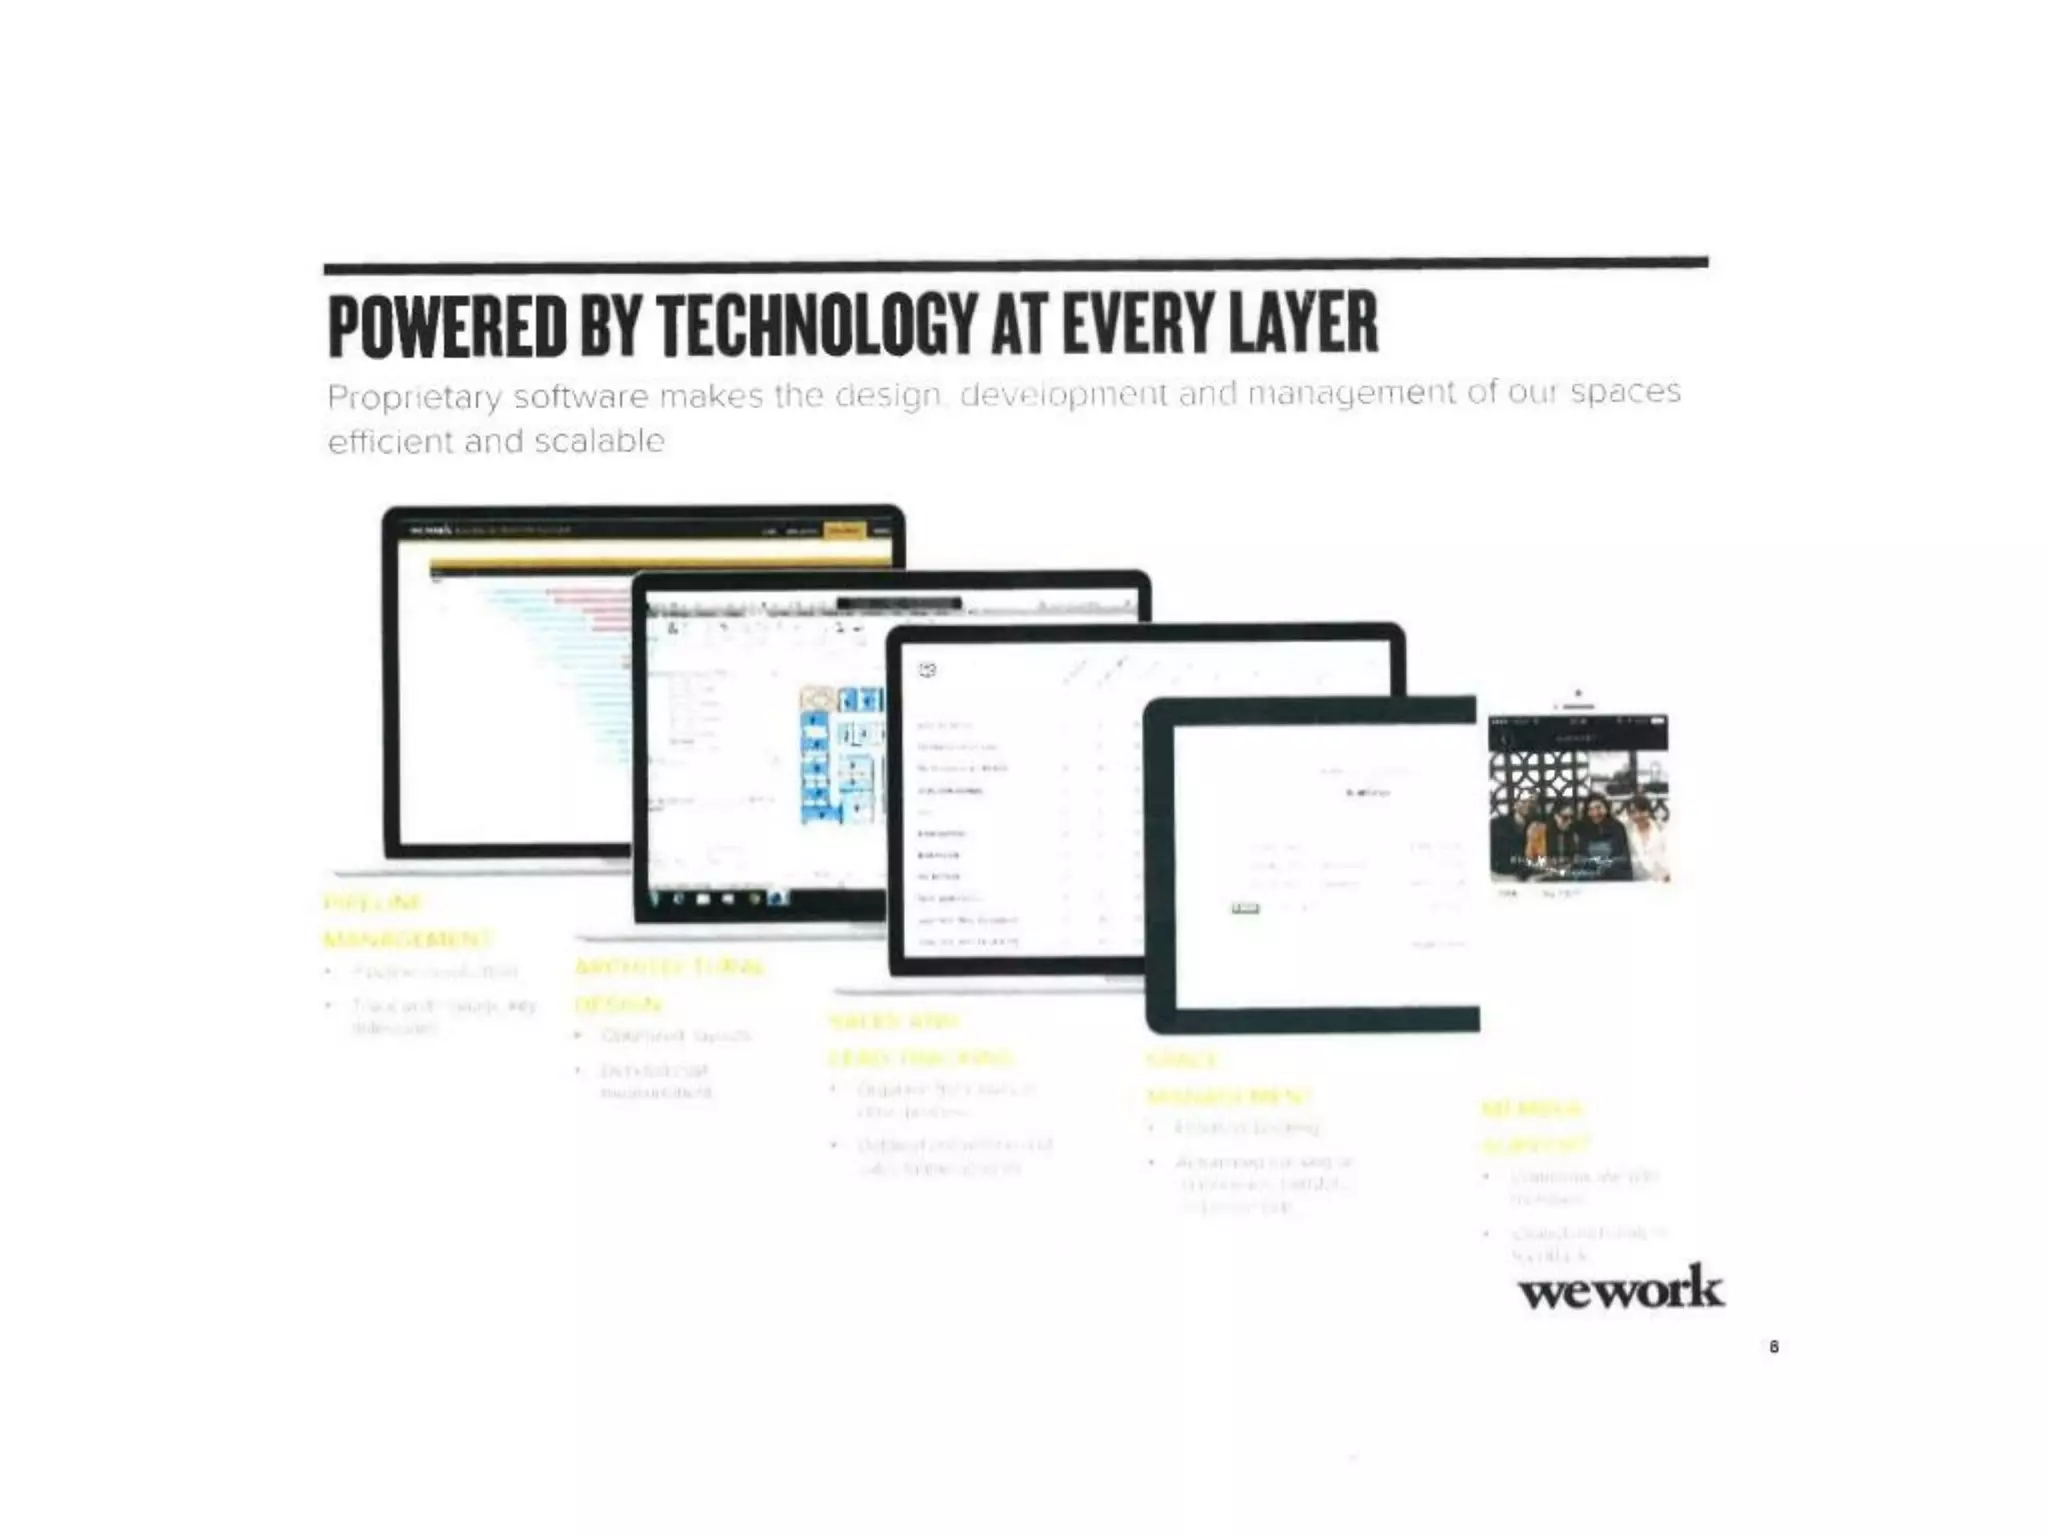
    • Proprietary design and management software
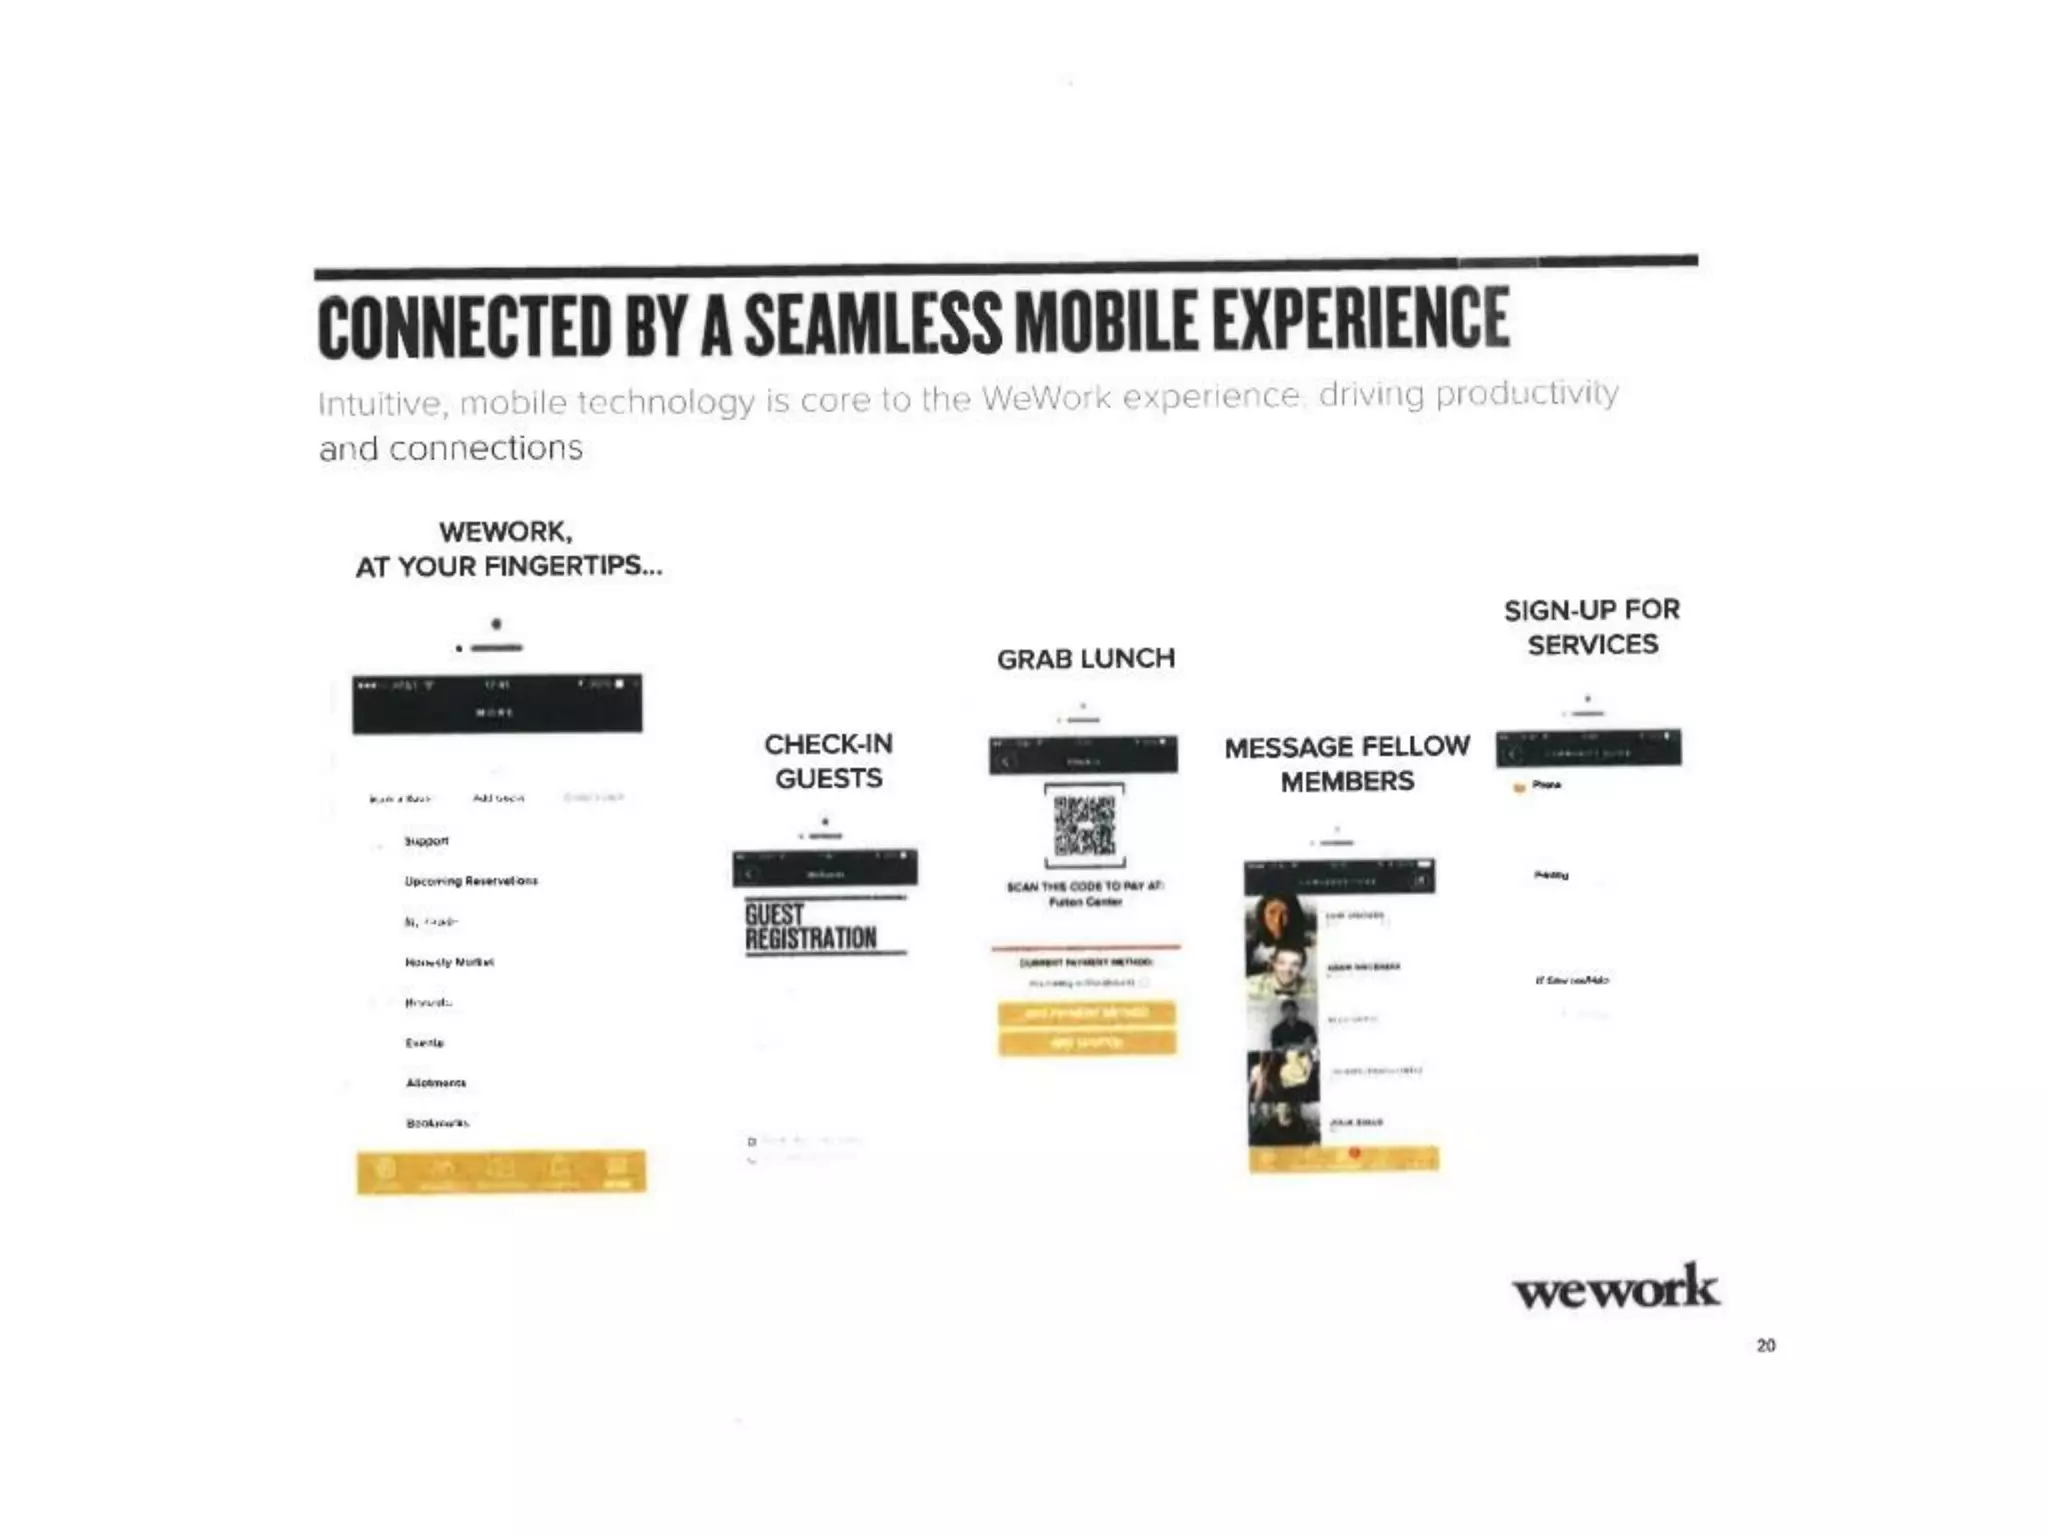
    • Mobile app for booking, check-in, messaging
    • “Fully integrated digital app” for services
  4. First-Mover Advantage
    • 4-year head start on competitors
    • Established brand in major markets
    • Landlord relationships and capital access
  5. Landlord Partnerships
    • Access to premium real estate portfolios
    • Landlord co-investment in developments
    • Value creation for landlords (claimed)

Actual Competitive Position

What makes WeWork defensible:

  • Brand recognition in major markets
  • Landlord relationships (though concentrated)
  • Established member base (though concentrated)
  • First-mover advantage in specific markets

What makes WeWork vulnerable:

  • Space is commodity: Any landlord can offer flexible leases
  • Community is weak: Only 45% app adoption, 39% repeat users
  • Technology is commodity: Desk booking app is trivial to replicate
  • Services are easily replicated: Partners can work with competitors
  • Pricing power is declining: New locations charge less than mature locations
  • No defensible moat: Competitors can easily enter with capital

Competitive threats not addressed:

  • Traditional landlords offering flexible leases
  • Other coworking spaces (Regus, IWG, etc.)
  • New coworking startups with lower cost structures
  • Home office and coffee shop alternatives
  • Traditional office subleases

Team

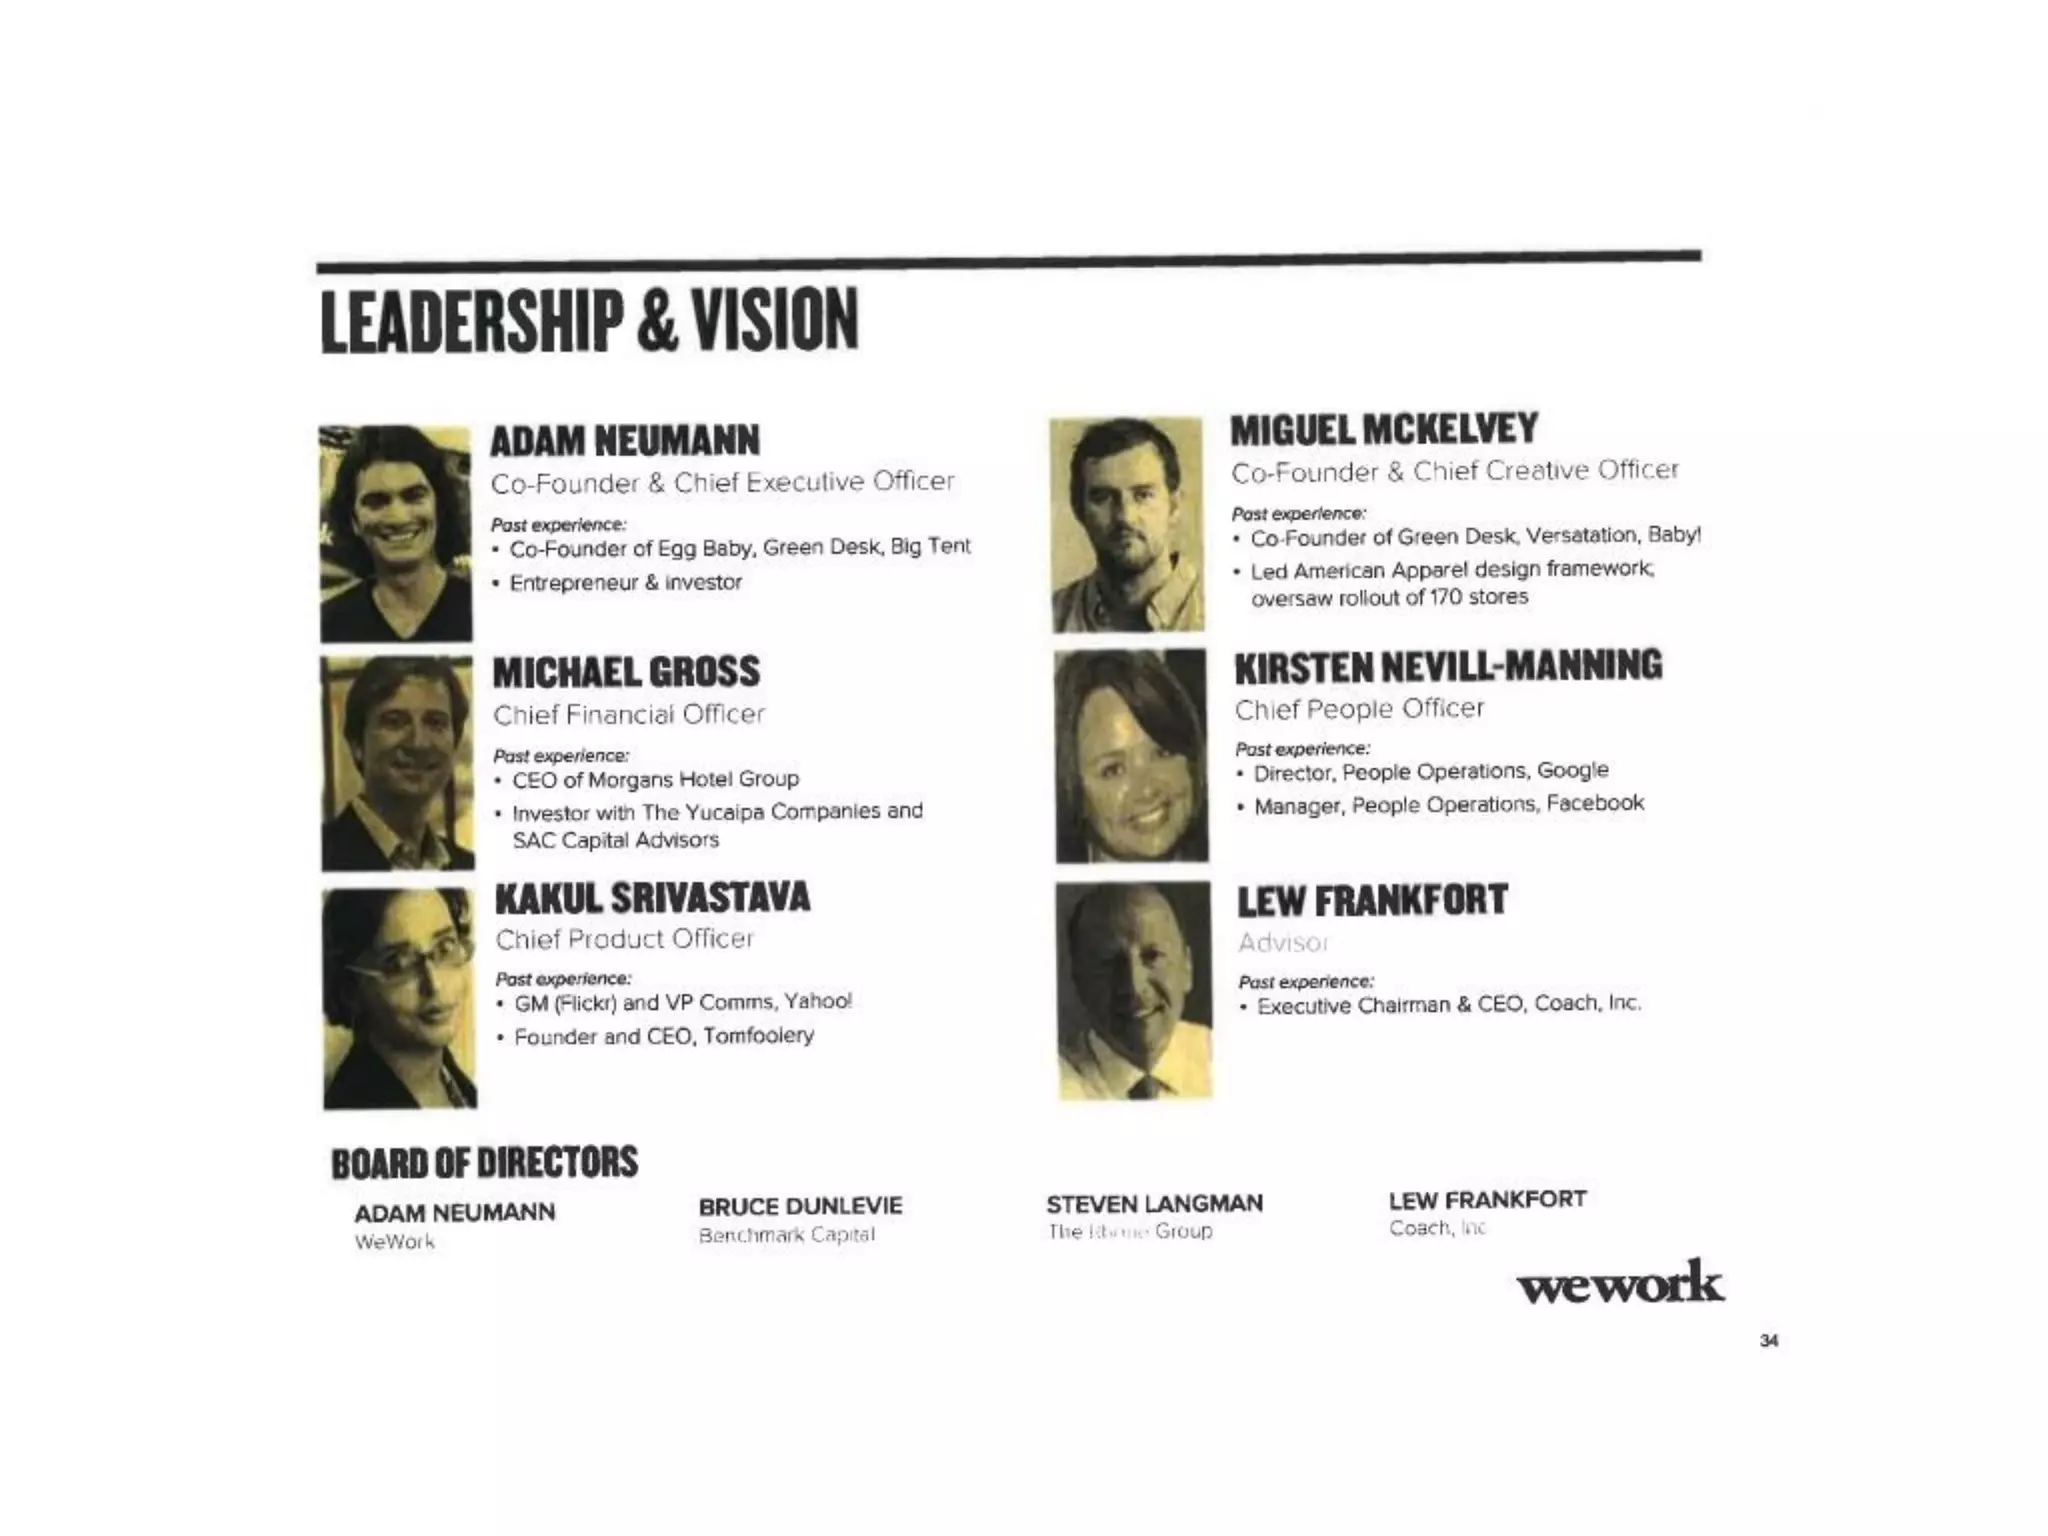
Executive Leadership (Slide 35):

Adam Neumann - Co-Founder & CEO

  • Background: Co-founder of Green Desk (coworking space), Egg Baby, Big Tent
  • Experience: Entrepreneur & investor
  • Red flags:
    • First-time CEO of large company
    • No experience with capital-intensive business
    • No experience with public company management
    • No experience managing 200+ person organization

Miguel McKelvey - Co-Founder & Chief Creative Officer

  • Background: Co-founder of Green Desk, led American Apparel design framework (170 stores)
  • Experience: Design and coworking
  • Red flags:
    • Design experience, not operations
    • No experience with residential real estate (WeLive)
    • No experience with large-scale operations

Michael Gross - Chief Financial Officer

  • Background: CEO of Morgans Hotel Group, investor with Yucaipa Companies and SAC Capital
  • Experience: Hotels and hospitality
  • Red flags:
    • Hotel experience ≠ real estate arbitrage experience
    • No experience with residential real estate
    • No experience with capital-intensive expansion

Kakul Srivastava - Chief Product Officer

  • Background: GM at Flickr, VP Communications at Yahoo!, founder/CEO of Tomfoolery
  • Experience: Tech products and communications
  • Red flags:
    • Product experience, not operations
    • No real estate experience
    • No experience with capital-intensive business

Kirsten Nevill-Manning - Chief People Officer

  • Background: Director of People Operations at Google, Manager at Facebook
  • Experience: HR and people operations
  • Red flags:
    • HR experience, not operations
    • No real estate experience
    • No experience with capital-intensive business

Lew Frankfort - Advisor

  • Background: Executive Chairman & CEO of Coach, Inc.
  • Experience: Luxury retail
  • Red flags:
    • Retail experience ≠ real estate experience
    • No coworking or residential experience

Board of Directors

  • Adam Neumann (WeWork)
  • Bruce Dunlevie (Benchmark Capital - investor)
  • Steven Langman (The Libra Group - investor)
  • Lew Frankfort (Coach, Inc. - advisor)

Critical leadership gaps:

  1. No Chief Operating Officer - critical for managing rapid expansion
  2. No real estate executive - critical for real estate company
  3. No residential real estate experience - critical for WeLive
  4. Weak board - mostly investors, not operators
  5. Inexperienced CEO - first-time CEO of large company

Go-to-Market Strategy

How WeWork acquires members (Implicit from data):

Member Acquisition Channels (Not explicitly stated)

  • Direct sales: Sales team targeting freelancers and small businesses
  • Word-of-mouth: Member referrals (implied by “community” emphasis)
  • Brand marketing: Lifestyle positioning (“Do What You Love”)
  • Location visibility: Physical presence in major markets
  • Services partnerships: TriNet healthcare, General Assembly education, etc.

Geographic Expansion Strategy (Slides 10, 17)

  • Current: 20 locations in 7 U.S. cities + 3 international cities
  • Planned: 80 locations by 2016 (58% unsigned as of Oct 2014)
  • Strategy: Focus on major markets (NYC, LA, SF, Chicago, DC, Boston)
  • International: Minimal (only 4 of 80 planned locations)

Landlord Acquisition Strategy (Slides 15-16, 31-32)

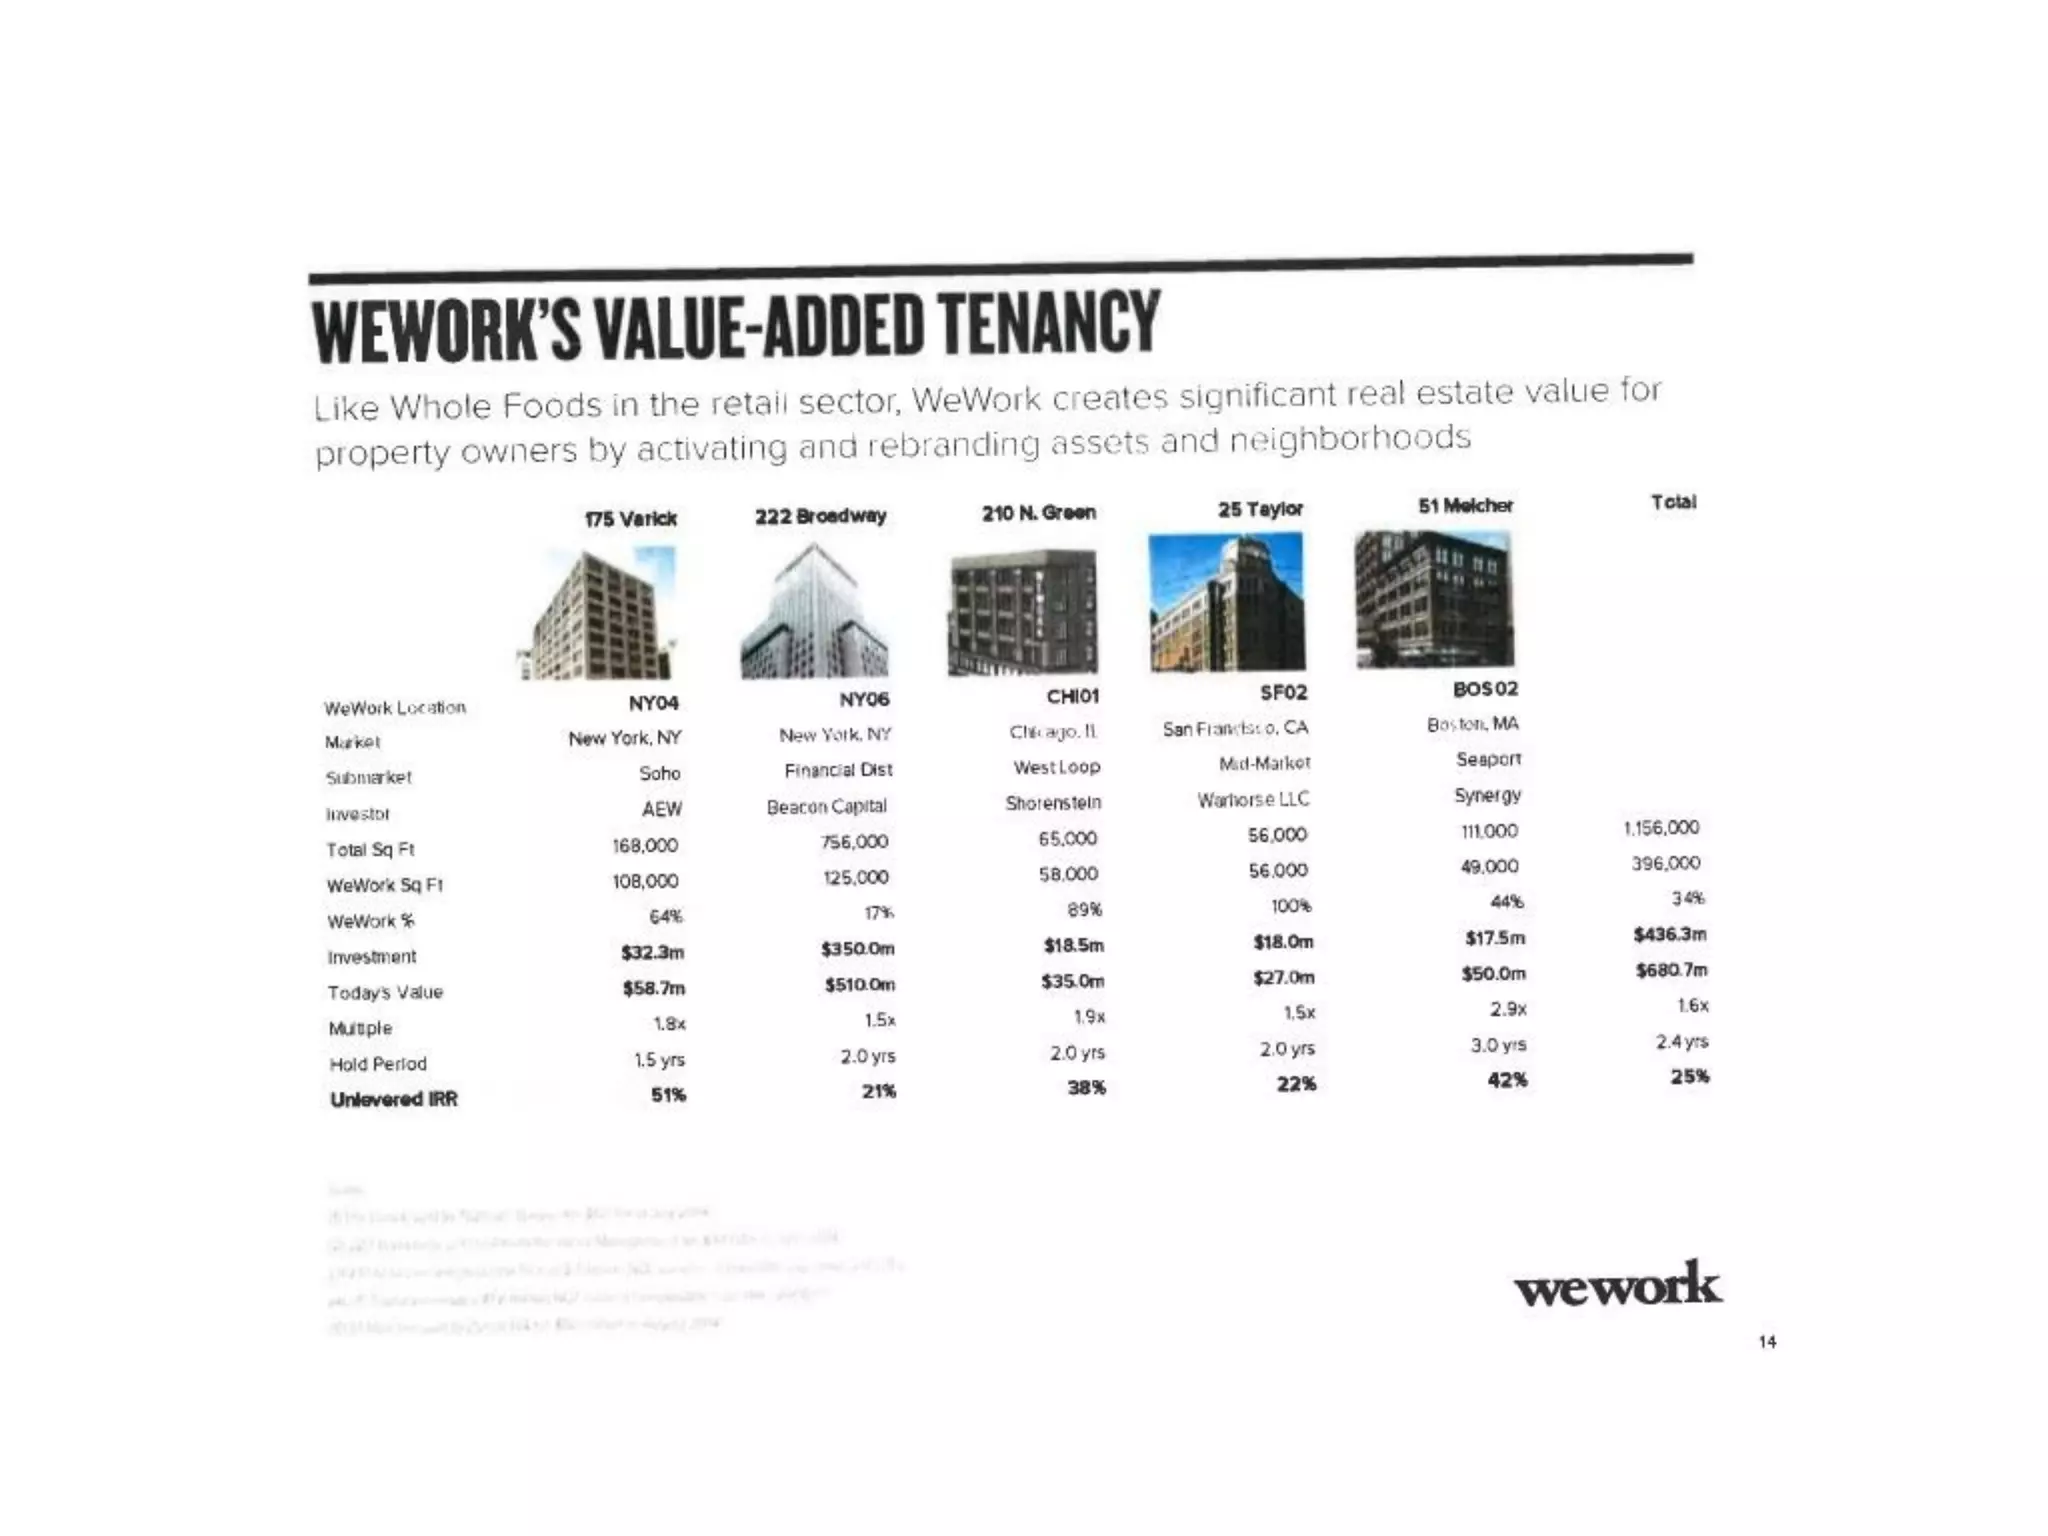
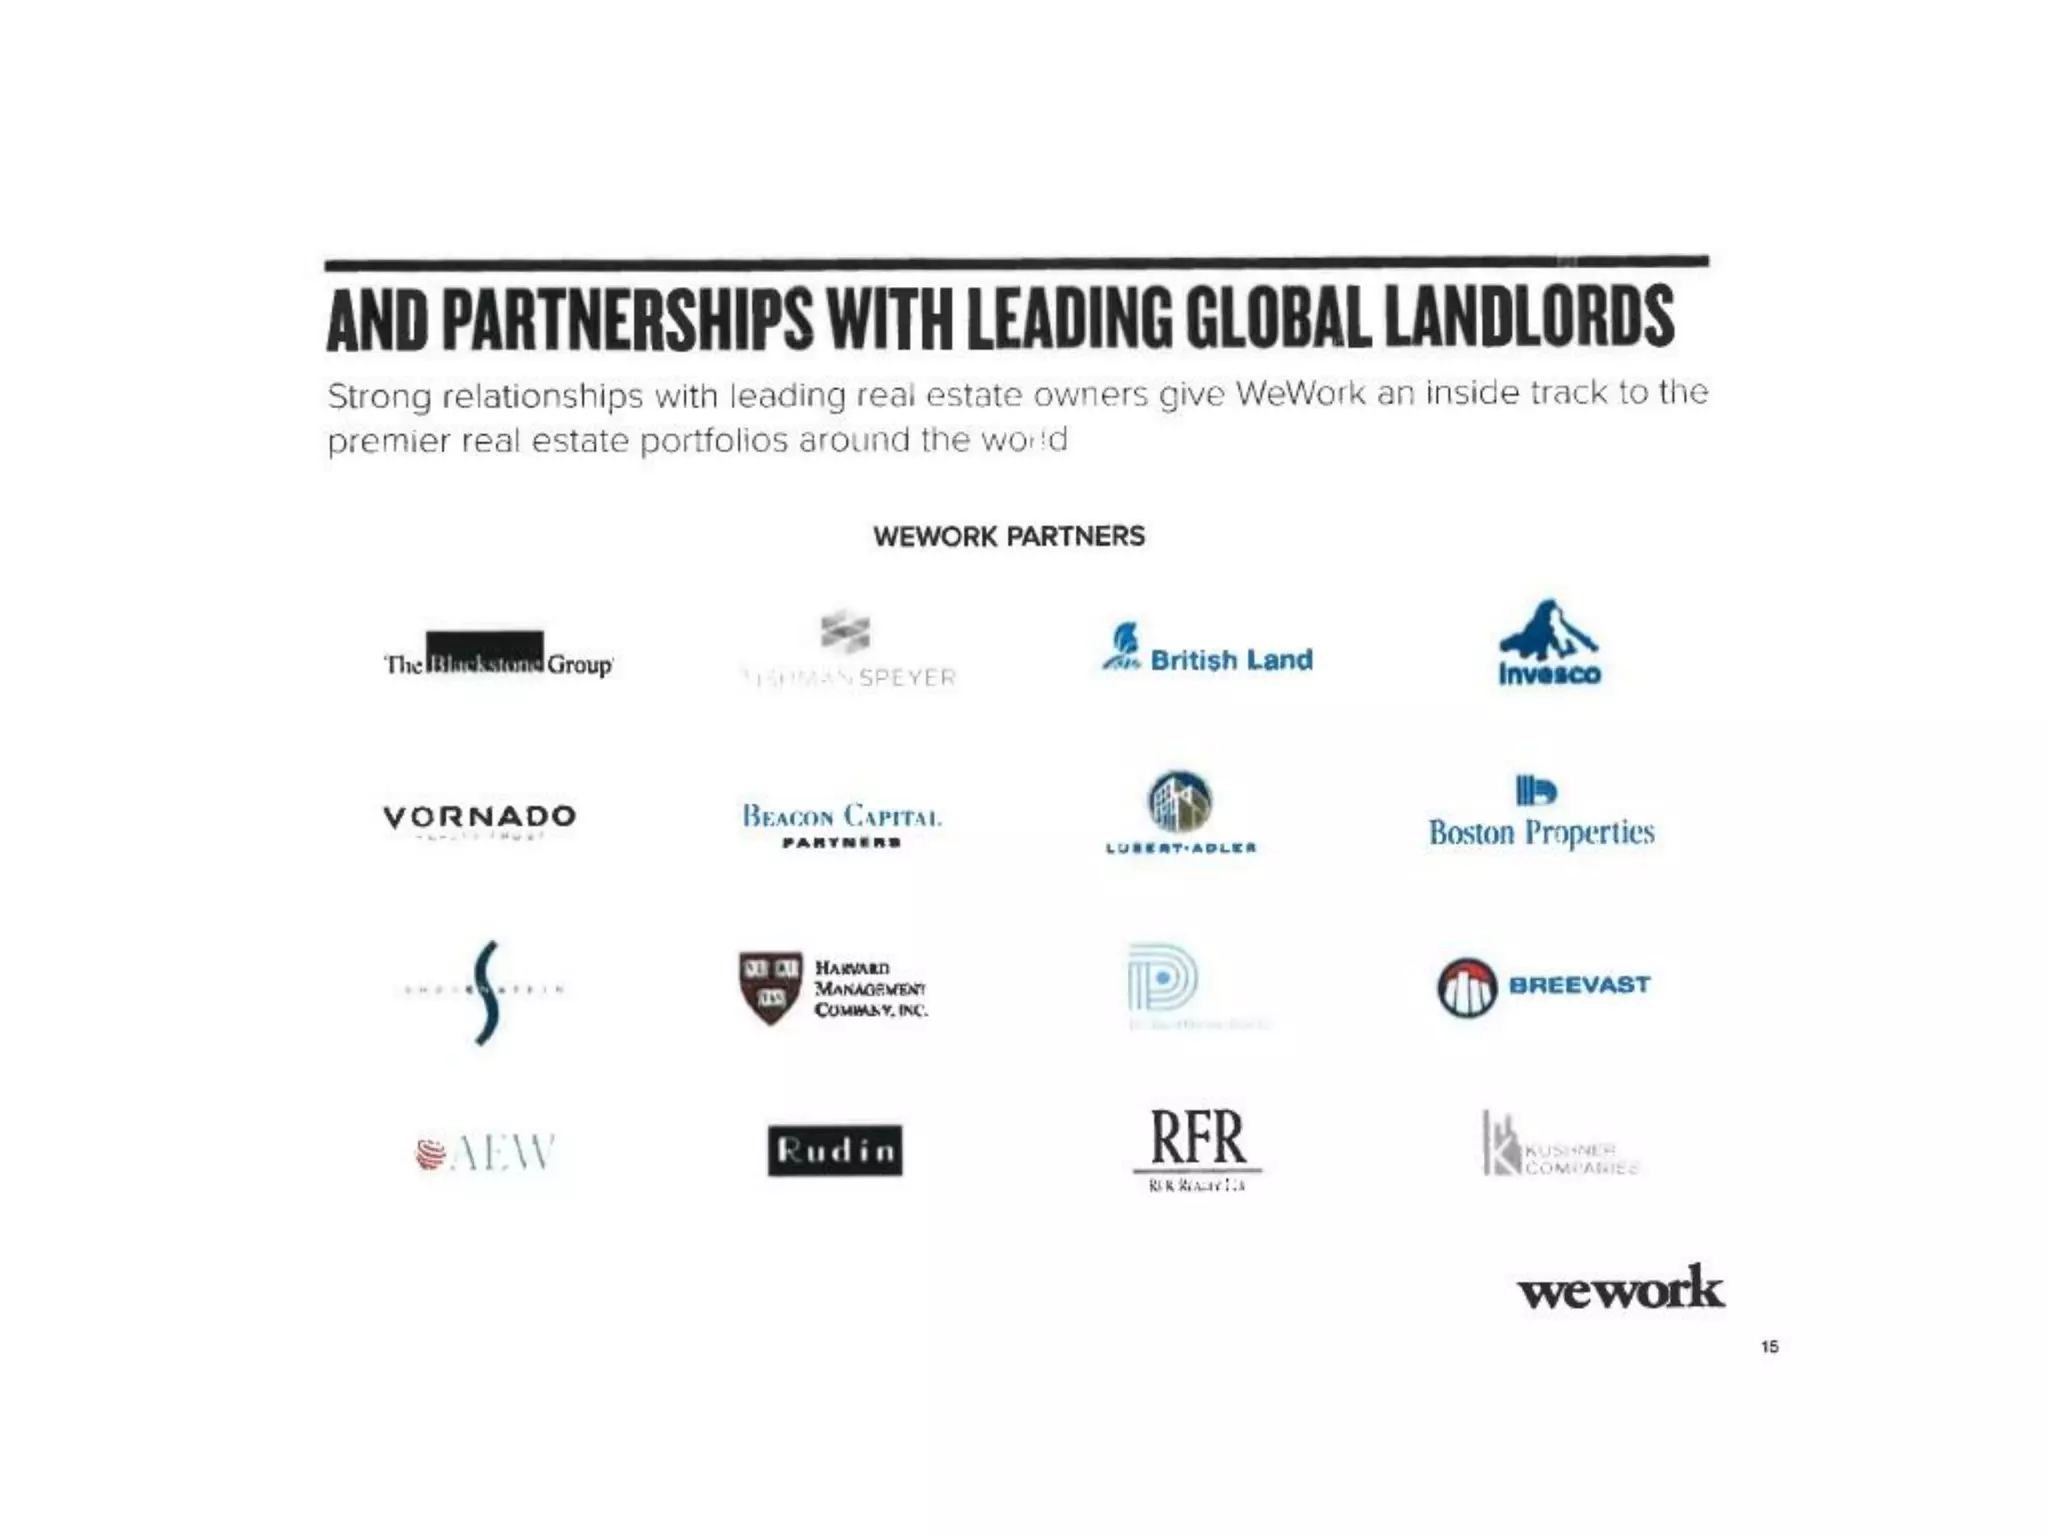
  • Partnerships: 16 major landlords (Vornado, Rudin, Boston Properties, etc.)
  • Value prop: Create value for landlords through occupancy and property appreciation
  • Co-investment: Landlords fund 50-75% of CapEx
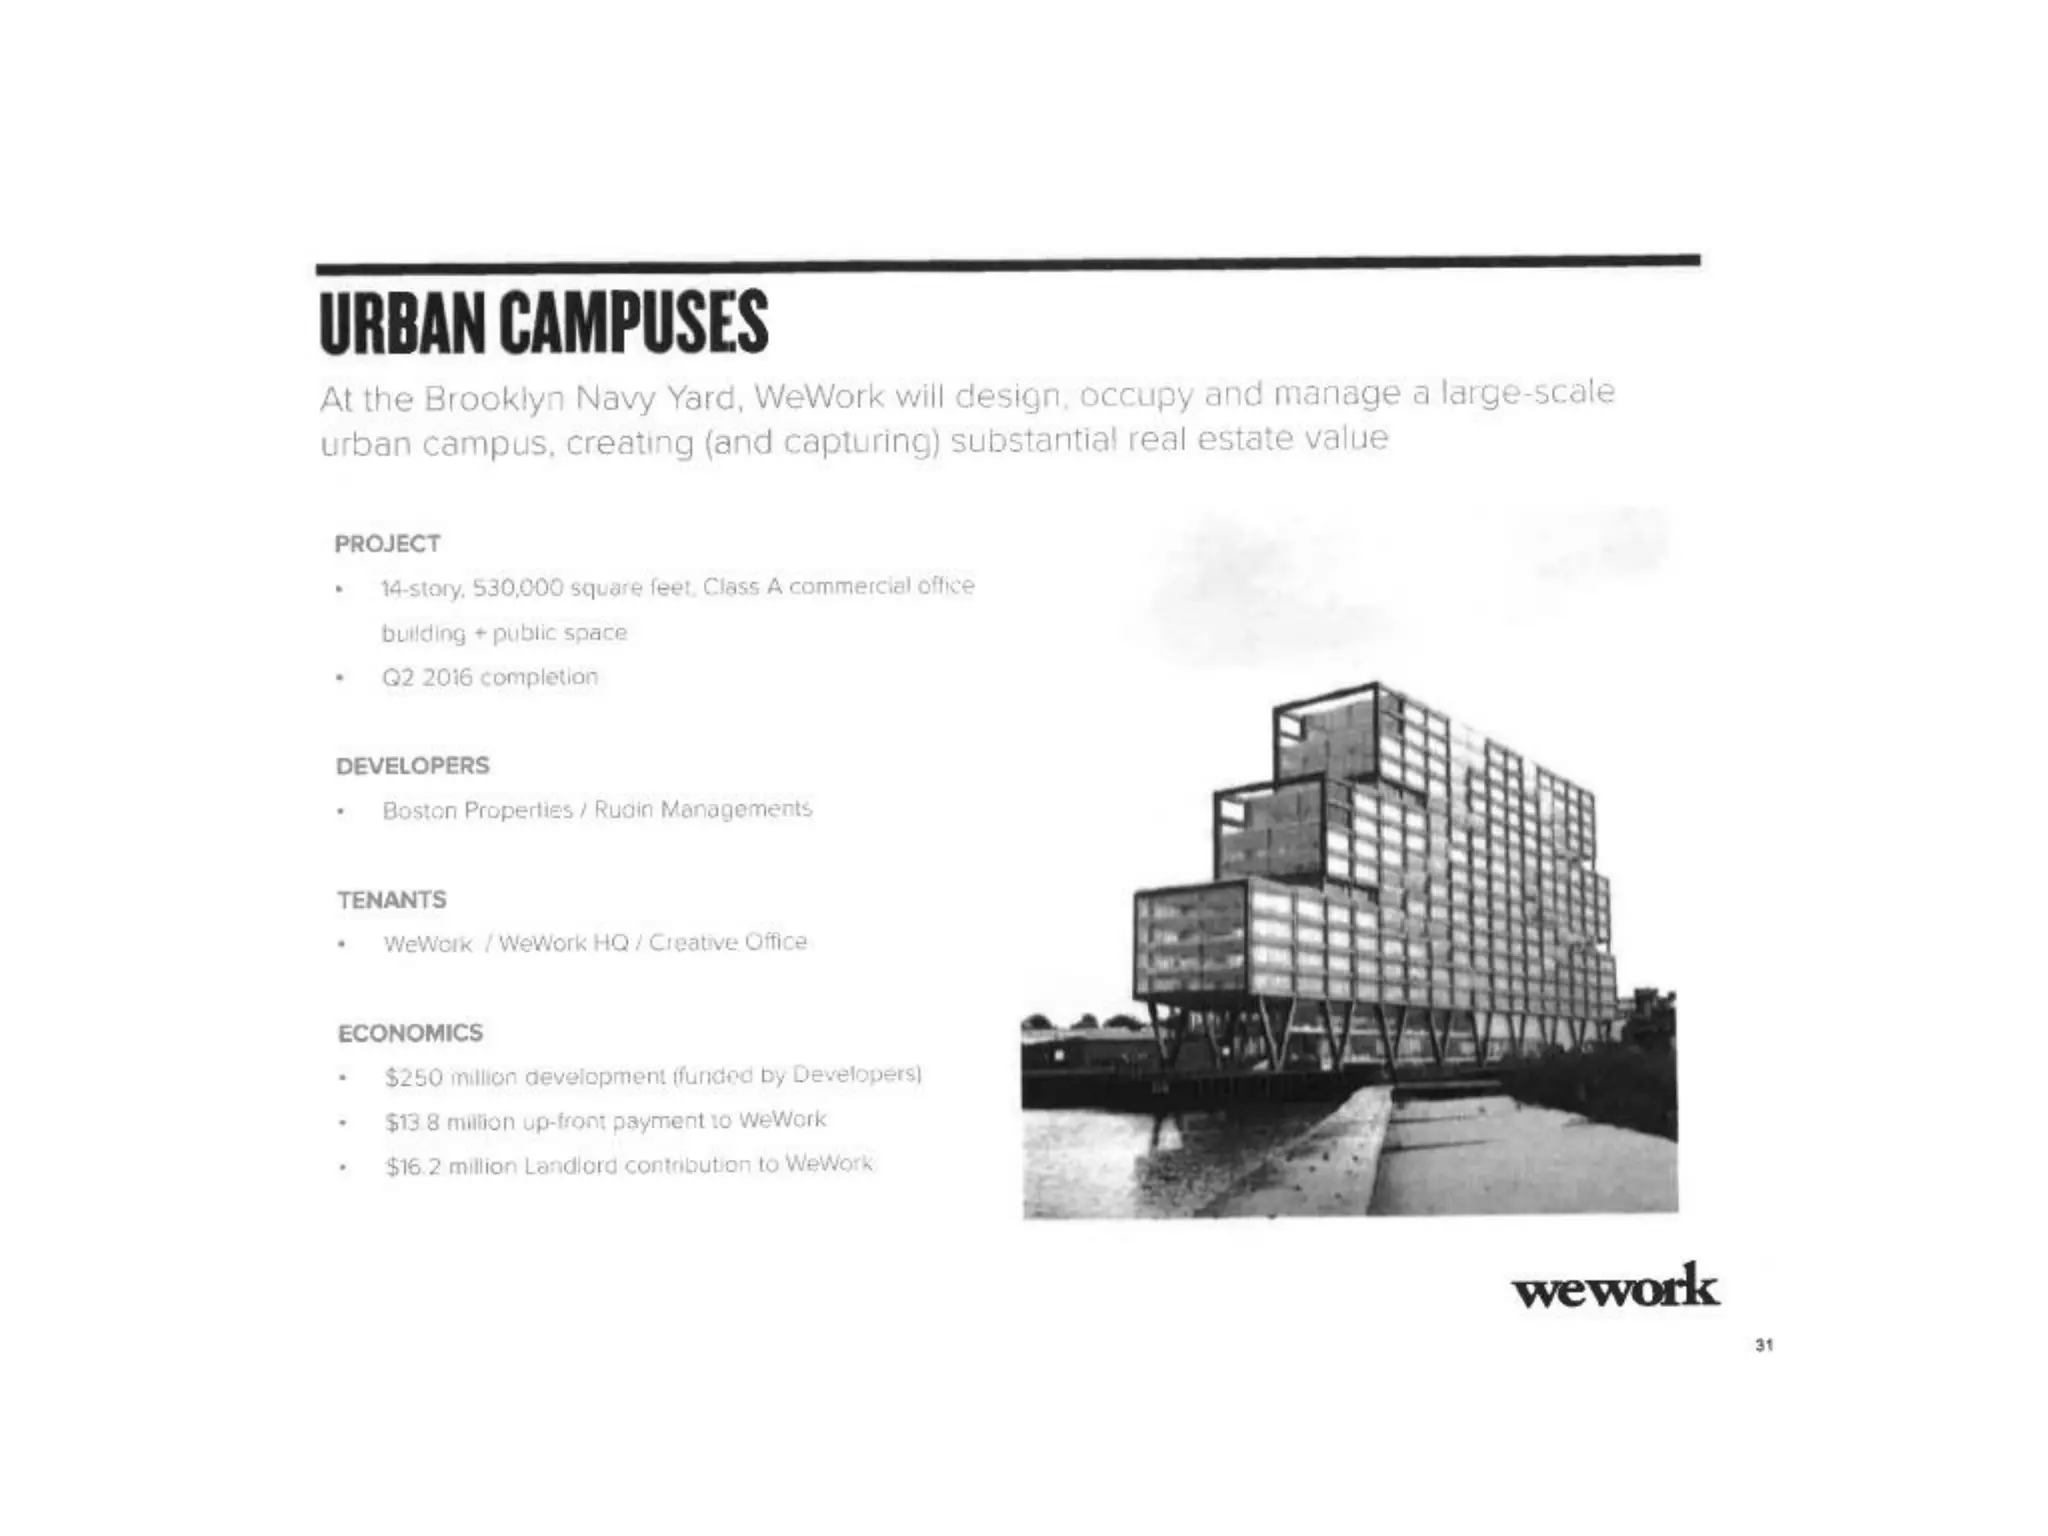
  • Mixed-use developments: Partner on large-scale projects (Brooklyn Navy Yard, 110 Wall St)

Services Monetization Strategy (Slides 24-26)

  • Phase I: Partnership agreements in place (TriNet, General Assembly, etc.)
  • Phase II: Exploration phase (additional services)
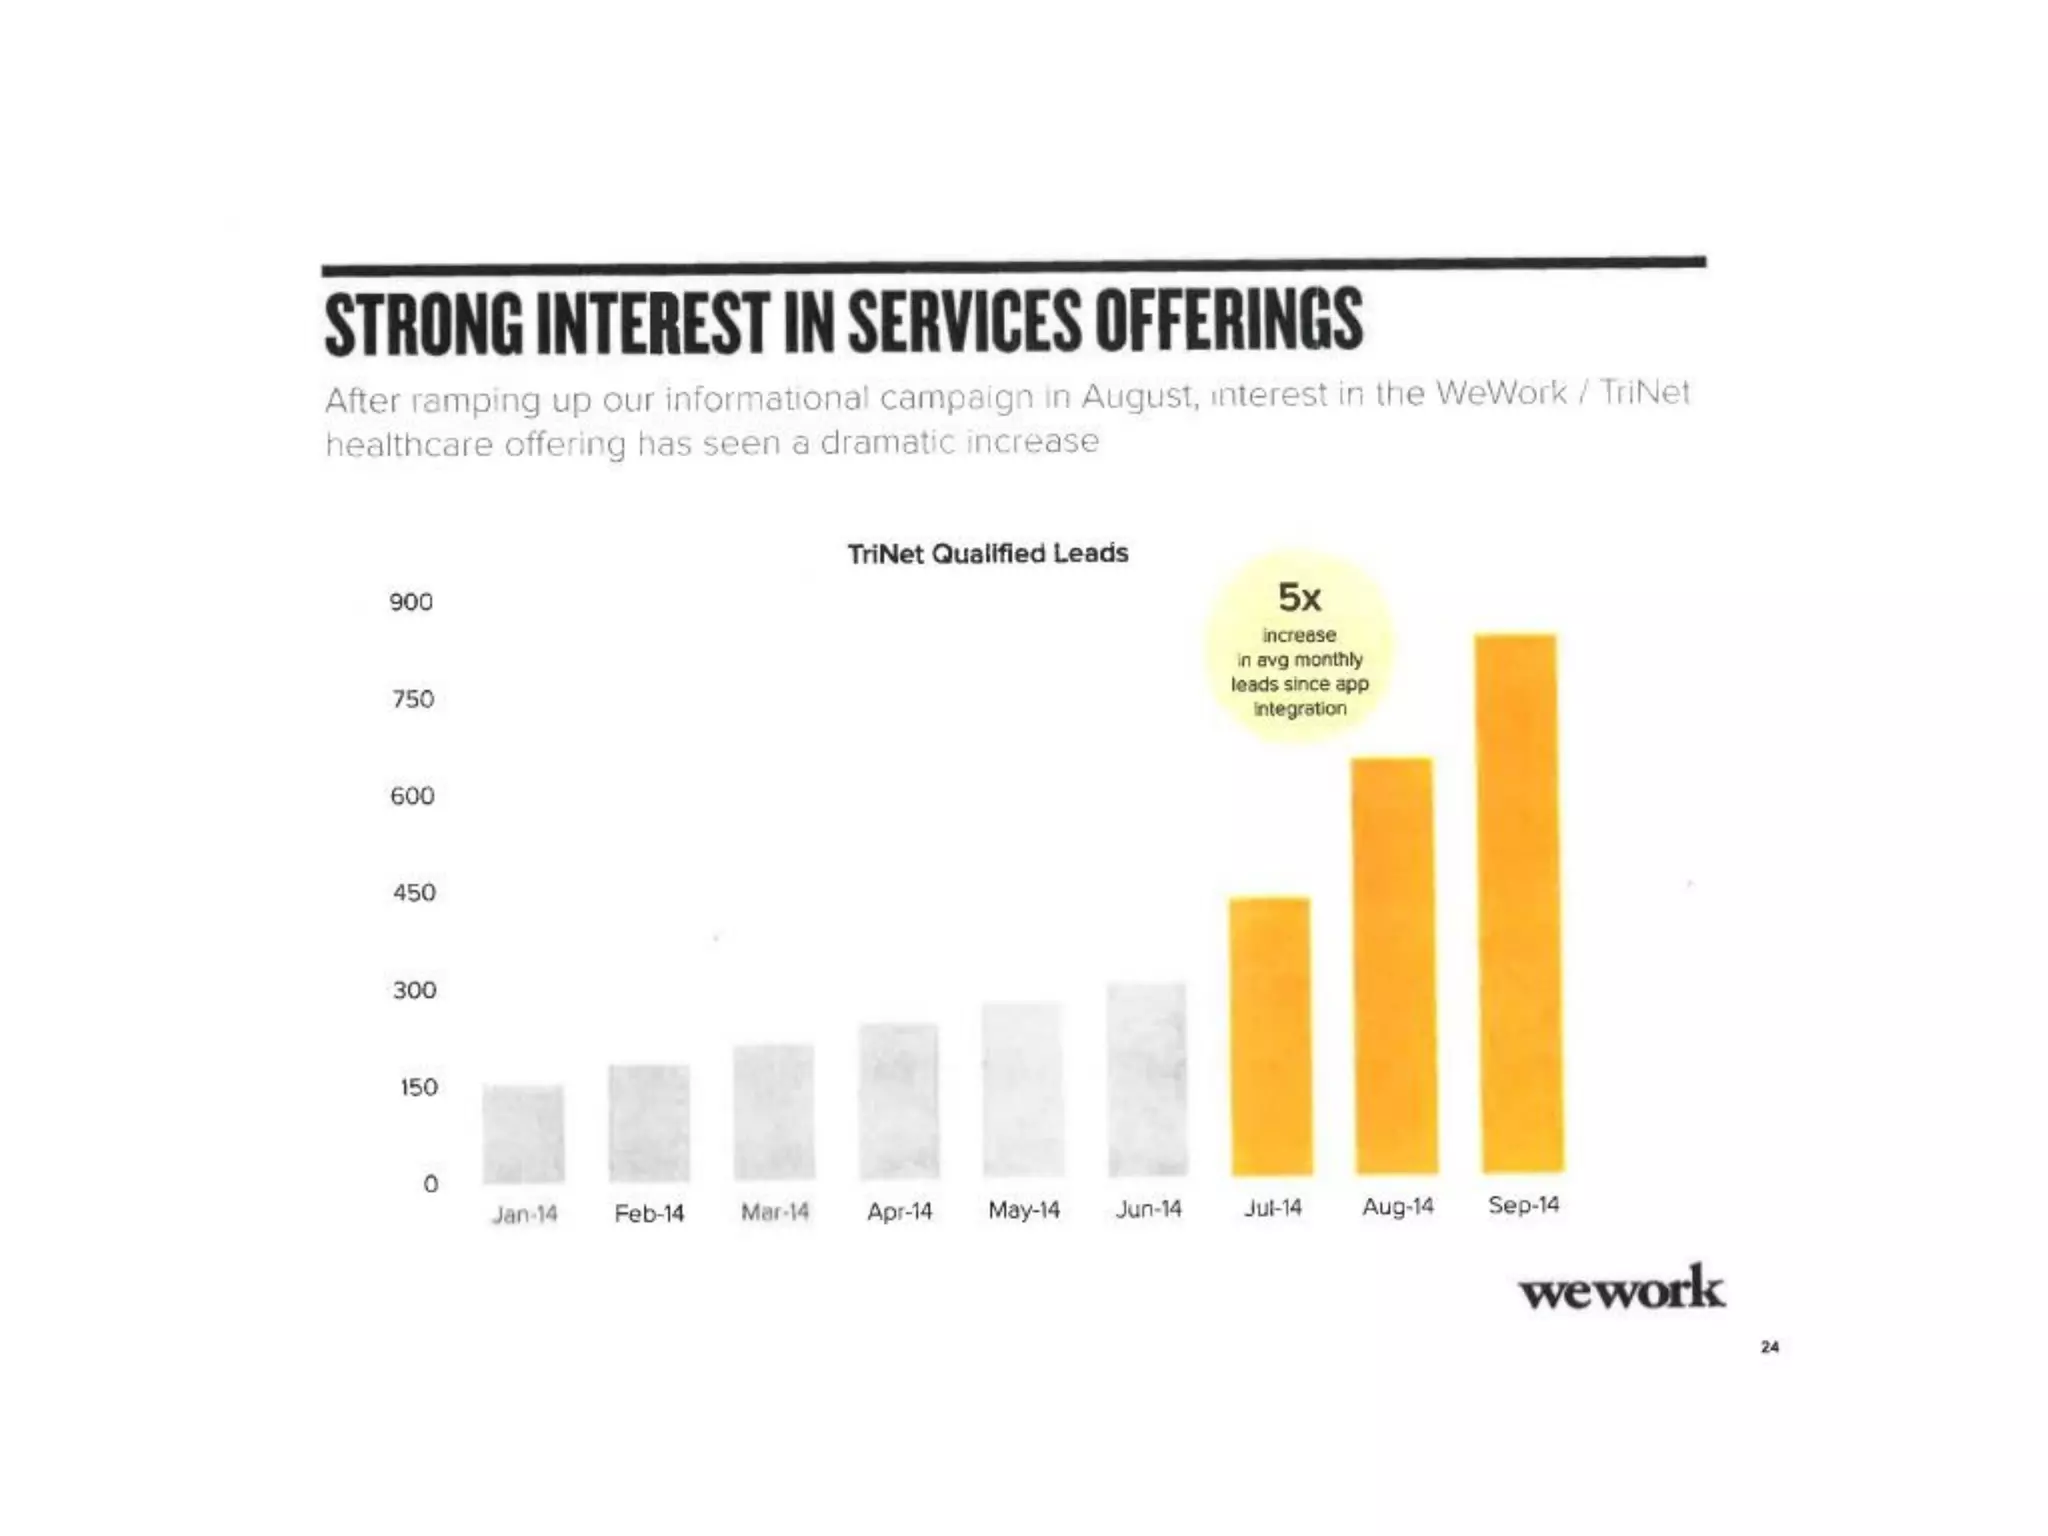
  • Marketing: Informational campaigns (TriNet healthcare saw 5x lead increase after August 2014 campaign)
  • Pricing: Services revenue projected to grow from $28 to $100/month per member

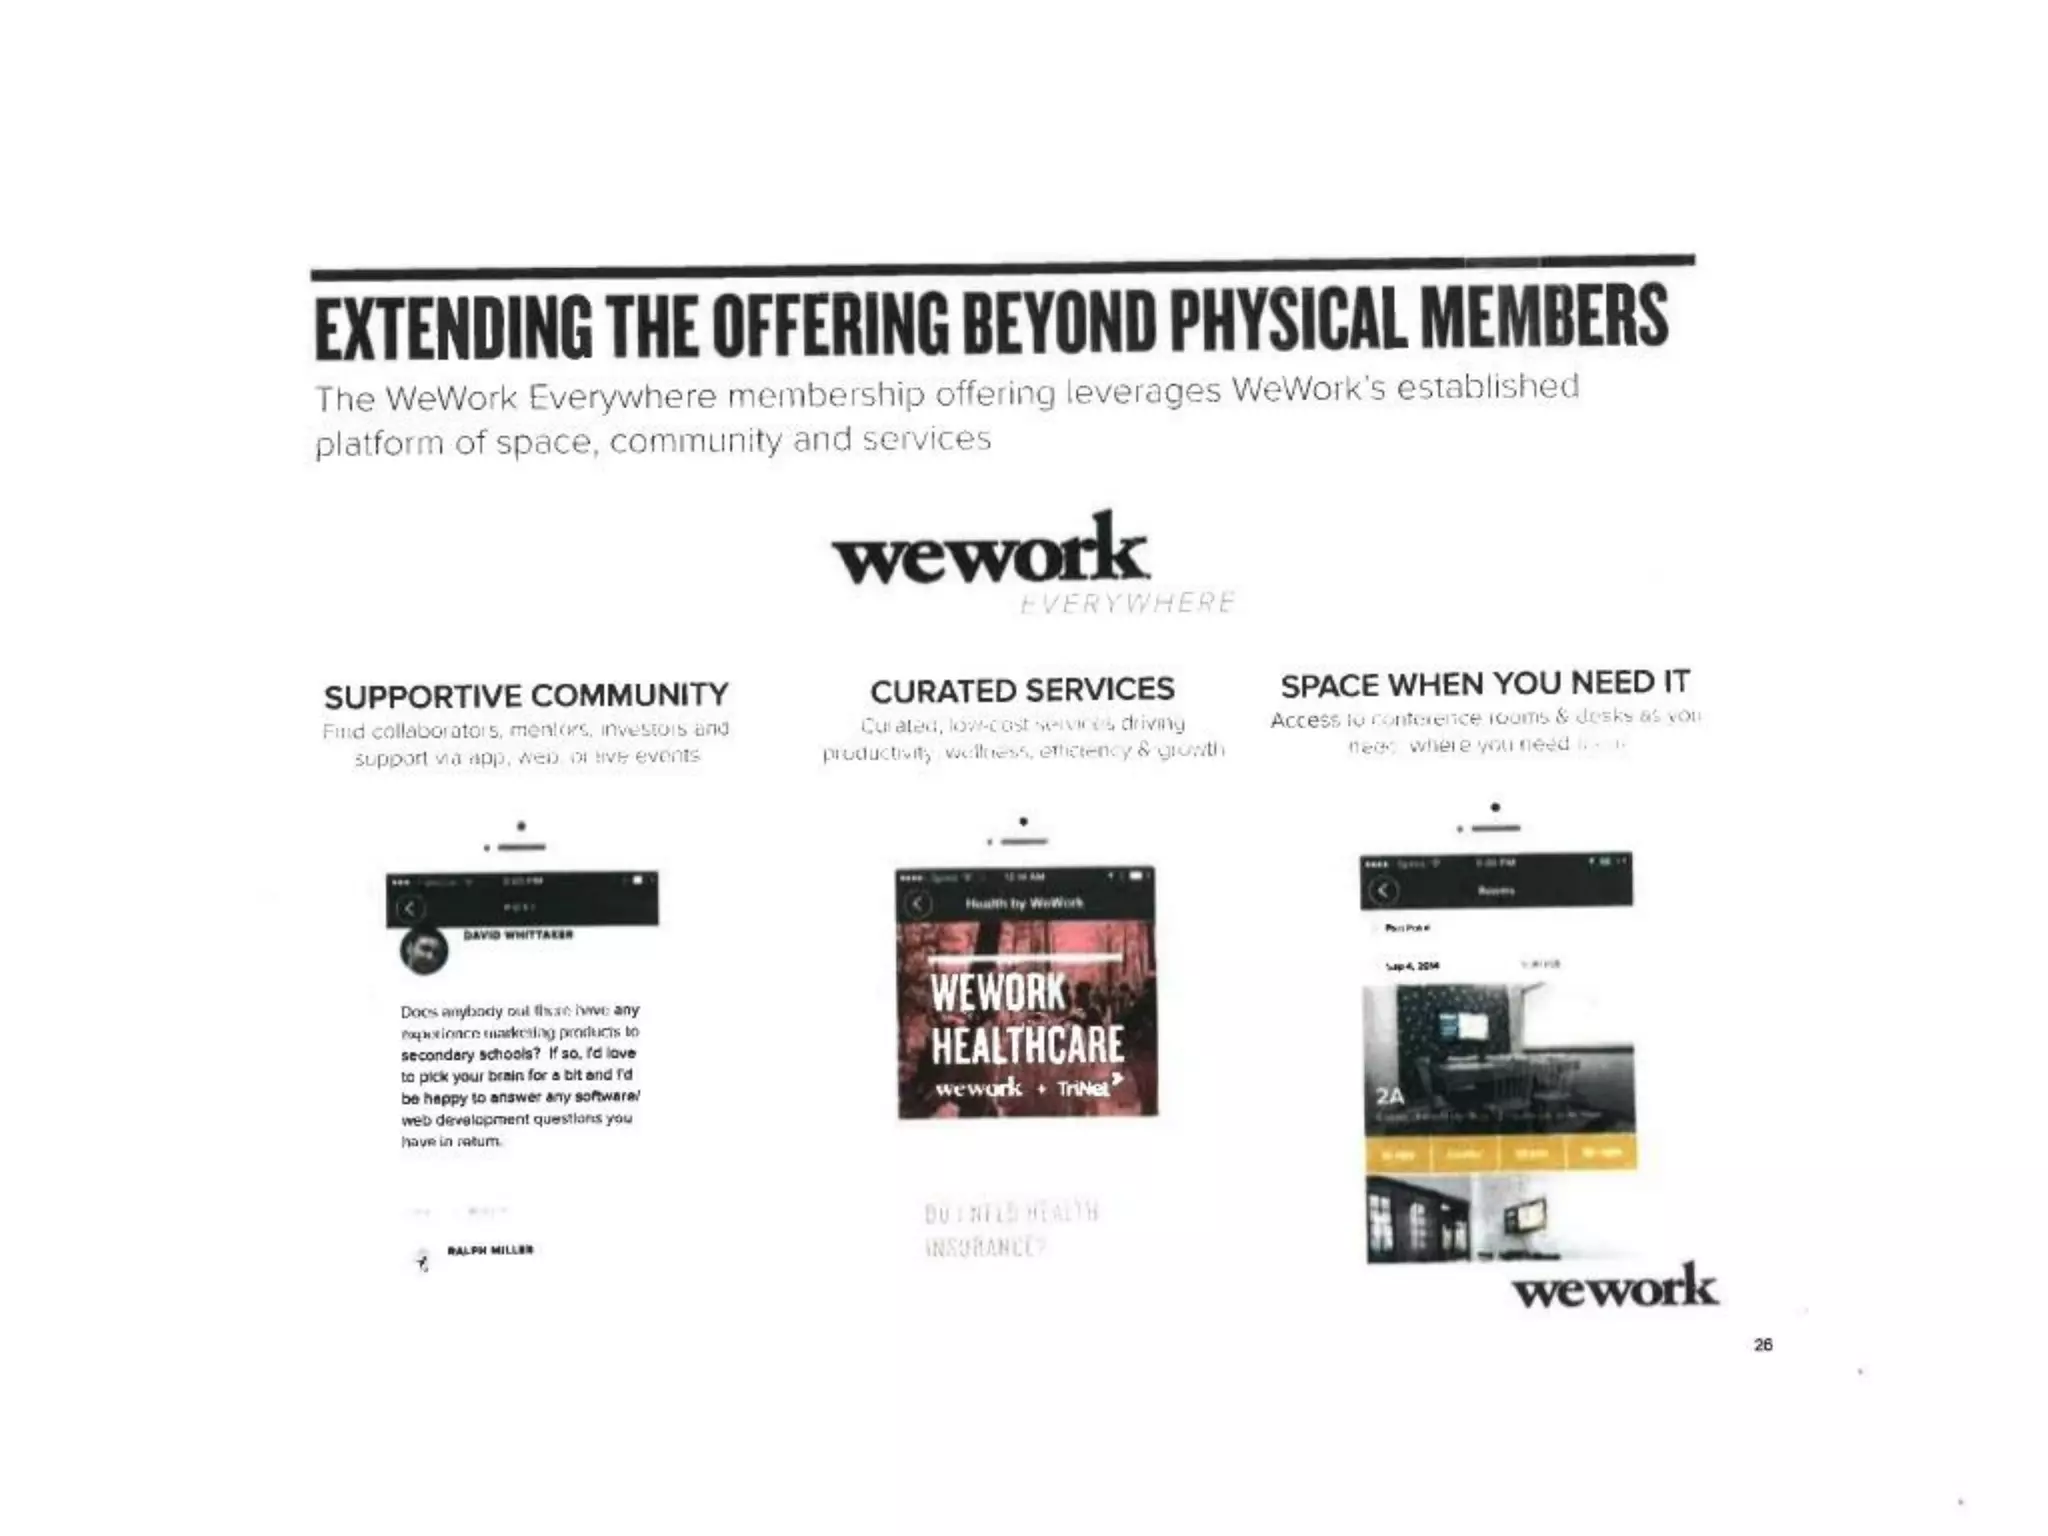
WeWork Everywhere Strategy (Slide 27)

  • Virtual membership: Community, services, and space access without physical location
  • Target: Members who want flexibility without committing to physical space
  • Pricing: Unknown (not disclosed)
  • Launch: Unknown (not disclosed)

WeLive Strategy (Slides 28-30)

  • Target: Young renters (age 18-35) seeking affordable co-living
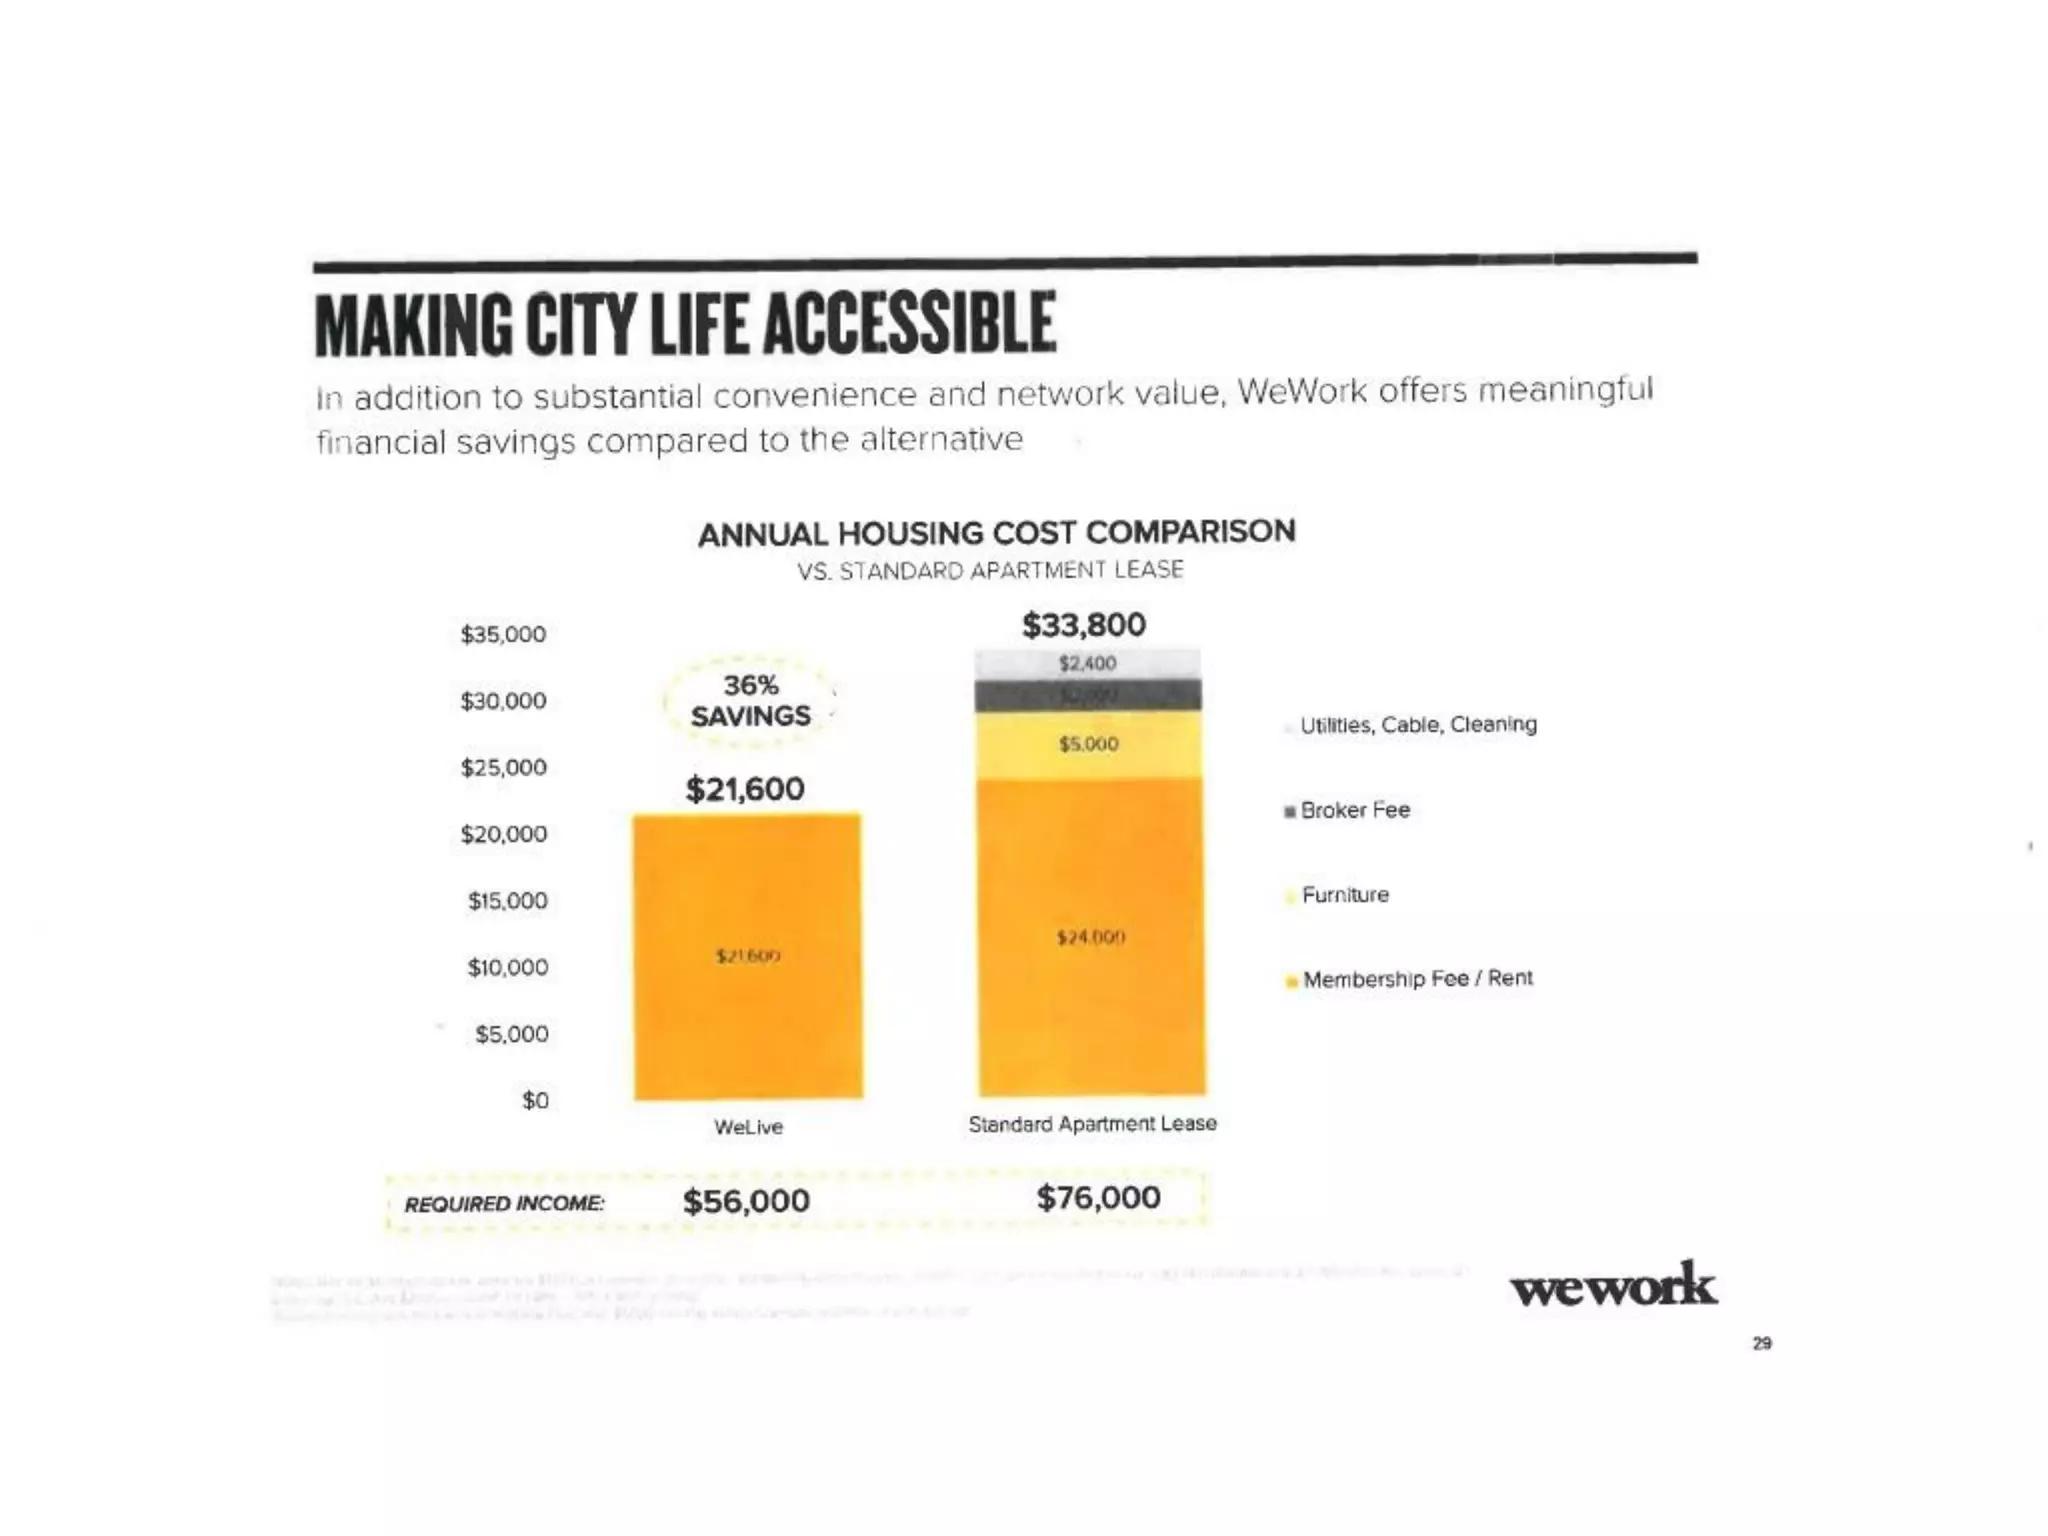
  • Pricing: $1,800/month (claimed 36% cheaper than traditional apartment)
  • Value prop: Furnished, all-inclusive, community-focused
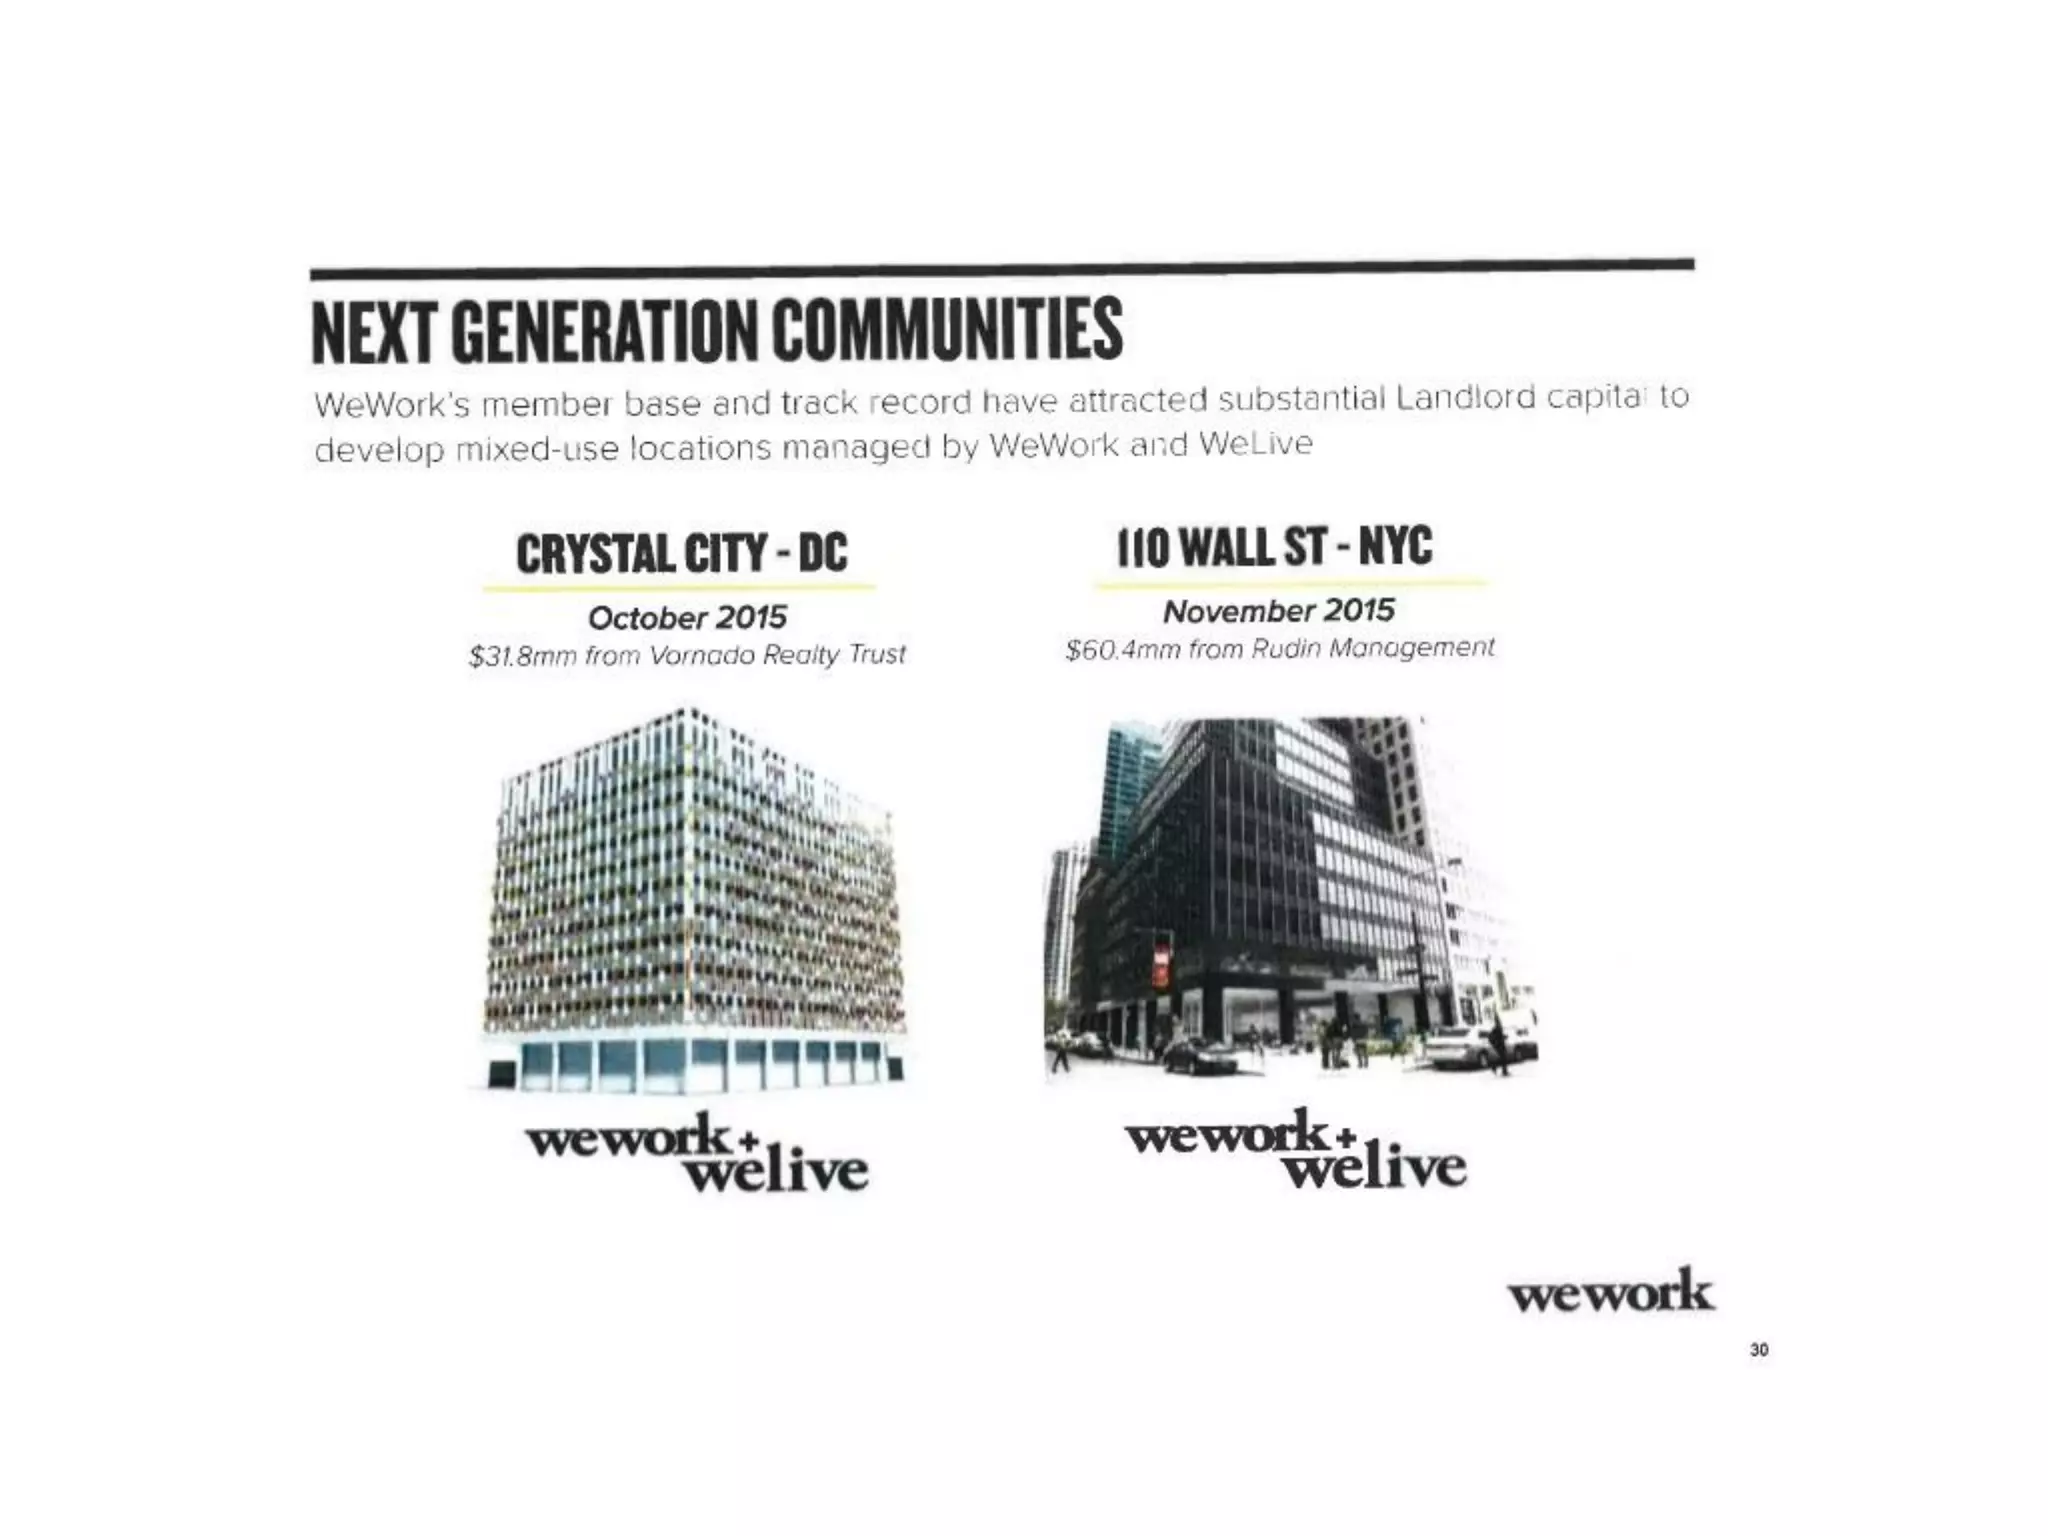
  • Locations: Mixed-use developments (Crystal City DC, 110 Wall St NYC)
  • Launch: October 2015 (Crystal City), November 2015 (110 Wall St)

Critical GTM problems:

  1. No explicit CAC or LTV metrics - can’t assess unit economics of acquisition
  2. Services adoption is low - despite 12 partnerships, only $28/month per member
  3. App adoption is low - only 45% of members use app monthly
  4. Member churn is not disclosed - can’t assess sustainability
  5. International expansion is failing - only 4% of members are international

The Ask

What WeWork was raising (Slide 34 context):

Series D Funding

  • Amount: $335M
  • Valuation: Implied $10B+ (based on growth projections)
  • Use of funds: Not explicitly stated, but implied from context:
    • Location expansion (80 locations by 2016)
    • WeLive development (residential co-living)
    • WeWork Everywhere launch (virtual membership)
    • Urban campus development (Brooklyn Navy Yard, etc.)
    • Working capital and operations

Capital Requirements (Estimated from data)

  • CapEx per location: $1-2M (estimated from Slide 18 data)
  • For 60 new locations: $60-120M
  • For WeLive expansion: $50-100M (estimated)
  • For urban campuses: $50-100M (landlord-funded, but WeWork contribution unknown)
  • Working capital and overhead: $50-100M

Total estimated capital need: $210-420M (Series D of $335M is in this range)

Use of Funds (Implied)

  1. Location expansion: Primary use (60+ new WeWork locations)
  2. WeLive development: Secondary use (residential co-living spaces)
  3. WeWork Everywhere: Tertiary use (virtual membership platform)
  4. Urban campuses: Landlord-funded, but WeWork contribution unknown
  5. Working capital: Operations, marketing, overhead

Investor Deep Dive

Executive summary, strengths & red flags

Executive Summary

WeWork's Series D pitch deck presents a compelling narrative of a "tech-enabled real estate platform" disrupting the commercial office market through a "Space as a Service" model, claiming 109% member CAGR, 41% unit EBITDA margins, and a path to $2.9B revenue by 2018. However, beneath the polished presentation lies a capital-intensive real estate arbitrage business with extreme landlord concentration (51% from single landlord), declining pricing power, weak community engagement (45% app adoption), and unrealistic financial projections that assume 38x revenue growth, multiple simultaneous business successes, and margin expansion contradicted by historical data. The deck is designed to position WeWork as a defensible tech company when it is fundamentally a real estate company dependent on landlord capital, vulnerable to economic cycles, and led by an inexperienced first-time CEO attempting to execute three separate businesses (WeWork, WeLive, WeWork Everywhere) simultaneously.

More Pitch Decks To Study

Compare structure, fundraising context, and investor-facing story across similar startup decks.