Compare your deck to Theranos

Compare Your Deck
Cautionary Tale

Theranos Pitch Deck (2006)

Cautionary Tales
Stage: Series C
Raised: $28.5M+
Year: 2006
Slides: 24
Outcome: FAILED - Fraud, dissolved

Pitch Deck

1 / 24
Theranos pitch deck - The Opening: Clear branding and investor framing
Click to expand

Deck Analysis

This deck is Theranos's Series C investor presentation from 2006. It presents a bold vision: a low-volume blood-testing cartridge and reader plus an informatics backend to enable real-time drug monitoring and post-prescription patient management. The slides mix product imagery, performance claims, clinical use-cases and large market estimates to make a fast, venture-friendly story — notable both for how convincingly it packaged a complex technology for investors and, retrospectively, for how many high‑impact claims went insufficiently substantiated before massive capital was raised and the company ultimately failed amid fraud allegations.

The Opening: Clear branding and investor framing

The Opening: Clear branding and investor framing

Slide 1 is the simple cover page with the Theranos logo, the phrase 'A Presentation For Investors' and a date (June 1, 2006). It’s minimal and professional, immediately signaling the audience and purpose. For investors, this sets expectations: a focused pitch, not a product brochure. The design is clean and unobtrusive, which helps direct attention to the name and the ask that follows.

Key Takeaway: Start with a clean, audience-specific cover that signals purpose and date — small details build credibility.
Company overview and go-to-market focus

Company overview and go-to-market focus

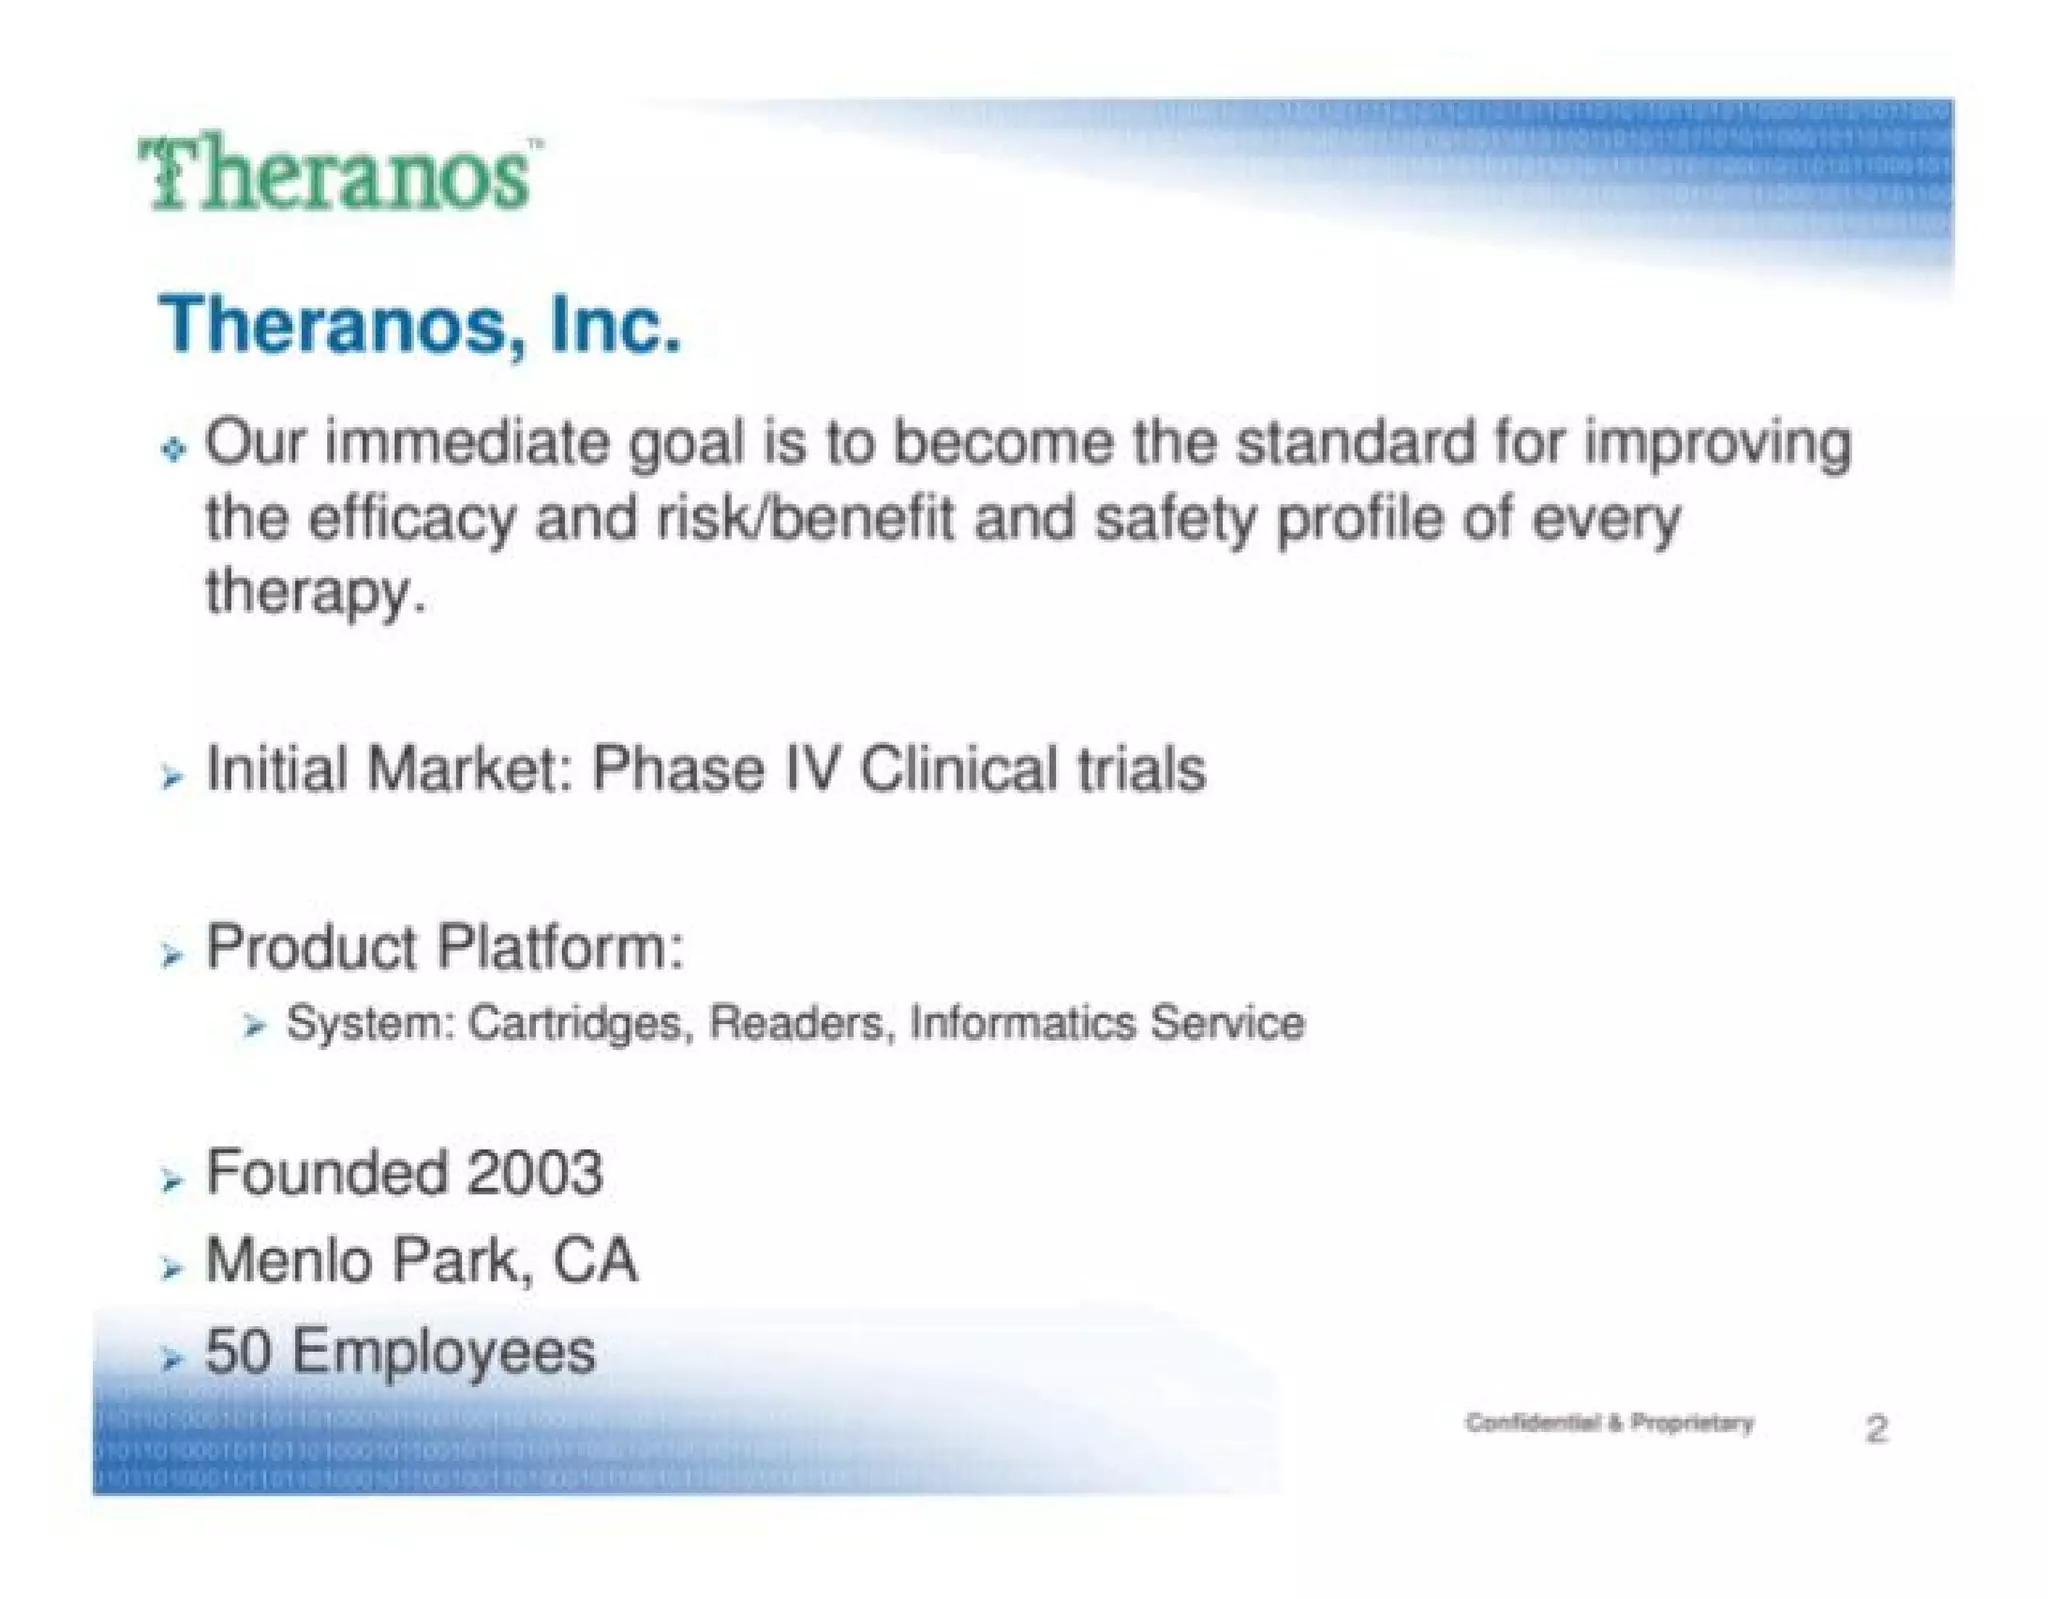
Slide 2 lays out the company's immediate goal, initial market (Phase IV clinical trials), product platform (cartridges, readers, informatics) and basic company facts (founded 2003, Menlo Park, 50 employees). This is effective because it quickly answers the who/what/where/why that investors want and ties the technology to a specific commercial entry point (post-marketing clinical trials) rather than an abstract 'healthcare' promise. Framing the initial market narrowly helps investors assess near-term traction potential and the revenue model.

Key Takeaway: Define a realistic initial beachhead market and explain the product components that map directly to that market.
Team slide: show depth but avoid vague credentials

Team slide: show depth but avoid vague credentials

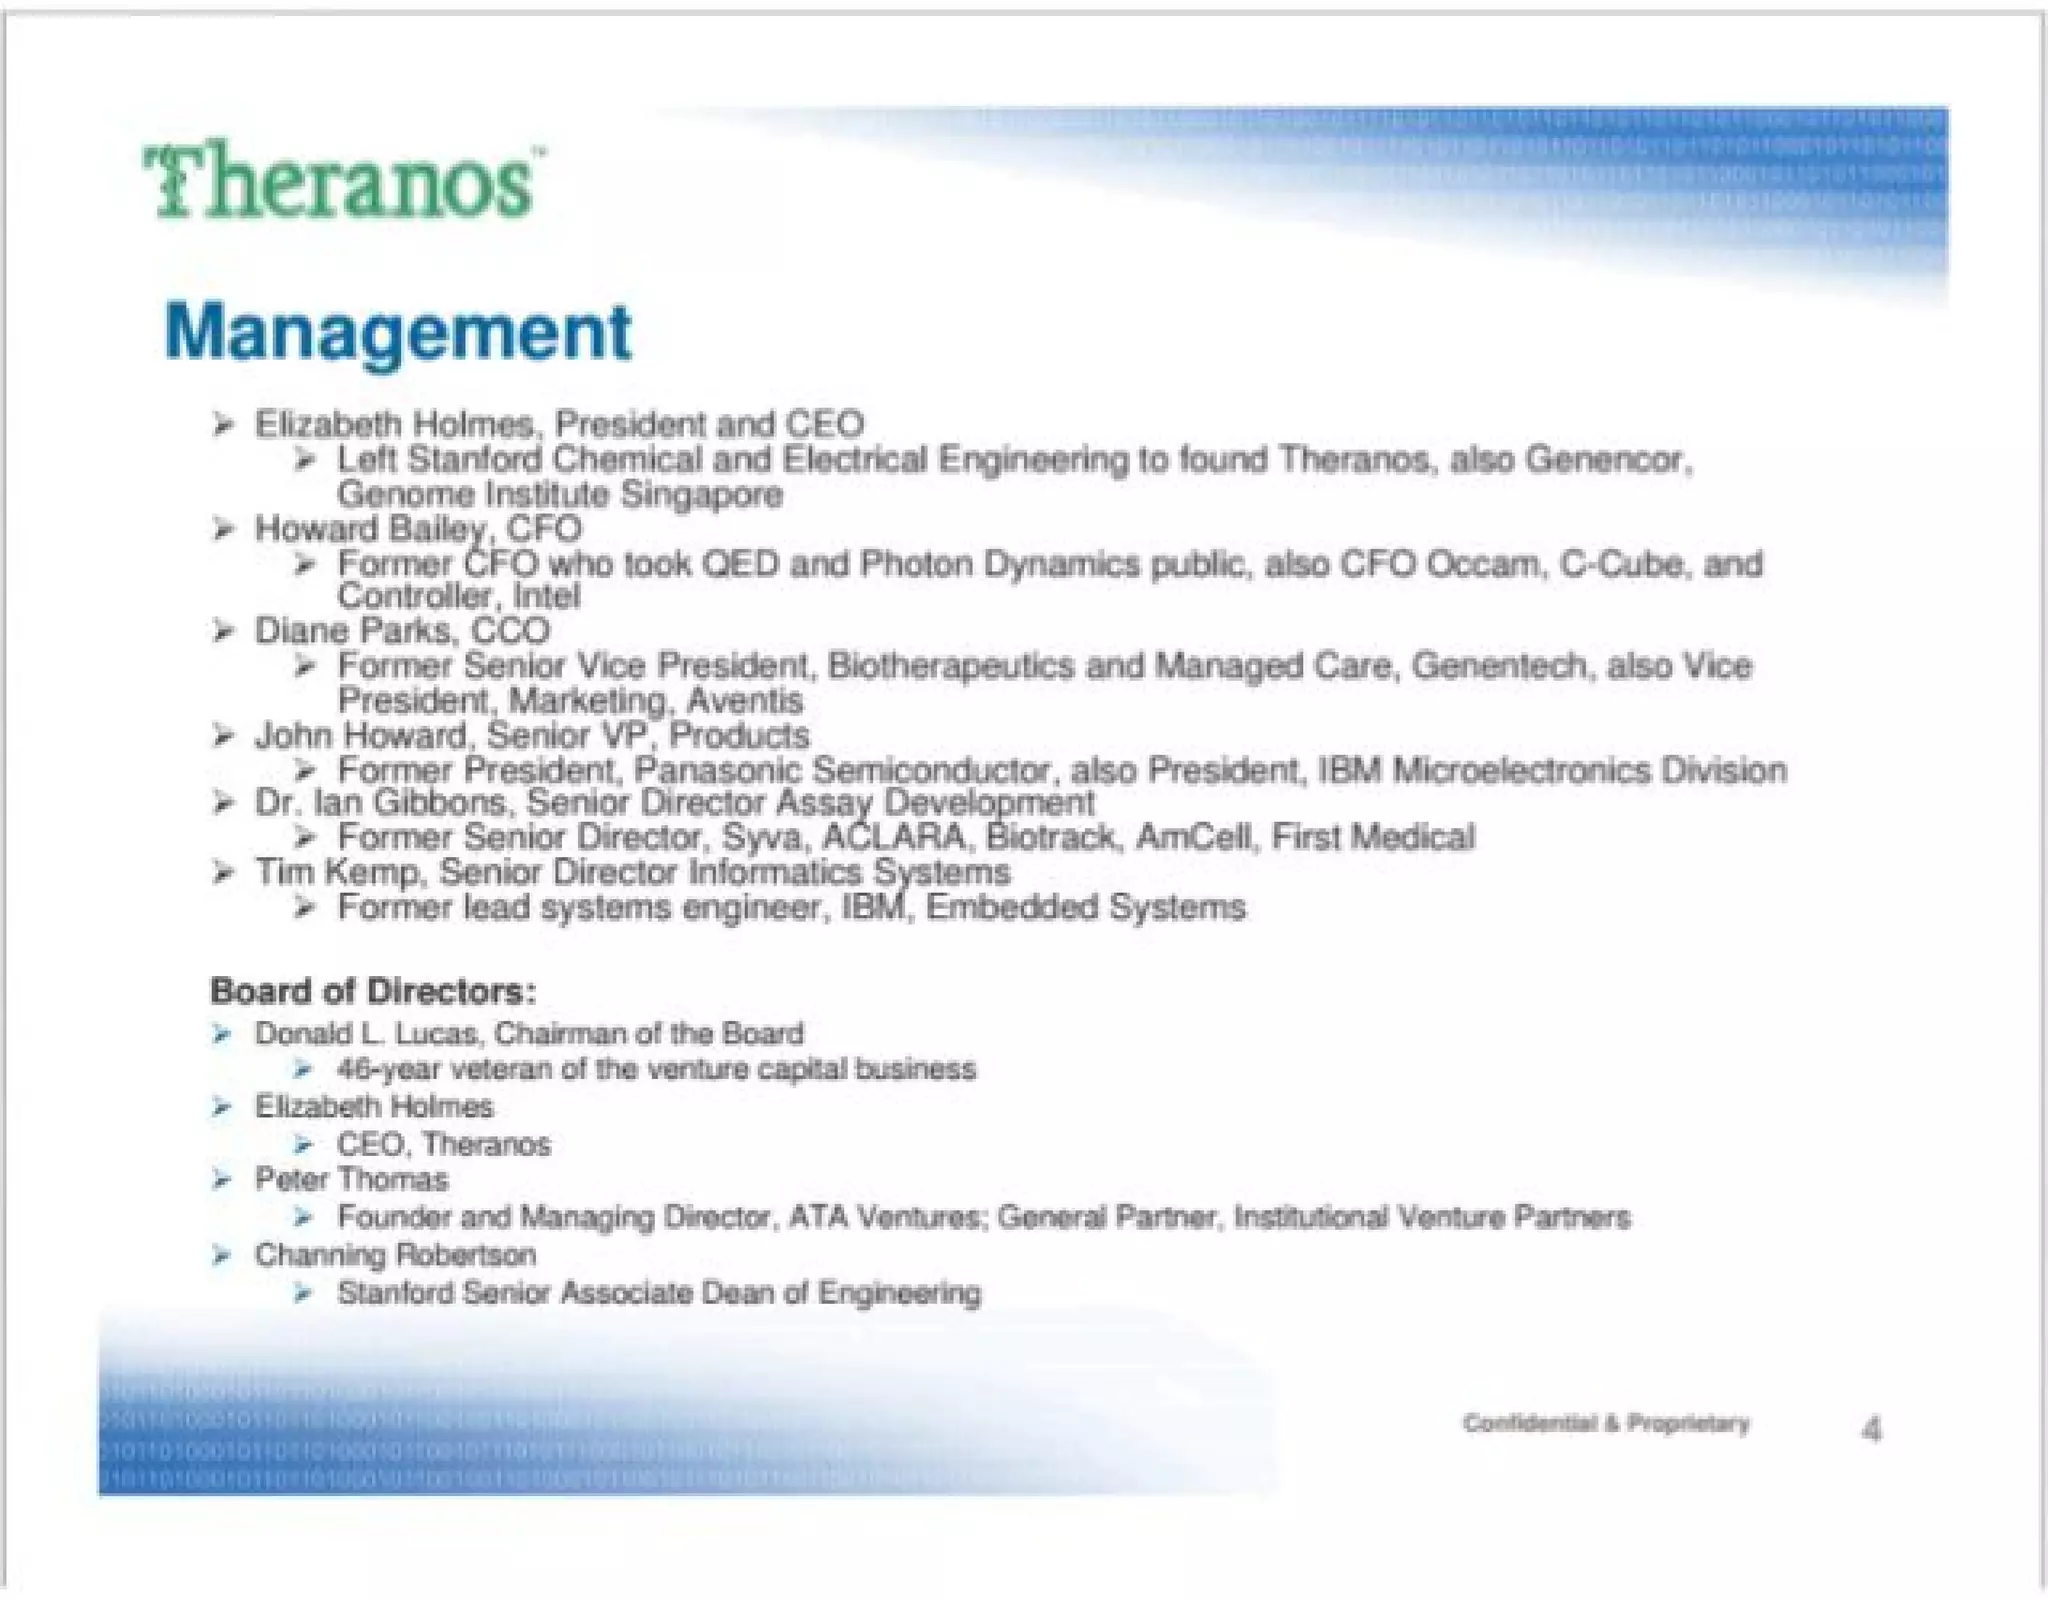
Slide 4 (Management) lists leadership and board members with short bios and past affiliations. It attempts to reassure investors by mixing industry veterans and technical leads. A strong team slide pairs relevant experience with clear roles; investors look for operational and scientific credibility. Theranos’s slide shows that principle: it highlights executives with prior exits and big-company experience to suggest the capacity to scale.

Key Takeaway: List leaders and board members with concise, relevant credentials and quantifiable achievements to give investors confidence — but also ensure governance and transparent validation.
Product visuals and the ‘what is our system’ story

Product visuals and the ‘what is our system’ story

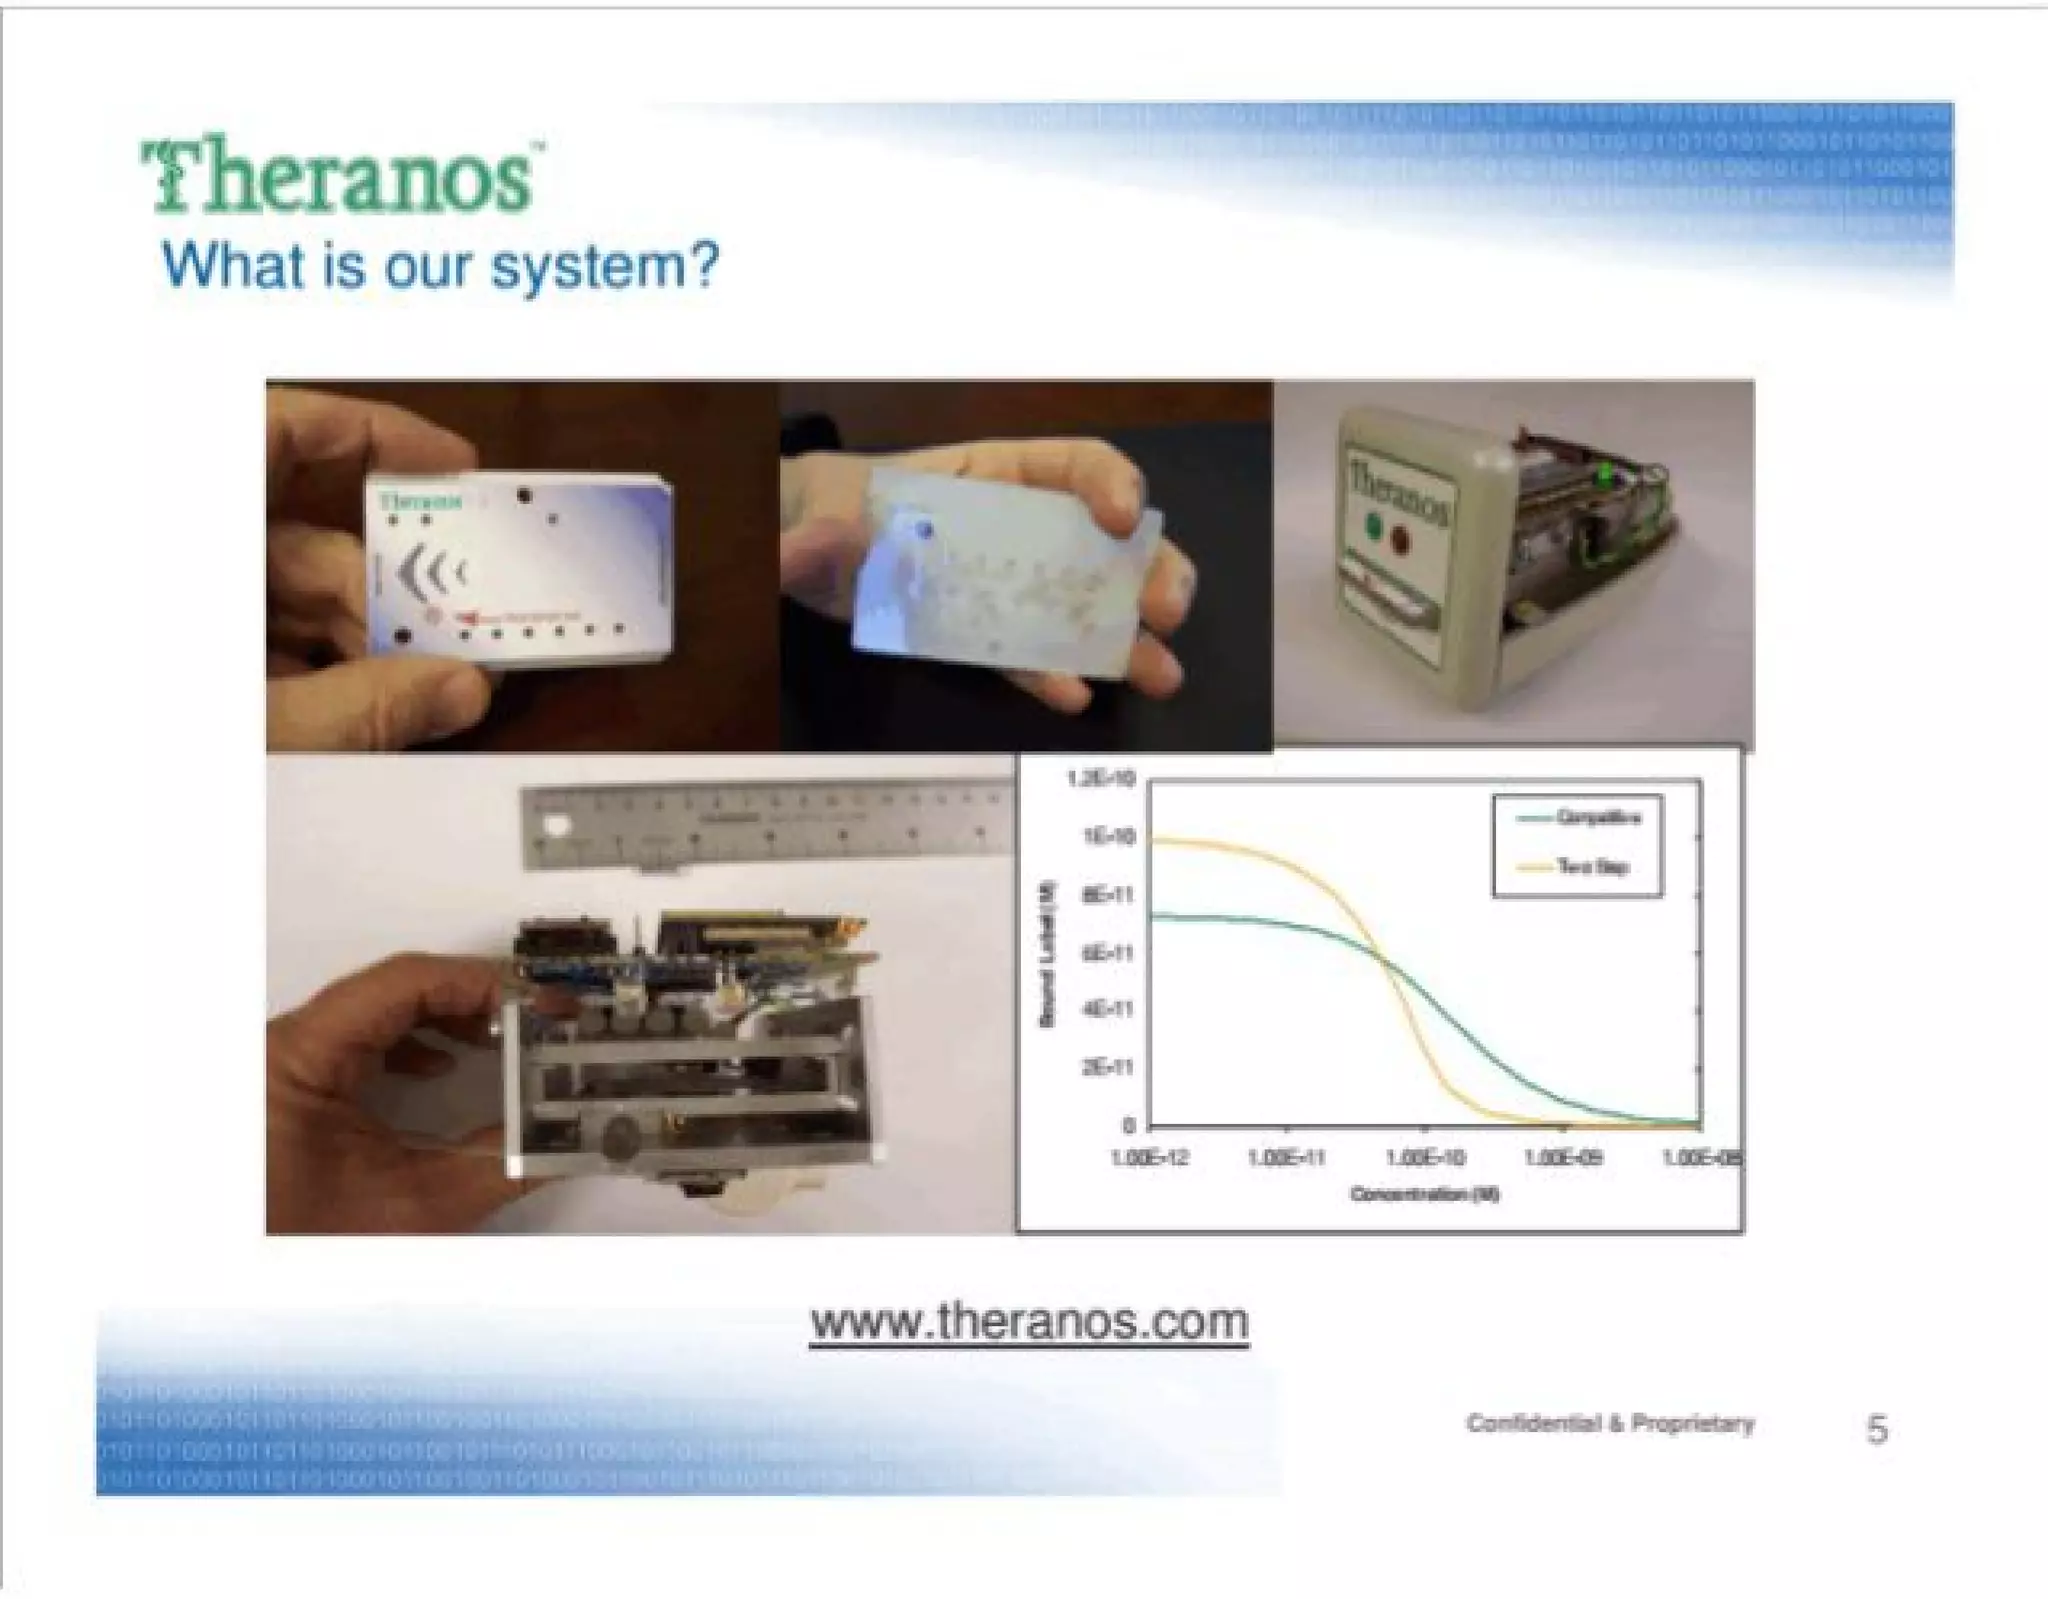
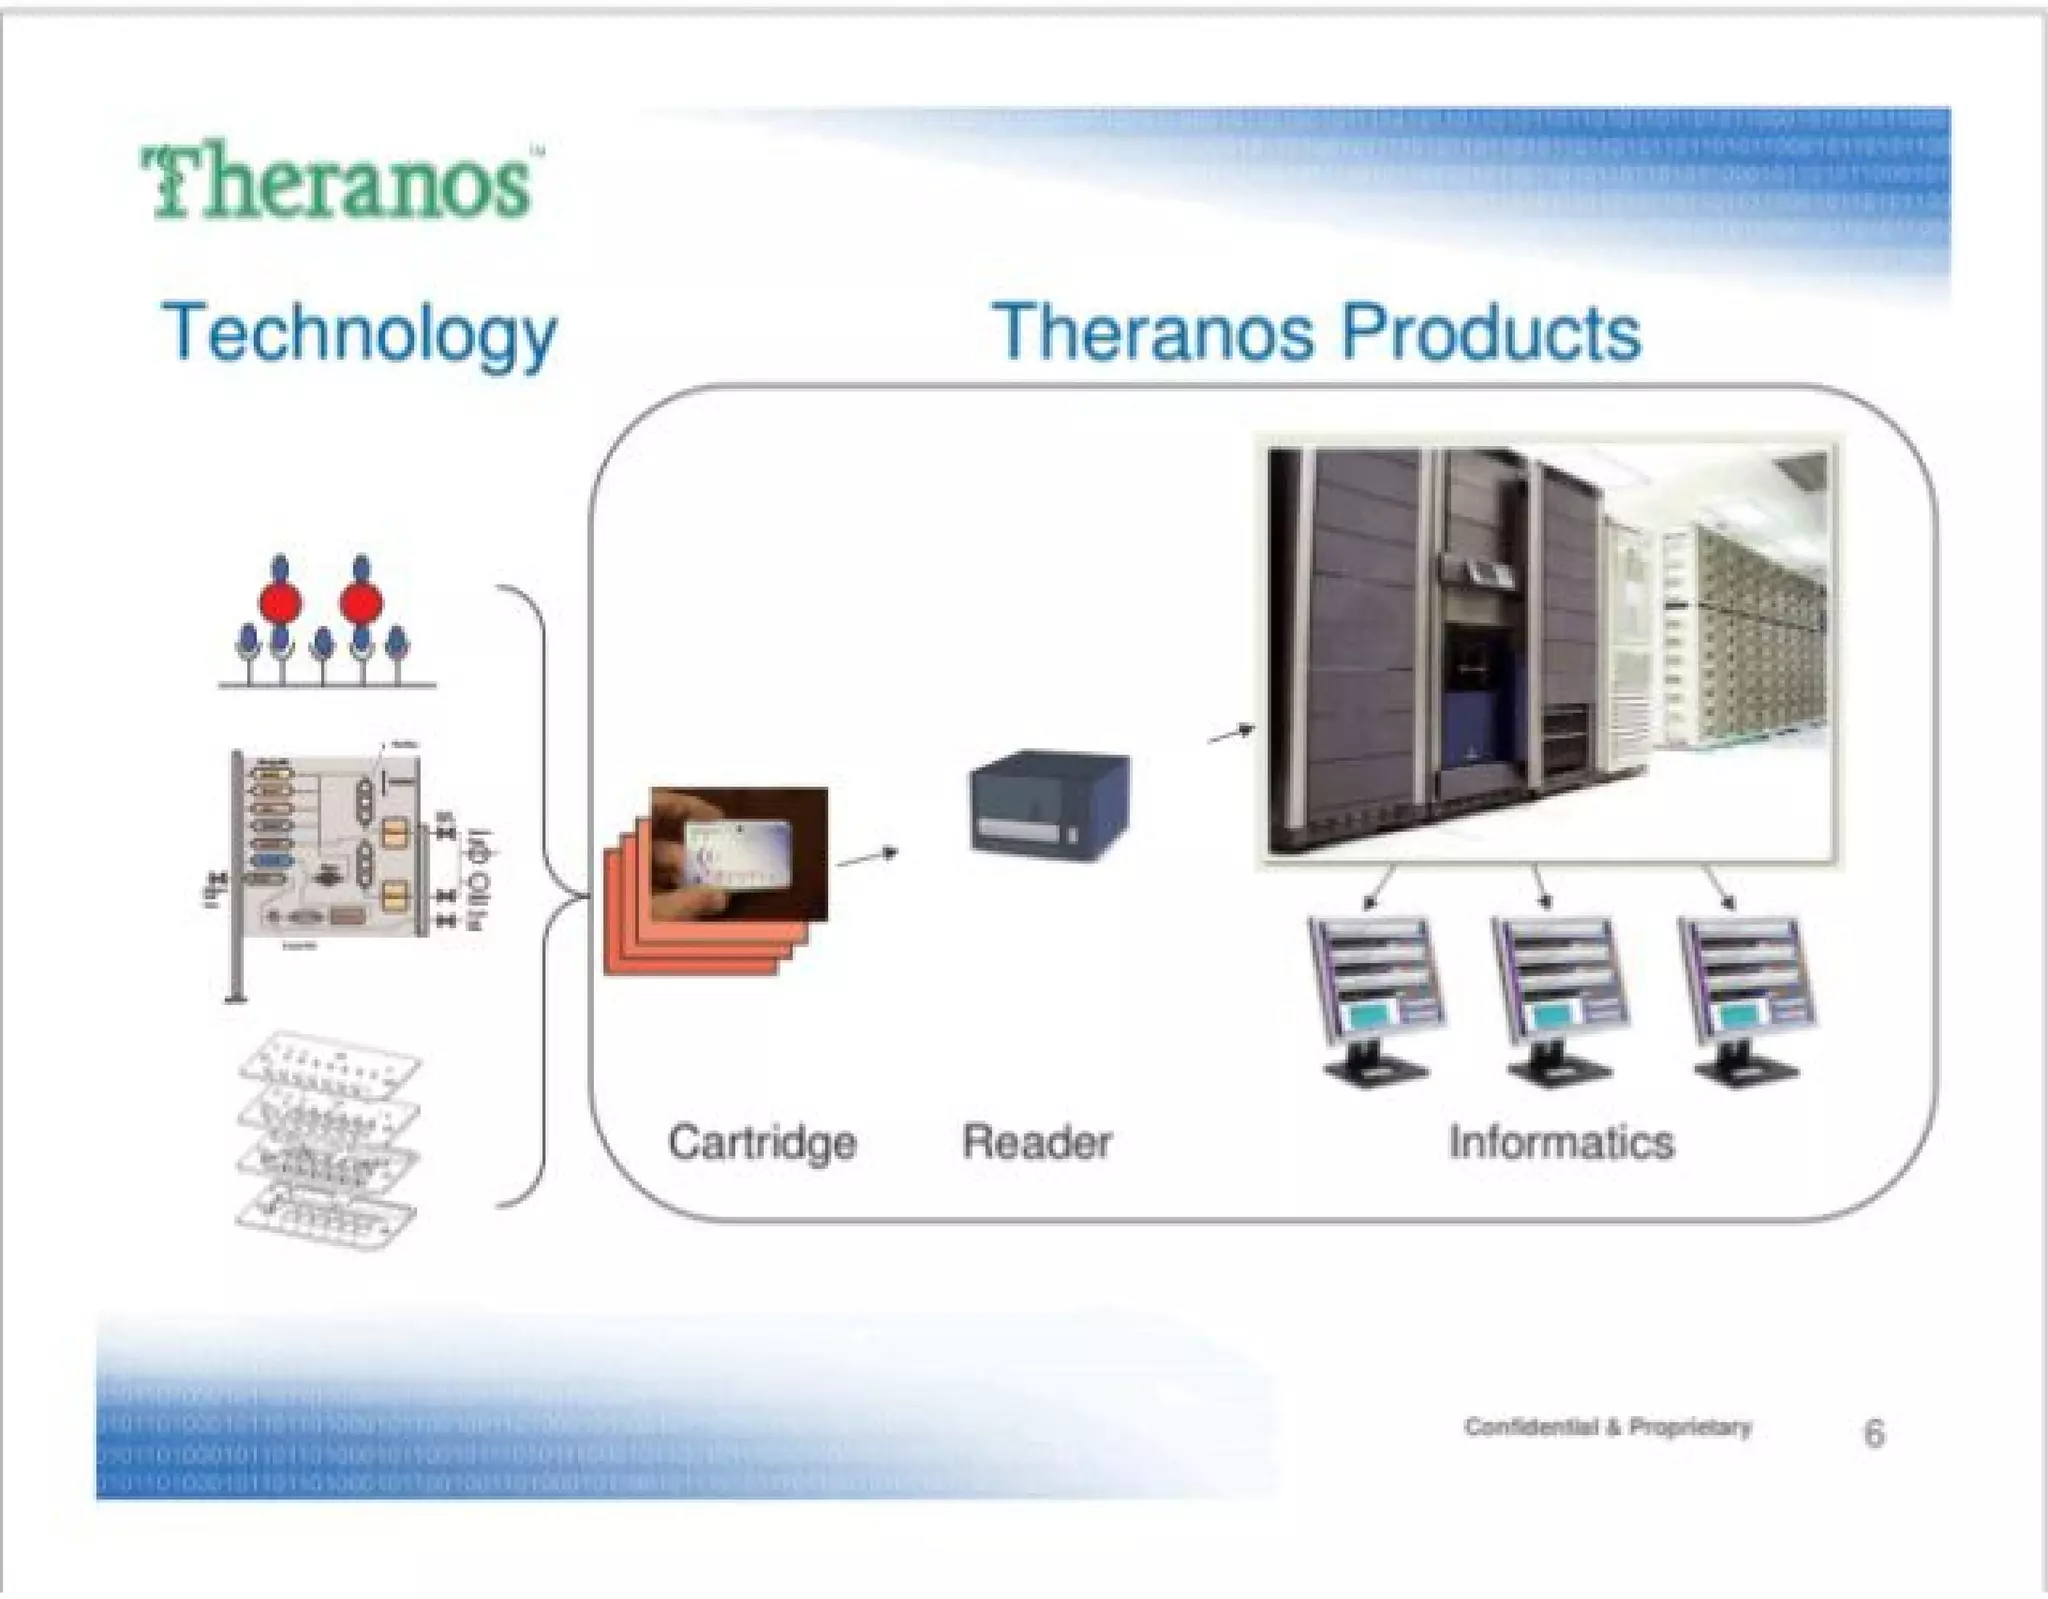
Slide 5 shows photos of cartridges, readers and a compact instrument, plus a simple graph. Visuals make the product tangible: investors can see scale, form factor and that some prototype exists — important for hardware and diagnostics companies. The deck uses imagery to bridge the technical world and the investor's need to believe something physical is being built. Showing multiple views (cartridge, internal components, and a result curve) is a good way to communicate complexity without overwhelming.

Key Takeaway: Use clear, honest product photos and representative outputs to make the technology tangible — but pair them with objective validation data.
Product features and technical claims

Product features and technical claims

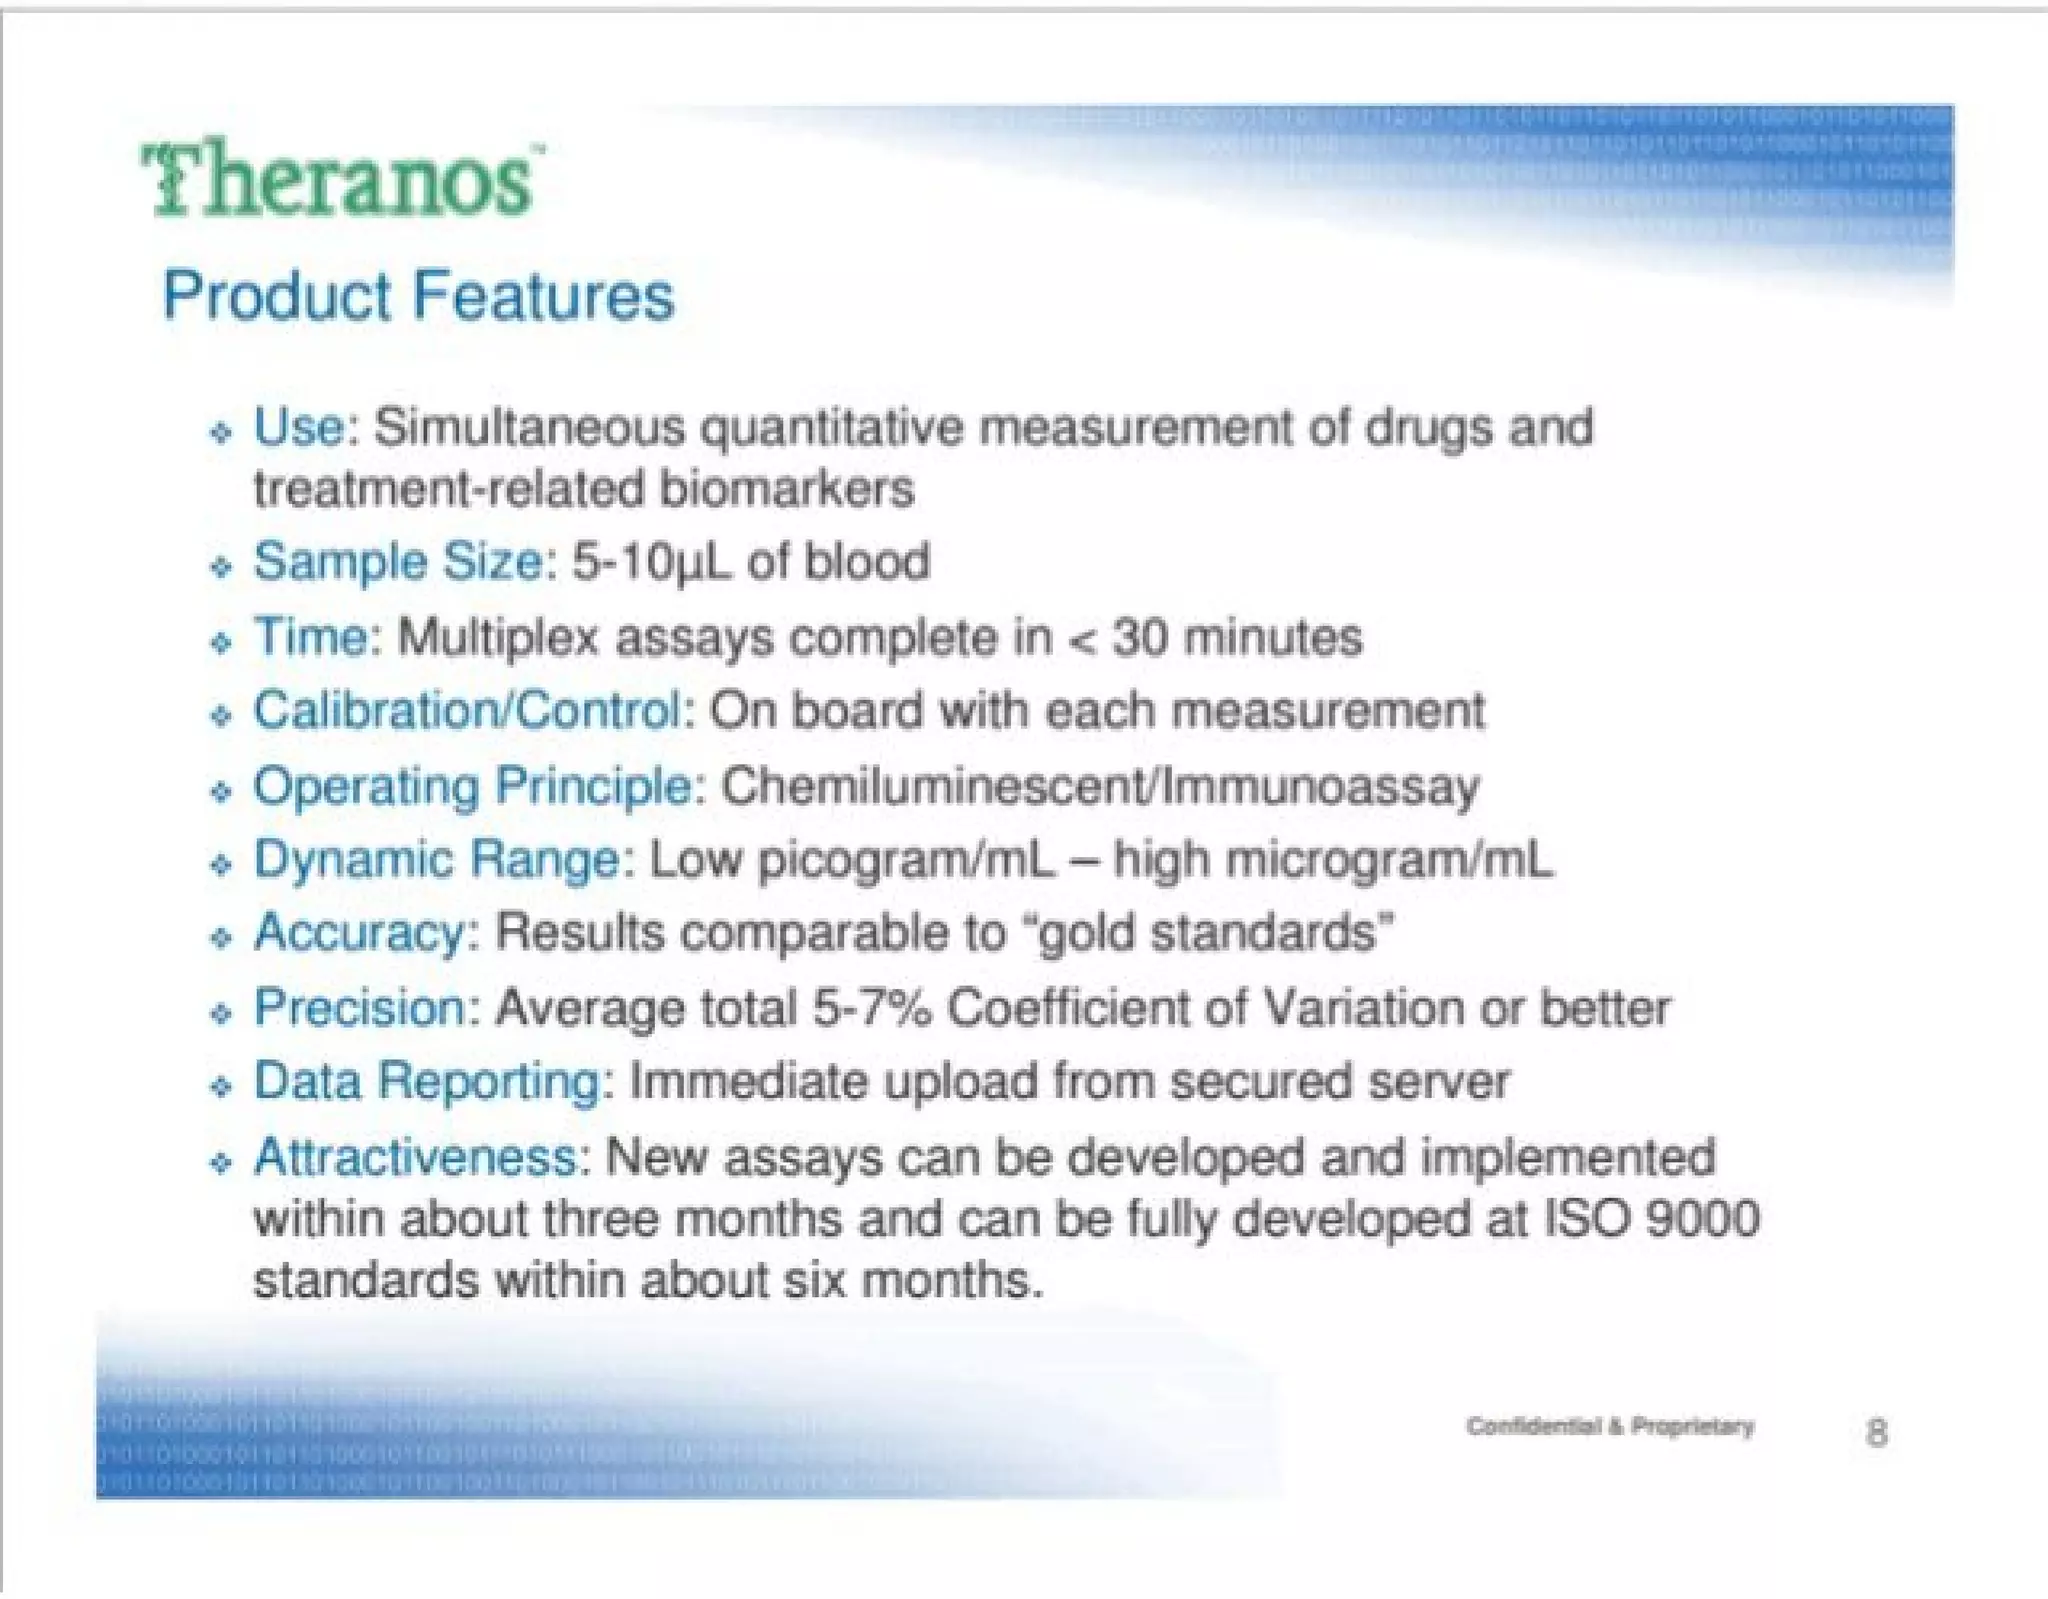
Slide 9 (Product Features) lists key technical specs: sample size (5–10 µL), time to result (<30 minutes), operating principle (chemiluminescent/immunoassay), precision (5–7% CV), immediate upload to secured server, and an attractive development timeline for new assays. This succinct, bullet‑point approach is effective because it addresses common diligence questions—sample volume, throughput, accuracy and data handling—without bogging down the deck.

Key Takeaway: State core technical specifications clearly and concisely, and be prepared to substantiate each claim with protocol-level data and third-party comparisons.
Market sizing and revenue assumptions

Market sizing and revenue assumptions

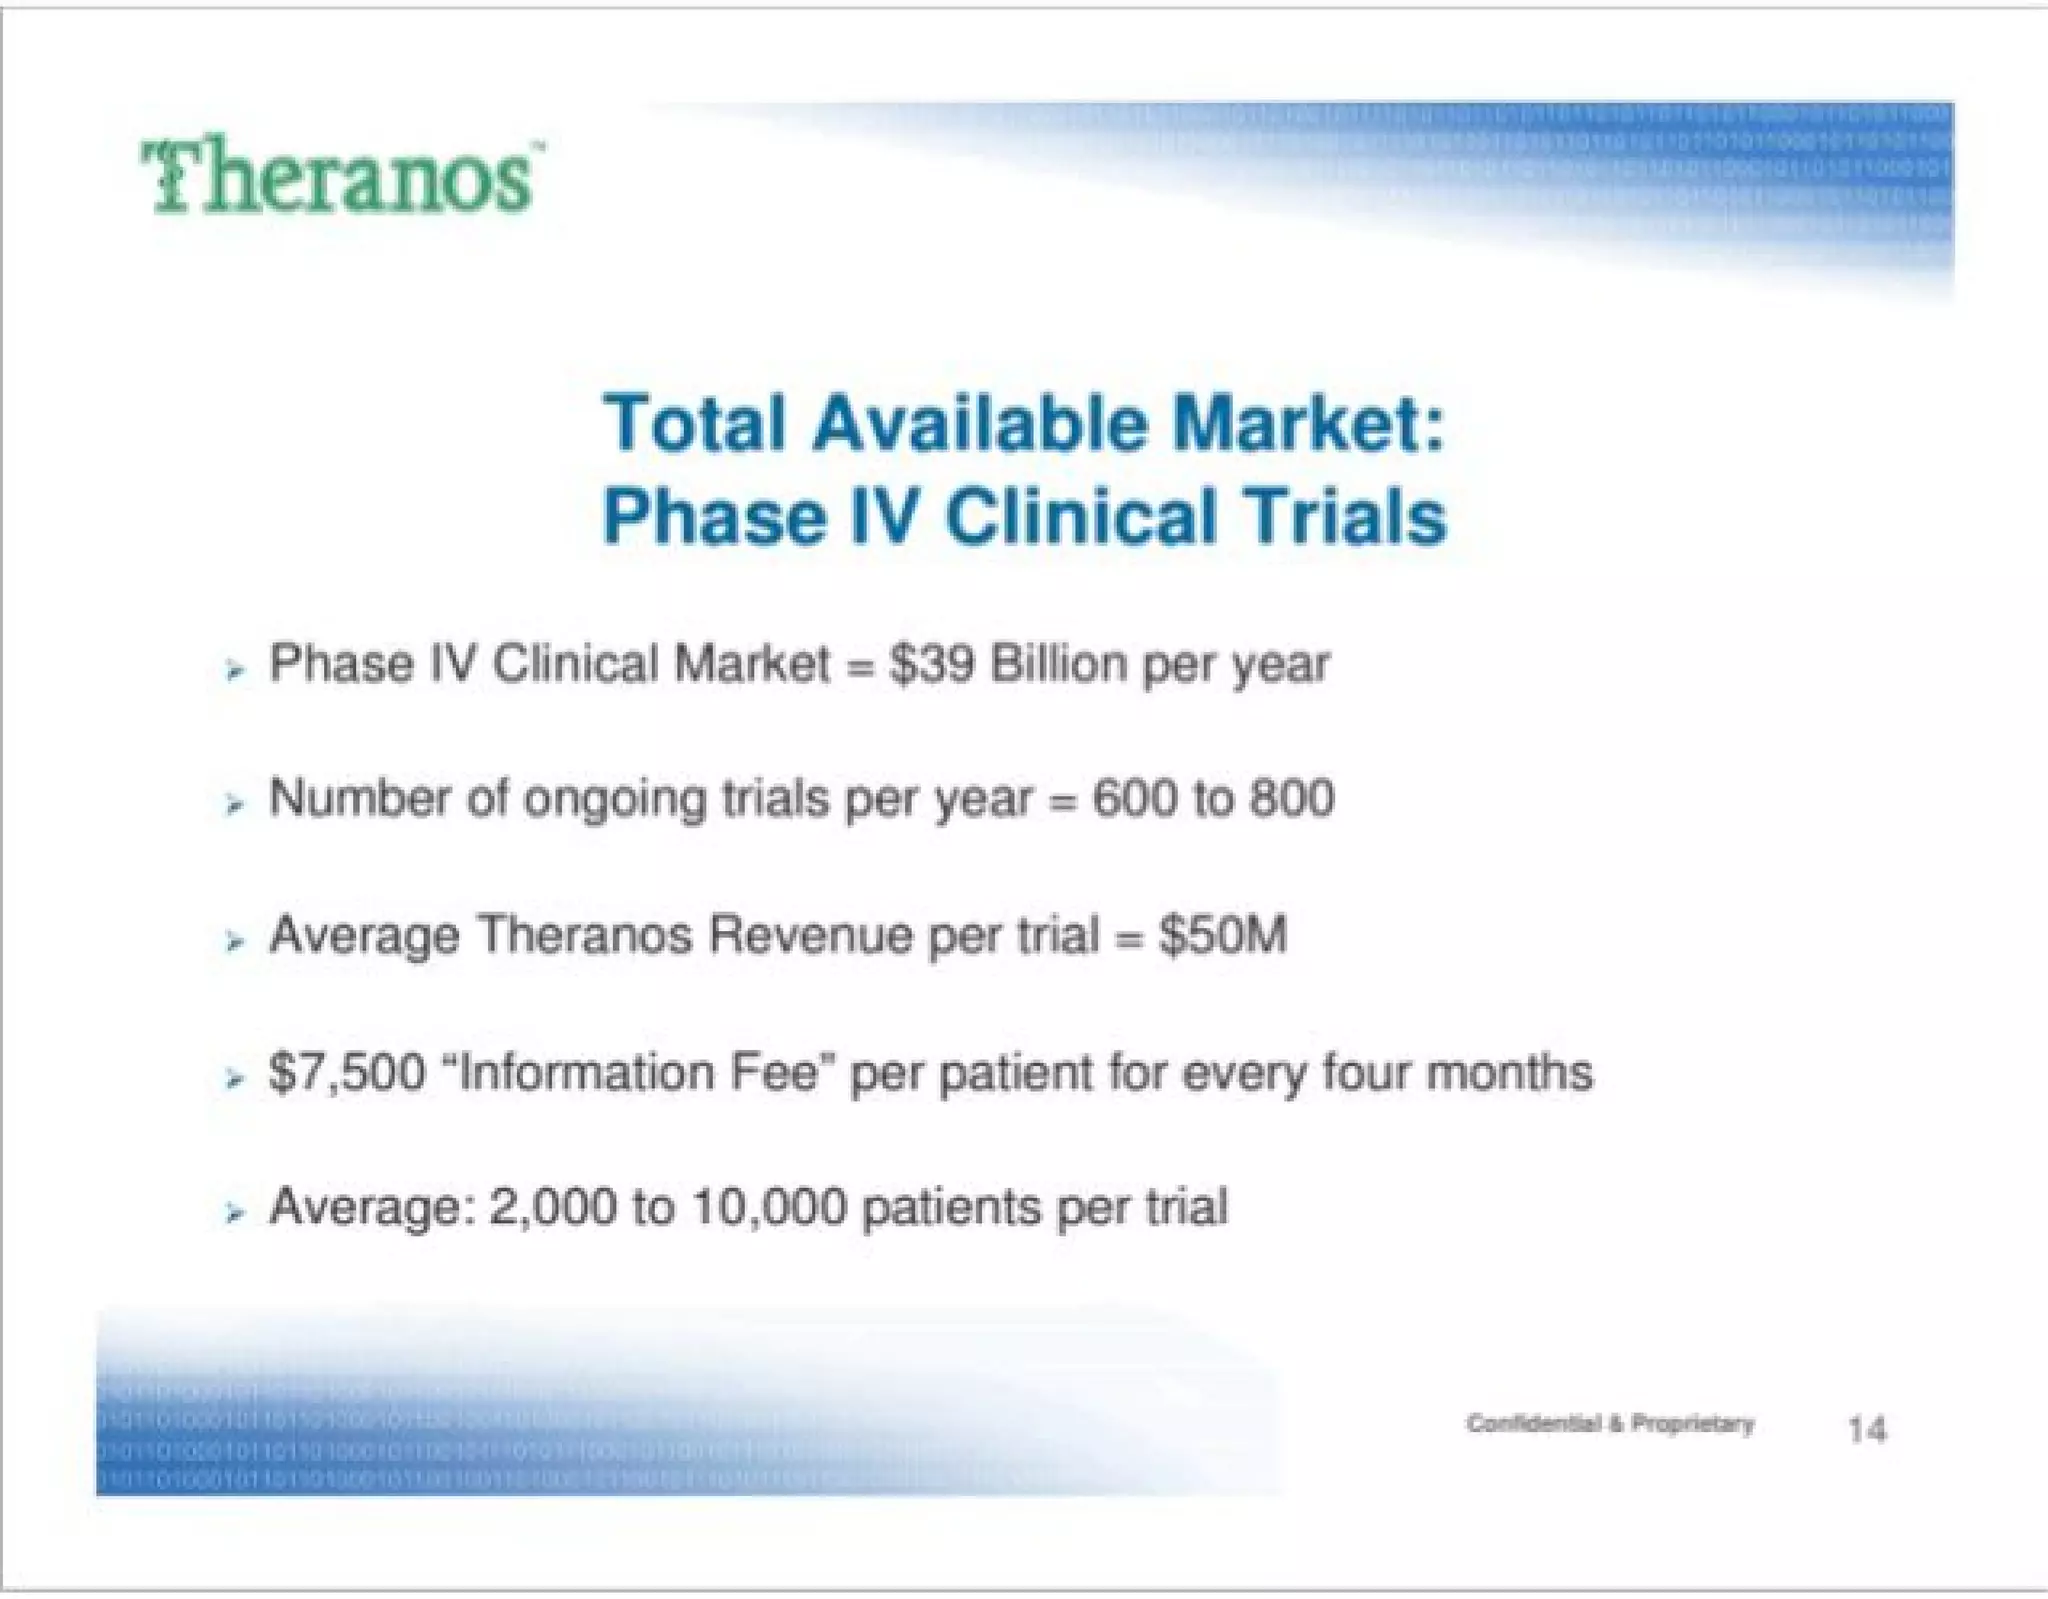
Slide 14 provides TAM details for Phase IV clinical trials: a $39B/year market, 600–800 ongoing trials, average Theranos revenue per trial of $50M, and an information fee model per patient. This is classic VC-facing math: combine a credible market segment with a clear monetization model to arrive at large revenue potential. Presenting trial counts and average revenue per trial helps investors do back-of-envelope checks quickly.

Key Takeaway: Show TAM with clear unit economics and conservative adoption assumptions; make it easy for investors to sanity-check your revenue math.
The offering and investor list: clarity and credibility

The offering and investor list: clarity and credibility

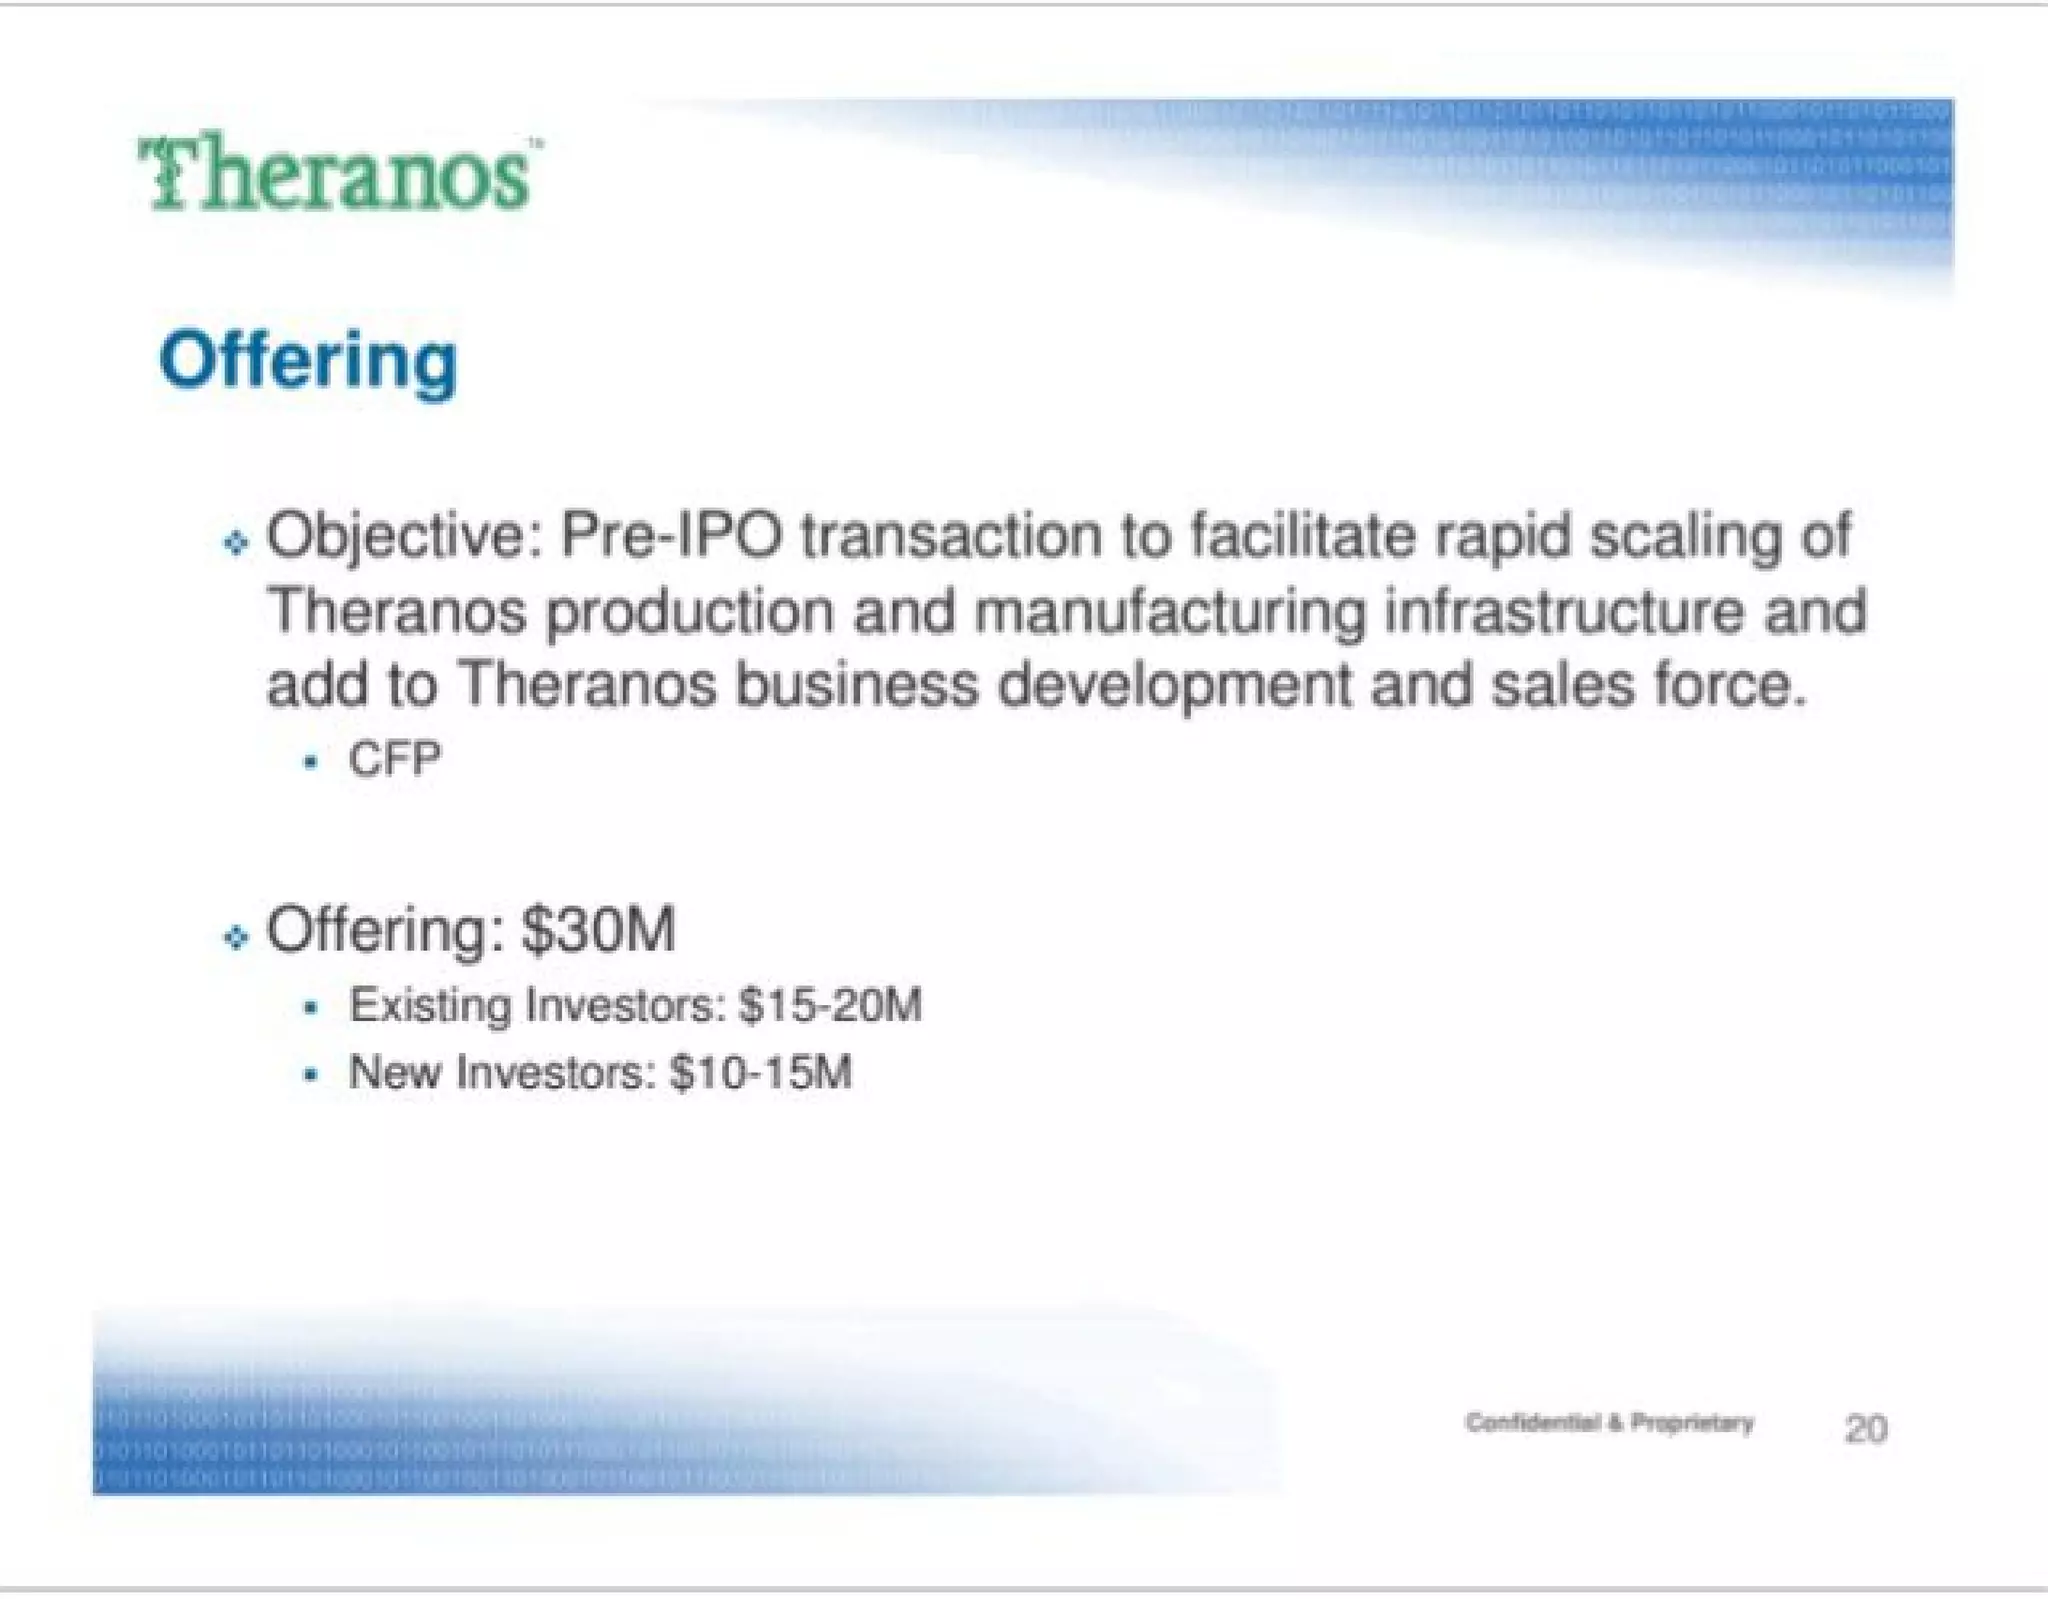
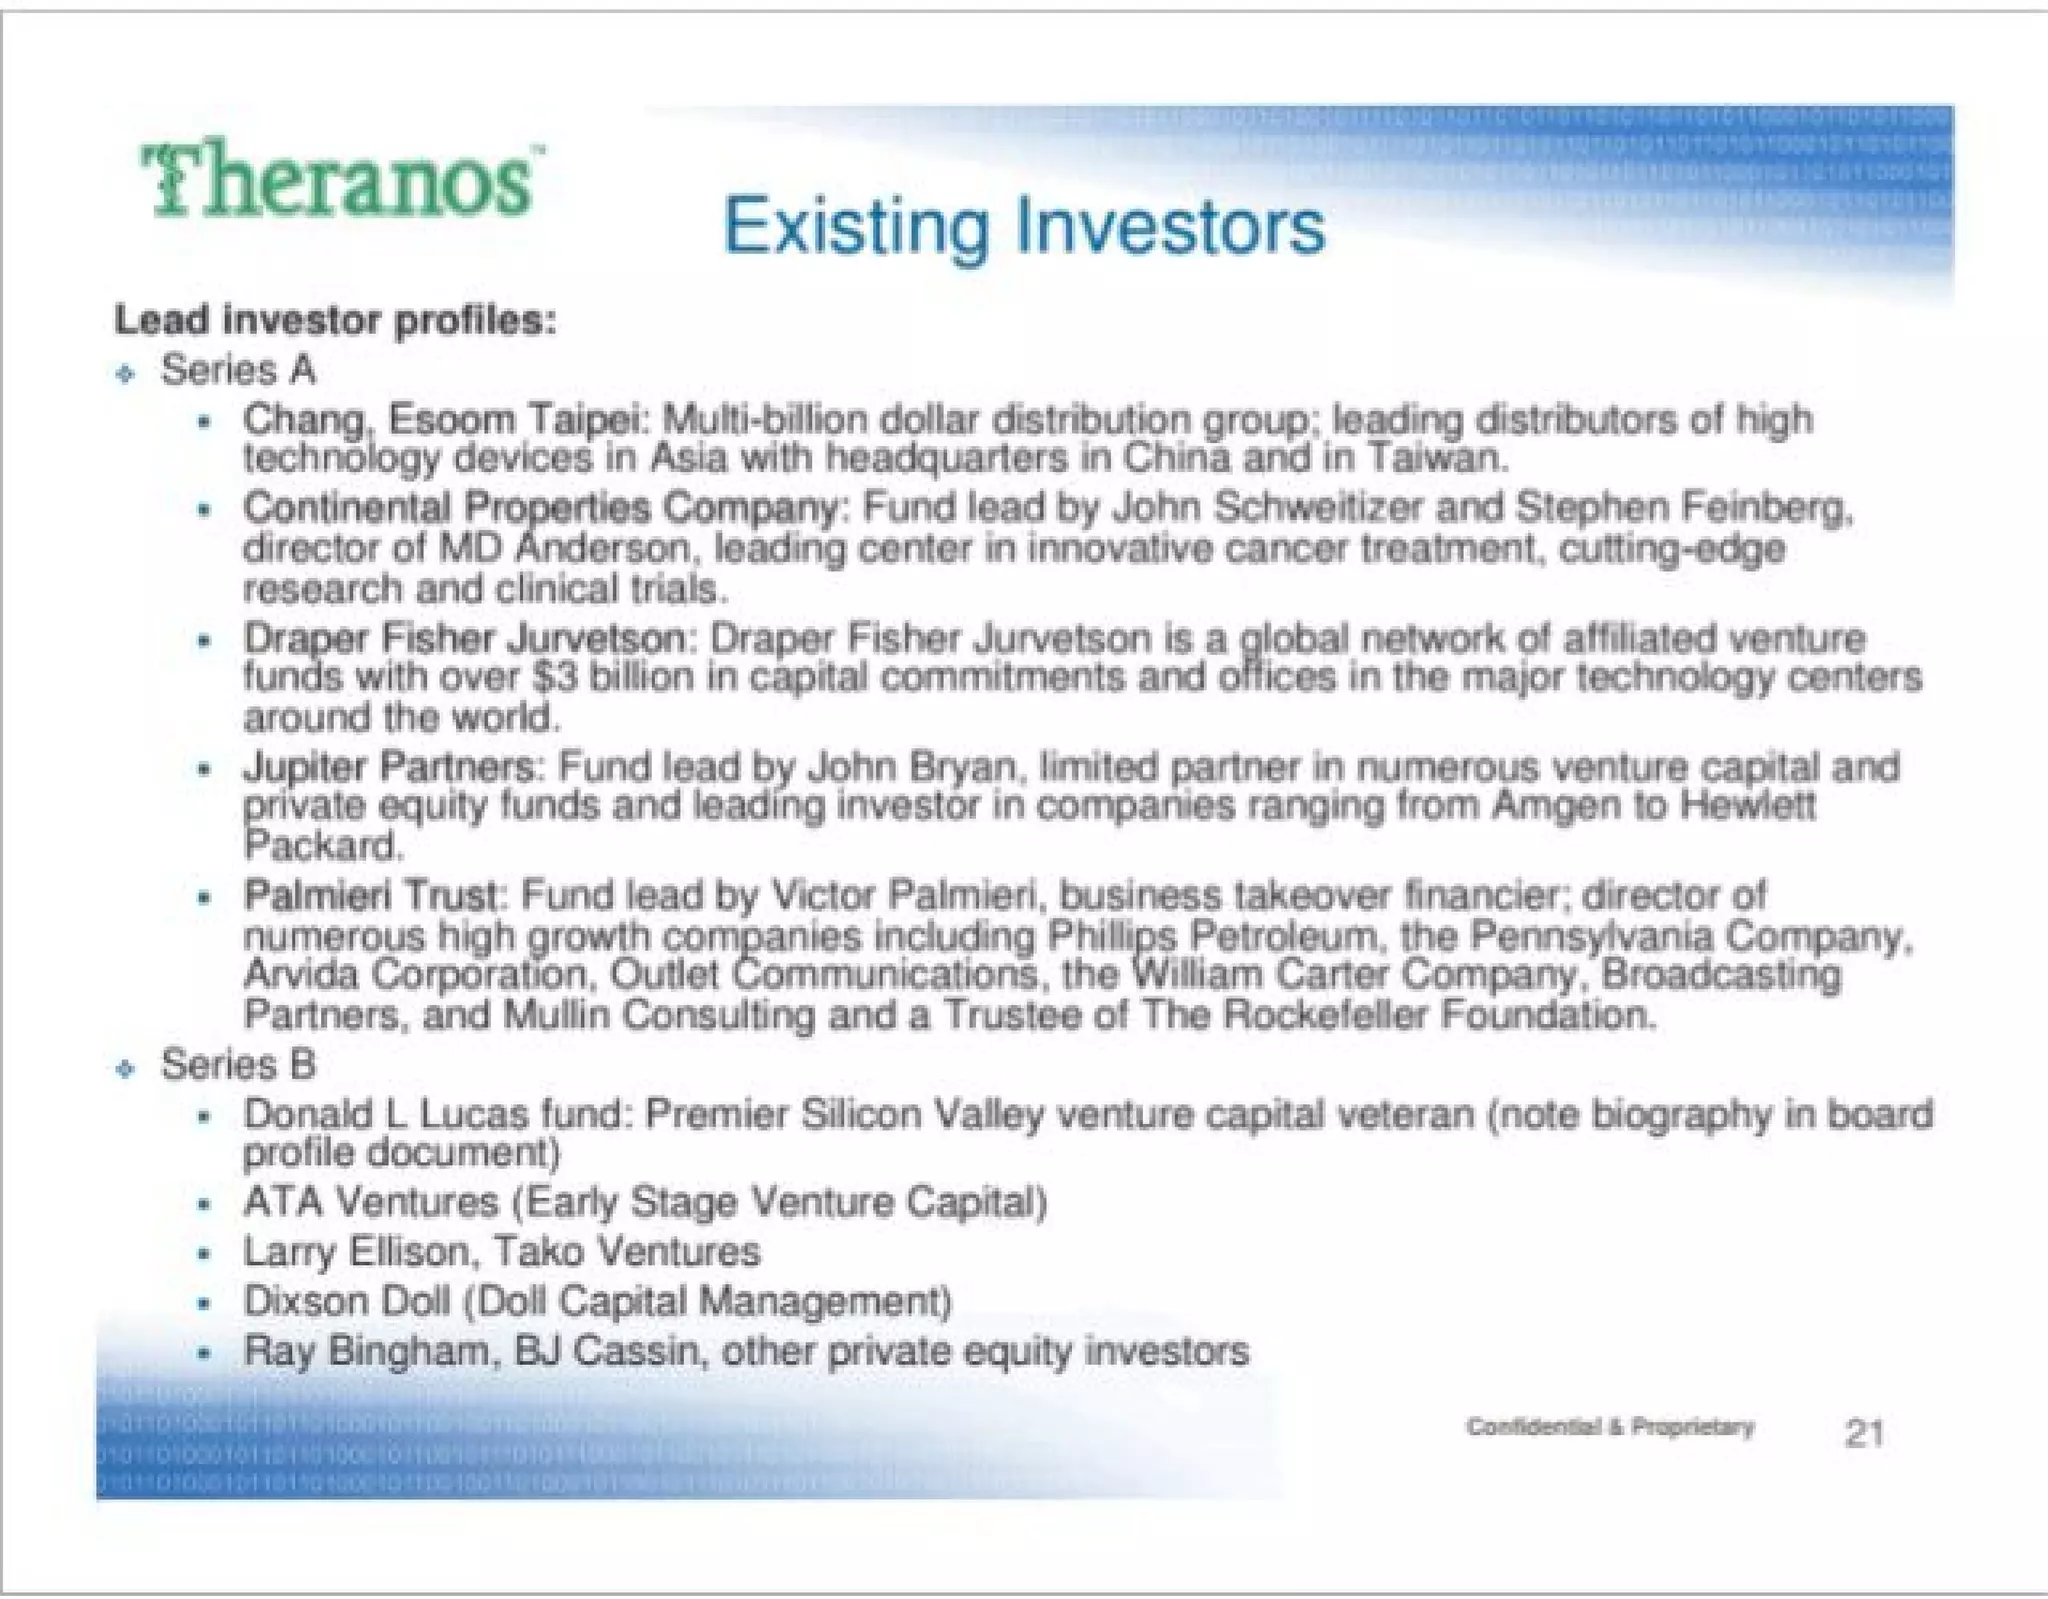
Slide 20 (Offering) states the fundraising objective ($30M), and splits expected allocation between existing and new investors. Slide 21 (Existing Investors) lists lead investor profiles across Series A and B, naming recognizable funds and individuals. This combination does two important things: it gives a clear ask and shows momentum/backing, which reduces perceived risk for new investors.

Key Takeaway: Be explicit about the round size, allocation and use of funds, and highlight reputable existing investors — but make sure commitments are accurate and supported.

Conclusion: Key Lessons

Theranos’s Series C deck is a strong example of investor-focused storytelling: clear branding, a defined beachhead market, tangible product visuals, succinct technical claims and ambitious market math. These are the right elements for a hardware/diagnostics raise and helped Theranos raise large sums quickly. However, the deck also illustrates critical pitfalls: grand claims without transparent, reproducible validation, optimistic TAM/conversion assumptions without conservative scenarios, and over-reliance on reputation rather than demonstrable, auditable performance.

For founders: craft a crisp narrative that ties product, market and monetization together; use visuals and a team slide to build trust; but pair every performance and market claim with verifiable evidence (protocols, blinded comparisons, regulatory milestones, and third-party data). Be conservative in your financial assumptions, transparent about use of funds, and ensure governance and data integrity are front and center — those are the factors that protect investors and founders alike as a company scales.

Full Deck Analysis

11 sections

Overview

Company: Theranos
Round: Series C ($28.5M+)
Year: June 1, 2006
Outcome: FAILED - Fraud, dissolved 2018
Status: Cautionary case study of fraudulent pitch deck

Executive Summary

The Theranos Series C pitch deck is a masterclass in fraudulent pitching that successfully raised $28.5M+ despite lacking fundamental validation. Across 23 slides, the company makes extraordinary claims about blood testing technology with virtually no supporting evidence, constantly pivots its business model (6+ different markets), and reveals fundamental technical problems while attempting to hide them. The deck demonstrates how charisma, vague language, investor backing, and FOMO can overcome the absence of peer-reviewed publications, FDA approvals, customer validation, or clinical data. This case study is essential reading for understanding how sophisticated fraud can be perpetrated through professional pitch decks.


Problem Statement

How the Deck Articulates the Problem

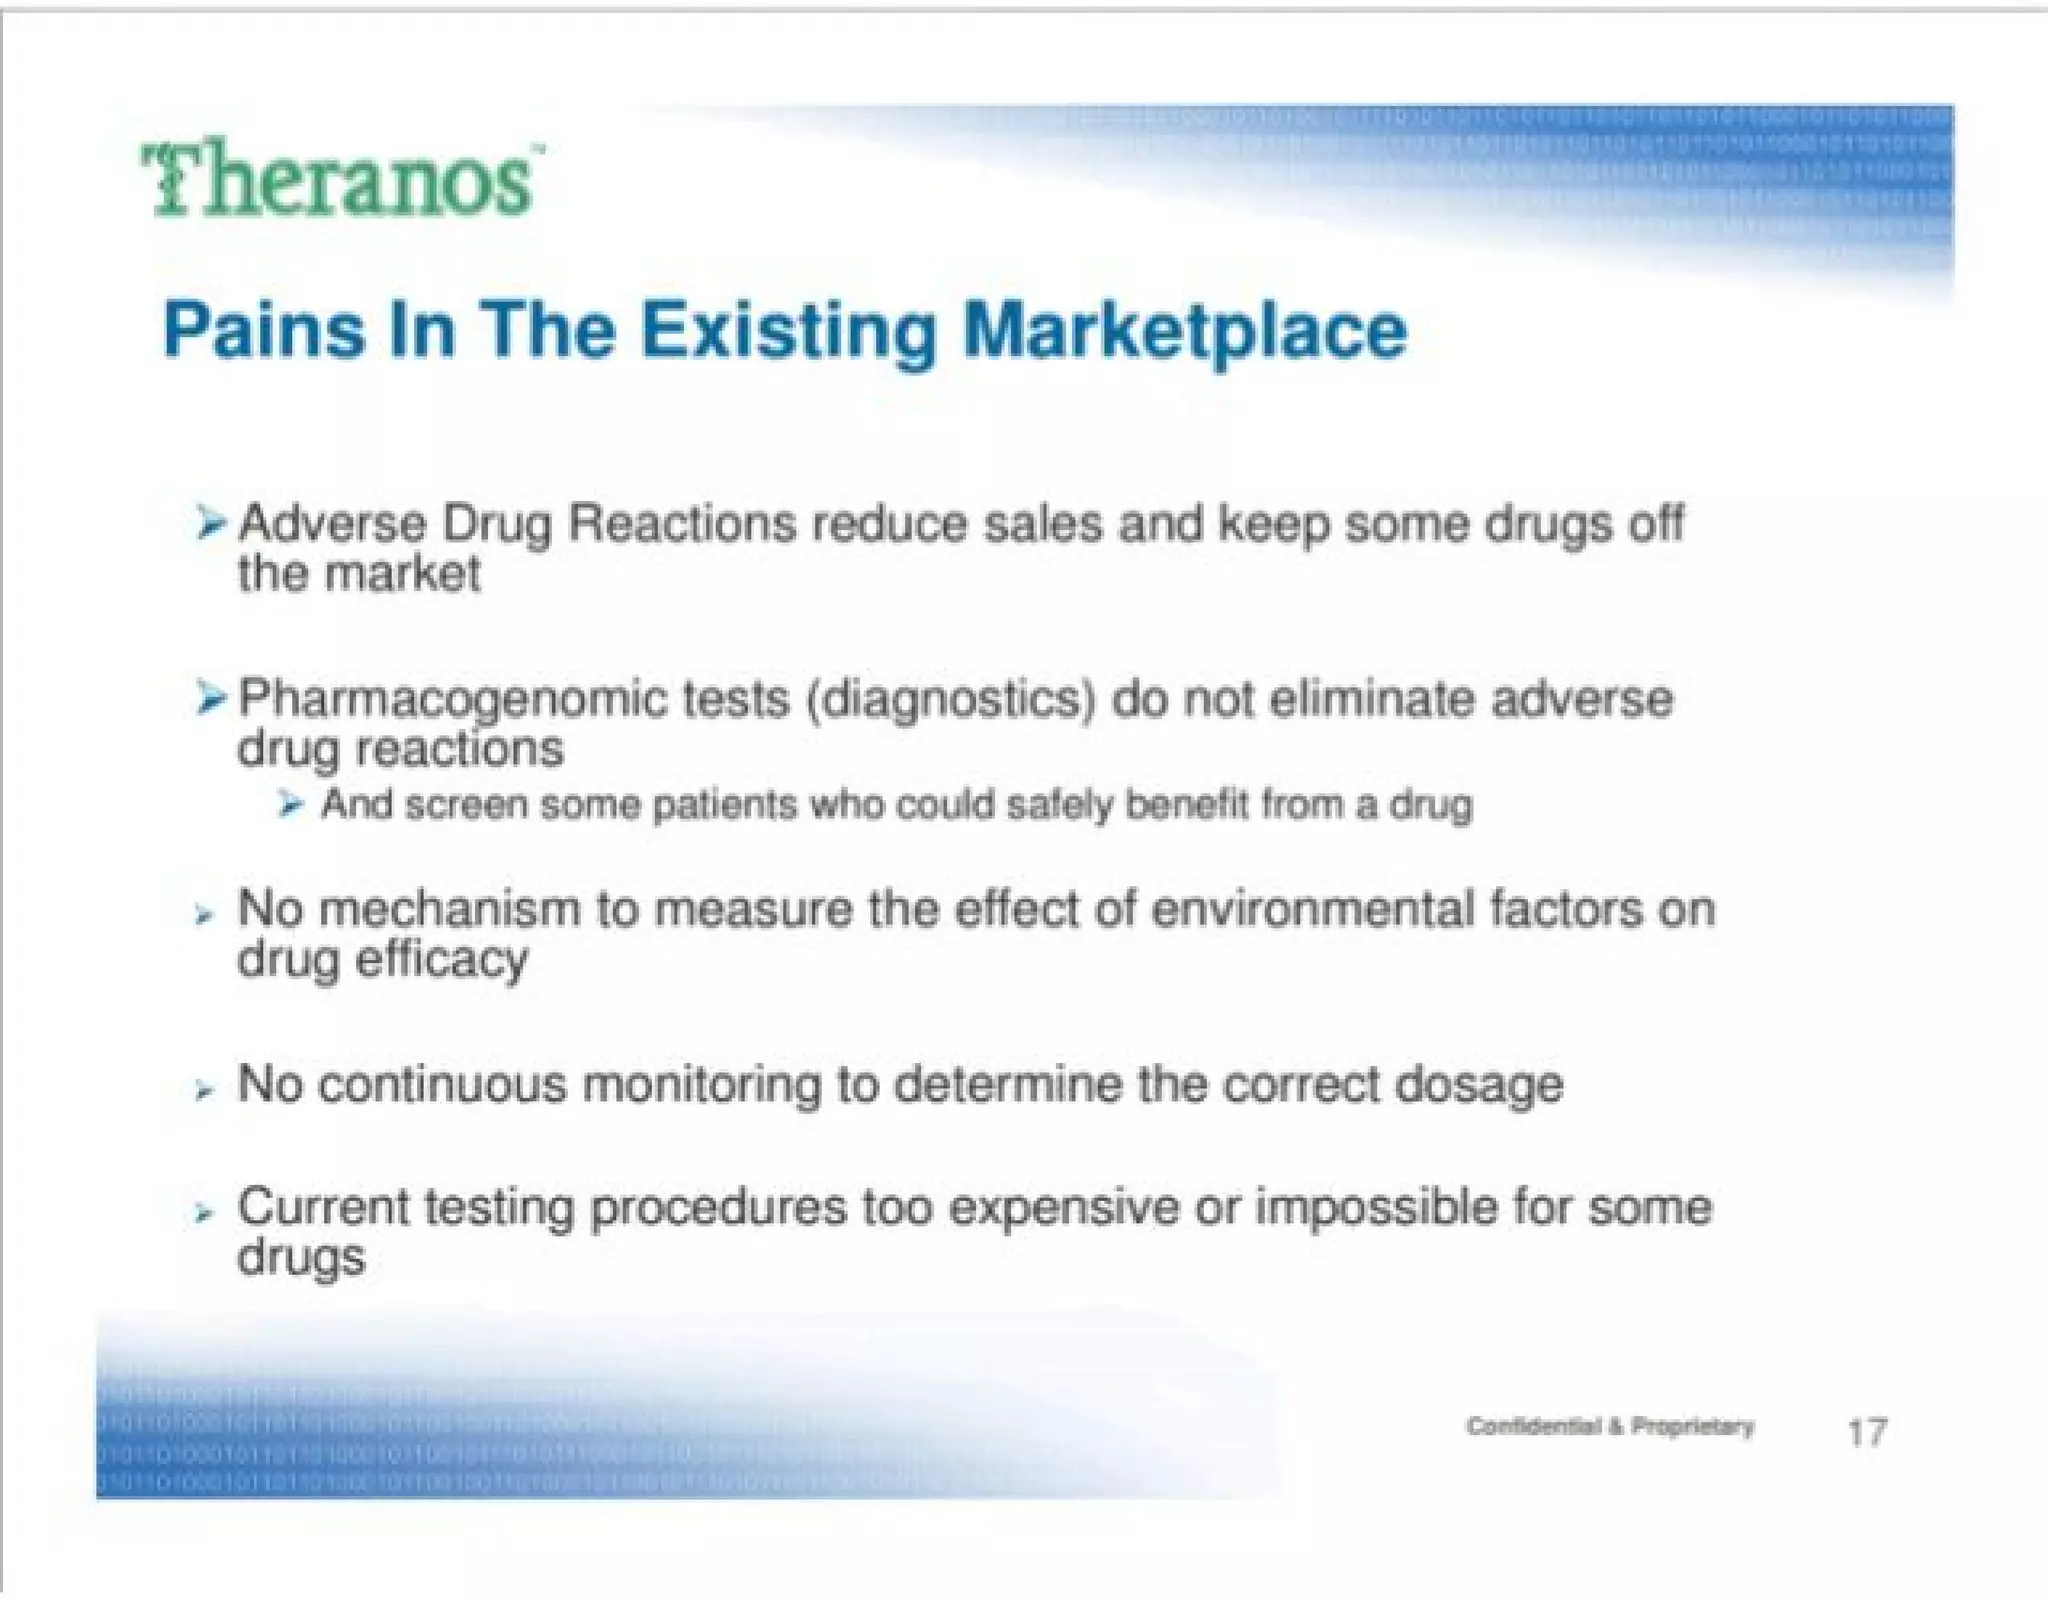
Slide 17: “Pains In The Existing Marketplace” identifies five market problems:

  1. Adverse Drug Reactions (ADRs) reduce sales and keep drugs off market
  2. Pharmacogenomic tests don’t eliminate ADRs and screen out patients who could benefit
  3. No mechanism to measure environmental factors on drug efficacy
  4. No continuous monitoring to determine correct dosage
  5. Current testing procedures too expensive or impossible for some drugs

Critical Issue with Problem Statement

The identified problems do not align with the proposed solution:

  • Problems focus on drug safety and efficacy optimization
  • Solution is drug level monitoring (therapeutic drug monitoring)
  • These are complementary, not competitive solutions
  • Suggests company is working backwards: starting with a solution and trying to find problems it solves

Problems Never Clearly Defined

  • Slide 2: Mission is vague (“become the standard for improving…every therapy”)
  • Slides 3-6: No clear explanation of what Theranos actually does
  • Slide 5: First hardware shown without explanation of purpose
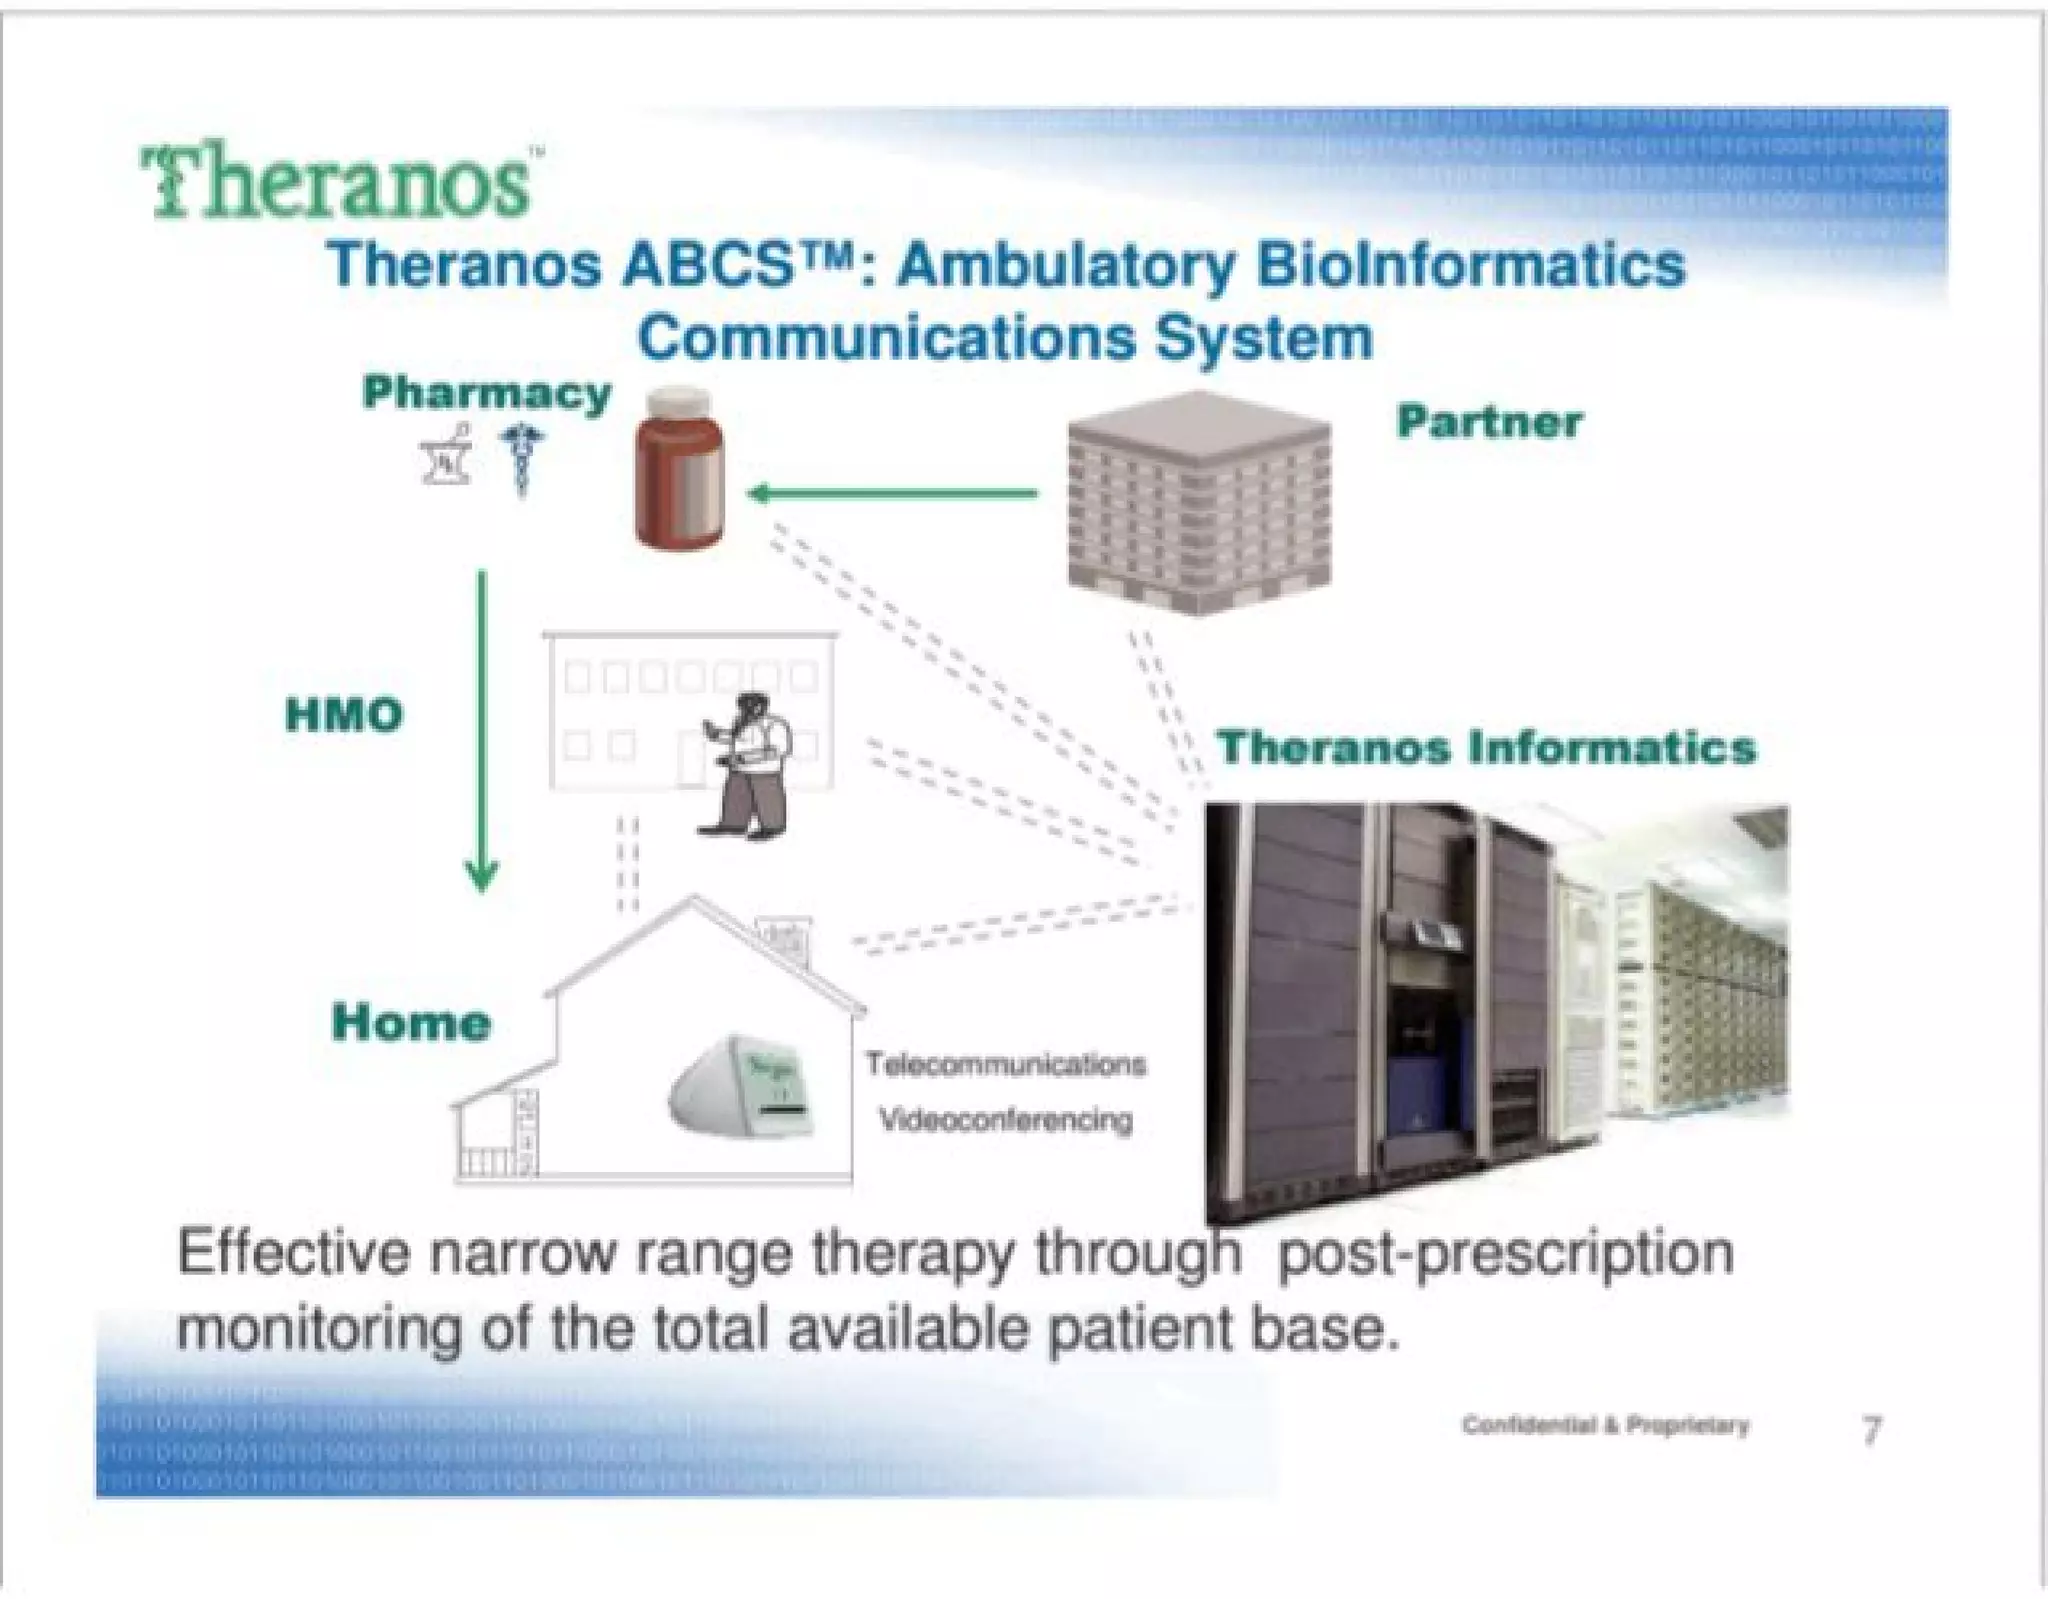
  • Slide 6: System architecture shown without explaining what it measures
  • Result: By Slide 17, the actual problem remains unclear

Solution

What Theranos Claims to Offer

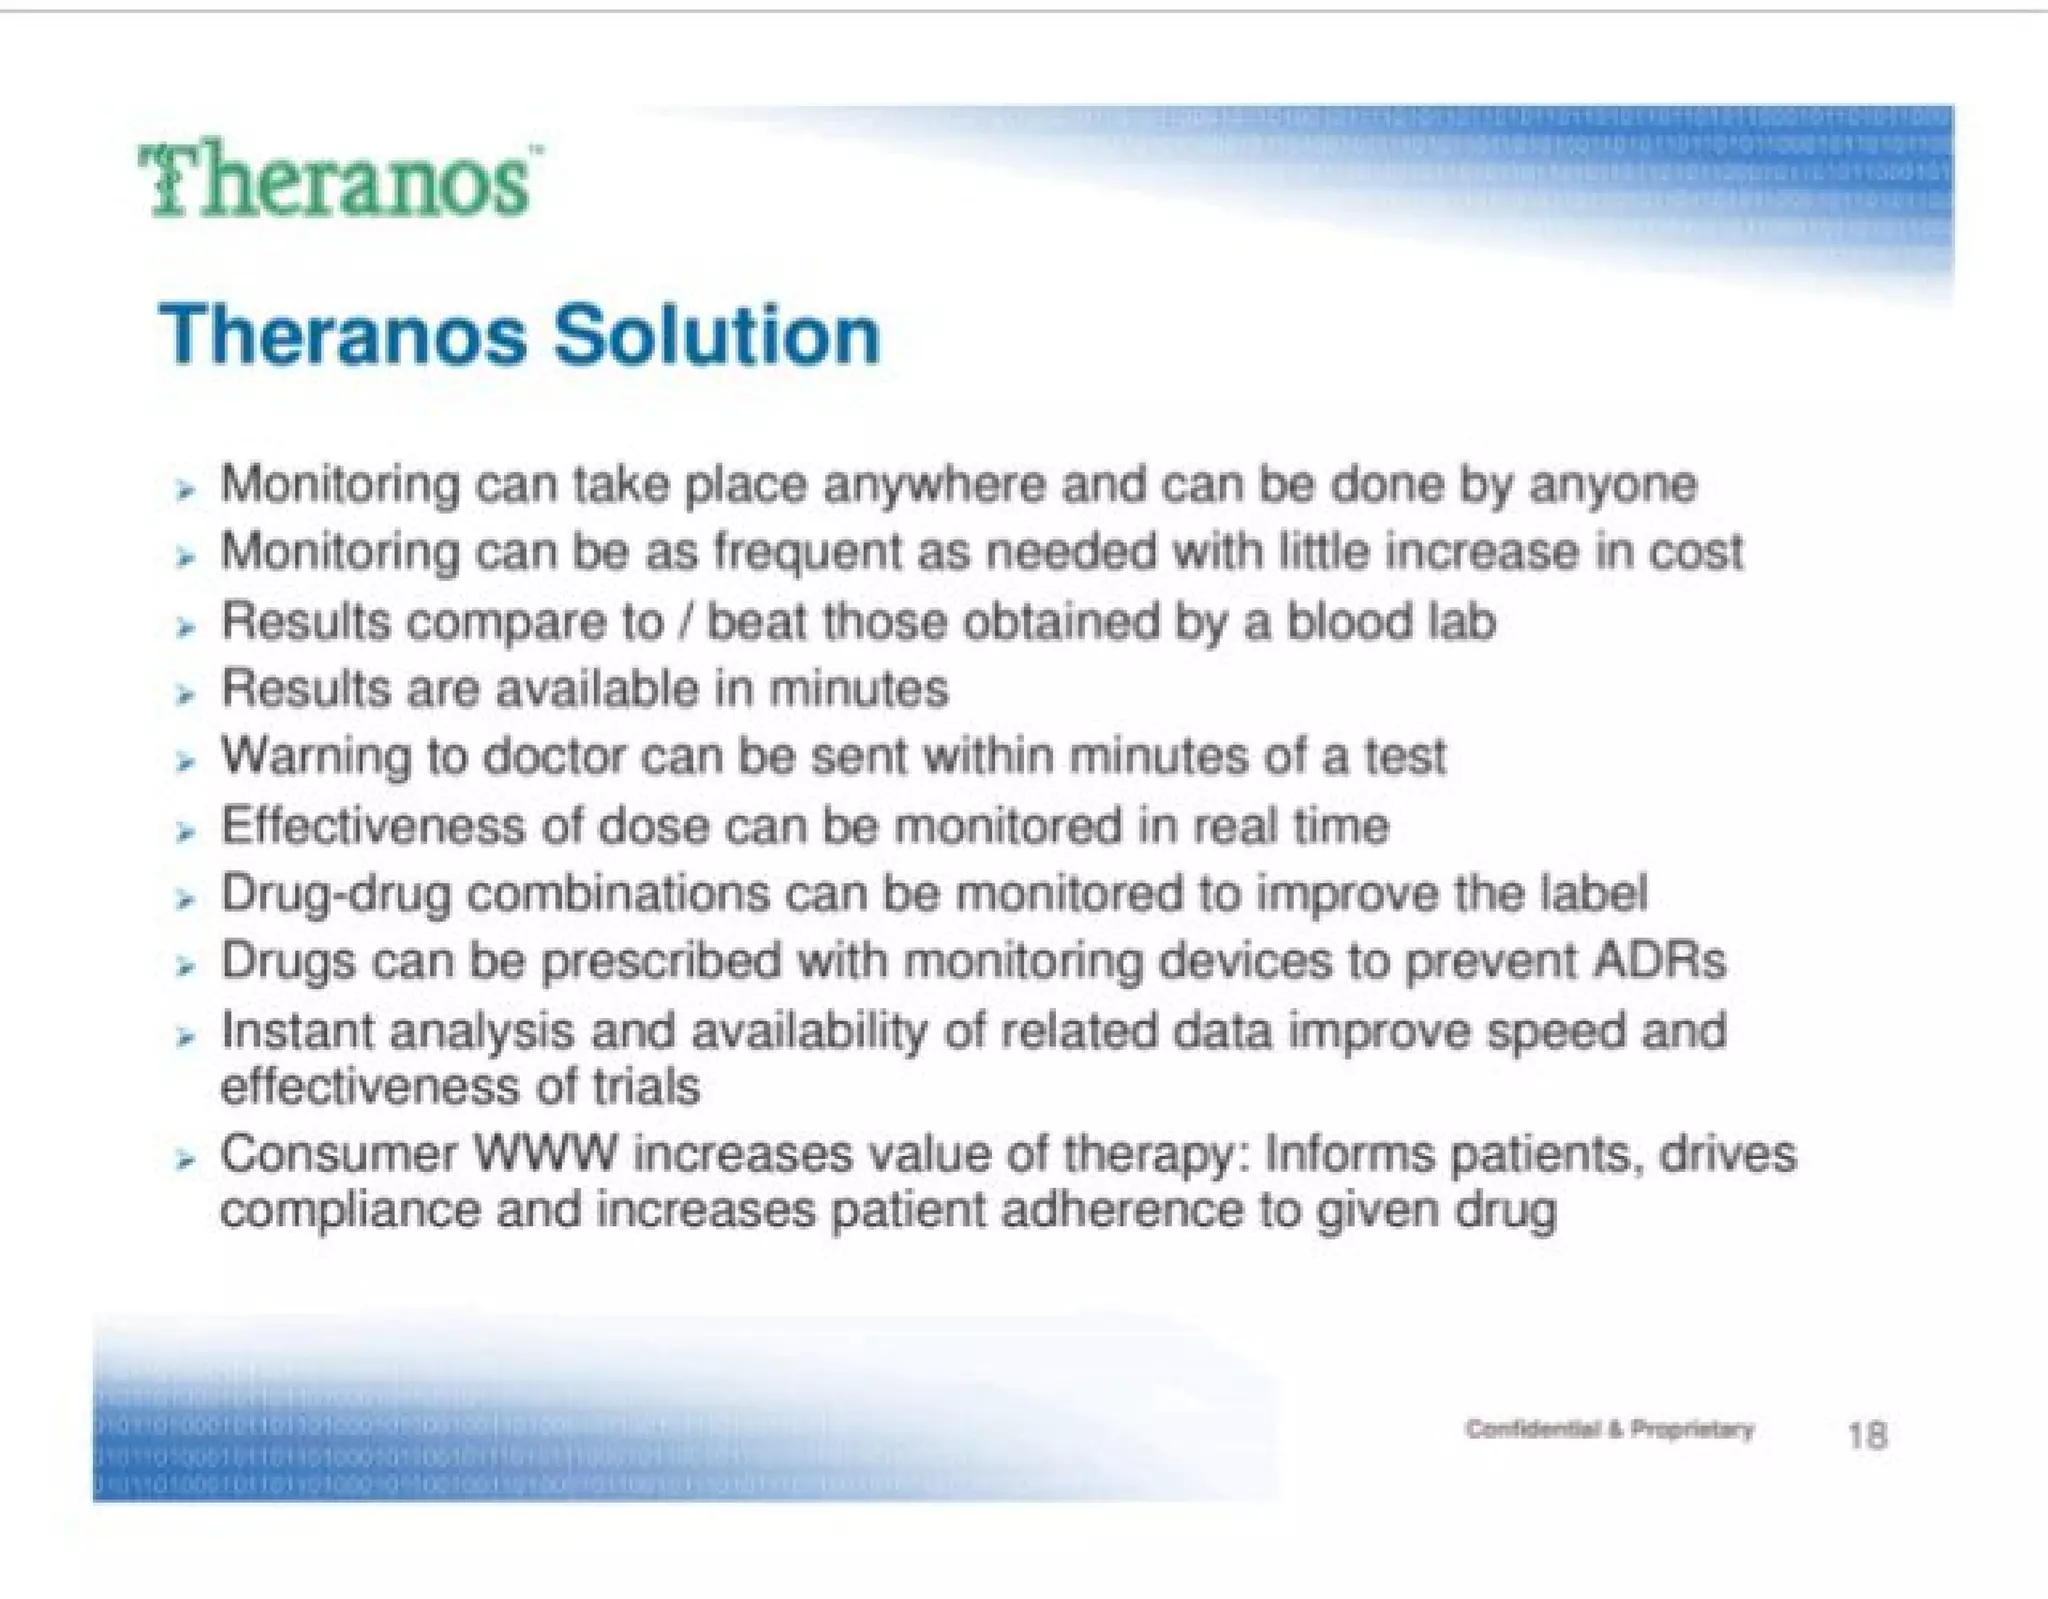
Slide 18: “Theranos Solution” lists 10 claimed benefits:

  1. Monitoring can take place anywhere and be done by anyone
  2. Monitoring can be as frequent as needed with little cost increase
  3. Results compare to/beat blood lab results
  4. Results available in minutes
  5. Warning to doctor within minutes of test
  6. Effectiveness of dose monitored in real time
  7. Drug-drug combinations monitored to improve label
  8. Drugs prescribed with monitoring devices to prevent ADRs
  9. Instant analysis improves speed and effectiveness of trials
  10. Consumer portal increases patient compliance

The Technology (Slides 5-6, 22-23)

Hardware Components:

  • Cartridge: Disposable microfluidic device (orange/red layered design)
  • Reader: Dark blue/black optical reader device
  • Informatics System: Large cabinet + desktop computers

Operating Principle:

  • Chemiluminescent/immunoassay (Slide 8)
  • Microfluidic technology (implied but never explicitly stated)
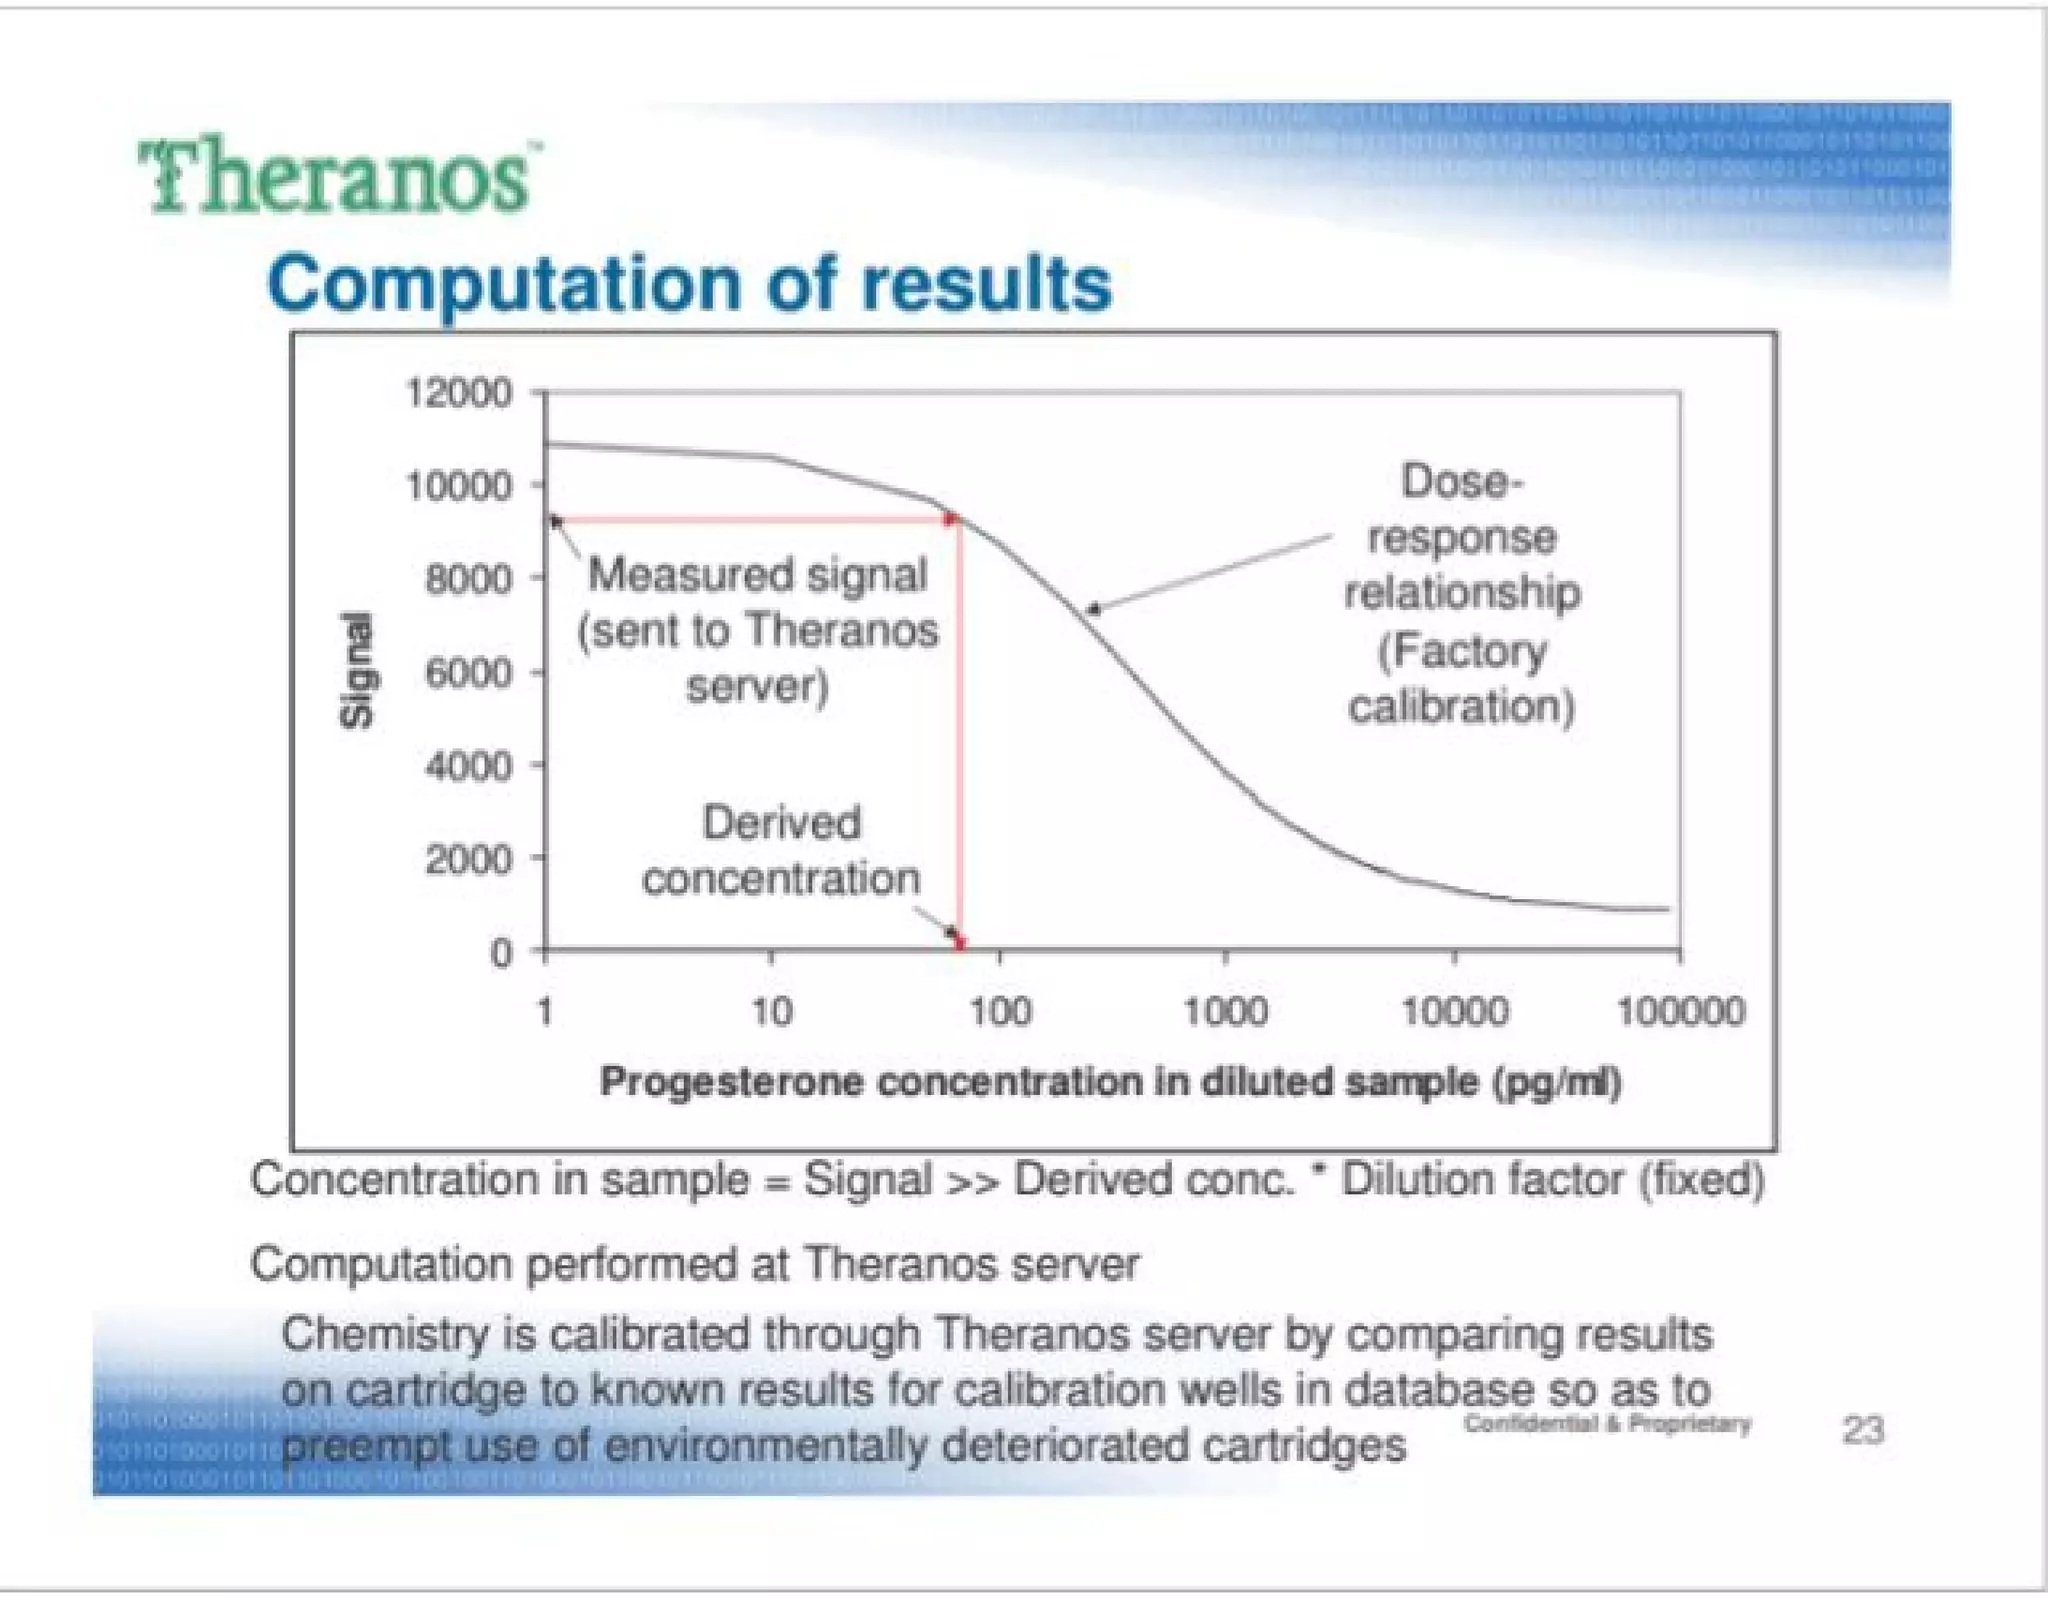
  • Server-based calibration (Slide 23 - major red flag)

Claimed Specifications (Slide 8):

  • Sample size: 5-10µL blood
  • Turnaround time: < 30 minutes for multiplex assays
  • Precision: 5-7% Coefficient of Variation
  • Dynamic range: Picogram/mL to microgram/mL (6+ orders of magnitude)
  • Accuracy: “Comparable to gold standards” (unspecified)
  • On-board calibration/control with each measurement

Critical Problem Revealed (Slide 23)

Server-based calibration to “preempt use of environmentally deteriorated cartridges”

  • Cartridges deteriorate in the field
  • Company uses remote server to detect and compensate for deterioration
  • This is non-standard, unvalidated, and raises data integrity concerns
  • Suggests fundamental manufacturing/stability problem

Market Opportunity

Market Sizing Claims (Slides 14-15)

Slide 14: Phase IV Clinical Trials Market

  • Total market: $39 Billion per year
  • Number of ongoing trials: 600-800 per year
  • Average Theranos revenue per trial: $50M
  • Information fee: $7,500 per patient per 4 months ($22,500/year)
  • Patients per trial: 2,000-10,000

Calculation Logic:

  • Low end: 2,000 patients × $7,500 × 3 cycles/year = $45M per trial
  • High end: 10,000 patients × $7,500 × 3 cycles/year = $225M per trial
  • Average: ~$50M per trial

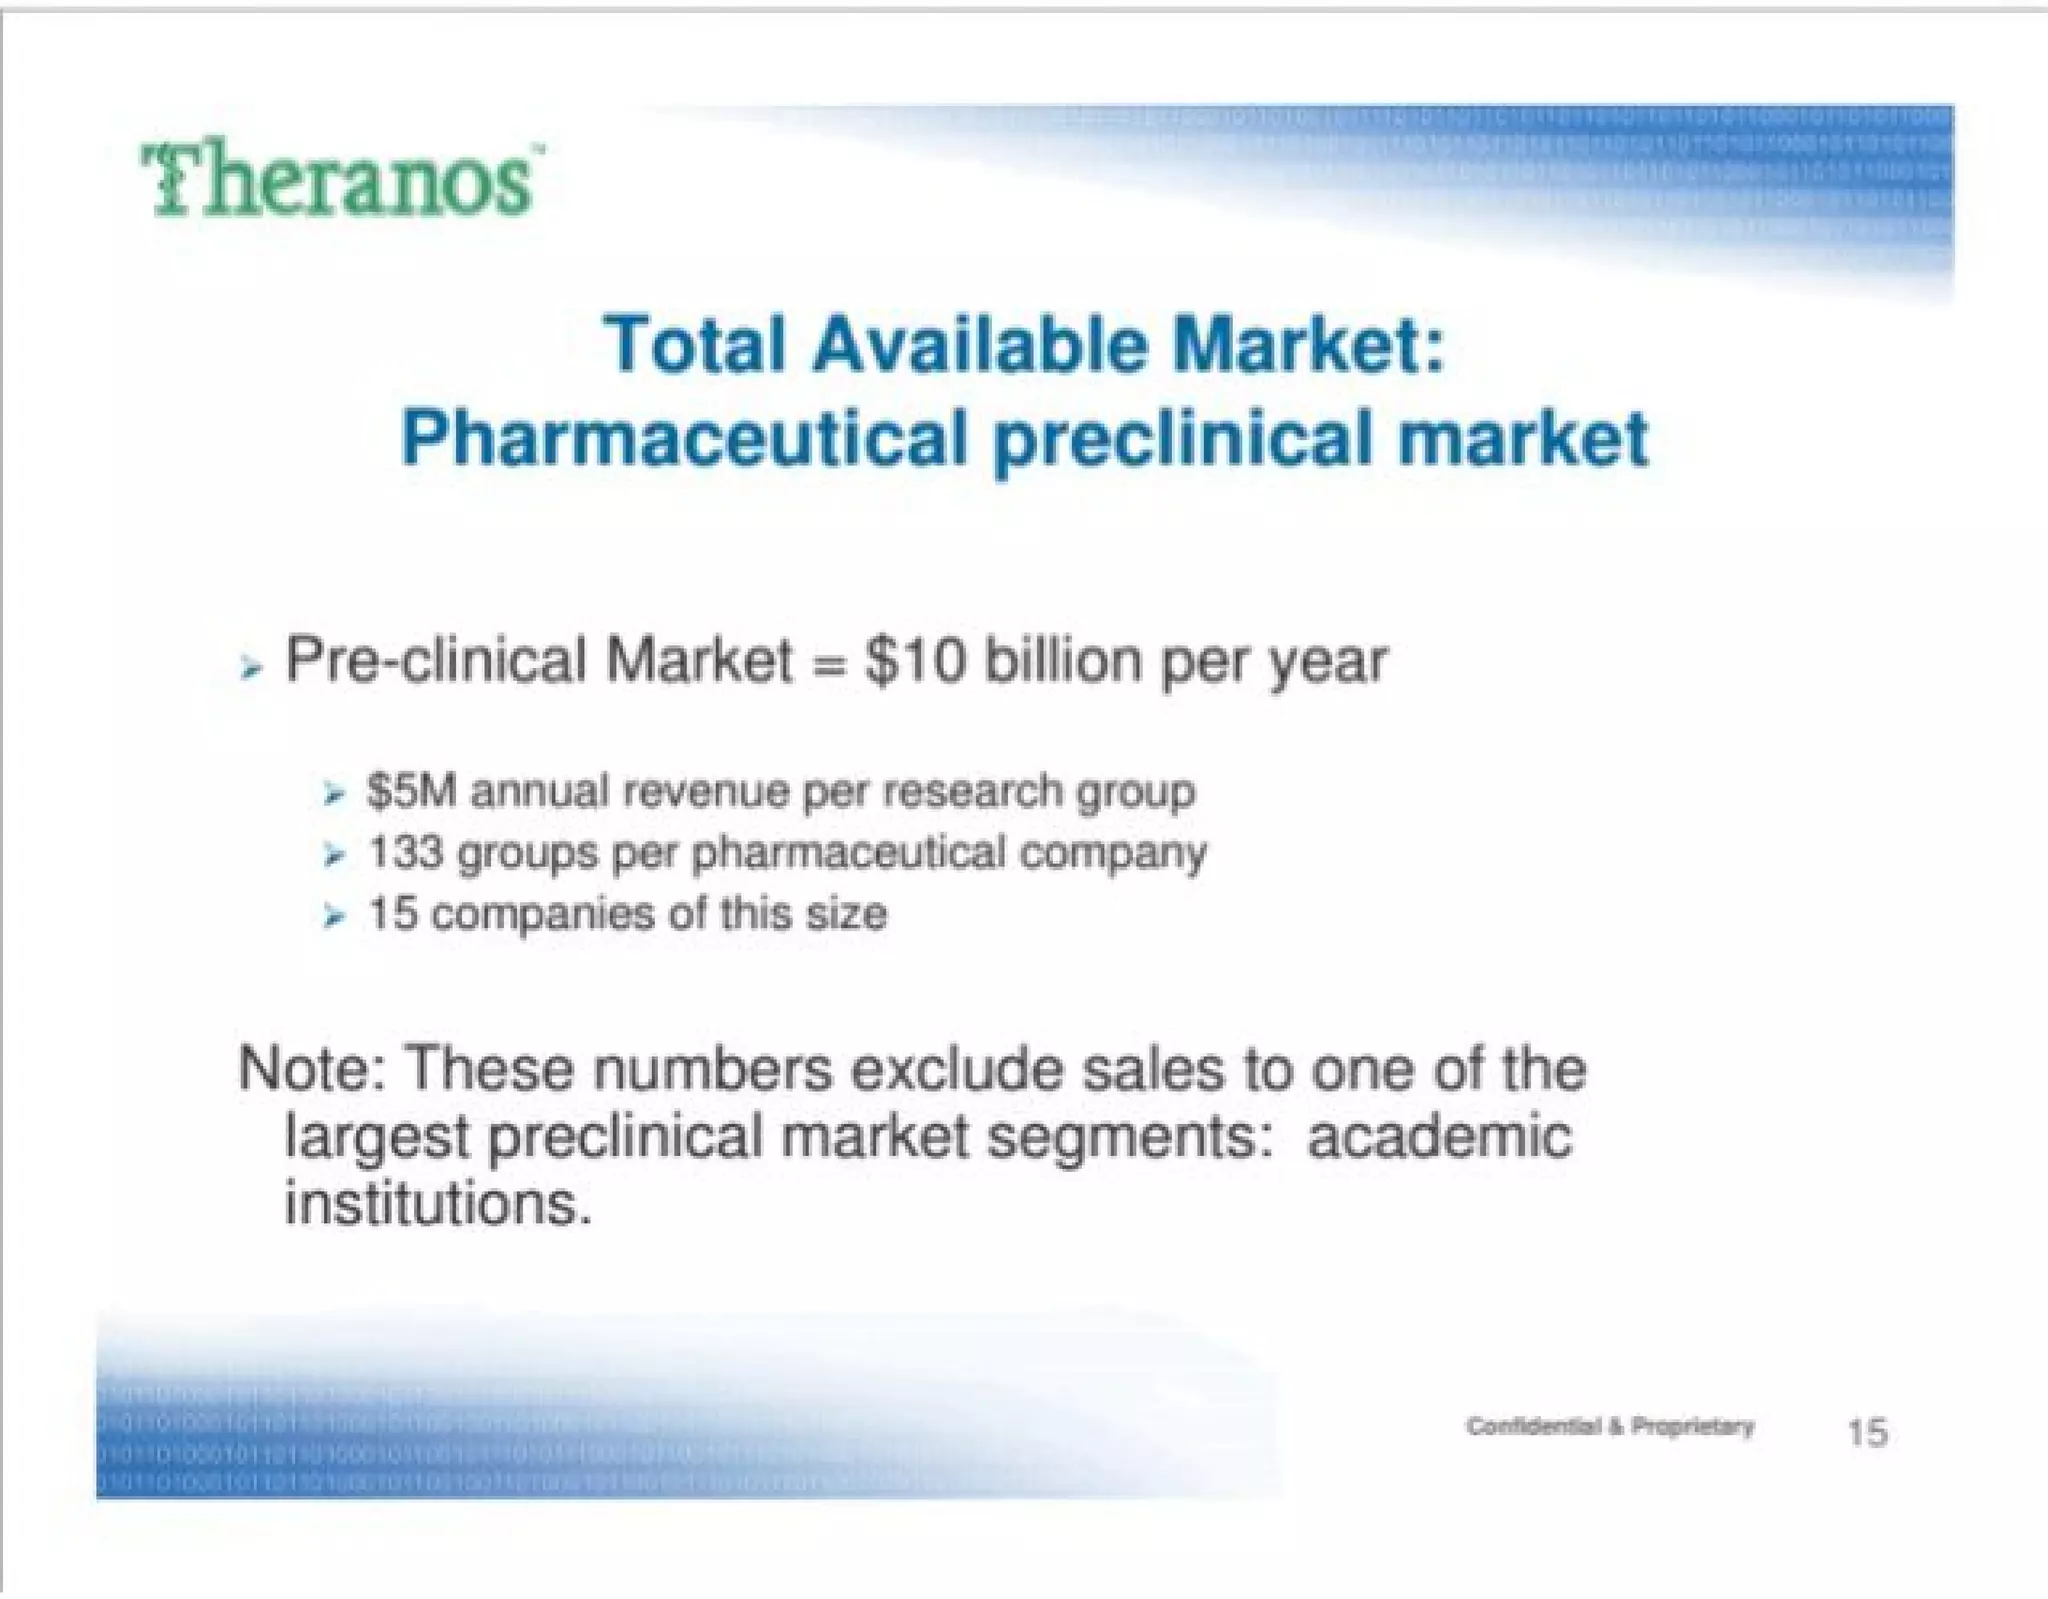
Slide 15: Pharmaceutical Preclinical Market

  • Total market: $10 Billion per year
  • Revenue per research group: $5M annually
  • Groups per pharmaceutical company: 133
  • Companies of this size: 15
  • Note: Excludes academic institutions (largest segment)

Critical Issues with Market Sizing

  1. No sources cited — all numbers are unsubstantiated
  2. Assumes 100% market capture — unrealistic for a startup
  3. No competitive analysis — how would Theranos capture this market?
  4. Revenue model unjustified — why would customers pay $7,500 per patient per 4 months?
  5. Multiple markets — company pivots between Phase IV trials, preclinical research, chemotherapy monitoring, telemedicine
  6. No evidence of customer willingness to pay — no customer validation

TAM/SAM/SOM Analysis

Metric Claimed Reality
TAM (Total Addressable Market) $39B (Phase IV) + $10B (preclinical) = $49B Unsubstantiated; assumes 100% addressability
SAM (Serviceable Addressable Market) Not defined Unknown; company has no clear focus
SOM (Serviceable Obtainable Market) Not defined 6 deals with 5 companies = minimal traction
Market Growth Rate Not addressed Unknown
Competitive Intensity Not addressed High (CROs, diagnostic companies, pharma)

Business Model

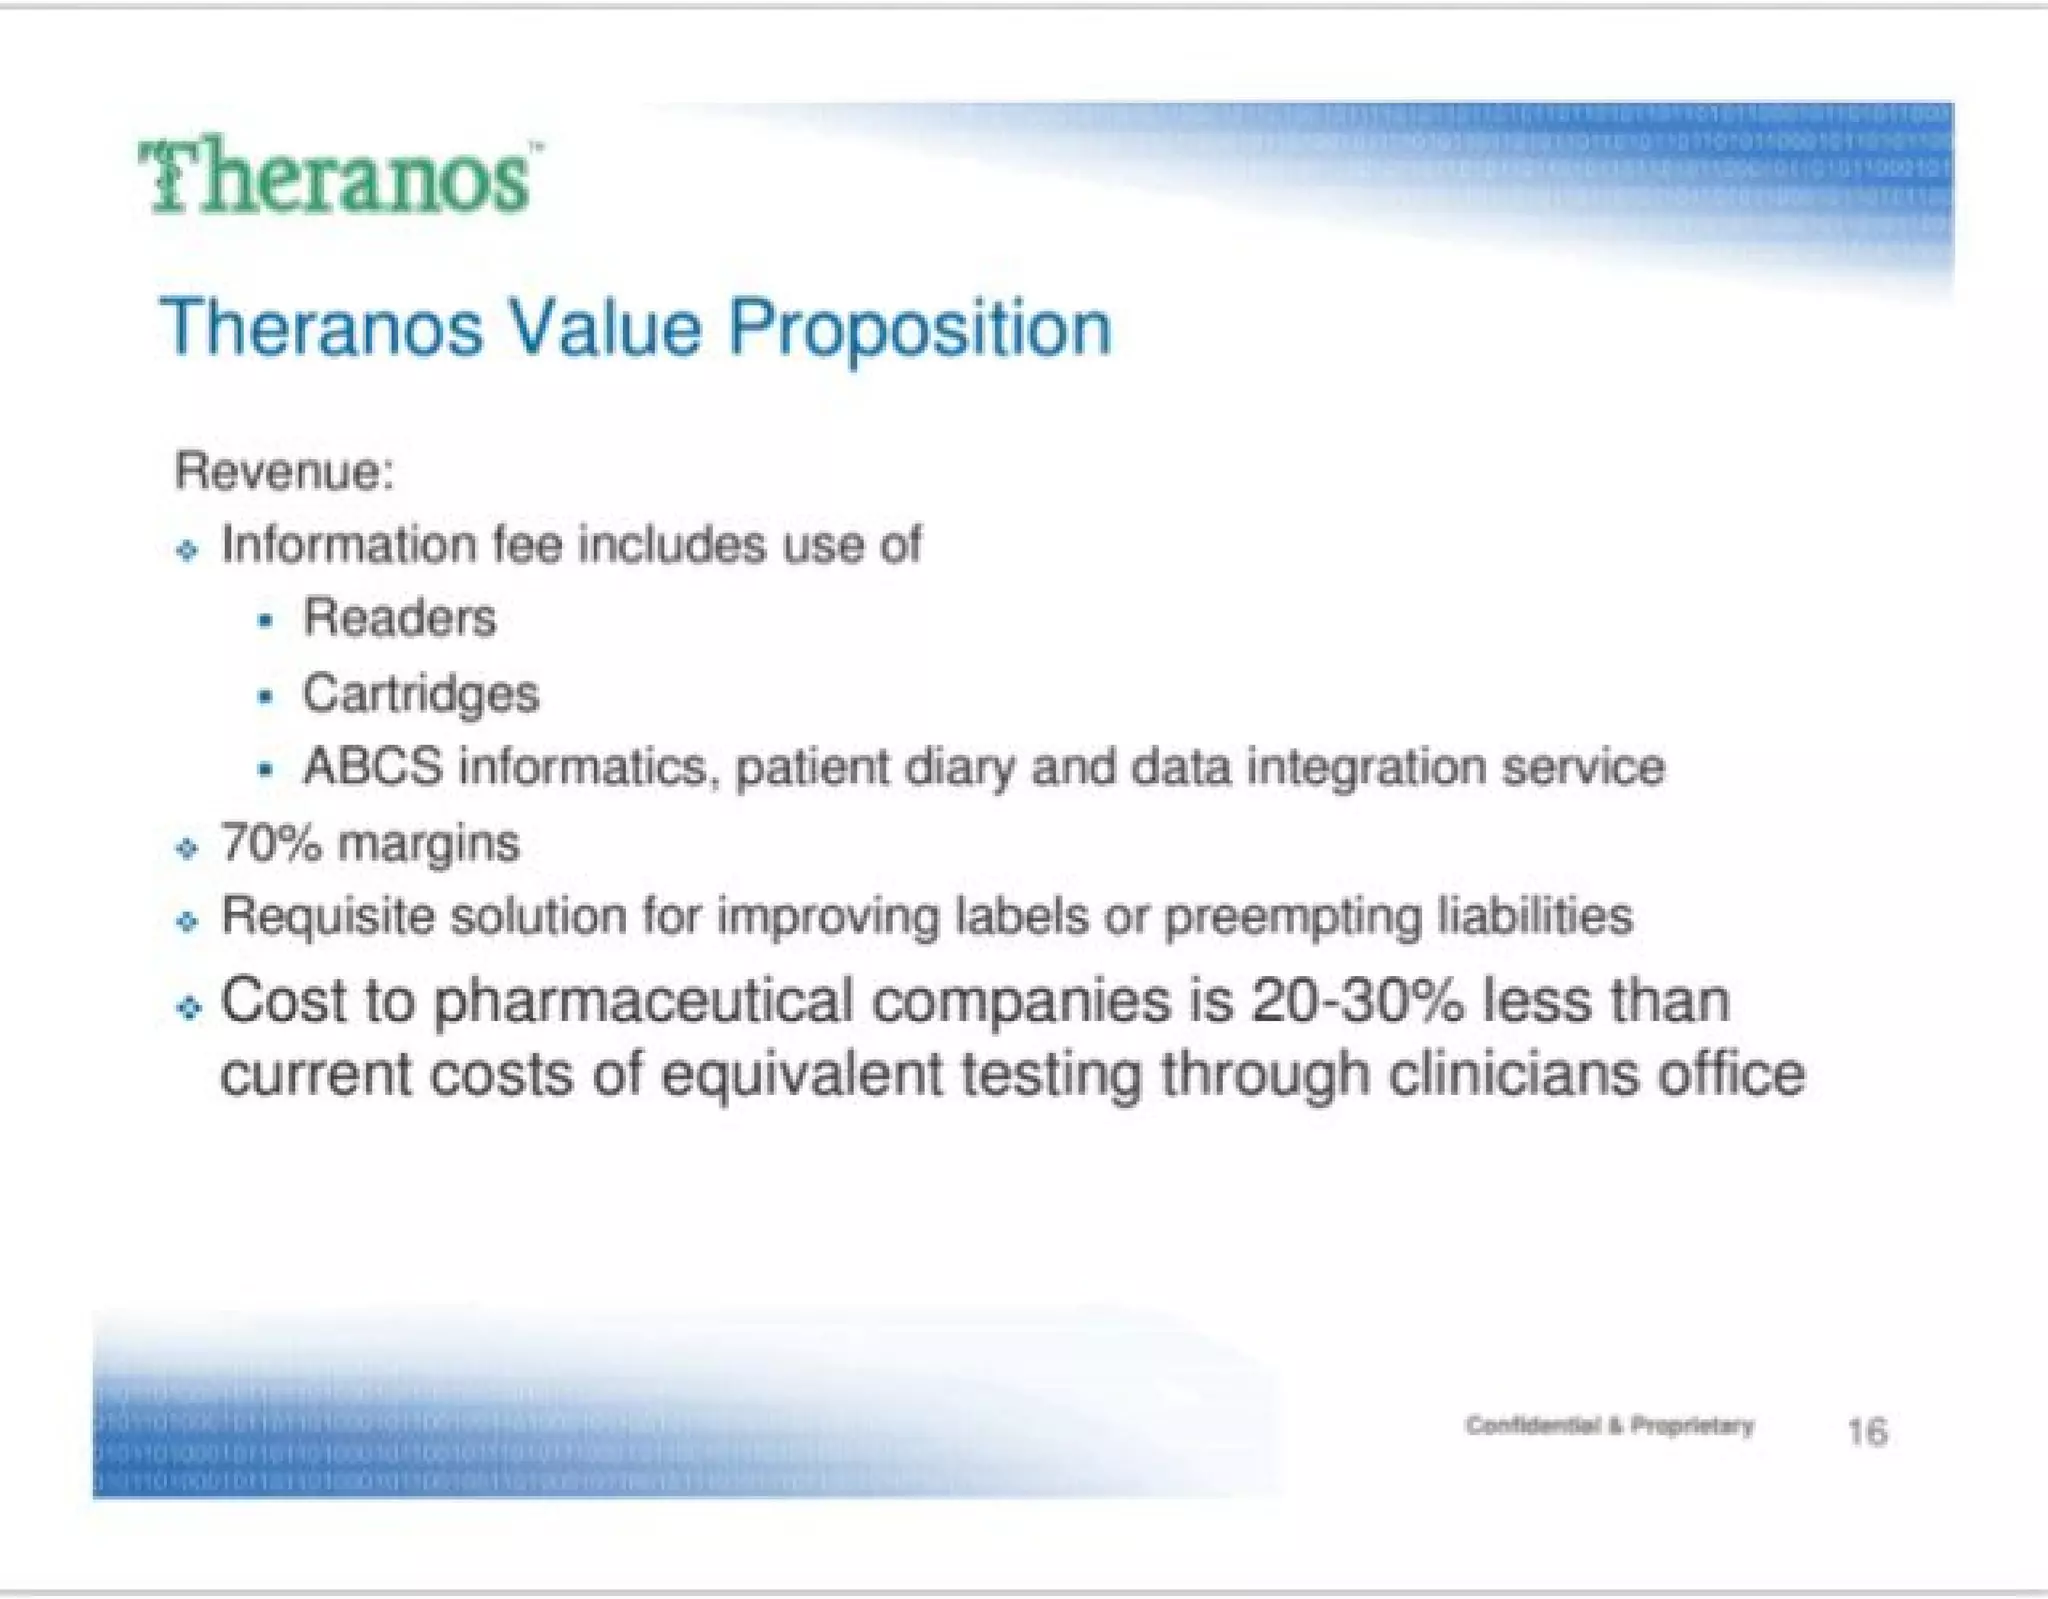
Revenue Model (Slide 16)

“Information Fee” Structure:

  • Bundled service including:
    • Hardware (Readers)
    • Consumables (Cartridges)
    • Software (ABCS informatics)
    • Service (Patient diary, data integration)

Pricing:

  • $7,500 per patient per 4 months (Slide 14)
  • Implied annual revenue per patient: $22,500

Gross Margins:

  • Claimed: 70% (Slide 16)
  • Red flag: Unrealistic for a startup with 50 employees
  • Typical medical device margins: 40-60%
  • Diagnostic companies at scale: 50-70%

Unit Economics

Metric Claimed Assessment
Price per patient per 4 months $7,500 Unjustified; no competitive comparison
Cost of goods sold ~$2,250 (30% of revenue) Unrealistic; no breakdown provided
Gross margin 70% Unrealistic for startup scale
Customer acquisition cost Not addressed Unknown
Lifetime value Not addressed Unknown
Payback period Not addressed Unknown

Revenue Projections (Slide 3)

Current Status (2006):

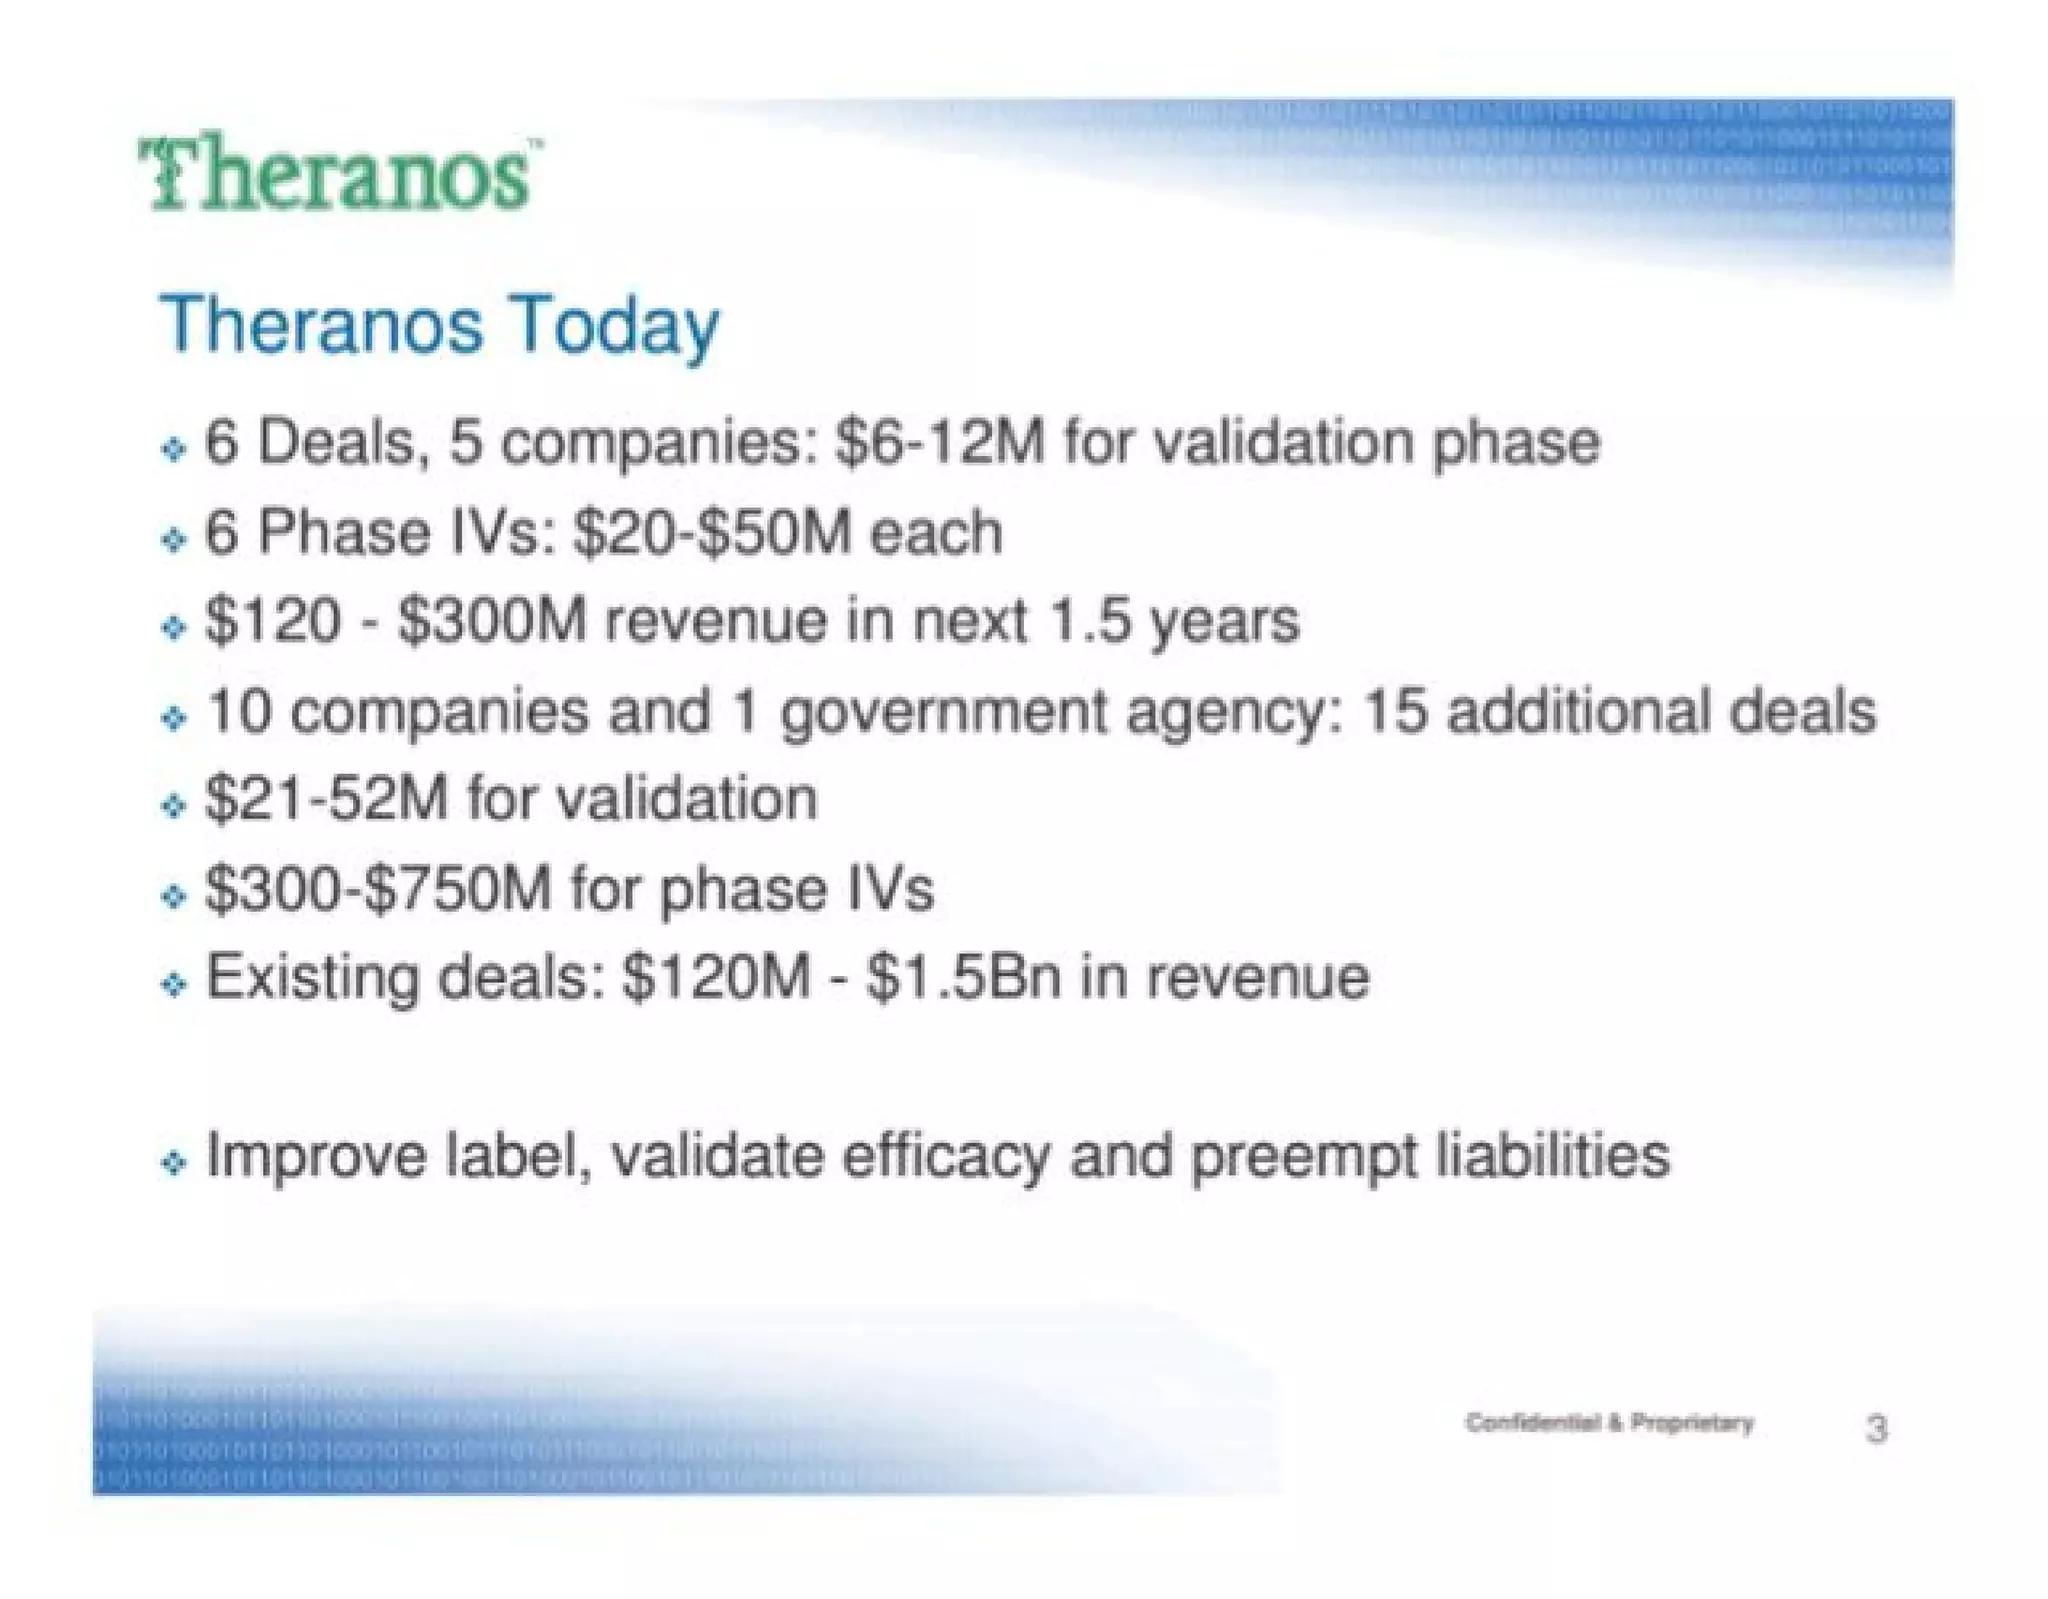
  • 6 Deals with 5 companies
  • No revenue figures disclosed
  • No indication of deal size or stage

Projections (1.5 years out):

  • $120M - $1.5B in revenue
  • Range is 12.5x spread — suggests uncertainty
  • No breakdown by customer or market segment
  • No indication of how these projections were derived

Traction & Metrics

Customer Traction (Slide 3)

Current Deals:

  • 6 Deals with 5 companies (unspecified)
  • 1 Government agency (unspecified)
  • 15 additional deals in pipeline (unspecified)

Critical Issues:

  • No customer names provided
  • No indication of deal size
  • No indication of revenue generated
  • No indication of customer satisfaction
  • No indication of product usage
  • For a Series C company, this is minimal traction

Proof Points

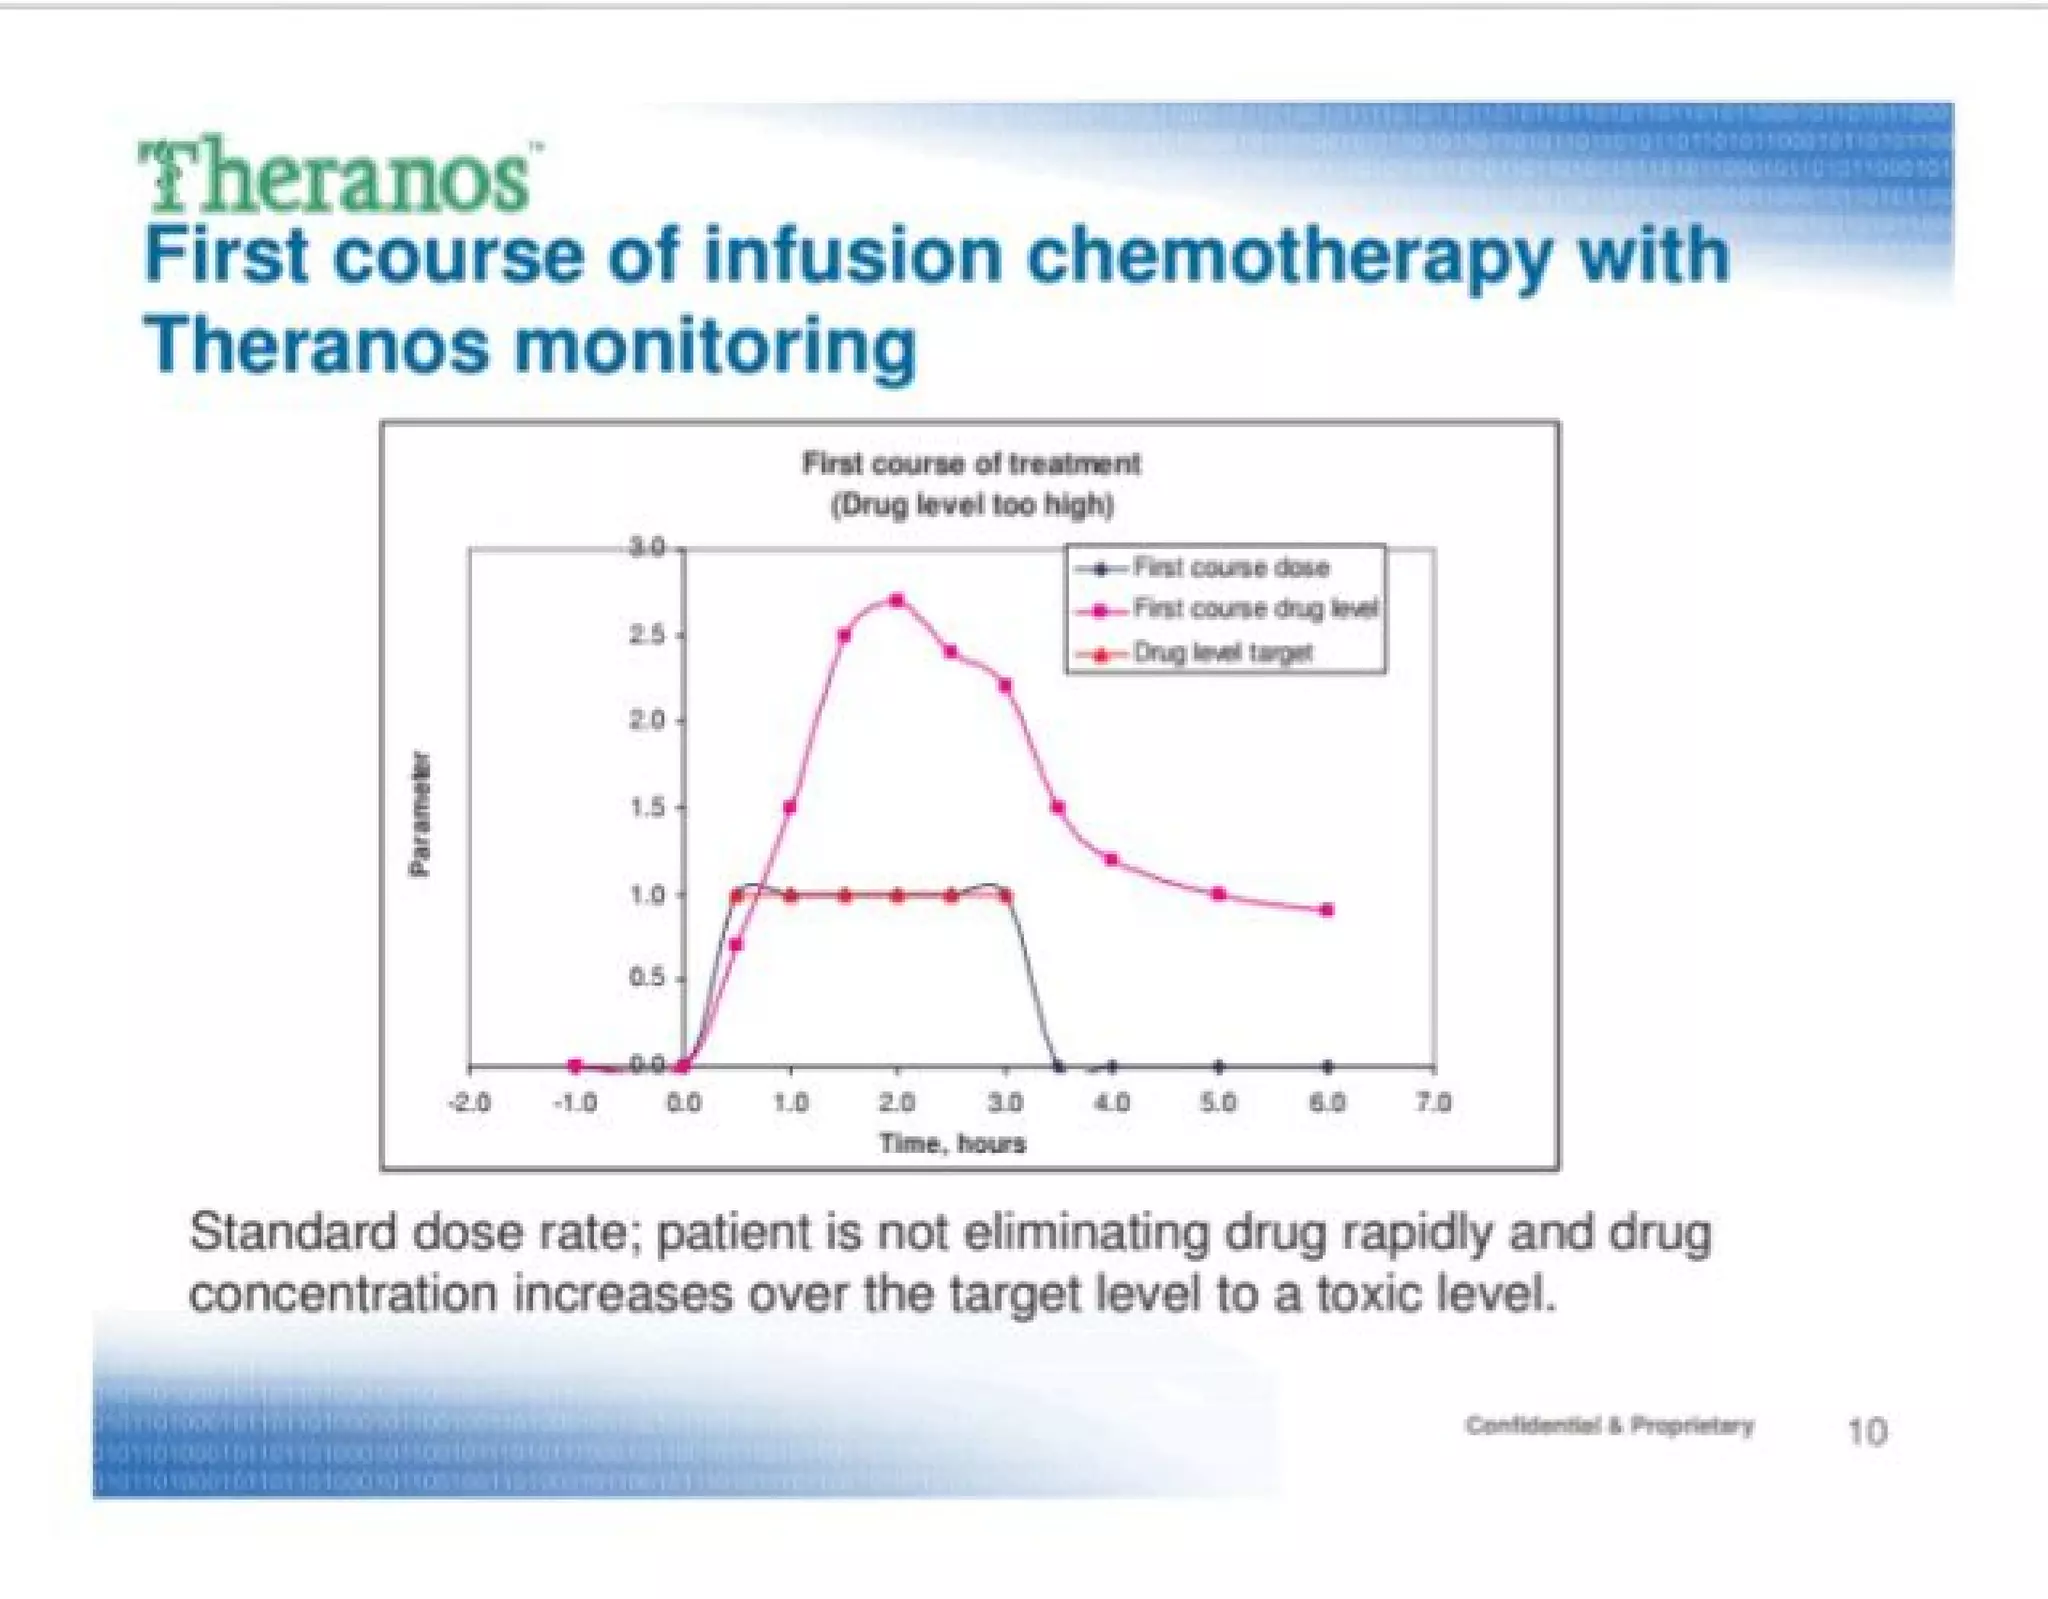
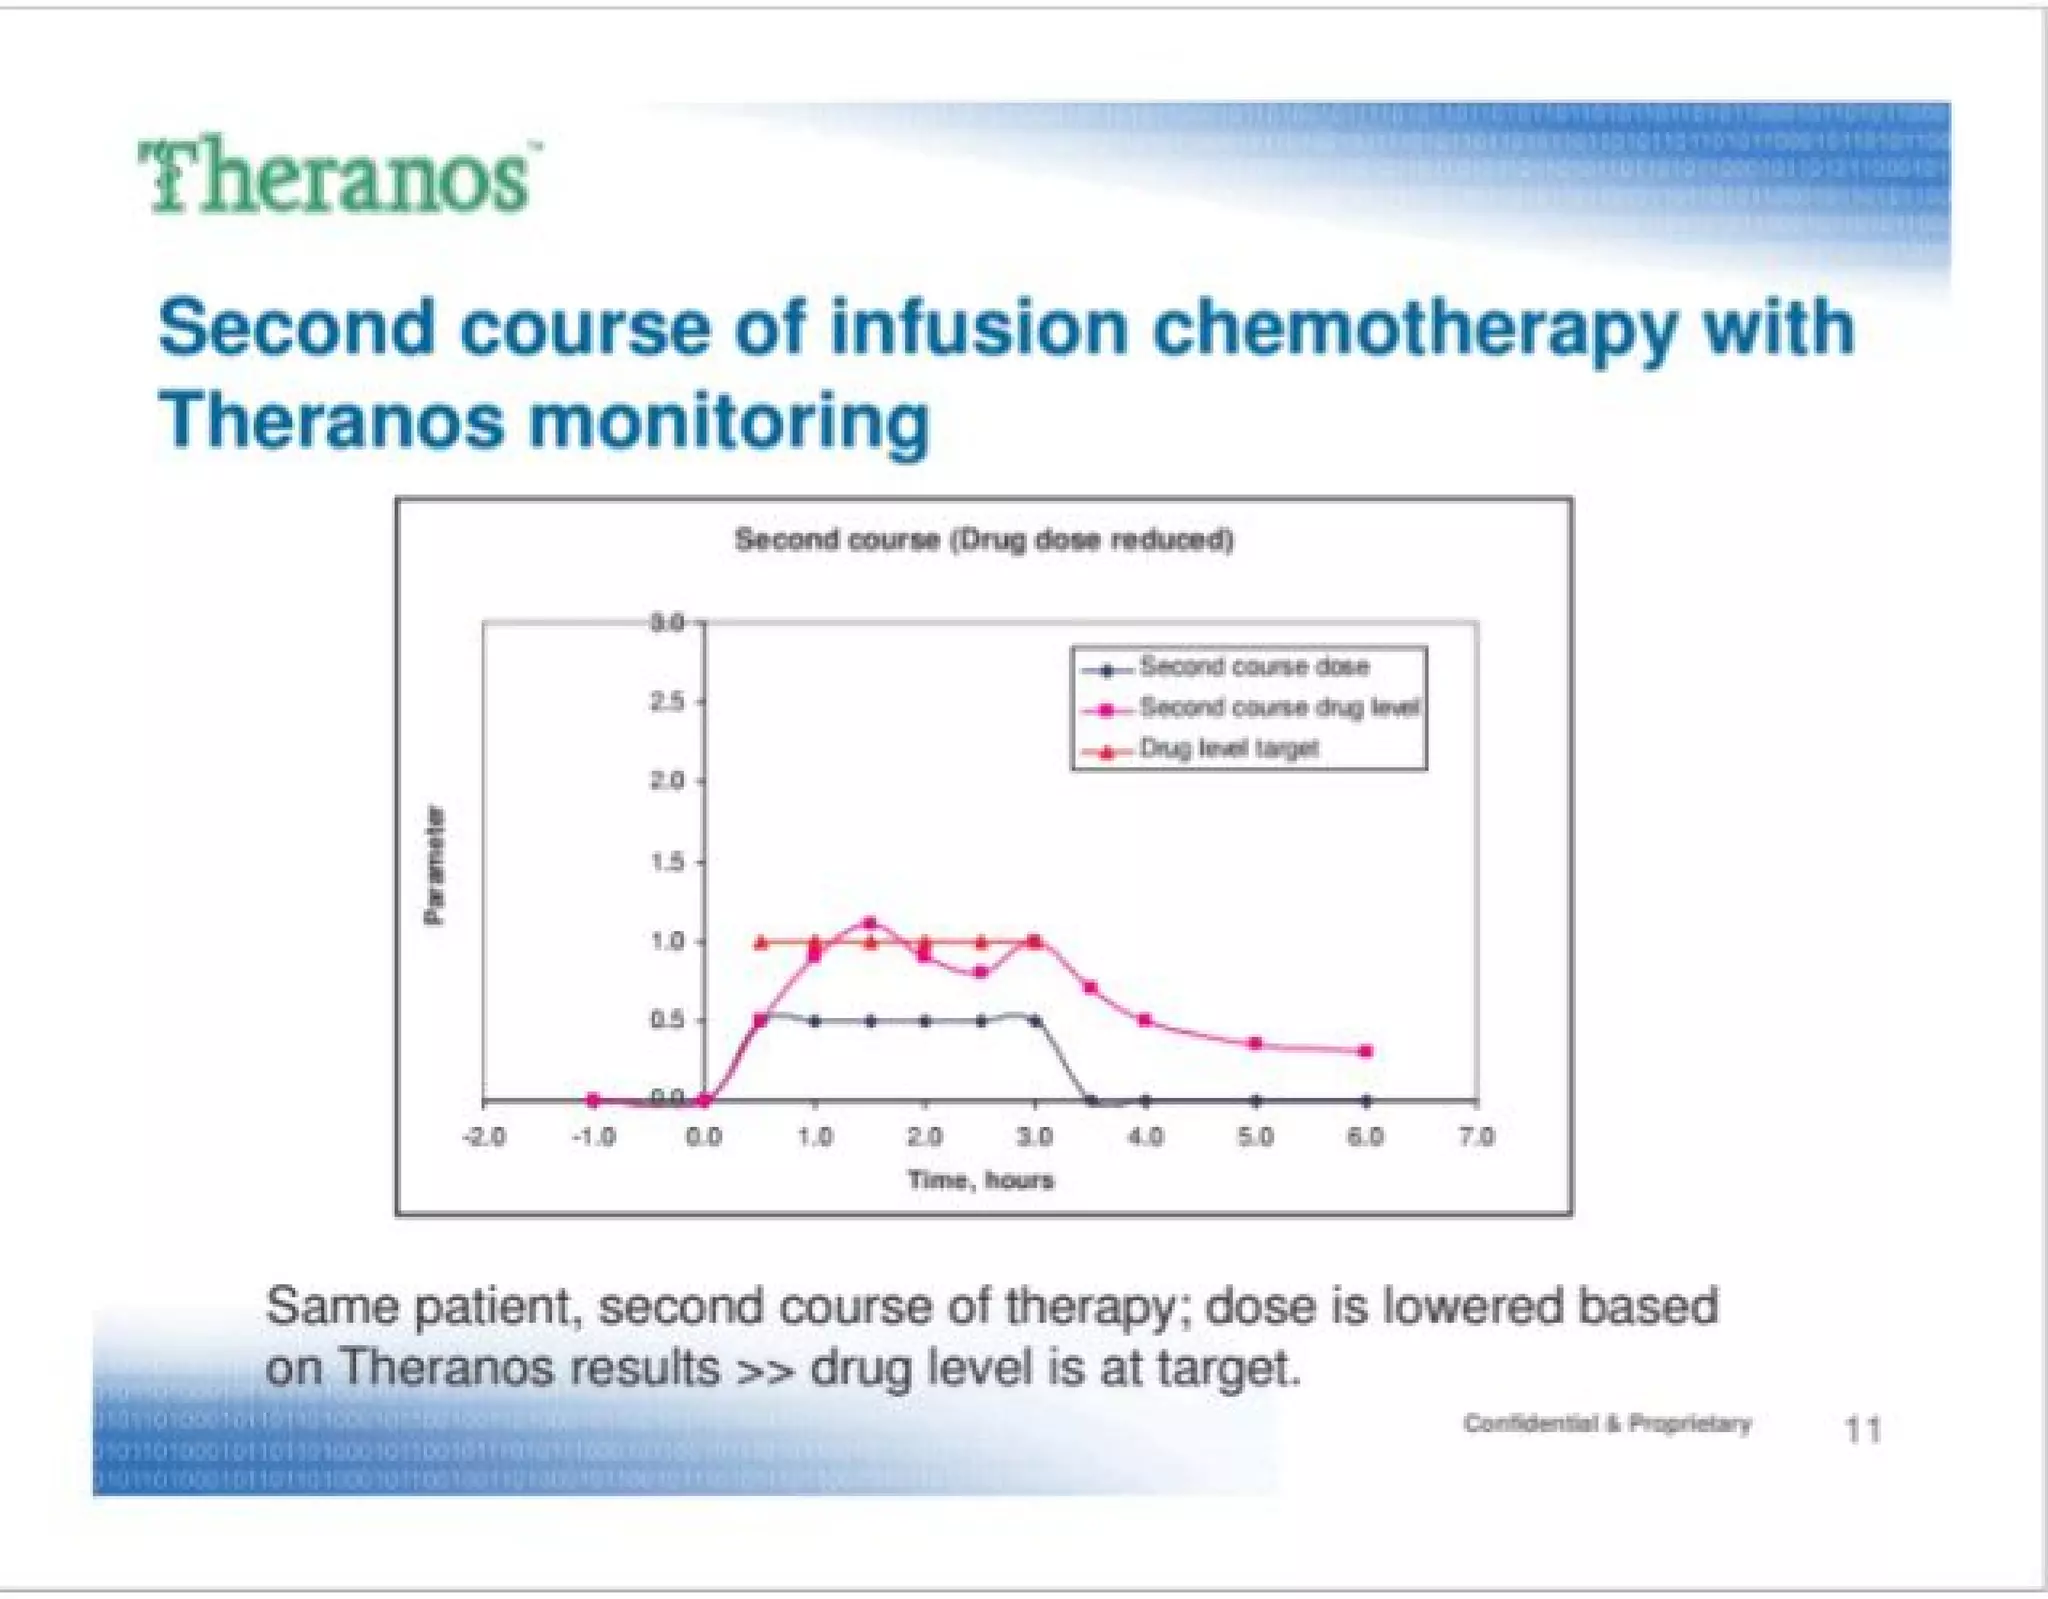
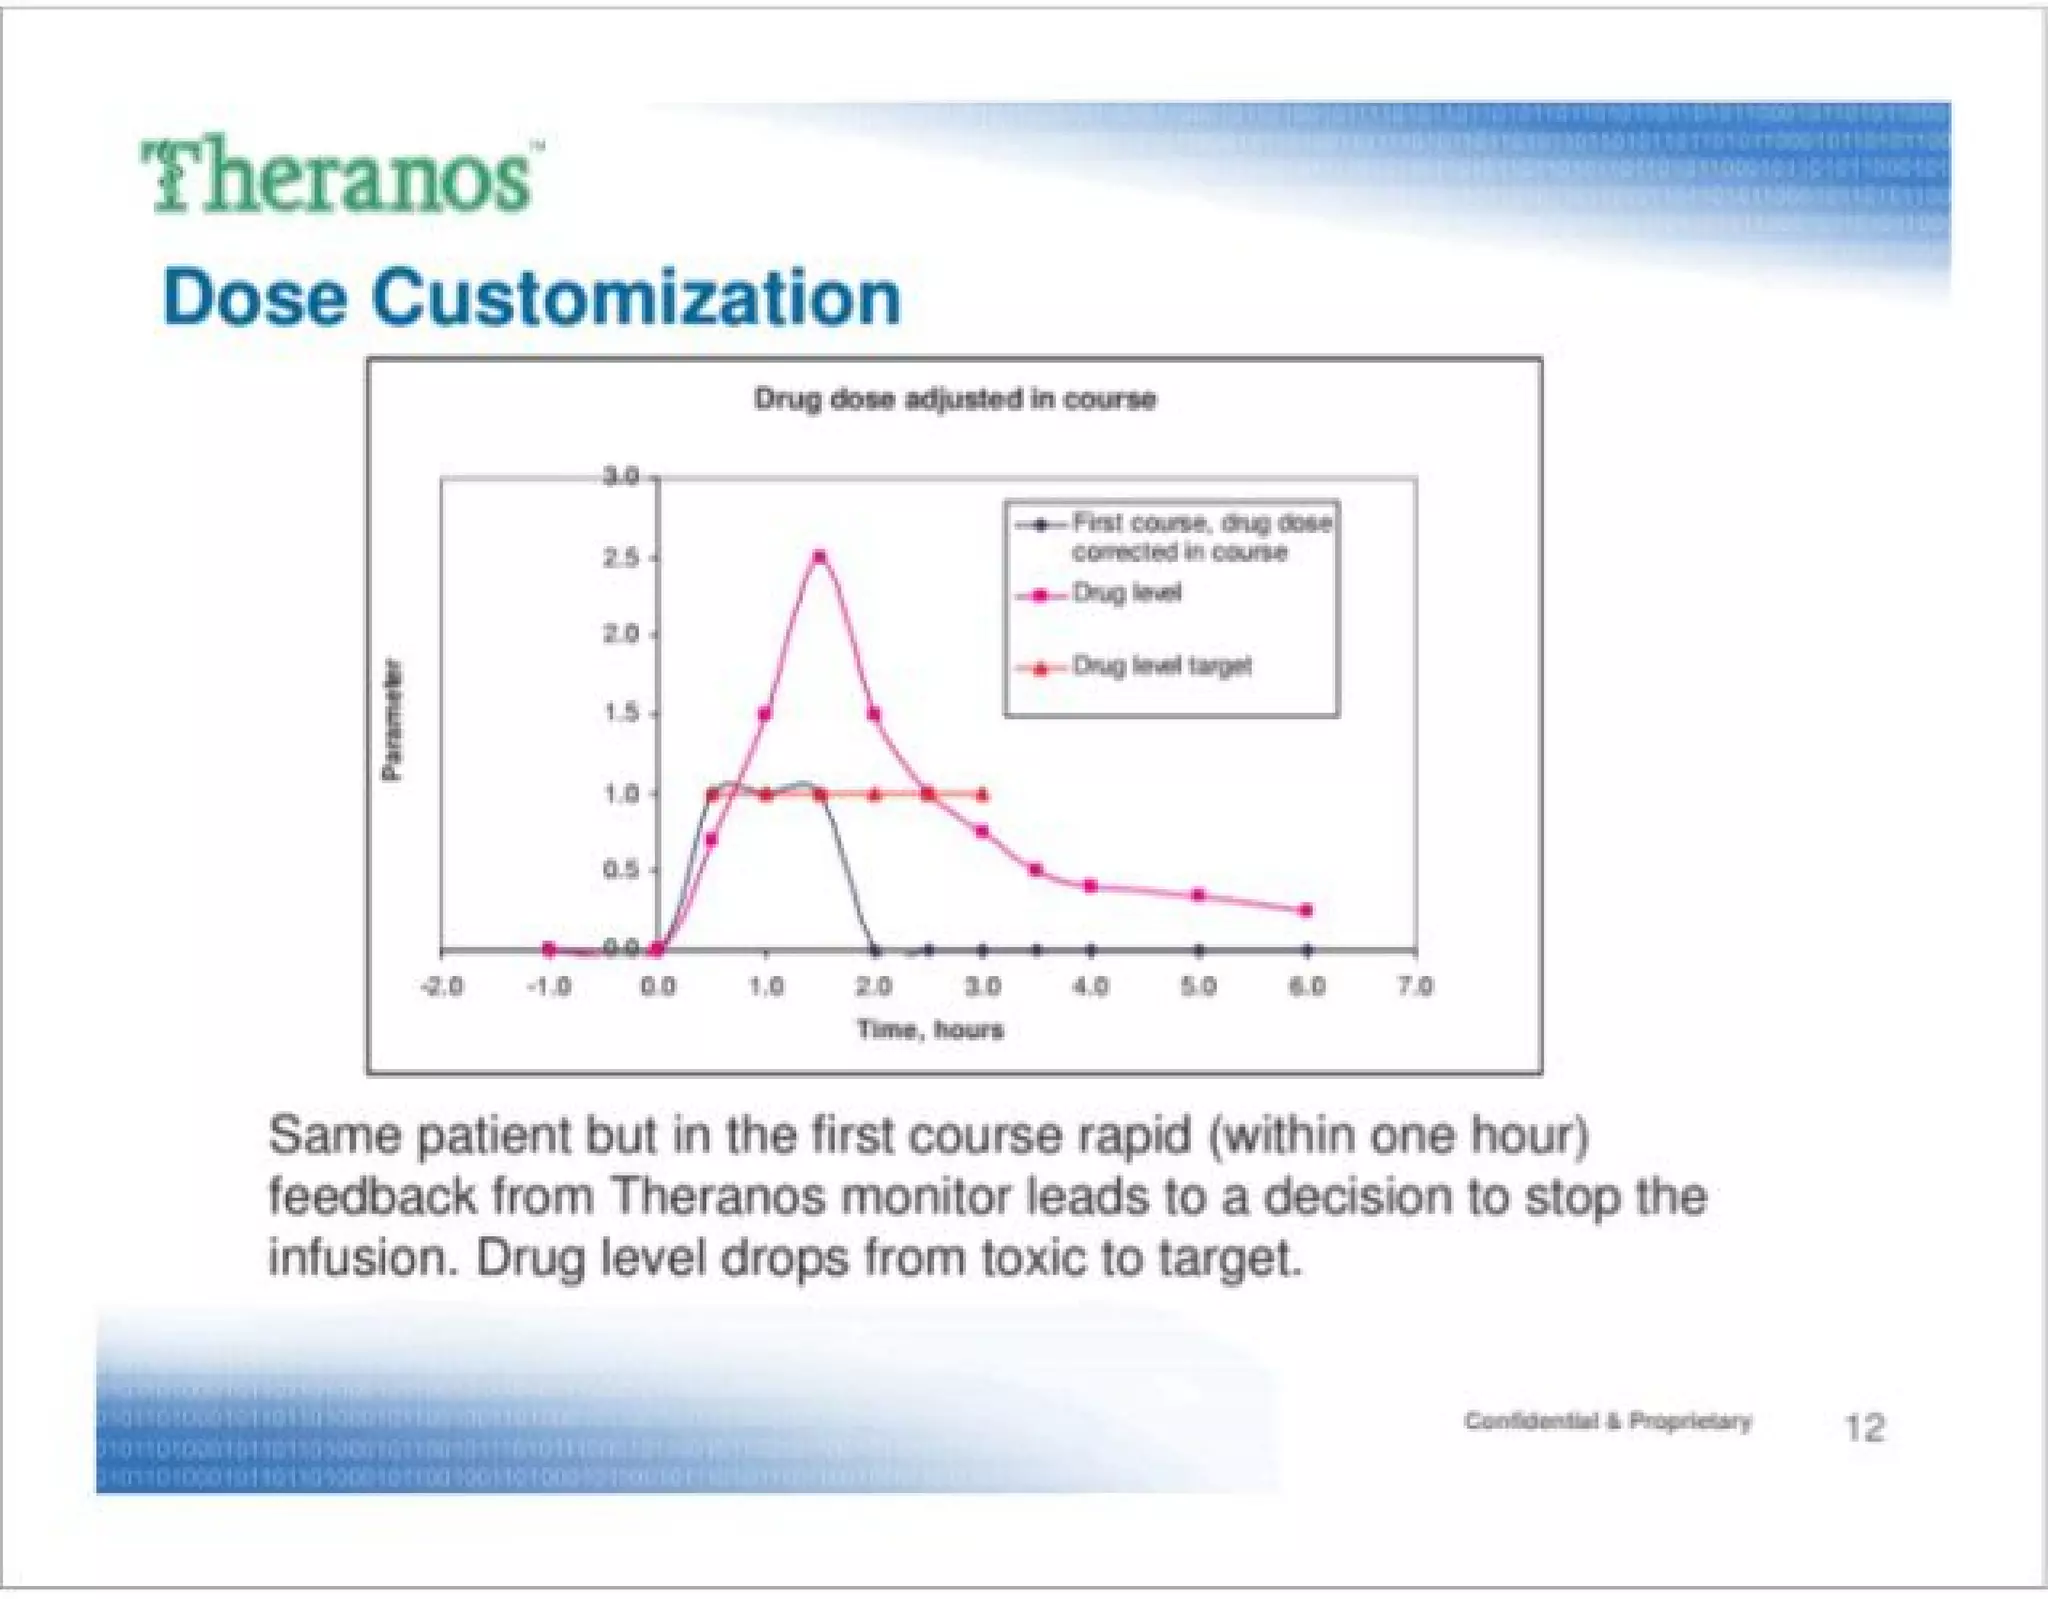
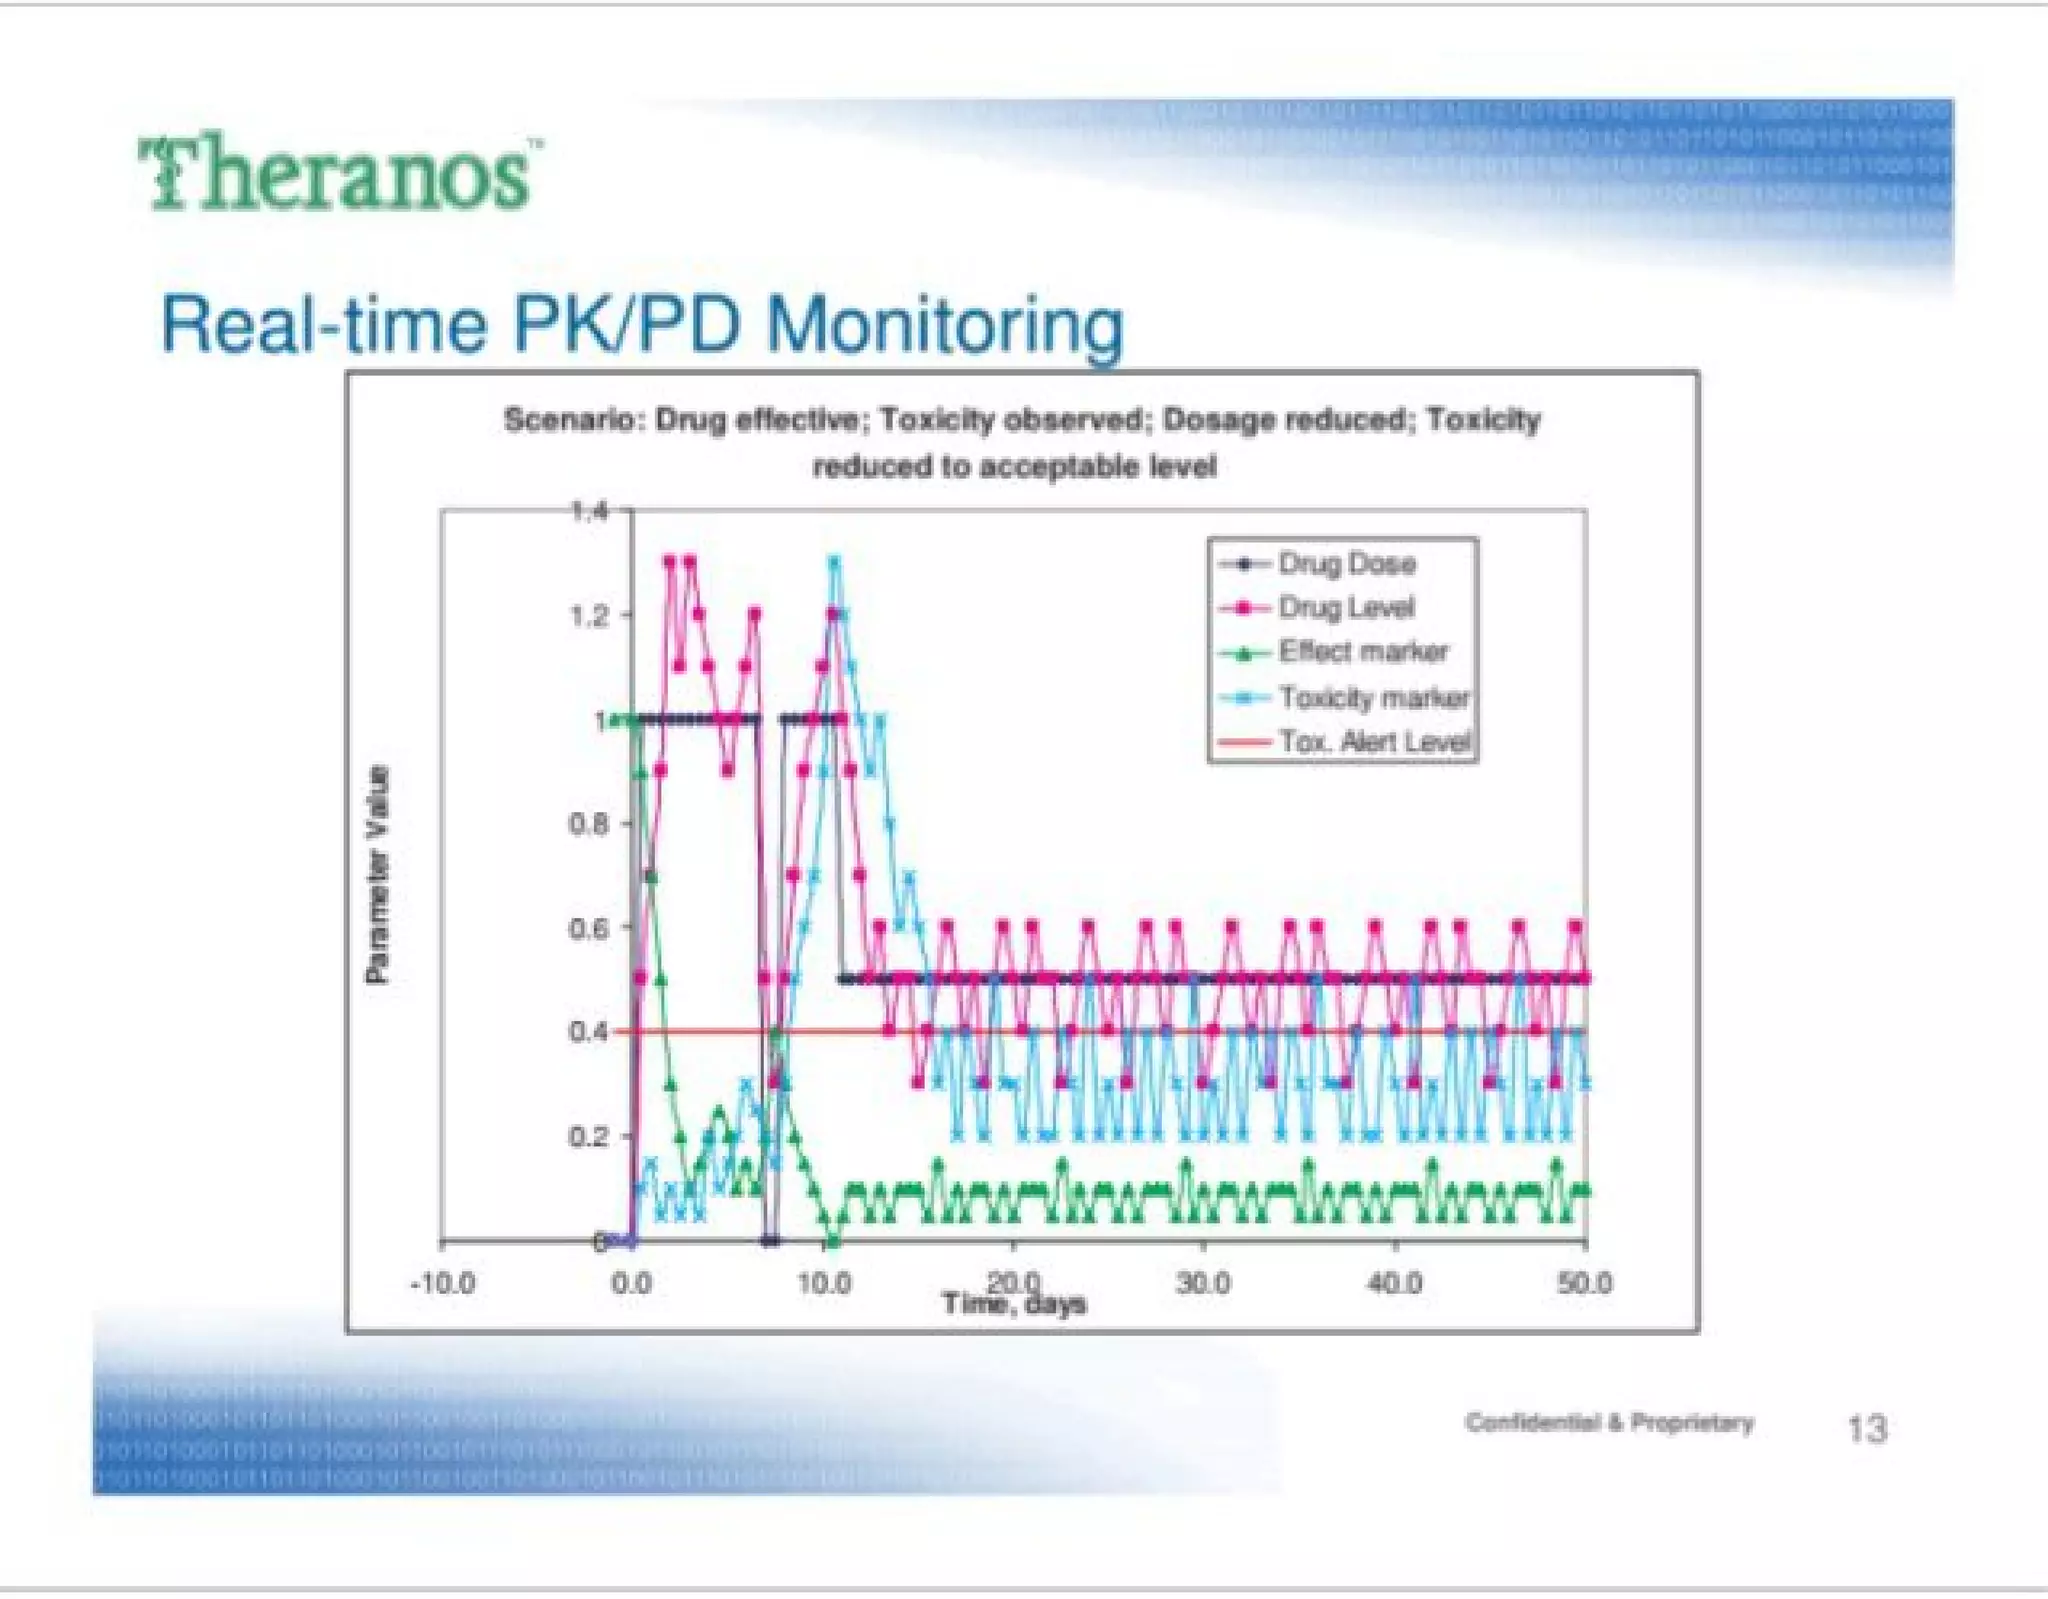
Slides 10-12: Chemotherapy Monitoring Case Study

  • Single patient, three treatment courses
  • Shows dose adjustment based on drug levels
  • Problems:
    • Only one patient (not statistically significant)
    • No clinical outcome data
    • No comparison to standard TDM
    • No indication of accuracy
    • Anecdotal evidence, not validation

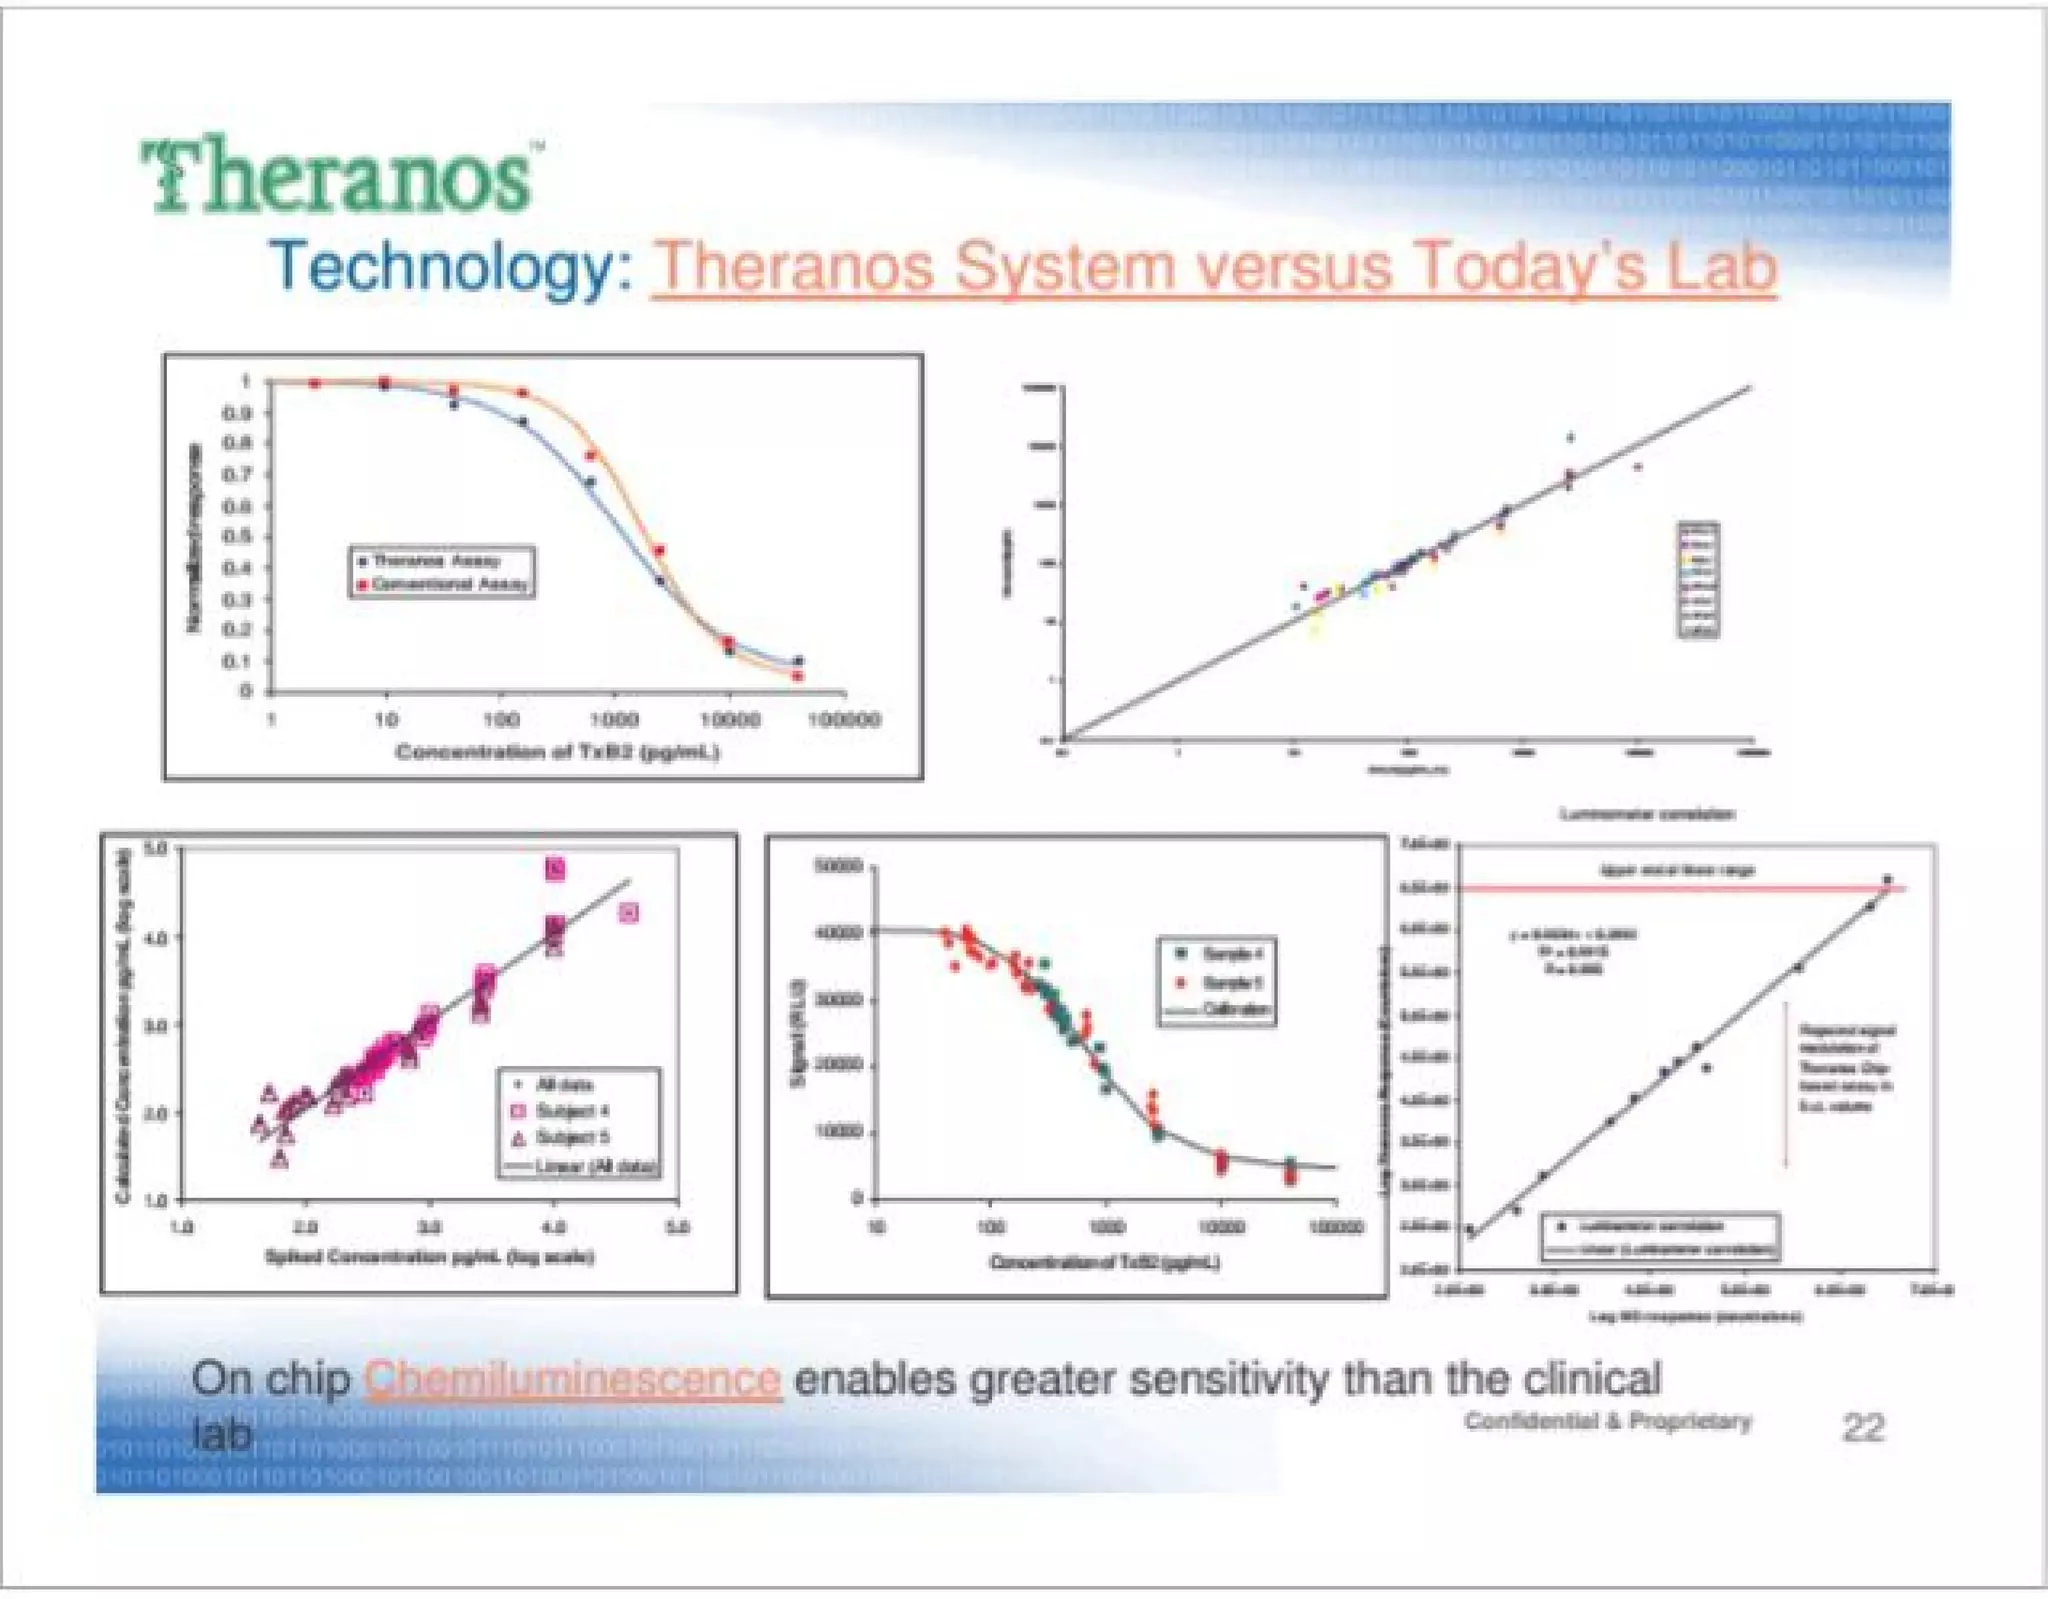
Slide 22: Technology Comparison Data

  • Four graphs comparing Theranos vs. conventional assay
  • Shows sensitivity, accuracy, calibration, linearity
  • Problems:
    • Poorly labeled graphs
    • No sample size information
    • No statistical analysis
    • No error bars or confidence intervals
    • Appears to be preliminary research data, not validated commercial product

Growth Metrics

Metric Value Assessment
Customers 5-6 companies Minimal for Series C
Revenue Not disclosed Unknown
Year-over-year growth Not disclosed Unknown
Customer retention Not disclosed Unknown
Net revenue retention Not disclosed Unknown
Burn rate Not disclosed Unknown
Runway Not disclosed Unknown

Competitive Positioning

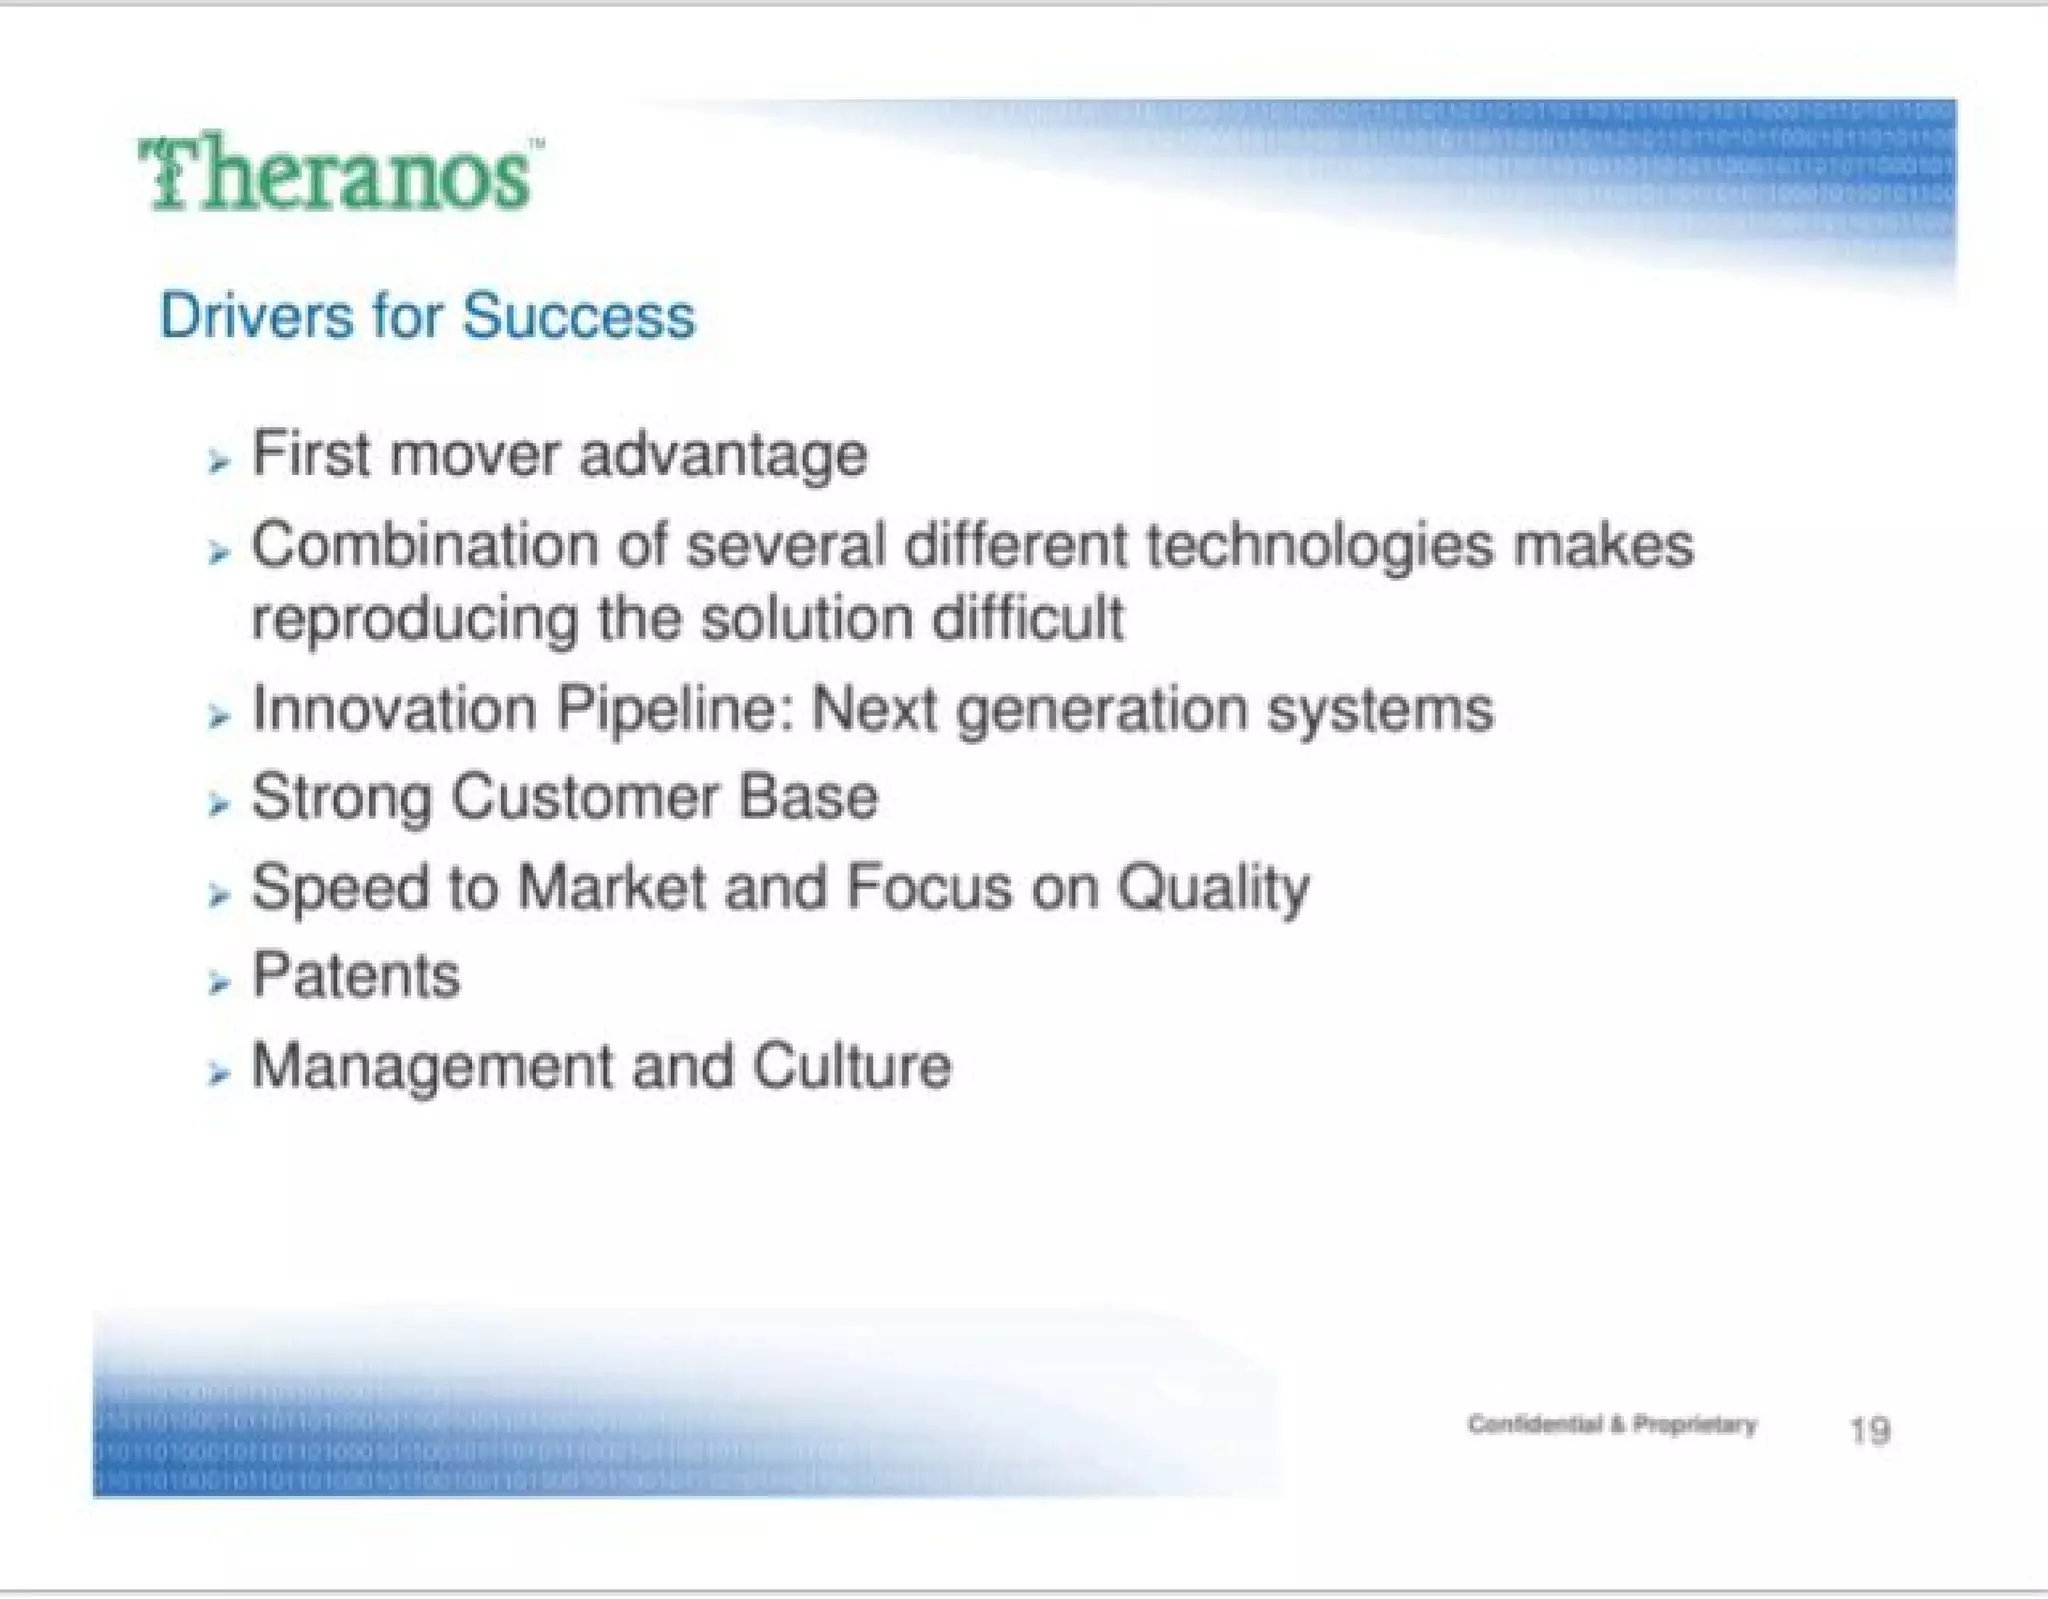
Claimed Competitive Advantages (Slide 19)

  1. First mover advantage — FALSE; TDM already exists
  2. Combination of technologies makes reproducing difficult — VAGUE; no specifics
  3. Innovation pipeline: Next generation systems — UNDEFINED; no details
  4. Strong customer base — FALSE; only 6 deals
  5. Speed to market and focus on quality — FALSE; 3 years with no commercial product
  6. Patents — MENTIONED but not detailed
  7. Management and culture — VAGUE; no specifics

Competitive Landscape (Not Addressed)

Existing competitors in therapeutic drug monitoring:

  • Hospital laboratories (HPLC, LC-MS)
  • Quest Diagnostics
  • LabCorp
  • Roche Diagnostics
  • Abbott Diagnostics
  • Siemens Healthcare Diagnostics
  • Specialized TDM companies

Theranos’s competitive advantages vs. these players:

  • Not explained
  • Not demonstrated
  • Not validated

Differentiation Claims

Claim Evidence Assessment
Results in minutes None Unsubstantiated
Smaller sample volume Slide 8 (5-10µL) Plausible but unvalidated
Better sensitivity Slide 22 (preliminary data) Preliminary, not validated
Lower cost Slide 16 (20-30% savings) Unjustified
Anywhere, anytime Slide 18 Unsubstantiated

Team

Executive Team (Slide 4)

Elizabeth Holmes - President and CEO

  • Background: Stanford Chemical and Electrical Engineering
  • Red flag: No healthcare/diagnostics background
  • Also: Genencor, Genome Institute Singapore (roles undefined)
  • Assessment: Entrepreneur/engineer, not scientist or clinician

Howard Bailey - CFO

  • Background: Former CFO at QED and Photon Dynamics (public companies)
  • Also: CFO at Occam, C-Cube; Controller at Intel
  • Assessment: Finance expert, but background is in semiconductors/optics, not healthcare

Diane Parks - CCO

  • Background: Former SVP Biotherapeutics and Managed Care at Genentech
  • Also: VP Marketing at Aventis
  • Assessment: Healthcare marketing/business development, not diagnostics expert

John Howard - Senior VP Products

  • Background: Former President, Panasonic Semiconductor; President, IBM Microelectronics Division
  • Red flag: Semiconductor/microelectronics background, not diagnostics
  • Assessment: Hardware/tech executive, not diagnostics expert

Dr. Ian Gibbons - Senior Director Assay Development

  • Background: Former Senior Director at Syva, ACLARA, Biotrack, AmCell, First Medical
  • Assessment: Only real scientist with actual assay development experience
  • Red flag: Not Chief Scientific Officer; not in leadership position

Tim Kemp - Senior Director Informatics Systems

  • Background: Former lead systems engineer, IBM Embedded Systems
  • Assessment: IT/systems expert, not diagnostics expert

Board of Directors (Slide 4)

Donald L. Lucas - Chairman

  • 46-year veteran of venture capital business
  • Assessment: VC expert, not healthcare expert

Elizabeth Holmes - CEO

  • Red flag: CEO on own board (governance concern)

Peter Thomas - Board Member

  • Founder and Managing Director, ATA Ventures
  • General Partner, Institutional Venture Partners
  • Assessment: VC expert, not healthcare expert

Channing Robertson - Board Member

  • Stanford Senior Associate Dean of Engineering
  • Assessment: Academic credibility, but engineering dean, not diagnostics expert

Team Assessment

Dimension Assessment
Healthcare expertise WEAK - only Dr. Gibbons has relevant background
Diagnostics expertise WEAK - no one from major diagnostic companies
FDA regulatory expertise ABSENT - no regulatory expert
Clinical laboratory expertise ABSENT - no lab director or pathologist
Manufacturing expertise ABSENT - no manufacturing expert
Alignment with business POOR - team is tech/semiconductor focused, not healthcare
Leadership depth WEAK - 50 employees total, limited functional expertise

Go-to-Market Strategy

Market Entry Strategy (Not Clearly Defined)

Slide 14: Phase IV Clinical Trials

  • Target: Pharmaceutical companies
  • Approach: Not specified
  • Sales strategy: Not specified
  • Customer acquisition cost: Not addressed

Slide 15: Preclinical Research

  • Target: Pharmaceutical research groups
  • Approach: Not specified
  • Sales strategy: Not specified
  • Customer acquisition cost: Not addressed

Slide 7: ABCS Telemedicine System

  • Target: HMOs, pharmacies, patients
  • Approach: Not specified
  • Sales strategy: Not specified
  • Customer acquisition cost: Not addressed

Distribution Channels

Mentioned but not detailed:

  • Direct sales to pharmaceutical companies
  • Direct sales to research groups
  • Telemedicine platform (unclear how this works)
  • “Partner” (undefined on Slide 7)

Sales Force Plan (Slide 20)

Objective: “Add to Theranos business development and sales force”

  • No details provided:
    • How many salespeople will be hired?
    • What’s the sales target?
    • What’s the sales cycle?
    • What’s the customer acquisition cost?
    • What’s the sales compensation structure?

Marketing Strategy

Not addressed in the deck

  • No brand positioning
  • No marketing budget
  • No customer acquisition strategy
  • No messaging framework
  • No competitive positioning

The Ask

Capital Raise (Slide 20)

Total Offering: $30M

  • Existing Investors: $15-20M
  • New Investors: $10-15M

Structure: CFP (Convertible Preferred)

  • Terms not explained
  • Conversion terms not specified
  • Liquidation preference not specified
  • Dividend rate not specified

Use of Proceeds (Slide 20)

Stated Objective:
“Pre-IPO transaction to facilitate rapid scaling of Theranos production and manufacturing infrastructure and add to Theranos business development and sales force”

Critical Issues:

  • No detailed breakdown of capital allocation
  • No timeline for deployment
  • No milestones tied to capital
  • No specific targets for manufacturing capacity
  • No specific targets for sales force size
  • Investors are being asked to invest $30M without clear use of proceeds

Implied Use of Proceeds (Inferred)

Category Estimated % Assessment
Manufacturing infrastructure Unknown No manufacturing plan provided
Sales force Unknown No sales plan provided
R&D Unknown Not mentioned
Operations Unknown Not mentioned
Working capital Unknown Not mentioned

Valuation

Not provided in the deck

  • Pre-money valuation: Not stated
  • Post-money valuation: Not stated
  • Price per share: Not stated
  • Dilution to existing shareholders: Not stated
  • Critical information missing for Series C investors

Path to Exit

Slide 20: “Pre-IPO transaction”

  • Suggests IPO is imminent
  • But company has:
    • No FDA approvals
    • No commercial product
    • Minimal customer traction
    • No revenue disclosed
    • IPO is unrealistic

Investor Deep Dive

Executive summary, strengths & red flags

Executive Summary

The Theranos Series C pitch deck is a masterclass in fraudulent pitching that successfully raised $28.5M+ despite lacking fundamental validation. Across 23 slides, the company makes extraordinary claims about blood testing technology with virtually no supporting evidence, constantly pivots its business model (6+ different markets), and reveals fundamental technical problems while attempting to hide them. The deck demonstrates how charisma, vague language, investor backing, and FOMO can overcome the absence of peer-reviewed publications, FDA approvals, customer validation, or clinical data. This case study is essential reading for understanding how sophisticated fraud can be perpetrated through professional pitch decks.

More Pitch Decks To Study

Compare structure, fundraising context, and investor-facing story across similar startup decks.