Compare your deck to Wefox

Compare Your Deck

Wefox Pitch Deck (2016)

Fintech
Stage: Series A
Raised: $28M
Year: 2016
Slides: 15
Outcome: Valued at $4.5B (2022)

Pitch Deck

1 / 15
Wefox pitch deck - The Opening: Clear positioning and timing
Click to expand

Deck Analysis

This deck for Wefox (Series A, 2016) positions the company as a technology-first, full-stack digital insurer focused on indirect distribution through advisors and brokers. It emphasizes superior unit economics driven by automation, analytics-driven underwriting, and a distribution strategy that leverages existing intermediaries rather than trying to convert customers directly. Notable elements include clear market sizing, operational metrics (automation/STP ratios), underwriting playbooks, and a coherent growth flywheel — all used to justify scale and profitability while pitching investors on a capital-efficient path to expansion.

The Opening: Clear positioning and timing

The Opening: Clear positioning and timing

Slide 1 is a classic title slide that sets the tone: ‘The Most Profitable Digital Insurer’ with a date stamp (March 2021). It’s simple but bold — the claim immediately frames the narrative around profitability, not just growth or product. For investors and partners, this is an important signal that the company is focused on sustainable unit economics rather than vanity metrics.

The effectiveness lies in clarity and confidence. The slide doesn’t bury the message in visuals or data; it establishes an expectation that the following slides will justify the profitability claim. Founders can learn to lead with a single, differentiated thesis that guides the rest of the deck instead of trying to cover every claim at once.

Key Takeaway: Open with one strong, differentiated claim that frames the entire story and sets expectations for the metrics and evidence to follow.
Value chain control and full-stack narrative

Value chain control and full-stack narrative

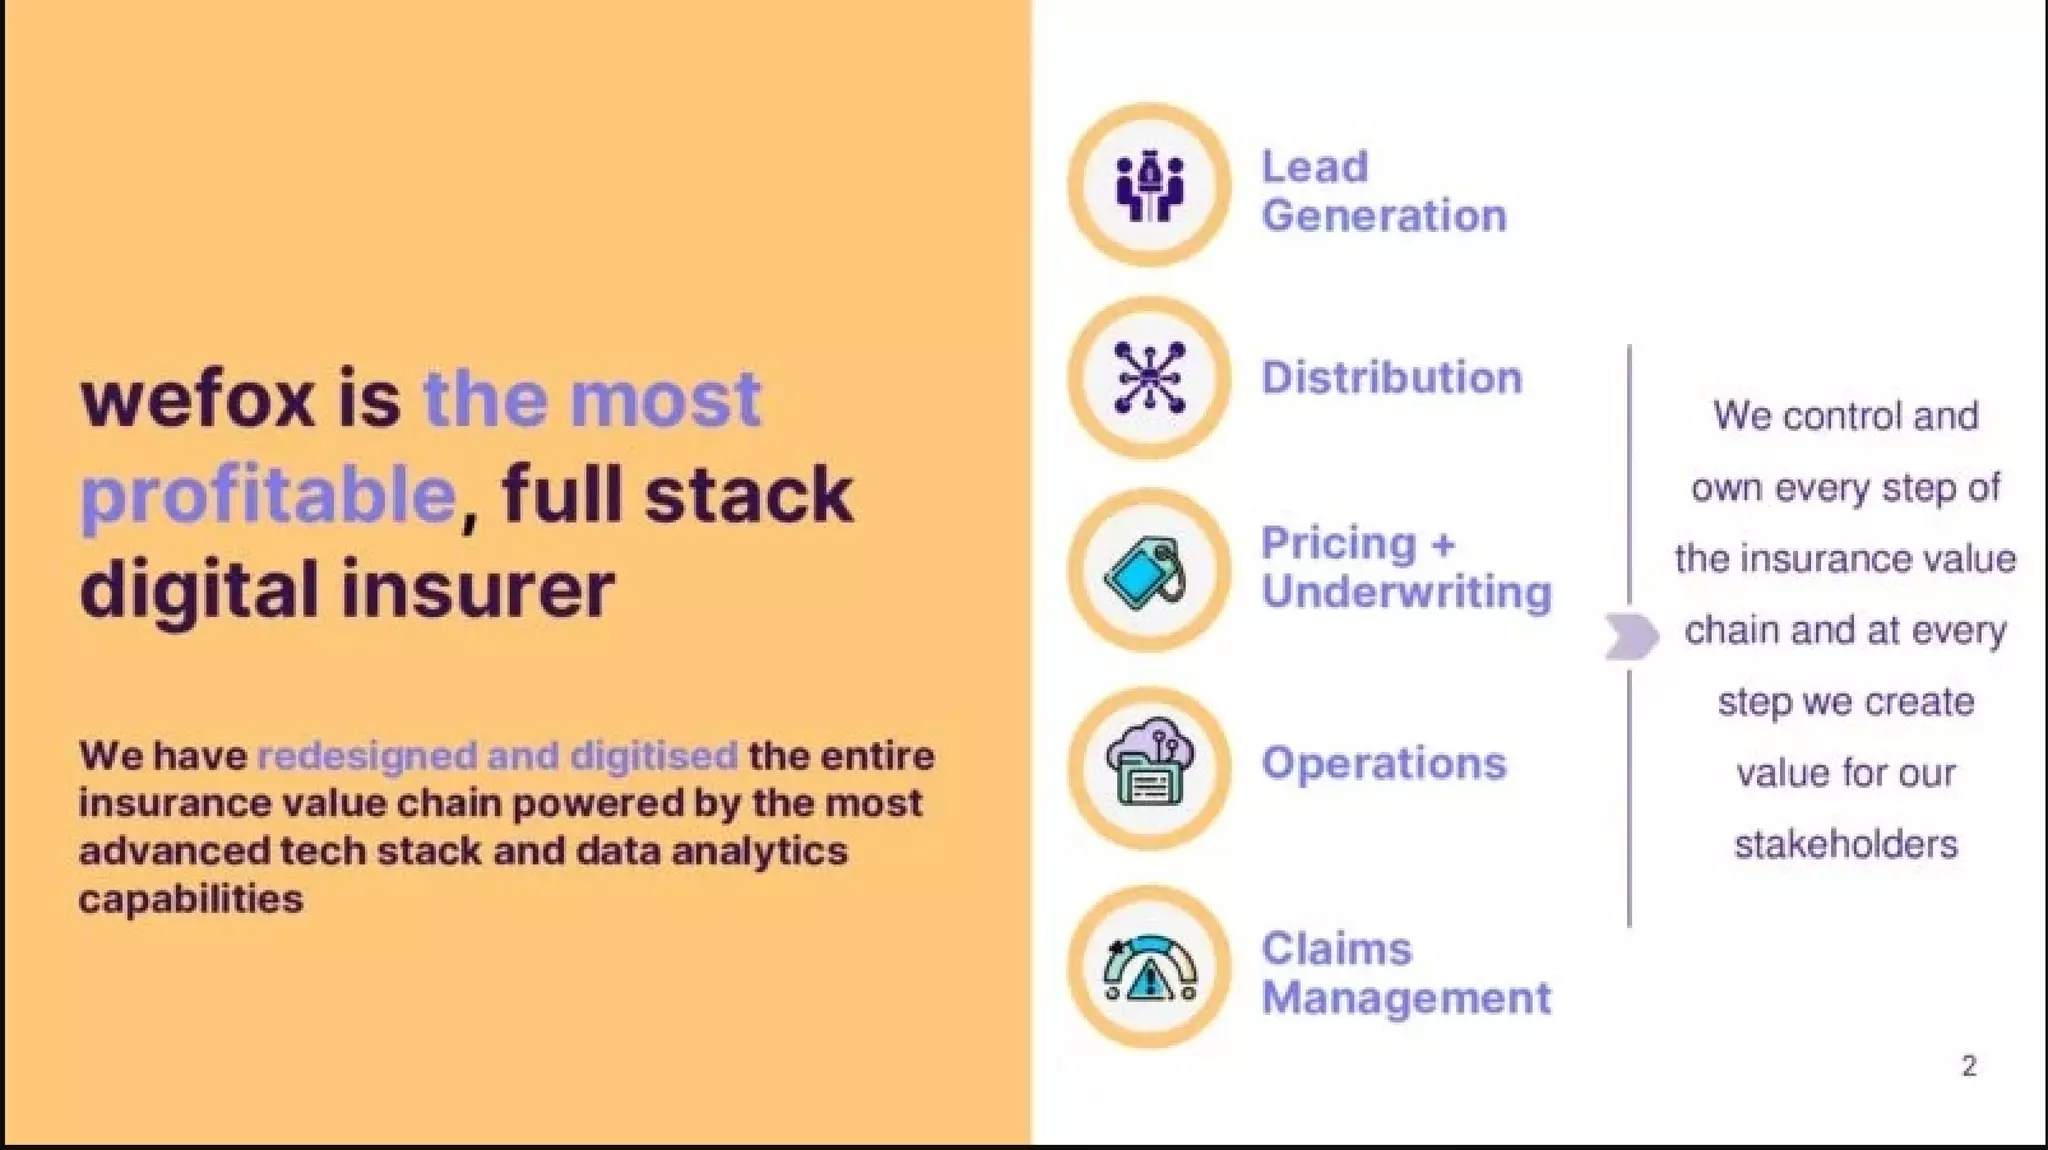
Slide 2 lays out Wefox’s claim to be a ‘full stack’ digital insurer by listing lead gen, distribution, pricing & underwriting, operations, and claims management. The right-side blurb reinforces control over the entire insurance value chain and the left-side copy explains the tech + data backbone. By visually listing discrete operational pillars, the slide communicates scope and execution capability.

This approach is effective because it converts a broad claim (“full stack”) into concrete, reviewable components. It shows investors where margins and value accrual are expected (e.g., underwriting and claims). Founders should emulate this by decomposing big claims into specific, auditable capabilities so the audience can follow how advantages are created and defended.

Key Takeaway: When claiming market or operational breadth, break the value chain into explicit components to show where you capture margin and competitive advantage.
Traction snapshot: growth, automation, and footprint

Traction snapshot: growth, automation, and footprint

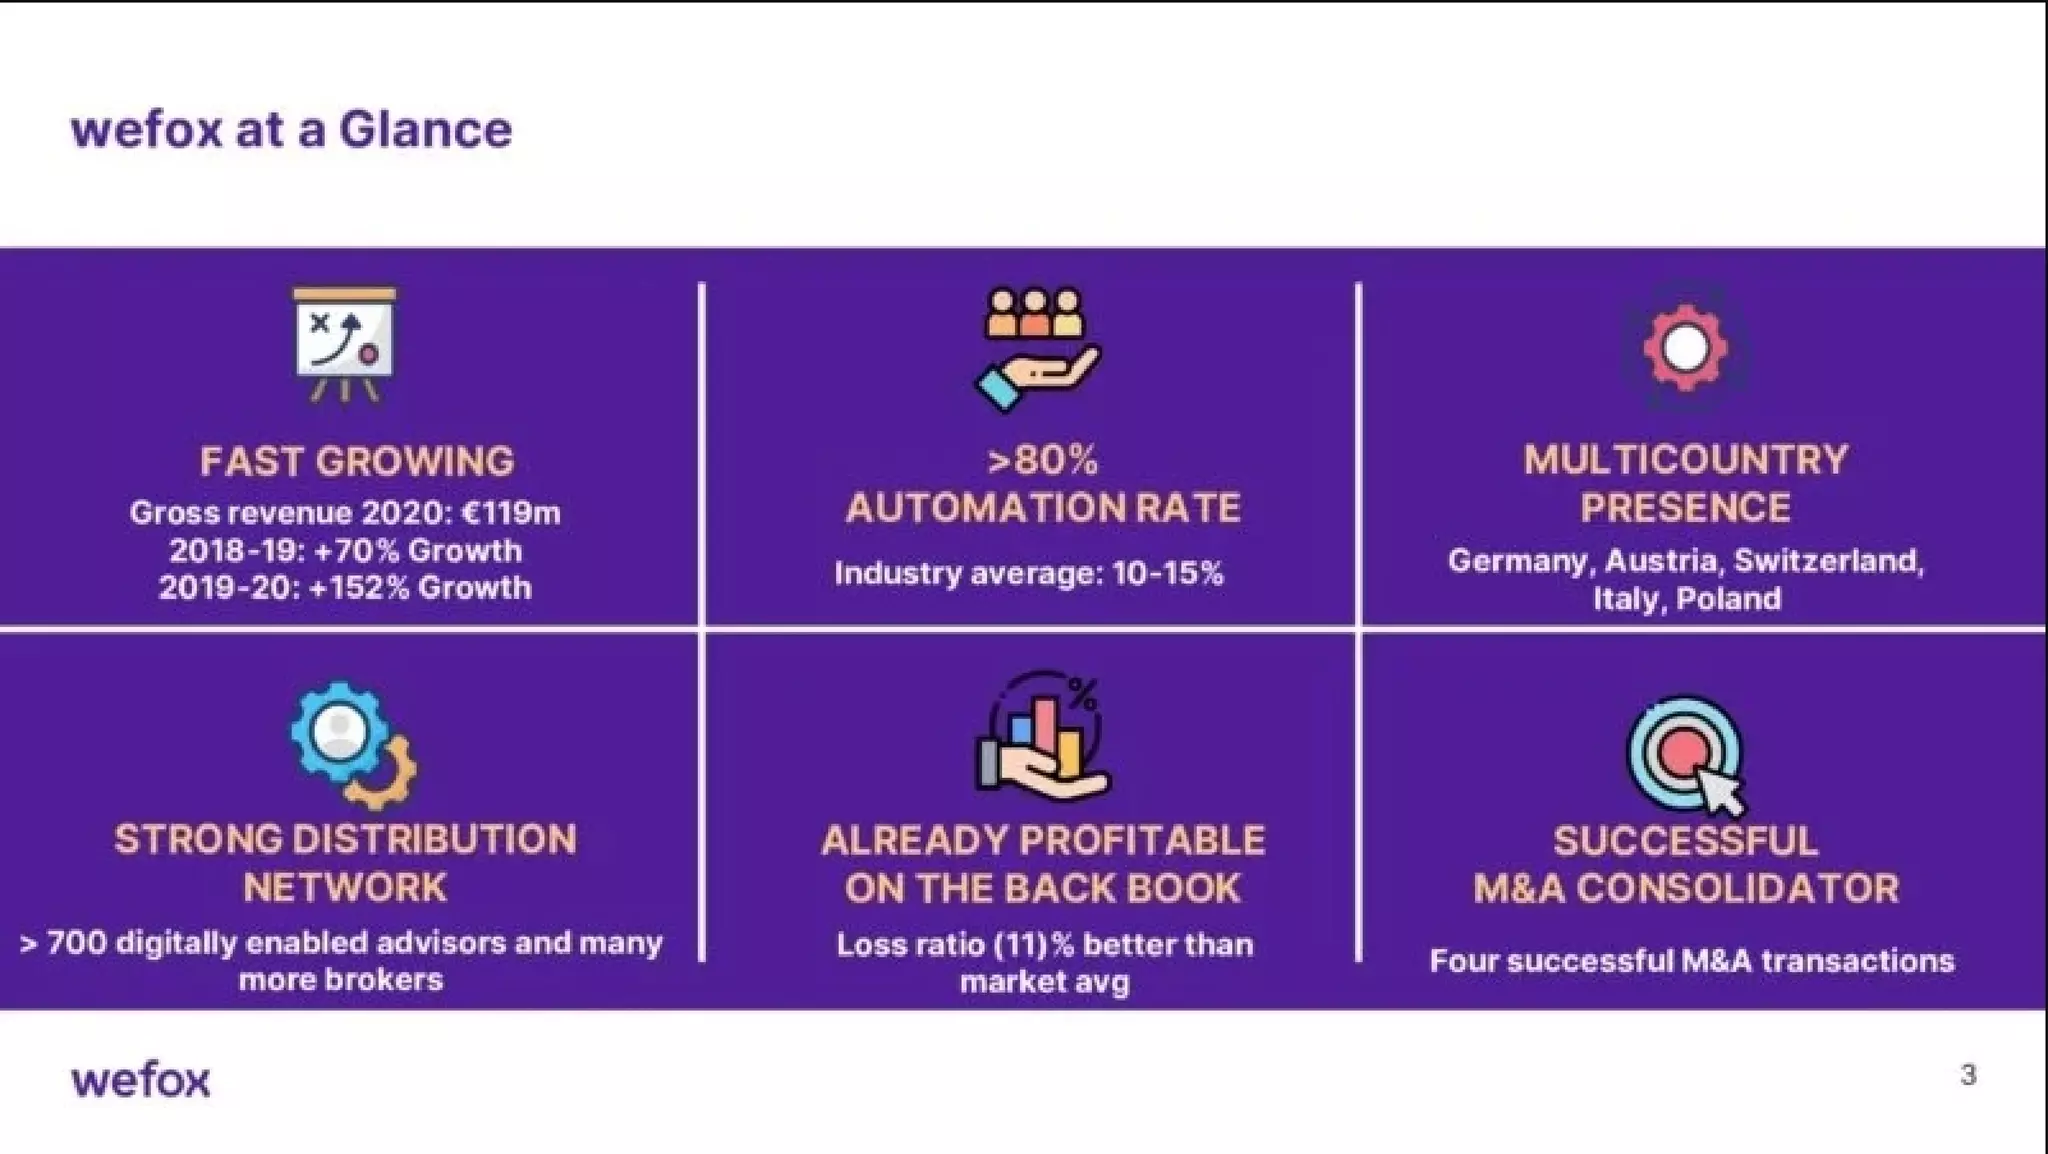
Slide 3 (‘wefox at a Glance’) packs key operational and market signals: revenue growth, >80% automation rate vs. 10–15% industry, multi-country presence, distribution breadth, early profitability on back book, and M&A activity. The grid format makes each claim digestible and emphasizes multiple independent evidence points of a scalable business.

This is effective because it blends growth and unit-economics signals — investors care about both. The >80% automation stat is particularly powerful when paired with claims of lower admin costs. Founders should craft similar one-slide snapshots that summarize the most persuasive mix of growth, efficiency, geographic reach, and defensibility metrics.

Key Takeaway: Use a compact slide to present complementary traction and efficiency metrics together — growth plus unit economics builds stronger investor confidence than either alone.
TAM and go-to-market focus

TAM and go-to-market focus

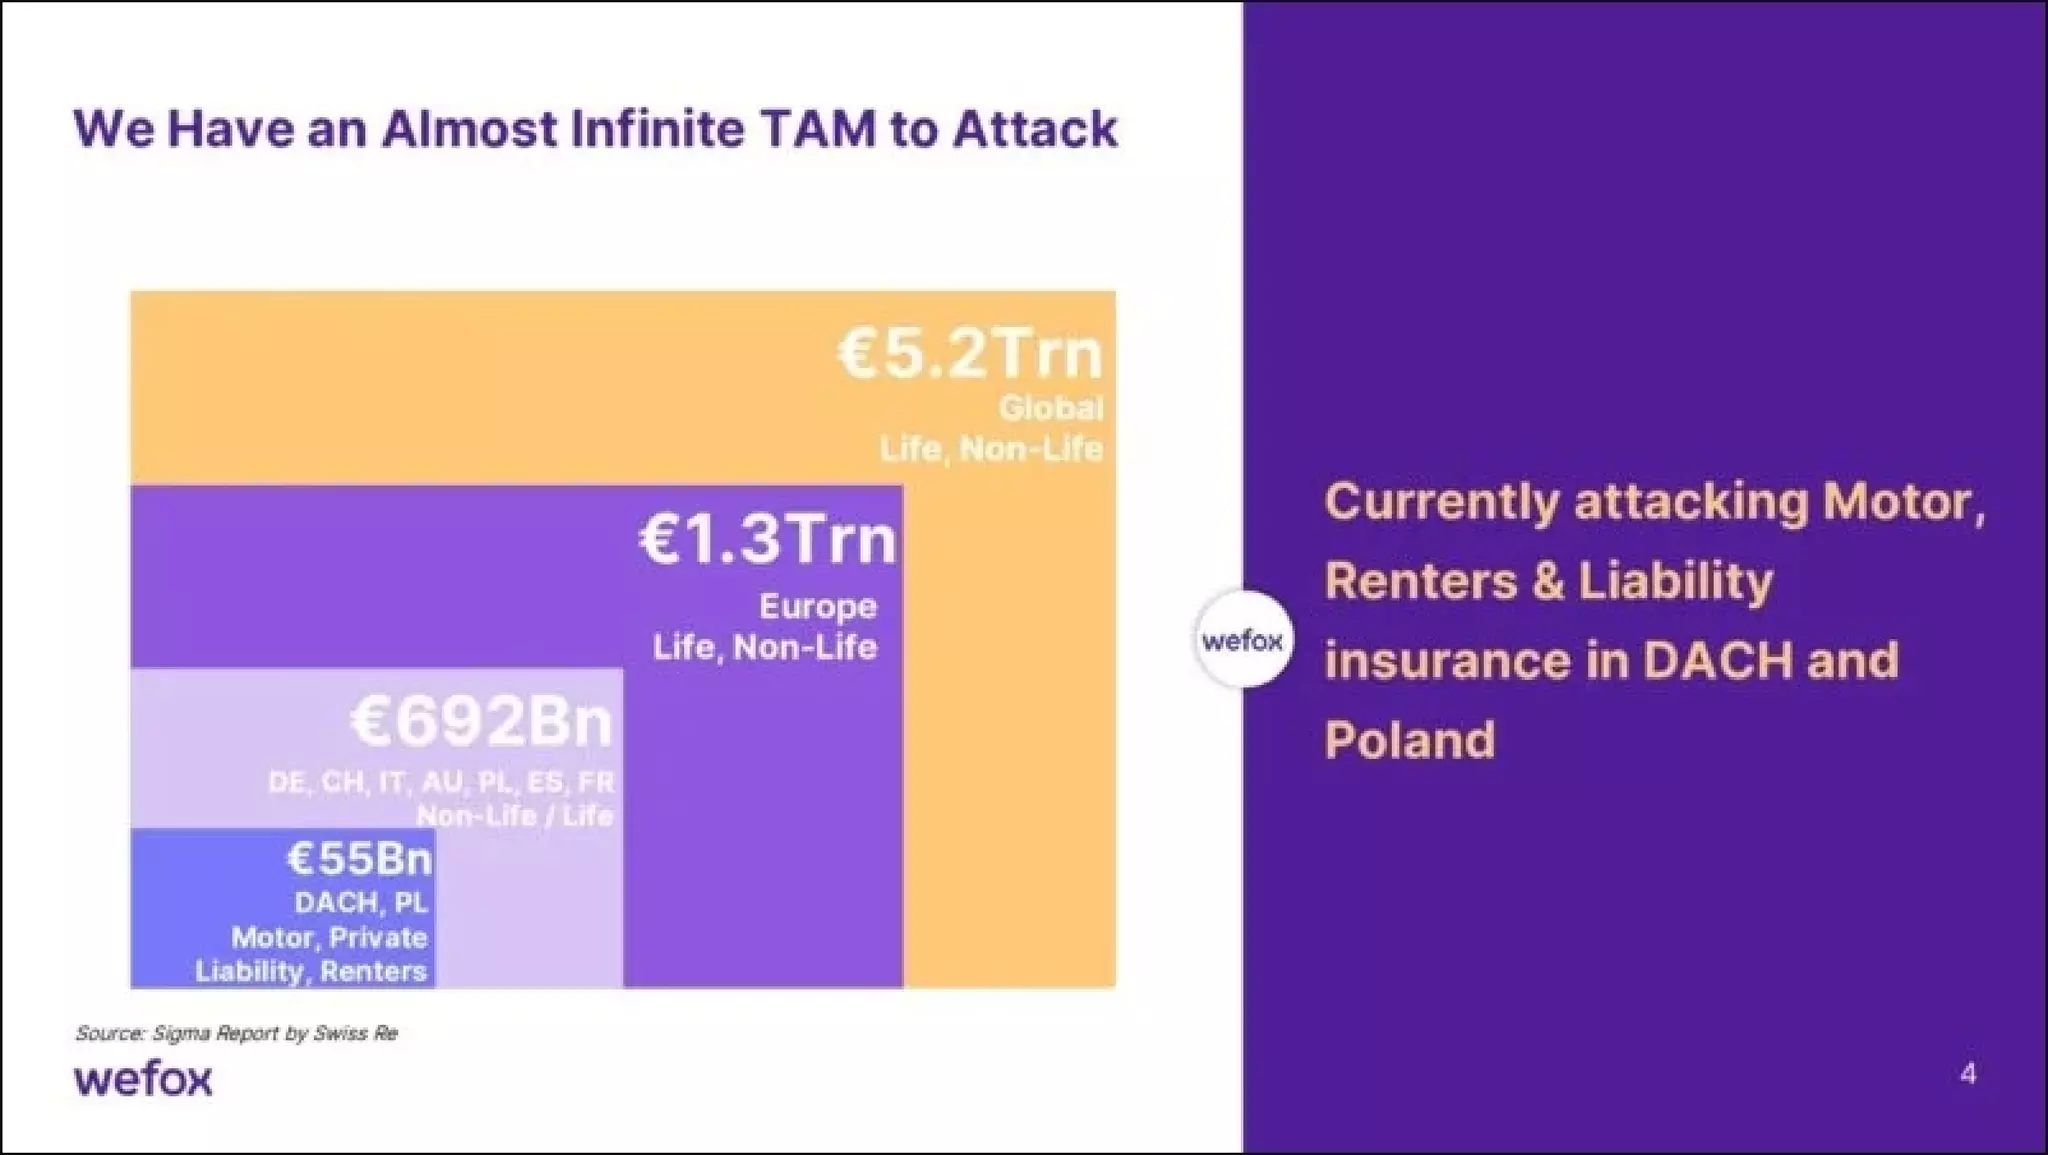
Slide 4 presents a layered TAM graphic (DACH & Poland, Europe, Global) and ties it to a clear GTM focus: currently attacking motor, renters, & liability in DACH and Poland. The graduated rectangles convey scale and the right-side text clarifies the initial beachhead. This balances ambition (big TAM) with discipline (narrow initial product/market fit).

The slide is effective because it avoids the common mistake of showing an enormous global TAM without explaining the route to capture it. By anchoring a massive long-term opportunity to a specific, defensible starting point, the team shows both vision and execution realism. Founders should always show the big opportunity but define the immediate, repeatable market where they can demonstrate unit economics first.

Key Takeaway: Show a large TAM to justify upside, but pair it with a focused, credible initial beachhead to demonstrate how you’ll capture value first.
Economic model: why digital + indirect distribution is superior

Economic model: why digital + indirect distribution is superior

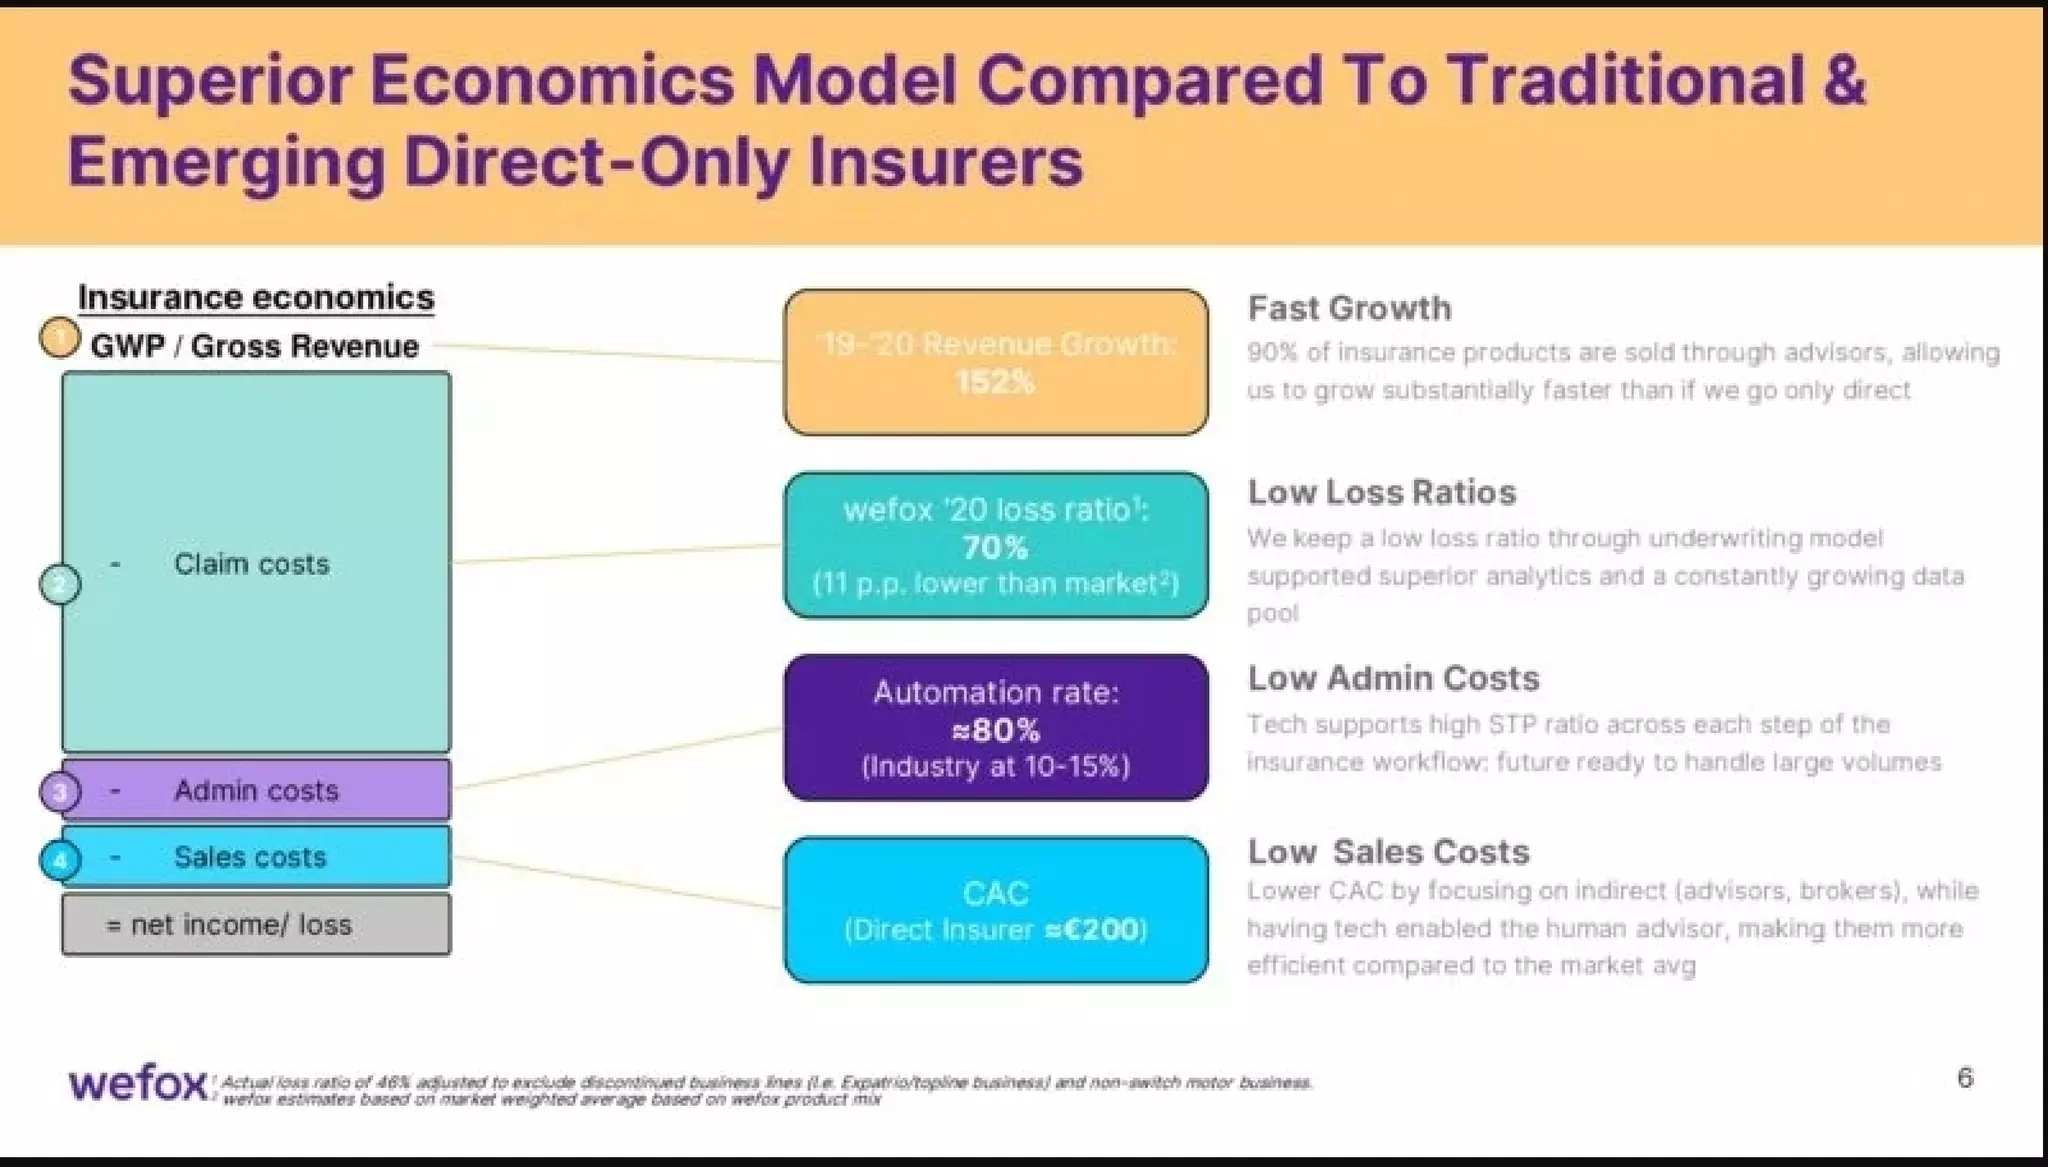
Slide 6 compares Wefox economics to traditional and direct-only insurers by breaking down gross revenue into claim costs, admin, and sales costs. It highlights 152% revenue growth, a 70% loss ratio (11 p.p. better than market), ≈80% automation, and low CAC (~€200). This is a tightly argued case that technology and an indirect distribution focus produce better margins and lower acquisition costs.

The usefulness here is the mapping from operational metrics to financial outcomes — it’s not abstract claims but causal links (automation → admin savings; advisor network → lower CAC). Founders should emulate this by linking operational KPIs to P&L line items so investors can easily see how unit economics scale with operational improvements.

Key Takeaway: Draw explicit causal lines from operational KPIs (automation, distribution mix) to P&L outcomes to make your economics believable and investable.
Underwriting playbook: data-driven selection and pricing

Underwriting playbook: data-driven selection and pricing

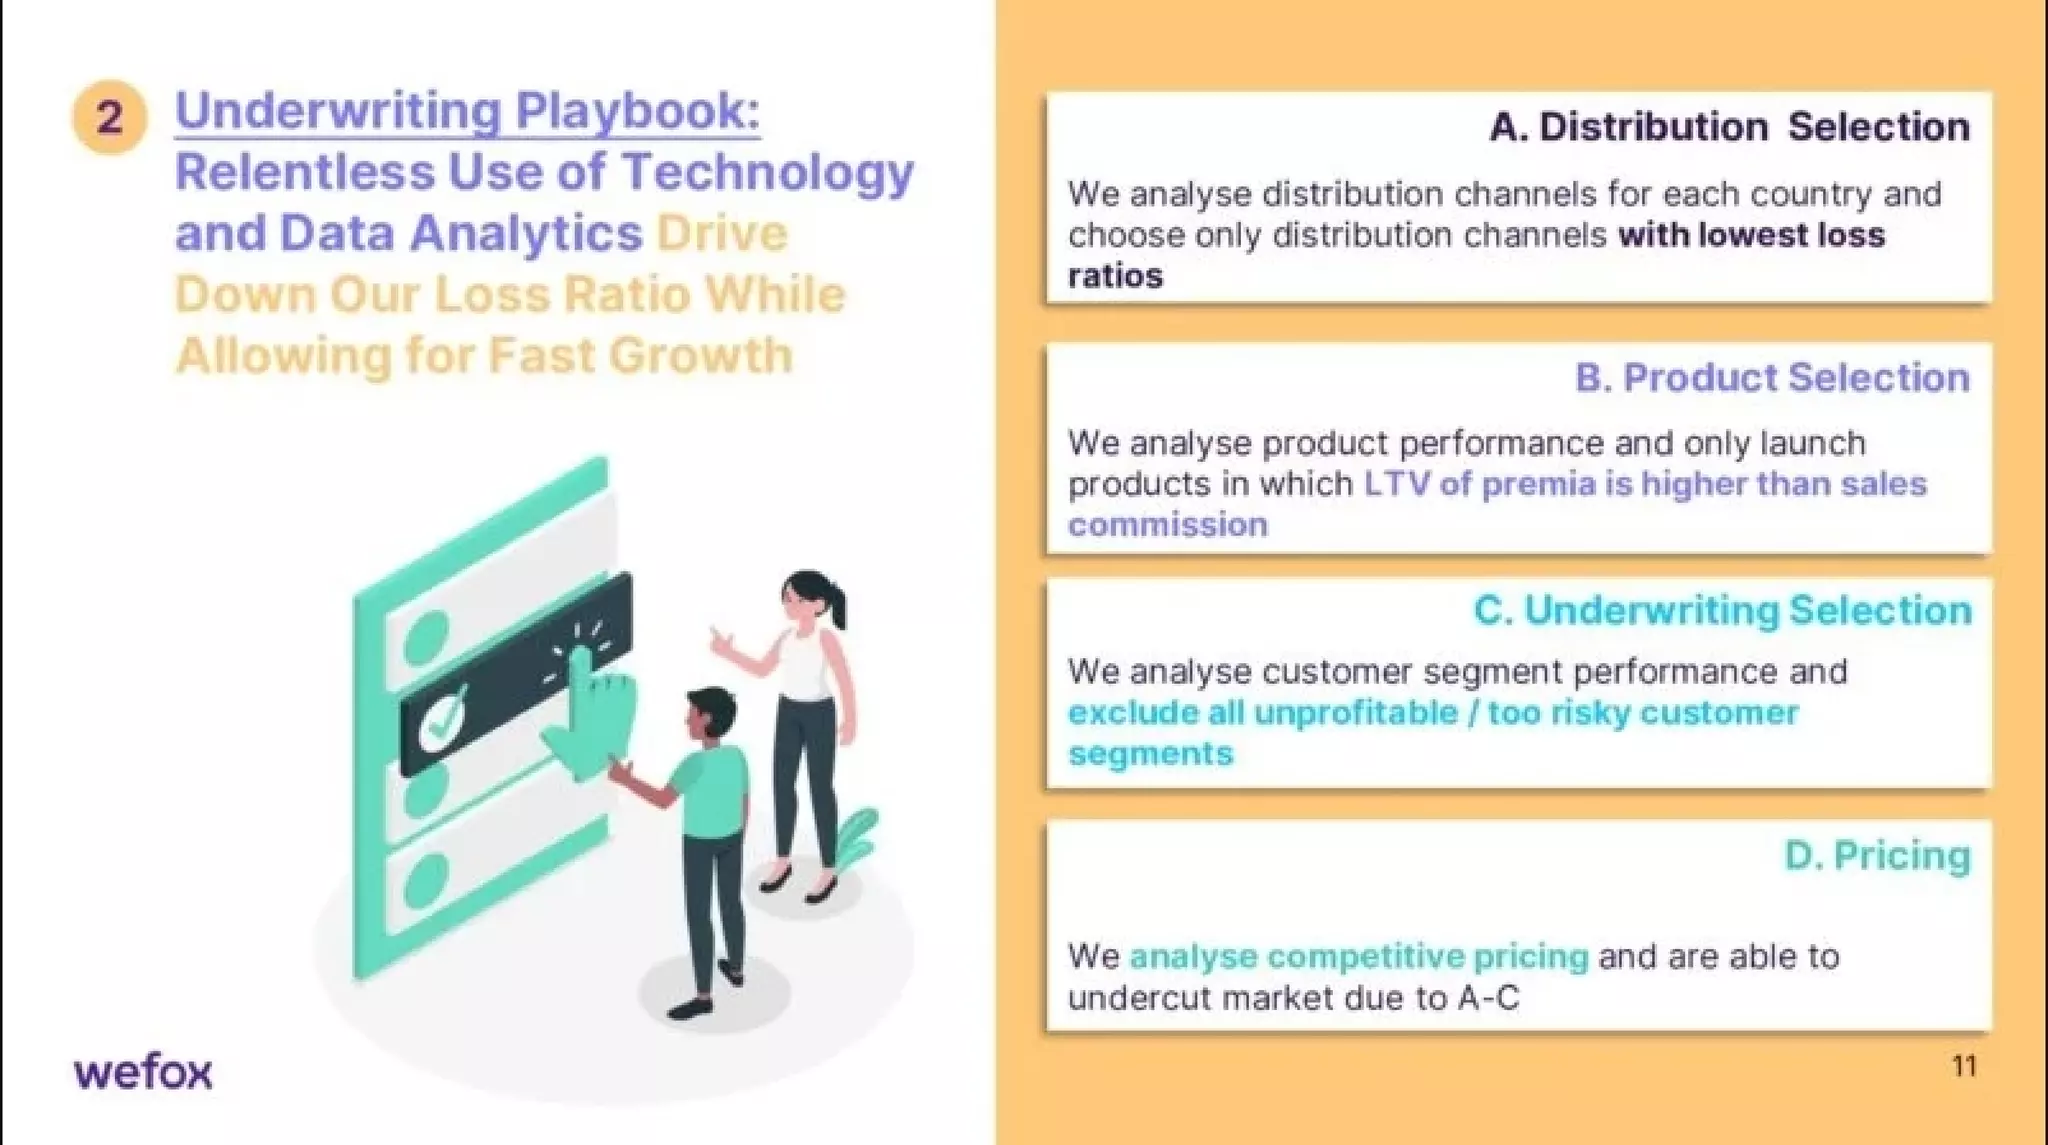
Slide 11 describes an underwriting playbook centered on relentless use of technology and analytics. It outlines distribution selection (choose channels with lowest loss ratios), product selection (ensure LTV > sales commission), underwriting selection (exclude unprofitable segments), and competitive pricing. The format is operational and prescriptive rather than aspirational, which demonstrates a repeatable process for risk control.

This is effective because underwriting is the core defensive moat for an insurer; showing disciplined analytics and channel/product selection reassures investors about loss control. Founders in risk-heavy industries should similarly present a repeatable playbook with decision rules that reduce subjective judgment and can be audited and improved over time.

Key Takeaway: Present a concrete, rule-based playbook for risk selection and pricing — show the decisions you make automatically and why they protect unit economics.
Evidence: improving loss ratios and STP automation

Evidence: improving loss ratios and STP automation

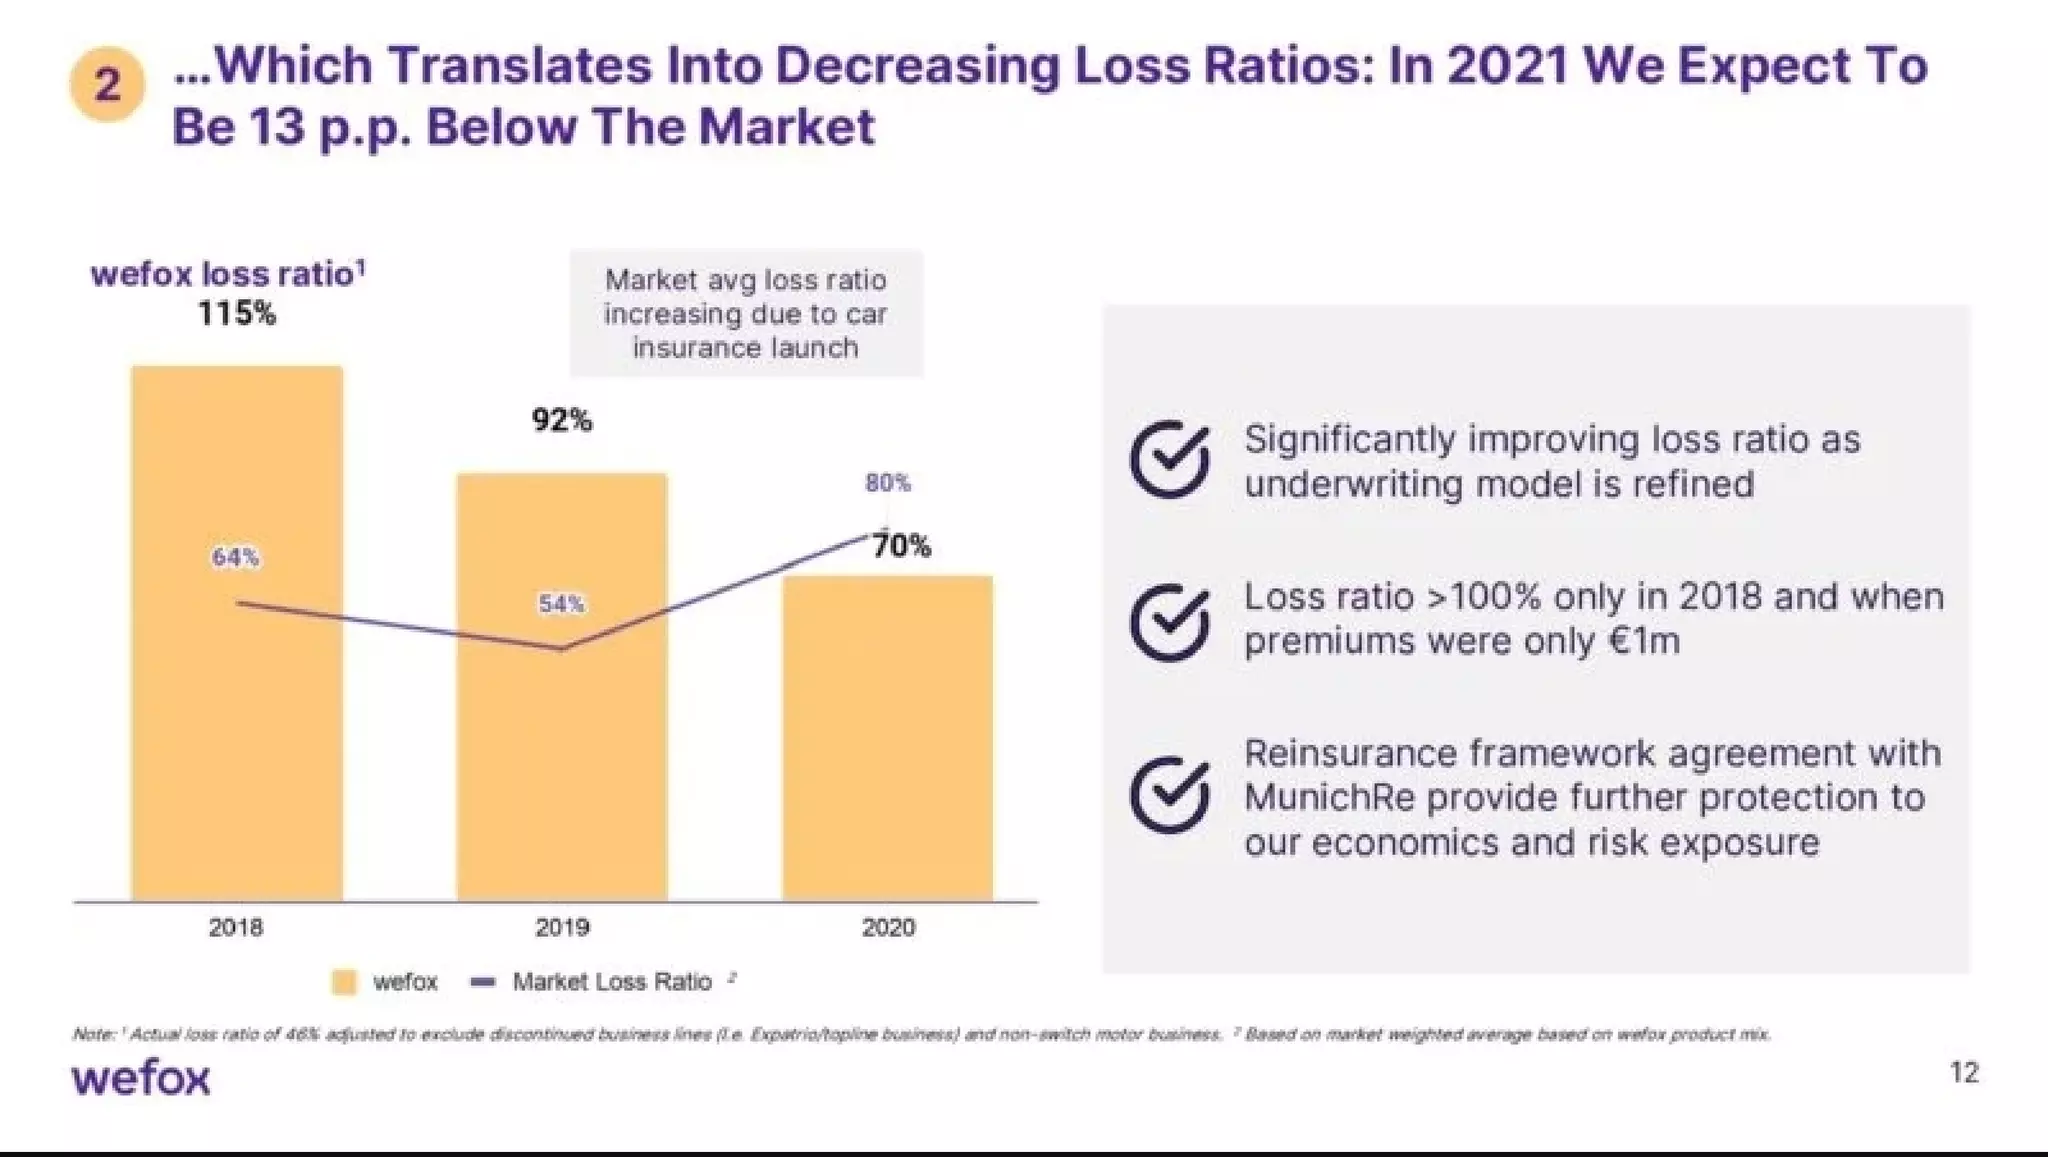
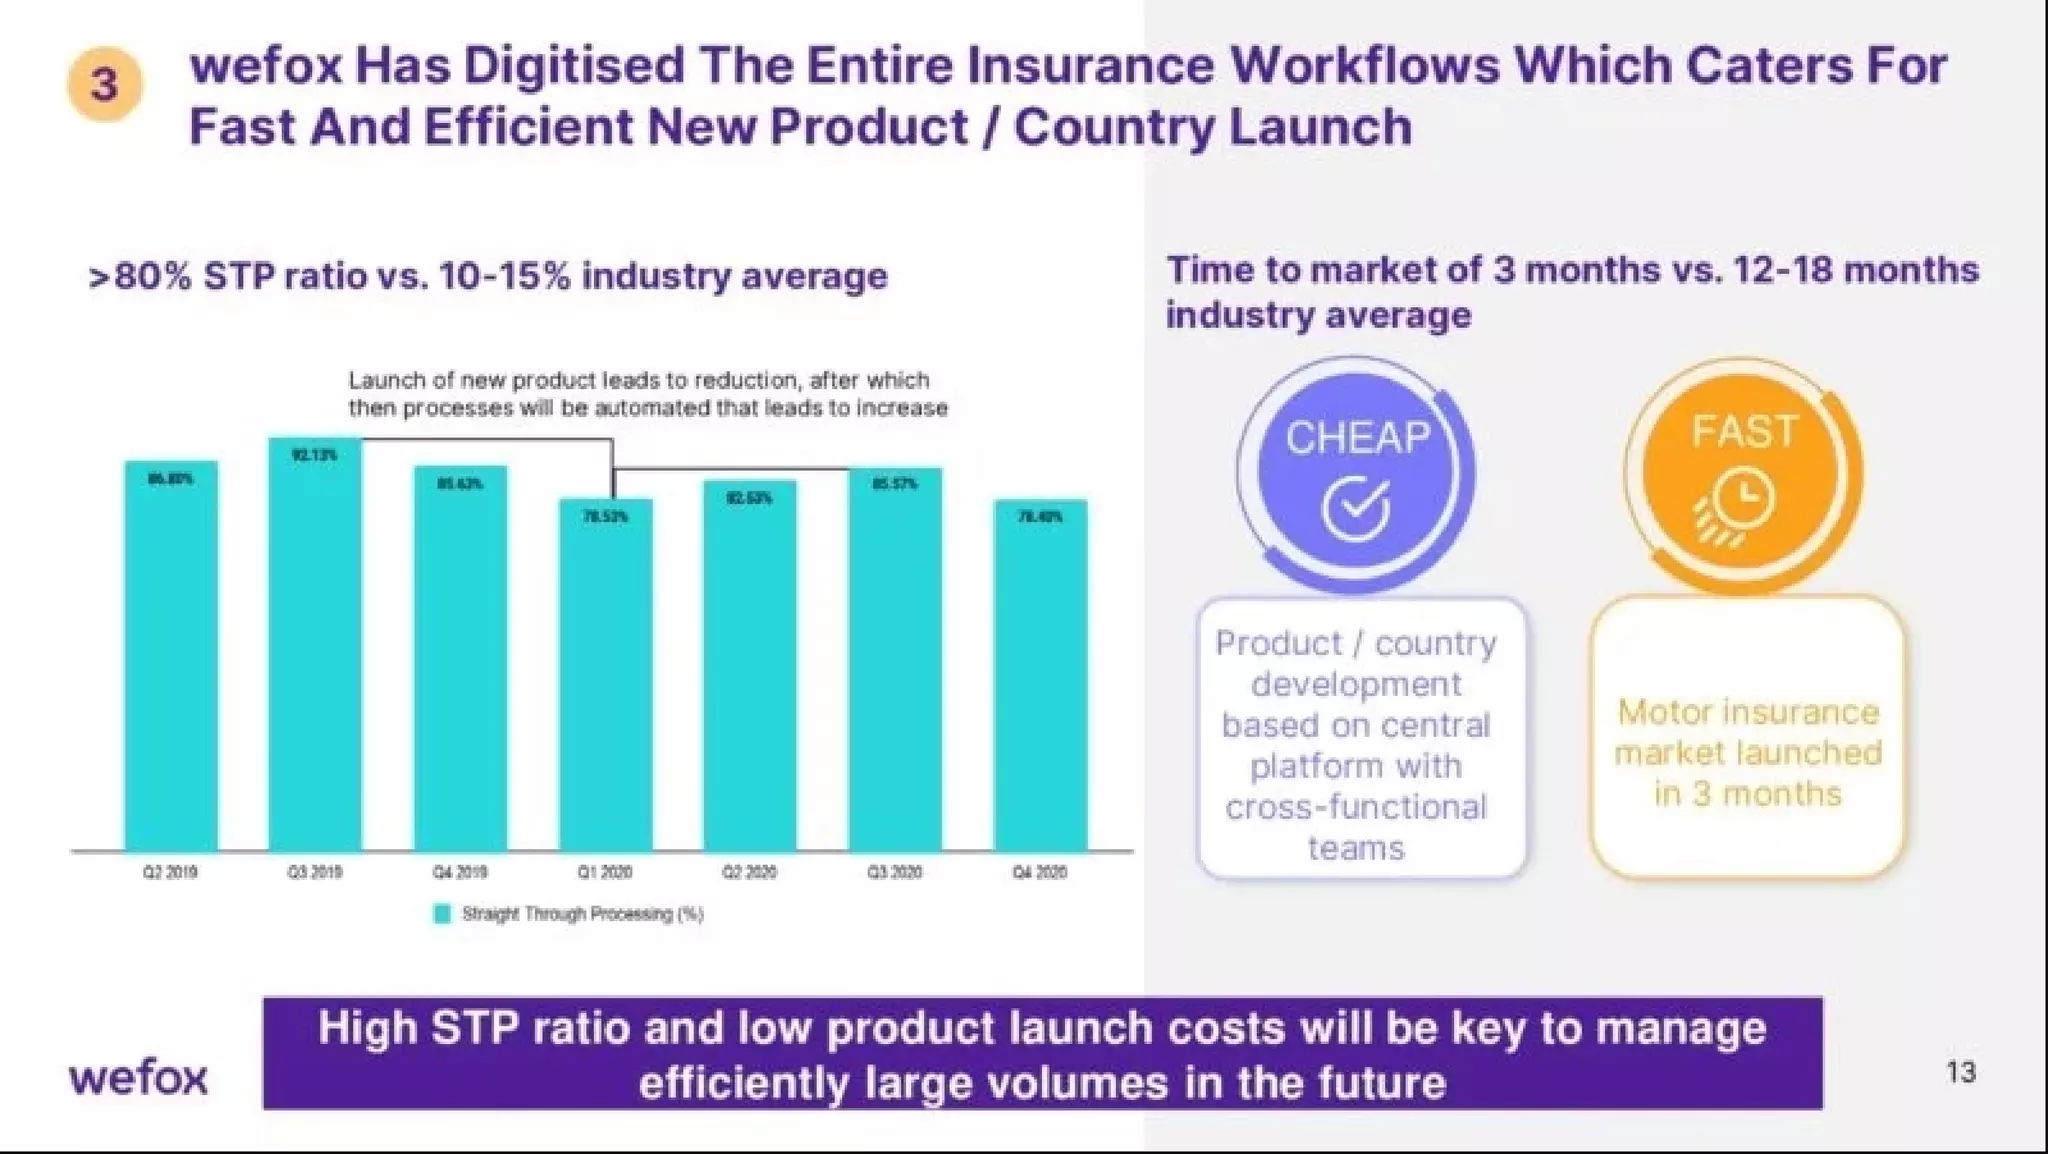
Slide 12 (loss ratios) and Slide 13 (STP ratio & time-to-market) provide the evidence that the playbook and automation produce results. Loss ratio charts show Wefox improving from >100% to 70% in 2020, with market comparisons and a note on reinsurance. The STP (straight-through processing) bars show >80% vs. 10–15% industry average and call out a 3-month time-to-market advantage for motor. These metrics validate the earlier claims with historical performance and operational throughput.

These slides are compelling because they move from claims to measurable outcomes: better loss ratios, high automation, and faster product launches. Investors look for demonstrated improvement and scale effects; this is exactly that. Founders should include both trend charts and process metrics to prove that their model improves over time and is capable of rapid expansion with controlled risk.

Key Takeaway: Support your playbook claims with time-series operating metrics (loss ratios, STP, time-to-market) that show performance improving as you scale.
Strategic narrative and growth flywheel

Strategic narrative and growth flywheel

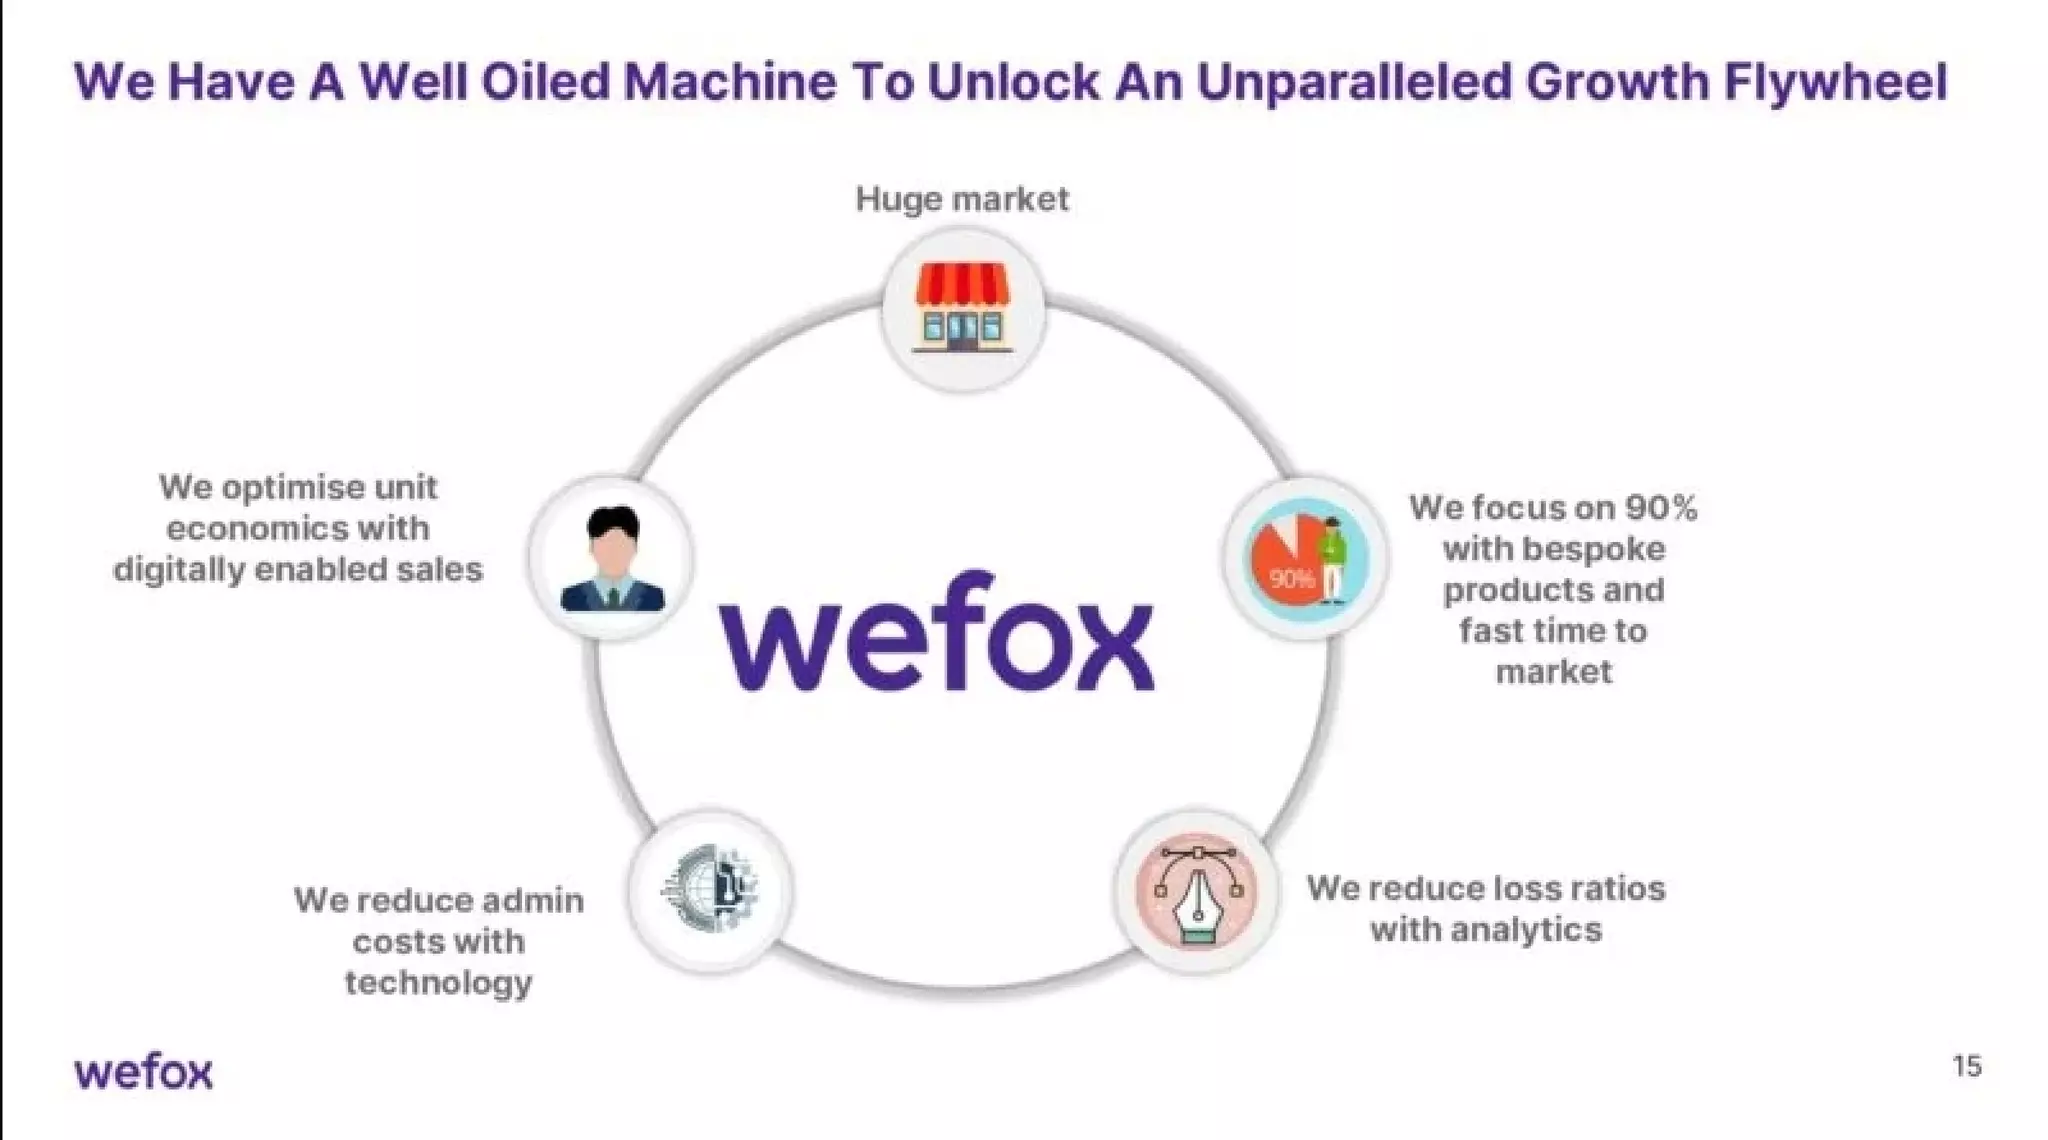
Slide 15 summarizes the flywheel: huge market, focus on the 90% sold via intermediaries, analytics to reduce loss ratios, technology to reduce admin costs, and digitally enabled sales to optimize unit economics. The circular diagram communicates an integrated, reinforcing system rather than isolated initiatives. This closes the deck narrative by showing how each capability feeds the next to drive scalable, profitable growth.

The effectiveness stems from synthesizing tactics into a strategy — it’s not just ‘we have a good product’ but ‘we have a self-reinforcing machine.’ Founders should aim to craft a similar flywheel slide that links product, distribution, data, and economics so investors can see compounding advantages rather than one-off metrics.

Key Takeaway: End with a succinct flywheel that connects capabilities into a self-reinforcing growth and margin story to show sustainable competitive advantage.

Conclusion: Key Lessons

Wefox’s deck succeeds by combining a focused GTM (indirect distribution), concrete operational playbooks (underwriting and channel selection), and measurable operating metrics (loss ratios, STP, automation, CAC) that connect directly to unit economics. The narrative balances ambition (large TAM) with execution discipline (beachhead, analytics rules, fast product launches), and closes with a coherent flywheel that shows how each piece compounds value.

Actionable advice for founders: lead with a single differentiated thesis, decompose broad claims into auditable capabilities, tie operational KPIs to P&L outcomes, show time-series improvement to prove scalability, and finish with a flywheel that unifies your strategy. Doing these things turns aspirational slides into an investable, verifiable story.

Full Deck Analysis

11 sections

Overview

Company: Wefox
Round: Series A ($28M)
Year: 2016
Outcome: Valued at $4.5B (2022)

Executive Summary

Wefox’s Series A deck presents a full-stack digital insurance company that controls the entire insurance value chain and scales primarily through digitally enabled advisors/brokers rather than direct-only distribution. The deck is notable for concrete market sizing (country / regional TAMs), strong growth traction (2018–2020 revenue and growth rates), high automation metrics (>80% STP), and a clear operational playbook (distribution selection, underwriting playbook, pricing and automation).

Problem Statement

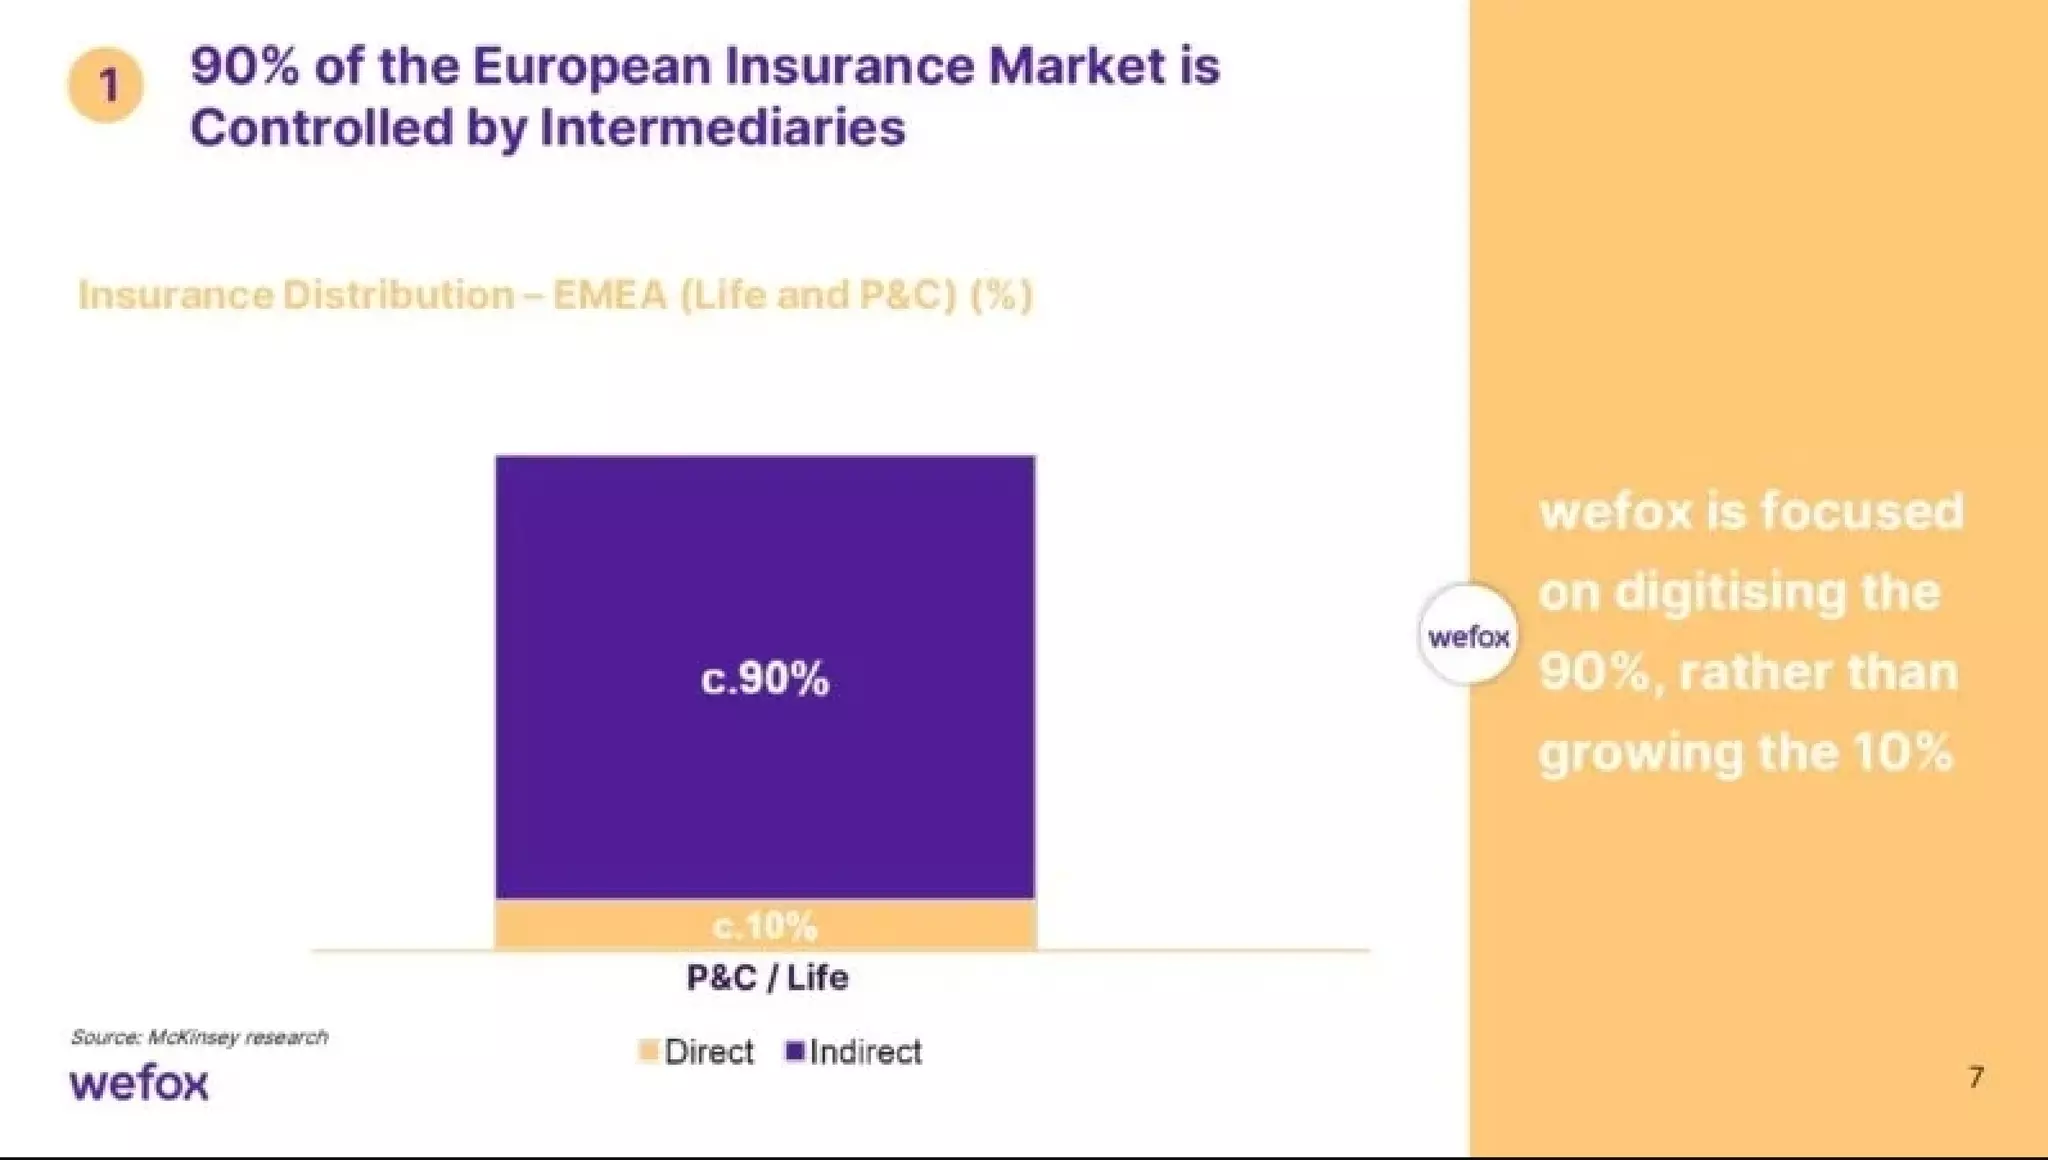
  • The deck frames the core problem as a fragmented, non-digital insurance distribution market with most volume controlled by intermediaries; customers and advisors are underserved by legacy insurers (Slide 7).
  • It highlights that only ~10% of insurance distribution is direct while ~90% is through intermediaries (Slide 7), meaning digital players that focus only on direct channels miss the dominant distribution channel.
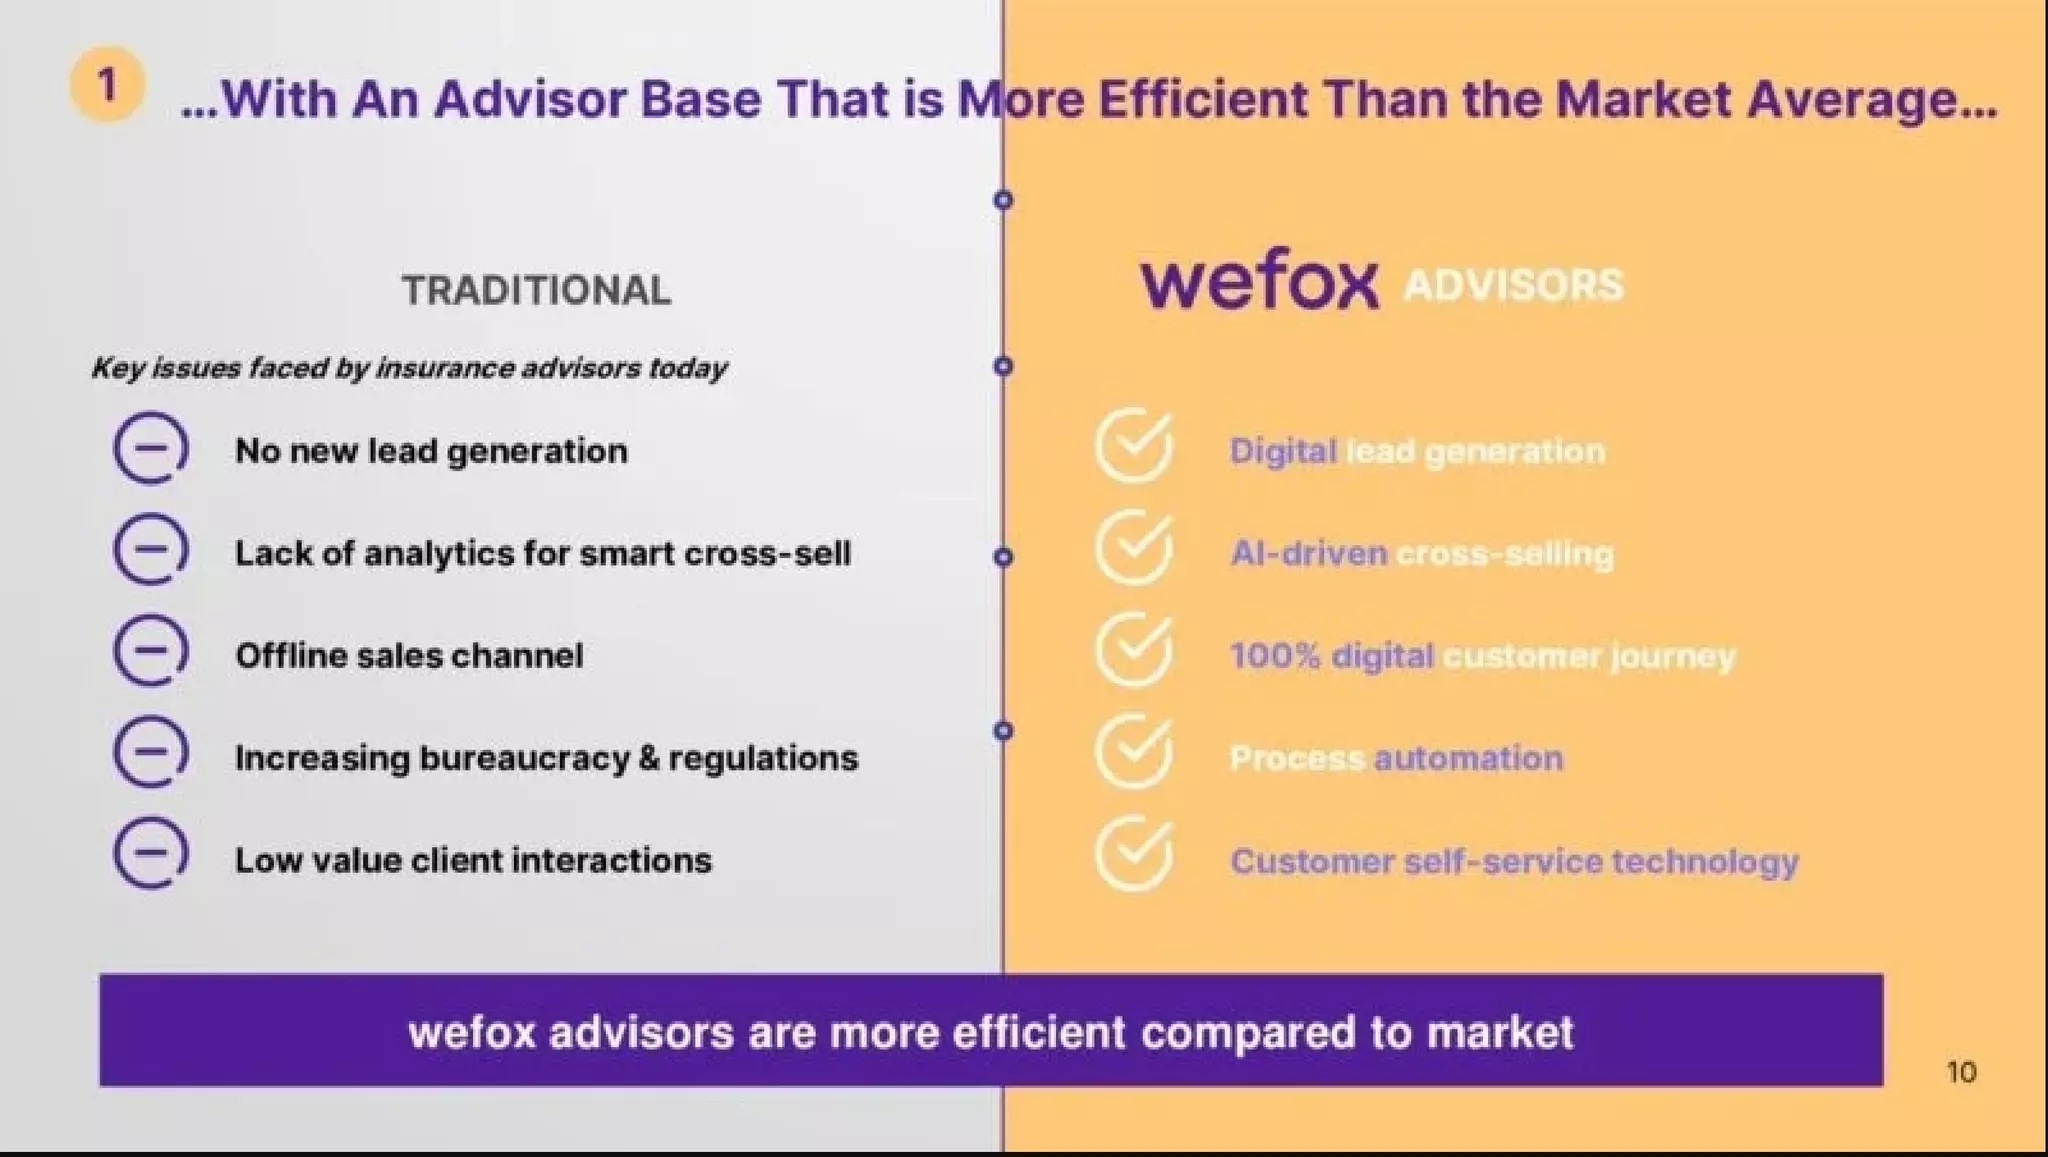
  • Traditional advisors face key issues: no digital lead generation, lack of analytics for cross-sell, offline sales channels, bureaucracy, and low-value client interactions (Slide 11).

Solution

  • Wefox positions itself as a full-stack, digitally-enabled insurer that redesigns and digitises the entire insurance value chain — lead generation, distribution, pricing & underwriting, operations and claims management — to serve intermediaries and their customers (Slides 2, 15).
  • The go-to-market differentiator: enable advisors/brokers with tech (lead gen, AI cross-sell, automation, 100% digital customer journeys) — focus on digitising the 90% indirect distribution (Slides 9–11).
  • Underwriting playbook and data analytics are used to exclude unprofitable segments, select low-loss distribution channels, and price competitively (Slide 12).

Market Opportunity

  • The deck provides layered TAM figures:
    • DACH + Poland (Motor, Private Liability, Renters): ~€55Bn (Slide 4)
    • Larger regional block (DE, CH, IT, AU, PL, ES, FR – Non-Life/Life): ~€692Bn (Slide 4)
    • Europe Life & Non-Life: ~€1.3Trn (Slide 4)
    • Global Life & Non-Life: ~€5.2Trn (Slide 4)
  • Strategic focus: initially attack Motor, Renters & Liability in DACH + Poland (Slide 4).
  • Key insight: the addressable market is very large and dominated by intermediary (indirect) channels (~90% of distribution in EMEA) — core strategic rationale for focusing on advisor enablement (Slide 7).

Business Model

  • Full-stack insurance (underwrite, price, distribute via advisors/brokers/affinity partners). Wefox keeps underwriting, claims and pricing in-house and powers distribution with tech-enabled advisors (Slides 2, 9).
  • Revenue is GWP / gross revenue (Slide 6). Example: gross revenue 2020 = €119M (Slide 3).
  • Unit economics emphasis / levers called out:
    • Low loss ratios through selective distribution and underwriting (Slide 6, Slide 12).
    • Low admin costs via automation / high STP (>80% vs industry 10–15%) (Slides 6, 13).
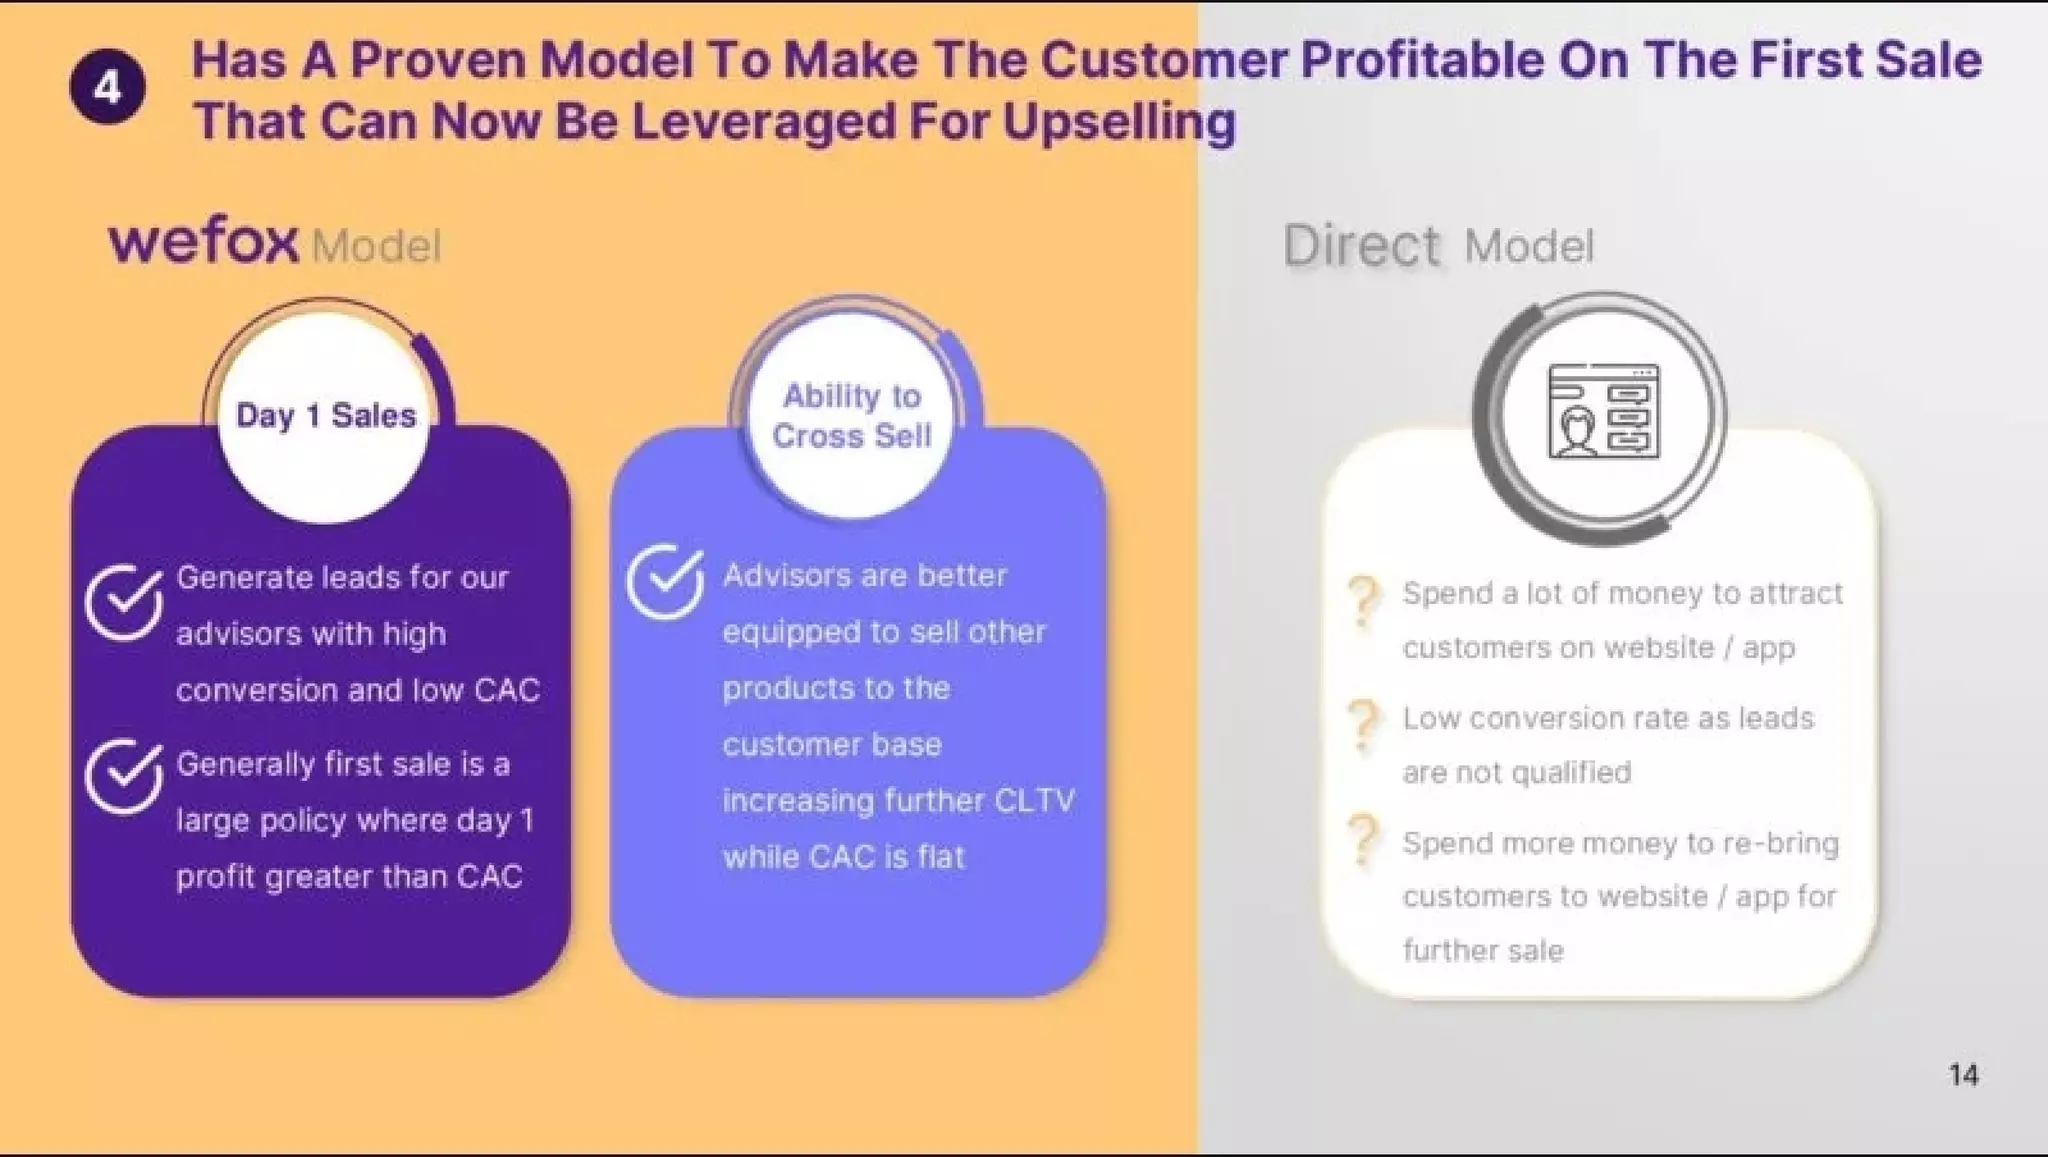
    • Lower CAC by focusing on indirect (advisor) distribution; direct-insurer CAC mentioned ≈ €200 as a comparator (Slide 6).
  • Monetization occurs through insurance premiums (GWP) with distribution commissions paid to advisors; company claims to capture more value by owning the stack.

Traction & Metrics

  • Revenue and growth:
    • Gross revenue 2020: €119M (Slide 3).
    • Growth: 2018–19: +70%; 2019–20: +152% (Slide 3).
  • Loss ratio / underwriting performance:
    • Wefox claims a 2020 loss ratio ~70%, cited as ~11 p.p. better than market avg (Slide 6 and Slide 12).
    • Historical note: loss ratio >100% only in 2018 when premiums were very small (~€1m) (Slide 12).
    • Reinsurance program in place with MunichRe to protect economics / risk exposure (Slide 12).
  • Operational metrics:
    • Automation / STP ratio >80% (industry 10–15%) (Slides 3, 13).
    • 700 digitally enabled advisors and “many more brokers” in distribution network (Slide 3).

    • Time-to-market for products: ~3 months vs industry 12–18 months (Slide 13).
  • Corporate activity:
    • Multicountry presence: Germany, Austria, Switzerland, Italy, Poland (Slide 3).
    • Four successful M&A transactions (Slide 3).

Competitive Positioning

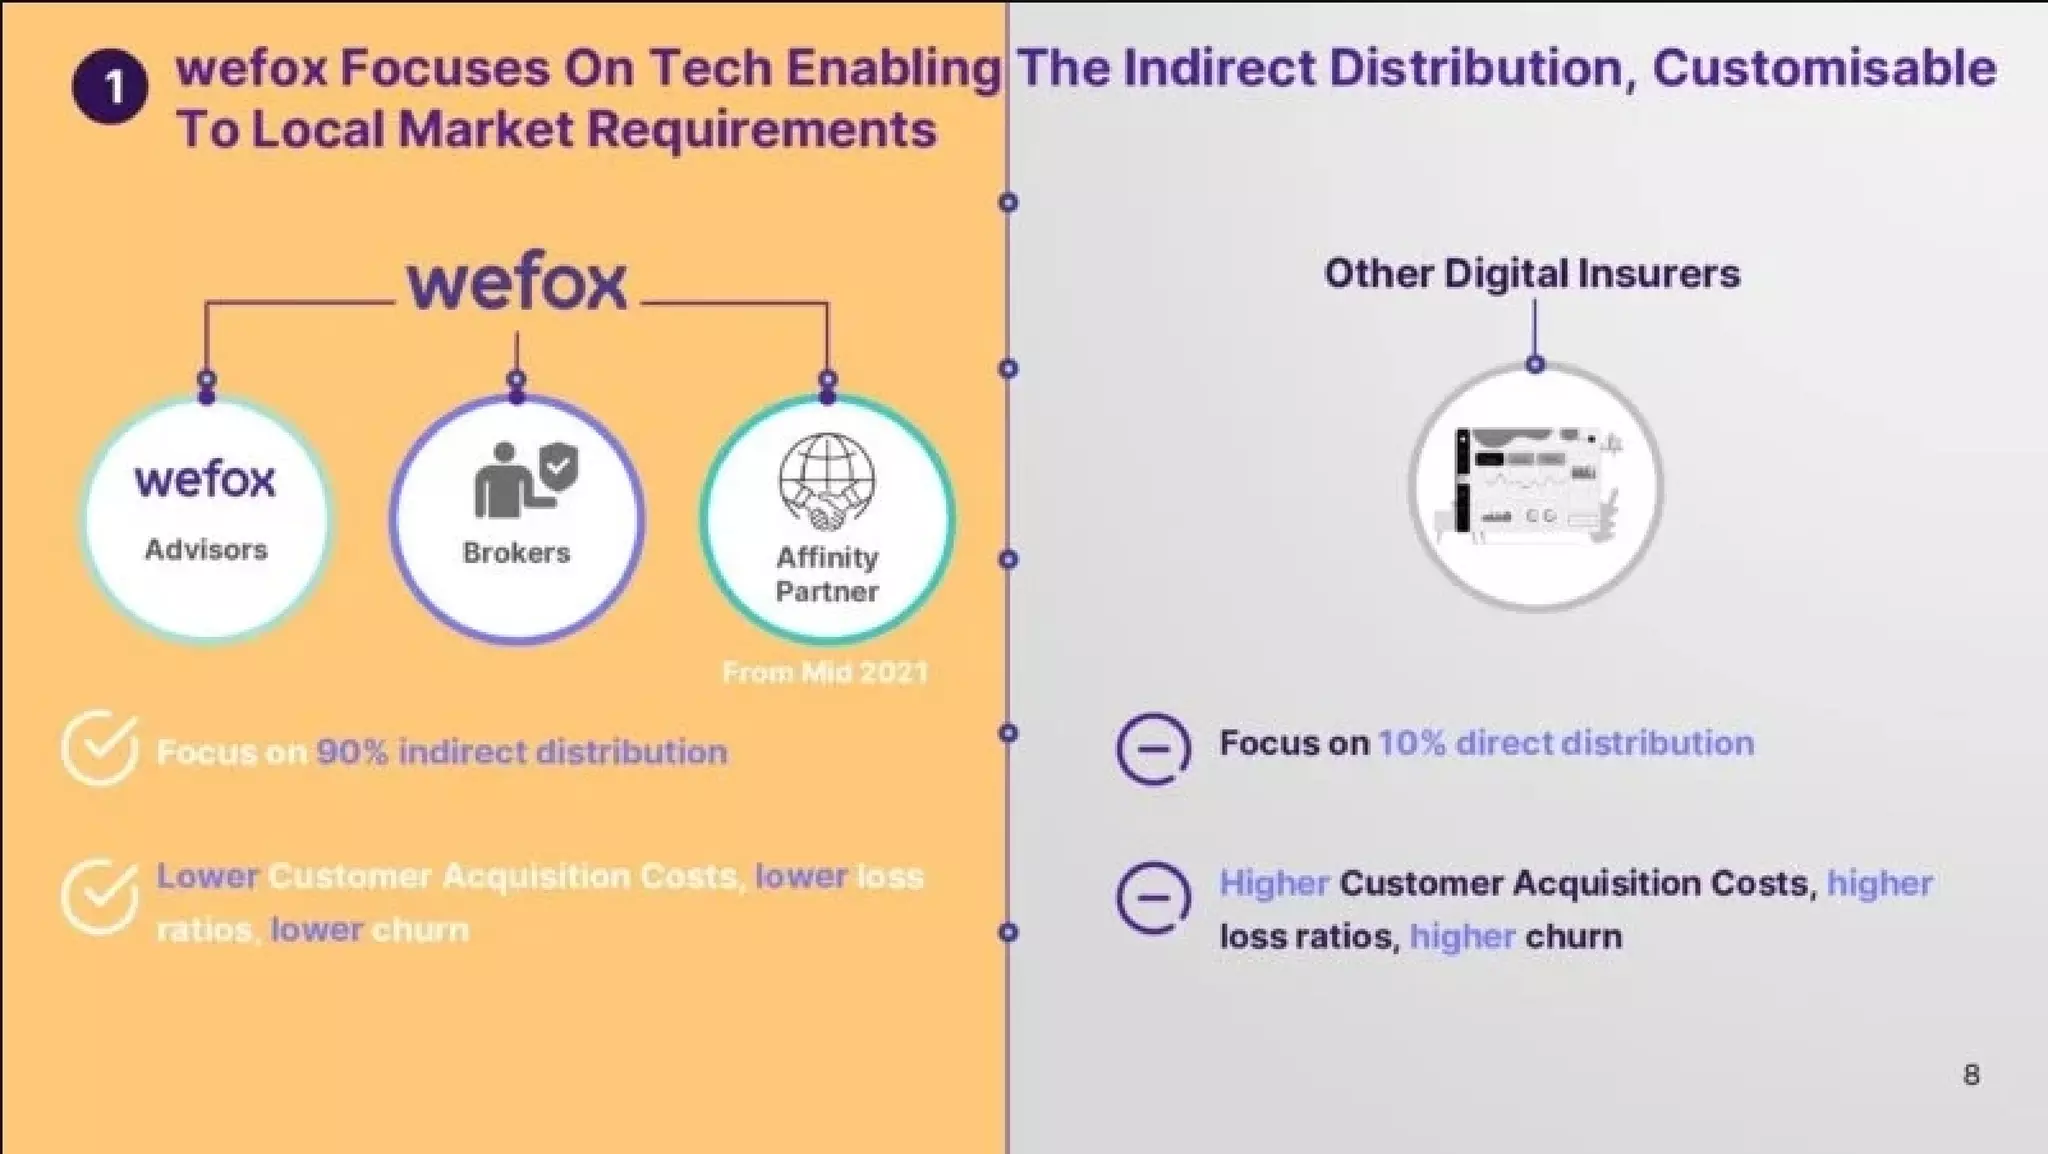
  • Differentiator vs other digital insurers: focus on digitising and enabling the 90% indirect/intermediated market instead of competing head-on in the 10% direct channel (Slides 7–9).
  • Tech-first but advisor-centric: combine high automation, analytics-driven underwriting, and advisor enablement to lower CAC, lower loss ratios and higher conversion (Slides 9–11).
  • Vertical integration: control of the full value chain (lead gen → claims) to capture margin and tune unit economics (Slide 2).

Team

  • The deck (slides provided) does not present a detailed founder/team slide or bios. This is a notable omission for Series A — no explicit founder backgrounds, domain expertise or hiring plan is shown in the 15 slides provided. Investors would expect explicit team credibility evidence at this stage.

Go-to-Market Strategy

  • Primary GTM: partner with and enable advisors, brokers and affinity partners (Slides 8–11).
  • Sales / acquisition channels:
    • Digital lead generation and qualification routed to advisors (Slide 11).
    • Advisor enablement features: AI cross-sell, process automation, 100% digital customer journey, self-service tooling (Slide 11).
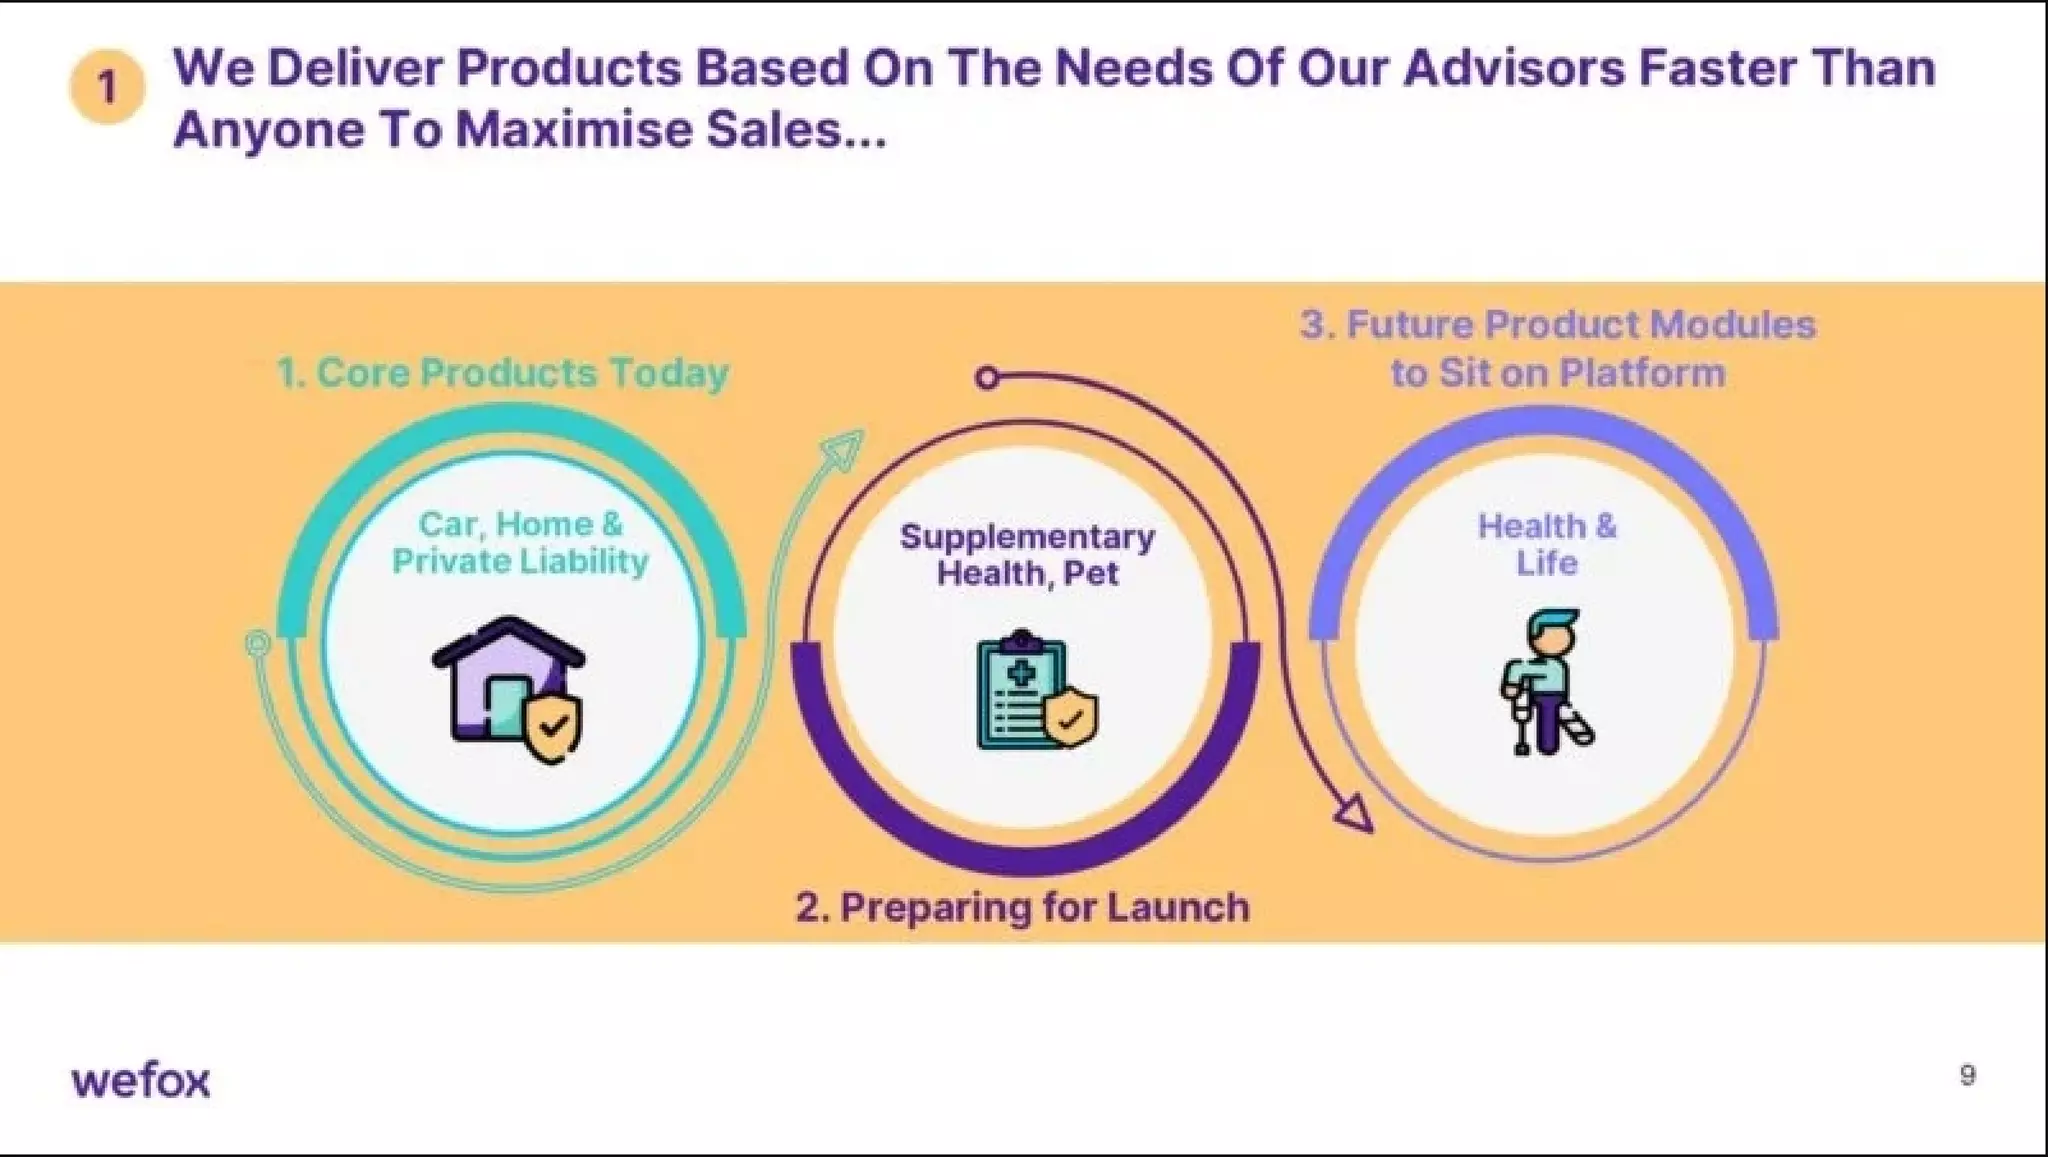
  • Product rollout: start with high-volume core products (Car, Home, Private Liability), then add supplementary (health, pet) and eventually Health & Life modules on the platform (Slide 10).
  • Rollout speed and low launch costs via central platform and cross-functional teams → demonstrated fast launch of motor product (Slide 13).

The Ask

  • Series A raise: $28M (2016).
  • The deck does not show a detailed use-of-funds breakdown (no slide with explicit allocation to product, tech, hiring, geographic expansion, or runway). This is a gap compared to investor expectations for a Series A.

Investor Deep Dive

Executive summary, strengths & red flags

Executive Summary

Wefox’s Series A deck presents a full-stack digital insurance company that controls the entire insurance value chain and scales primarily through digitally enabled advisors/brokers rather than direct-only distribution. The deck is notable for concrete market sizing (country / regional TAMs), strong growth traction (2018–2020 revenue and growth rates), high automation metrics (>80% STP), and a clear operational playbook (distribution selection, underwriting playbook, pricing and automation).

Key Strengths

3 identified

1

Strong, layered market sizing with concrete numbers (€55Bn / €692Bn / €1.3Trn / €5.2Trn) — gives clear scale and strategic focus (Slide 4).

2

Clear traction and unit-economics signals (revenue €119M 2020, +152% year-over-year, >700 advisors, >80% automation, loss ratio claims) — credible growth story (Slides 3, 6, 12, 13).

3

Differentiated GTM and operational playbook — focus on enabling intermediaries rather than competing only on direct channels, plus a concrete underwriting playbook (Slides 9–12).

Red Flags & Weaknesses

3 identified

1

No team slide / weak team signal in the deck — Series A investors expect clear founder & key exec bios, domain experience and hires plan.

2

Lack of detailed financials, unit economics, and use-of-funds (no P&L, cash burn, runway, LTV:CAC math). Loss-ratio presentation is somewhat confusing across slides.

3

Some key claims lack substantiation in the deck (e.g., “>700 digitally enabled advisors,” “automation >80%” — good claims but limited supporting detail / third-party validation in slides). Reinsurance mention (MunichRe) is positive but details absent.

More Pitch Decks To Study

Compare structure, fundraising context, and investor-facing story across similar startup decks.