Compare your deck to Divvy

Compare Your Deck

Divvy Pitch Deck (2017)

Fintech
Stage: Series A
Raised: $10.5M
Year: 2017
Slides: 14
Outcome: Acquired by Bill.com for $2.5B

Pitch Deck

1 / 14
Divvy pitch deck - The Opening: Clear mission and positioning
Click to expand

Deck Analysis

This deck from Divvy (Series A, 2017) presents a focused fintech play: enable homeownership for credit-worthy renters through a fractional equity model that aligns incentives between the company and tenants. The presentation is notable for its clarity — a tight problem statement, a simple three-step solution, clear tech and capital strategies, and early unit economics and traction metrics — and for how it packages a complex financial product into a consumer-facing, scalable offering. The story here is both product (fractional homeownership) and operations (credit facility + tech platform) — a useful case study for startups bridging regulated finance and consumer marketplaces.

The Opening: Clear mission and positioning

The Opening: Clear mission and positioning

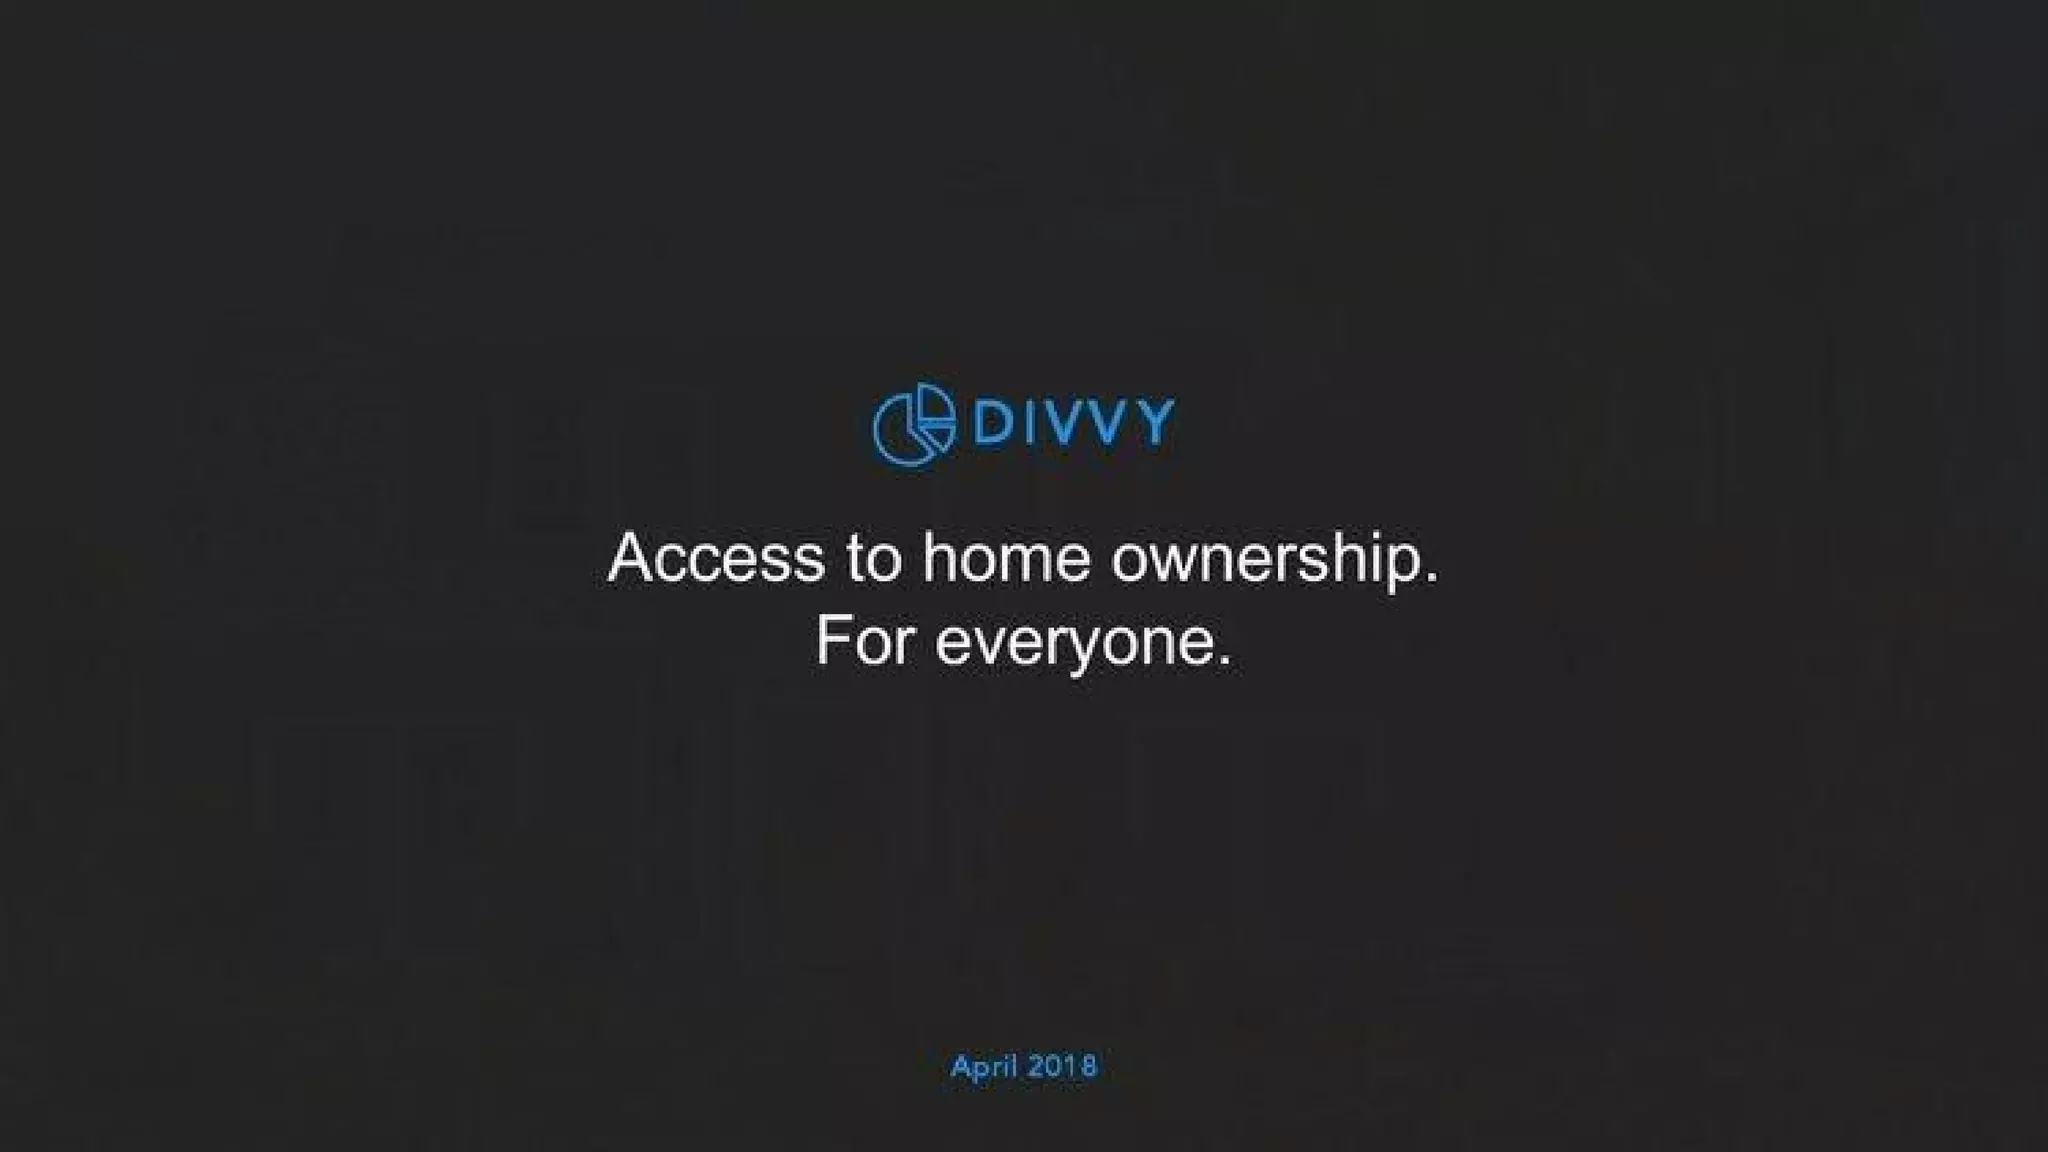
Slide 1 uses minimal copy and strong negative space to introduce the company and its mission: "Access to home ownership. For everyone." The slide is visually spare — a brand mark, the tagline and a date — which forces the audience to focus on the promise and sets the tone for a mission-driven pitch. That economy of language makes the problem immediate and emotionally resonant without burying the audience in data up front.

For founders, this is a reminder that the first slide should do one job well: make the audience remember what you are trying to change. A short, bold mission line backed by a recognizable name/logo and a timestamp is an efficient opener for an investor deck because it frames everything that follows and provides context for traction and financial asks.


Key Takeaway: Lead with a single, memorable mission statement and avoid clutter on your opening slide so investors instantly grasp what you are building.
Team: Demonstrating complementary expertise

Team: Demonstrating complementary expertise

Slide 2 presents the founding trio with photos and short bios that highlight complementary domains — product and real estate expertise, capital markets and underwriting experience, and engineering/tech credentials. The slide communicates credibility quickly: each founder brings a piece of the operating puzzle (product, capital strategy, technology) that the business requires. Including prior companies and education signals both domain knowledge and network access.

For investors in complex, regulated markets, team composition matters more than in many consumer apps. Founders should emulate this by succinctly tying each founder’s background to the company’s most important risks (e.g., underwriting, capital sourcing, technology). Short, targeted bullets under each photo do more to build confidence than long paragraphs.

Key Takeaway: Showhow each founder directly mitigates a core business risk — use concise bullets linking background to the company’s key challenges.
Market Opportunity: A tight and tangible target

Market Opportunity: A tight and tangible target

Slide 3 states a crisp market insight: "6 million credit-worthy households should be homeowners, but aren't." This is a focused TAM/SAM-style stat that immediately defines the addressable customer and the problem scope. It’s effective because it balances specificity (a numeric claim) with empathy (these are credit-worthy people who are being underserved), which helps justify the venture’s mission while hinting at scale.

Founders should aim for single-line market punches like this: concrete, defensible, and directly tied to the product’s value proposition. When possible, follow up with segmentation (who within that 6M is the early target) and how the model captures that subset — investors want to see both size and a credible plan to reach it.

Key Takeaway: Use one clear, defensible market statistic to anchor your opportunity and then show how your initial go-to-market targets a realistic slice of it.
Solution & Business Model: Simple process, aligned incentives

Solution & Business Model: Simple process, aligned incentives

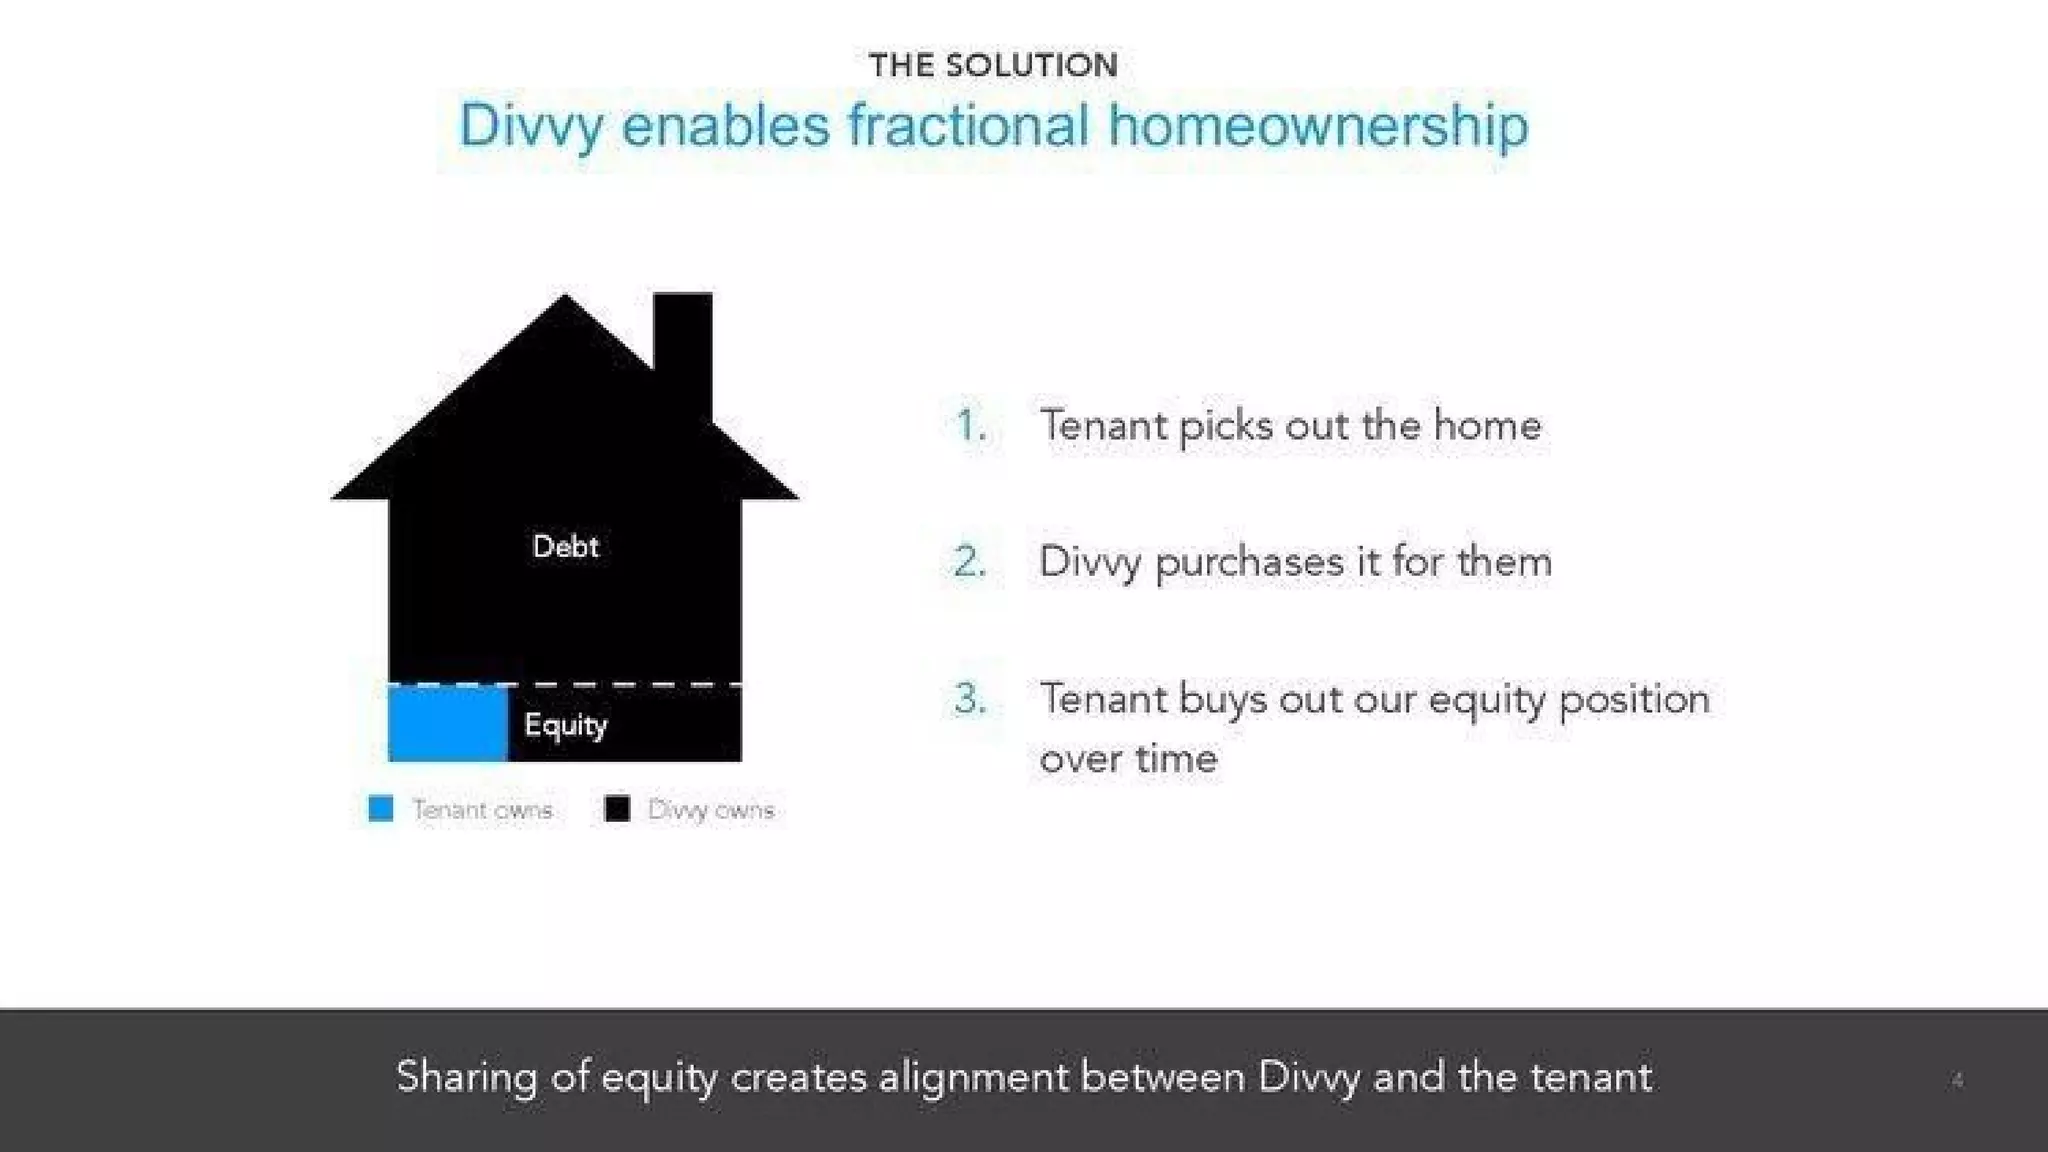
Slide 4 lays out Divvy’s three-step solution: tenant selects a home, Divvy purchases it, tenant buys out equity over time. The slide pairs a simple diagram (debt vs equity ownership) with numbered steps, making a potentially complex financial flow easy to understand. It also highlights the core behavioral and economic insight: sharing equity aligns incentives and creates a pathway to homeownership rather than an opaque loan product.

This approach is instructive: complex financial products benefit from process-driven visuals that show customer flow and alignment of incentives. Founders should prioritize clarity on who owns what at each stage, how customers progress economically, and why the model reduces risk or increases retention compared with incumbents.

Key Takeaway: Map customer flow in 3–4 clear steps and show how ownership and incentives shift over time to make a financial product intuitive.
Technology & Operations: Identifying the core scalable levers

Technology & Operations: Identifying the core scalable levers

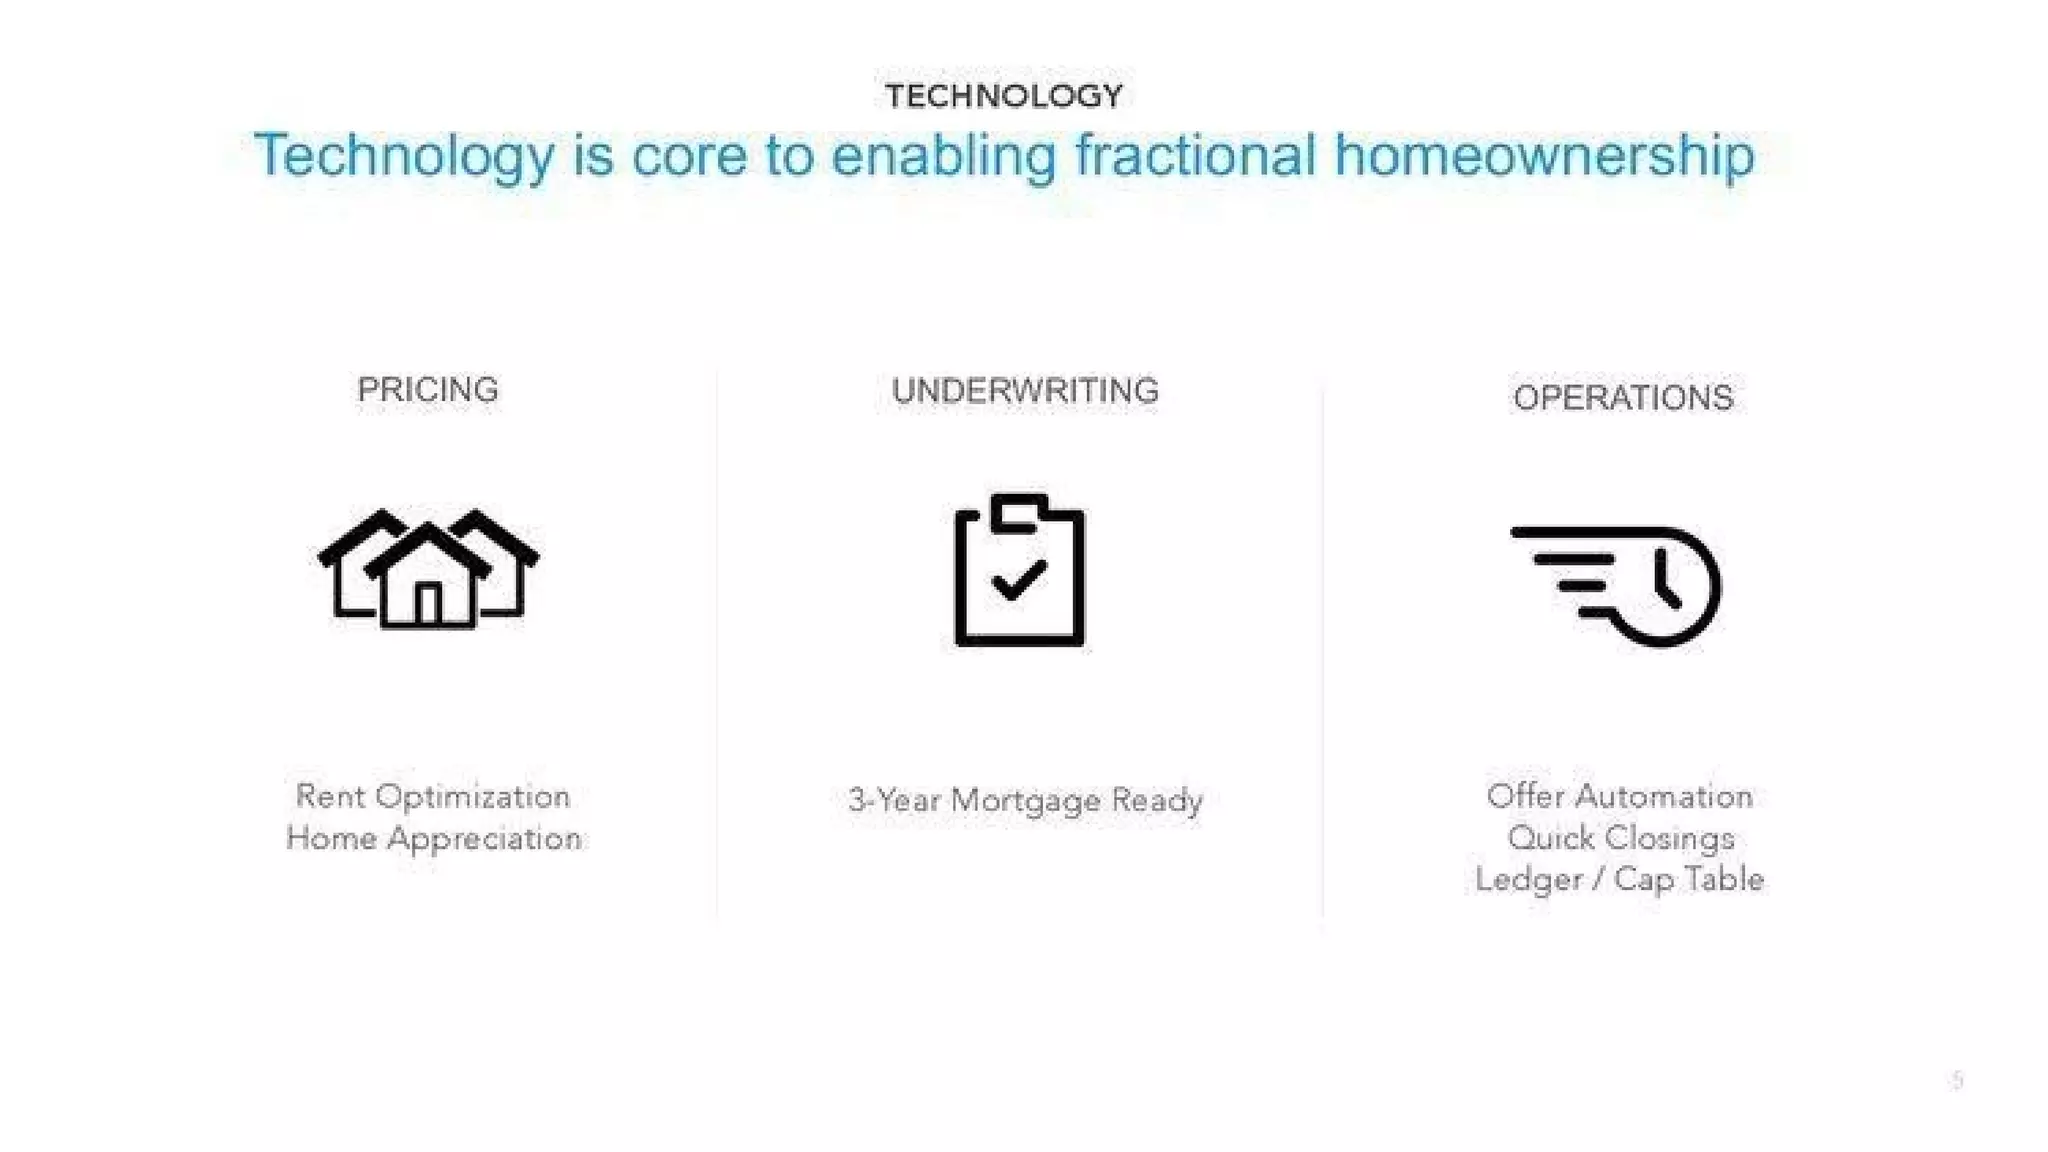
Slide 5 positions technology as central to enabling fractional homeownership, breaking it down into pricing, underwriting and operations. Each pillar maps to a specific scaling problem: pricing optimizes rent and appreciation capture, underwriting makes short-term mortgage-readiness credible, and operations automate offers and closings to reduce friction. By calling these out, the deck signals that Divvy is not just a balance-sheet play but a tech-enabled operations business.

For founders building capital-intensive consumer finance products, this is a good blueprint: identify 3–4 core technical capabilities that convert into operational leverage (better margins, faster throughput, lower defaults). Investors want to know which parts of the stack are proprietary vs. commoditized and how tech reduces cost-to-serve as you scale.

Key Takeaway: Explicitly call out the small set of technical capabilities that drive unit economics and operational scale, and explain how each reduces cost or risk.
Unit Economics: Visualizing the value chain

Unit Economics: Visualizing the value chain

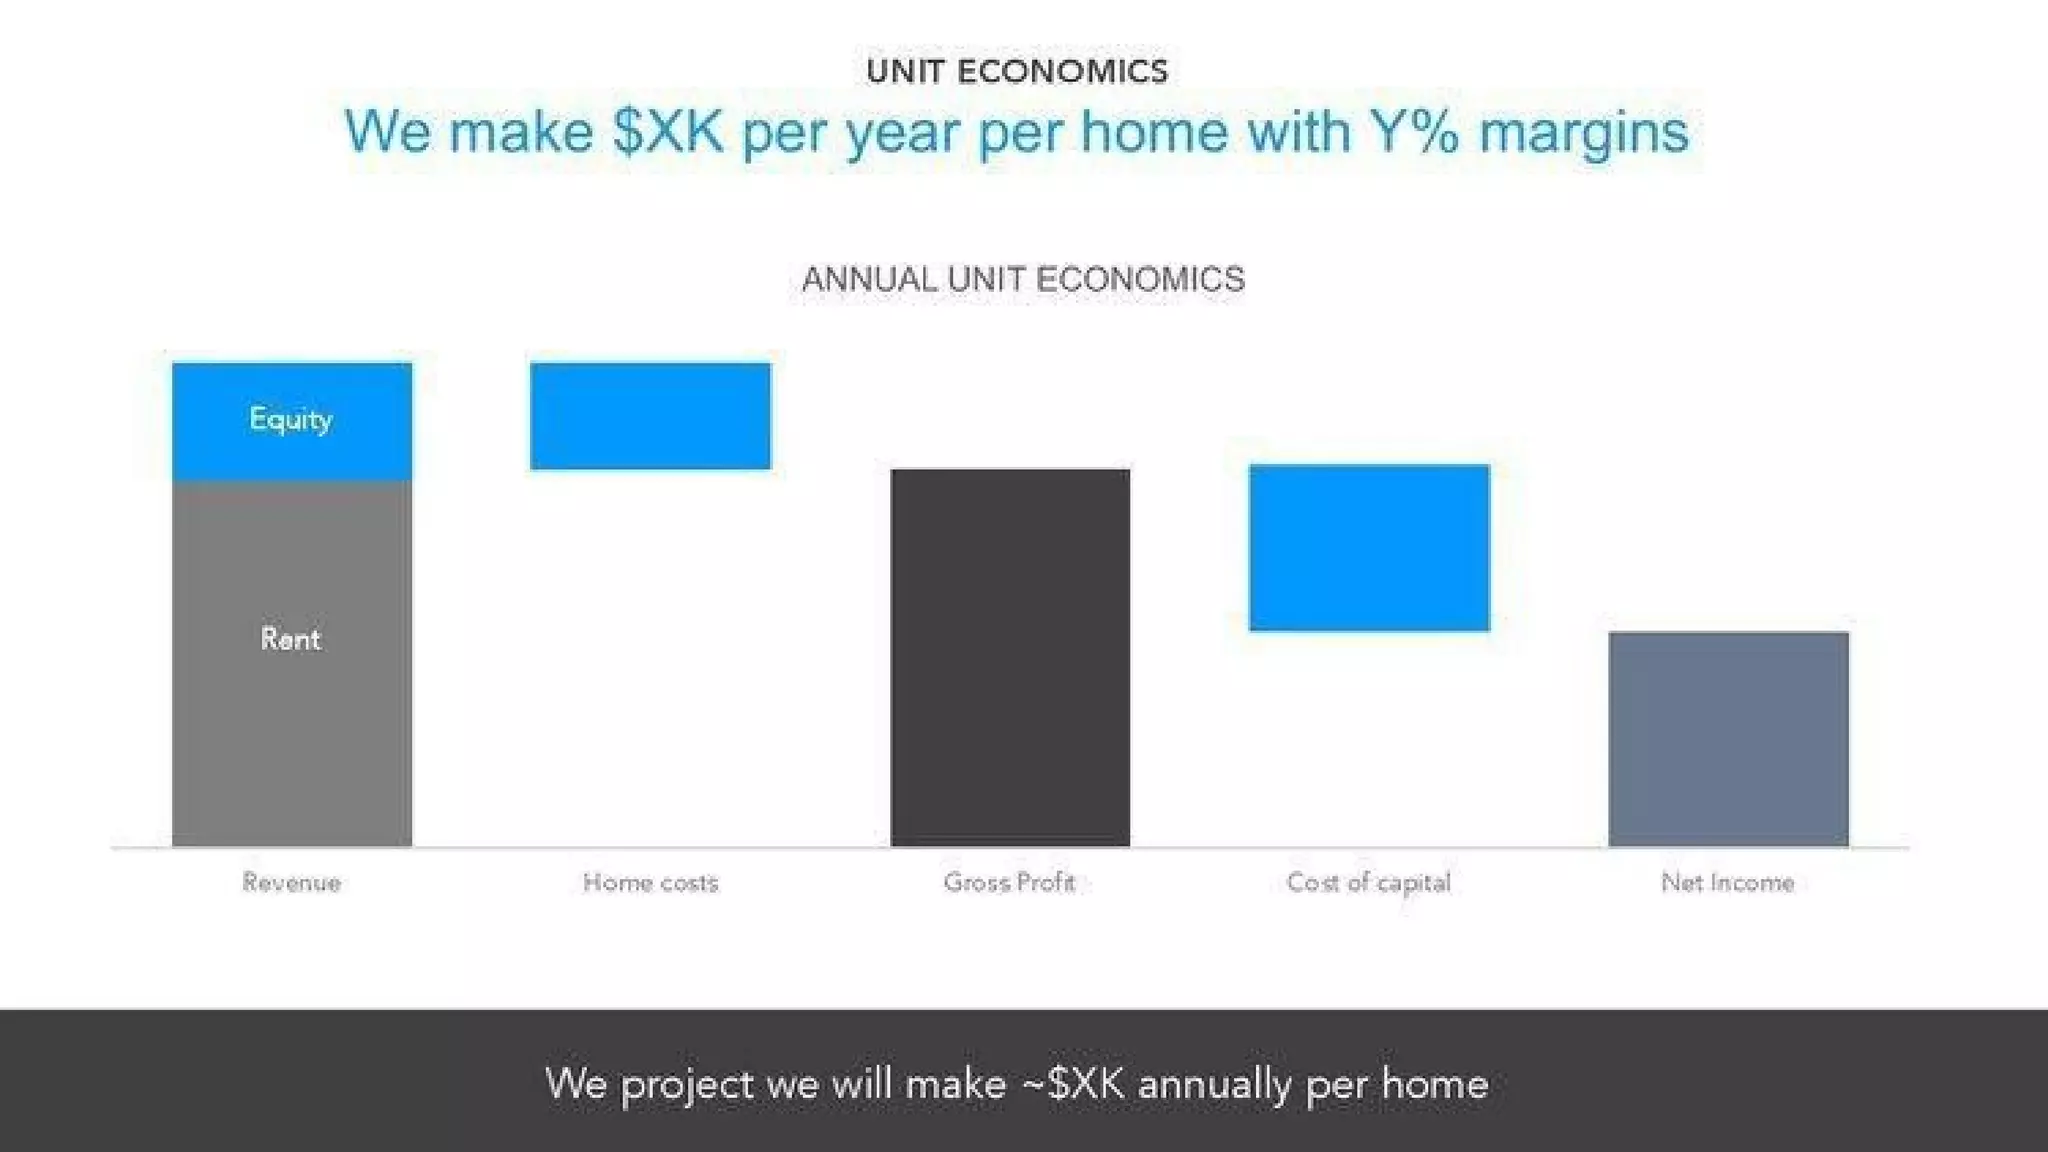
Slide 6 depicts annual unit economics in a cascading bar style (revenue -> home costs -> gross profit -> cost of capital -> net income). The visualization emphasizes that revenue contains both rent and equity upside, and that the company’s gross margin must cover capital and operating costs to produce meaningful net income per home. Presenting economics visually makes it easier for investors to understand where value accrues and where pressure points are (e.g., cost of capital).

Founders should use clear visuals to show per-unit flows and sensitivities — highlight the levers (rent optimization, home selection, capital cost) and the assumptions behind them. Be prepared to follow this with a short sensitivity analysis (e.g., how margins change with house price appreciation or varying advance rates) — that’s often the next question from sophisticated investors.

Key Takeaway: Use a simple waterfall or cascading chart to show where revenue becomes profit and call out the top 2–3 levers that move unit economics materially.
Traction: Growth rate and distribution engine

Traction: Growth rate and distribution engine

Slide 13 (monthly homes closed) shows rapidly increasing monthly closings from Nov '17 through an April run-rate, communicating clear momentum. Slide 12 (distribution) earlier highlights an agent-referral flywheel: agents refer clients and other agents. Together these slides demonstrate both demand (growing closings) and a scalable channel (real estate agents incentivized to refer). The combination is powerful: traction without a repeatable distribution model is fragile; pairing them suggests sustainable growth.

Founders should present traction as both raw growth and as evidence of a repeatable acquisition funnel. Use two slides or a combined narrative: one to show the numbers and momentum, and one to explain the mechanism (partnerships, referral loops, economics per acquisition) that will sustain and scale that growth.

Key Takeaway: Show momentum with clear month-over-month metrics and pair that with the concrete distribution mechanism that explains how you’ll sustain growth.

Conclusion: Key Lessons

Divvy’s deck is a compact example of how to pitch a regulated, capital-intensive fintech: it starts with an emotive, simple mission, establishes credibility through team and a tight market stat, explains the customer flow with a direct three-step solution, and then prioritizes the technical and capital levers required to scale. Its strengths are clarity (visual process maps and waterfalls), alignment of incentives (equity sharing), and the combination of early traction with a logical distribution strategy.

Actionable advice for founders: open with a one-line mission, show a clear problem-size stat, map the end-to-end customer flow in 3–4 steps, call out the 3 core technical/operational capabilities that enable scale, present unit economics as a waterfall so top-line converts to net, and prove product-market fit with both momentum and a repeatable acquisition channel. Finally, when your business depends on external capital, explicitly outline how you will source and scale that capital (term loans, credit facilities, partners) — investors want to see a plan for the balance sheet as well as the product.

Full Deck Analysis

11 sections

Overview

Company: Divvy
Round: Series A ($10.5M)
Year: 2017 (Pitch presented April 2018)
Outcome: Acquired by Bill.com for $2.5B (2021)
Time to Exit: ~3 years post-Series A

Executive Summary

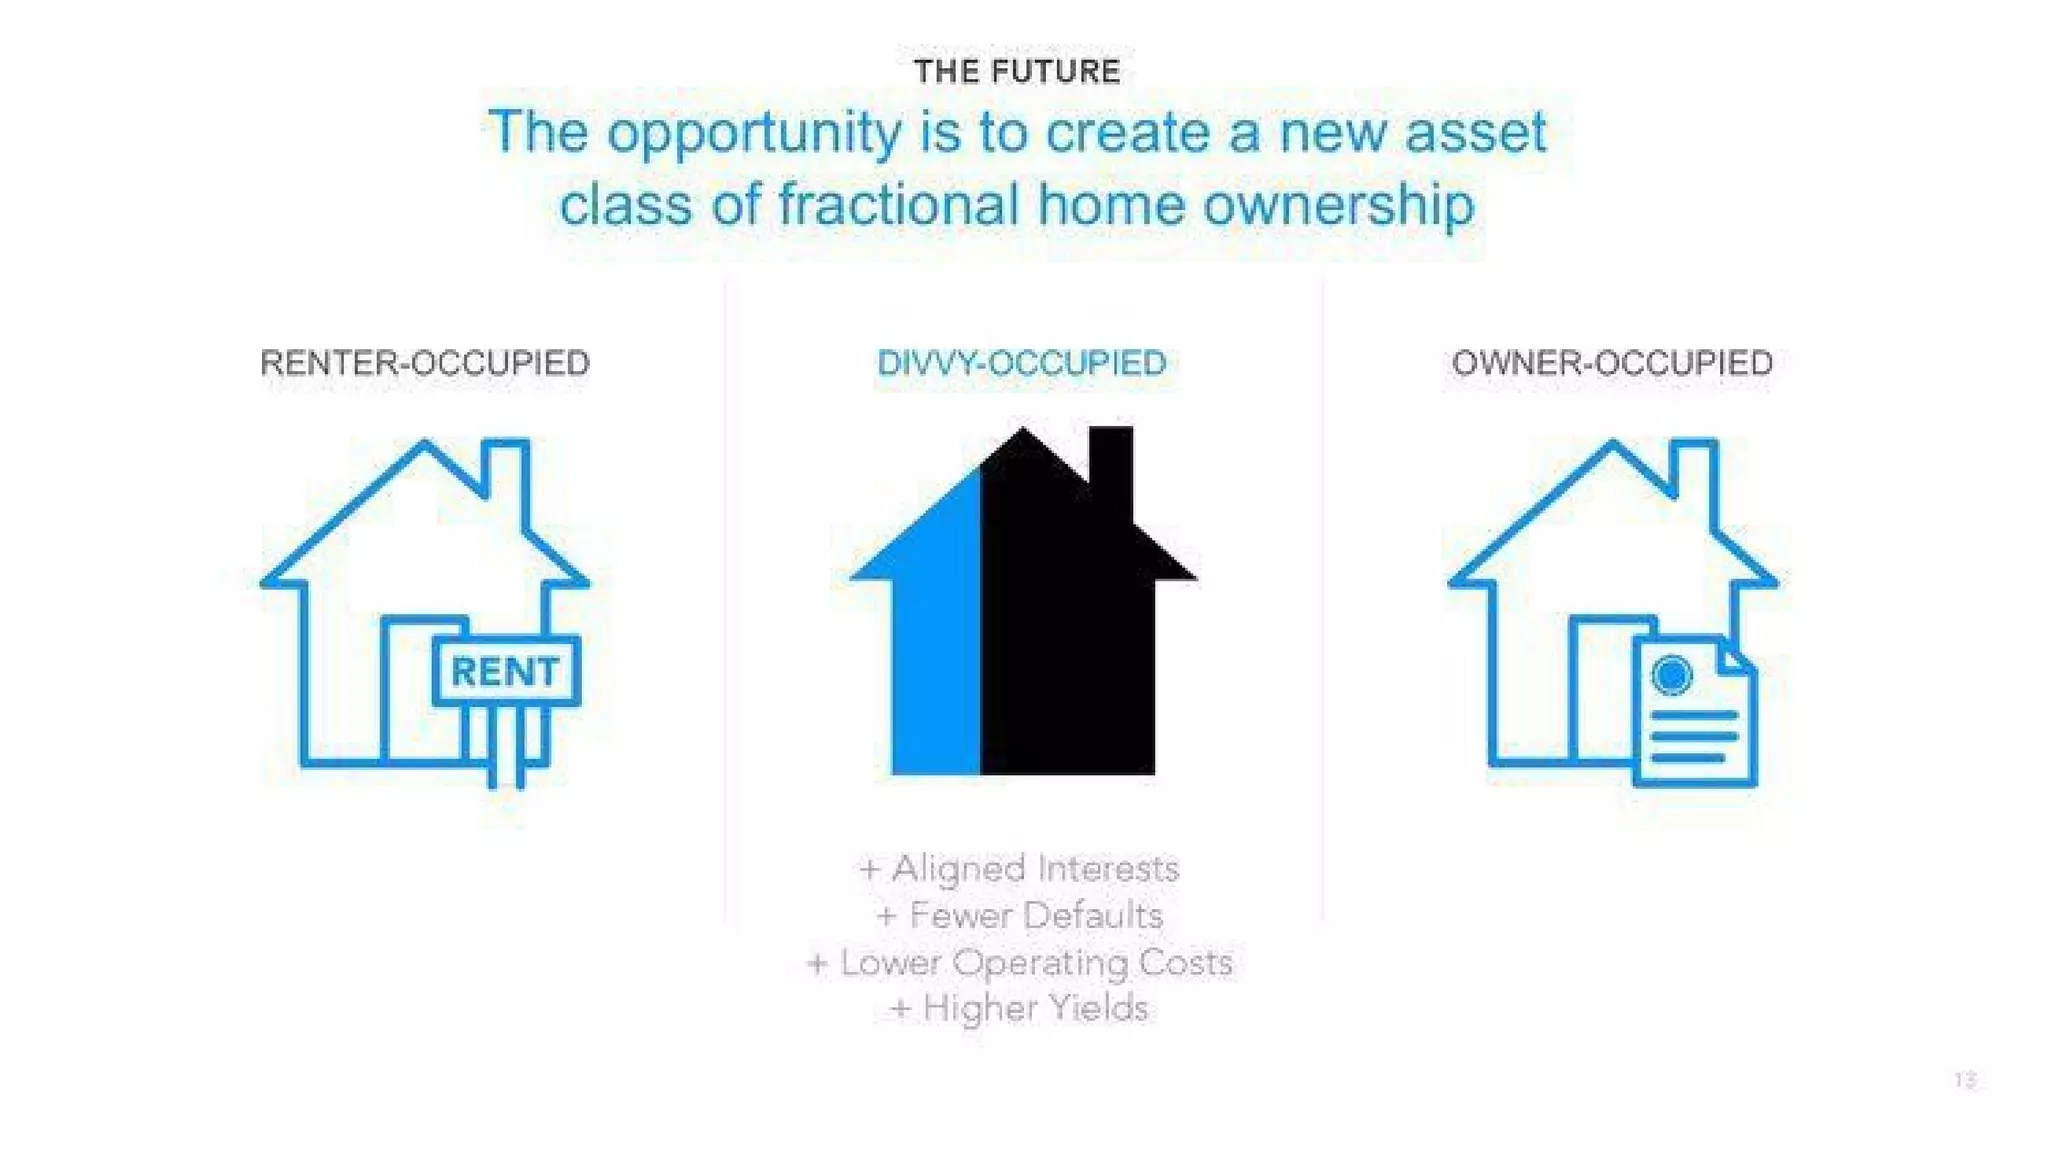
Divvy’s Series A pitch presents a compelling rent-to-own platform that democratizes homeownership for credit-worthy but capital-constrained households through a fractional ownership model. The deck effectively combines a large addressable market (6 million households), proven early traction (exponential growth from Nov 2017-Apr 2018), and a sophisticated capital markets strategy to scale. The pitch resonated with investors by positioning Divvy as a new asset class—bridging traditional rental and ownership markets—with aligned incentives between the company and customers, ultimately validating the model’s viability and leading to a $2.5B acquisition within three years.


Problem Statement

Slide 3: “6 million credit-worthy households should be homeowners, but aren’t”

The deck identifies a specific, quantified market gap: 6 million households that meet credit standards but are excluded from homeownership. While the slide doesn’t explicitly detail why these households are excluded, the implicit barriers are:

  • Down payment requirements: Traditional mortgages require 3-20% down payments ($6K-$54K on a $200K home)
  • Credit history gaps: Non-traditional credit profiles despite creditworthiness
  • Income documentation: Gig economy workers or self-employed individuals
  • Liquidity constraints: Credit-worthy but cash-poor households

Effectiveness: The problem is quantified (6M) and specific (credit-worthy), but lacks depth on root causes or customer pain points. No customer testimonials or research cited to validate the problem.


Solution

Slide 4: “Divvy enables fractional homeownership”

Divvy’s solution is a three-step rent-to-own model:

  1. Tenant selects the home they want to purchase
  2. Divvy purchases the property on the tenant’s behalf
  3. Tenant buys out Divvy’s equity stake over time (implied 3-year timeline from Slide 5)

Equity Structure:

  • Tenant starts with initial equity stake (blue portion of house diagram)
  • Divvy holds remaining equity/debt position (black portion)
  • Shared equity alignment: Both parties benefit from home appreciation
  • Tenant builds equity through rent payments + appreciation

Key Differentiator: Unlike traditional rent-to-own, Divvy’s shared equity model aligns incentives—both parties win if the home appreciates and the tenant successfully transitions to ownership.

Effectiveness: The solution is visually clear and addresses the down payment barrier, but mechanics are vague (initial equity %, buyout terms, default scenarios).


Market Opportunity

Total Addressable Market (TAM)

Primary TAM: 6 million credit-worthy households

  • Defined as households that qualify for credit but lack capital/traditional mortgage access
  • Represents underserved segment between traditional renters and traditional homebuyers

Serviceable Addressable Market (SAM)

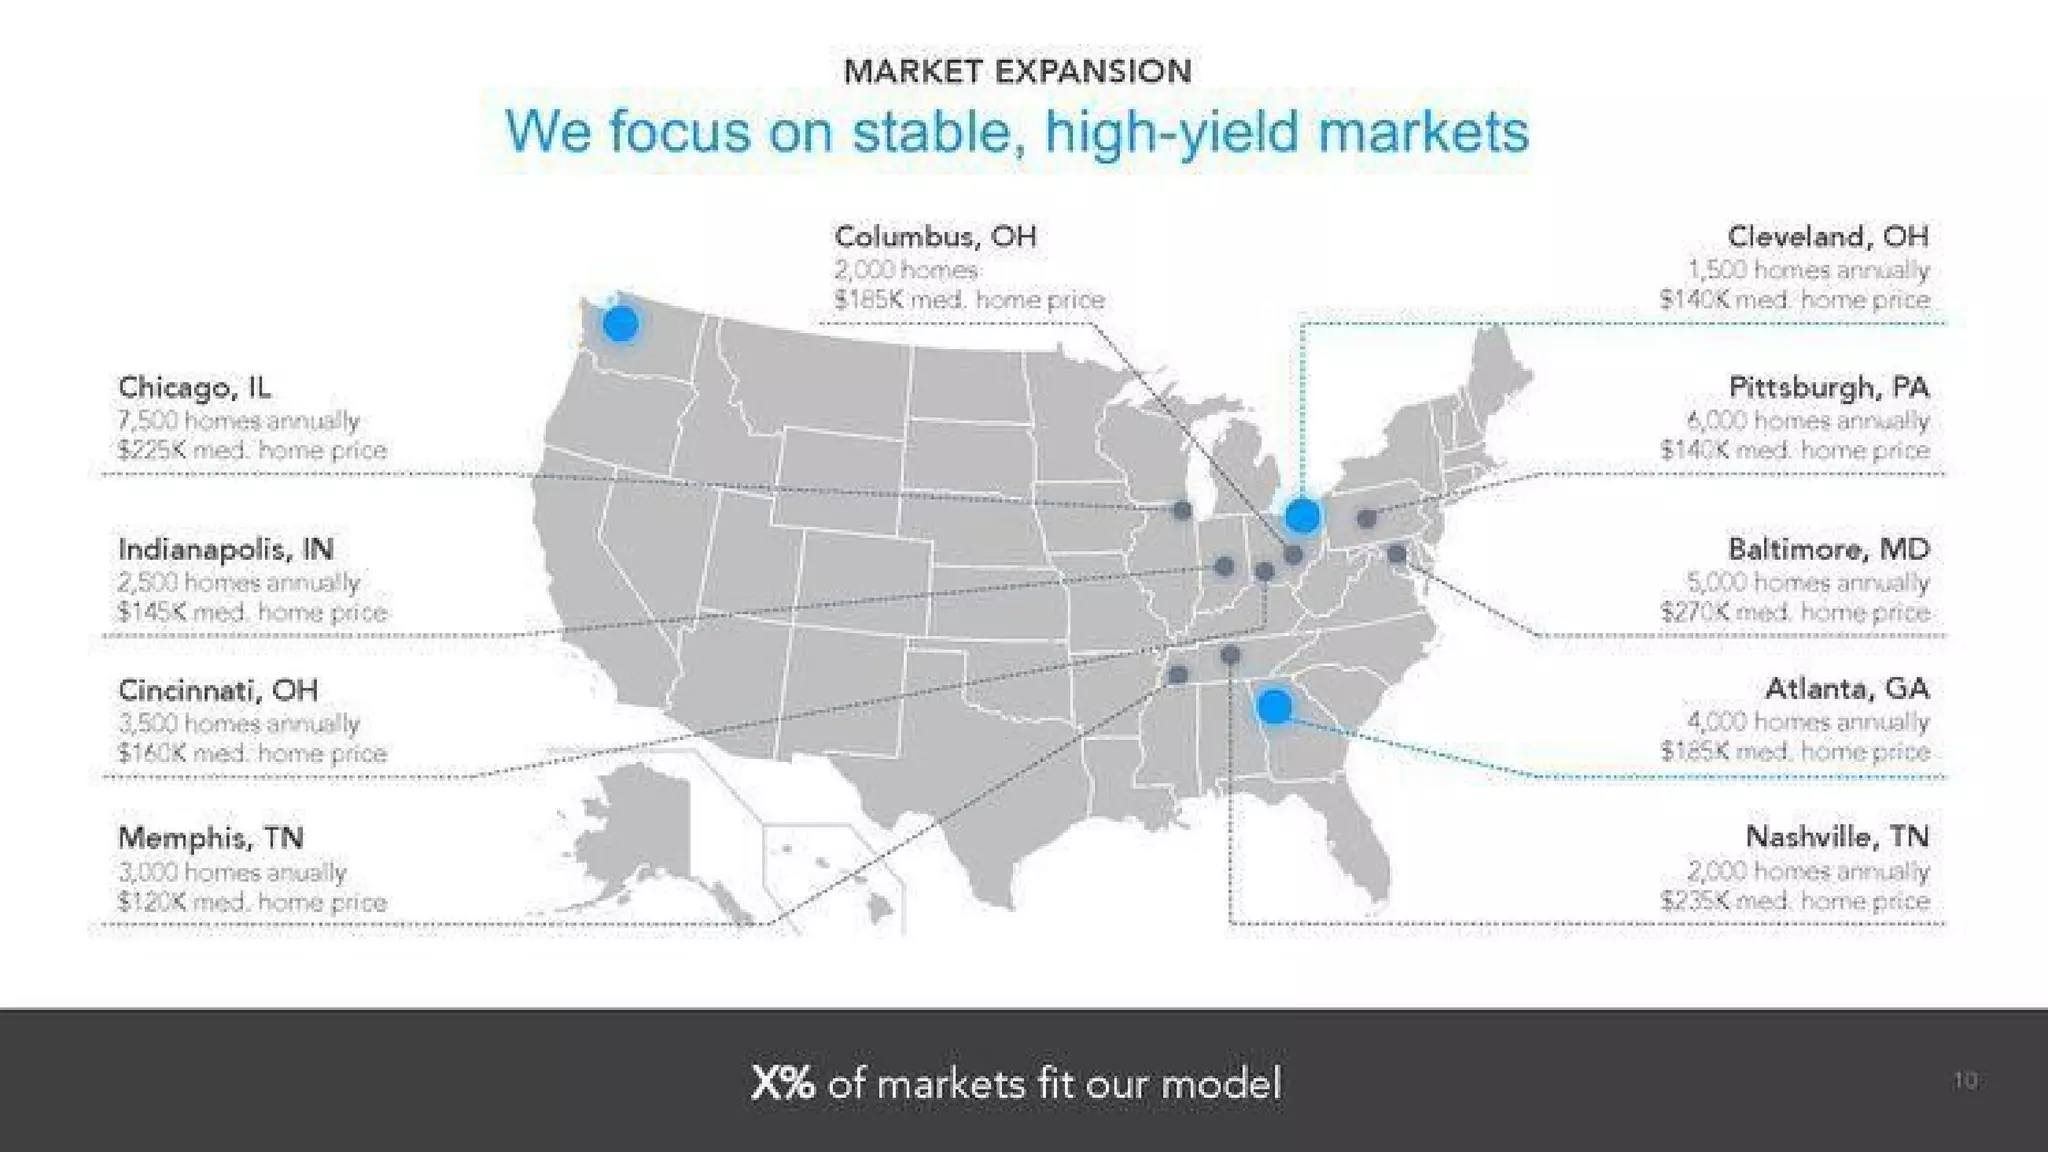
10 target markets with ~34,800 homes/year potential:

Market Annual Homes Median Home Price Notes
Chicago, IL 7,500 $225K Largest market
Baltimore, MD 5,000 $270K Highest price point
Pittsburgh, PA 4,000 $140K  
Atlanta, GA 4,000 $165K  
Cincinnati, OH 3,500 $160K  
Indianapolis, IN 2,800 $145K  
Memphis, TN 3,000 $120K Lowest price point
Columbus, OH 2,000 $165K  
Cleveland, OH 1,500 $140K  
Nashville, TN 2,000 $265K  
TOTAL ~34,800 $160K avg  

Market Selection Rationale: Focus on stable, high-yield Midwest/Southeast markets with lower median home prices (reducing capital requirements per unit). No explicit criteria stated, but implied selection favors:

  • Lower cost of living markets
  • Stable housing markets (less volatile than coastal metros)
  • Sufficient rental demand to support model

Market Fit: Slide 7 states “X% of markets fit our model” (percentage redacted), suggesting selective geographic expansion based on specific criteria.

Serviceable Obtainable Market (SOM)

Implied from traction: At April 2018 run-rate of ~100 homes/month:

  • Year 1 projection: ~1,200 homes
  • Year 3 projection: 100,000 families (mission statement, Slide 14)
  • Implies 33x growth over 3 years (~50% CAGR)

Business Model

Revenue Model

Dual revenue streams per home (Slide 6: Unit Economics):

  1. Rental Income
    • Monthly rent payments from tenant
    • Covers property costs (taxes, insurance, maintenance, property management)
    • Generates gross profit margin
  2. Equity Appreciation
    • Divvy retains equity stake during holding period
    • Benefits from home price appreciation
    • Realizes gains when tenant buys out equity position

Unit Economics

Annual Revenue Per Home: $XK (redacted)

Waterfall Structure:

  • Revenue = Rent + Equity appreciation
  • Less: Home Costs = Property taxes, insurance, maintenance, management
  • Gross Profit = Revenue - Home Costs
  • Less: Cost of Capital = Financing costs on property purchase
  • Net Income = ~$XK annually per home (redacted)

Margin Target: Y% (redacted)

Key Insight: The waterfall shows positive net income per home, validating unit-level profitability. However, the black bar (gross profit) appears negative before capital costs, suggesting thin margins on operations alone—profitability depends on capital structure optimization.

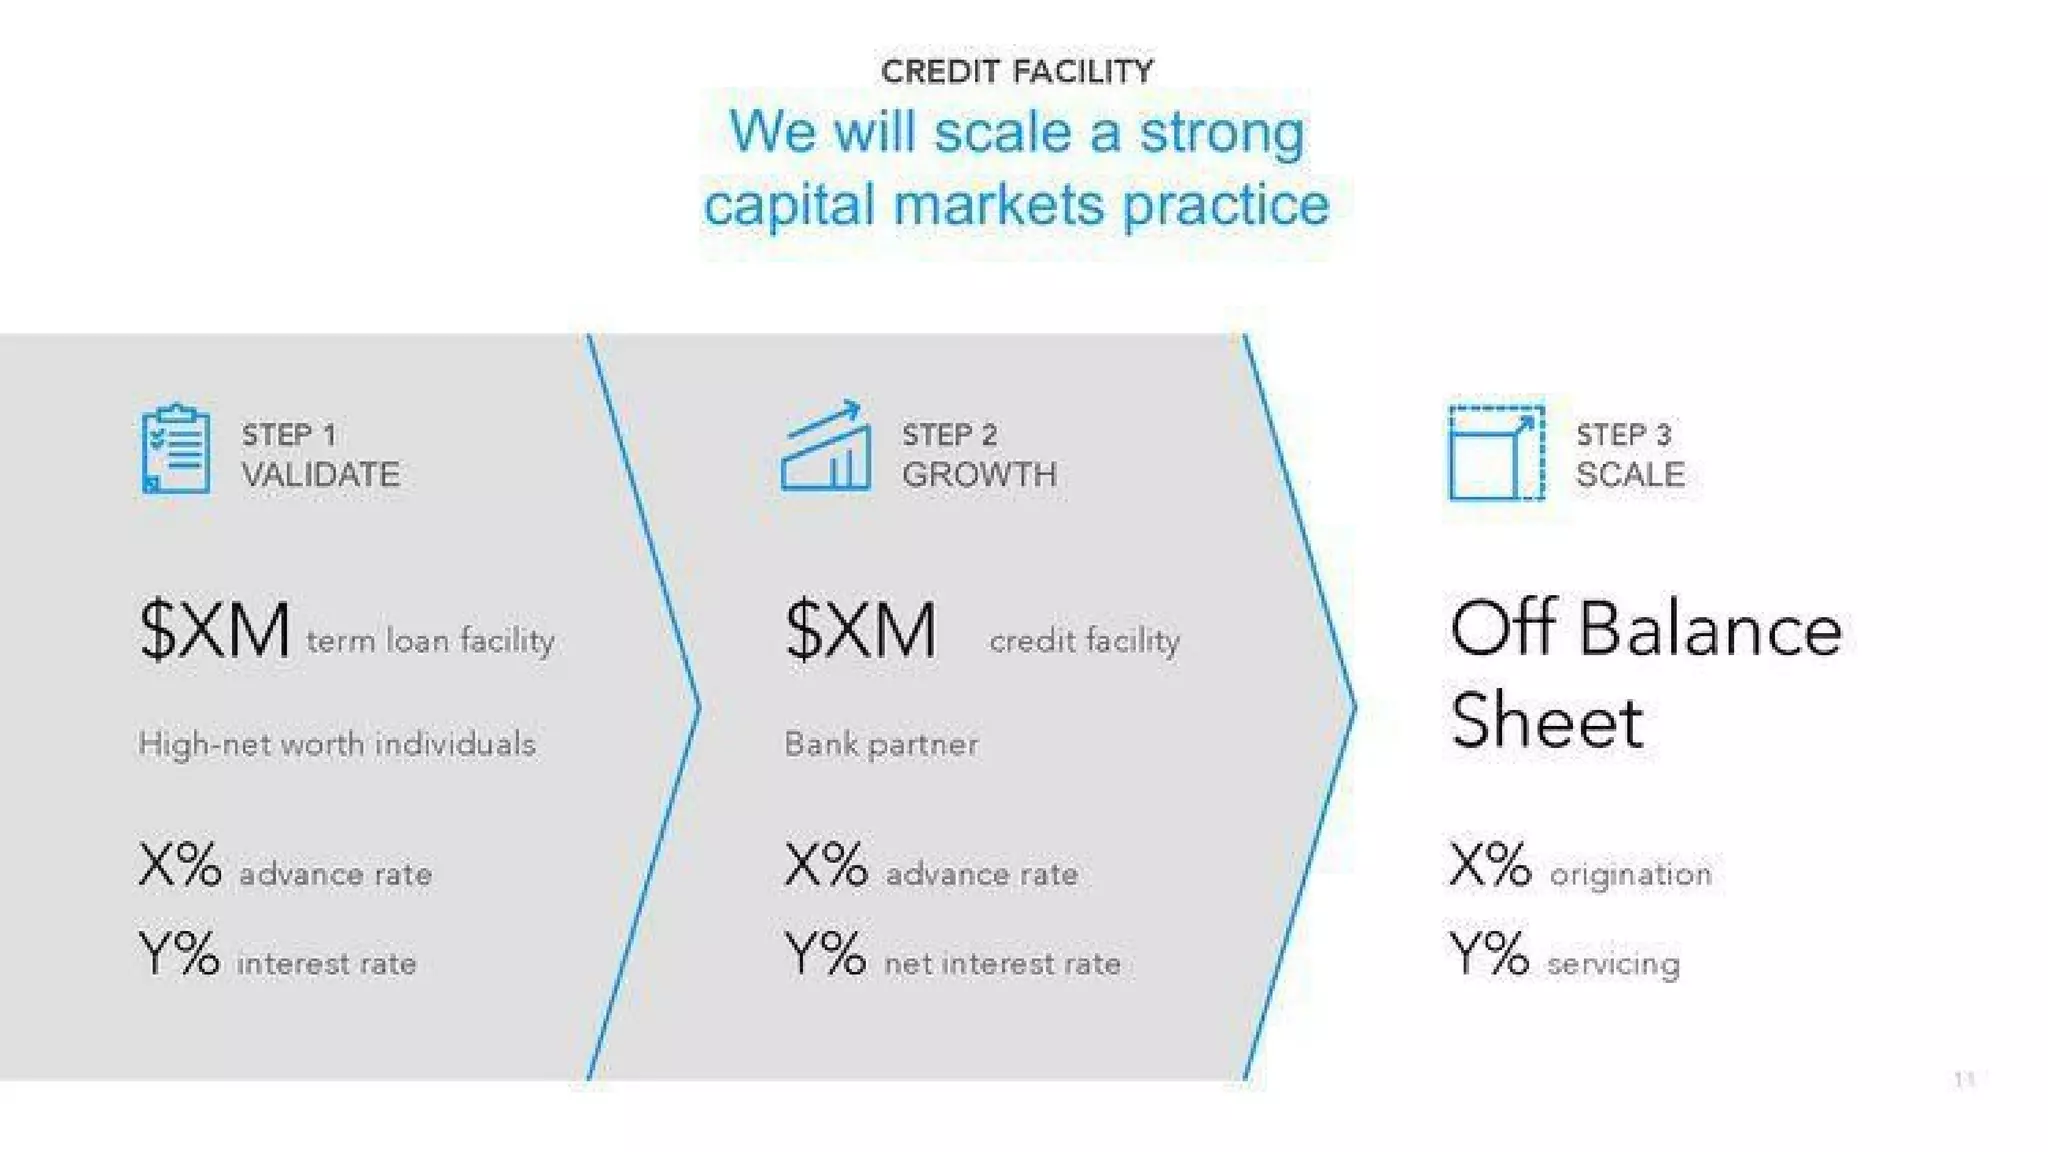
Financing Strategy (Slide 8)

Three-stage capital markets approach:

Stage Facility Source Size Advance Rate Rate
1. Validate Term Loan High-net-worth individuals $XM X% Y%
2. Growth Credit Facility Bank partner $XM X% Y% net
3. Scale Off-Balance-Sheet Securitization (implied) — X% origination Y% servicing

Implication: Divvy plans to securitize its mortgage portfolio (Stage 3), converting illiquid home equity positions into tradeable securities—a sophisticated capital markets play that reduces balance sheet risk and enables unlimited scaling.


Traction & Metrics

Growth Trajectory (Slide 12: “Our customers love our product”)

Monthly Homes Closed (Nov 2017 - Apr 2018):

Month Homes Closed Growth Rate
Nov ‘17 ~10-15 Baseline
Dec ‘17 ~10-15 Flat
Jan ‘18 ~25-30 +67-100%
Feb ‘18 ~40-50 +60-100%
Mar ‘18 ~70-80 +75-100%
Apr ‘18 (run-rate) ~100+ +25-43%

Growth Pattern: Exponential acceleration from Jan-Apr 2018, with 2-3x month-over-month growth during peak period.

3-Month Total: X homes closed (redacted)
Customer Backlog: Y customers (redacted)

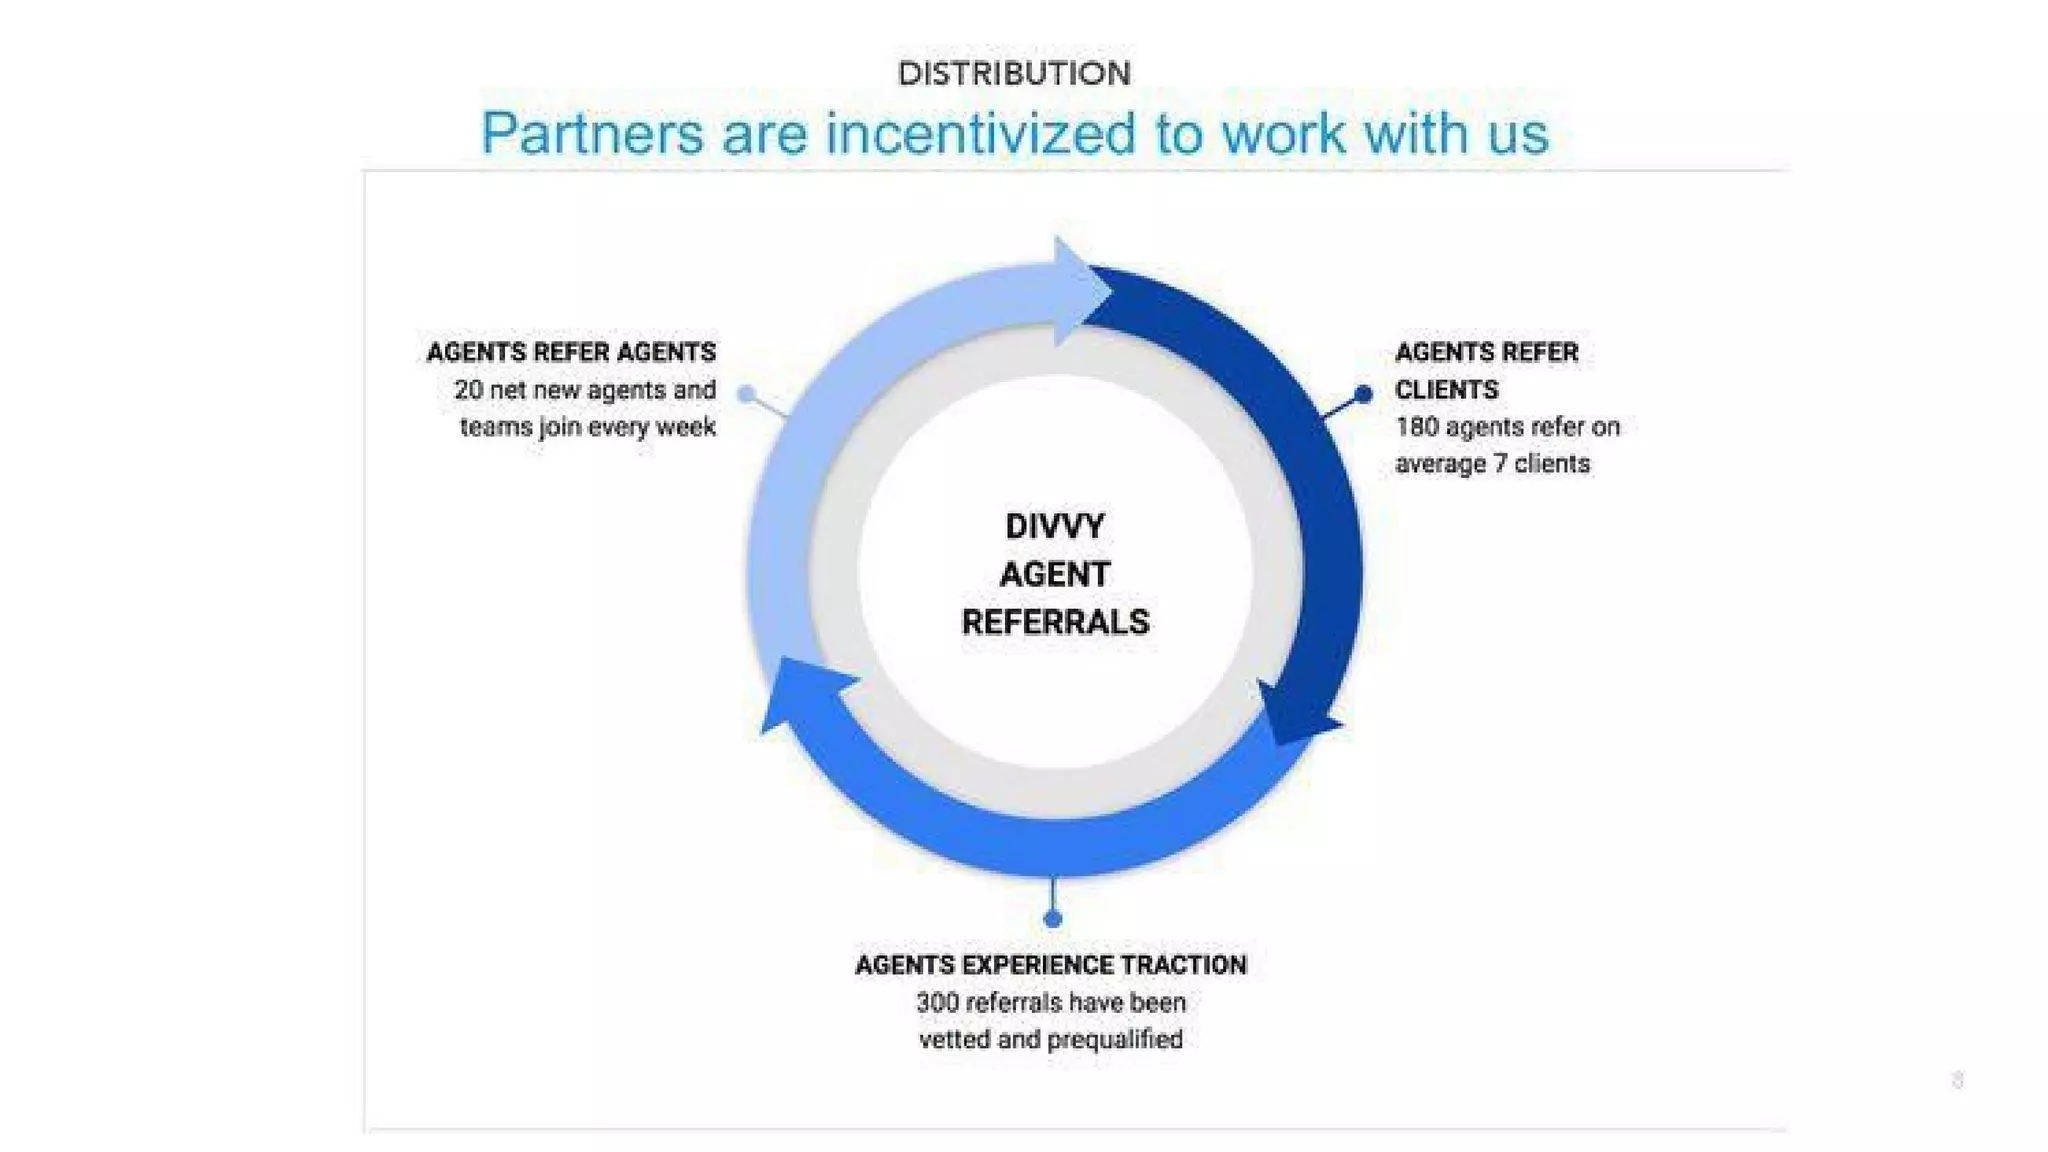
Distribution Traction (Slide 11: Agent Referral Network)

Agent Network Metrics:

  • Active agents: 180
  • Agent recruitment rate: 20 net new agents/teams per week
  • Average referrals per agent: 7 clients
  • Implied monthly referrals: 180 agents × 7 clients = 1,260 referrals
  • Prequalified referrals: 300 (proof of concept)

Viral Growth Mechanism: Agents refer other agents (20/week), creating network effects and reducing customer acquisition cost.

Key Proof Points

  1. Product-market fit: Exponential growth validates demand
  2. Repeatable distribution: Agent referral model scales with agent recruitment
  3. Customer backlog: Demand exceeds supply (positive signal)
  4. Early validation: 300 prequalified referrals show model works

Metrics NOT Disclosed

  • Default rate / delinquency rate
  • Customer acquisition cost (CAC)
  • Lifetime value (LTV)
  • Churn / retention rate
  • Conversion rate (referral → closed home)
  • Average home price / equity split
  • Tenant credit scores / income profiles

Competitive Positioning

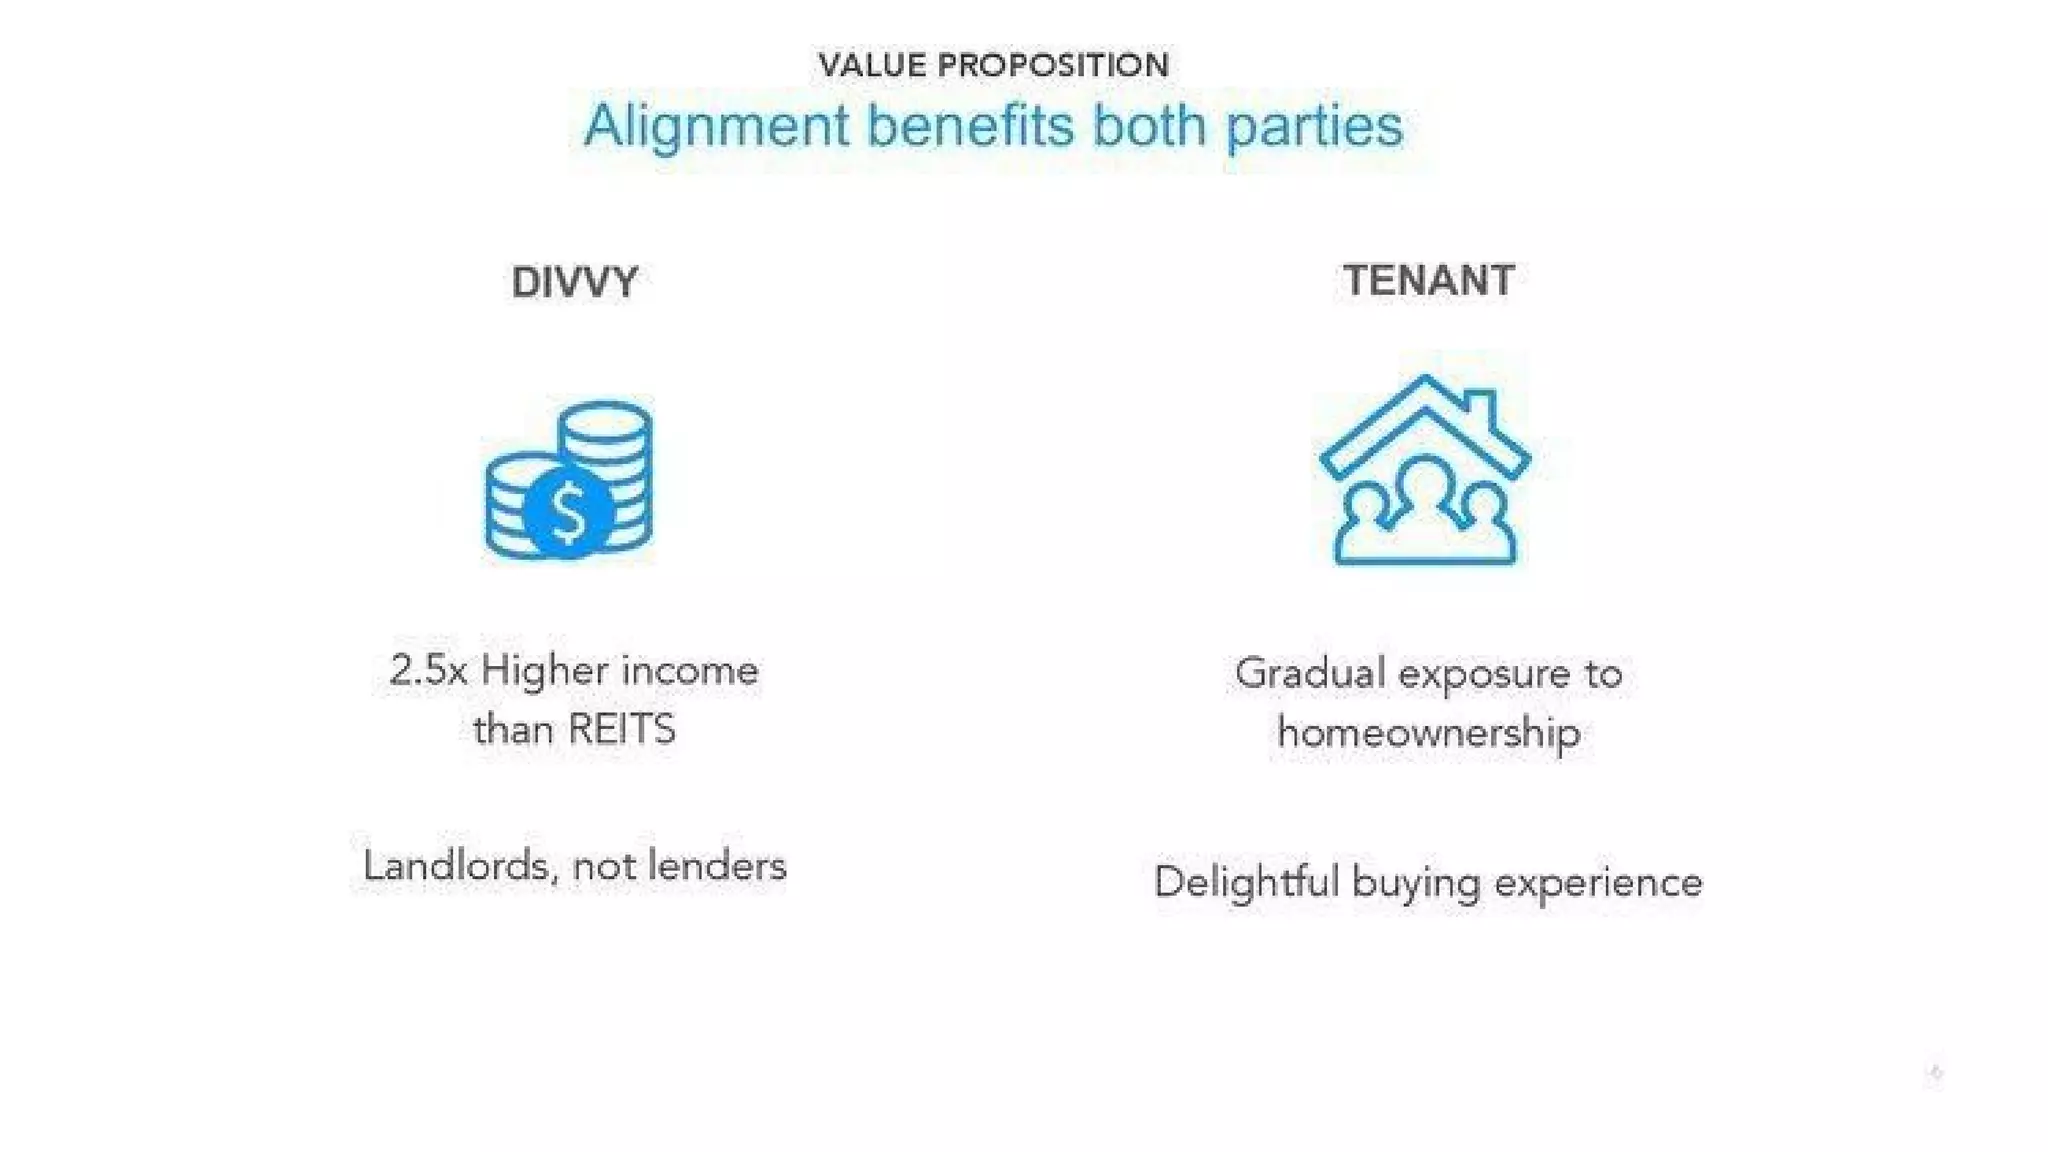
Differentiation Strategy (Slide 10: Value Proposition)

Divvy vs. REITs:

  • 2.5x higher income than REITs
    • Positions Divvy as superior real estate investment
    • Specific benchmark: REIT returns
    • Implies Divvy generates 2.5x the annual yield of traditional REITs
    • Note: No source or calculation methodology provided

Divvy vs. Traditional Landlords:

  • Landlords, not lenders
    • Emphasizes equity upside vs. interest income
    • Positions as real estate operator, not fintech lender
    • Implies better risk-adjusted returns than mortgage lending

Divvy vs. Traditional Mortgages:

  • Gradual exposure to homeownership
    • Removes down payment barrier
    • De-risks transition to ownership
    • Allows credit-building during holding period

Divvy vs. Rent-to-Own:

  • Shared equity alignment
    • Both parties benefit from appreciation
    • Reduces moral hazard (traditional rent-to-own often exploitative)
    • Aligns incentives for successful tenant transition

Competitive Advantages

  1. Technology-enabled underwriting (Slide 5): Automated pricing, underwriting, operations
  2. Capital markets sophistication: 3-stage financing strategy enables scaling
  3. Agent distribution network: Leverages existing real estate ecosystem
  4. Aligned incentive model: Shared equity reduces defaults vs. traditional rent-to-own

Competitive Gaps

  • No explicit competitor analysis in deck
  • No mention of existing rent-to-own players (Wayflyer, Roofstock, etc.)
  • No regulatory moat discussed
  • No IP/patent protection mentioned
  • Vulnerable to competition from traditional landlords, REITs, or fintech lenders

Team

Founding Team (Slide 2)

Adena Hefets - CEO

  • Background: Product & Capital Markets @ Square Capital (fintech expertise)
  • Finance: Investor @ TPG (private equity), Banker @ BAML (mortgage/real estate finance)
  • Education: MBA from Stanford University, Cornell University undergrad
  • Relevance: Capital markets + real estate finance expertise critical for financing strategy

Brian Ma - CPO (Chief Product Officer)

  • Background: Repeat founder (3rd company), Founder @ Decide.com (data/analytics)
  • Real Estate: Product @ Zillow (housing tech), RE Agent and Investor (domain expertise)
  • Education: CS & EE from University of Washington
  • Relevance: Product + real estate domain expertise; repeat founder credibility

Nicholas Clark - CTO

  • Background: CTO @ DoubleDutch (scale), Sr. Engineer @ Microsoft (tech depth)
  • Entrepreneurship: Founder @ MobileSRC (startup experience)
  • Education: ECE from Cornell University
  • Relevance: Technical leadership + scale experience

Team Assessment

Strengths:

  • Complementary skills: Real estate + capital markets + technology
  • Relevant experience: Square Capital (fintech), TPG (capital), Zillow (housing), Microsoft (scale)
  • Top-tier education: Stanford MBA, Cornell, UW
  • Repeat founder: Ma’s track record de-risks execution
  • Domain expertise: CEO’s banking background + CPO’s real estate background

Gaps:

  • No operations/scaling expert explicitly mentioned
  • No diversity shown in photos (all appear to be male)
  • Limited public track records for Ma and Clark (no major exits mentioned)
  • Hefets’ startup experience not detailed (first-time founder?)

Go-to-Market Strategy

Distribution Channel: Agent Referral Network (Slide 11)

Three-Part Referral Loop:

  1. Agent Recruitment (Viral Growth)
    • 20 net new agents/teams join per week
    • Agents refer other agents
    • Creates network effects and reduces CAC
  2. Customer Acquisition (Agent Referrals)
    • 180 active agents refer on average 7 clients each
    • ~1,260 monthly referrals from agent network
    • Leverages existing real estate advisor relationships
  3. Proof of Concept (Traction)
    • 300 referrals prequalified and vetted
    • Validates agent referral model works
    • Demonstrates demand from agent ecosystem

GTM Advantages

  • Aligned incentives: Agents earn commissions for successful referrals
  • Existing relationships: Agents already advise customers on housing
  • Scalable: Agent network can grow exponentially (20/week recruitment)
  • Low friction: Customers trust agent recommendations
  • Repeatable: Model works across all 10 target markets

GTM Risks

  • Agent churn: Agents may shift focus to higher-commission products
  • Competitive poaching: Competitors could recruit same agents
  • Commission pressure: Agents may demand higher commissions as volume grows
  • Market saturation: Limited number of agents in each market
  • Regulatory risk: Agent compensation structures may face scrutiny

Customer Acquisition Economics

Not disclosed in deck:

  • Cost per referral
  • Conversion rate (referral → closed home)
  • Customer acquisition cost (CAC)
  • CAC payback period
  • Lifetime value (LTV) / LTV:CAC ratio

The Ask

Funding Request

Series A: $10.5M

Use of Funds

Not explicitly detailed in deck, but implied allocation based on slides:

  1. Technology development (Slide 5): Pricing, underwriting, operations platforms
  2. Agent recruitment & support (Slide 11): Scaling agent network (20/week growth)
  3. Market expansion (Slide 7): Entering additional markets beyond initial 10
  4. Working capital (Slide 8): Financing homes until capital facility established
  5. Team expansion: Hiring for operations, underwriting, customer service

Capital Strategy Post-Series A

Stage 1 (Validate): $XM term loan from HNW individuals

  • Validates unit economics and model
  • Funds initial home purchases

Stage 2 (Growth): $XM credit facility from bank partner

  • Scales home purchases across 10 markets
  • Reduces reliance on equity capital

Stage 3 (Scale): Off-balance-sheet securitization

  • Converts home equity positions into securities
  • Enables unlimited scaling without balance sheet constraints
  • Generates origination fees (X%) and servicing fees (Y%)

Investor Deep Dive

Executive summary, strengths & red flags

Executive Summary

Divvy's Series A pitch presents a compelling rent-to-own platform that democratizes homeownership for credit-worthy but capital-constrained households through a fractional ownership model. The deck effectively combines a large addressable market (6 million households), proven early traction (exponential growth from Nov 2017-Apr 2018), and a sophisticated capital markets strategy to scale. The pitch resonated with investors by positioning Divvy as a new asset class—bridging traditional rental and ownership markets—with aligned incentives between the company and customers, ultimately validating the model's viability and leading to a $2.5B acquisition within three years.

Key Strengths

7 identified

1

Quantified, Specific Problem

- "6 million credit-worthy households" is concrete and measurable

2

Exponential Growth Trajectory

- 2-3x month-over-month growth (Jan-Apr 2018) validates product-market fit

3

Aligned Incentive Model

- Shared equity between Divvy and tenant reduces moral hazard

4

Sophisticated Capital Markets Strategy

- 3-stage financing approach (HNW → Banks → Securitization) shows deep understanding

5

Complementary, Credible Team

- CEO with Square Capital + TPG background, CPO with Zillow + real estate experience

6

Scalable Distribution Channel

- Agent referral network with viral growth (20 agents/week recruitment)

7

Clear Visual Communication

- Minimalist design, clear diagrams (house equity split, waterfall, circular flow)

Red Flags & Weaknesses

10 identified

1

Redacted Financial Metrics

- Unit economics ($XK, Y% margins), financing amounts ($XM), and key metrics (X%, Y%) are heavily redacted

2

Limited Traction Data

- Only 6 months of growth data (Nov 2017-Apr 2018)

3

Vague Default Rate & Risk Metrics

- No mention of default rates, delinquency rates, or loss rates

4

No Competitive Analysis

- Deck does not mention competitors or competitive landscape

5

Regulatory Risk Not Addressed

- No mention of legal, regulatory, or compliance challenges

6

Customer Acquisition Cost Not Disclosed

- No CAC, LTV, or unit economics for customer acquisition

7

Market Selection Criteria Unclear

- 10 target markets selected, but criteria not explained

8

Tenant Buyout Mechanics Vague

- How does tenant buy out Divvy's equity? What are the terms?

9

No Churn or Retention Metrics

- No mention of customer retention, churn, or lifetime value

10

Mission Target (100K Families) Lacks Timeline

- "Helping 100,000 families" is stated without timeline or feasibility analysis

More Pitch Decks To Study

Compare structure, fundraising context, and investor-facing story across similar startup decks.