Compare your deck to ComplyAdvantage

Compare Your Deck

ComplyAdvantage Pitch Deck (2015)

Fintech
Stage: Series A
Raised: $631K
Year: 2015
Slides: 16
Outcome: Valued at $1.4B+ after Series C (2022)

Pitch Deck

1 / 16
ComplyAdvantage pitch deck - The Opening: Clear branding and simple framing
Click to expand

Deck Analysis

This Series A pitch deck from ComplyAdvantage (2015) presents a focused, product-led story for a fintech solving AML/financial-crime detection using real-time data and API-first integrations. The deck is notable for combining crisp positioning (single API call to surface risk), technical diagrams that show integration/architecture, clear problem quantification, and concrete customer outcomes — a structure that helped the company scale to a large enterprise valuation by demonstrating product-market fit and operational impact.

The Opening: Clear branding and simple framing

The Opening: Clear branding and simple framing

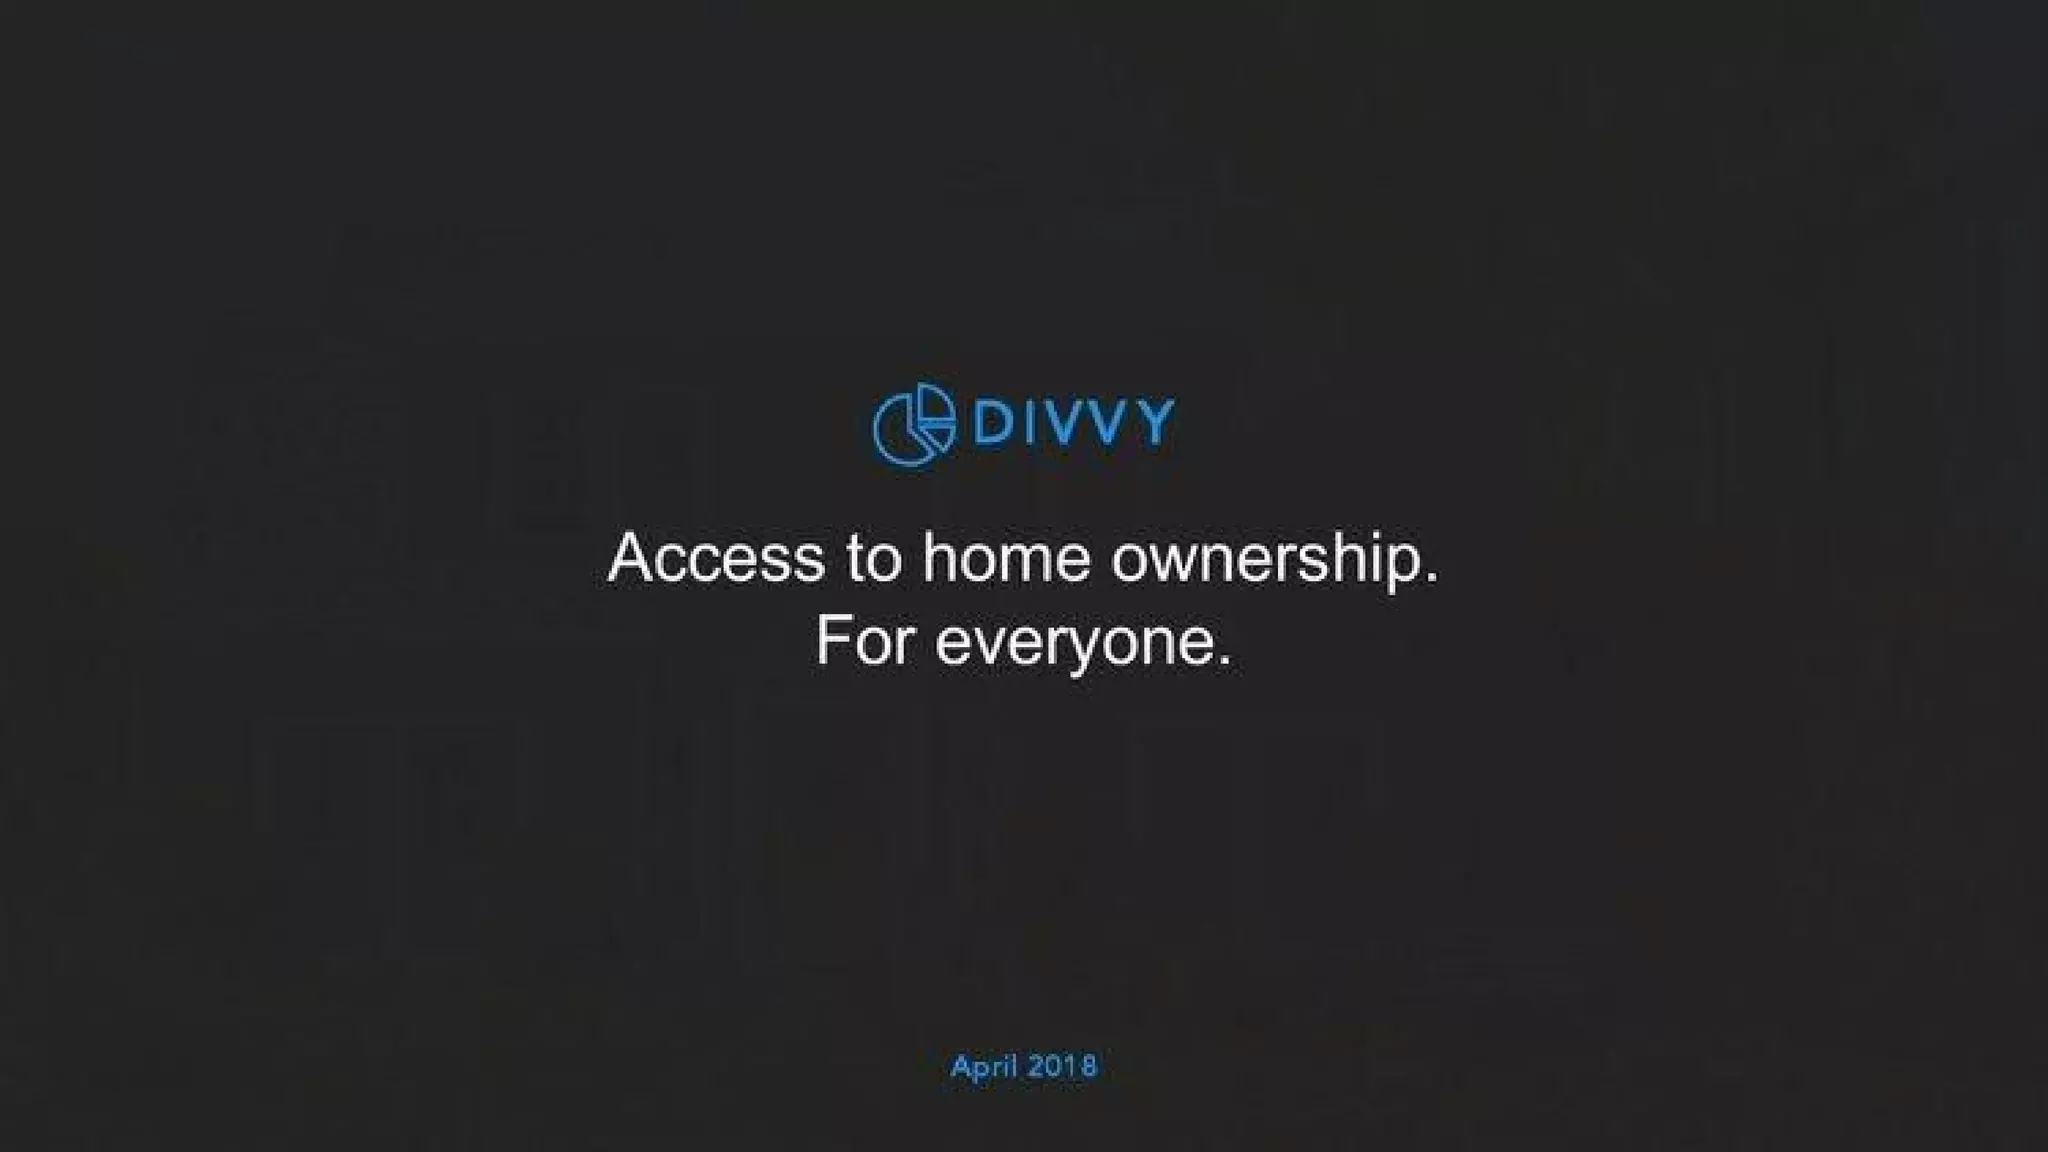
The first slide (Company Overview) is minimal and highly branded. It uses strong, consistent visual identity and gives the viewer a single mental anchor — the company name and domain — while keeping the audience focused on the presenter rather than overwhelming them with text. The slide sets the tone: enterprise, trustworthy, and professional.
Founders can learn from this restraint. An opening slide should not bury the audience in detail; it should create context, reinforce credibility, and make the deck easy to follow. The visual rhythm and brand consistency across slides that follow start from this clean opening.

Key Takeaway: Start with a clean, branded cover that sets tone and directs attention to the narrative rather than the visuals.
Data credibility: 'Real-Time Risk Data' breakdown

Data credibility: 'Real-Time Risk Data' breakdown

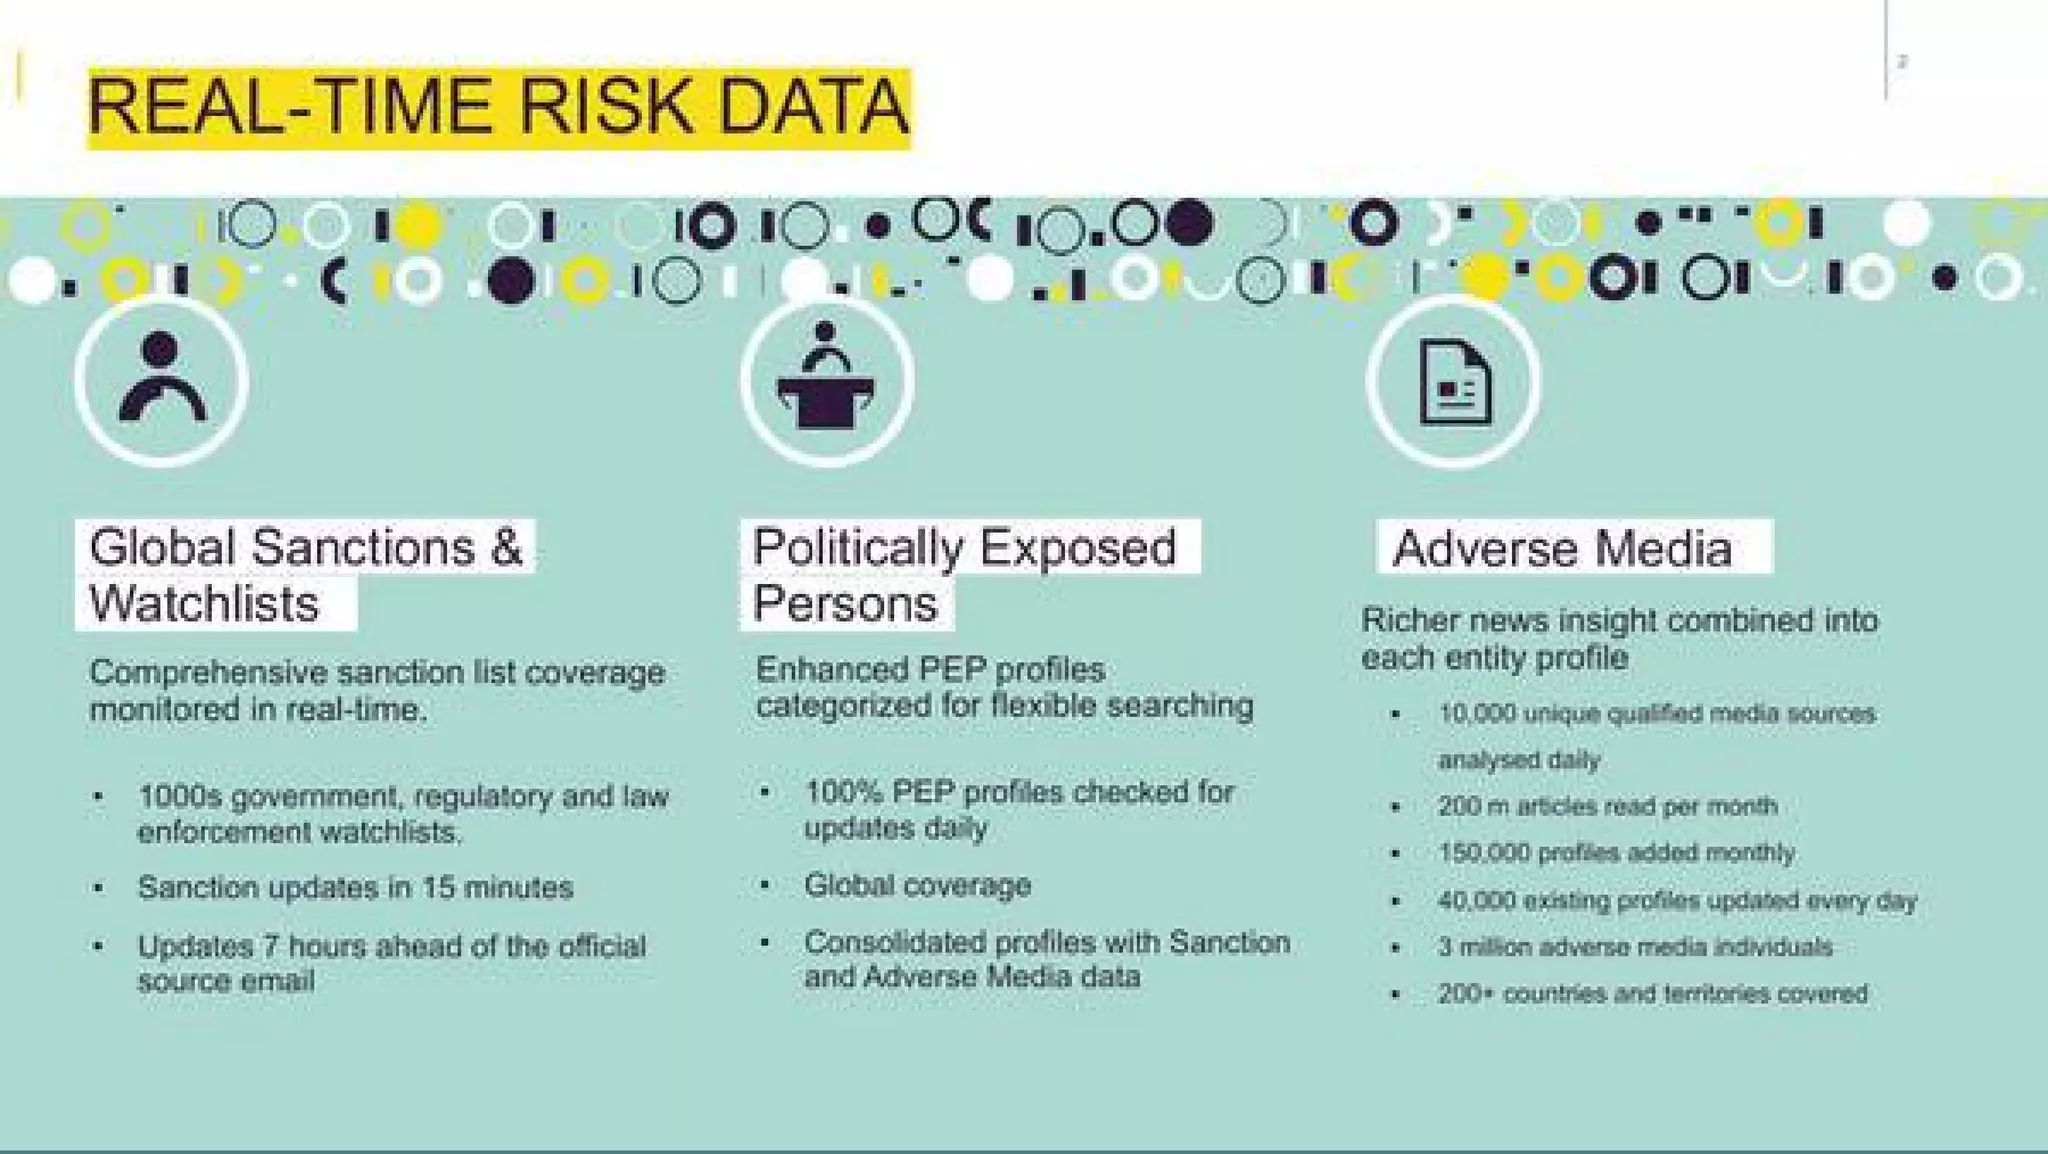
Slide 2 lays out the core data pillars: Global Sanctions & Watchlists, Politically Exposed Persons (PEPs), and Adverse Media. Presenting data sources and coverage up-front signals credibility to compliance and enterprise buyers who care deeply about provenance and timeliness. Each column includes crisp bullets (updates in minutes, 100% PEP checks, number of media sources) which demonstrates operational granularity without long paragraphs.
This is an instructive example of building trust through specificity. Founders selling data-driven products should surface the key attributes buyers care about (coverage, freshness, scale, provenance) and quantify them. It transforms vague claims into verifiable competitive advantages and reduces buyer skepticism.

Key Takeaway: Explicitly list and quantify your data sources and update cadence to build credibility with data-sensitive buyers.
Product architecture: show how the product plugs into customer systems

Product architecture: show how the product plugs into customer systems

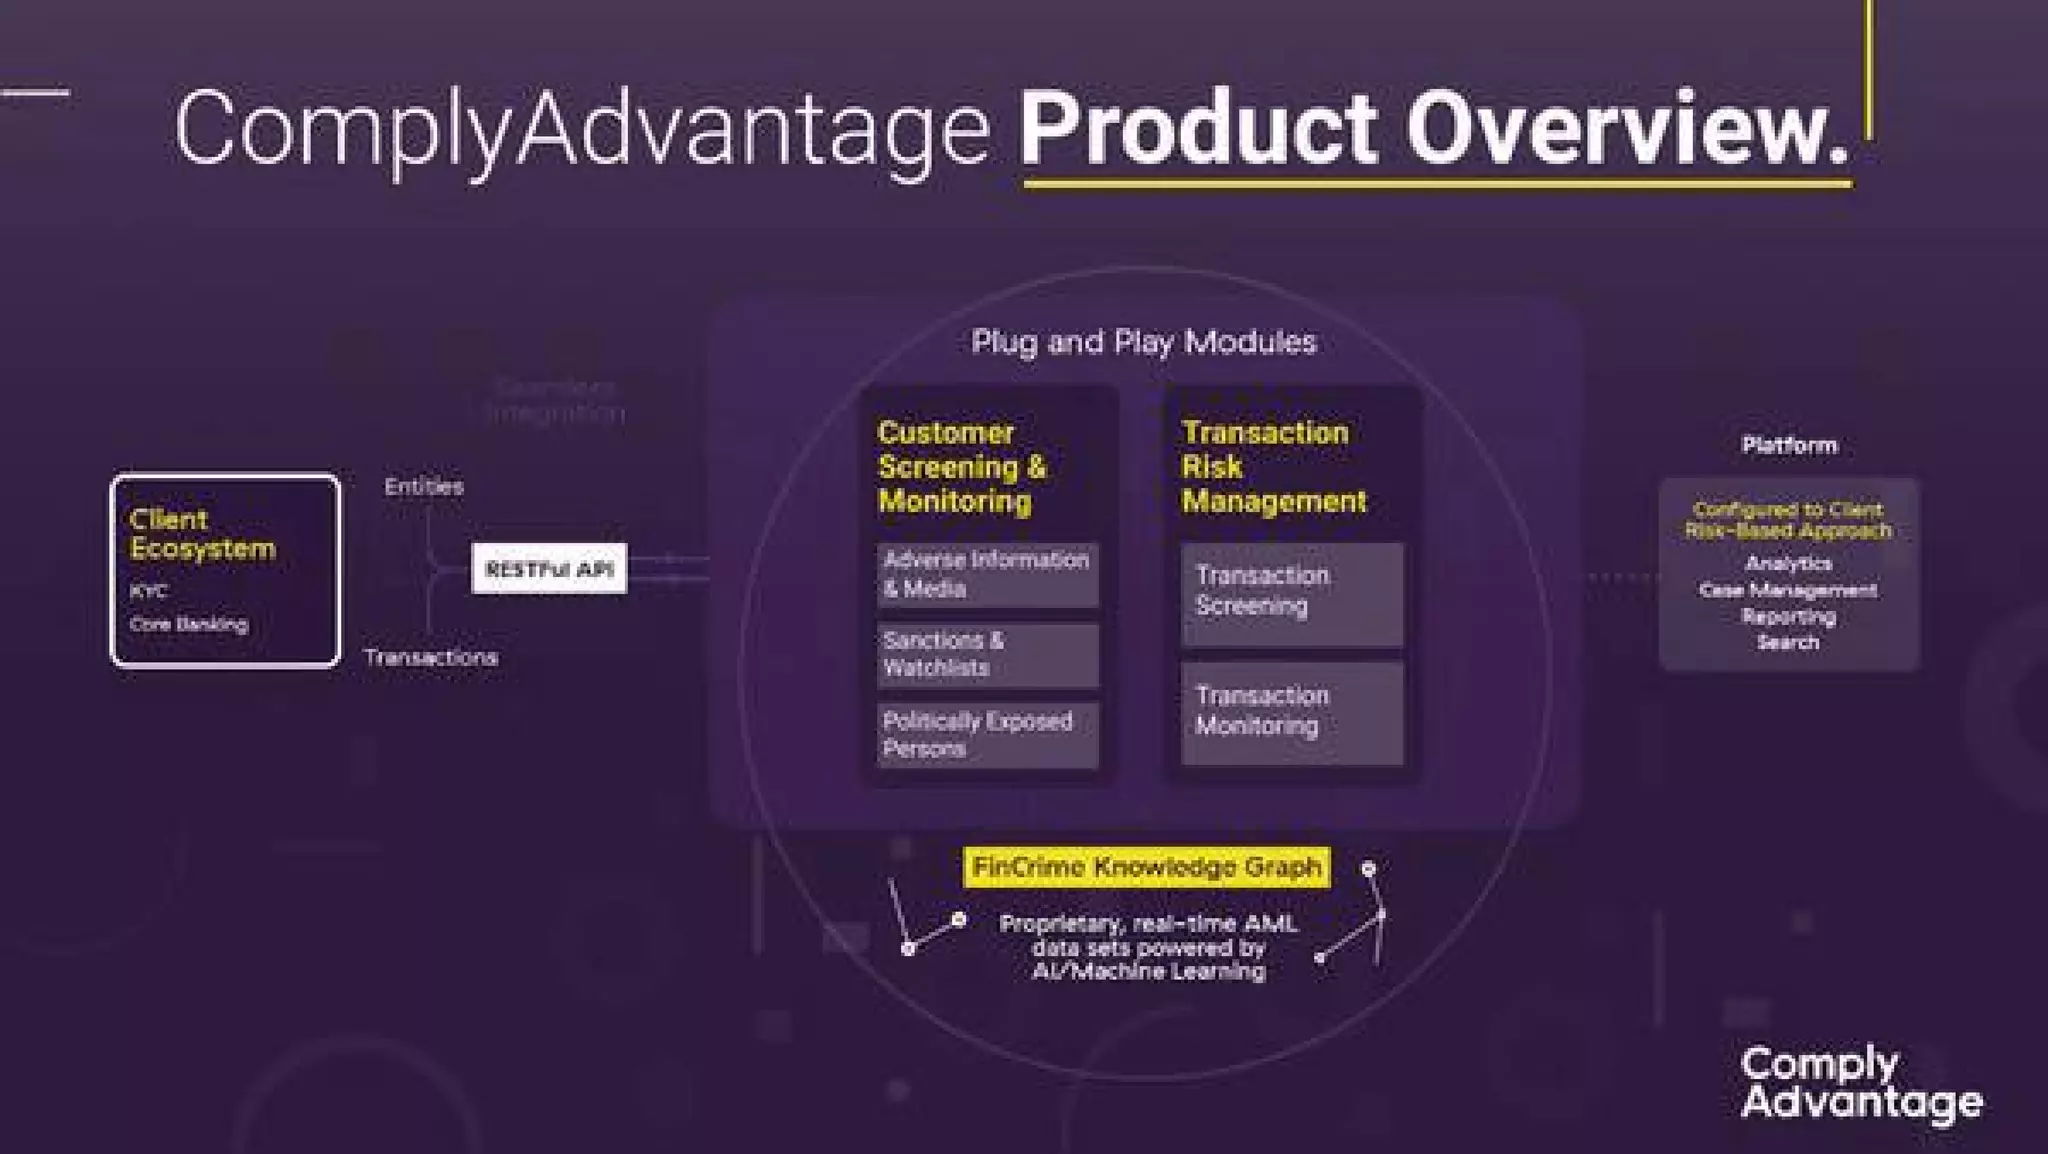
Slide 3 is a product overview diagram that maps client ecosystem -> RESTful API -> plug-and-play modules -> platform. It highlights modularity (screening, monitoring, transaction risk) and calls out the FinCrime Knowledge Graph as a proprietary core. The diagram balances technical detail and accessibility: non-technical stakeholders can see where the product sits, while technical buyers see integration points and extensibility.
Founders should emulate this approach by showing integration touchpoints, modular components, and where their proprietary moat lives in the stack. Diagrams that clarify how customers actually use and extend the product reduce integration objections and speed up procurement conversations.

Key Takeaway: Use a simple architecture diagram to show integration points, modularity, and the proprietary element that creates a moat.
Single-sentence value proposition: emphasize the core customer benefit

Single-sentence value proposition: emphasize the core customer benefit

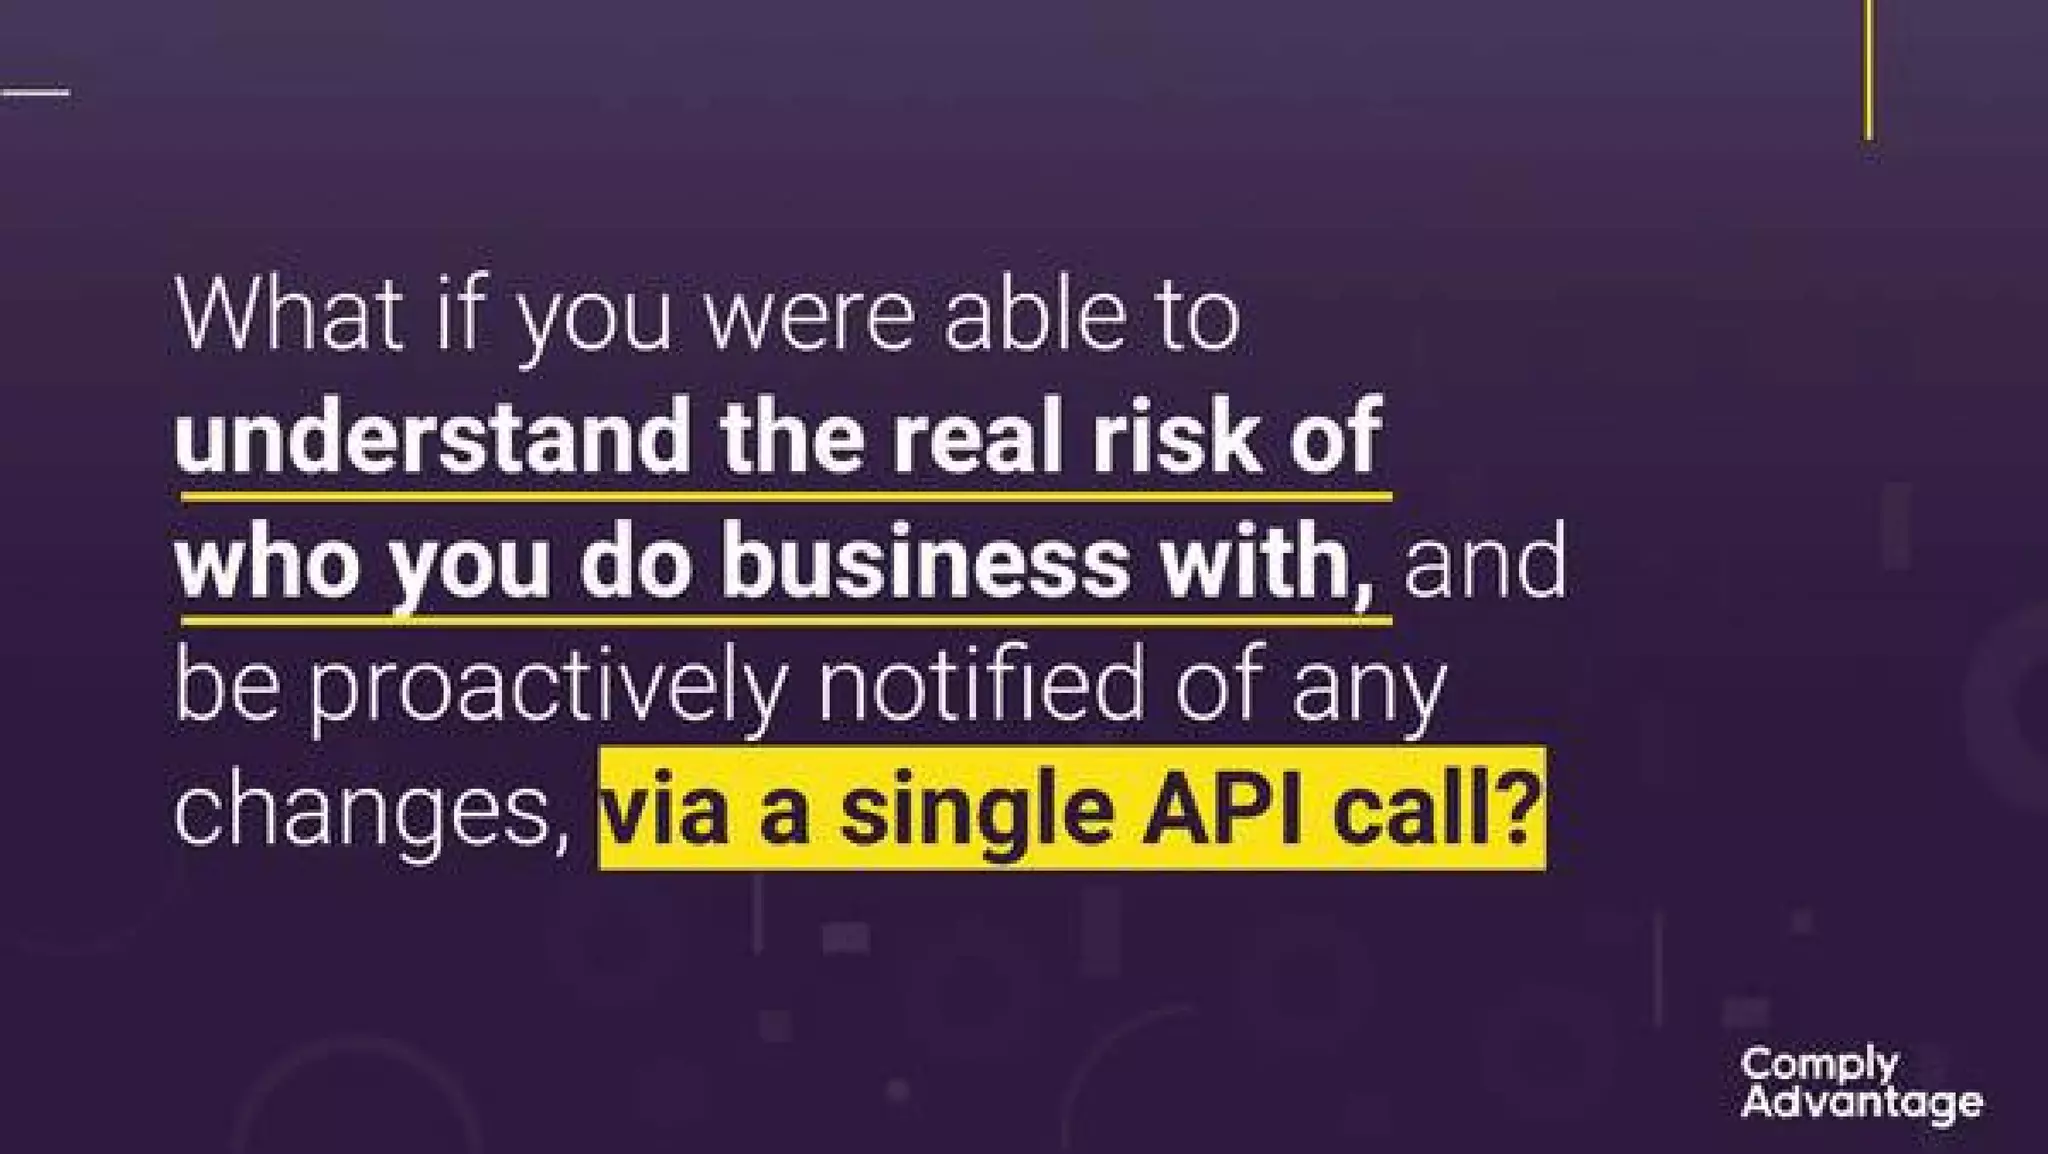
Slide 4 asks a direct question: what if you could understand real risk and be proactively notified via a single API call? That copy crystallizes the product’s unique selling proposition in one short, memorable line and frames the rest of the deck. It moves beyond features to articulate the buyer benefit — immediate, automated risk insight — which is essential for executive-level attention.
Founders should practice distilling their product into a single, concrete customer outcome early in the deck. This becomes the narrative spine: every subsequent slide either proves the claim, shows how it works, or demonstrates impact with metrics or customers.

Key Takeaway: Lead with a single, benefit-focused line that encapsulates the product’s primary customer outcome.
Market pain and urgency: quantify the problem

Market pain and urgency: quantify the problem

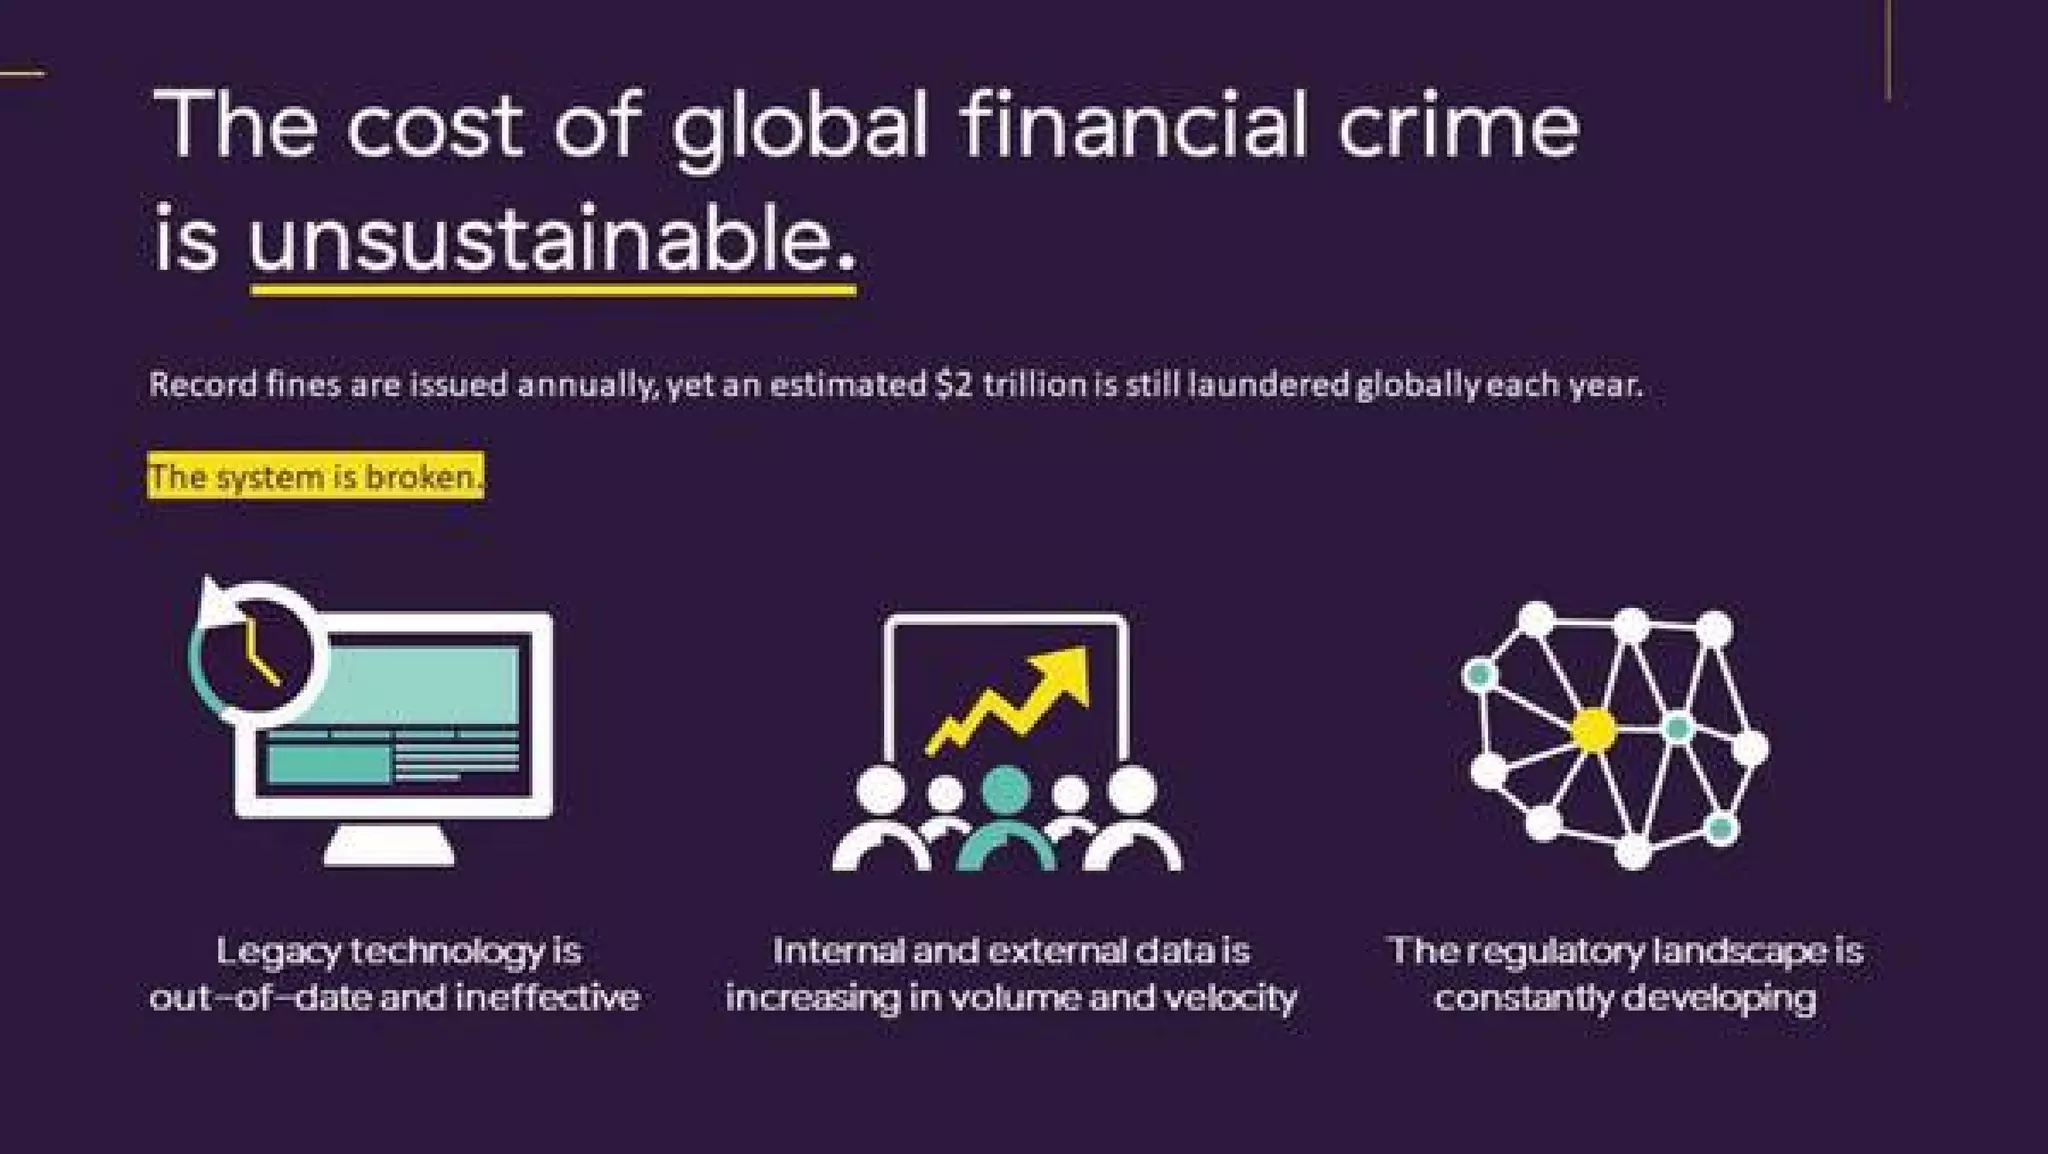
Slide 5 frames the market problem: global financial crime is unsustainable, fines are rising, and legacy tech is ineffective. The slide uses a strong headline and three supporting pain points (legacy tech, exploding data volumes, evolving regulations) paired with icons to make the case visually. By describing systemic failure and scale, the slide creates urgency and legitimizes investment in new solutions.
Founders should mirror this technique: quantify the pain (dollars, time, inefficiency), list clear root causes, and use visuals to make the problem feel immediate. A compelling problem statement motivates investor interest and primes them to accept the solution and go-to-market plan.

Key Takeaway: Quantify the pain and root causes early to create urgency and justify the solution you’re selling.
Operational workflow: map product to customer processes

Operational workflow: map product to customer processes

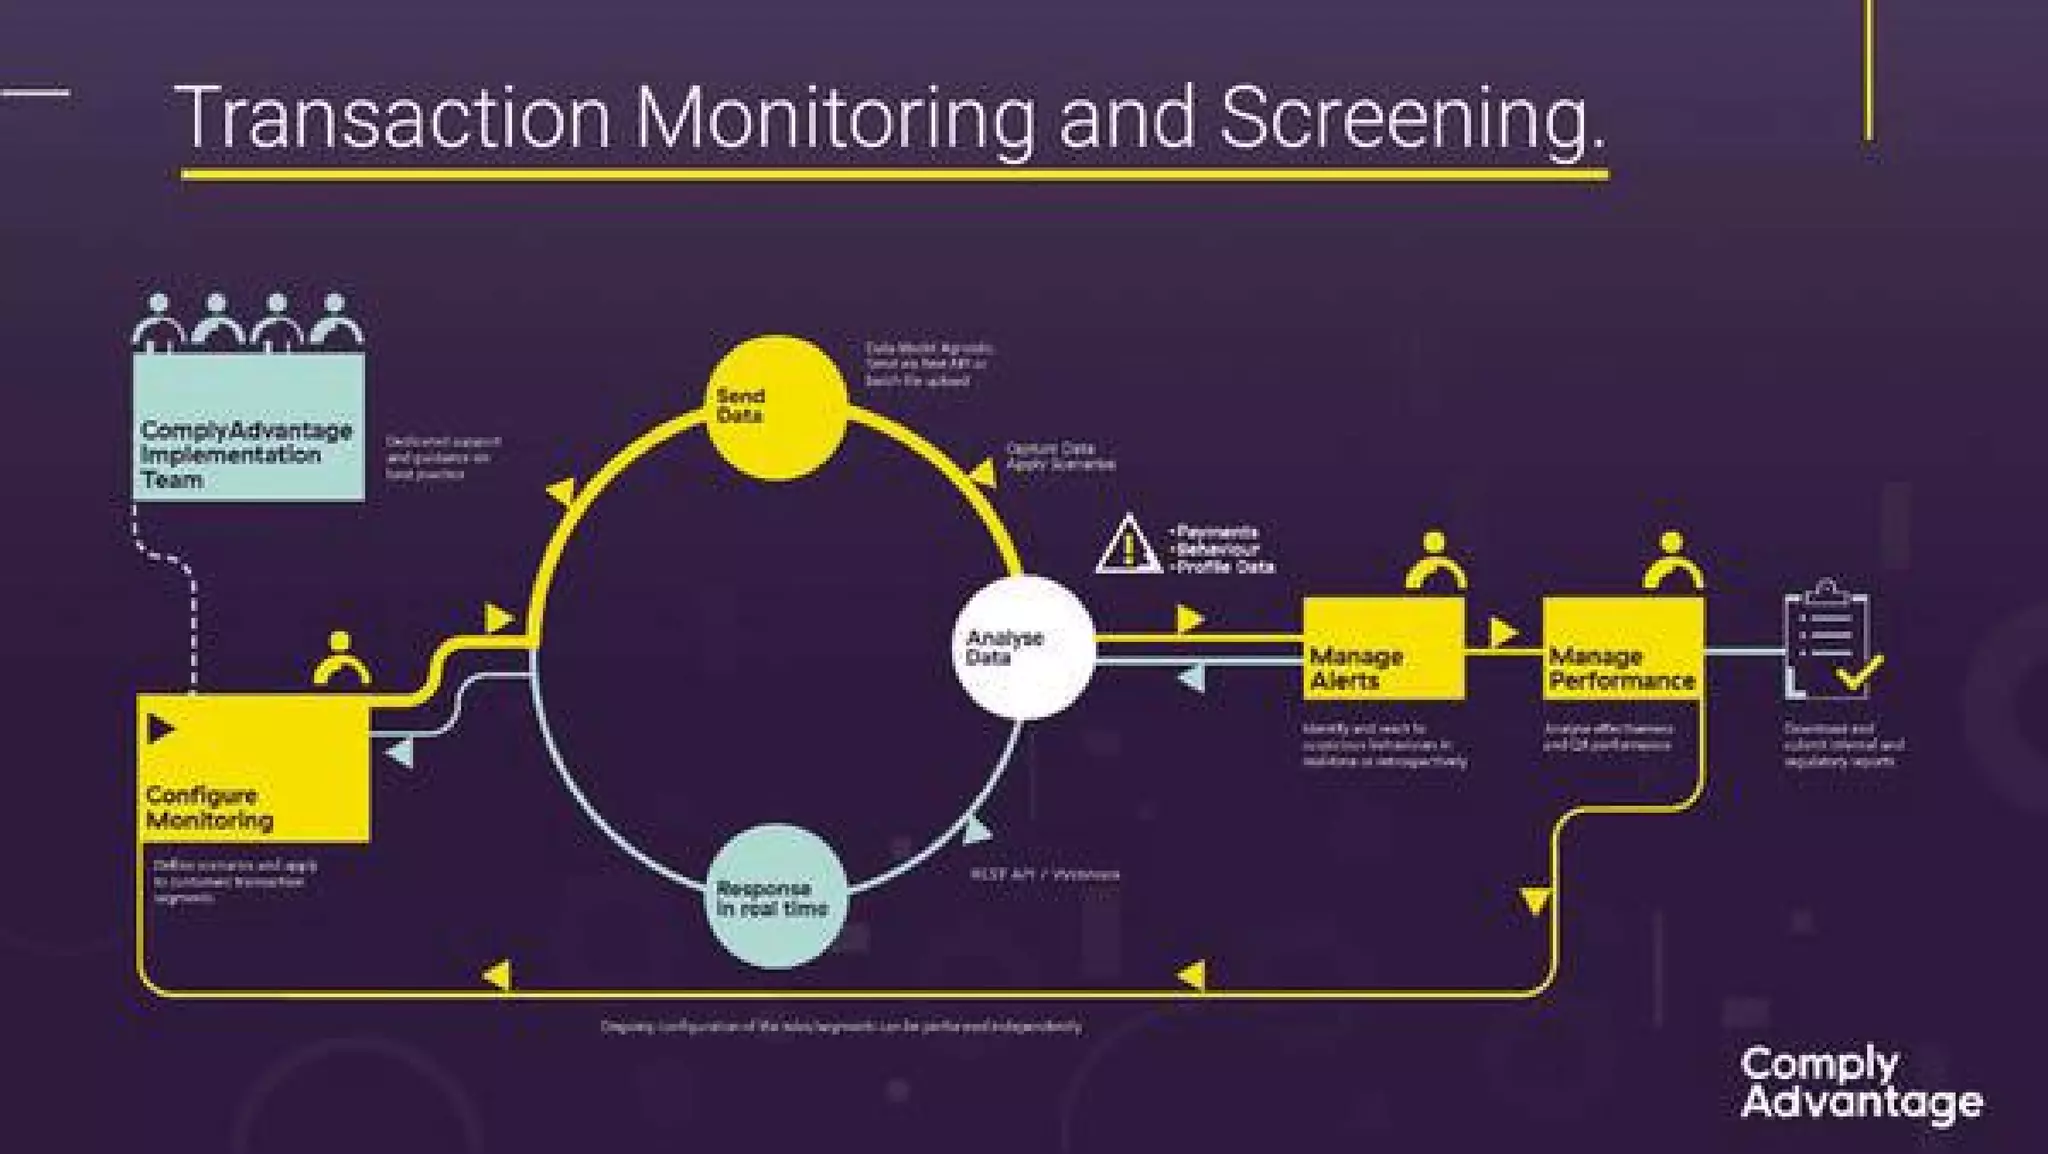
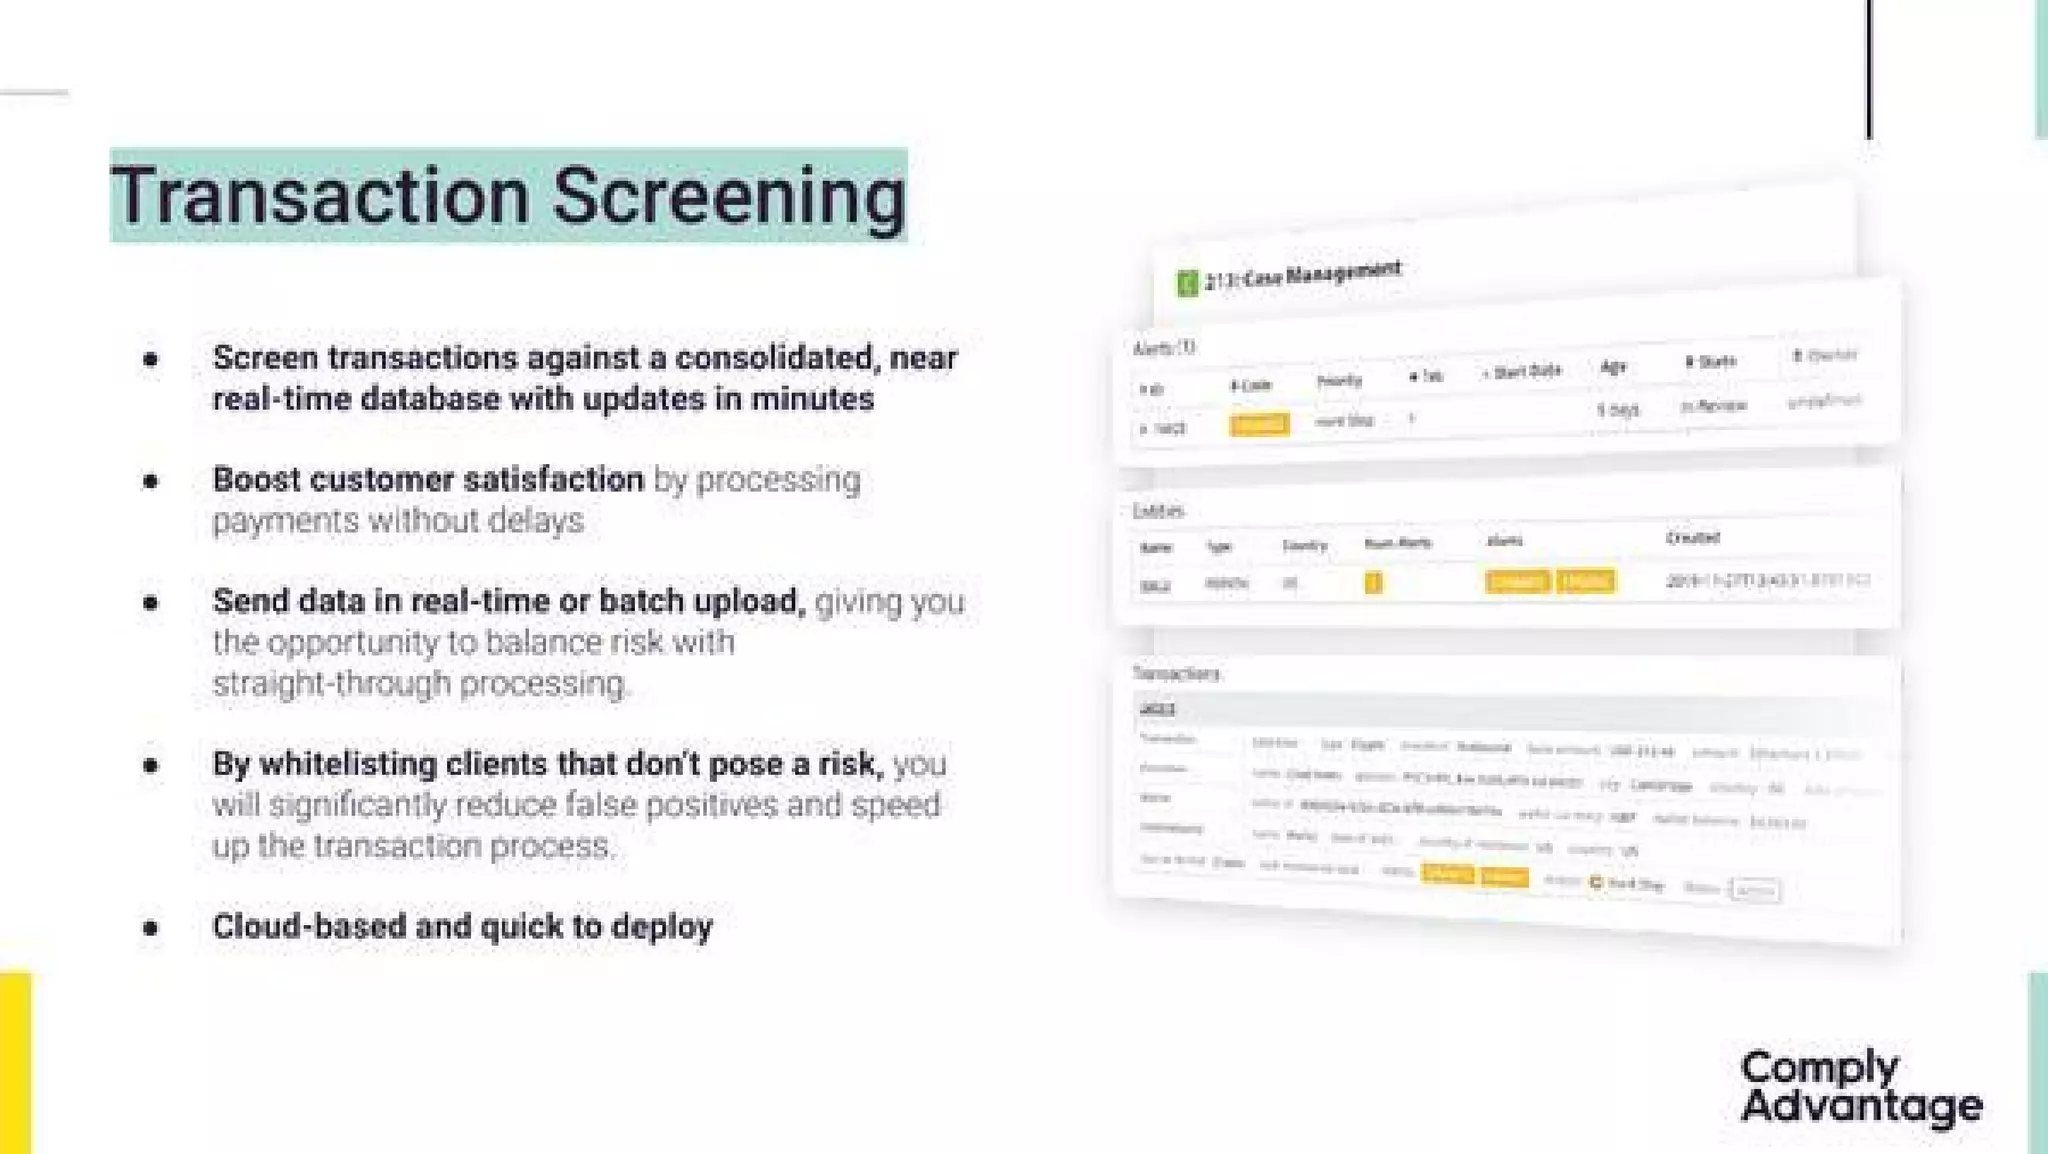
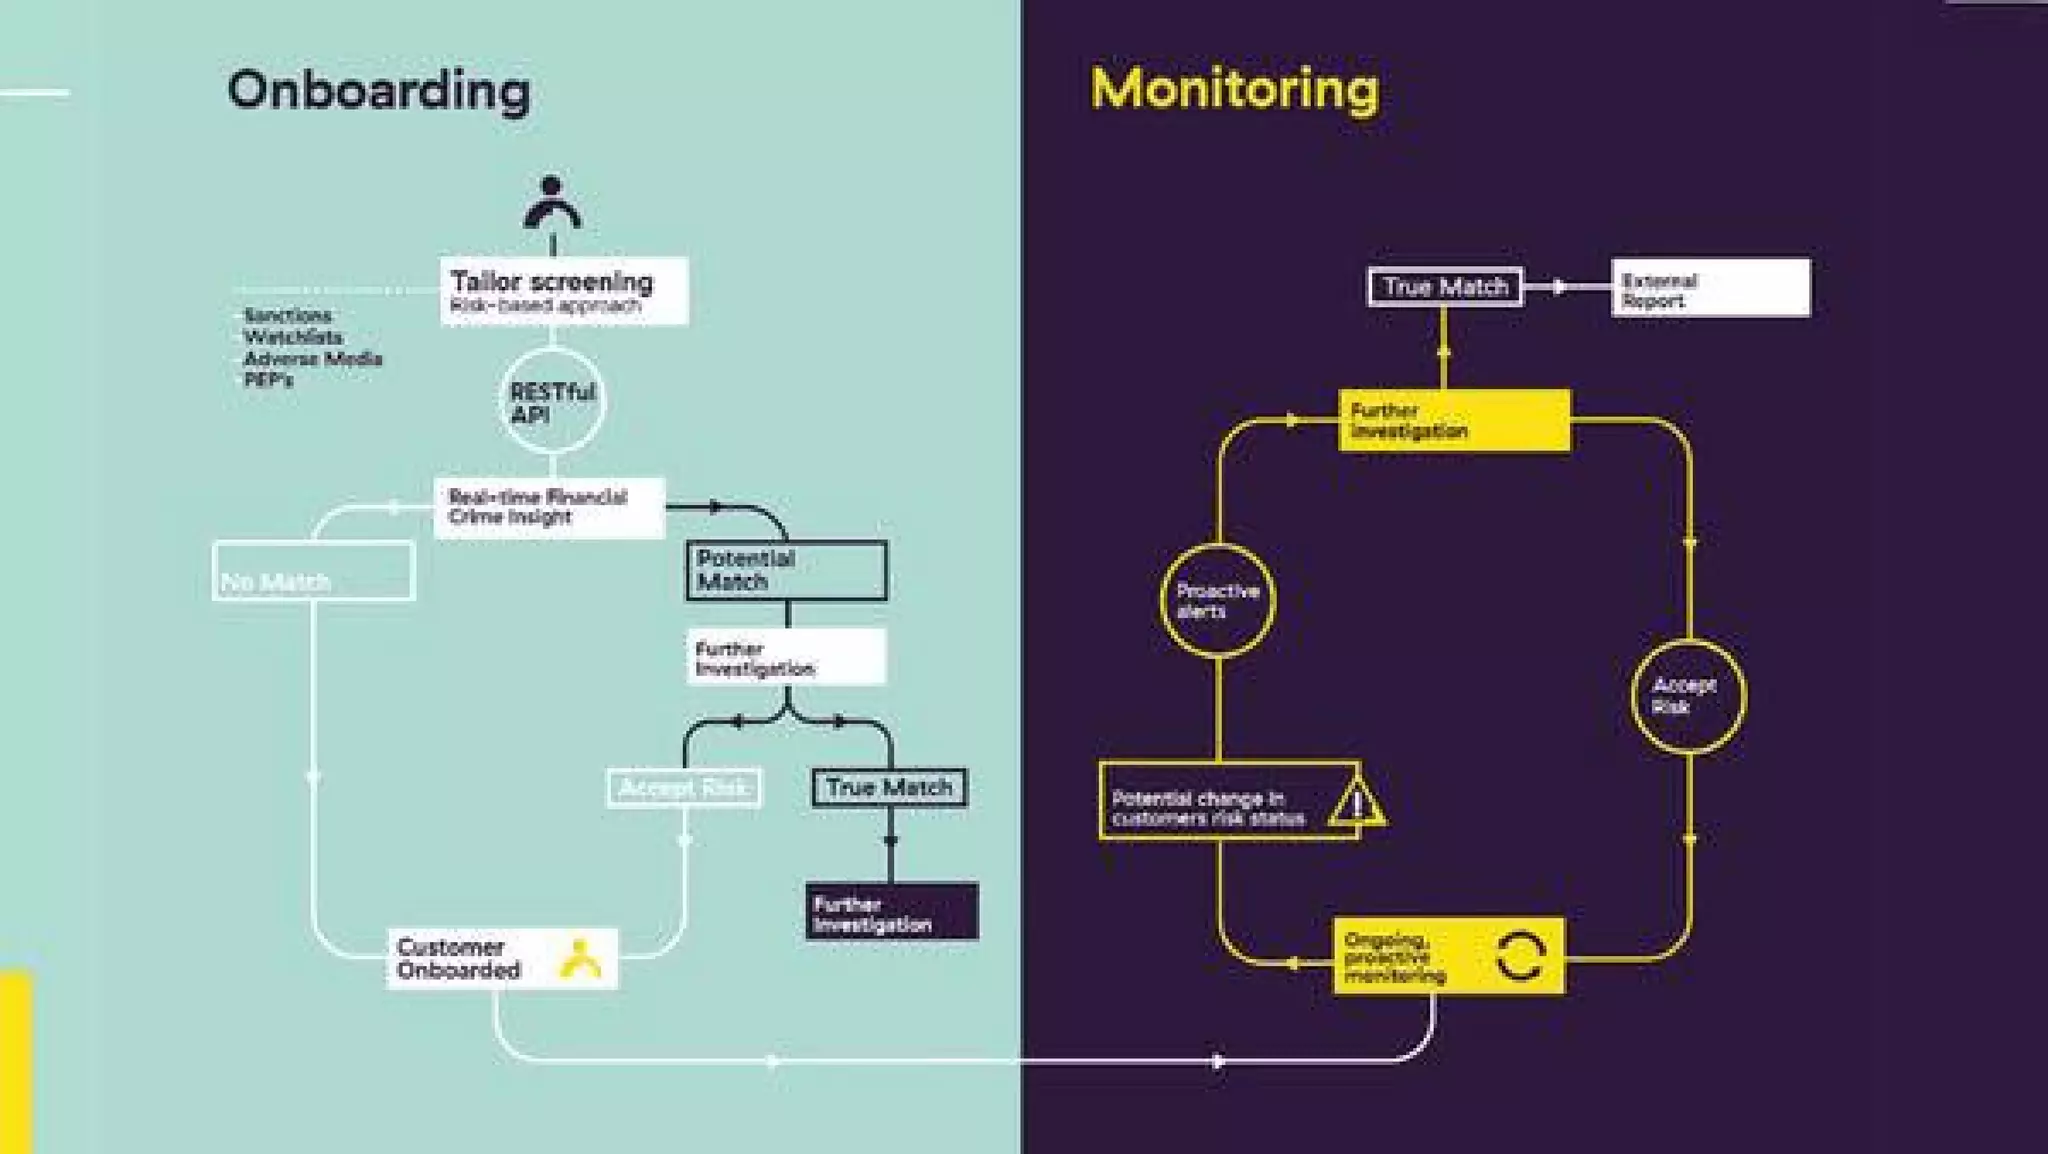
Slide 7 presents a transaction monitoring and screening workflow showing configuration, data ingestion, analysis, alerts, and case management. It translates product capabilities into operational steps a compliance team would recognize. This helps buyers visualize where the product reduces workload, shortens cycle time, and plugs into existing processes — critical for compliance workflows that cannot be disruptive.
For founders, mapping your product to the buyer’s exact operational flow is a high-leverage move: it reduces perceived implementation risk and makes ROI easier to calculate. Use clear arrows, role labels, and outcome boxes to show how your product changes day-to-day work.

Key Takeaway: Show a real workflow that maps your product into the customer's operations to reduce implementation anxiety and illustrate ROI.
Feature clarity and metrics: show benefits with concrete numbers

Feature clarity and metrics: show benefits with concrete numbers

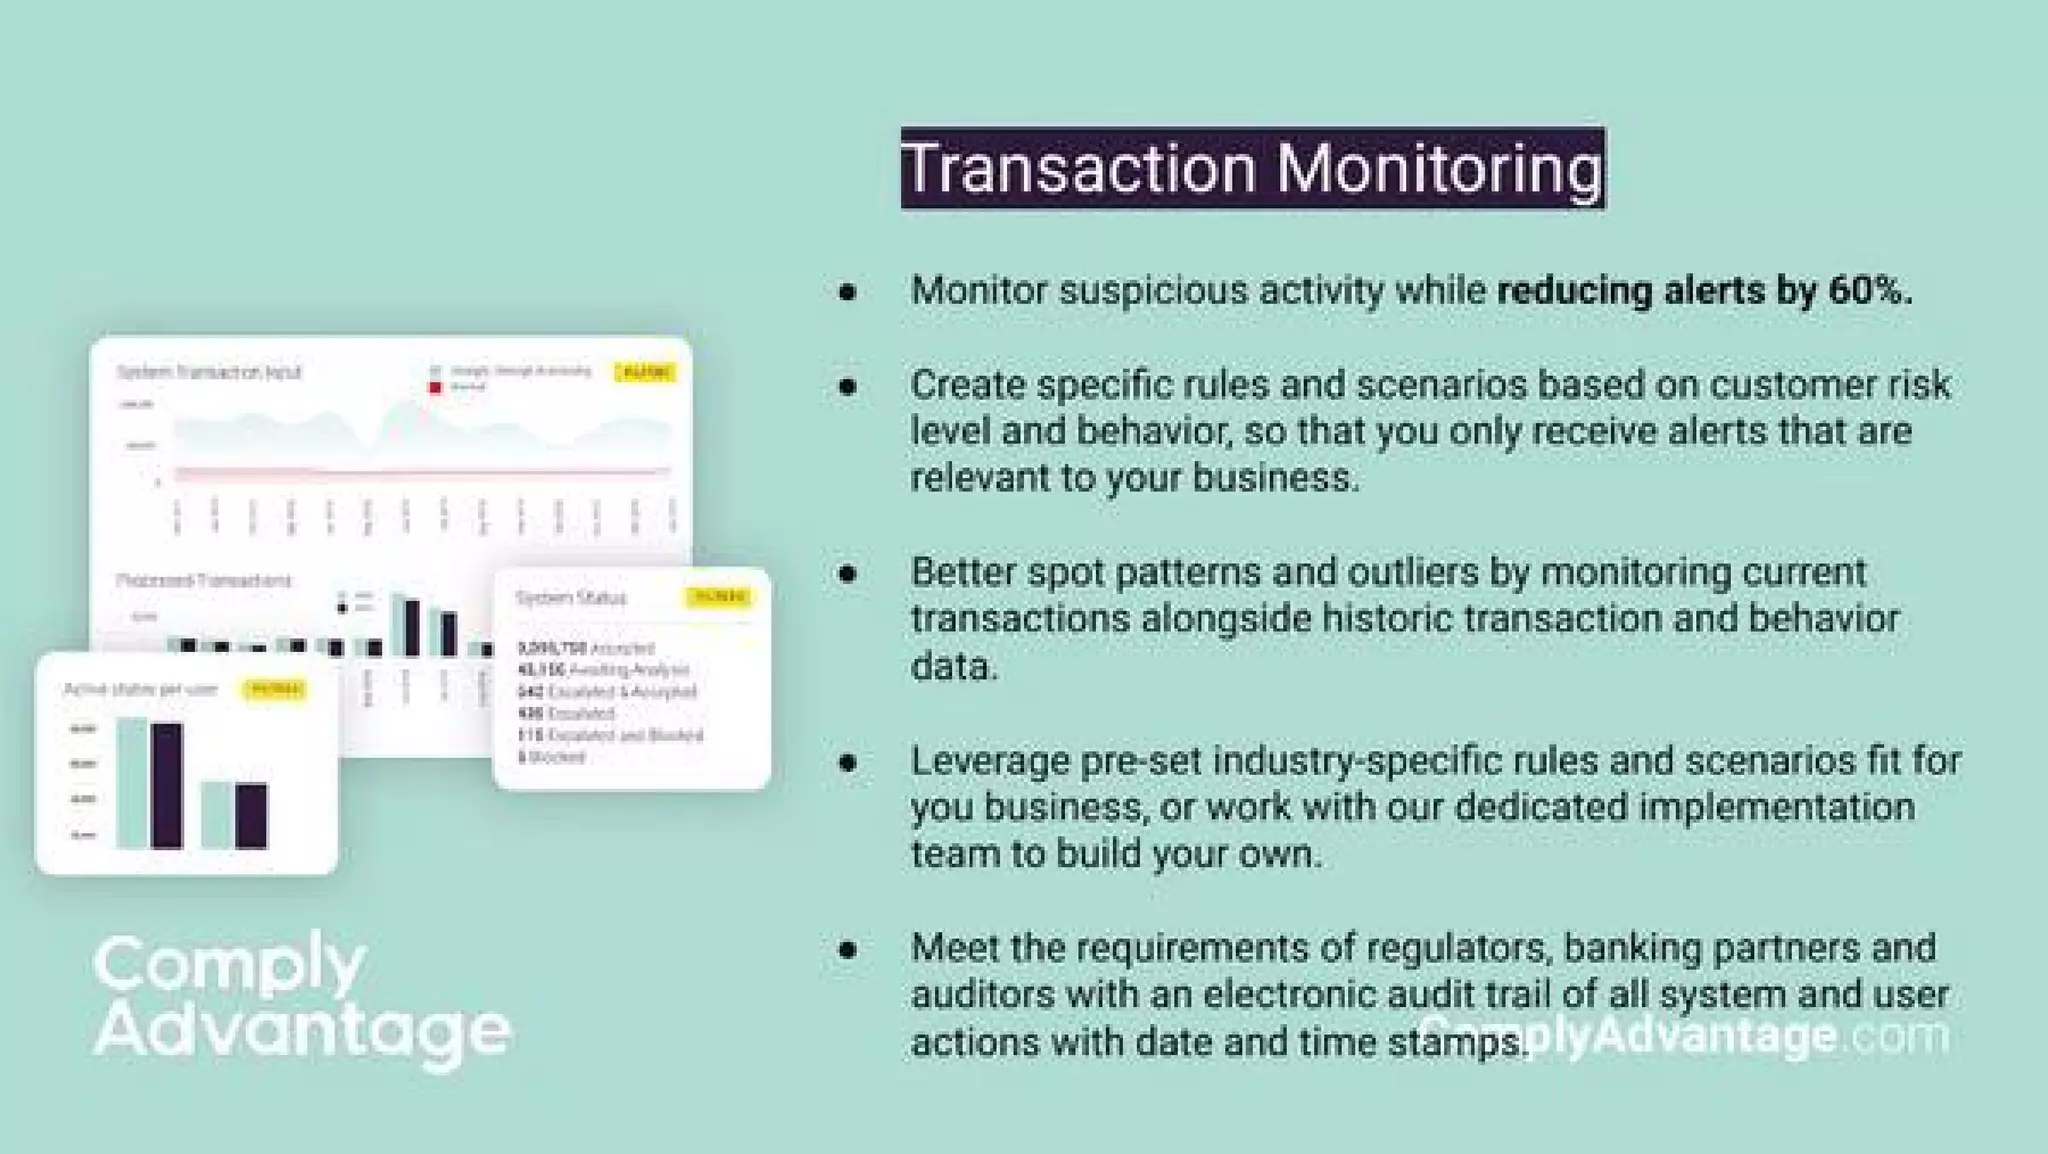
Slide 9 (Transaction Monitoring) lists benefits and includes a headline metric: monitor suspicious activity while reducing alerts by 60%. The bullets cover rule specificity, pattern detection, industry presets, and audit trails — all compliance-buying triggers. Combining qualitative features with a strong quantitative outcome demonstrates both functionality and business impact.
Founders should quantify impact where possible (reduced alerts, faster onboarding, cost savings) and pair those metrics with a short explanation of how they’re achieved. Numbers make claims believable and provide a benchmark for later case studies and sales conversations.

Key Takeaway: Pair feature-level descriptions with at least one credible metric to demonstrate real-world impact.
Customer proof: a concise, quantified case study

Customer proof: a concise, quantified case study

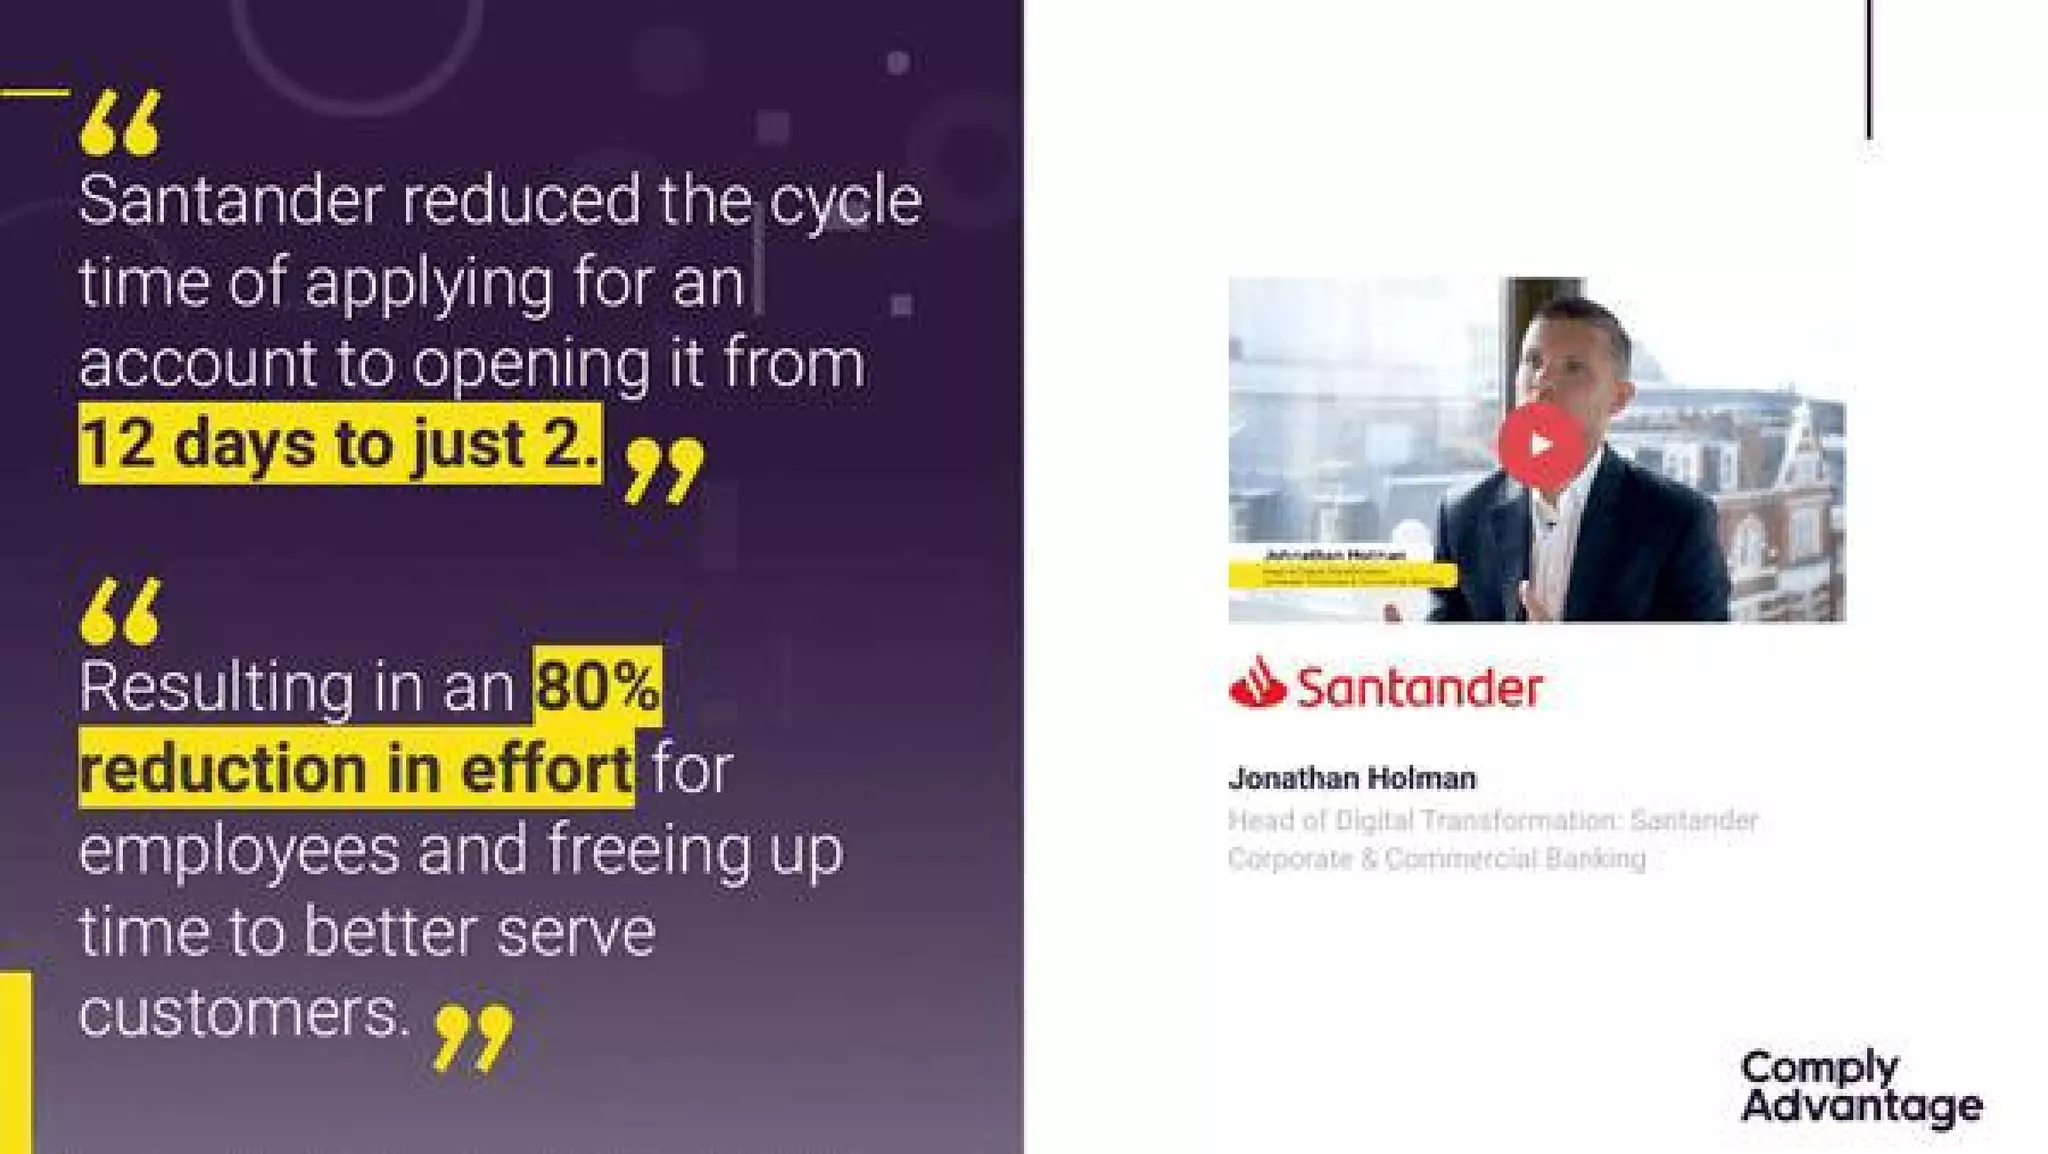
Slide 15 presents a powerful customer outcome: Santander reduced account opening cycle time from 12 days to 2 and achieved an 80% reduction in effort. The slide pairs the statistic with the client logo and a short testimonial-style layout. This combination of a reputable customer and hard metrics provides social proof that moves prospects and investors from theoretical value to proven results.
Startups should include at least one tightly-focused case study with brand logos and two or three quantified outcomes. The story should be short, verifiable, and tied to the exact product features that delivered the result — that makes it persuasive in sales and investor conversations.

Key Takeaway: Use a short, logo-backed case study with concrete, verifiable metrics to convert skeptics into believers.

Conclusion: Key Lessons

ComplyAdvantage’s Series A deck is a strong example of product-first storytelling for a complex, regulated market. Strengths include a tight opening proposition, early proof of data quality, a clear architecture that highlights the proprietary moat, mapped customer workflows, and quantified customer outcomes. The deck balances technical detail (API, knowledge graph) with commercial proof (metrics, case studies) — a combination that explains product value to both technical and business stakeholders.
Actionable advice for founders: distill your core benefit into one line early; prove data and technical claims with quantified, sourceable details; illustrate how your product fits into customers’ operational workflows; and include at least one high-impact, logo-backed case study with concrete metrics. Doing these things reduces buyer friction, accelerates sales conversations, and makes fundraising narratives much more compelling.

Full Deck Analysis

11 sections

Overview

Company: ComplyAdvantage
Round: Series A ($631K)
Year: 2015
Outcome: Valued at $1.4B+ after Series C (2022)


Executive Summary

ComplyAdvantage’s Series A deck (2015) presents an API-first, cloud-native AML screening and transaction-monitoring product built on proprietary data and ML-powered knowledge graphs to deliver real‑time risk signals. The deck is notable for clear product flows, strong operational datapoints about coverage and update velocity (media sources, sanctions, profiles), and early, quantifiable client impact metrics (large banks / fintech customers).


Problem Statement

How the deck articulates the problem:

  • The deck frames the systemic failure of legacy AML/compliance systems: out‑of‑date technology, exploding data volume/velocity, and constantly changing regulatory requirements (Slide 5: “The cost of global financial crime is unsustainable” and three problem icons describing legacy tech, data growth and evolving regulation).
  • It quantifies scale of the challenge with industry-level context: “an estimated $2 trillion is still laundered globally each year” (Slide 5).
  • It emphasizes operational pain: slow onboarding, high false-positive volumes, and ineffective monitoring that create regulatory, cost and operational exposure (Slide 6 testimonial bullets and later slides showing alert/false-positive reduction targets).

Referenced slides: 4 (value proposition question), 5 (scale & core pain), 6 (customer impact quotes).


Solution

How the deck positions the solution:

  • A modular, API-first AML platform offering Customer Screening & Monitoring, and Transaction Risk Management as plug‑and‑play modules (Slide 3).
  • Core technical differentiators: a proprietary “FinCrime Knowledge Graph” powered by AI/ML, real-time data pipelines (sanctions, PEPs, adverse media) and RESTful API + webhooks for two‑way integrations (Slides 3, 8, 12).
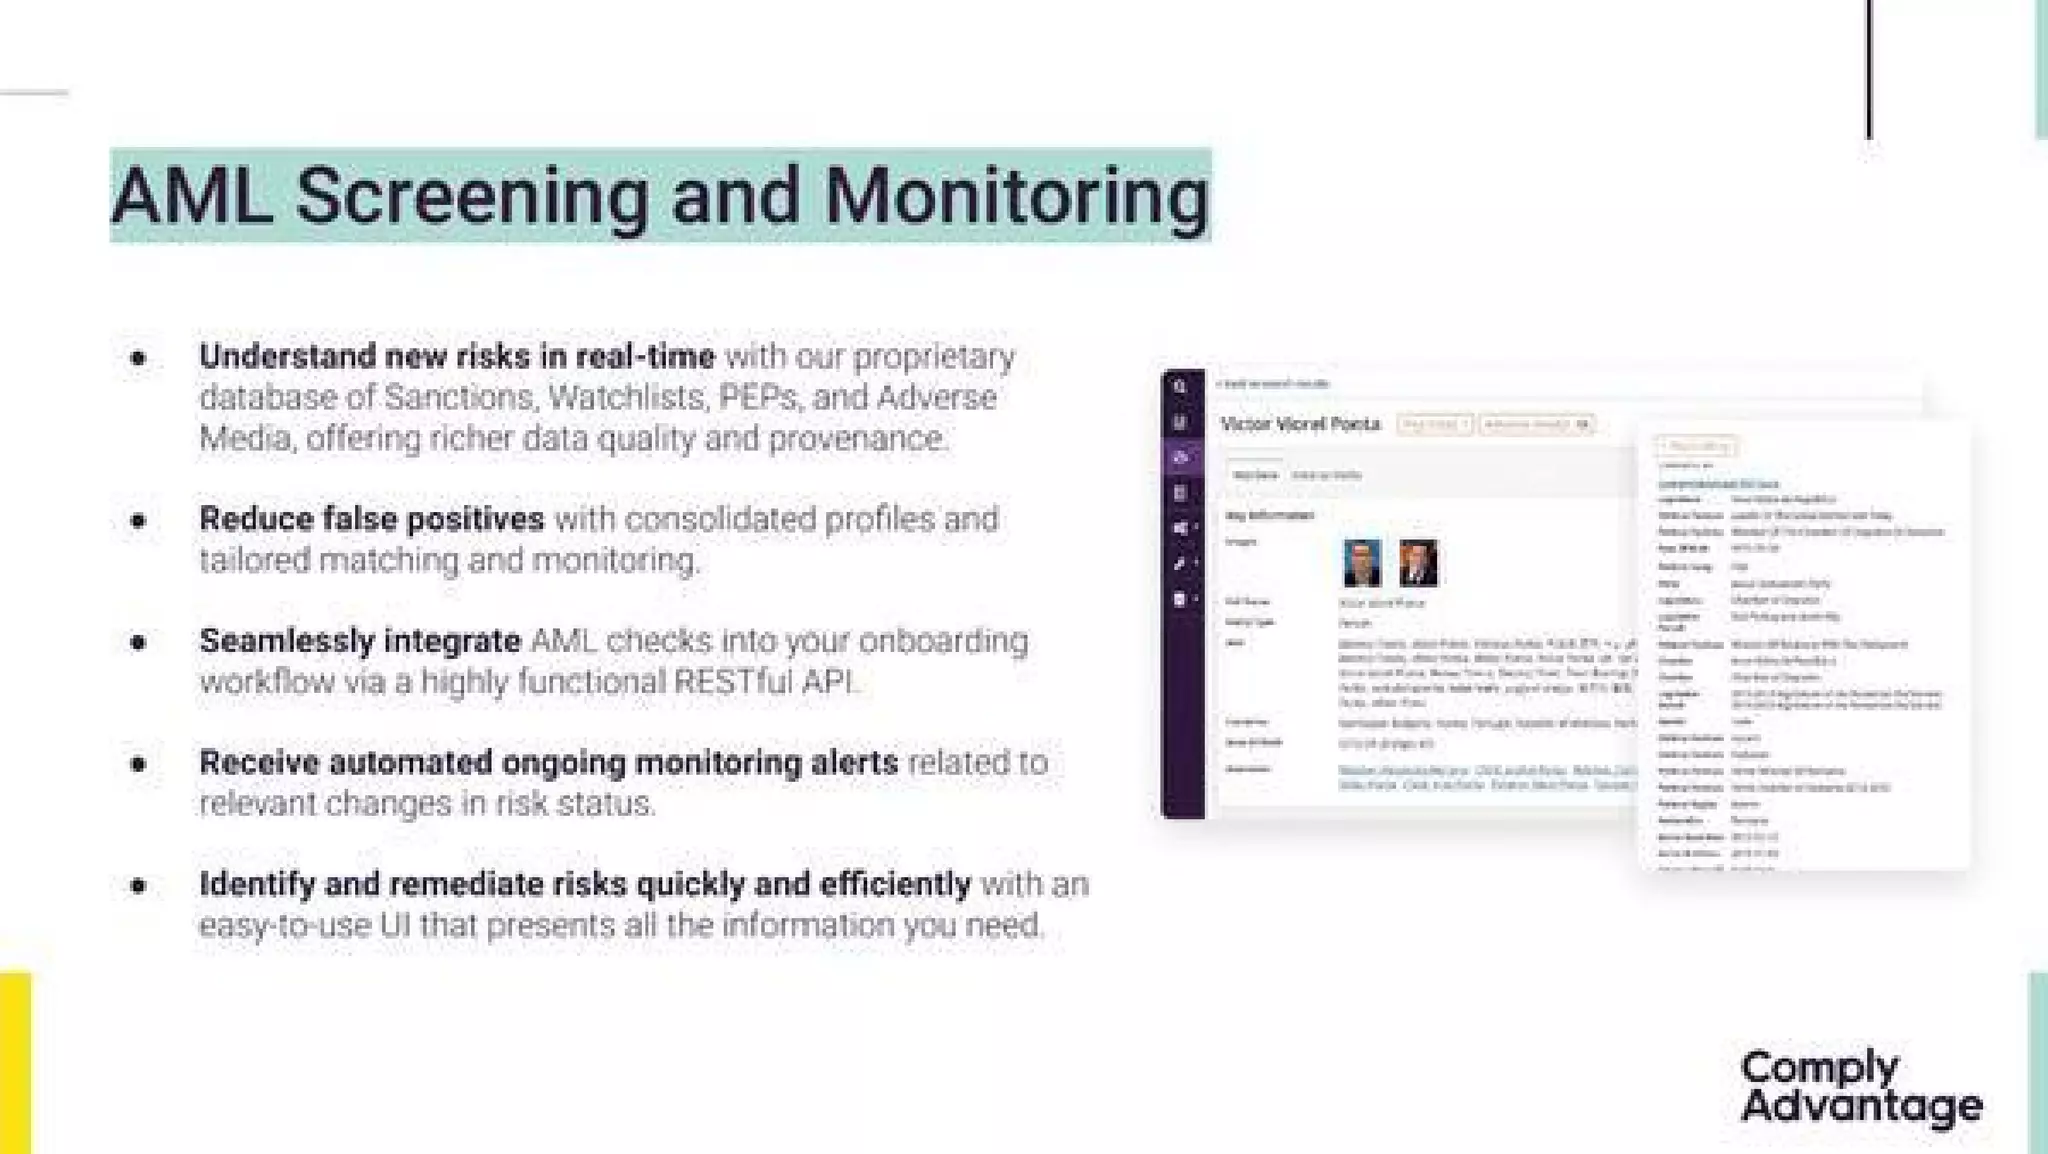
  • Product capabilities highlighted: consolidated entity profiles, automated adverse media classification, near real‑time sanction/watchlist updates, transaction screening & monitoring engines, case management and reporting (Slides 2, 8, 9–11).
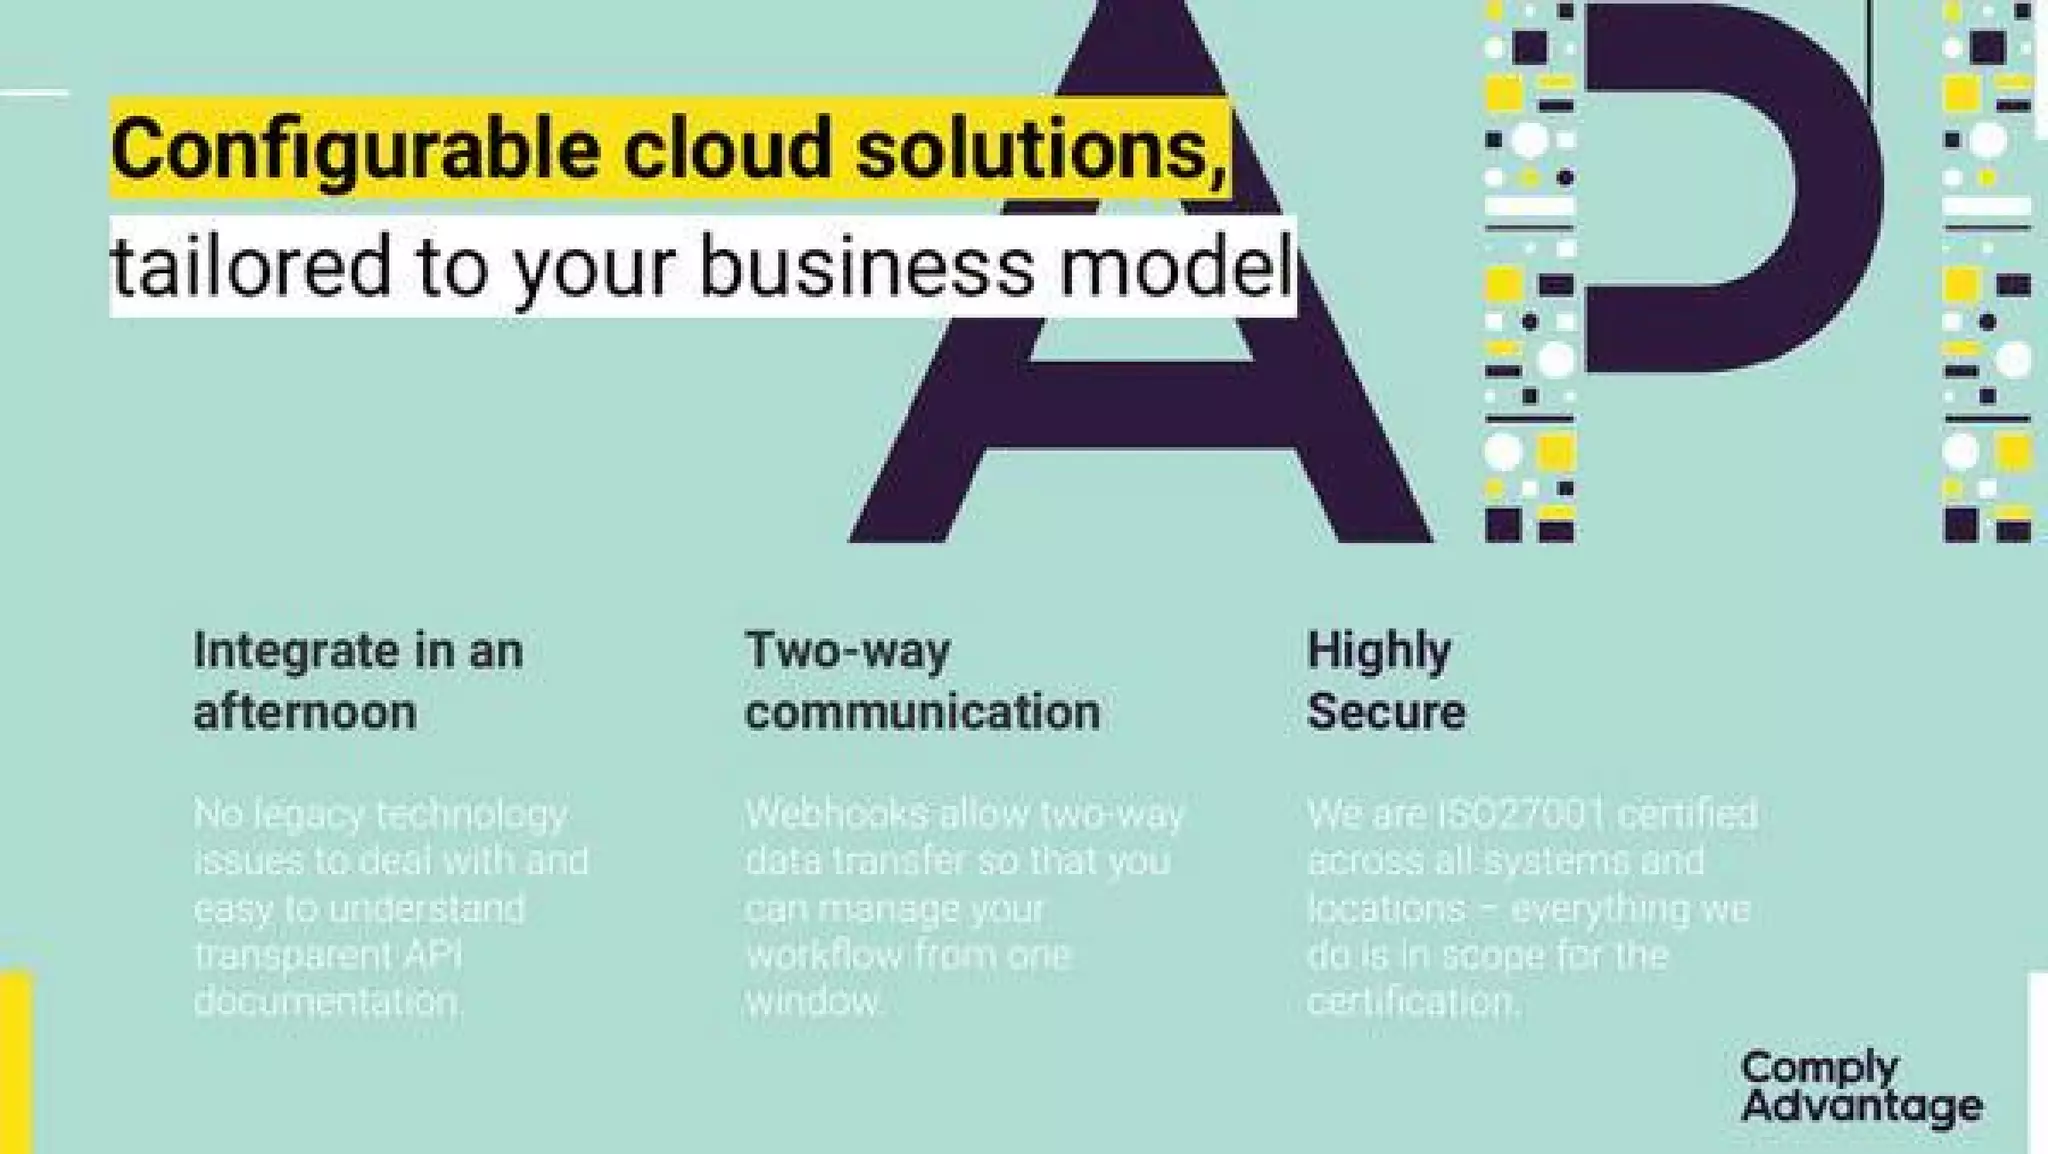
  • Cloud deployment, fast integration (“Integrate in an afternoon”), and configurable rule sets (Slides 12, 13).

Referenced slides: 2 (data), 3 (product overview), 8–11 (capabilities & UX), 12–13 (integration & security).


Market Opportunity

TAM/SAM/SOM analysis (what the deck shows and what it omits):

  • The deck establishes the problem scale with macro data (Slide 5): “$2 trillion laundered annually” — used to convey urgency and large downstream spend on compliance.
  • No explicit TAM / SAM / SOM figures or dollarized market sizing are presented in the slides. The deck relies on problem magnitude and large prospective buyer types (banks, fintechs) rather than formal market sizing.

Takeaway: the deck communicates a large, urgent market implicitly but does not provide explicit TAM/SAM/SOM numbers.


Business Model

Revenue model and unit economics (implicit from deck):

  • B2B SaaS / API-based model: subscription and module licensing (Customer Screening, Transaction Monitoring) — Slide 3’s “Plug and Play Modules” and Slides 12–13 emphasize cloud & API commercial delivery.
  • Professional services/implementation: an implementation team is referenced in operational flow diagrams (Slide 7), implying initial setup/consulting revenue.
  • No explicit pricing, ARRs, margins, CAC, or unit economics provided in the deck.

Traction & Metrics

Growth metrics and proof points shown in the deck:

  • Data coverage/scale (Slide 2: REAL-TIME RISK DATA):
    • “1000s government, regulatory and law enforcement watchlists”
    • “Sanction updates in 15 minutes”
    • “Updates 7 hours ahead of the official source email”
    • Adverse media metrics: “10,000 unique qualified media sources analysed daily”, “200m articles read per month”, “150,000 profiles added monthly”, “40,000 existing profiles updated every day”, “3 million adverse media individuals”, “200+ countries and territories covered”
  • Customer impact / case results (Slides 6 & 15):
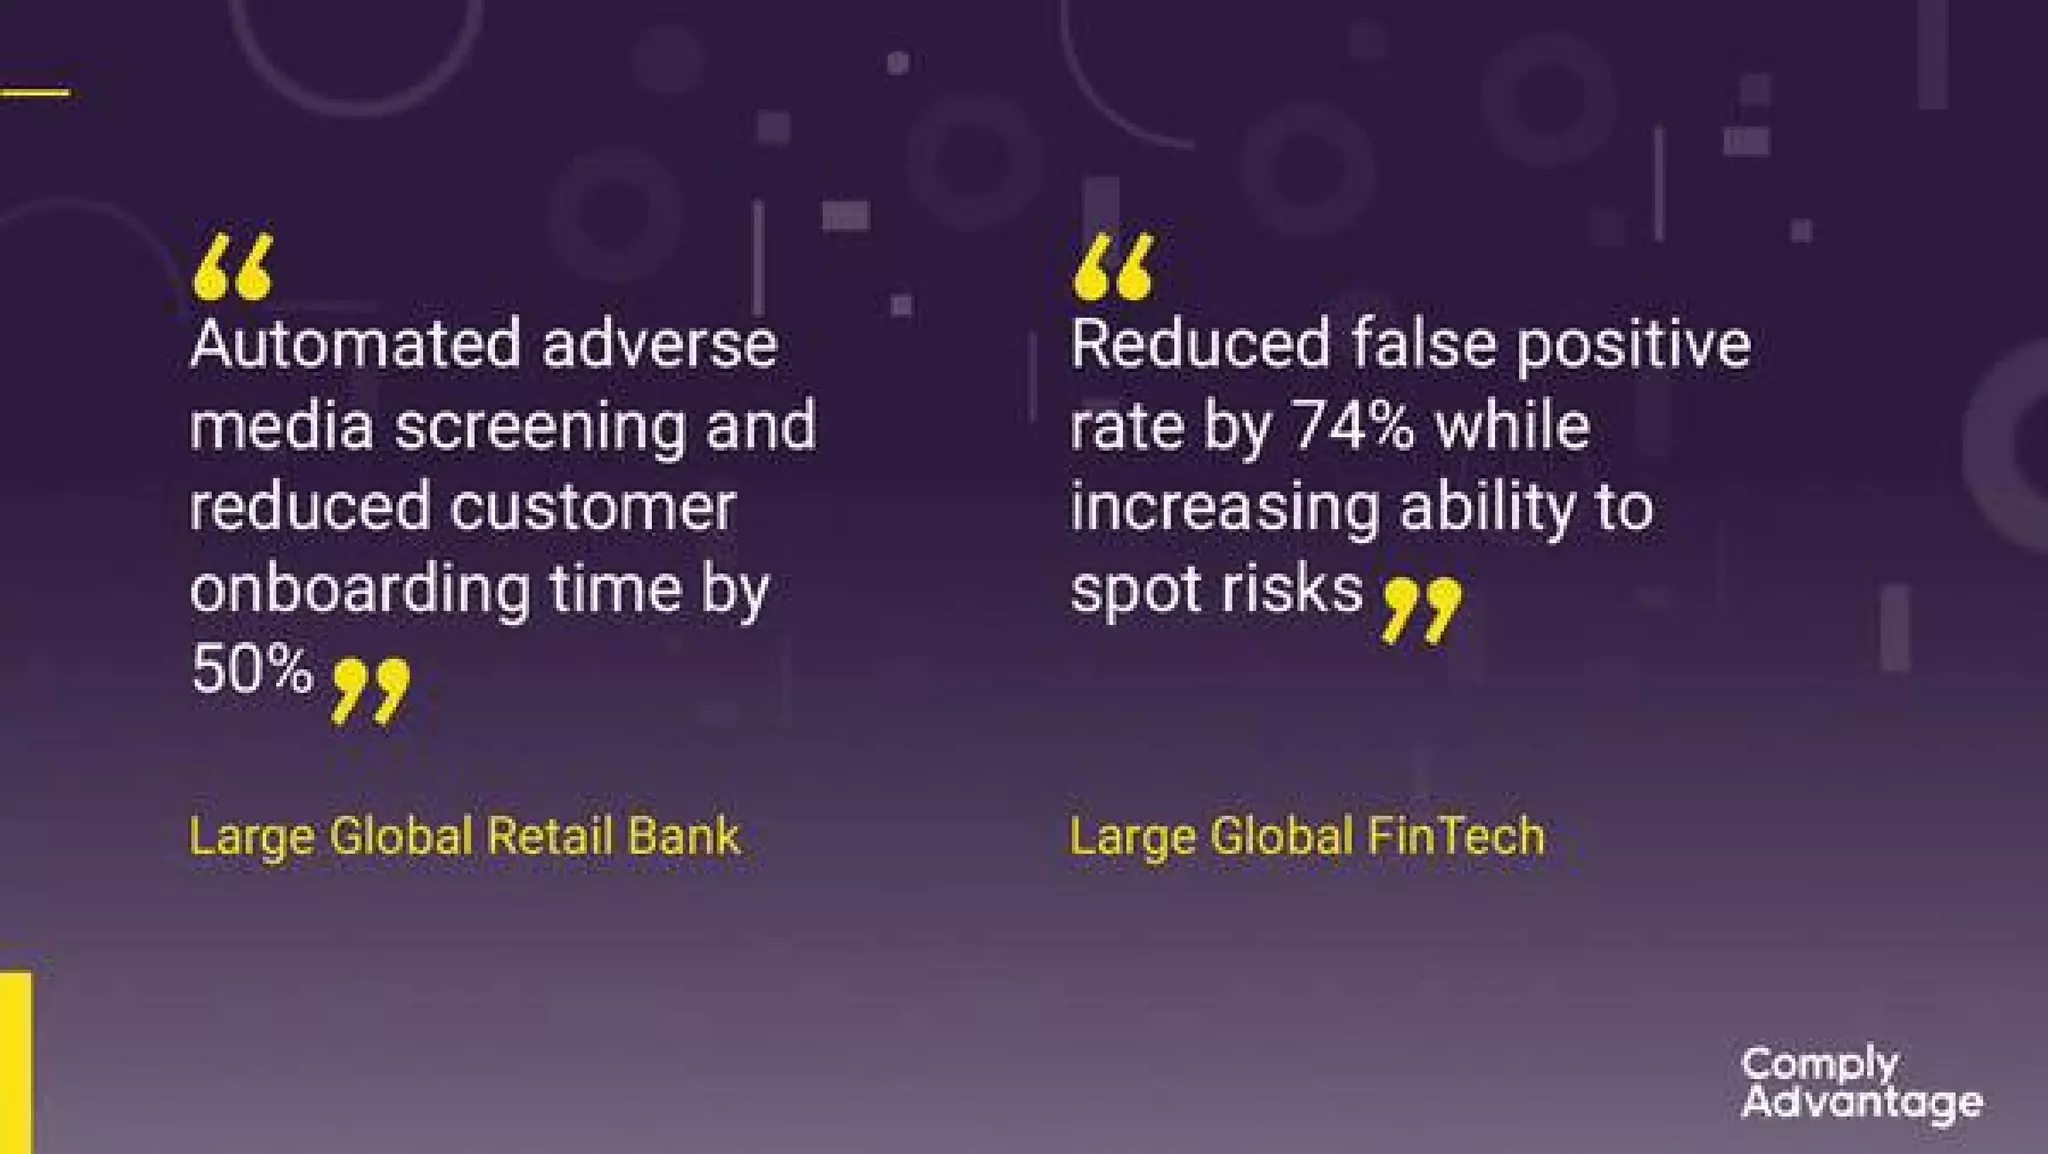
    • “Automated adverse media screening and reduced customer onboarding time by 50%” (Large Global Retail Bank)
    • “Reduced false positive rate by 74% while increasing ability to spot risks” (Large Global FinTech)
    • Transaction monitoring claim: “Monitor suspicious activity while reducing alerts by 60%” (Slide 9)
    • Santander case: reduced account opening cycle from “12 days to just 2” and “80% reduction in effort” (Slide 15)
  • Awards & recognition (Slide 16) — later validation (post‑Series A) shown as credibility.

Notes: deck focuses on product metrics and client impact rather than topline financials (no ARR/MRR, churn, CAC:LTV).


Competitive Positioning

How they differentiate:

  • Real-time data velocity and breadth: faster sanction and media updates; huge ingest and coverage numbers (Slide 2).
  • Proprietary FinCrime Knowledge Graph + AI/ML to reduce false positives and improve entity consolidation (Slides 3, 8).
  • API-first, cloud-native deployment enabling rapid integration and two-way workflows (Slides 8, 12).
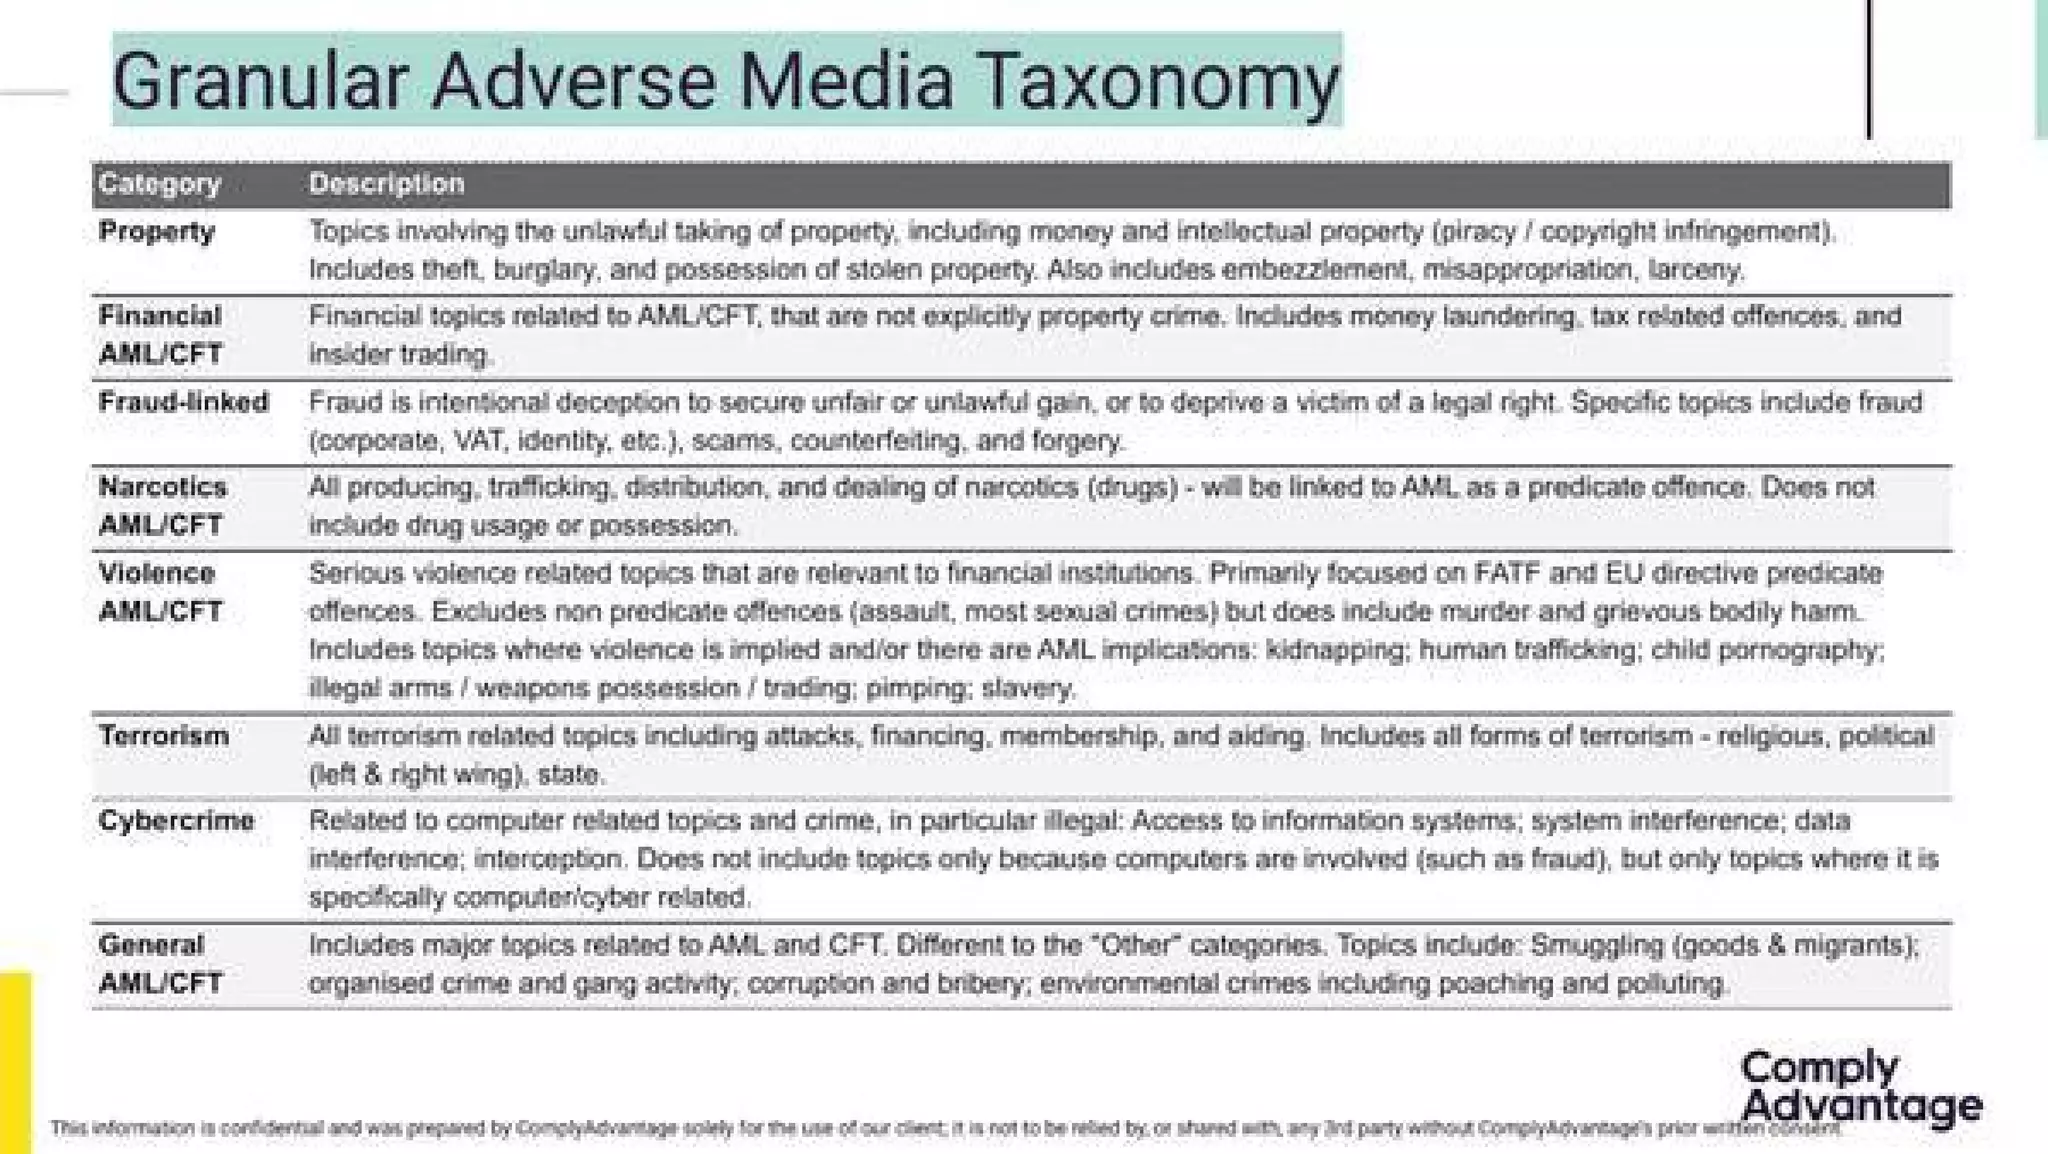
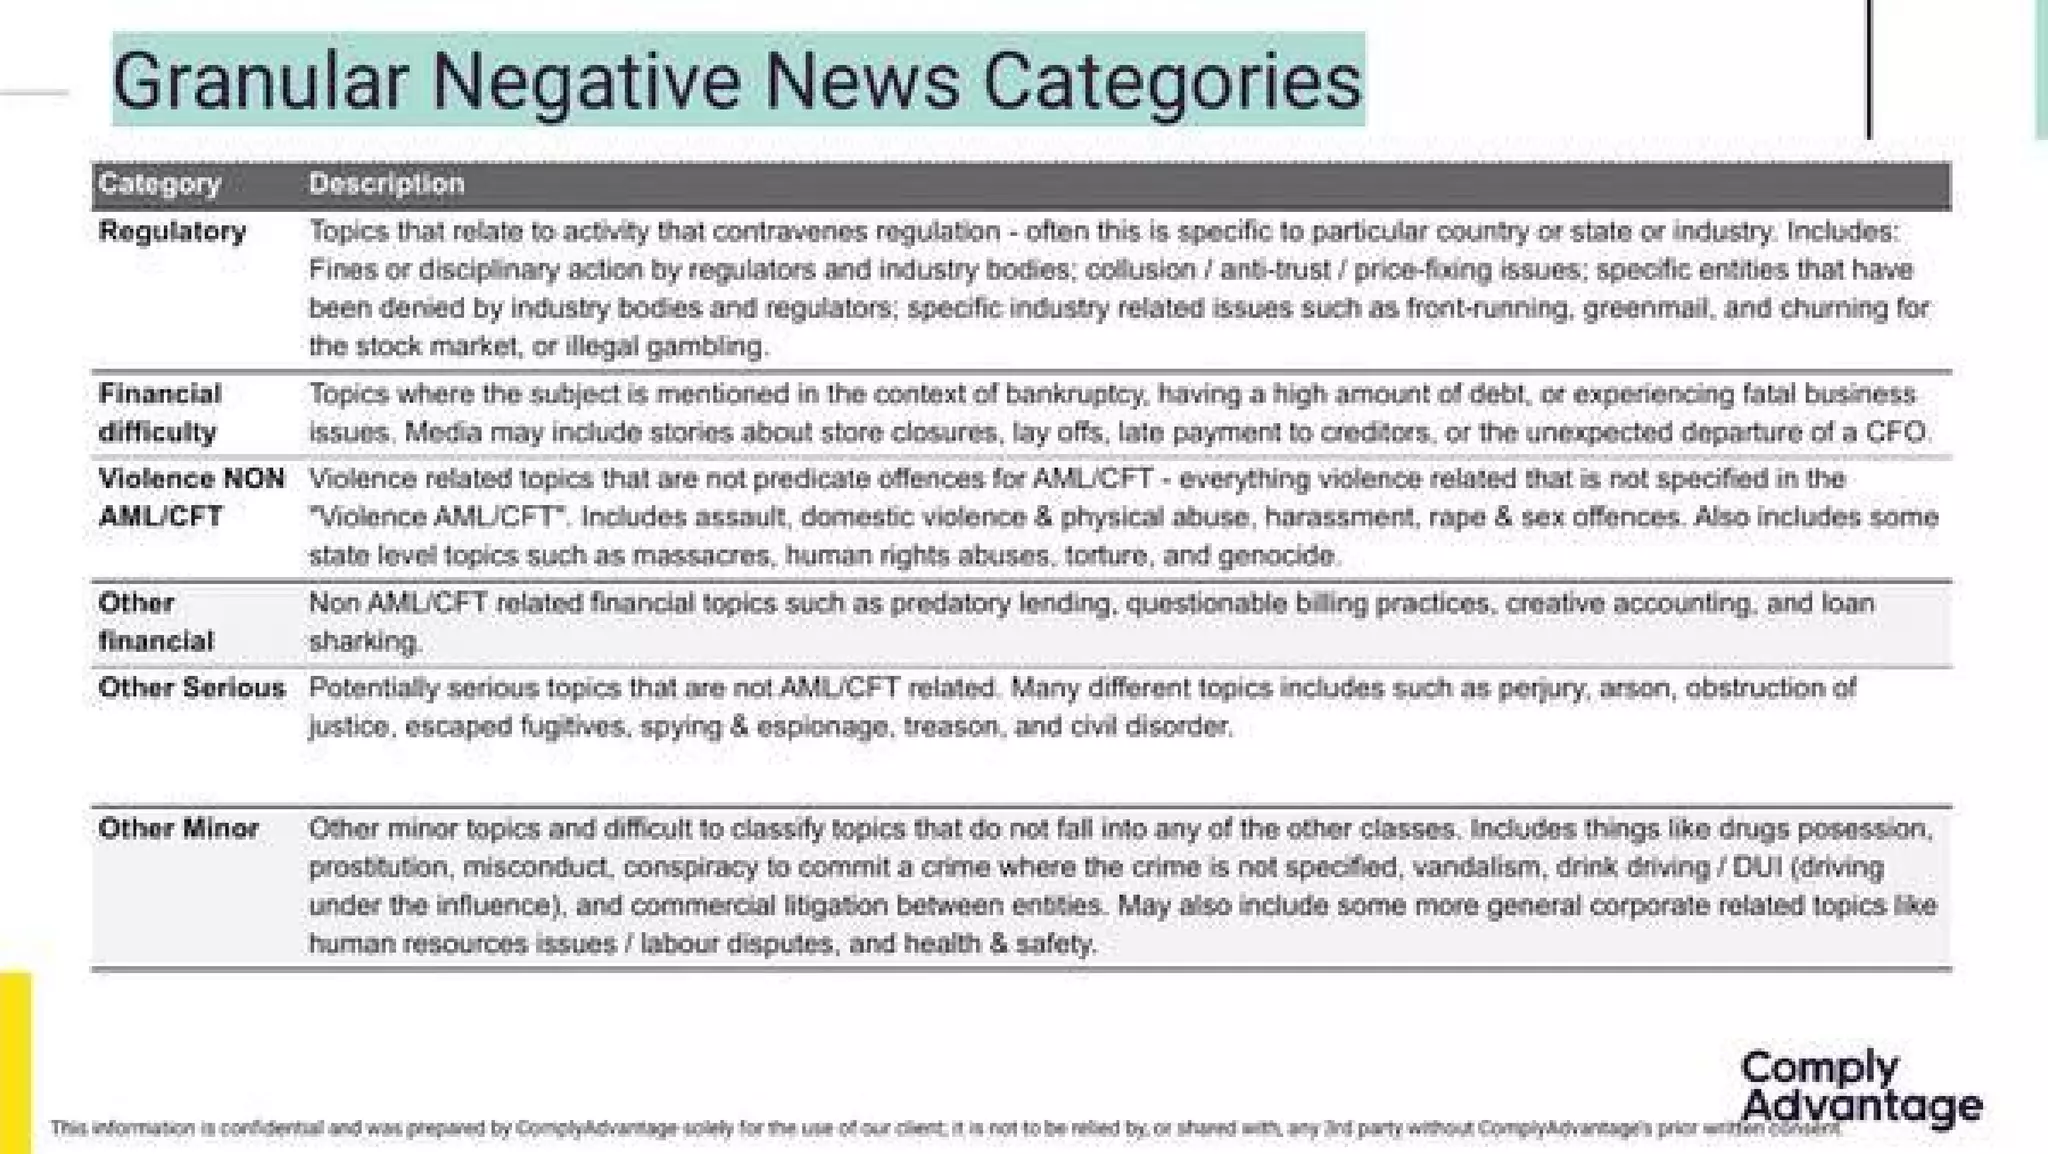
  • Granular adverse media taxonomy and classification to improve signal quality (Slides 13–14).
  • Client case studies and measurable reductions in onboarding time/false positives give operational differentiation vs legacy screening vendors.

Team

Team credentials (what the deck contains and limits):

  • The deck shows team imagery and references (Slide 16) and mentions a founder named “Charlie” (Slide 16: “Charlie was shortlisted for CityAM’s Entrepreneur of the Year Award”).
  • Implementation team is referenced in product flow (Slide 7).
  • Detailed bios, prior exits, or extensive team backgrounds are not provided in the deck.

Takeaway: team credibility is supported by awards/shortlists and visible implementation capability, but the deck lacks explicit bios and experience summaries that investors typically expect.


Go-to-Market Strategy

Distribution approach shown or implied:

  • Direct sales to regulated institutions (banks, fintechs) — evidenced by customer quotes (Santander, large retail bank, large fintech) and case study slides (Slides 6, 15).
  • Technical GTM: RESTful API + webhooks for rapid integration targeted at product/engineering teams (Slides 3, 8, 12).
  • Implementation services and pre-set industry-specific rule packs to accelerate deployment (Slides 7, 9, 11).
  • No explicit channel partnerships, pricing tiers, sales motion metrics (sales cycle, outbound vs inbound mix) provided.

The Ask

What they were raising and use of funds:

  • Raise: Series A — $631K (given context).
  • The deck does not clearly itemize intended use of proceeds, burn plan or runway milestones. (No explicit “use of funds” slide visible.)

Investor Deep Dive

Executive summary, strengths & red flags

Executive Summary

ComplyAdvantage’s Series A deck (2015) presents an API-first, cloud-native AML screening and transaction-monitoring product built on proprietary data and ML-powered knowledge graphs to deliver real‑time risk signals. The deck is notable for clear product flows, strong operational datapoints about coverage and update velocity (media sources, sanctions, profiles), and early, quantifiable client impact metrics (large banks / fintech customers).

Key Strengths

3 identified

1

Clear product architecture and flows

2

Strong operational data and real-time claims

3

Compelling, measurable customer outcomes

Red Flags & Weaknesses

3 identified

1

No explicit financials or traction KPIs (ARR / MRR / growth rates)

2

Missing TAM/SOM numeric sizing and go-to-market economics

3

Thin team detail and organizational plan

More Pitch Decks To Study

Compare structure, fundraising context, and investor-facing story across similar startup decks.