Compare your deck to Uber

Compare Your Deck

Uber Pitch Deck (2008)

Marketplace
Stage: Seed
Raised: $200K
Year: 2008
Slides: 25
Outcome: IPO at $75B valuation

Pitch Deck

1 / 25
Uber pitch deck - The Opening: Simple positioning and immediate value prop
Click to expand

Deck Analysis

This deck is Uber's 2008 seed pitch that crisply frames a large, inefficient taxi market and presents a technology-driven on-demand premium car service as the solution. It stands out for tightly linking a clear customer pain (slow, unreliable hailing and expensive medallions) to a simple product concept (one-click, members-only car requests) and a concrete path to execution (apps, dispatch tech, fleet plans). The presentation is notable for being straightforward, operationally focused, and for demonstrating early traction and a realistic roadmap rather than an overambitious, speculative narrative.

The Opening: Simple positioning and immediate value prop

The Opening: Simple positioning and immediate value prop

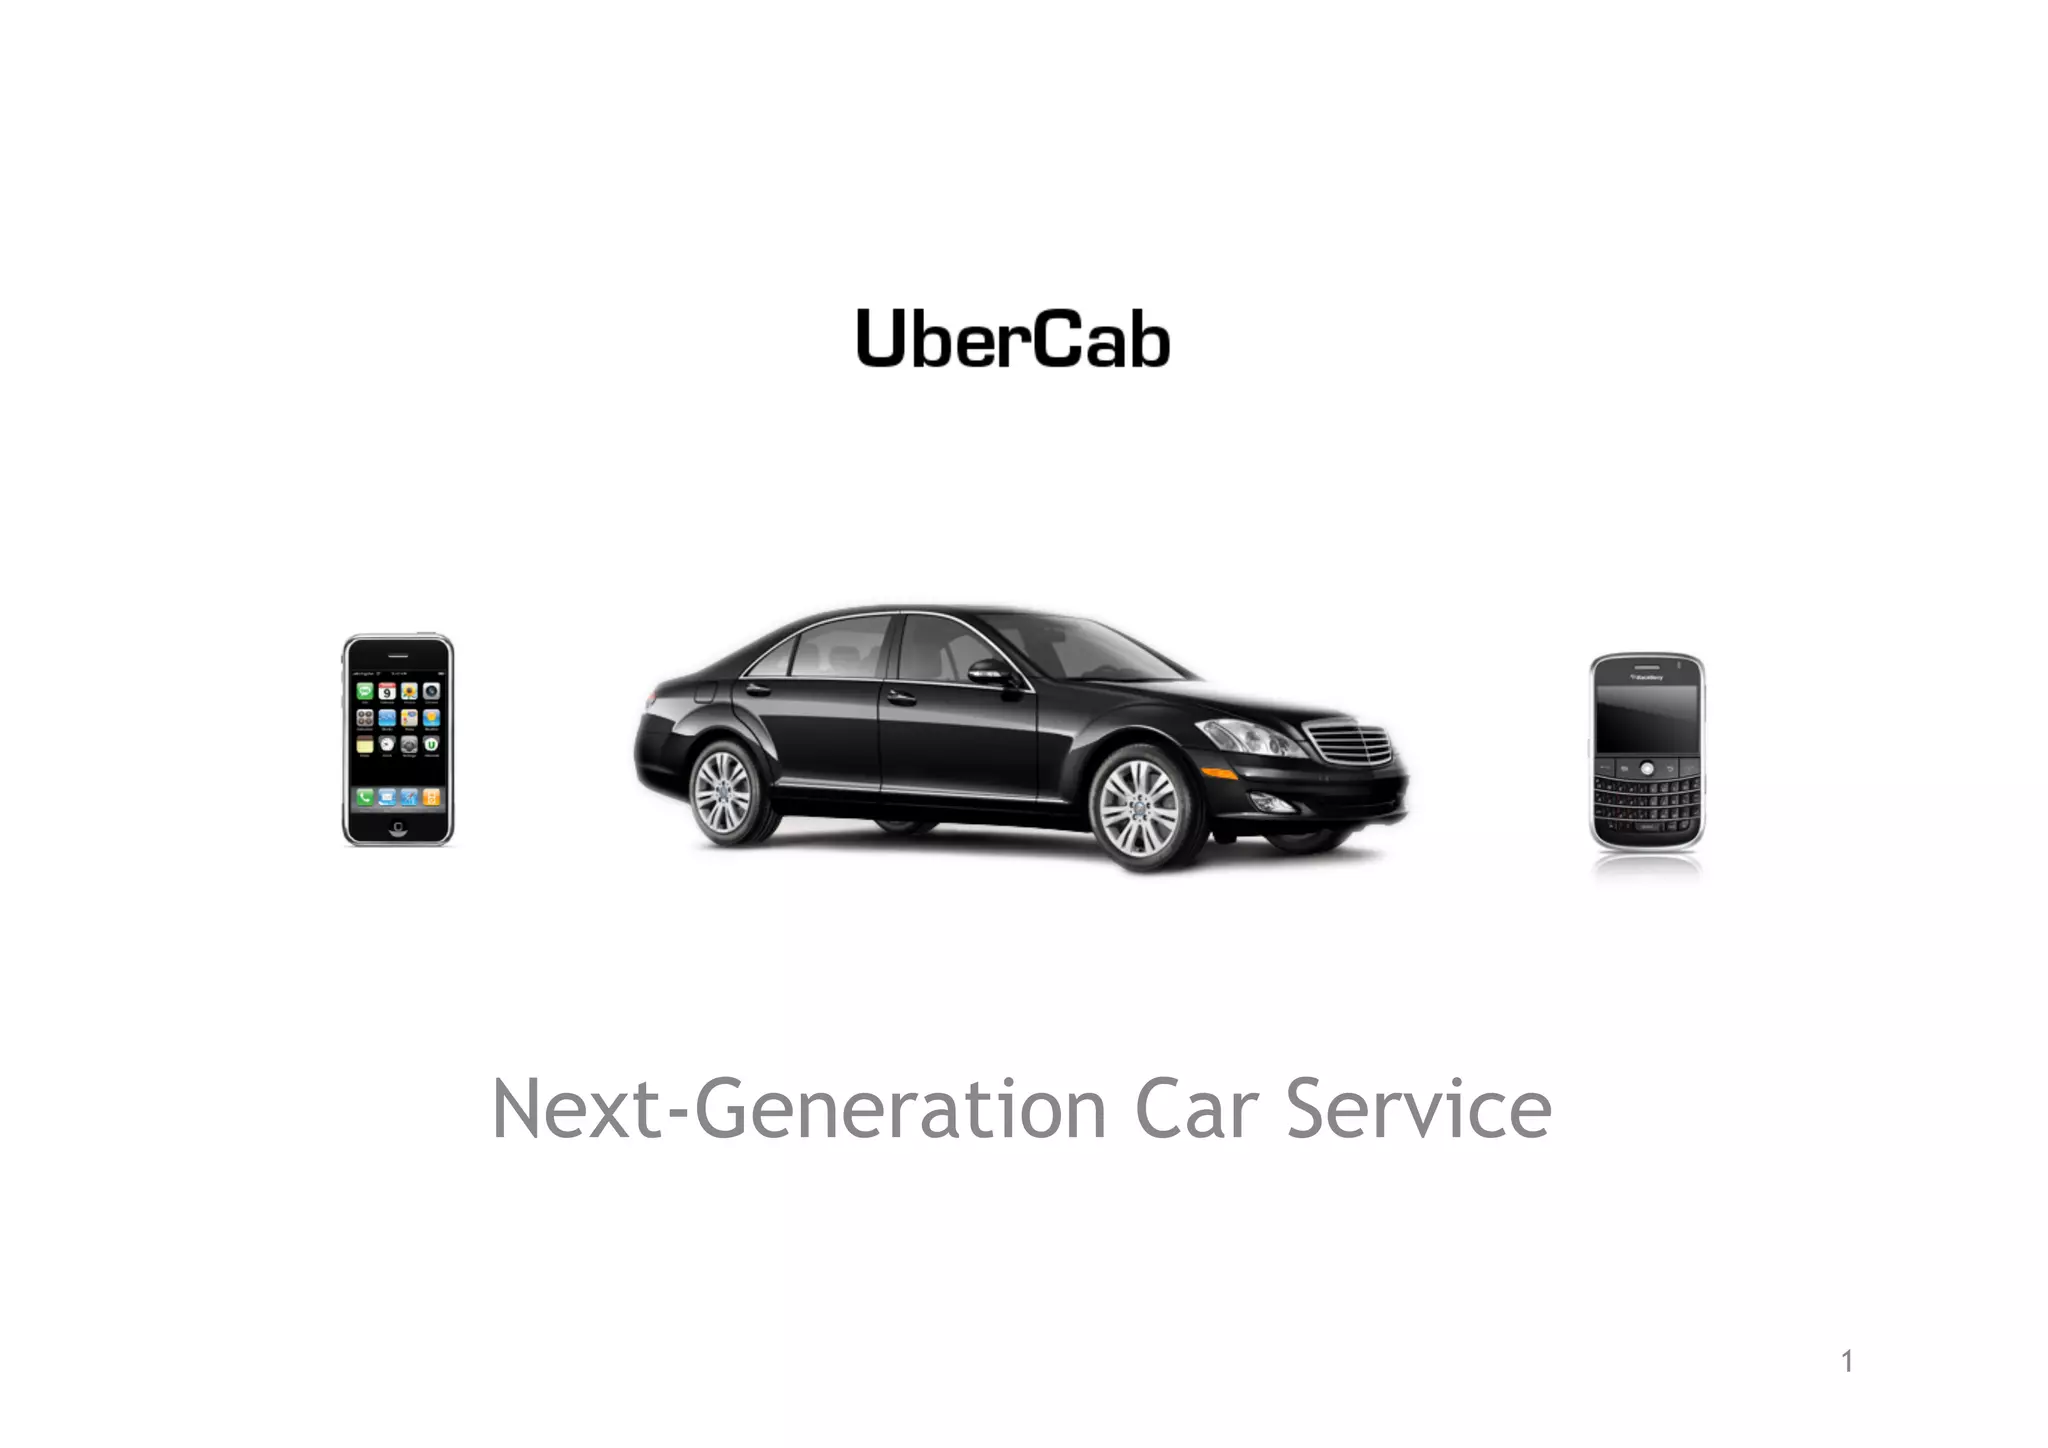
Slide 1 establishes the brand and the single-line value proposition: 'Next-Generation Car Service.' The visual is minimal — a sleek car and phones — which reinforces a premium, tech-enabled transportation experience. This directness makes the product easy to grasp instantly for investors: premium cars + mobile technology = better car service.

What founders can learn: start with a concise, memorable positioning that ties product, channel, and benefit in one line. The slide avoids fluff and focuses attention on the central promise, which primes the audience for the problem and solution that follow.

Key Takeaway: Lead with a one-line value proposition and simple visuals that make the product and benefit obvious within seconds.
Problem Framing: Quantifying incumbent inefficiency (Medallion System)

Problem Framing: Quantifying incumbent inefficiency (Medallion System)

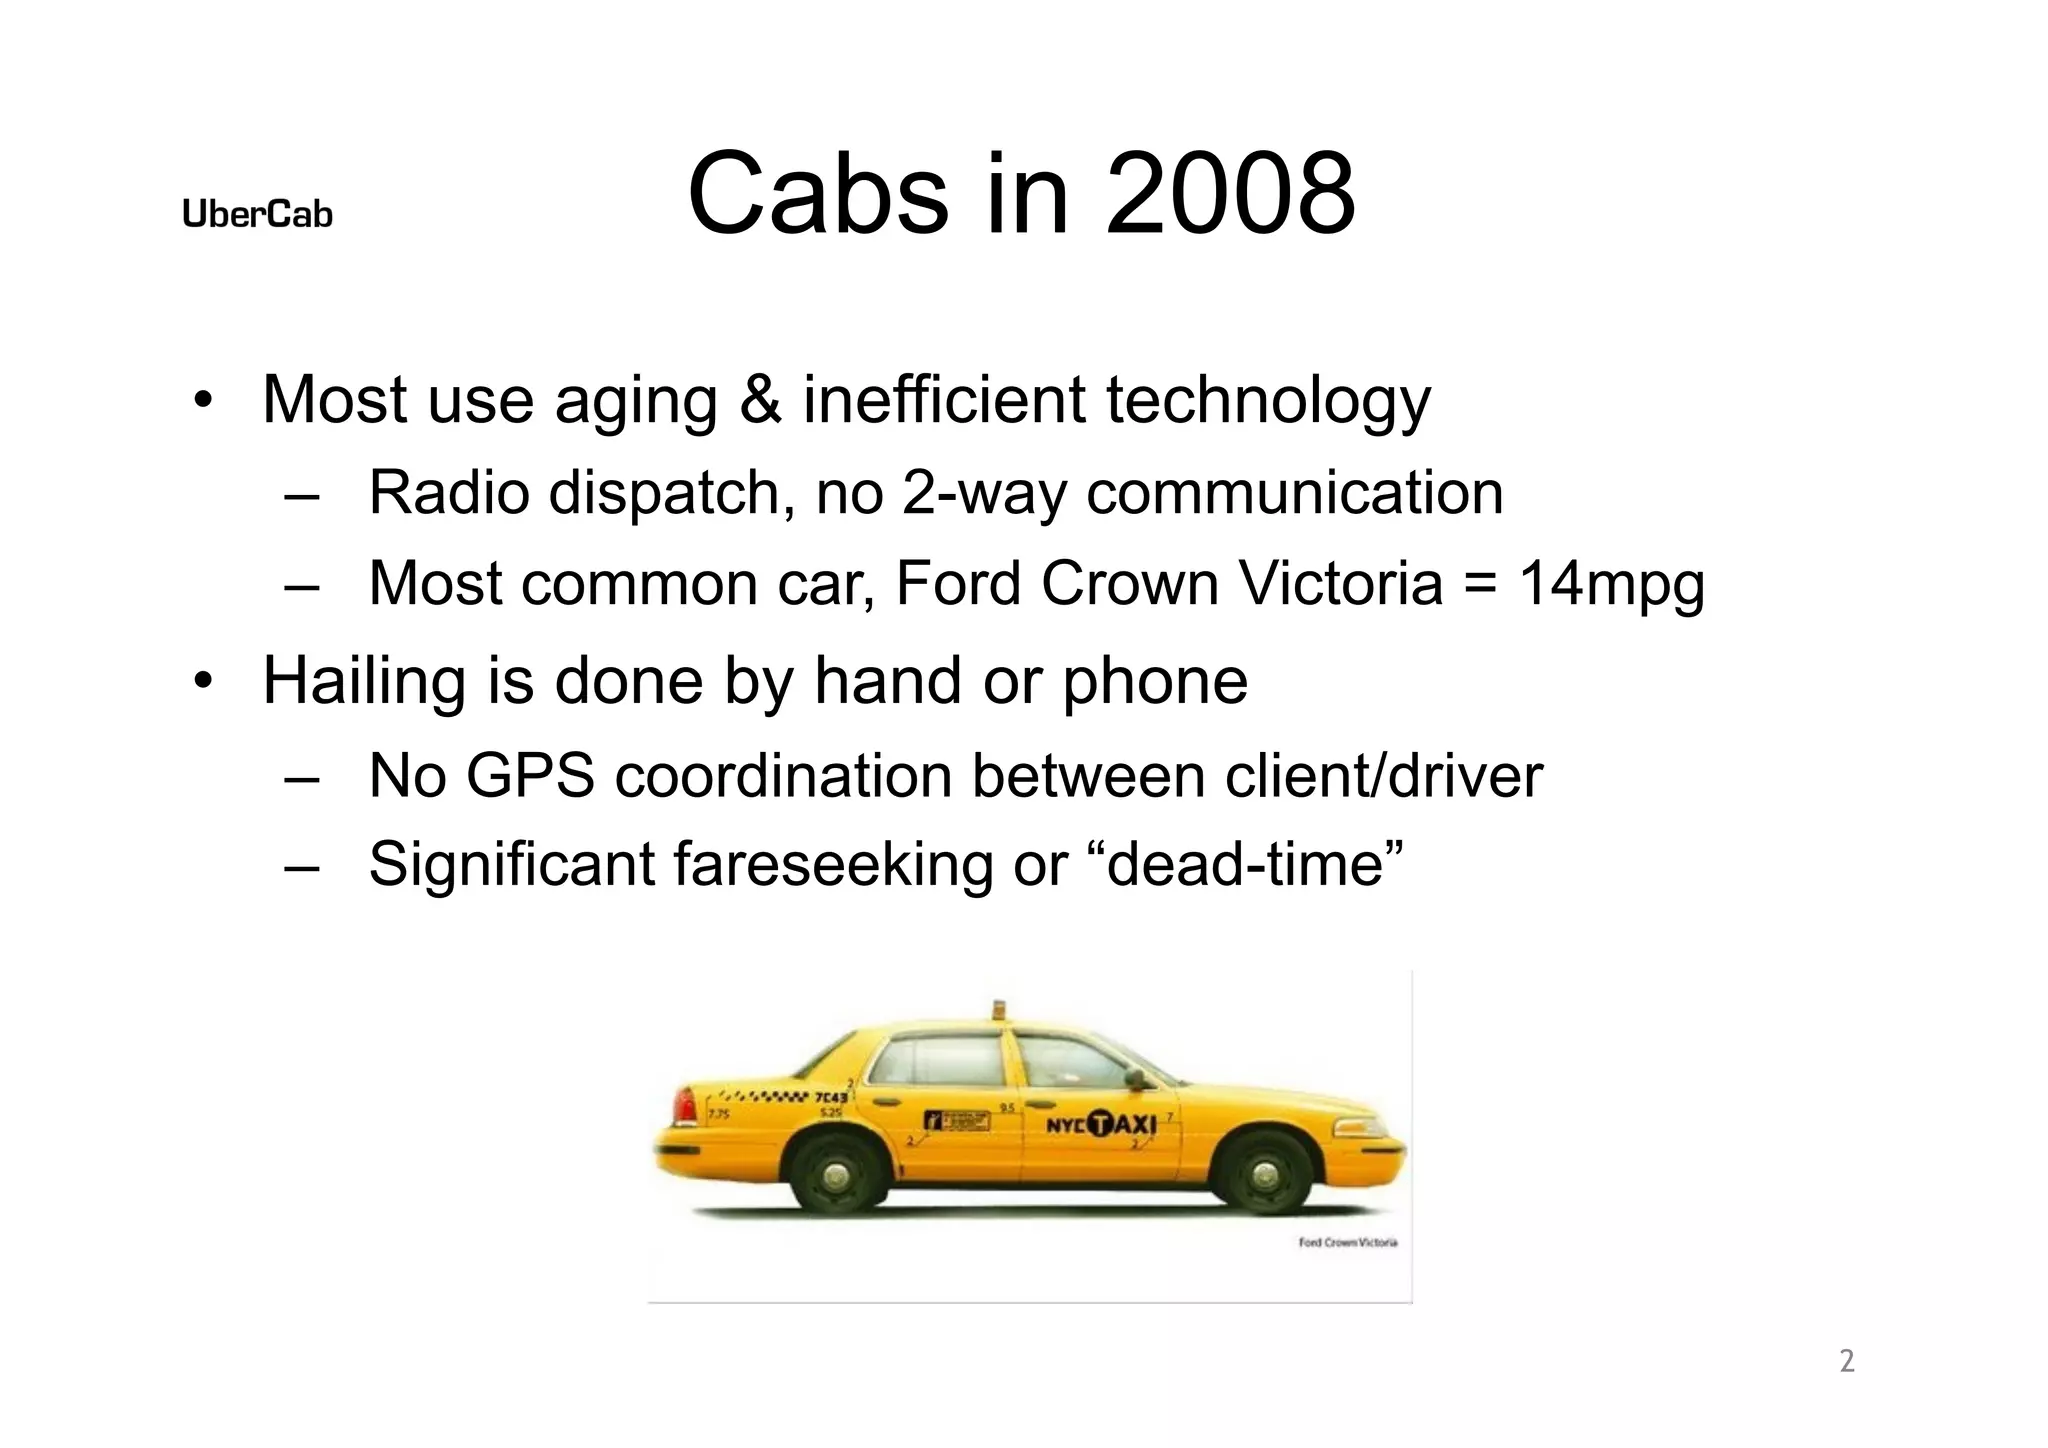
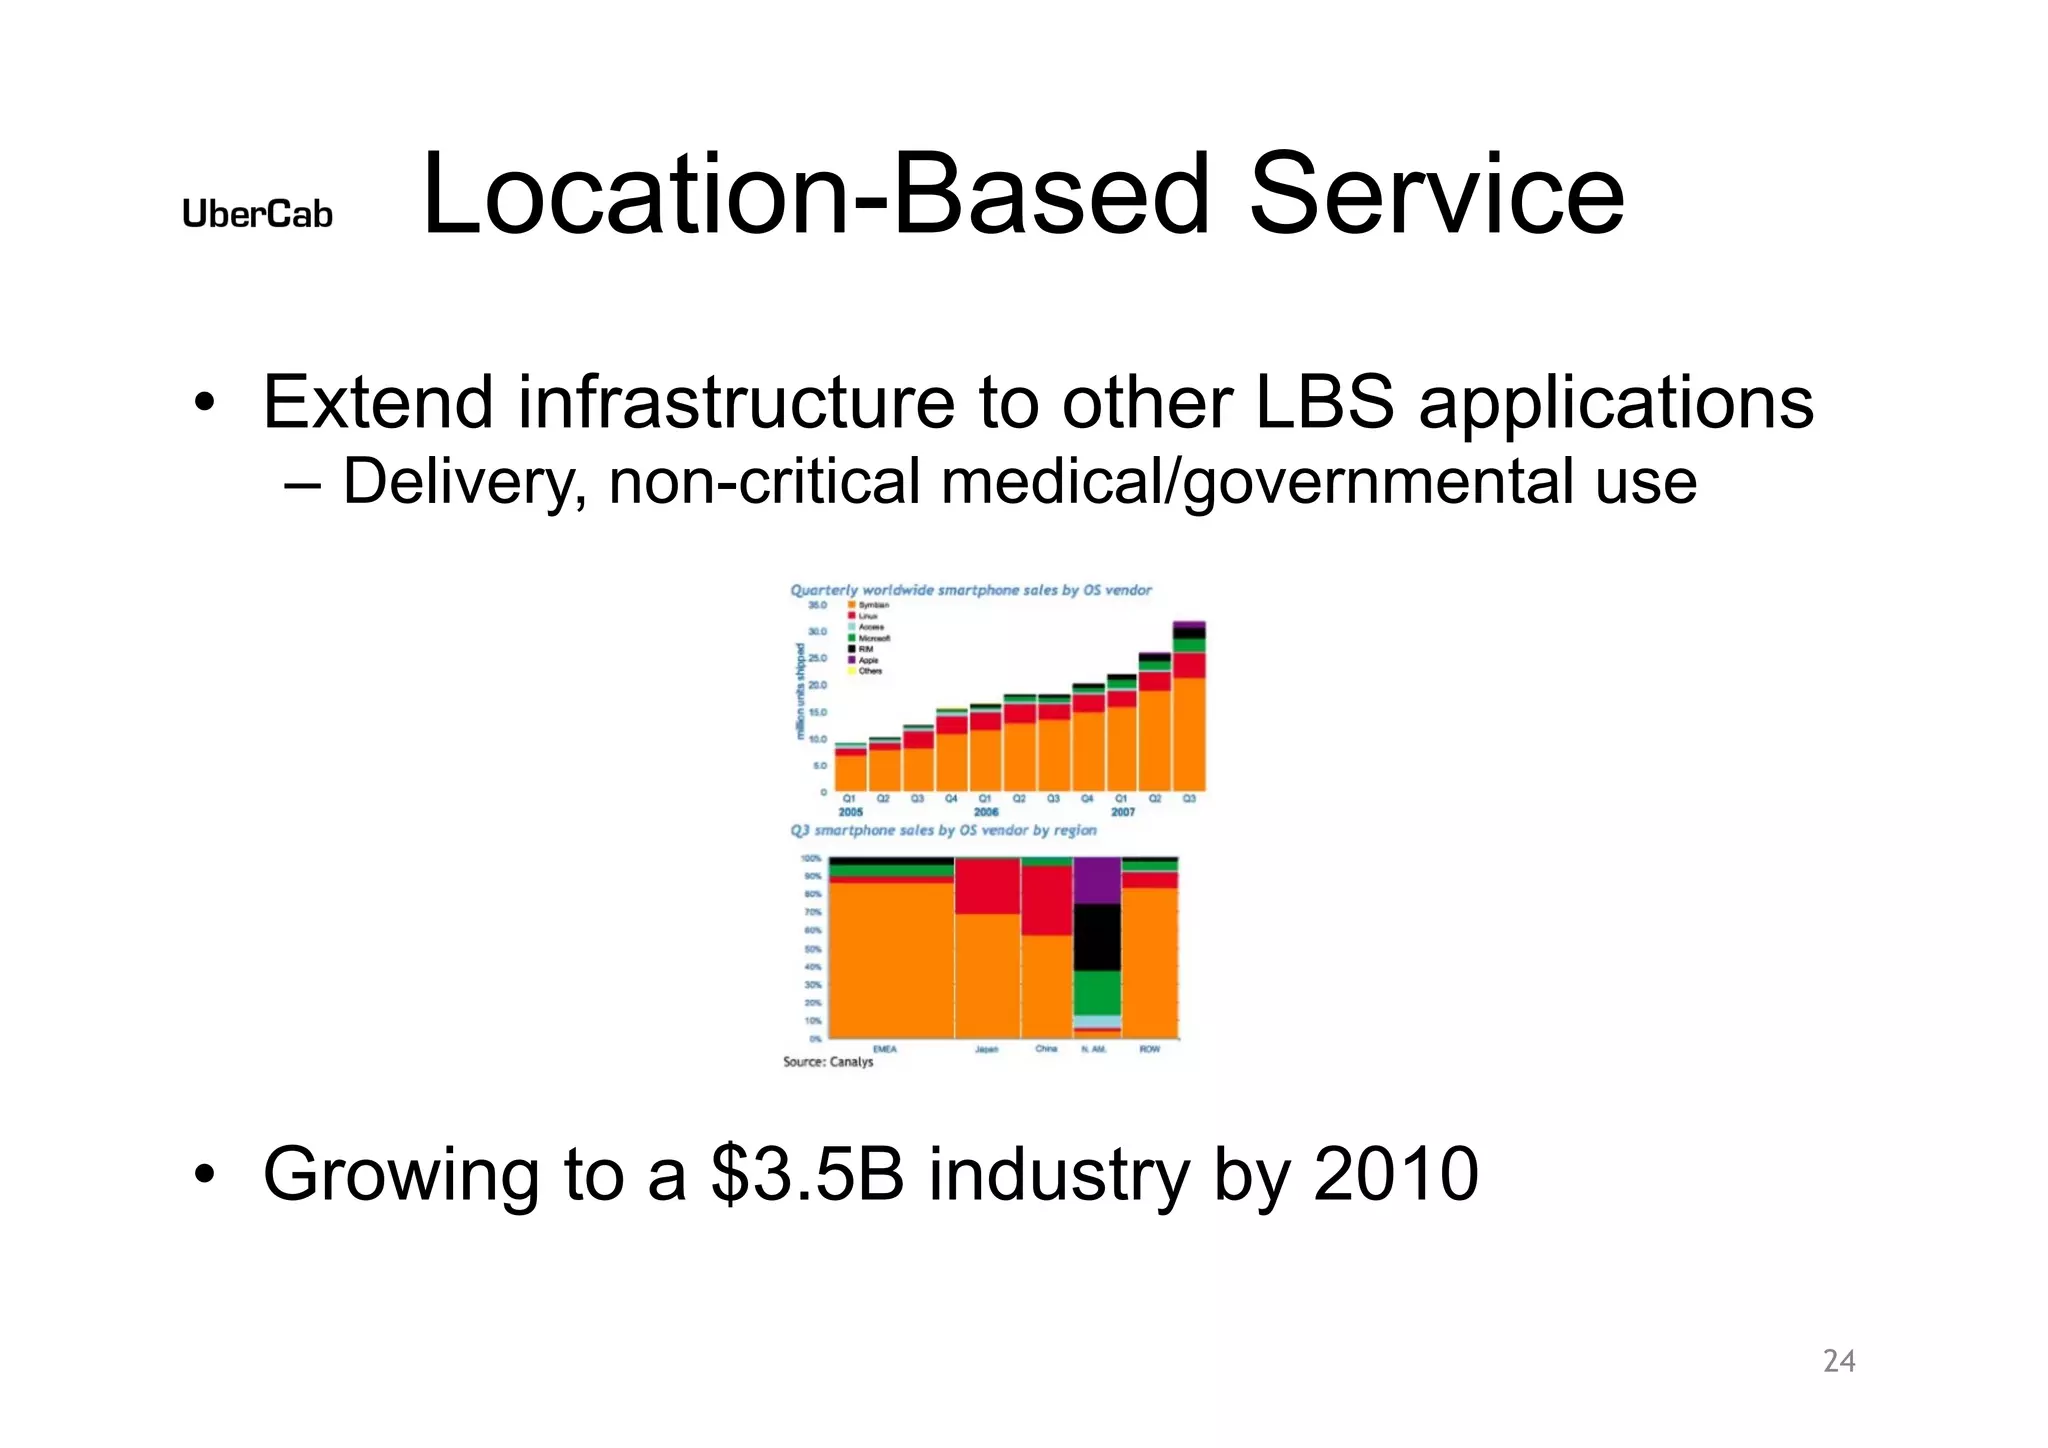
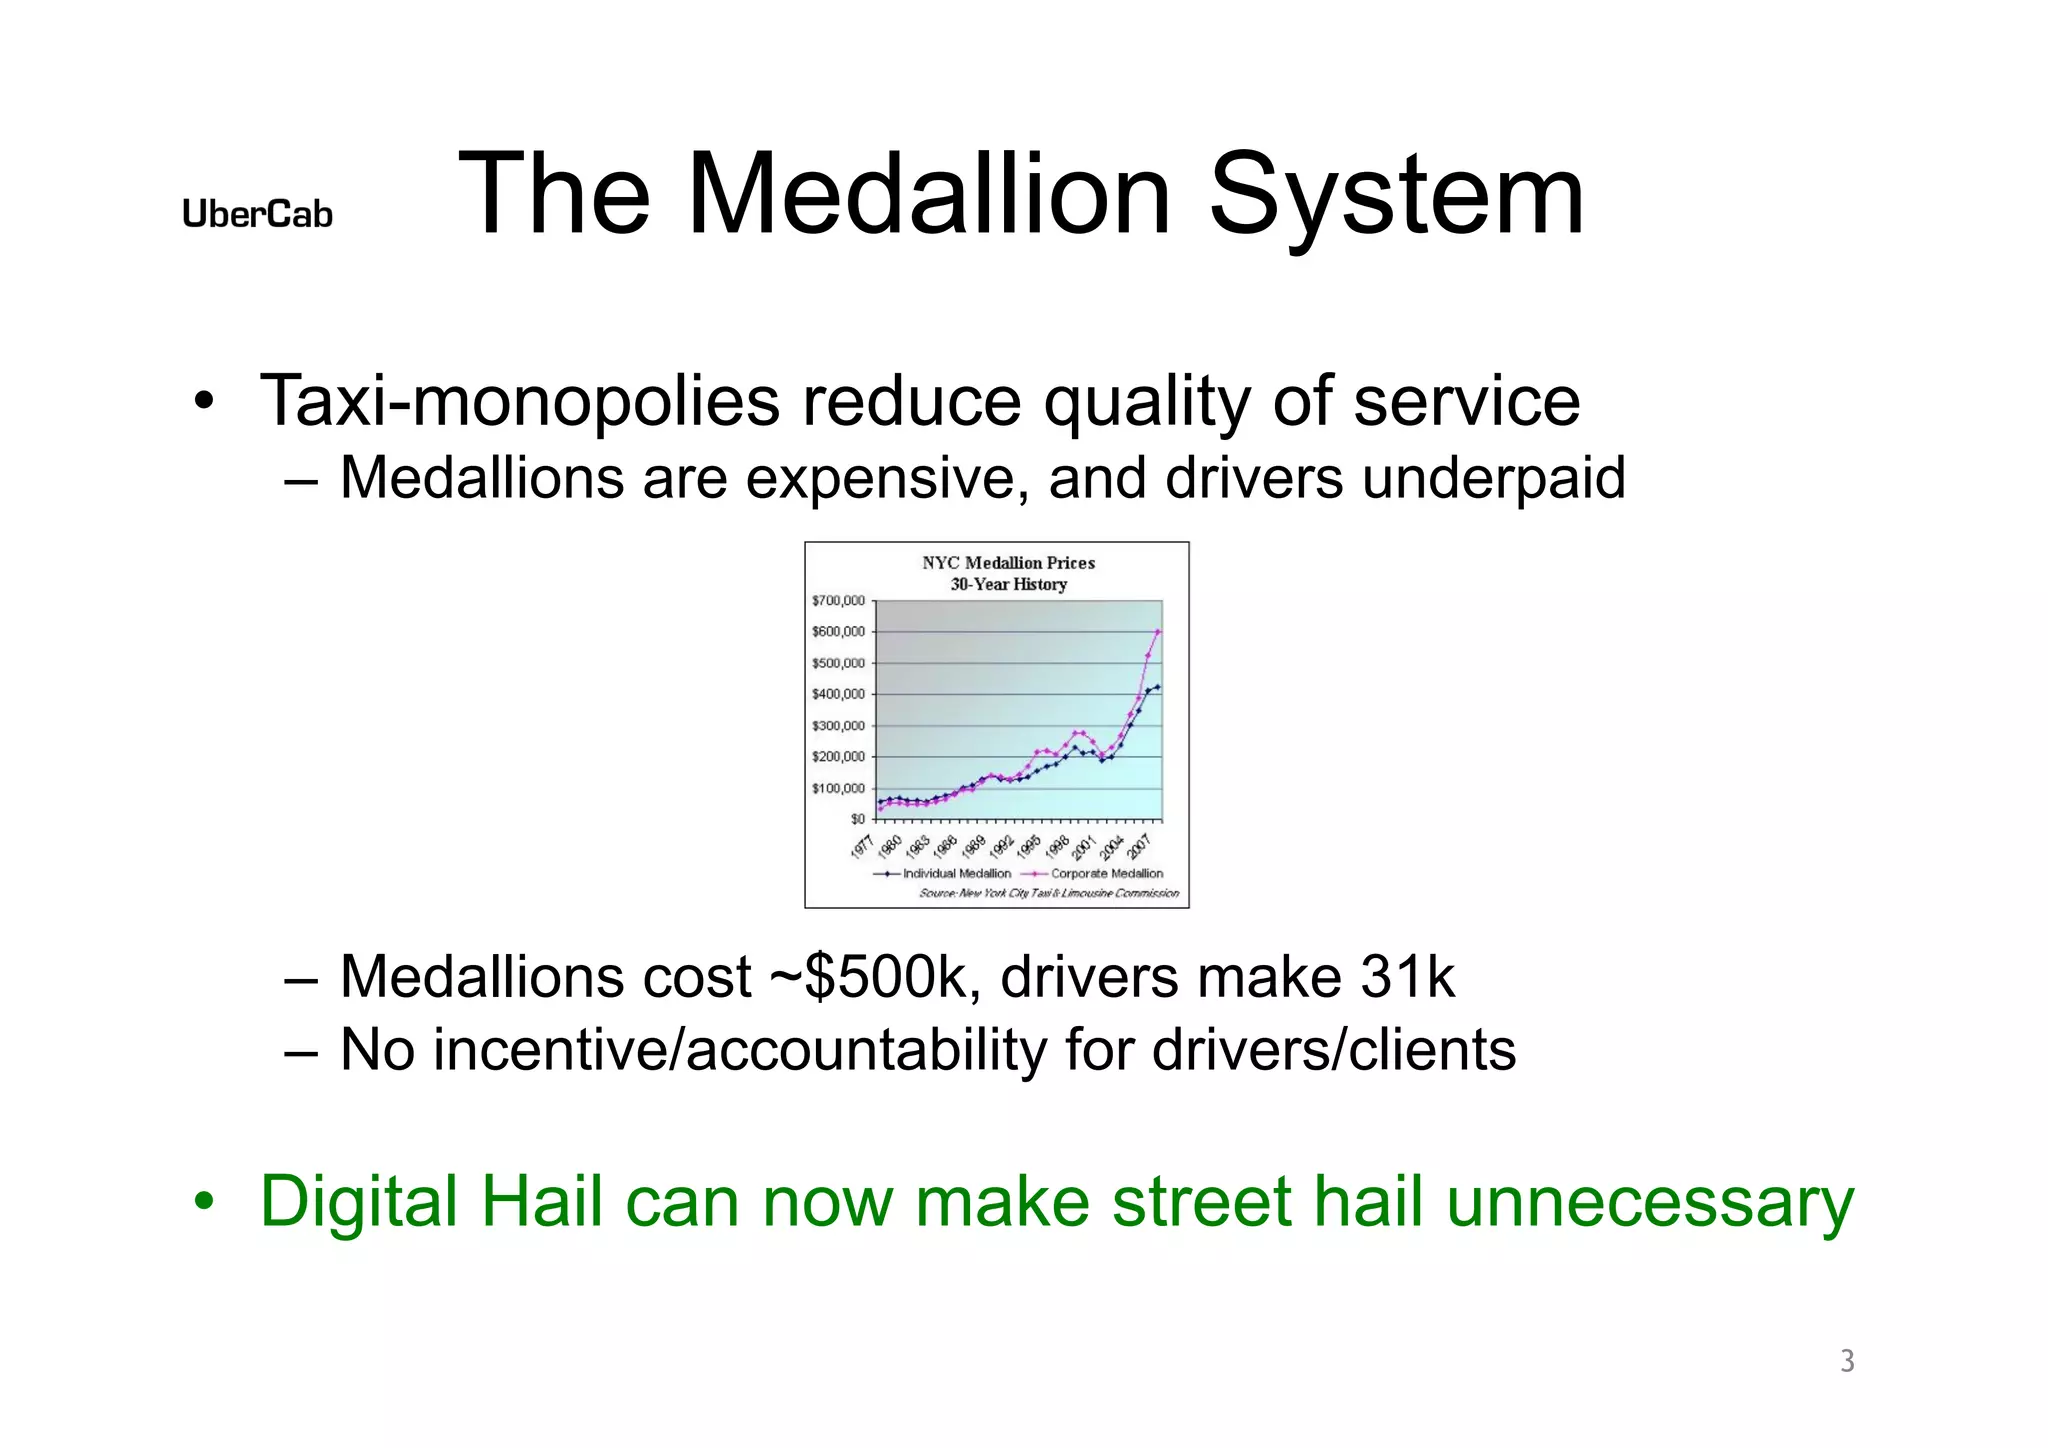
Slide 3 and related slides on market context detail how taxi monopolies, medallion costs, and inefficient dispatch lead to poor service and low driver compensation. The deck uses specific numbers — medallions costing ~$500k and drivers making ~$31k — to make the economic pain tangible. By explaining 'dead-time' and the lack of GPS coordination, the founders create a defensible rationale for why a technology layer can unlock value.

This is effective because it pairs an emotional customer pain (long waits, unreliable service) with hard economic constraints that technology can alter. Founders should emulate this approach: quantify the incumbent's fracture points (cost structures, regulation, operational inefficiencies) to show a clear opportunity for disruption and to justify a technical solution.

Key Takeaway: Use concrete numbers and operational failure points to turn a perceived inconvenience into a provable market opportunity.
Product Concept: Clear, differentiated offering (UberCab concept)

Product Concept: Clear, differentiated offering (UberCab concept)

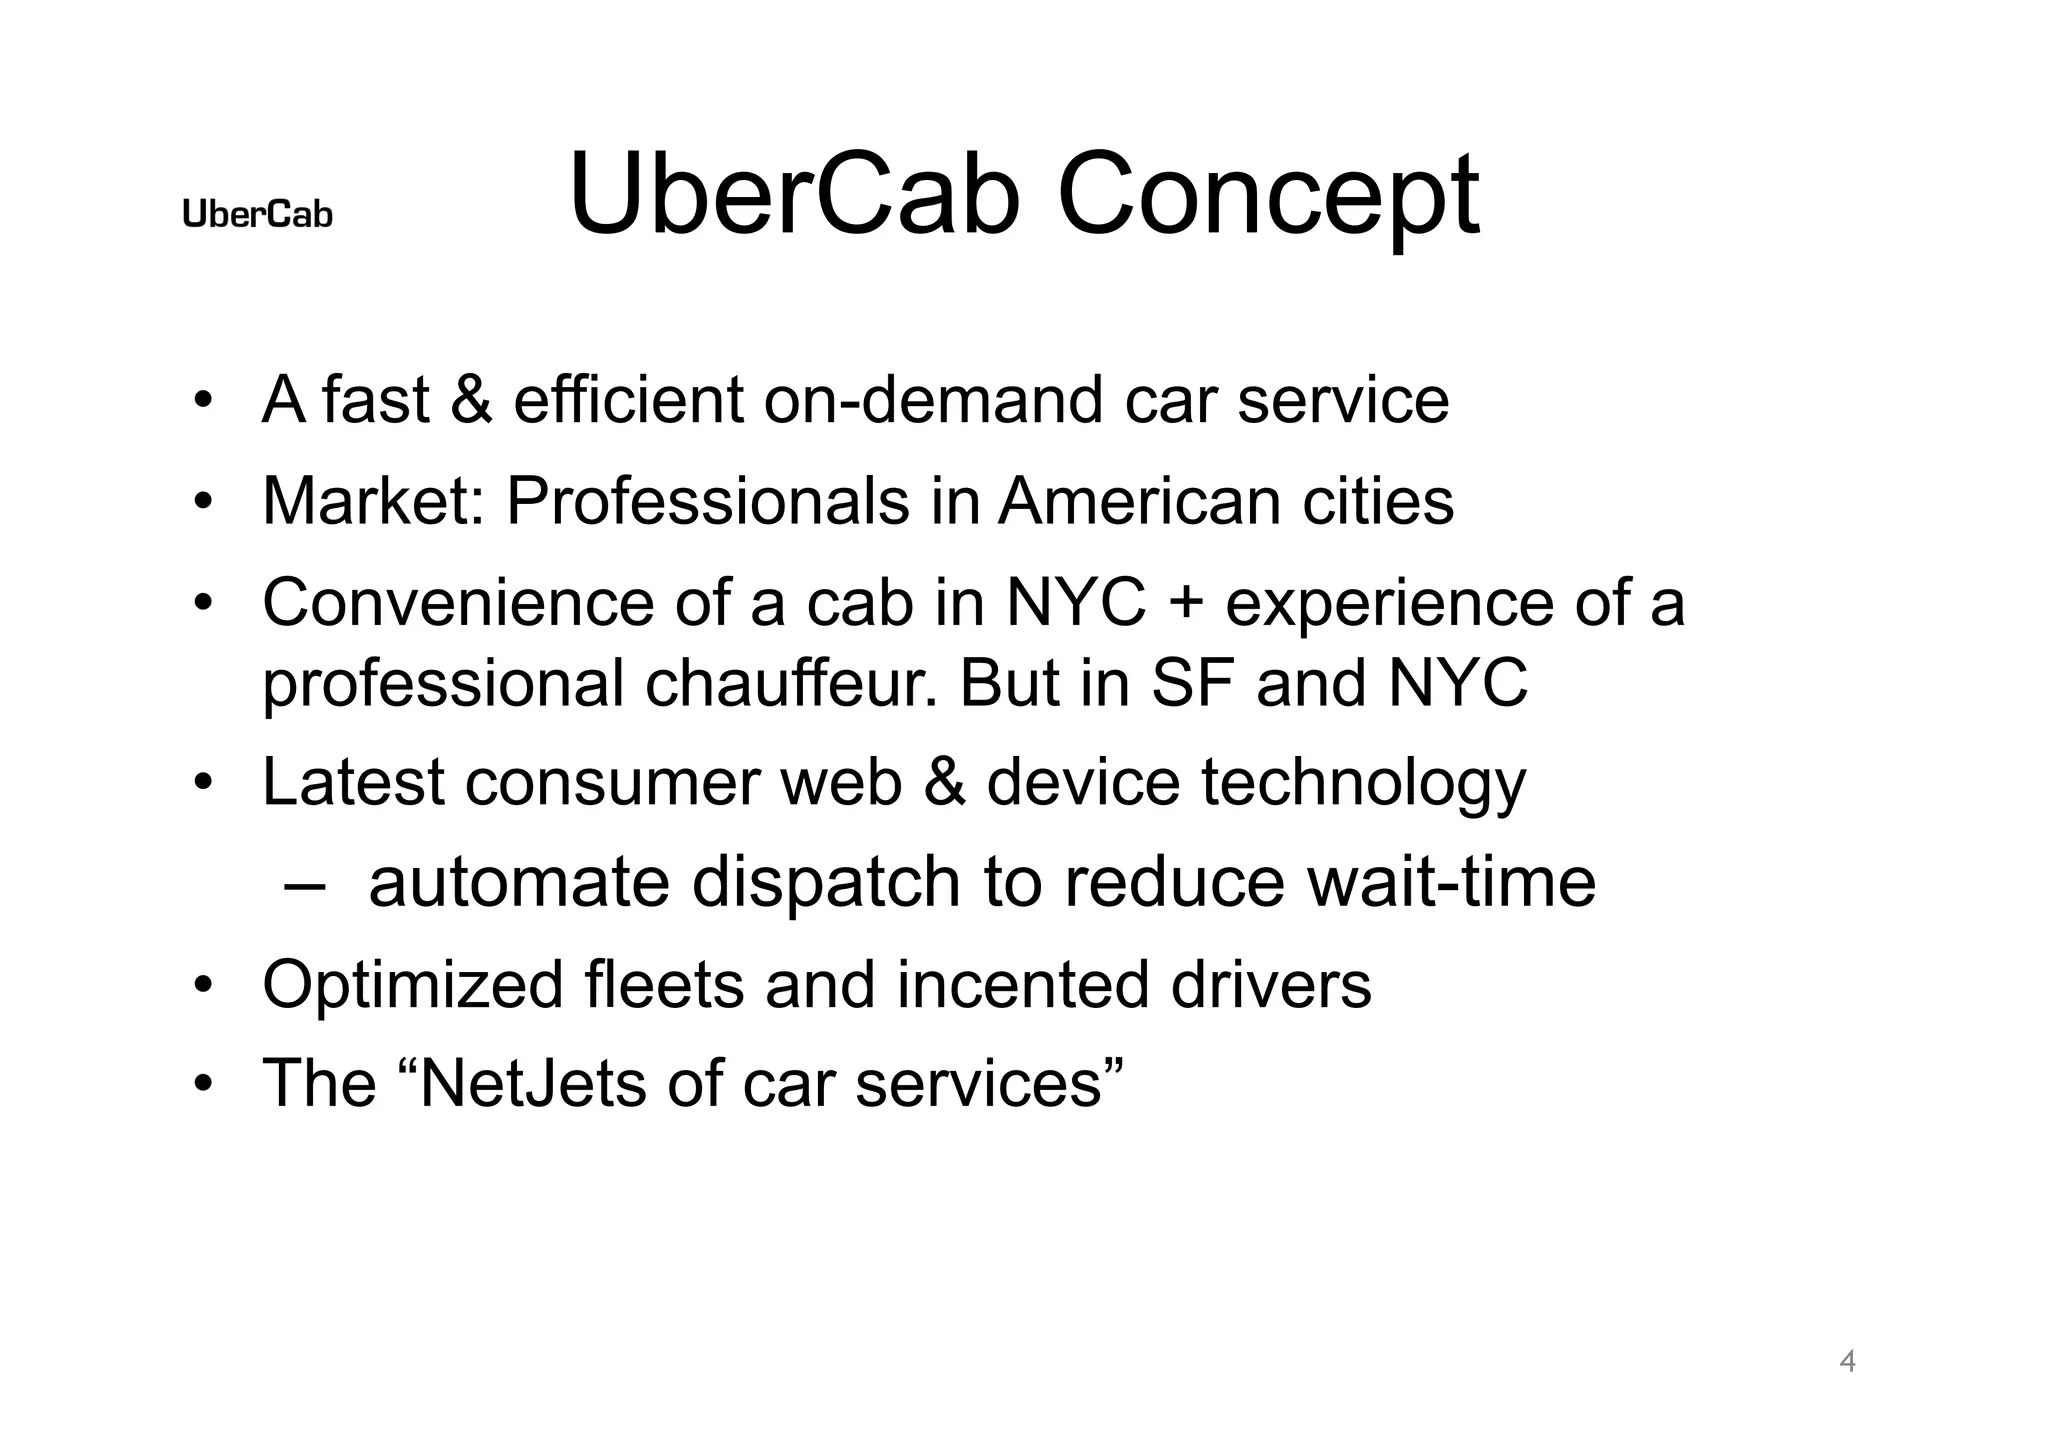
Slide 4 lays out the UberCab concept: on-demand, professional drivers, geo-aware dispatch, and optimized fleets. It balances customer-facing benefits (convenience, guaranteed pickup, luxury cars) with operational levers (automated dispatch, incented drivers). This dual focus — experience + operations — helps investors see not just demand but how the business will deliver reliably.

Founders can learn to craft product slides that explicitly map features to operational needs and market segments. Instead of listing features, Uber connects features to the customer problem and the unit economics that will enable scale (e.g., digital hail removes the need for medallions). That makes the product more investable because it answers both demand and delivery questions.

Key Takeaway: Describe the product by showing how features solve the customer's pain and how operations will sustain and scale the experience.
Go-to-Market & Business Model Design: Membership and guaranteed pickup

Go-to-Market & Business Model Design: Membership and guaranteed pickup

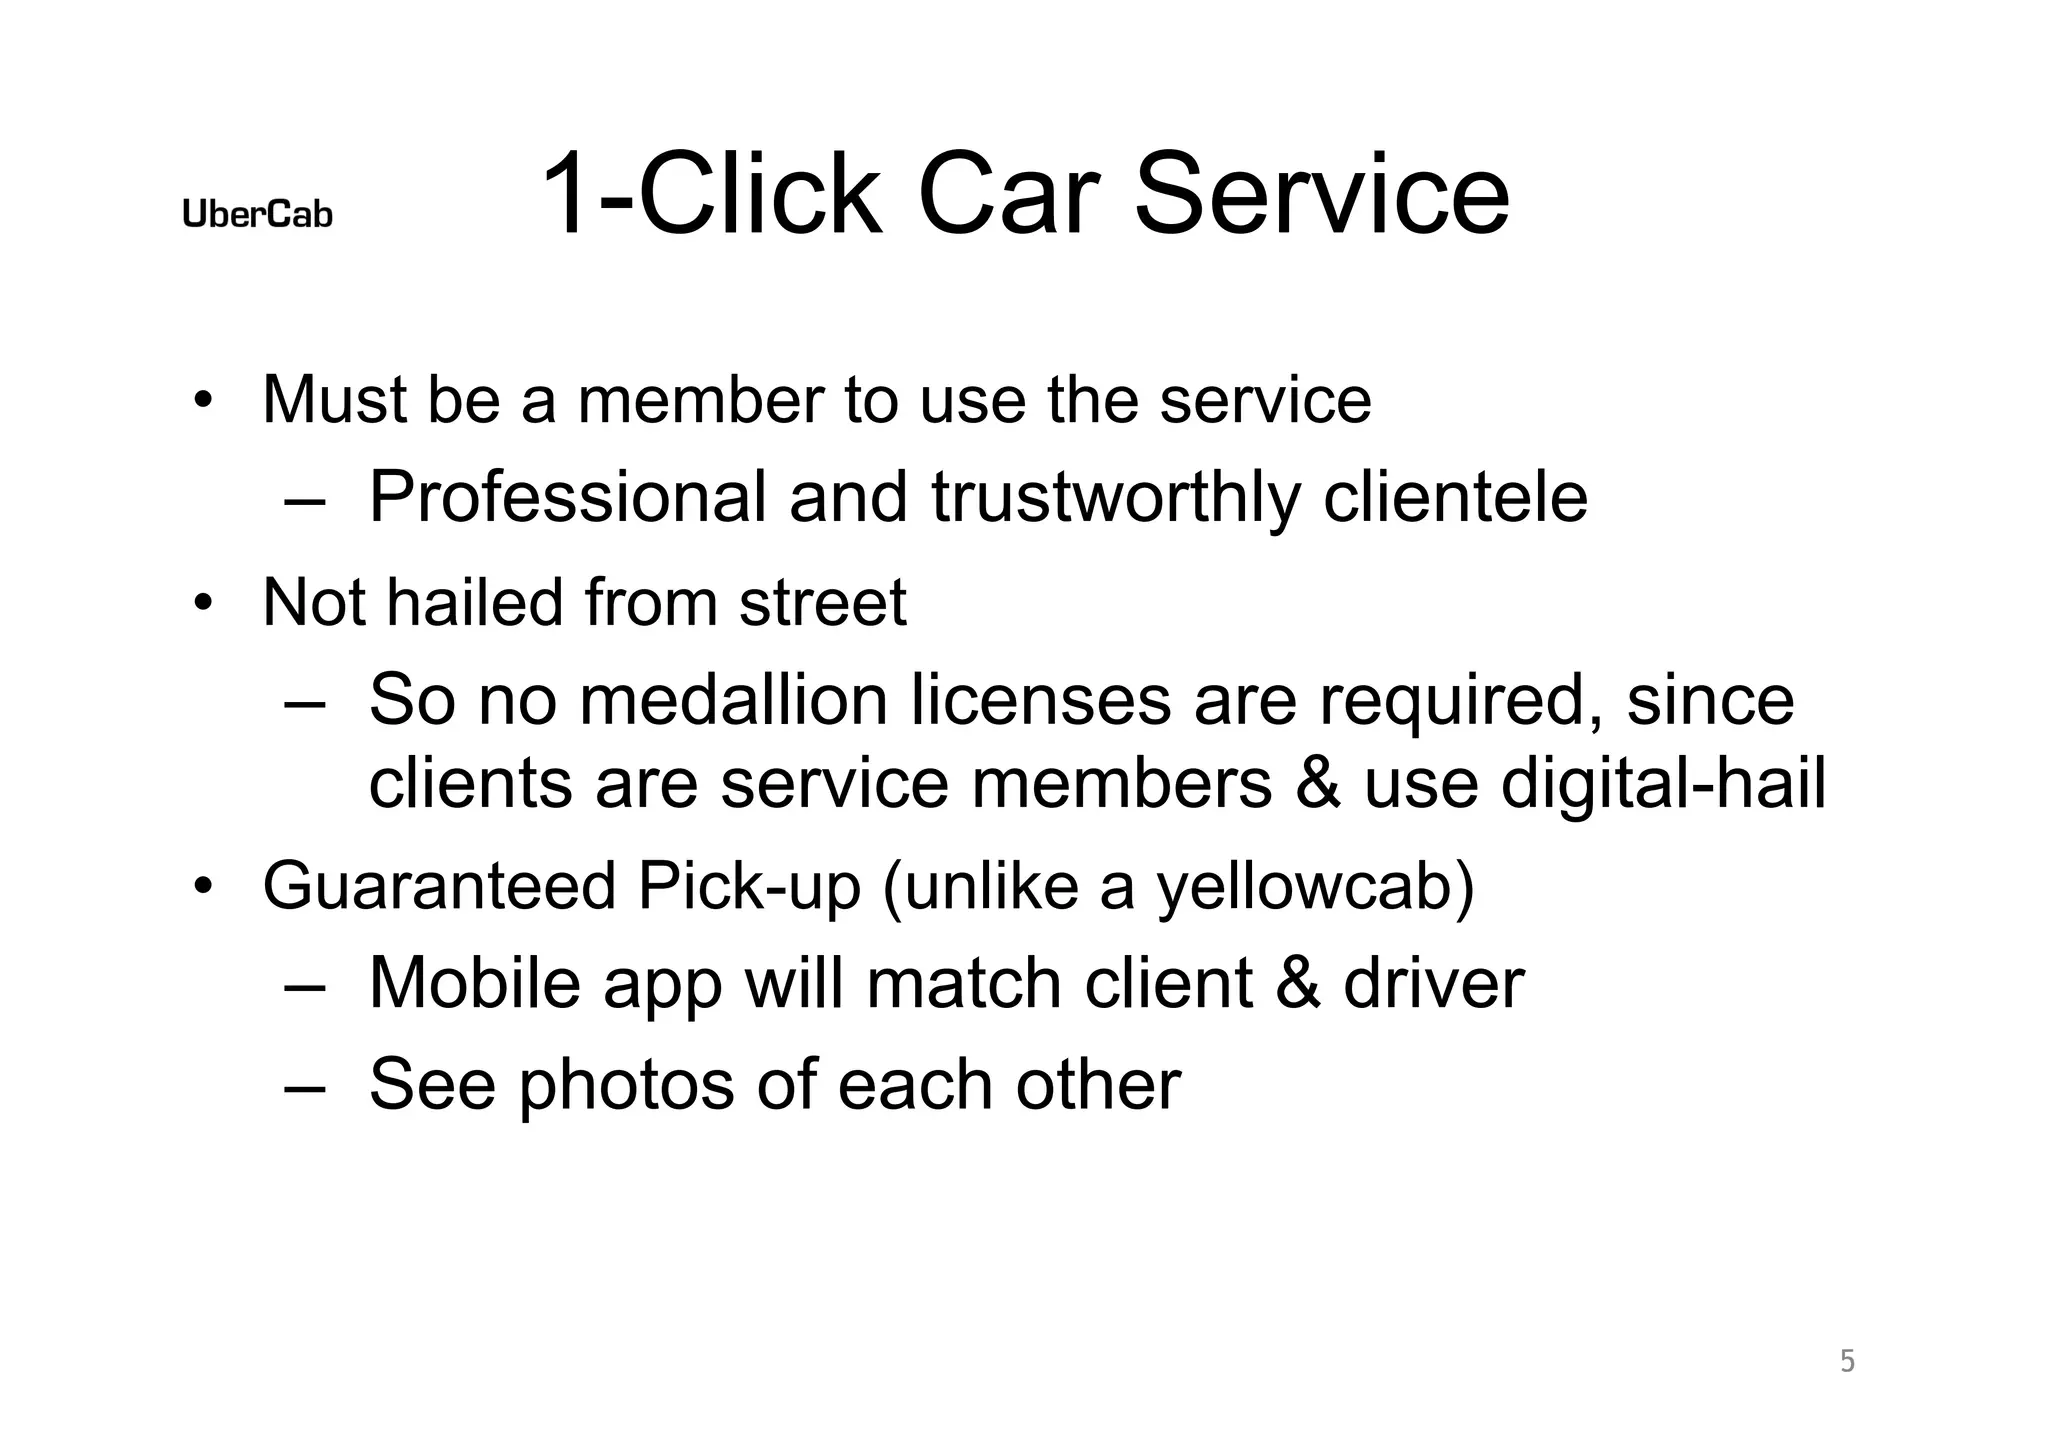
Slide 5 explains key go-to-market choices: members-only access, not hailed from the street (avoiding medallion constraints), and guaranteed pickups via mobile matching. These decisions simultaneously shape customer experience, regulatory exposure, and revenue mechanics. The membership model signals higher ARPU, curated clientele, and control over service quality — all persuasive to seed investors focused on defensibility.

This slide teaches founders to surface early business-model tradeoffs clearly. Pick rules (membership vs. marketplace access, pricing for immediacy, etc.) and explain how they move metrics (acquisition, retention, pricing power). The deck uses business-model choices to show a path to differentiation and unit-economics improvement.

Key Takeaway: Use explicit business-model rules (membership, guaranteed service) to demonstrate how you’ll capture value, control quality, and minimize regulatory friction.
Product Distribution: Mobile apps and multi-channel access

Product Distribution: Mobile apps and multi-channel access

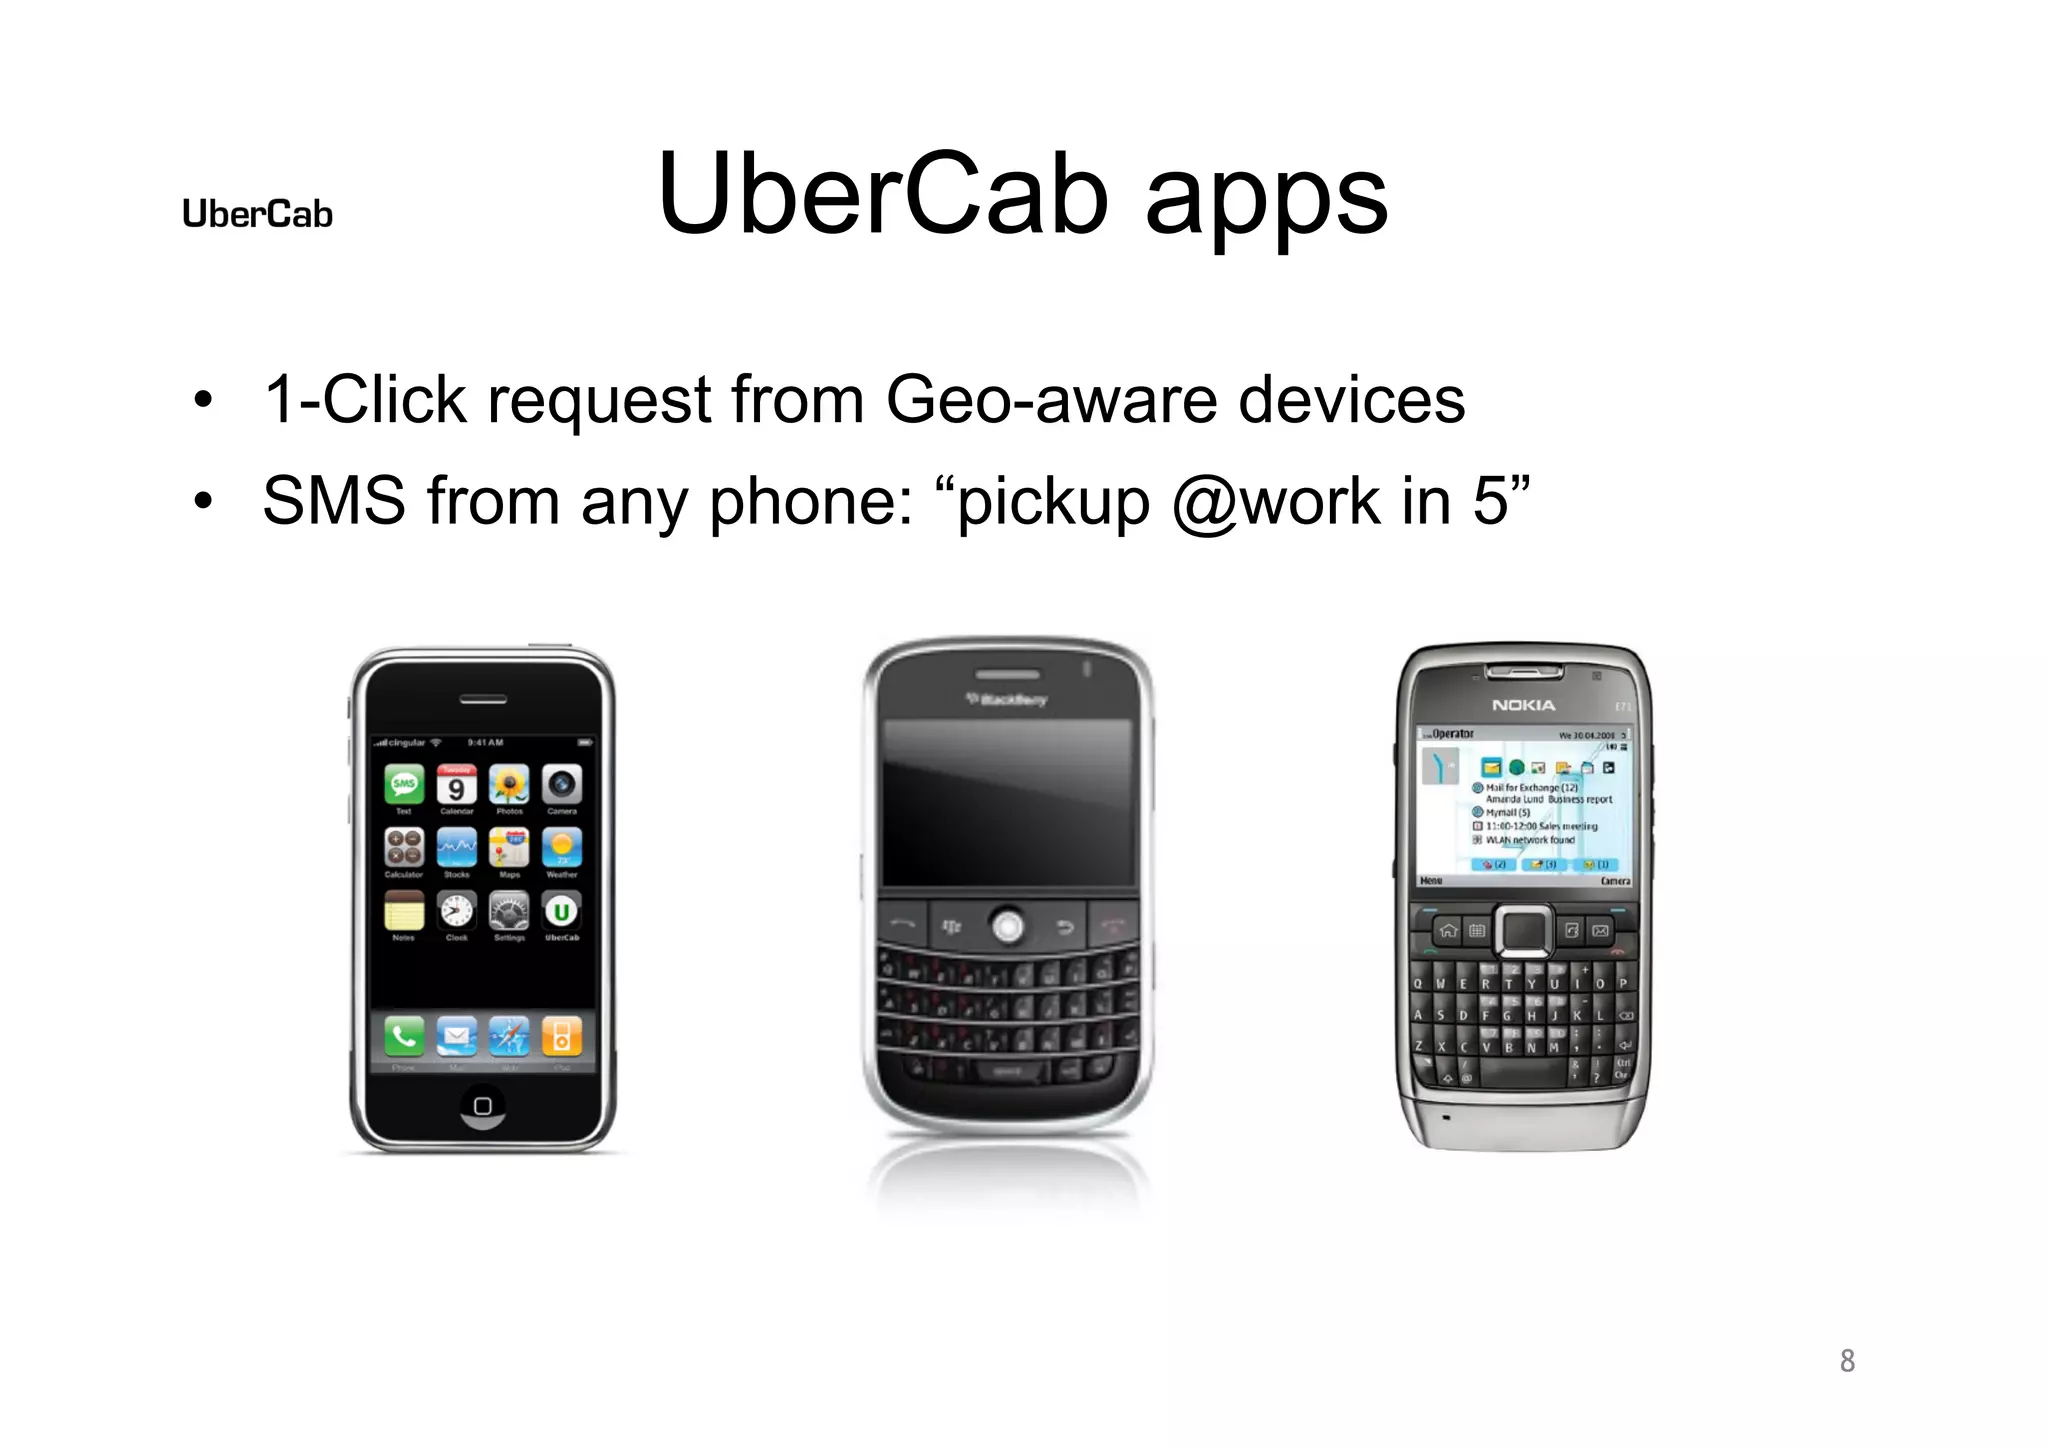
Slide 8 highlights the multi-device strategy — iPhone, BlackBerry, SMS — to make ordering accessible from any phone. In 2008 this signaled pragmatic product-market fit thinking: reach the devices your target customers already use. The slide also implies a low-friction order mechanism (1-click requests) and alternative SMS flow for non-smartphones, reducing dependence on any single platform.

Founders should ensure distribution plans are device- and user-behavior-informed. Describe not just the app but how customers will actually summon the product across the devices they carry. Early cross-platform coverage reduces friction and accelerates adoption in enterprise and consumer segments alike.

Key Takeaway: Design distribution to match user behavior across devices; support the simplest, lowest-friction paths first (e.g., SMS or single-click) to drive adoption.
Technology & Ops: Demand forecasting and geo-aware dispatch

Technology & Ops: Demand forecasting and geo-aware dispatch

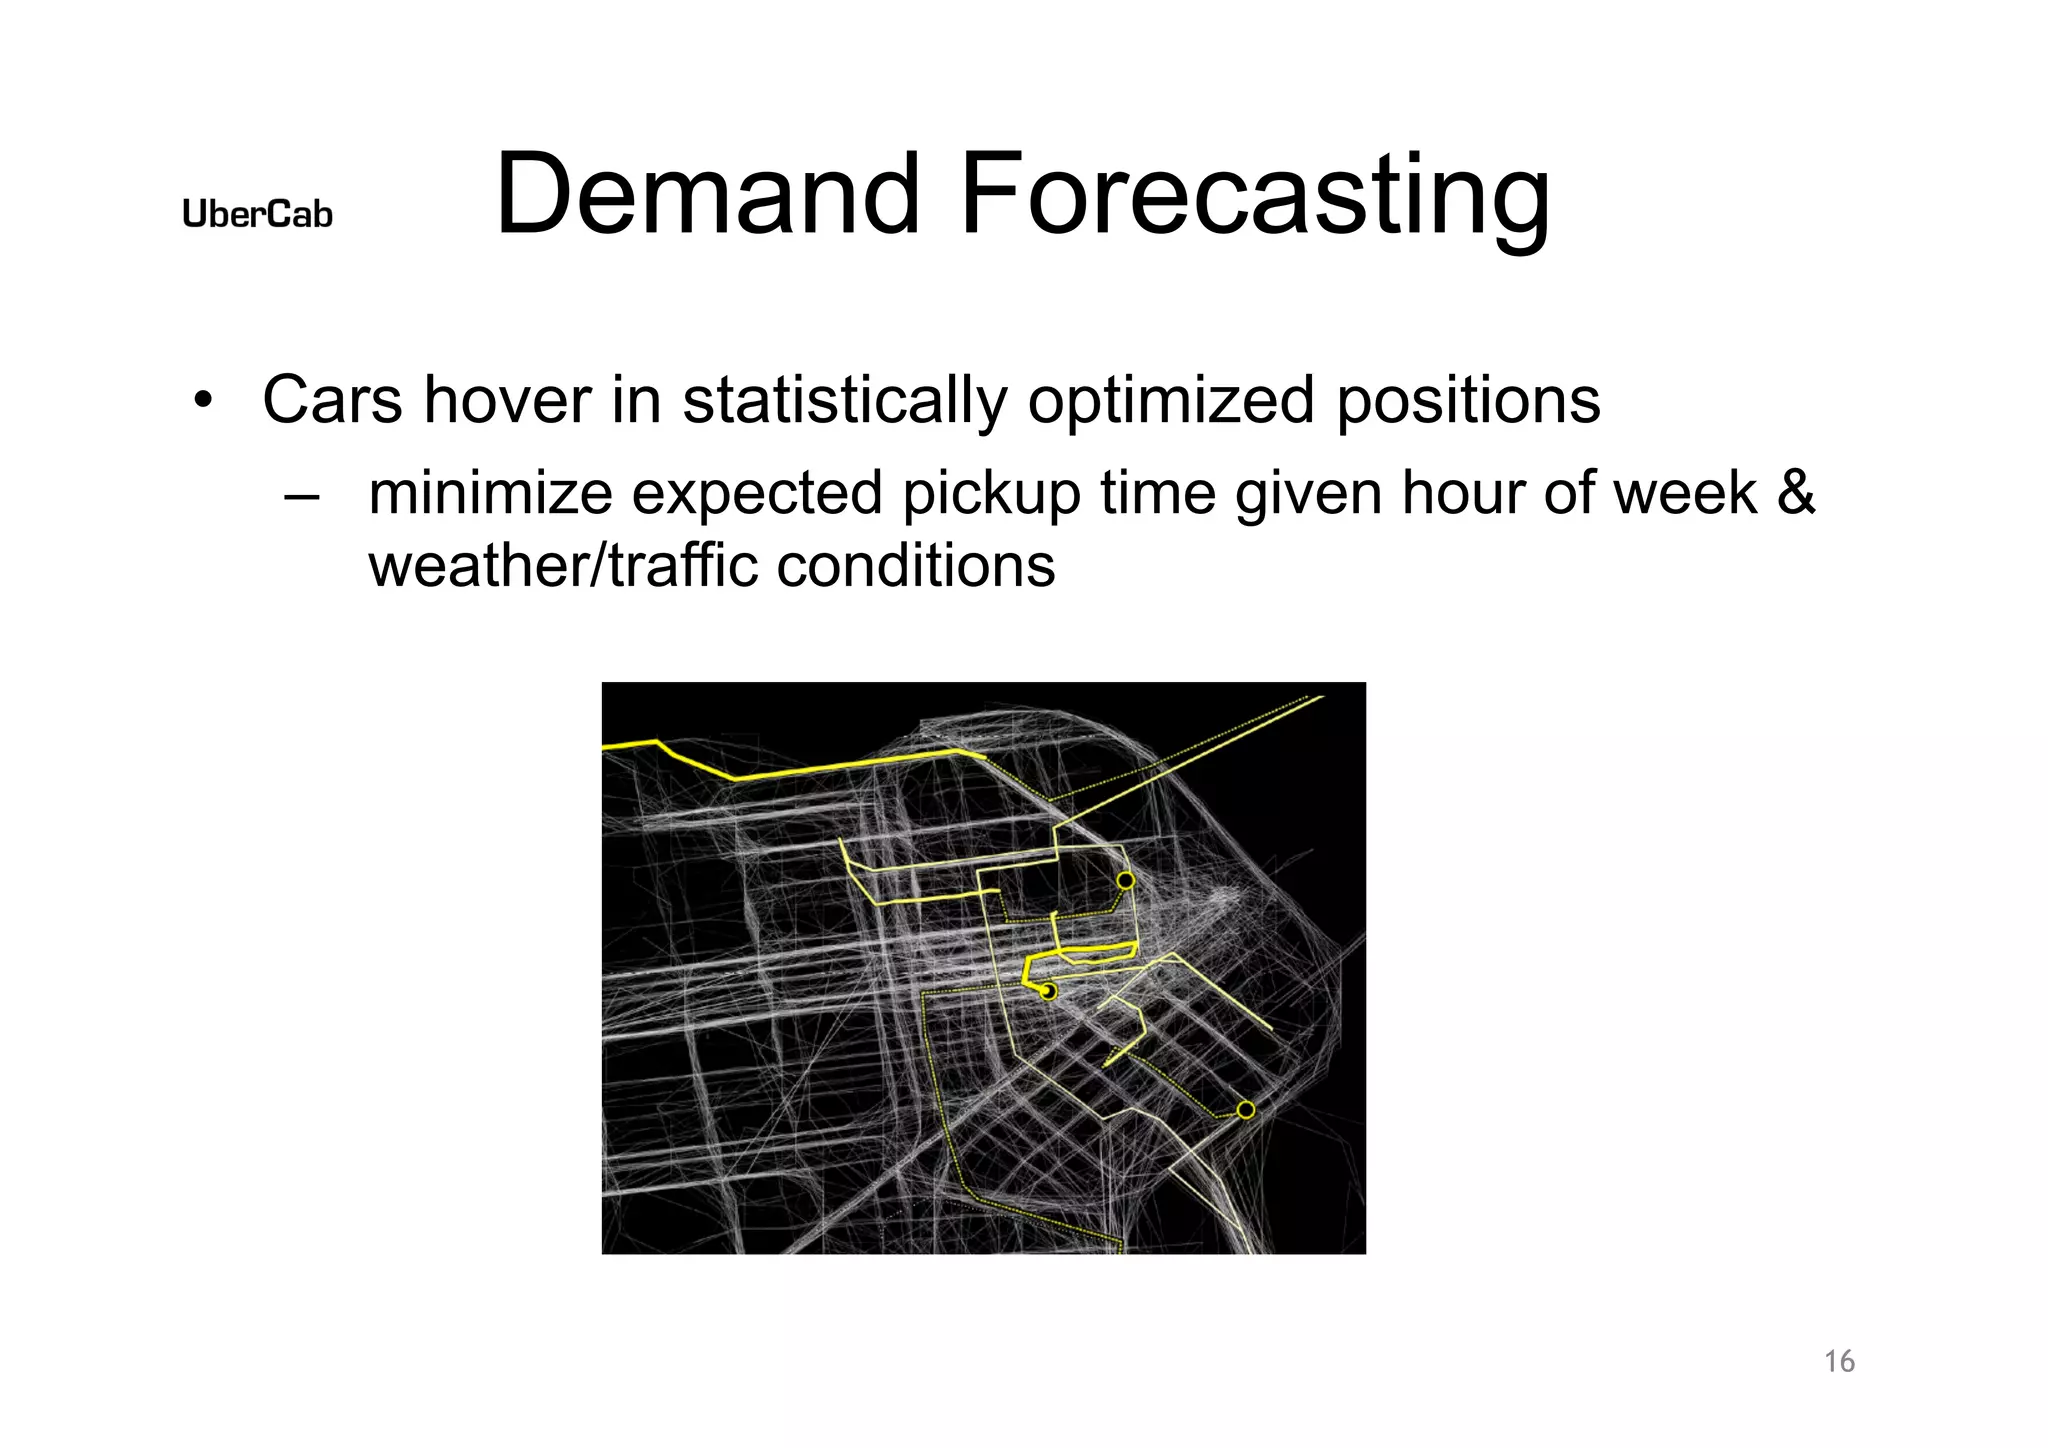
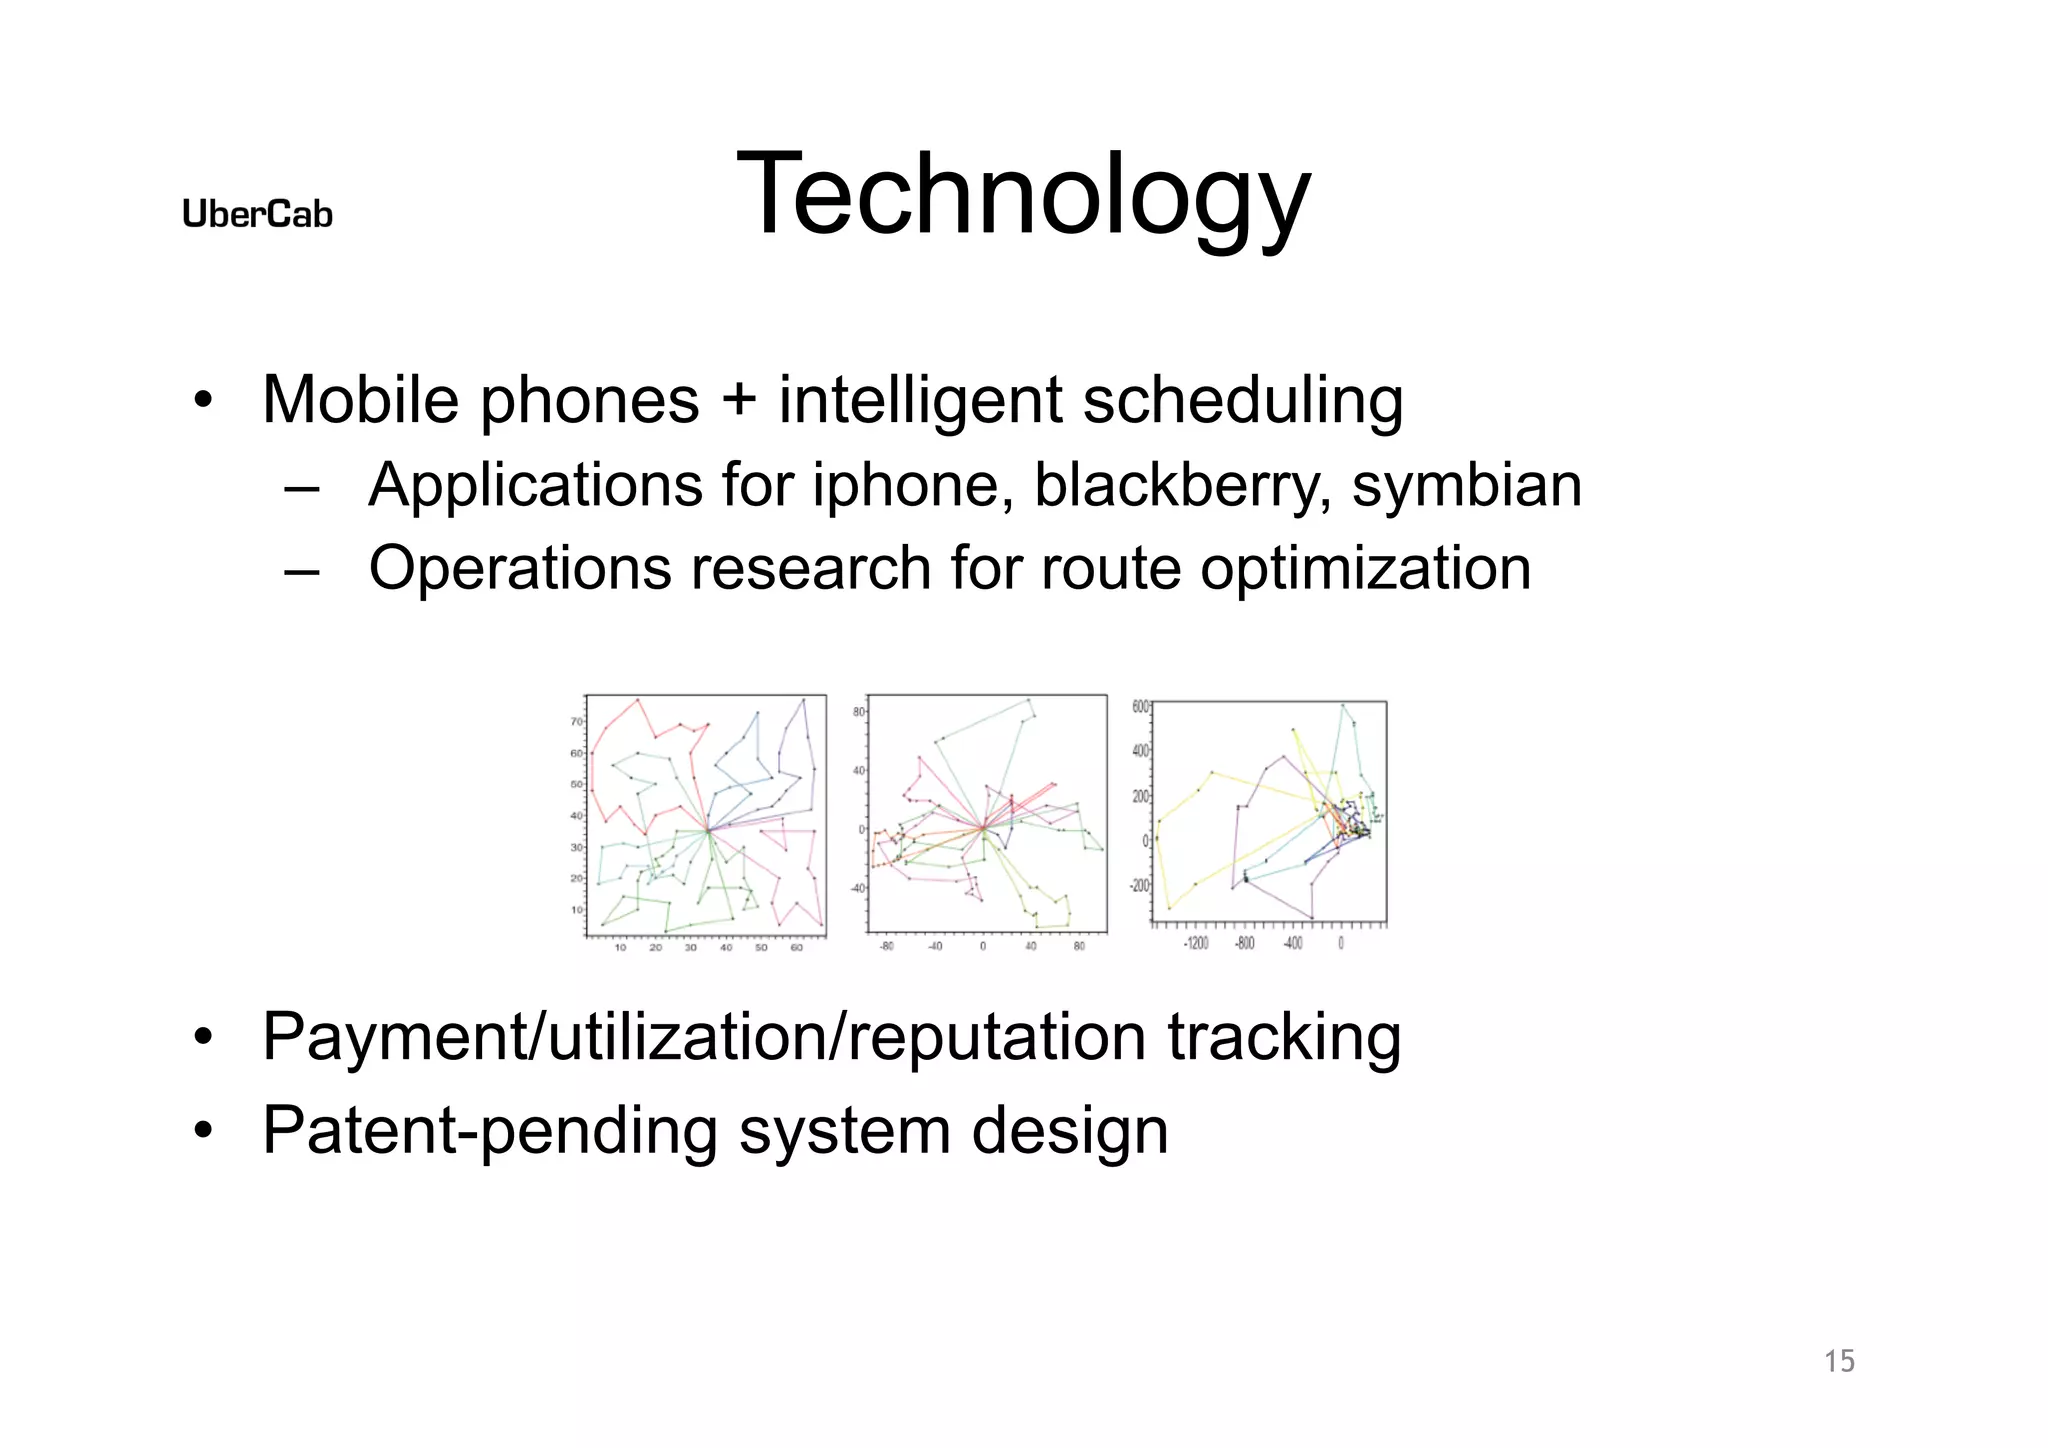
Slides 15 and 16 dig into the technical moat: intelligent scheduling, operations research, demand forecasting, and geo-aware auto-dispatch. These slides move beyond the interface to show the core engine that will reduce wait times and improve fleet utilization. Presenting route-optimization visuals and the concept of cars 'hovering' in statistically optimized positions signals that product scale depends on real engineering, not just brand or marketing.

For founders, this is a reminder to illustrate the defensible technical elements of your business. Highlight the algorithms or data advantages (demand forecasting, routing optimization, reputation systems) that materially change unit economics. Investors fund tech that is hard to replicate and that meaningfully improves customer experience or margins.

Key Takeaway: Demonstrate the technical (algorithmic/data) advantages that will improve unit economics and create a defensible moat as you scale.
Progress & Ask: Early traction and clear next steps

Progress & Ask: Early traction and clear next steps

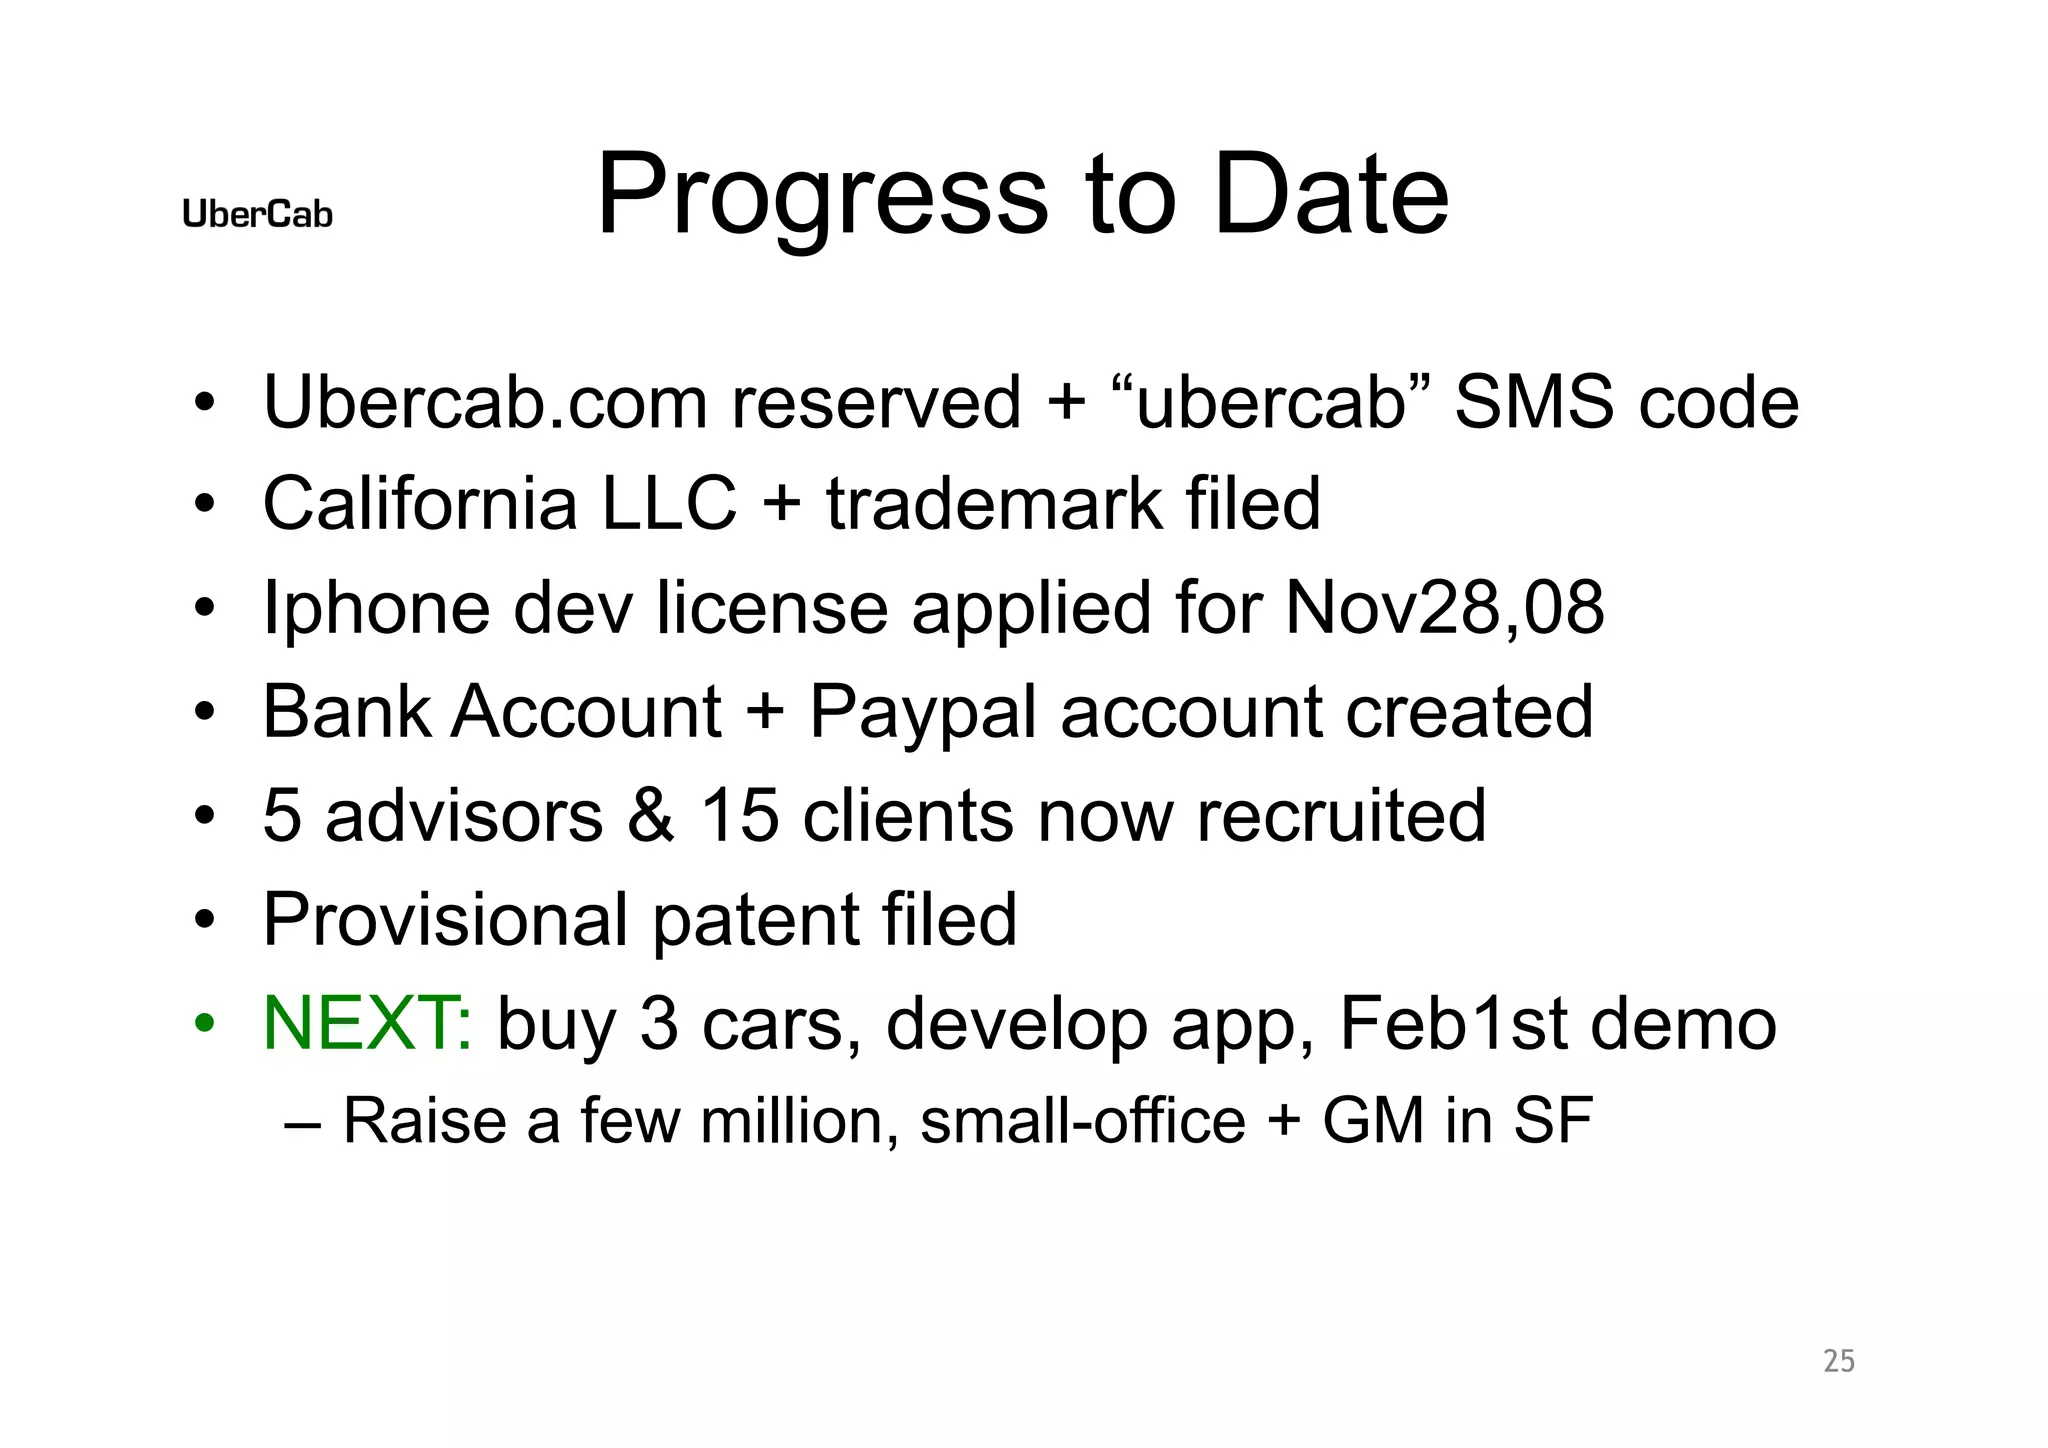
Slide 25 closes with practical milestones: domain secured, legal structure in place, advisors and initial clients recruited, provisional patent, and a specific next step to buy cars, develop the app, and show a demo. The team frames a concrete, short-term plan and a fundraising target. That grounding in execution — rather than vague growth aspirations — makes the seed ask credible.

Founders should emulate this by ending decks with tangible accomplishments and a concise 'next steps' funding use case. Investors want to know what their capital will buy and how soon they’ll see a demo or measurable milestones; this slide provides both clarity and accountability.

Key Takeaway: Close with concrete traction, specific near-term milestones, and a clear use of funds so investors know exactly what success looks like in the next quarter.

Conclusion: Key Lessons

This deck succeeds because it pairs a crisp customer value proposition with quantified market failure, operationally grounded product design, and a defensible technical approach. It balances aspirational positioning with concrete economics, distribution strategies, and a short-term execution plan. For founders creating pitch decks: lead with a one-line value prop, quantify the incumbent problem, show how your product and operations fix it, highlight technical advantages that create a moat, and finish with real traction and a specific use of funds. Clarity, evidence, and a credible roadmap are far more persuasive at seed stage than lofty market projections alone.

Full Deck Analysis

11 sections

Overview

Company: Uber (originally UberCab)
Round: Seed ($200K)
Year: 2008
Outcome: IPO at $75B valuation (2019)
Deck Length: 25 slides

Executive Summary

The Uber seed pitch deck from 2008 presents a compelling vision for disrupting the fragmented taxi and car service market through mobile technology and algorithmic dispatch. The founders identified a clear structural problem (medallion system inefficiency, aging technology, poor customer experience) and proposed a premium, app-based solution targeting affluent professionals in major US cities. What makes this deck notable is its combination of specific market data (medallion prices, market segmentation, city-by-city TAM), technical sophistication (predictive positioning, route optimization, multi-platform support), and realistic financial projections that proved massively conservative relative to Uber’s actual trajectory. The deck demonstrates founders who understood both the regulatory landscape and the enabling technology (smartphone adoption) that would make their business model viable.

Problem Statement

Core Problem (Slides 2-3): The taxi and car service industry in 2008 was characterized by:

  1. Technological inefficiency:
    • Radio dispatch with no 2-way communication
    • No GPS coordination between drivers and customers
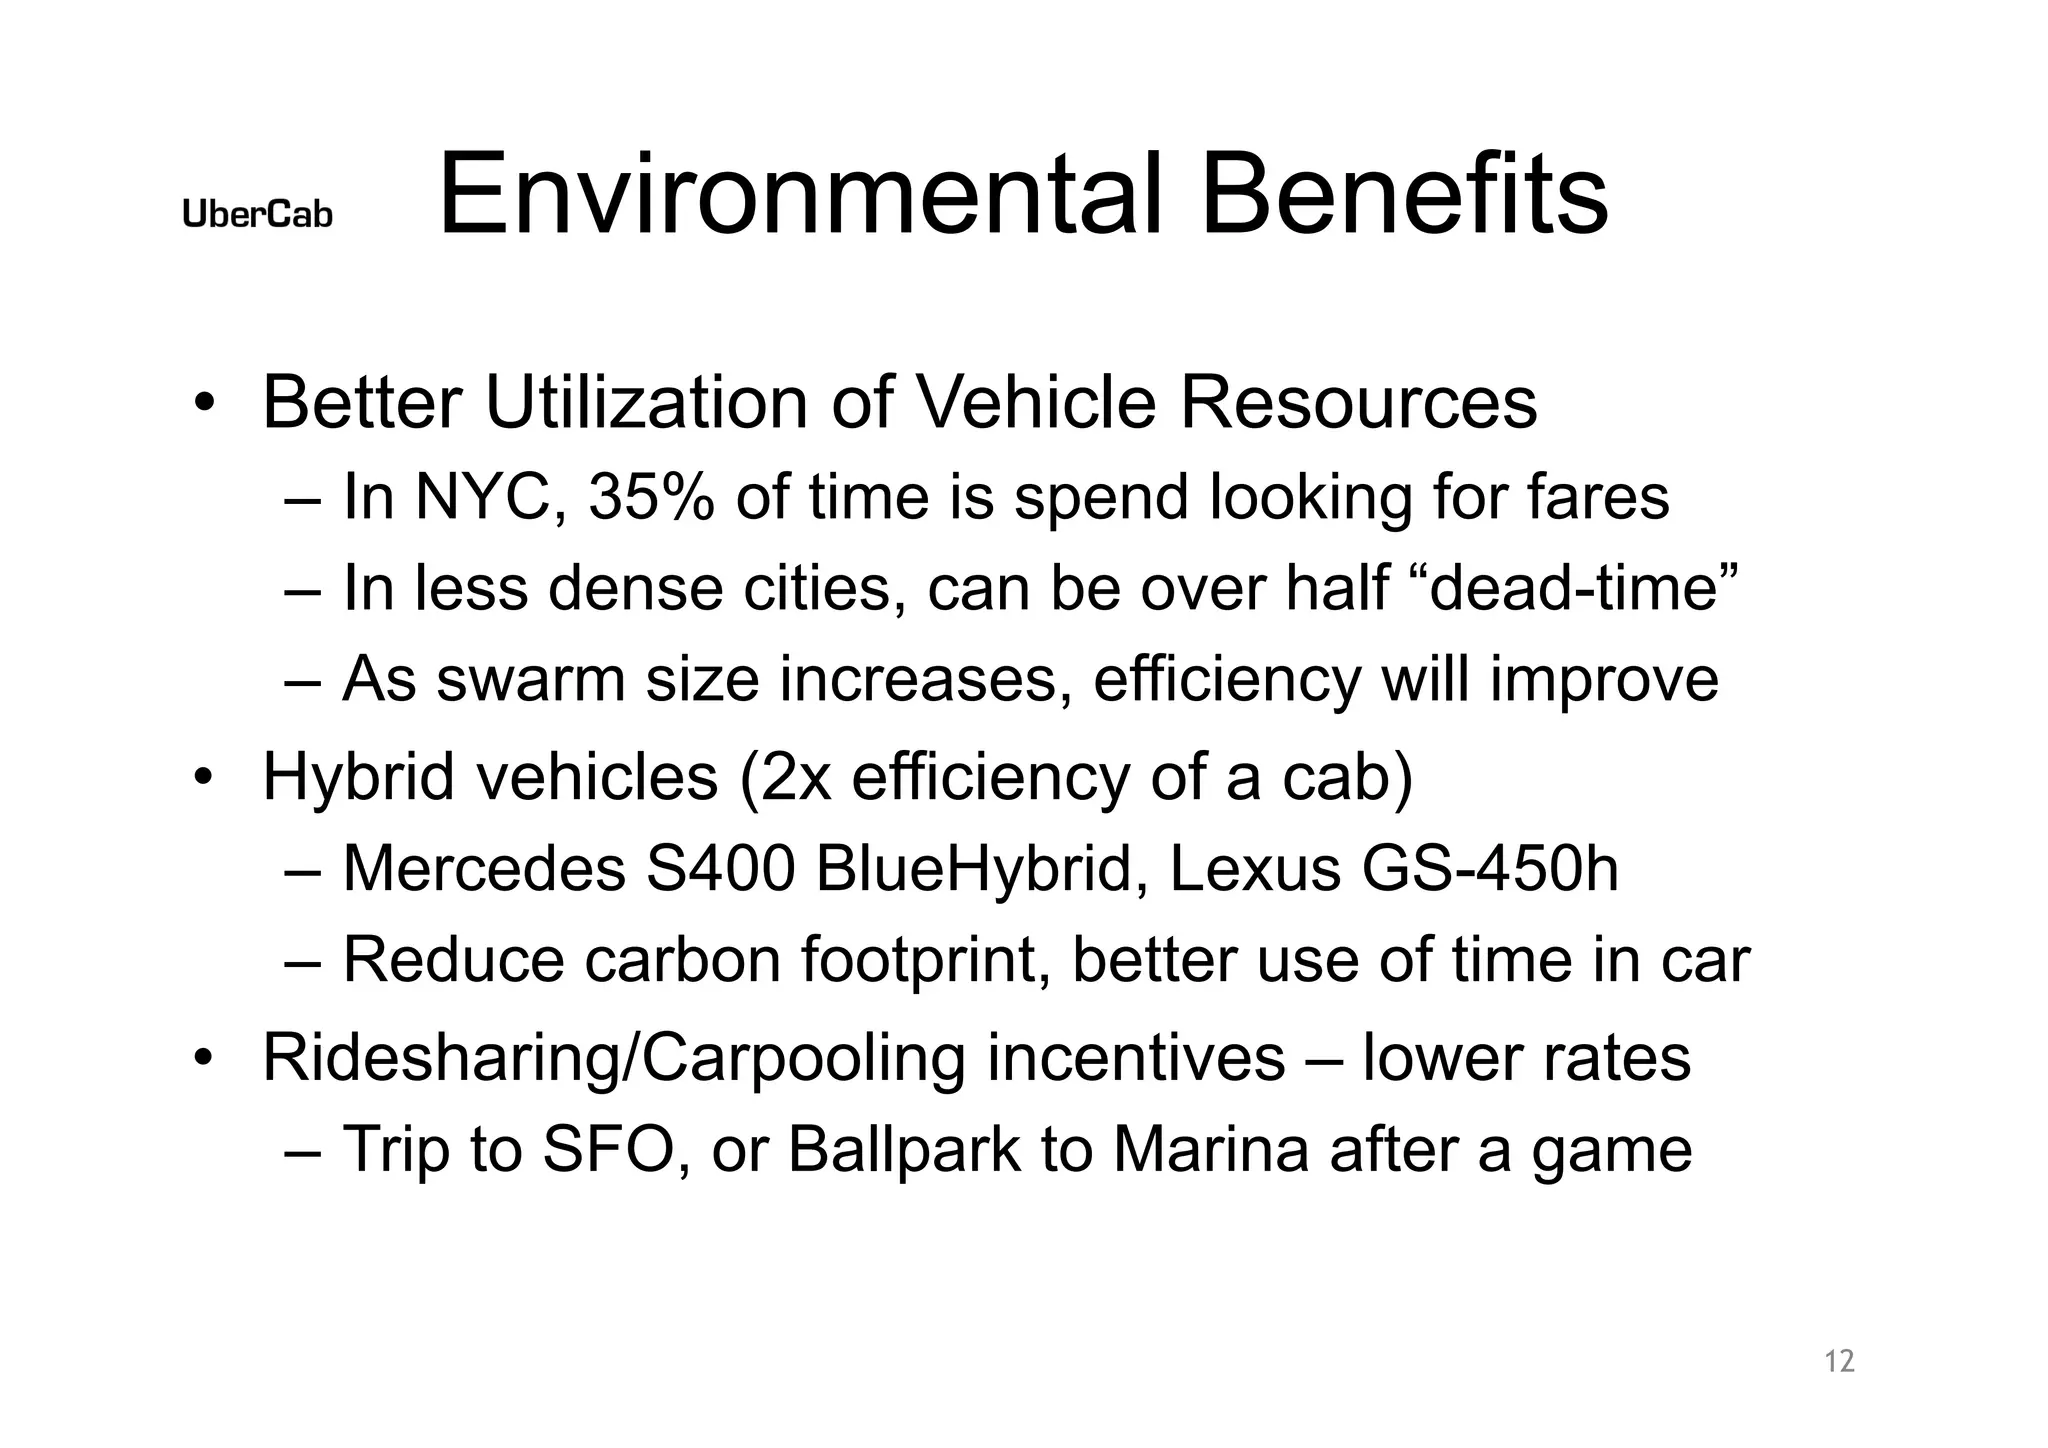
    • Significant “dead-time” (empty vehicles searching for fares)
    • In NYC: 35% of taxi time spent looking for fares
    • In less dense cities: over 50% dead-time
  2. Regulatory barriers (Medallion System):
    • NYC medallion prices: ~$700,000 (up from ~$100,000 in 1977)
    • Driver annual salary: $31,000 (vs. $500K medallion cost)
    • Creates misaligned incentives and poor service quality
    • Reduces competition and innovation
  3. Customer pain points:
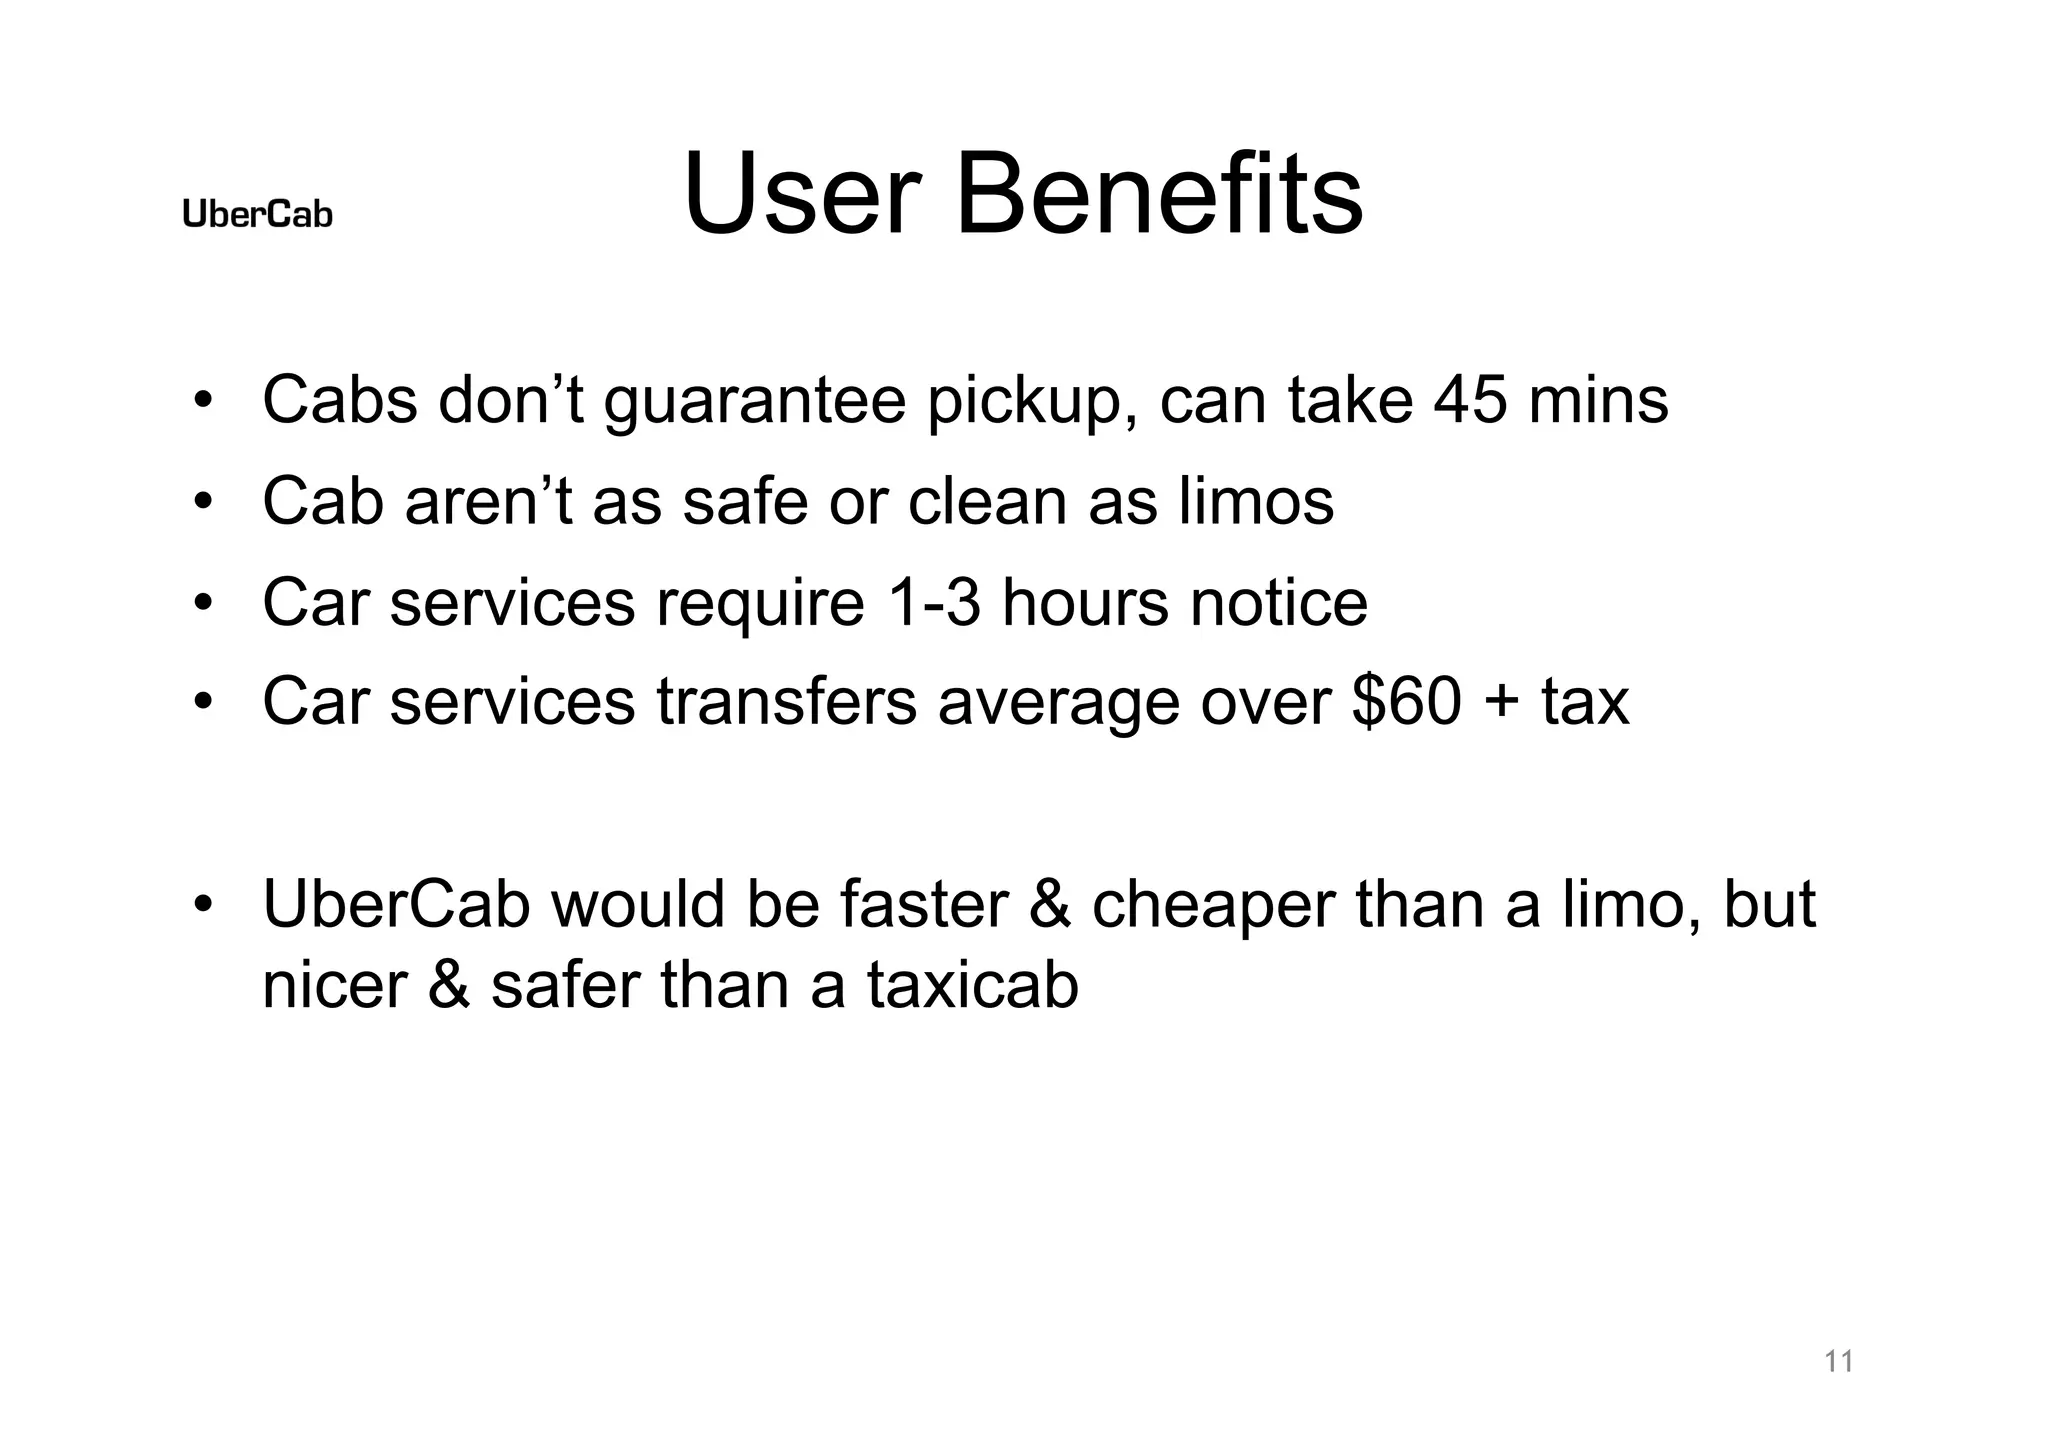
    • Yellow cabs: No guaranteed pickup, can take 45 minutes
    • Traditional car services: Require 1-3 hours advance notice
    • Traditional car services: Average cost $60+ per transfer
    • No safety/cleanliness guarantees
    • No real-time tracking or accountability

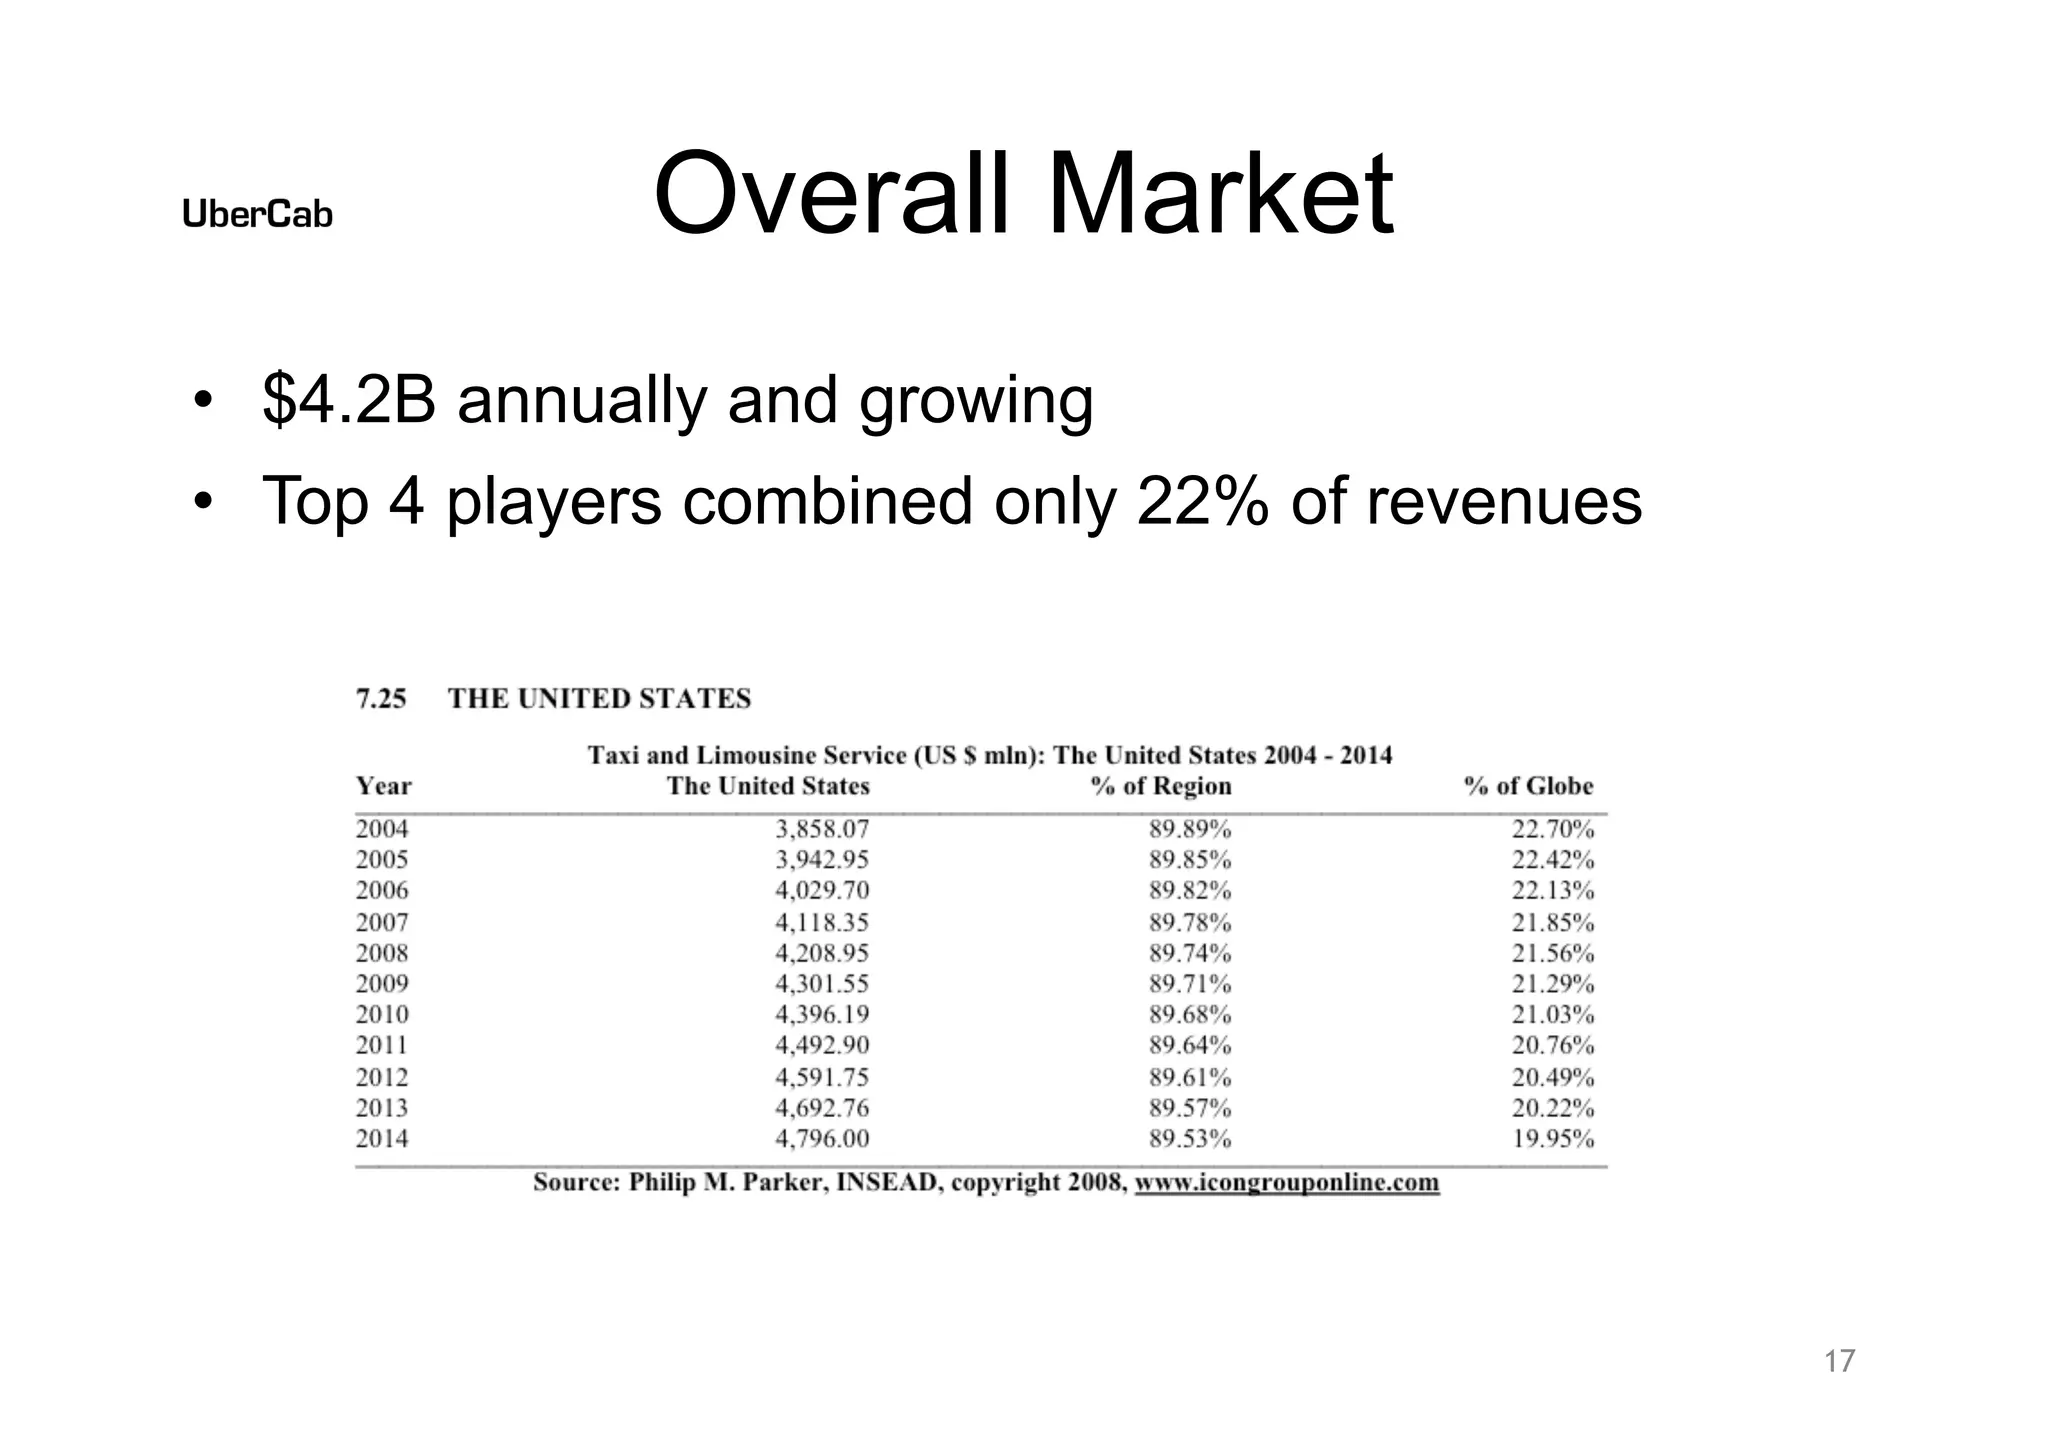
Market Context: The deck positions this as a $4.2B annual market (2008) that is highly fragmented (top 4 players = only 22% of revenues), growing slowly (~2.4% CAGR), and ripe for disruption.

Solution

Core Value Proposition (Slides 4-7): “Faster & cheaper than a limo, but nicer & safer than a taxicab”

Product Features:

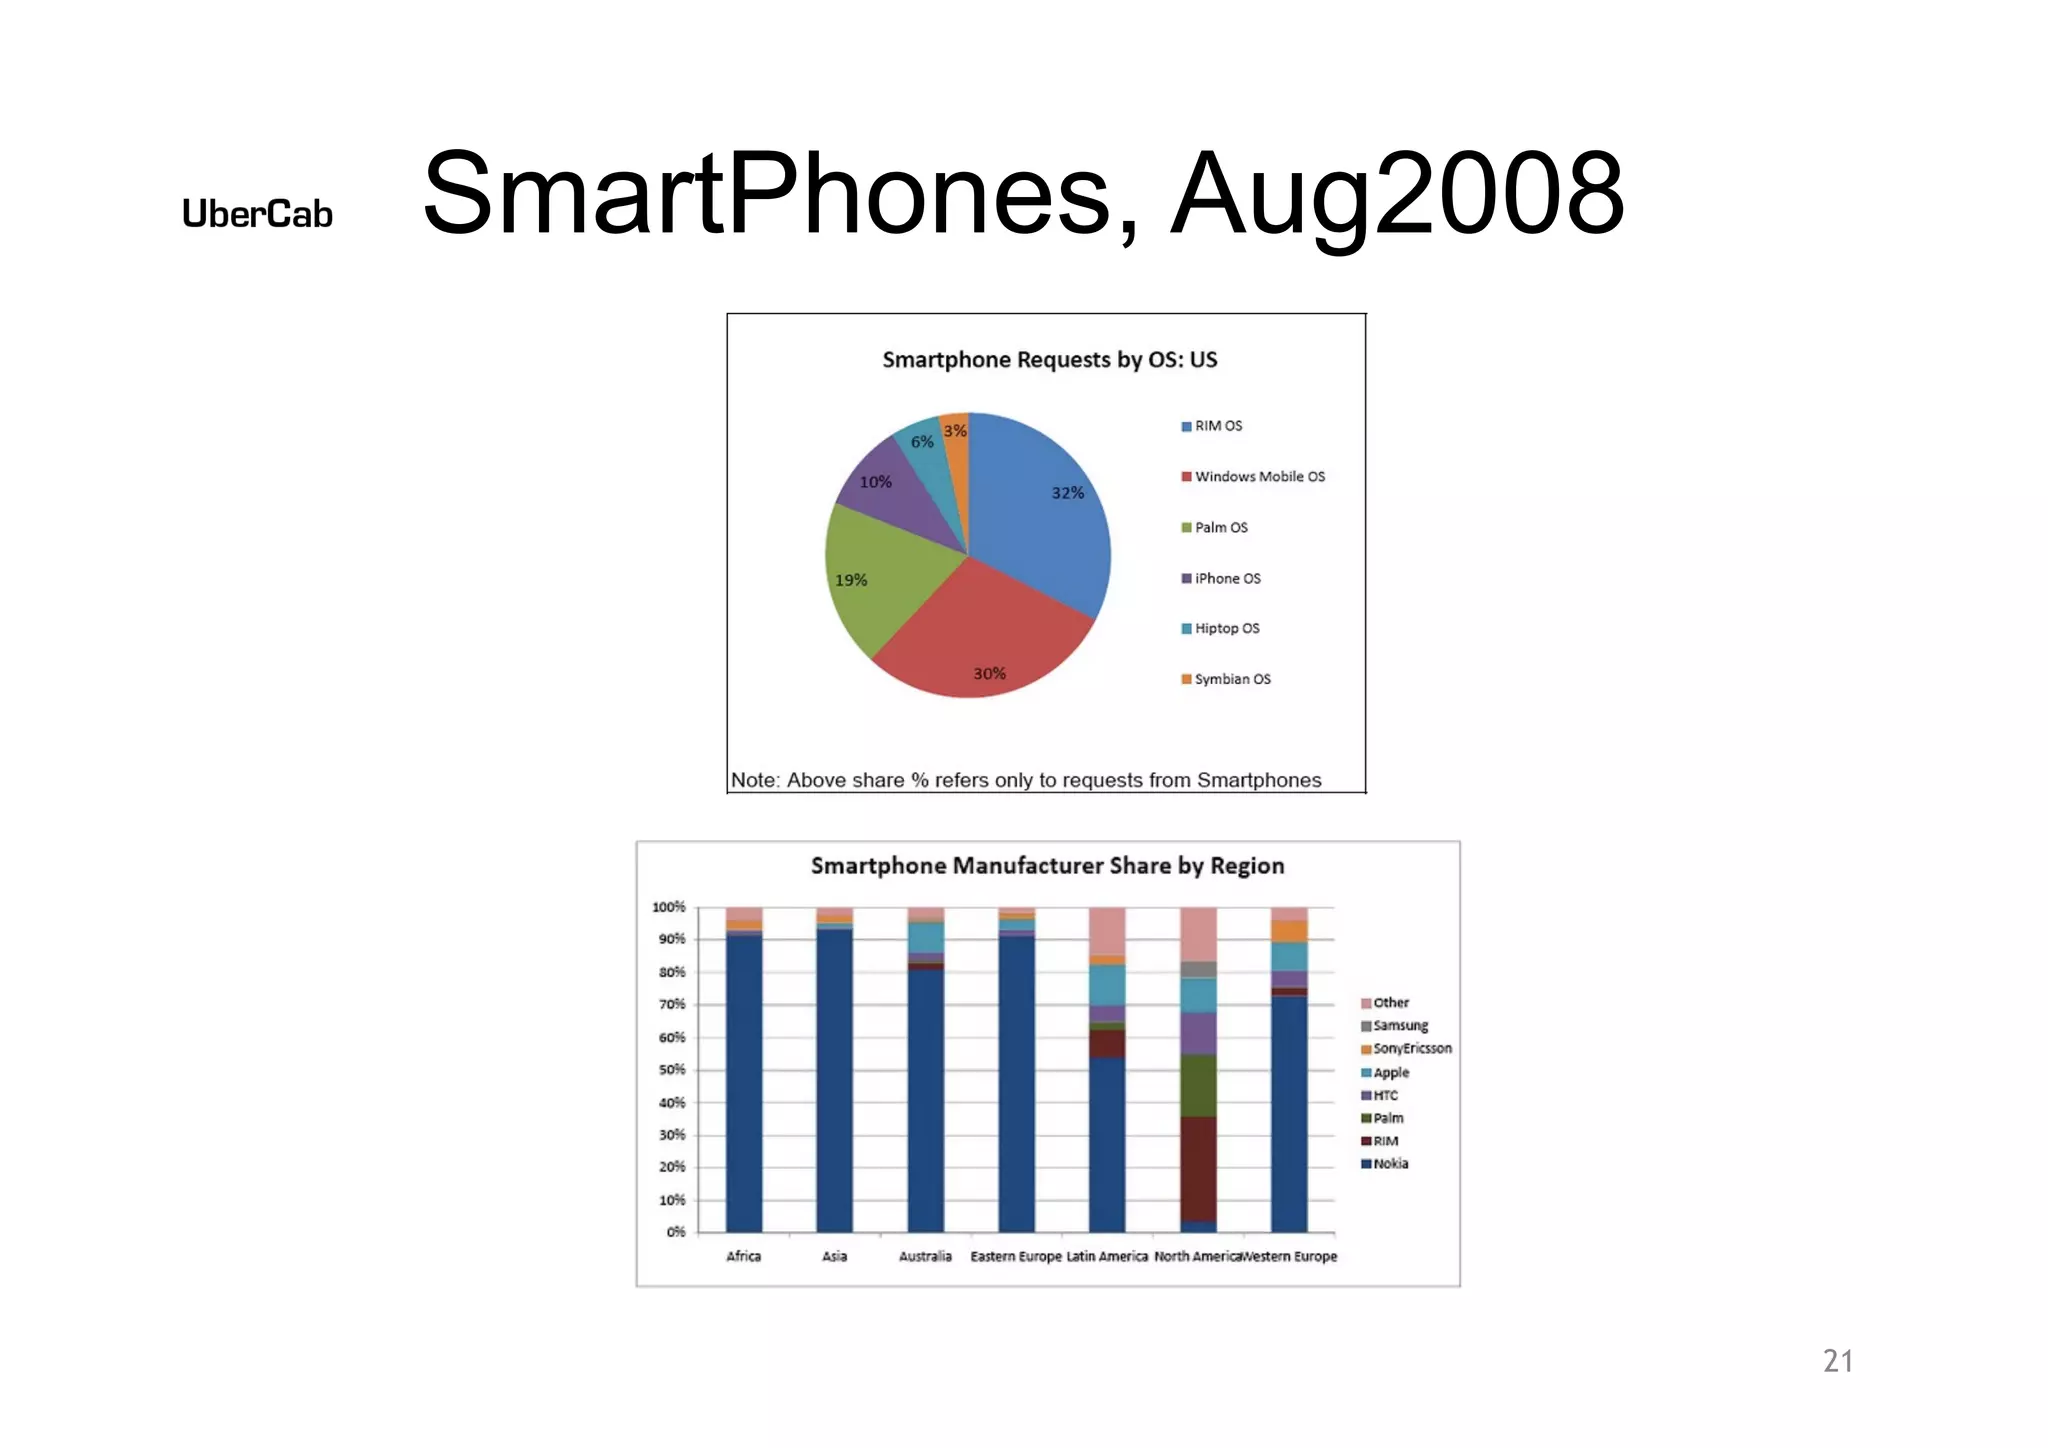
  • 1-click booking via mobile app (iPhone, BlackBerry, Symbian) or SMS
  • Guaranteed pickup with 5-minute response time promise
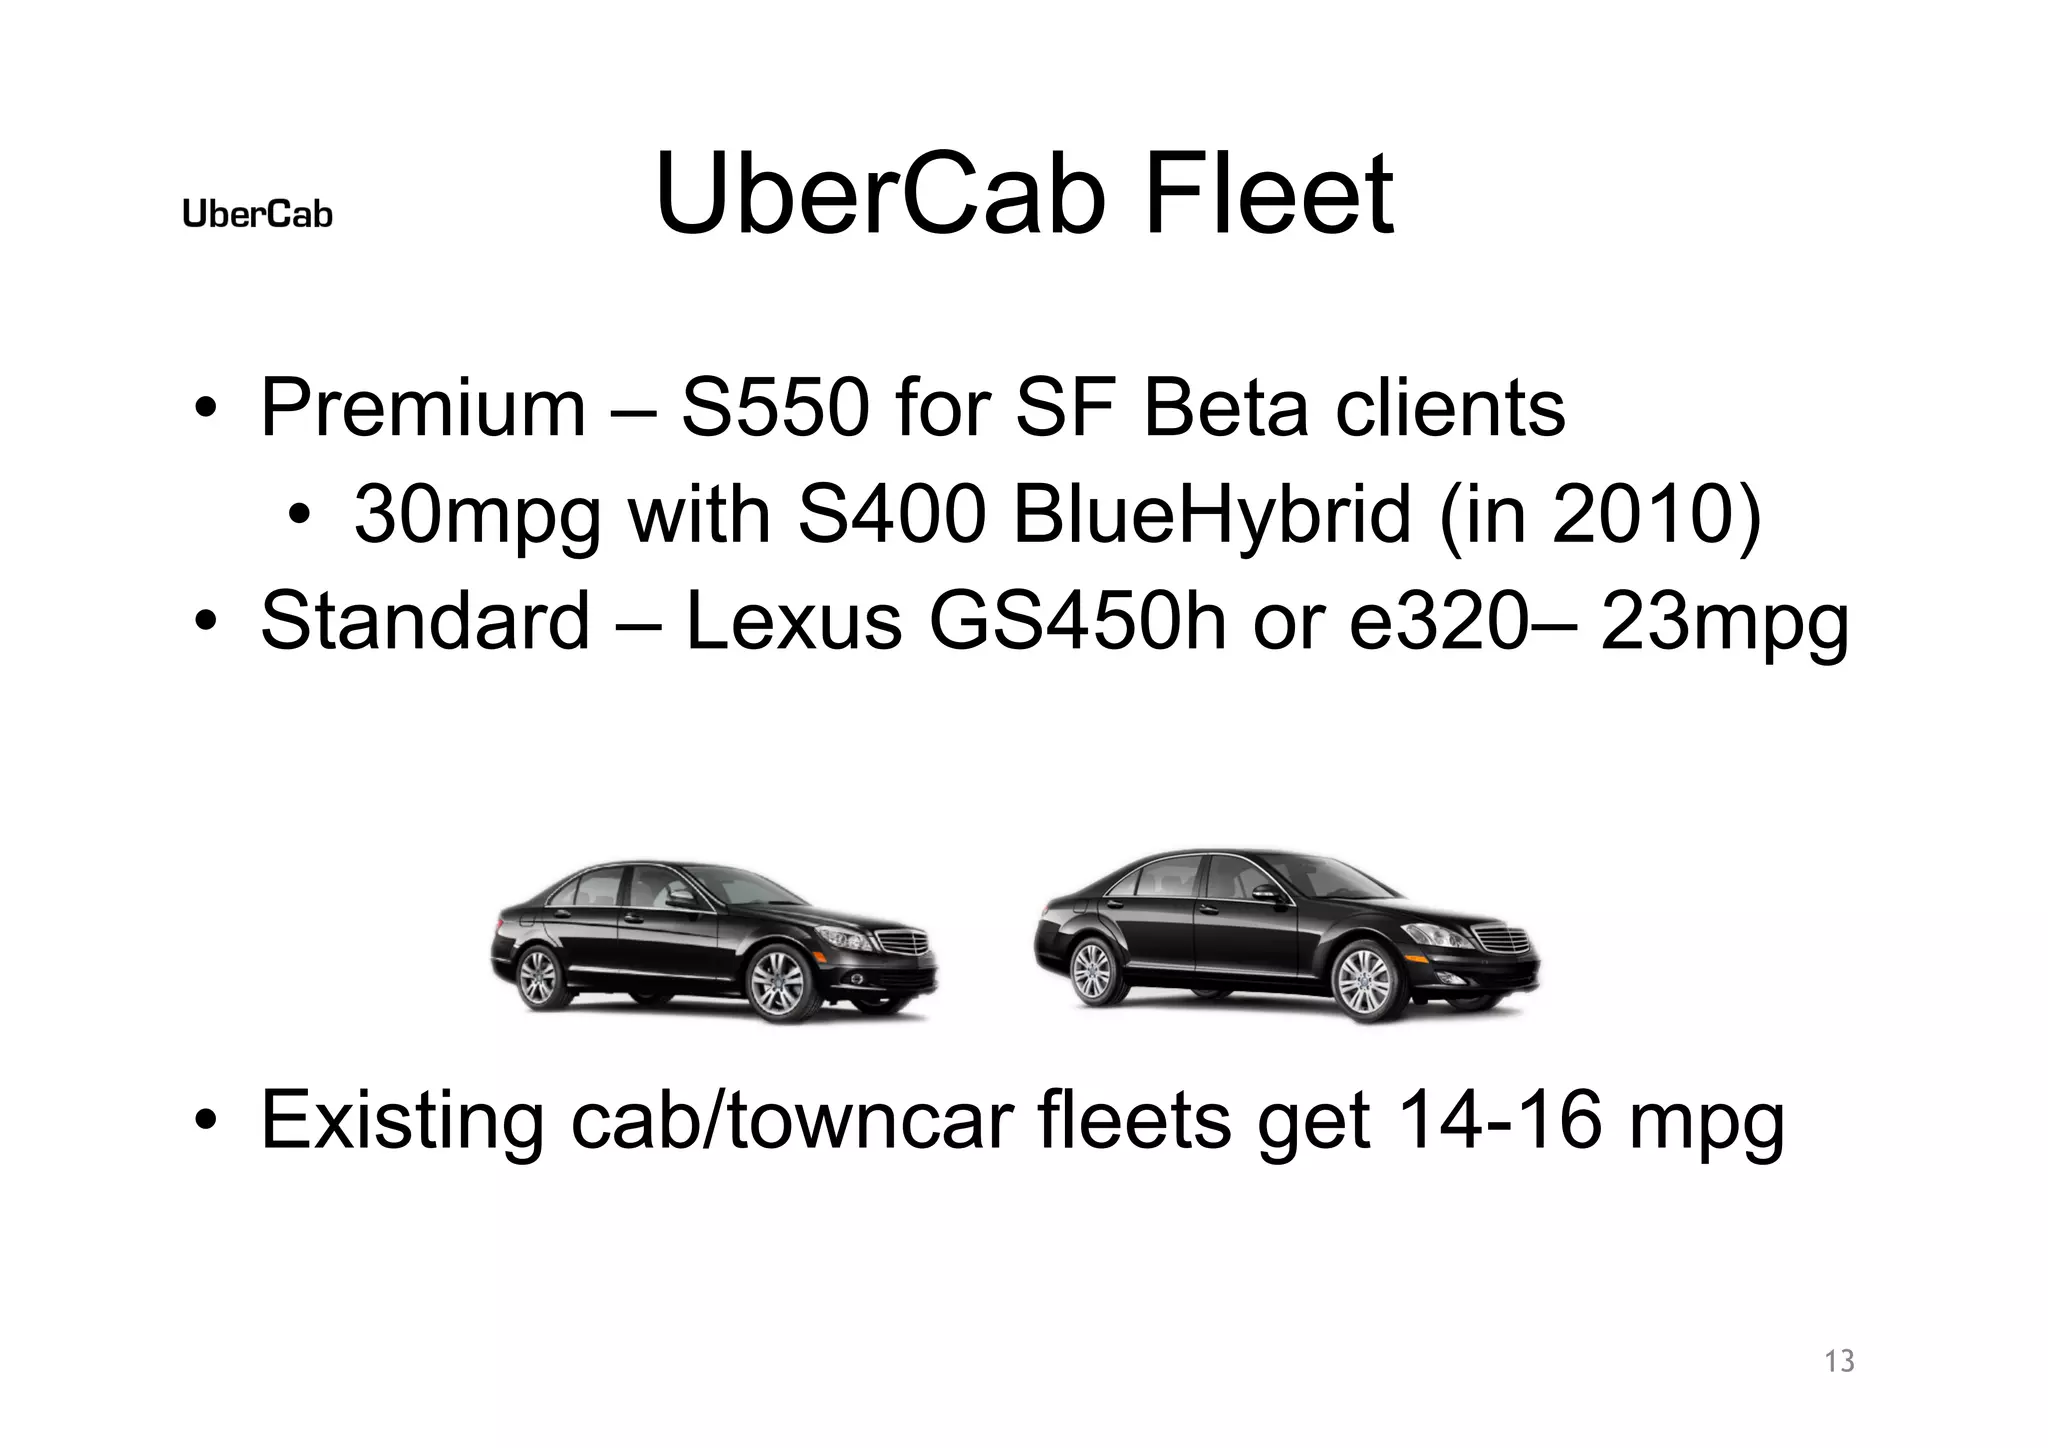
  • Luxury vehicles (Mercedes S-Class, Lexus sedans)
  • Driver accountability through rating system (“Rate your trip”)
  • Cashless, pre-paid billing system
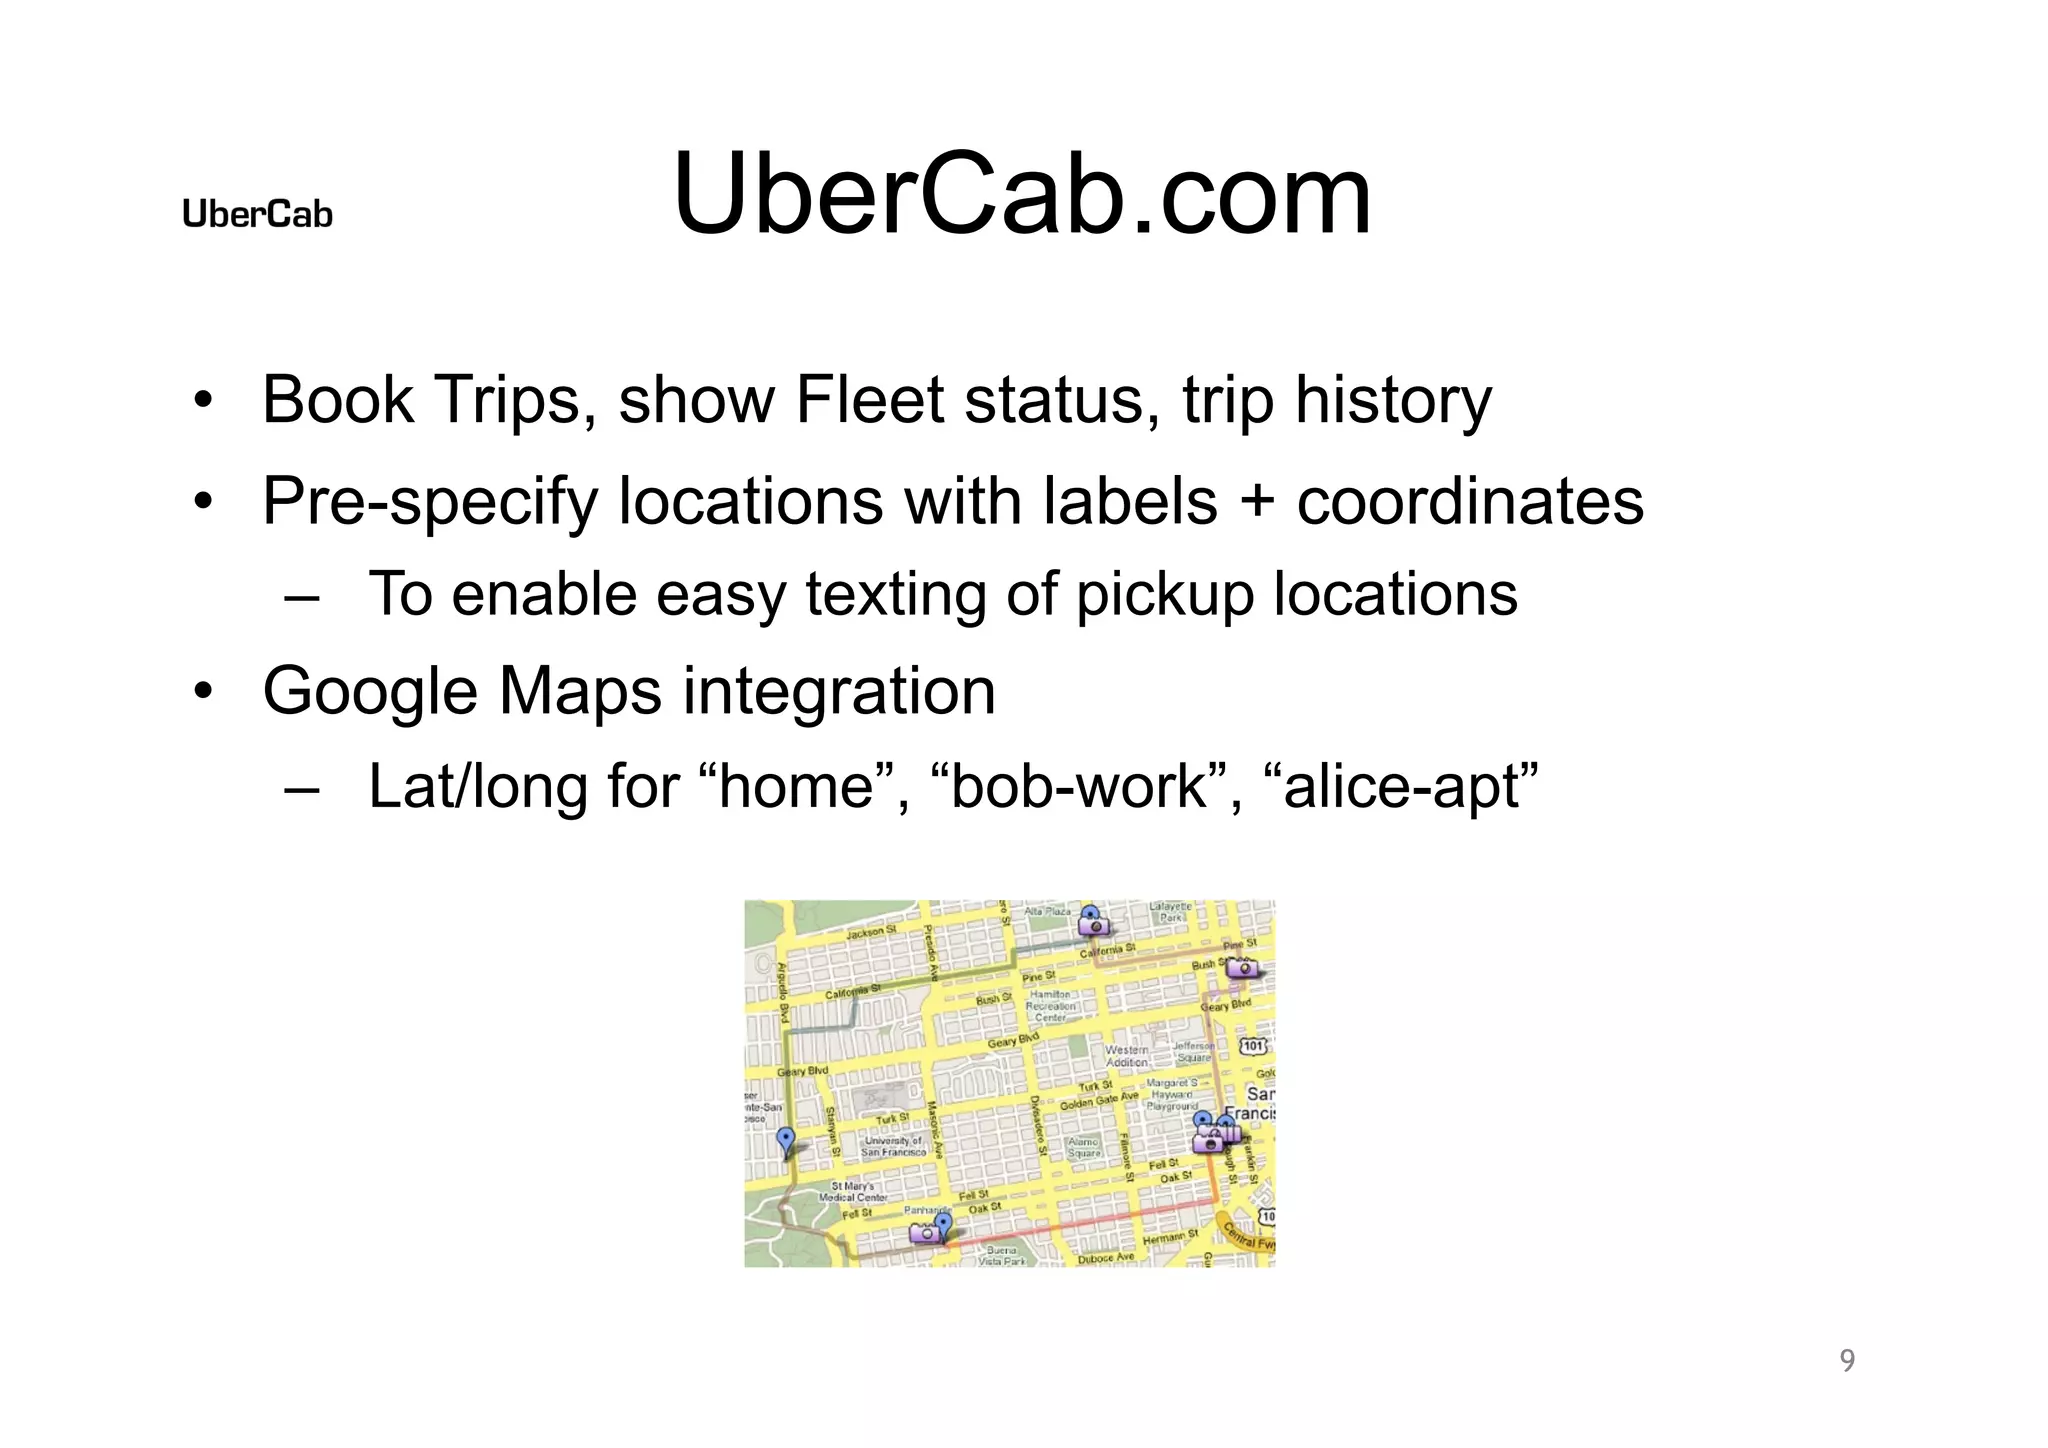
  • Real-time fleet visibility and trip history

Technology Differentiators (Slides 15-16):

  • Predictive positioning: Cars “hover” in statistically optimized positions based on hour of week, weather, and traffic
  • Route optimization: Operations research for efficient dispatch
  • Multi-platform apps: iPhone, BlackBerry, Symbian support
  • Payment/utilization/reputation tracking integrated system
  • Patent-pending system design

Regulatory Strategy (Slide 5):

  • Membership-only model (not street hail) to avoid medallion license requirements
  • Pre-arranged service for members = regulatory loophole vs. traditional taxis
  • Curated, professional clientele ensures quality and safety

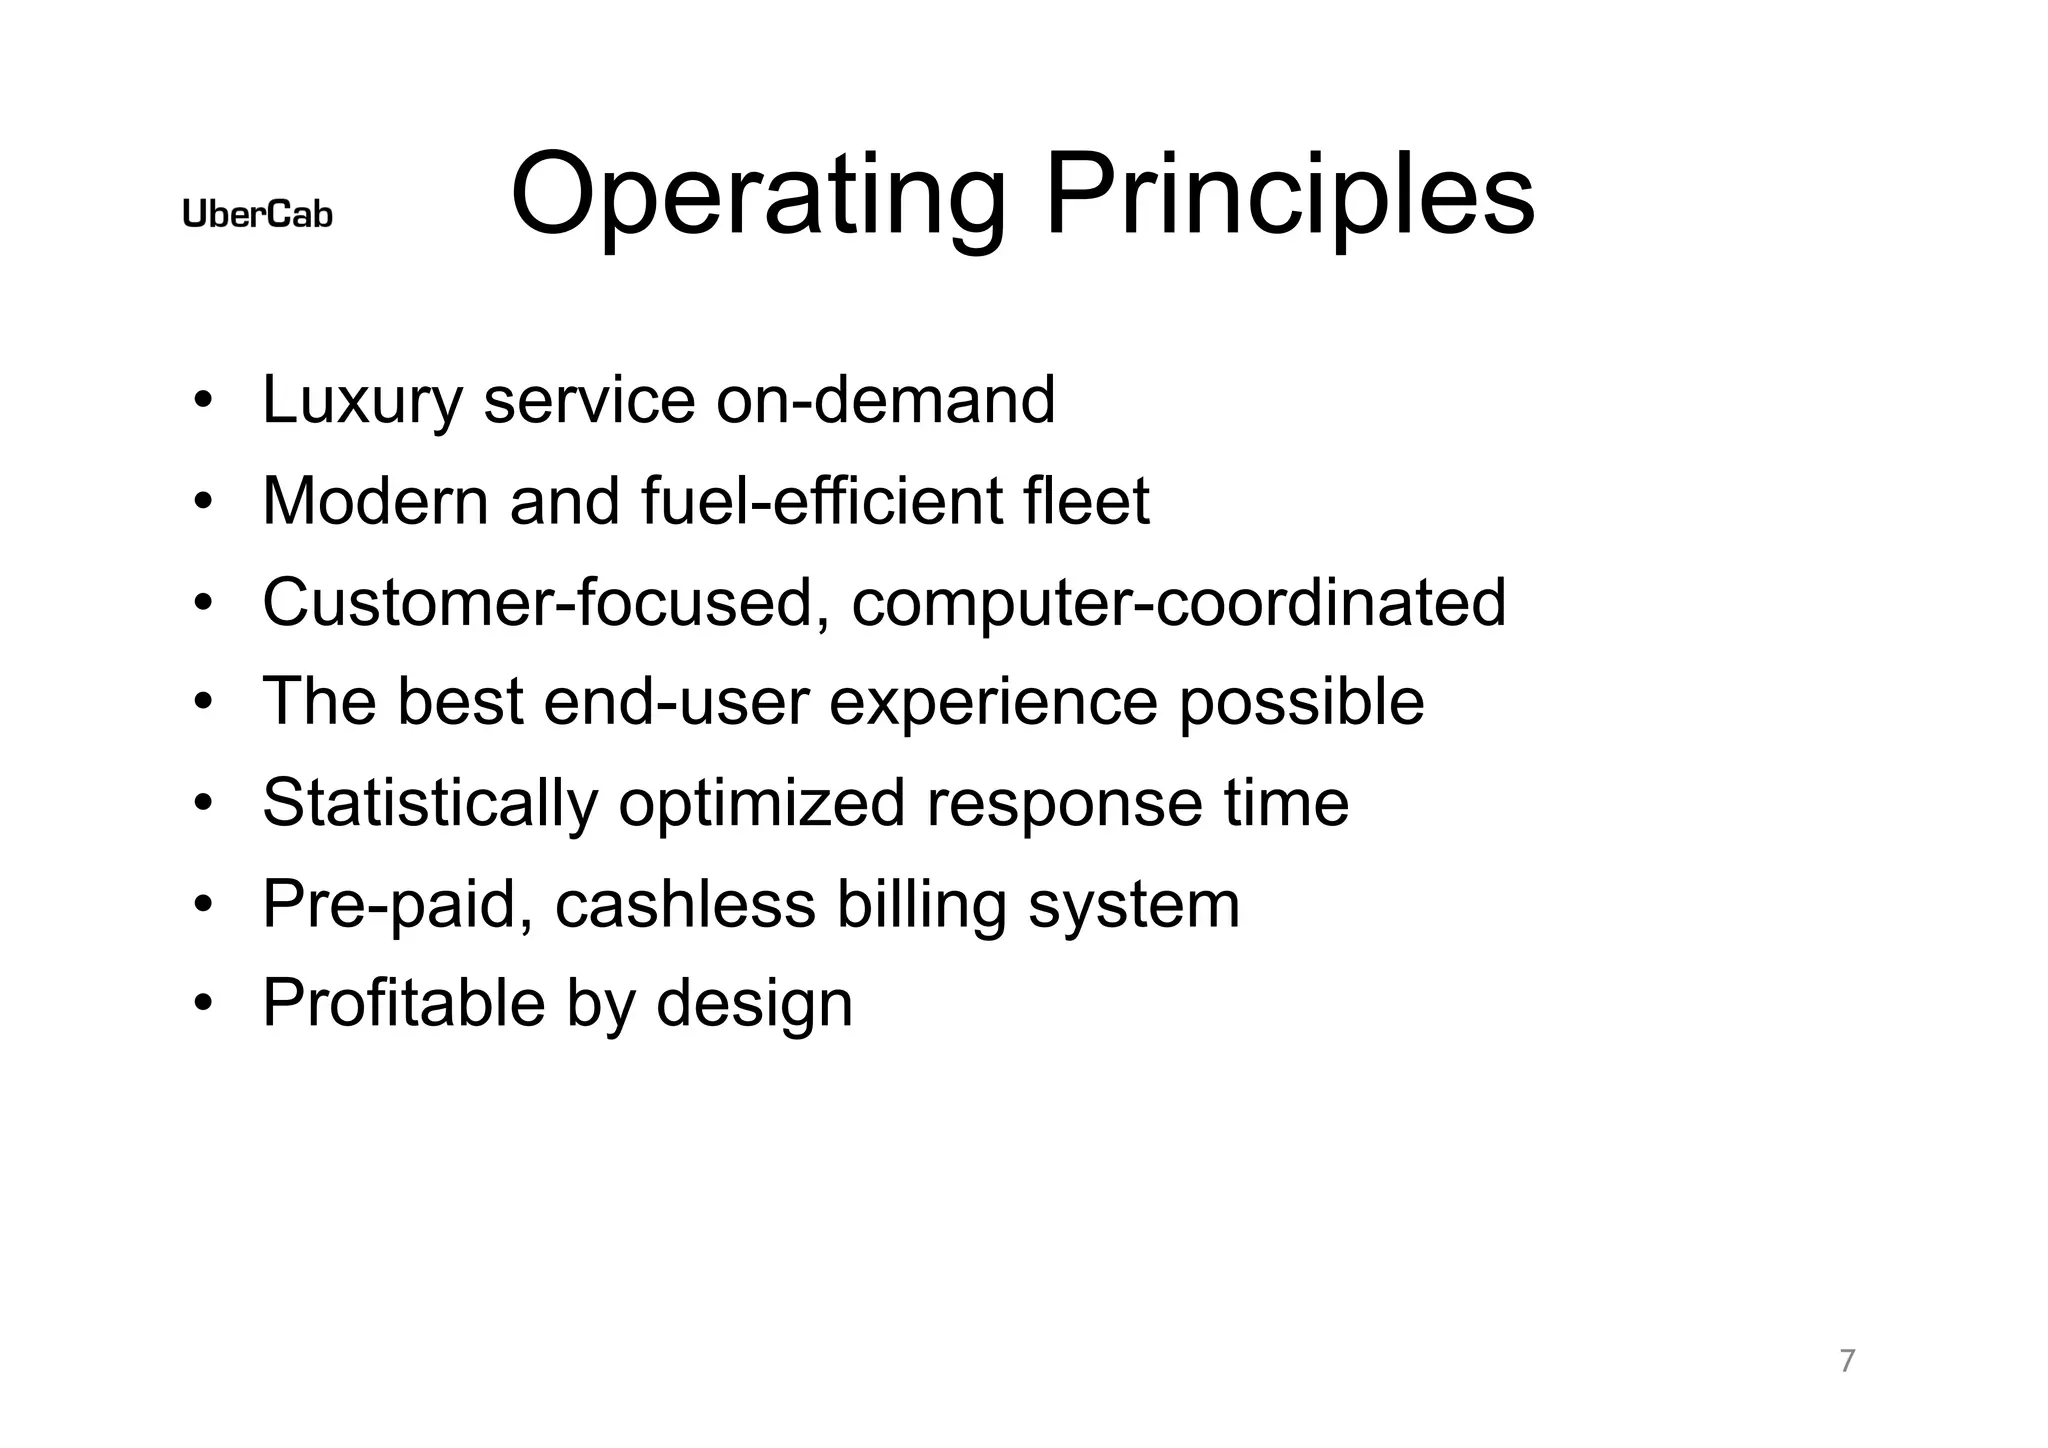
Operating Principles (Slide 7):

  • Luxury service on-demand
  • Modern, fuel-efficient fleet
  • Customer-focused, computer-coordinated
  • Statistically optimized response time
  • Pre-paid, cashless billing
  • “Profitable by design” (emphasis on unit economics from day one)

Market Opportunity

Total Addressable Market (TAM):

  • US Taxi & Limousine Market: $4.2B annually (2008)
  • Projected growth: $4.8B by 2014 (~2.4% CAGR)
  • Global context: US = 21.29% of world market

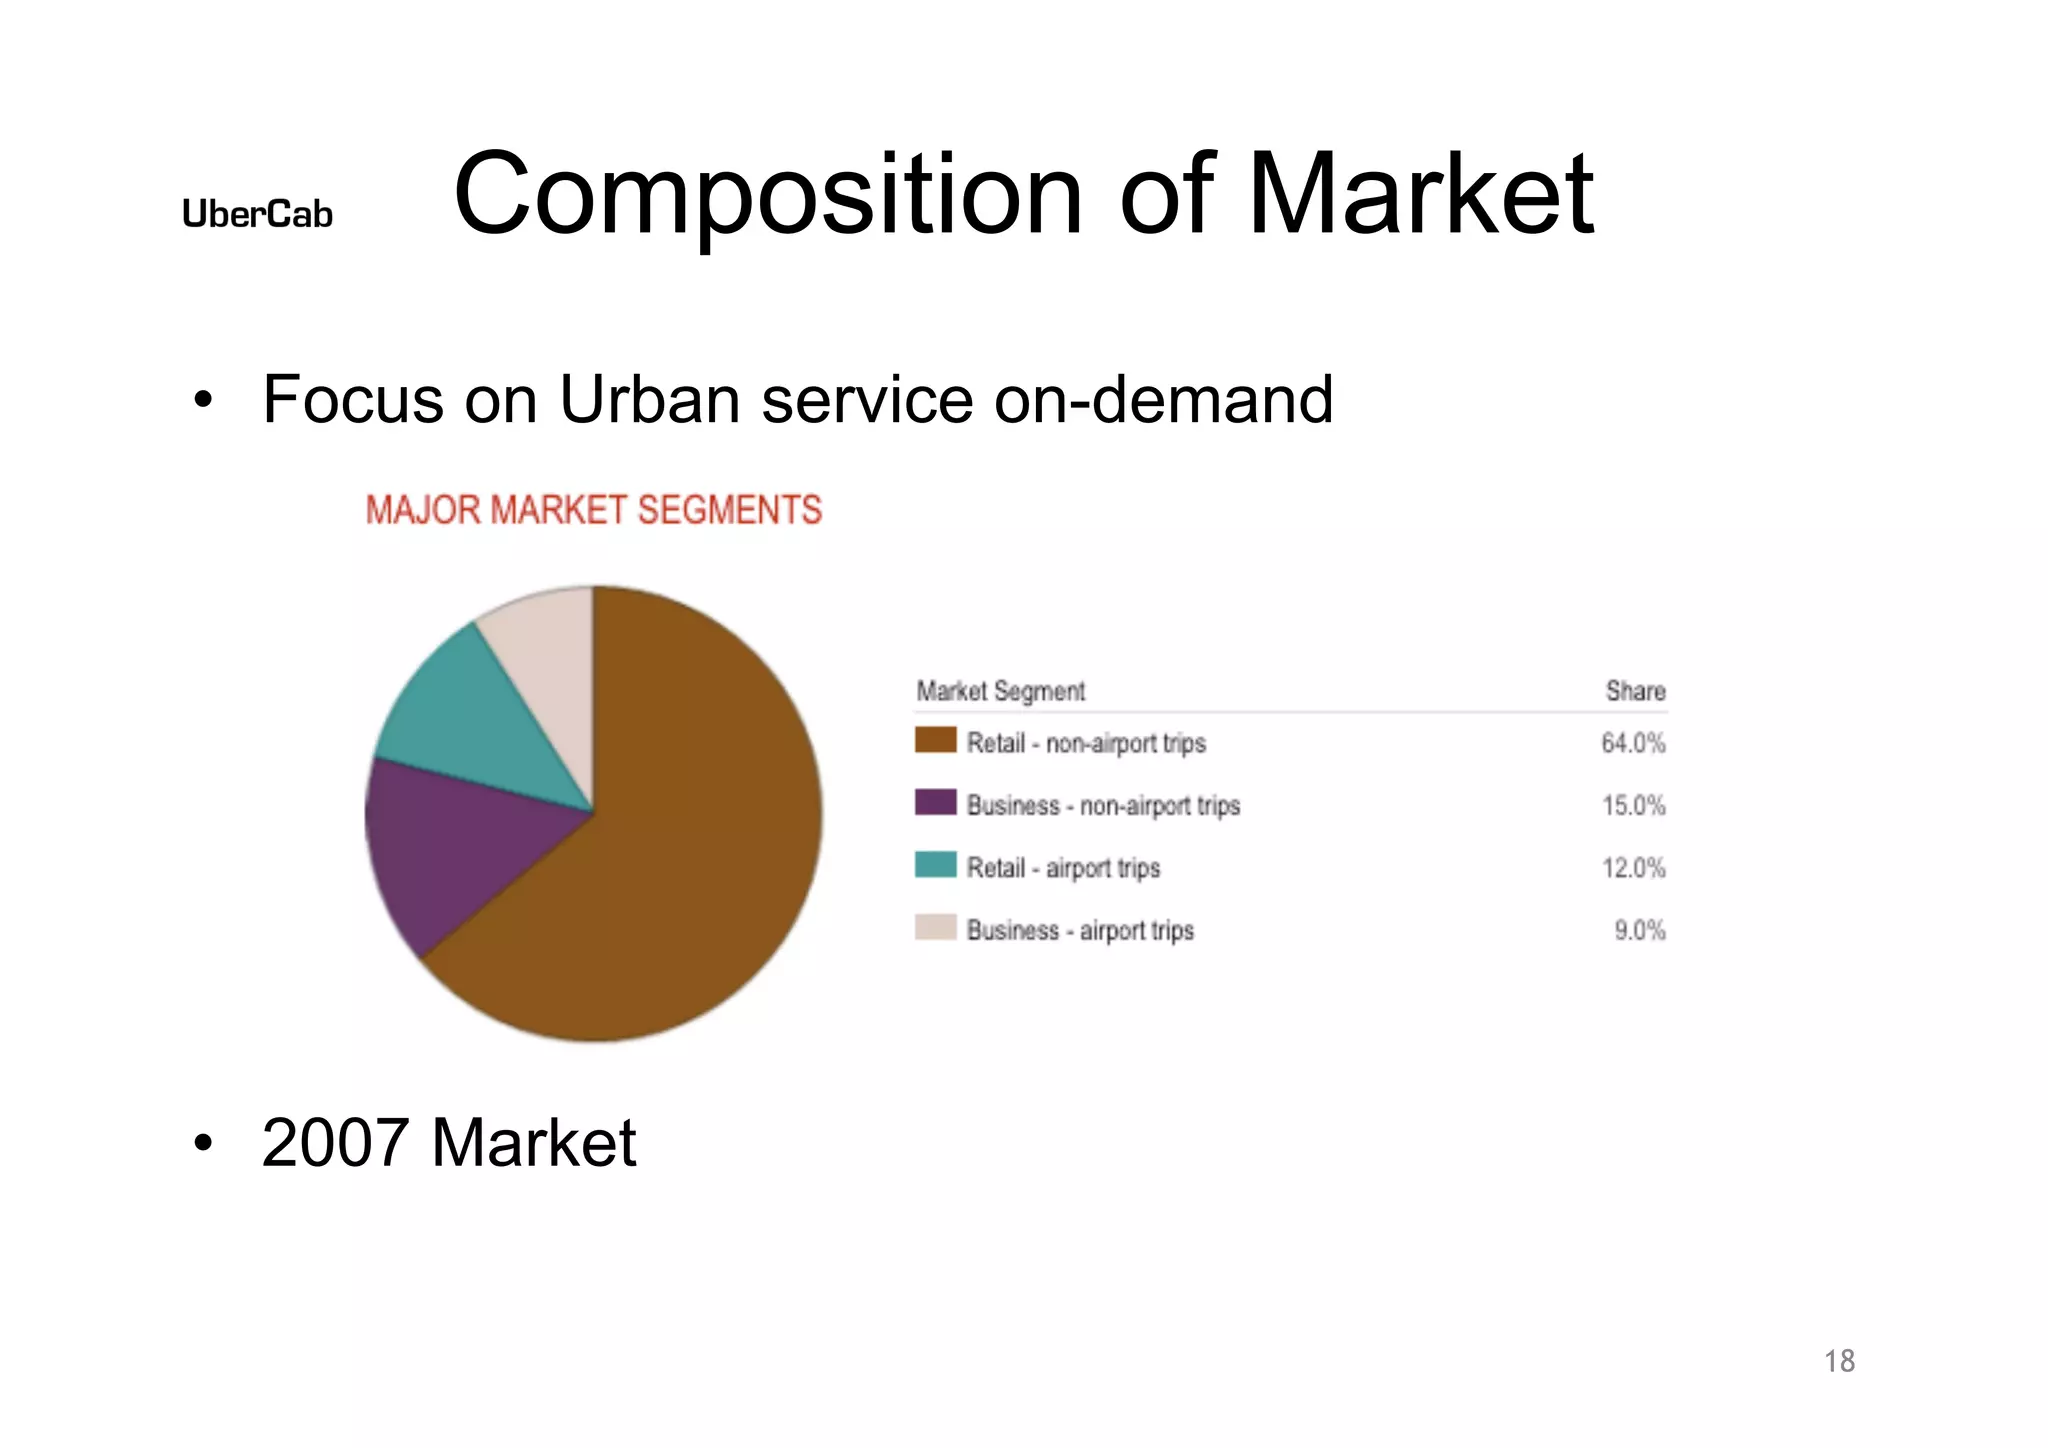
Market Segmentation (Slide 18):
| Segment | Share | Size |
|———|——-|——|
| Retail - non-airport trips | 64.0% | $2.7B |
| Business - non-airport trips | 15.0% | $630M |
| Retail - airport trips | 12.0% | $504M |
| Business - airport trips | 9.0% | $378M |

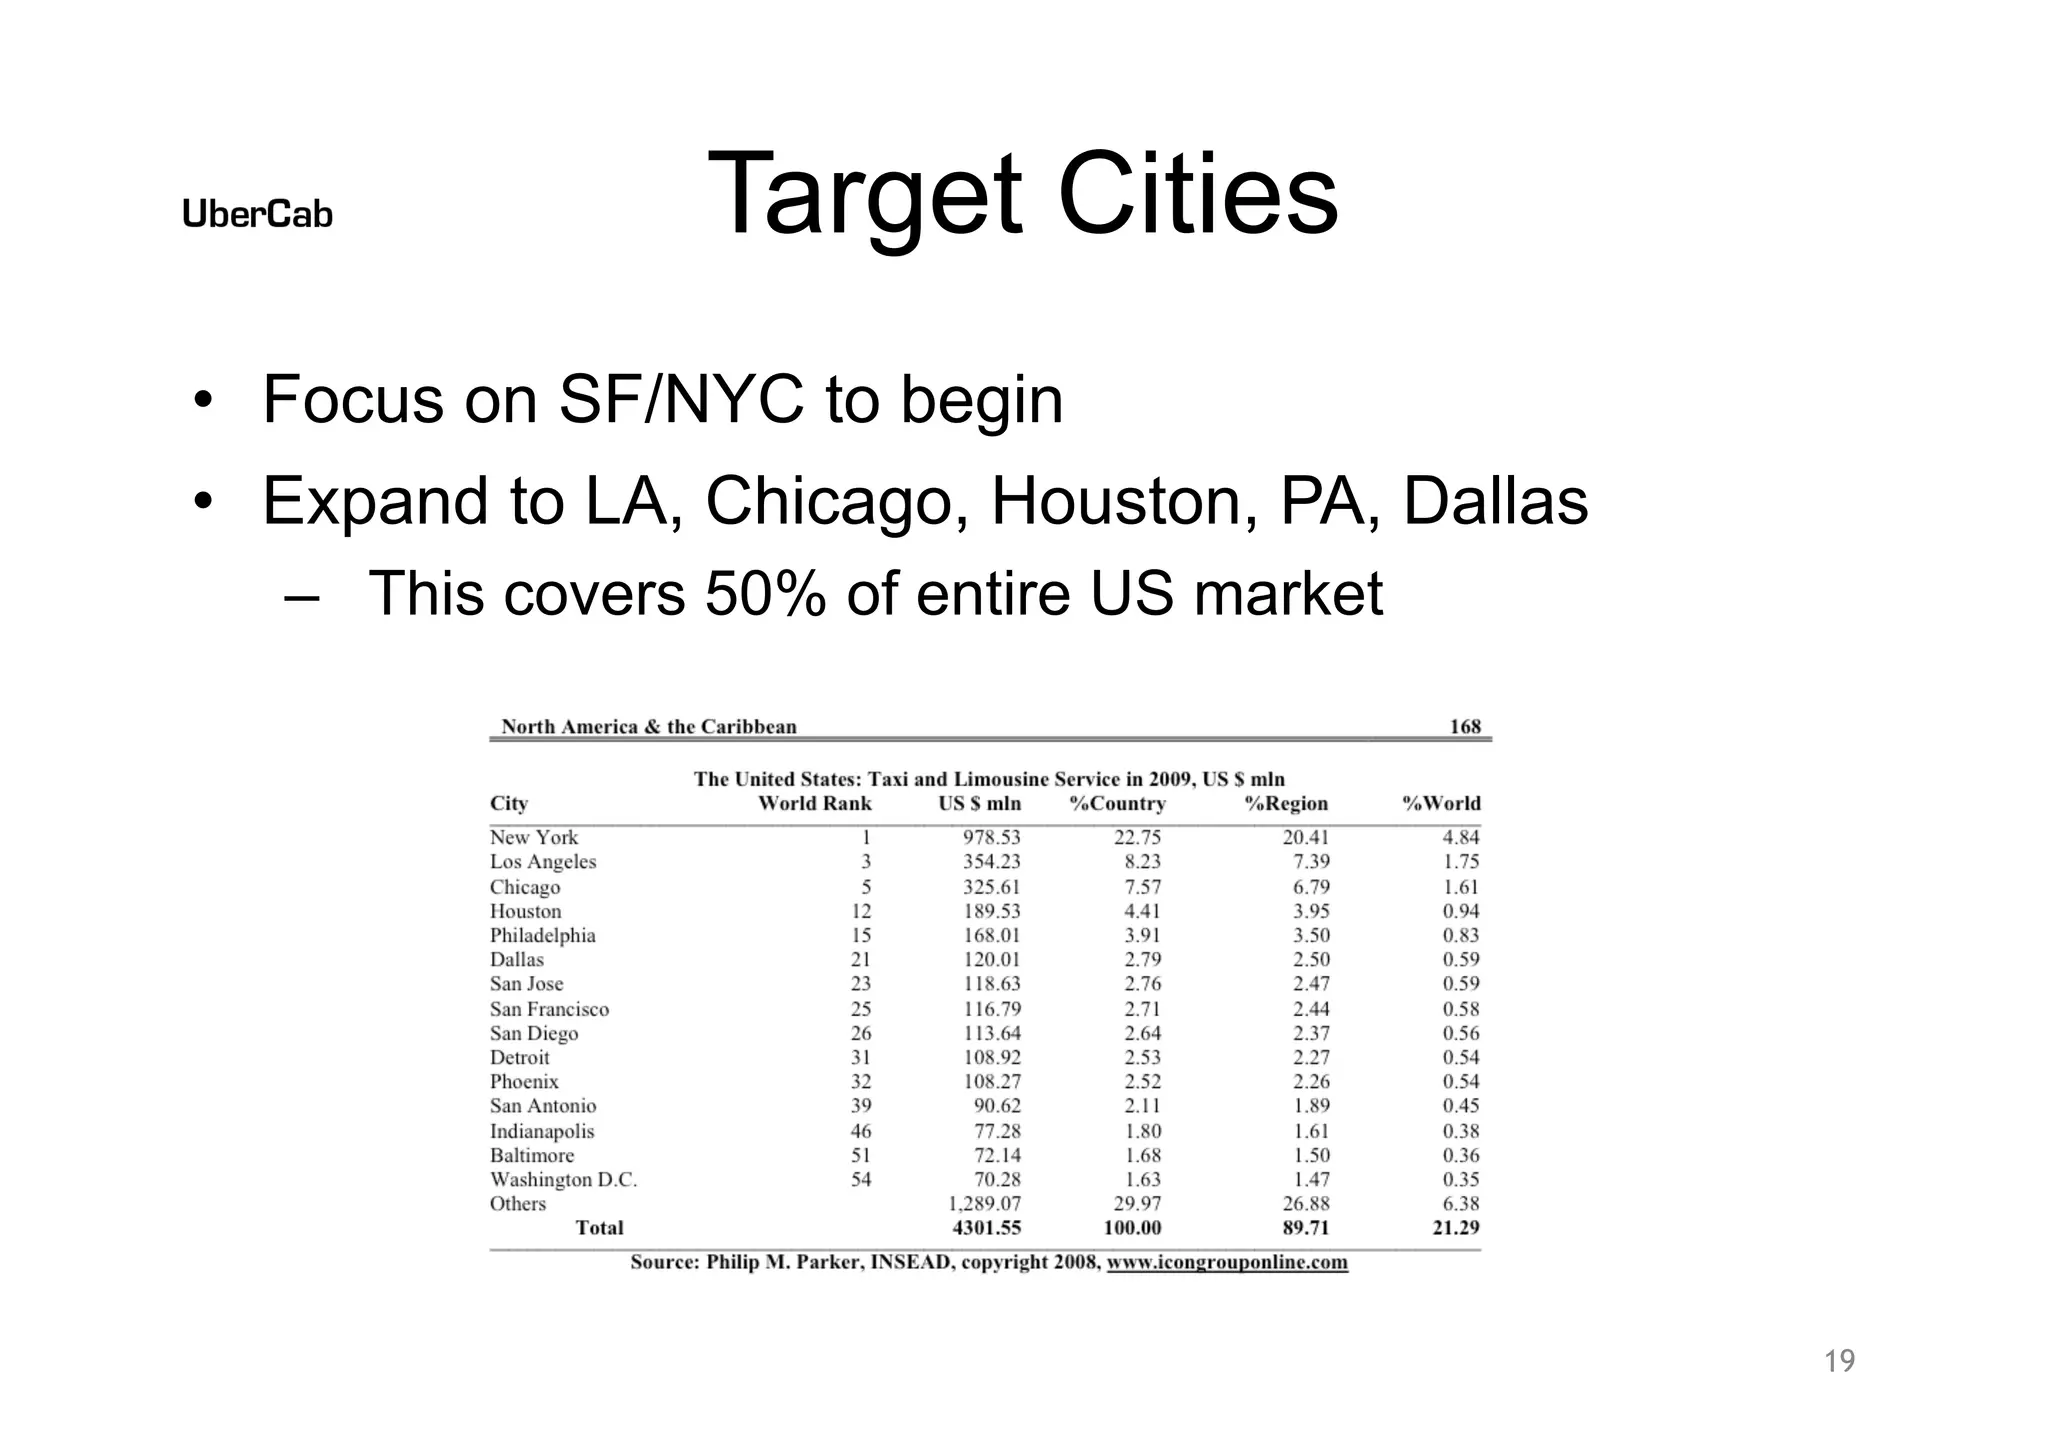
Geographic Opportunity (Slide 19):
Top 7 cities = 50% of US market:

  • New York: $978.53M (22.75% of US market)
  • Los Angeles: $354.23M (8.23%)
  • Chicago: $325.61M (7.57%)
  • Houston: $189.53M (4.41%)
  • Philadelphia: $168.01M (3.91%)
  • Dallas: $120.01M (2.79%)
  • San Francisco: $116.79M (2.71%)

Market Fragmentation: Top 4 players = only 22% of revenues, leaving 78% fragmented—classic disruption opportunity.

Addressable Market for Uber’s Premium Positioning:

  • Initial focus: Business travelers and affluent professionals in SF/NYC
  • Estimated addressable market: ~$500M-$1B (premium segment of top 7 cities)

Business Model

Revenue Model:

  • Pre-paid membership model (invite-only, referred from existing members)
  • Per-ride pricing: Premium over traditional car services but cheaper than limousines
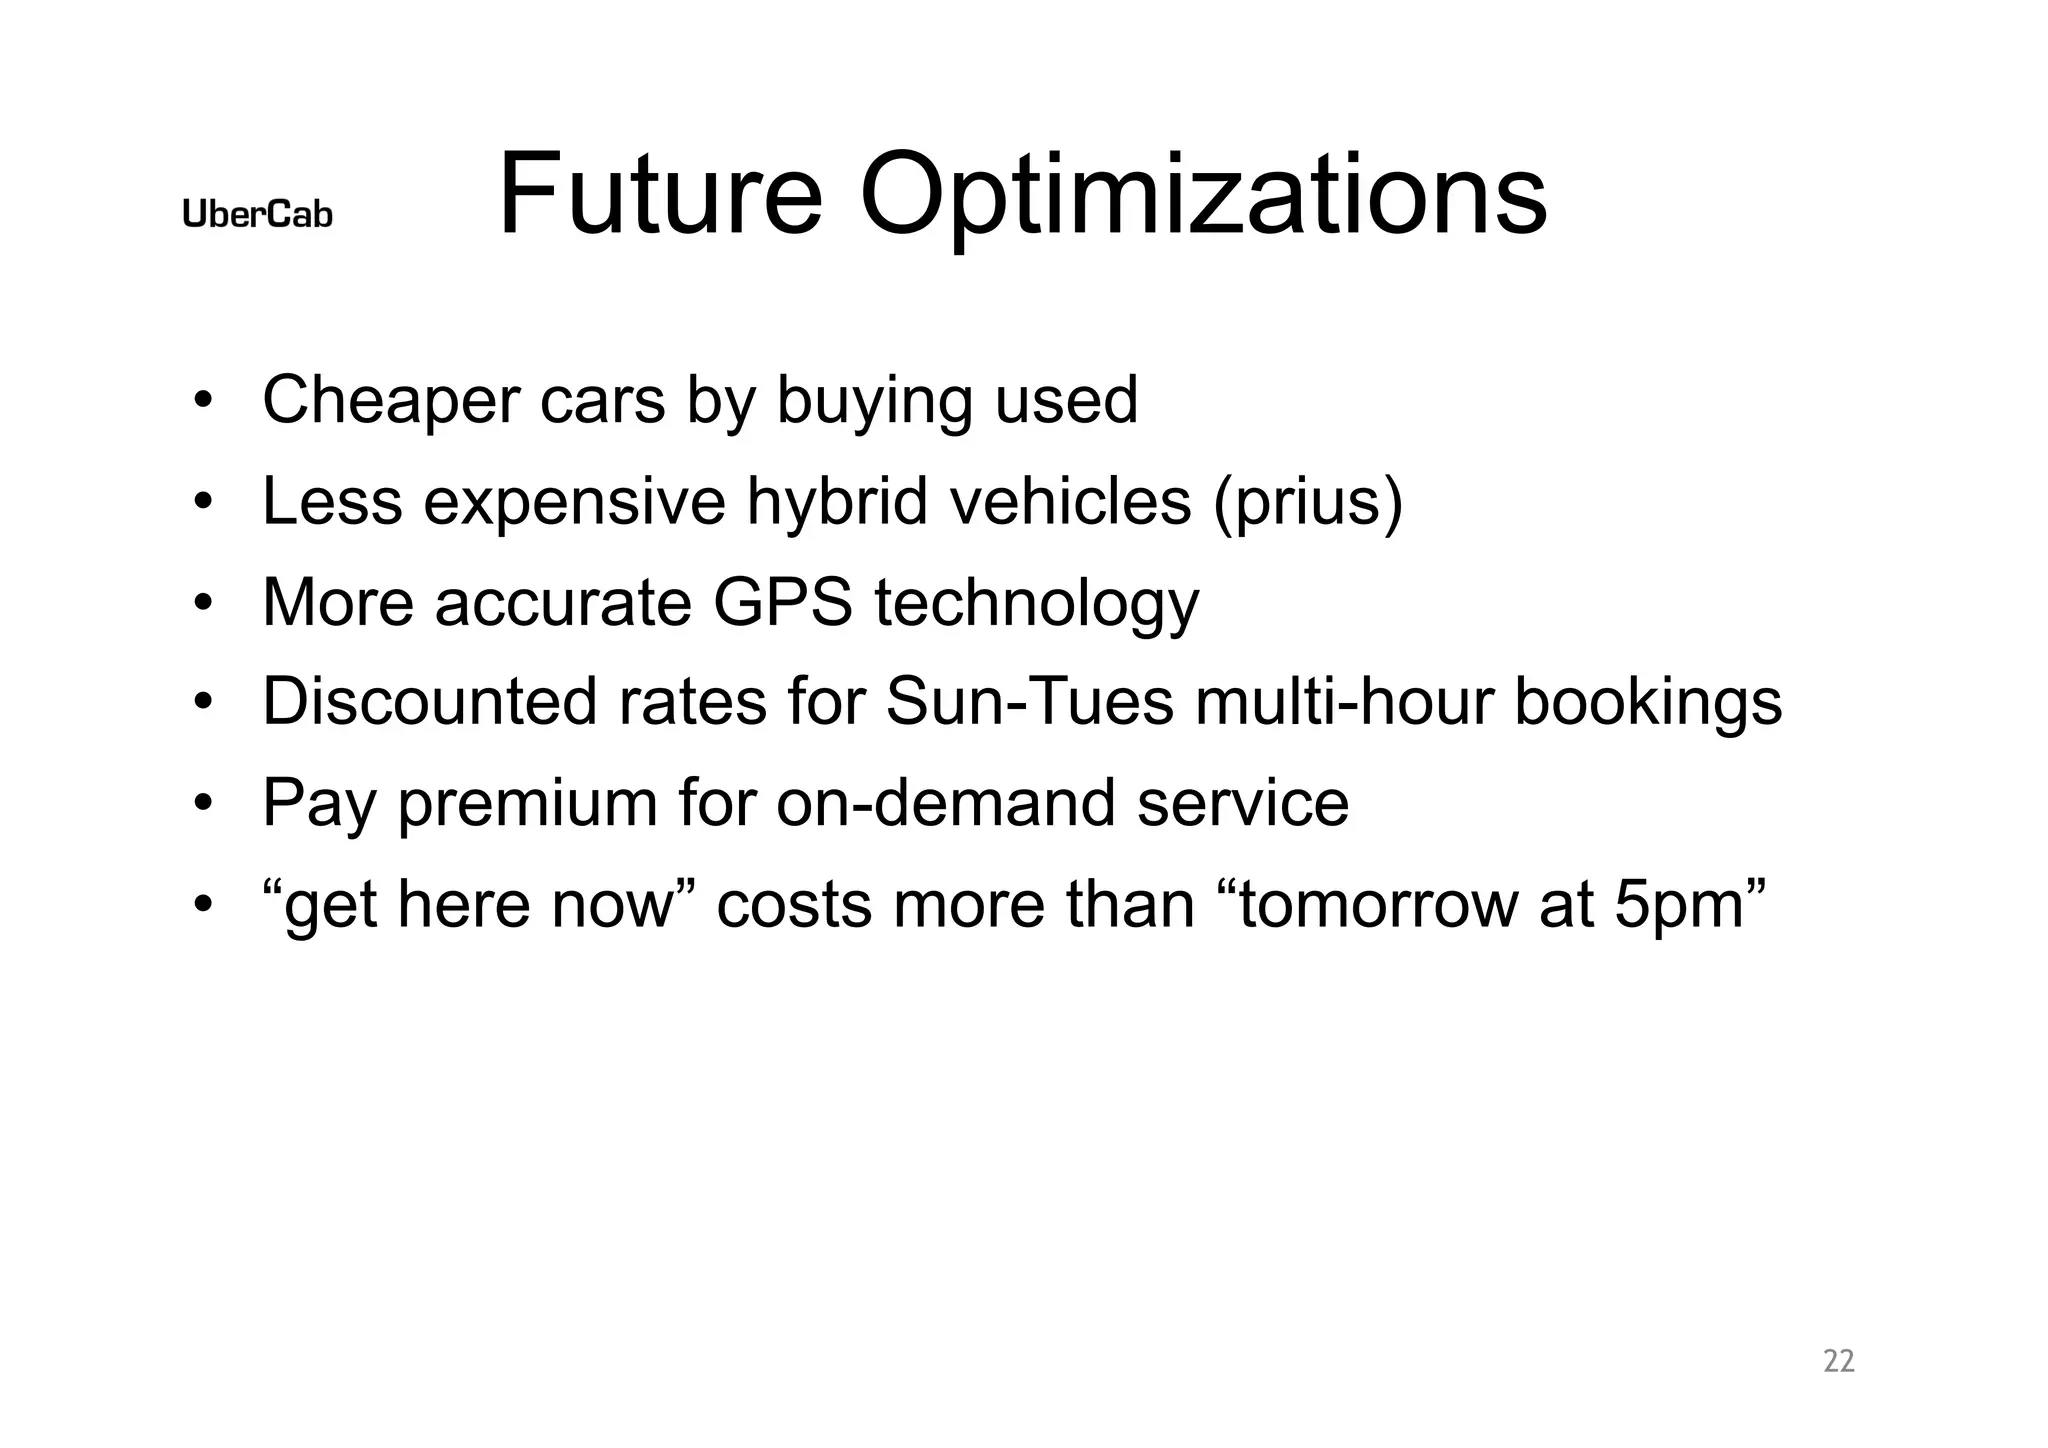
  • Dynamic pricing: “Get here now” costs more than “tomorrow at 5pm” (early surge pricing concept)
  • Off-peak discounting: Discounted rates for Sun-Tues multi-hour bookings

Unit Economics (Implied but not fully detailed):

  • Fleet: Premium vehicles (Mercedes S400 BlueHybrid, Lexus GS-450h)
  • Fuel efficiency: 30 mpg (hybrid) vs. 14-16 mpg (traditional taxis)
  • Cost reduction levers: Used cars, Prius hybrids, improved GPS
  • Margin target: Slide 7 emphasizes “Profitable by design”

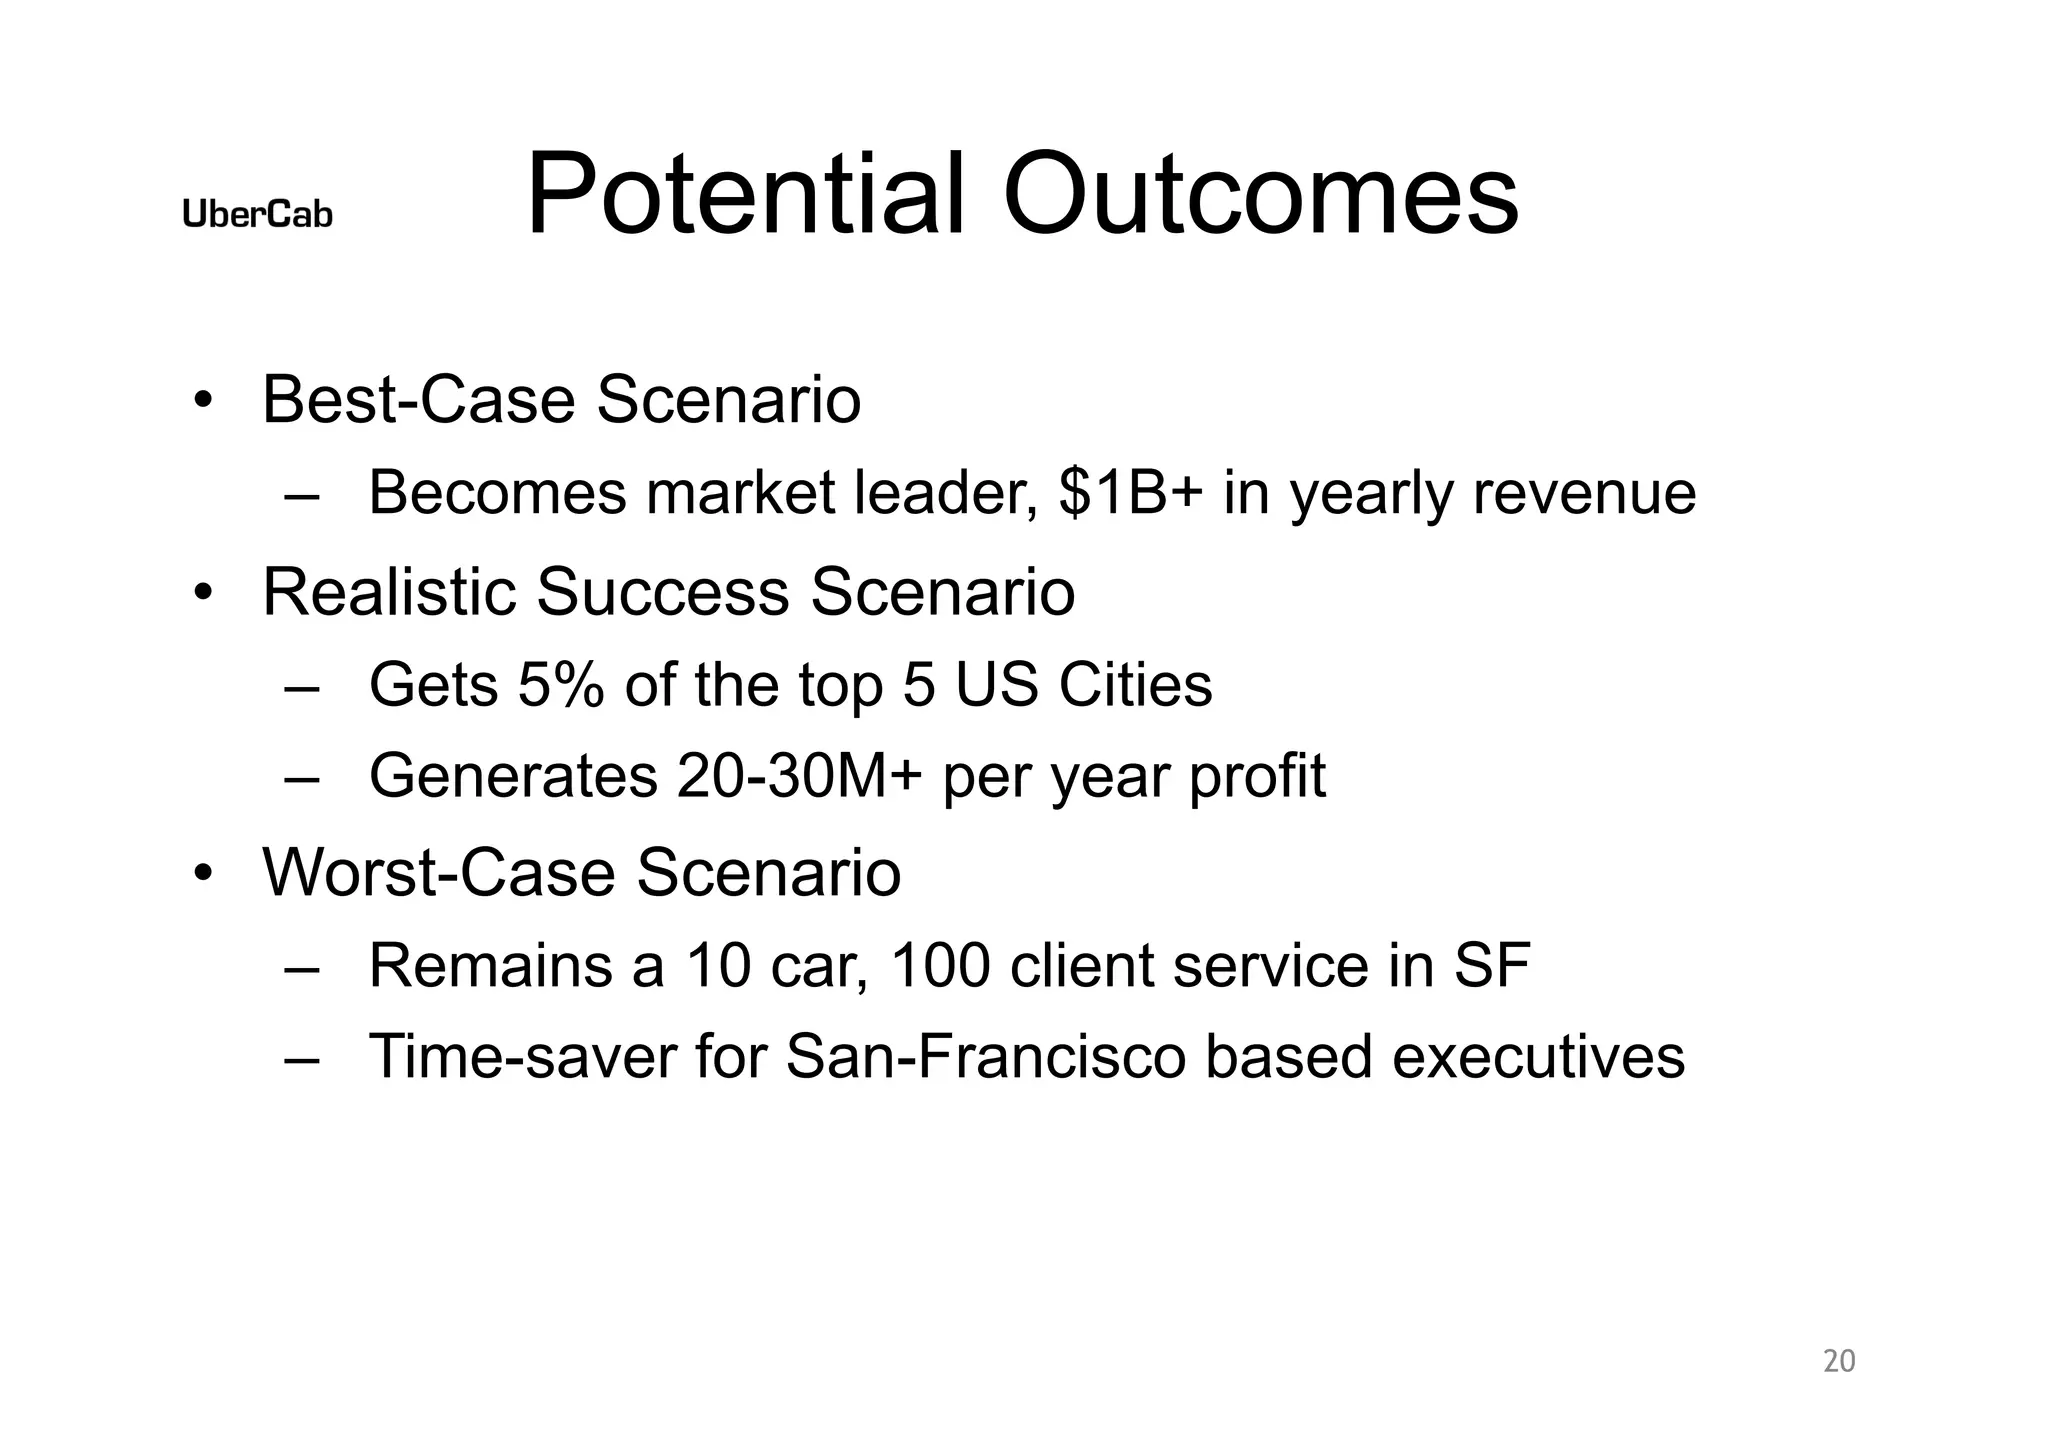
Realistic Success Scenario (Slide 20):

  • 5% market share of top 5 US cities
  • $20-30M+ annual profit
  • (Implies ~$80M revenue at 25-37% profit margin)

Best-Case Scenario (Slide 20):

  • Market leader position
  • $1B+ annual revenue

Worst-Case Scenario (Slide 20):

  • 10 cars, 100 clients in SF only
  • Niche service for SF executives
  • (Shows downside protection; business remains viable even if scaling fails)

Traction & Metrics

Progress to Date (Slide 25):

  • ✅ Domain reserved: Ubercab.com
  • ✅ SMS shortcode secured: “ubercab”
  • ✅ California LLC formed
  • ✅ Trademark filed
  • ✅ iPhone developer license applied for (Nov 28, 2008)
  • ✅ Bank account + PayPal account created
  • ✅ 5 advisors recruited
  • ✅ 15 clients recruited (pre-launch)
  • ✅ Provisional patent filed

Next Steps (Slide 25):

  • Buy 3 cars
  • Develop app
  • Feb 1st demo
  • Raise “a few million” (Series A)
  • Hire General Manager
  • Establish small office in SF

Metrics Assessment:

  • 15 pre-launch clients: Modest but meaningful validation of concept
  • 5 advisors: Suggests credibility and network (though names not provided)
  • No revenue data: Suggests pre-revenue or pre-paying customers, not active users
  • No driver recruitment metrics: Critical gap—no mention of driver supply

Competitive Positioning

Competitive Set:

  1. Yellow Cabs — Mass-market, unreliable, unsafe, dirty
  2. Traditional Car Services — Require advance notice, expensive ($60+), inconvenient
  3. Limousines — Premium but expensive, pre-scheduled only
  4. Existing ride-hailing — None mentioned; market was open in 2008

Positioning Strategy (Slide 11):

  • “Faster & cheaper than a limo, but nicer & safer than a taxicab”
  • Occupies the “sweet spot” between mass-market taxis and premium limos
  • Combines convenience of taxis with quality of limos

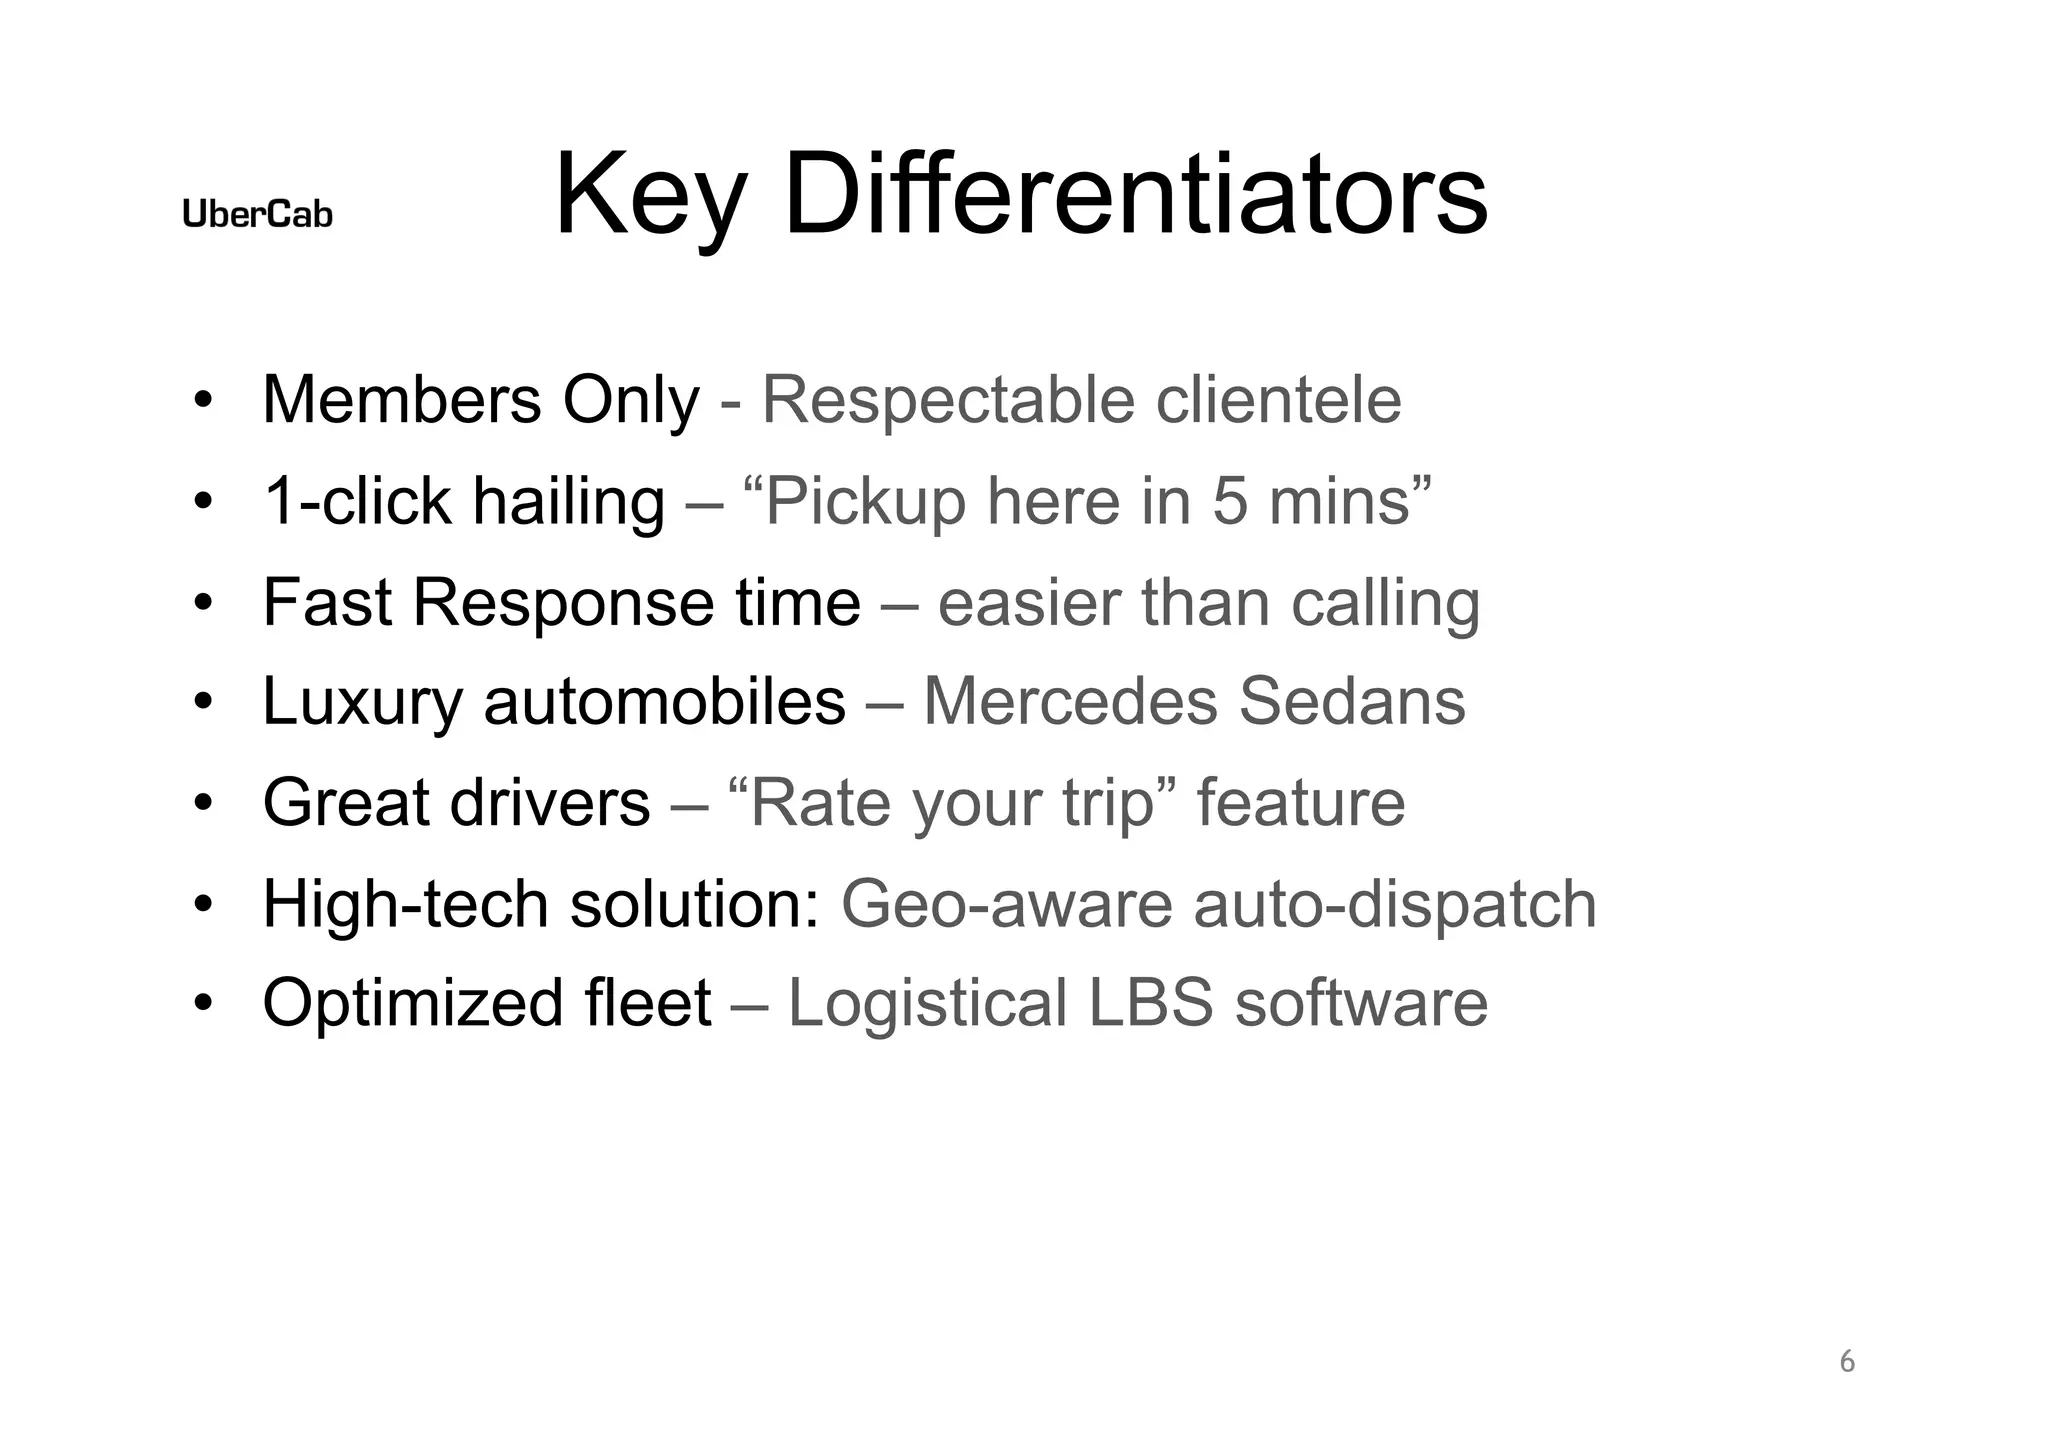
Key Differentiators (Slide 6):

  1. Members Only — Respectable clientele (quality control)
  2. 1-click hailing — “Pickup here in 5 mins” (speed promise)
  3. Fast Response time — Easier than calling
  4. Luxury automobiles — Mercedes Sedans
  5. Great drivers — “Rate your trip” feature (accountability)
  6. High-tech solution — Geo-aware auto-dispatch
  7. Optimized fleet — Logistical LBS software

Competitive Moat:

  • Technology: Predictive positioning algorithm (patent-pending)
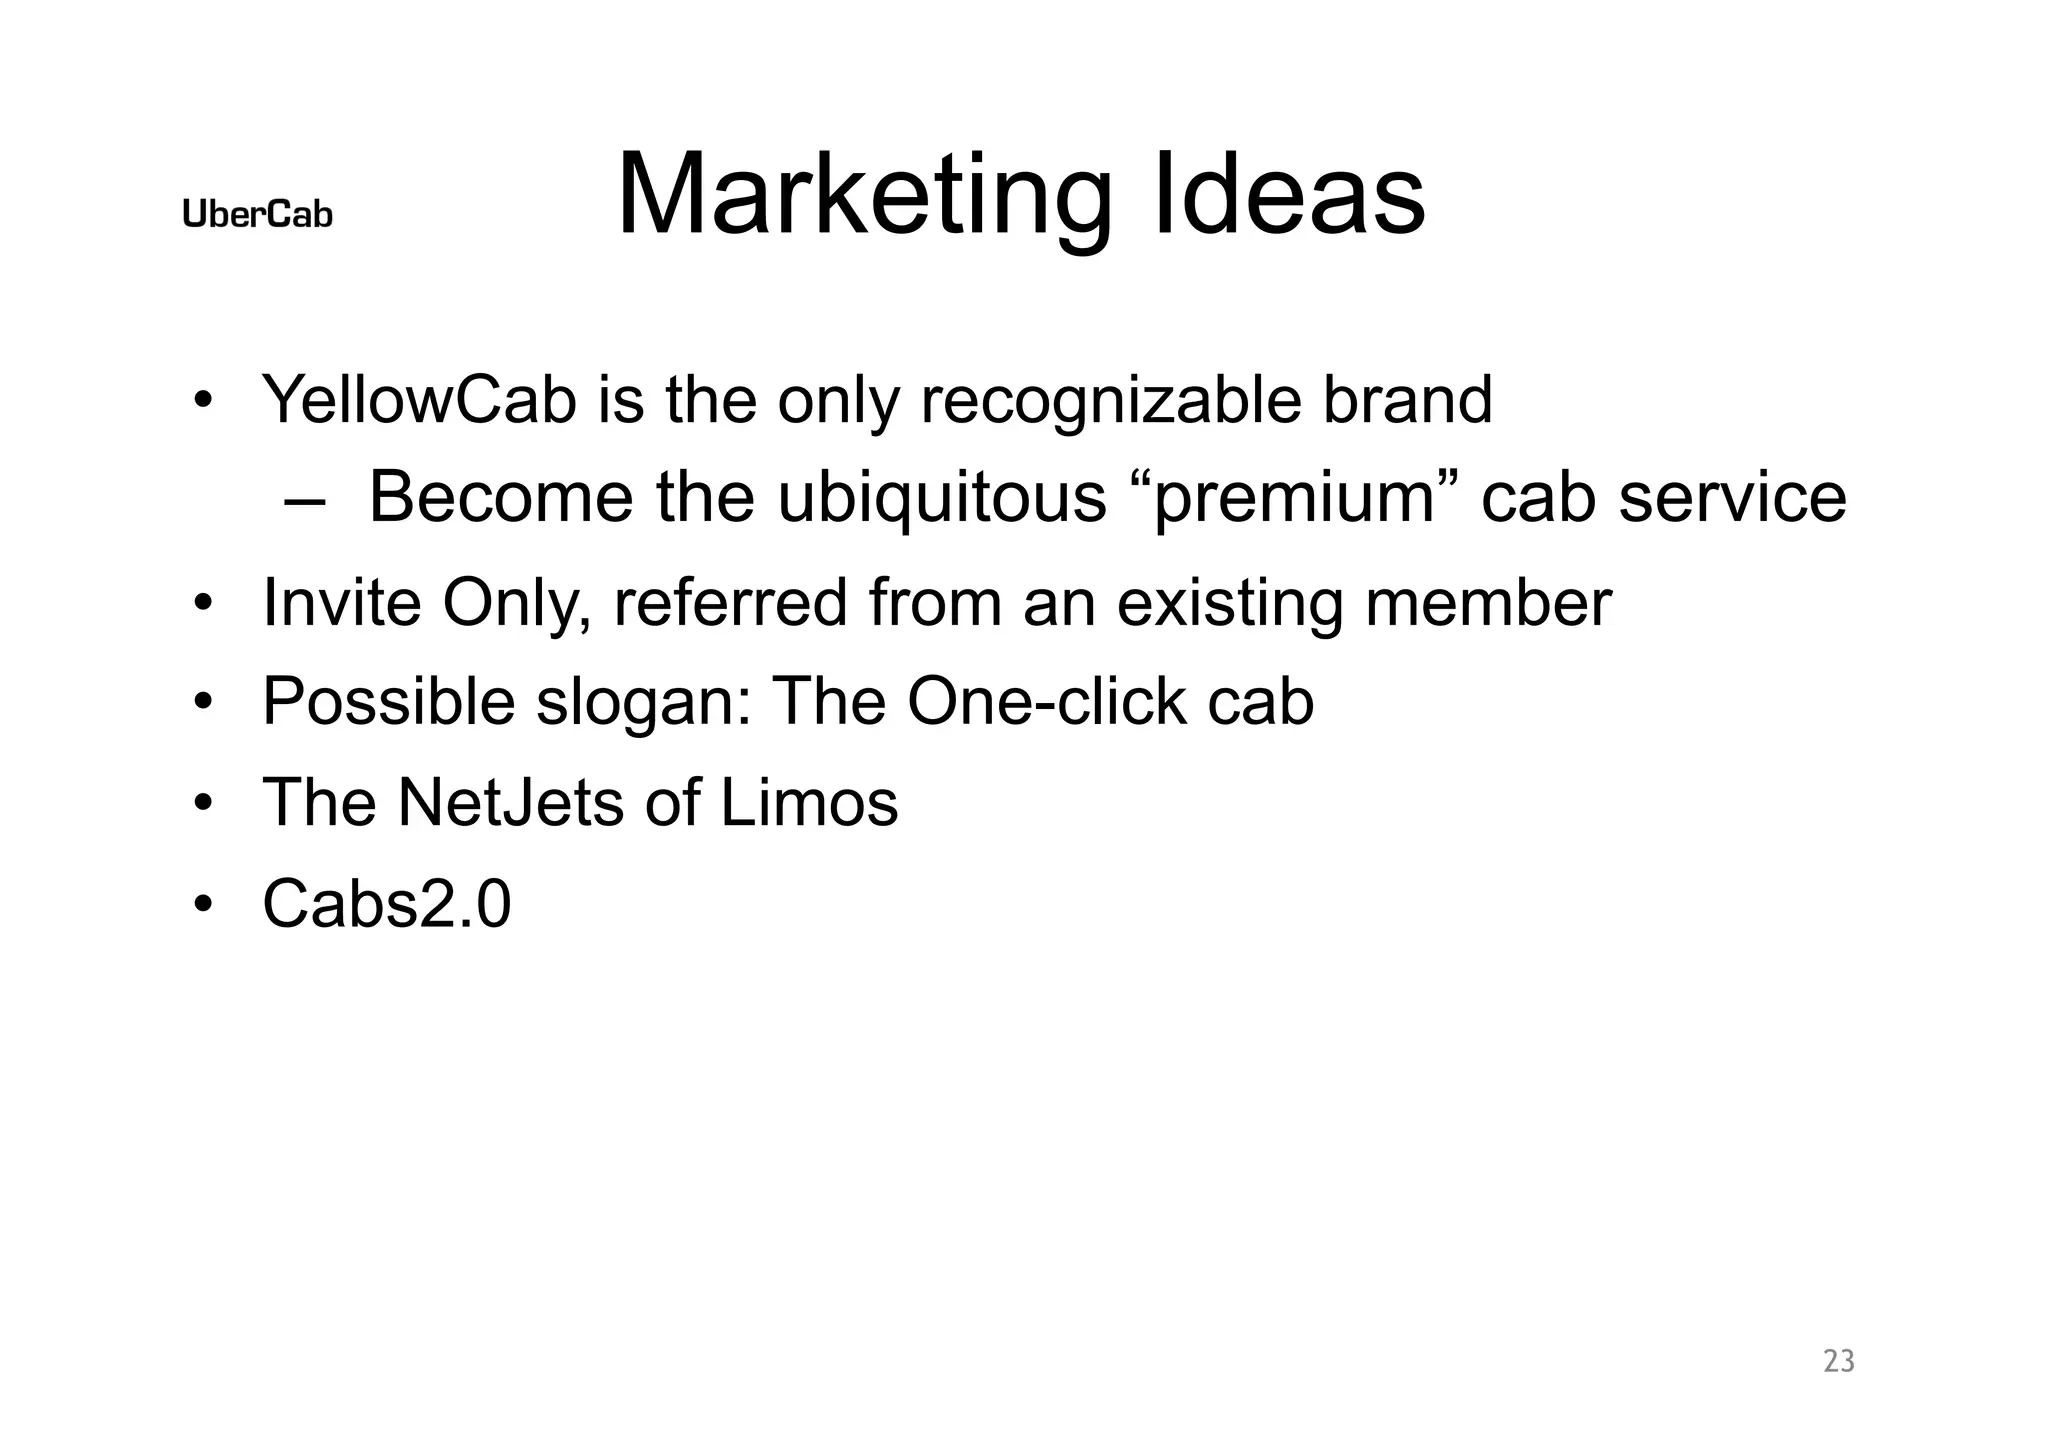
  • Brand: Become the ubiquitous “premium” cab service (vs. YellowCab’s fragmented brand)
  • Network effects: Referral-only model creates viral growth
  • Regulatory: Membership model avoids medallion license requirements

Team

Team Credentials:
The deck does not explicitly identify the founding team or their backgrounds. However, it references:

  • 5 advisors recruited (names not provided)
  • General Manager to be hired (not yet in place)

Inferred Team Capabilities:

  • Technical sophistication: Route optimization, multi-platform app development, GPS integration
  • Business acumen: Market analysis, financial modeling, regulatory strategy
  • Operational experience: Fleet management, driver recruitment, customer service

Notable Gap: The deck does not include a “Team” slide with founder bios, relevant experience, or advisor names. This is a weakness—investors typically want to see founder credentials and relevant domain expertise.

Go-to-Market Strategy

Launch Strategy (Slides 14, 19, 23):

Phase 1 - Proof of Concept:

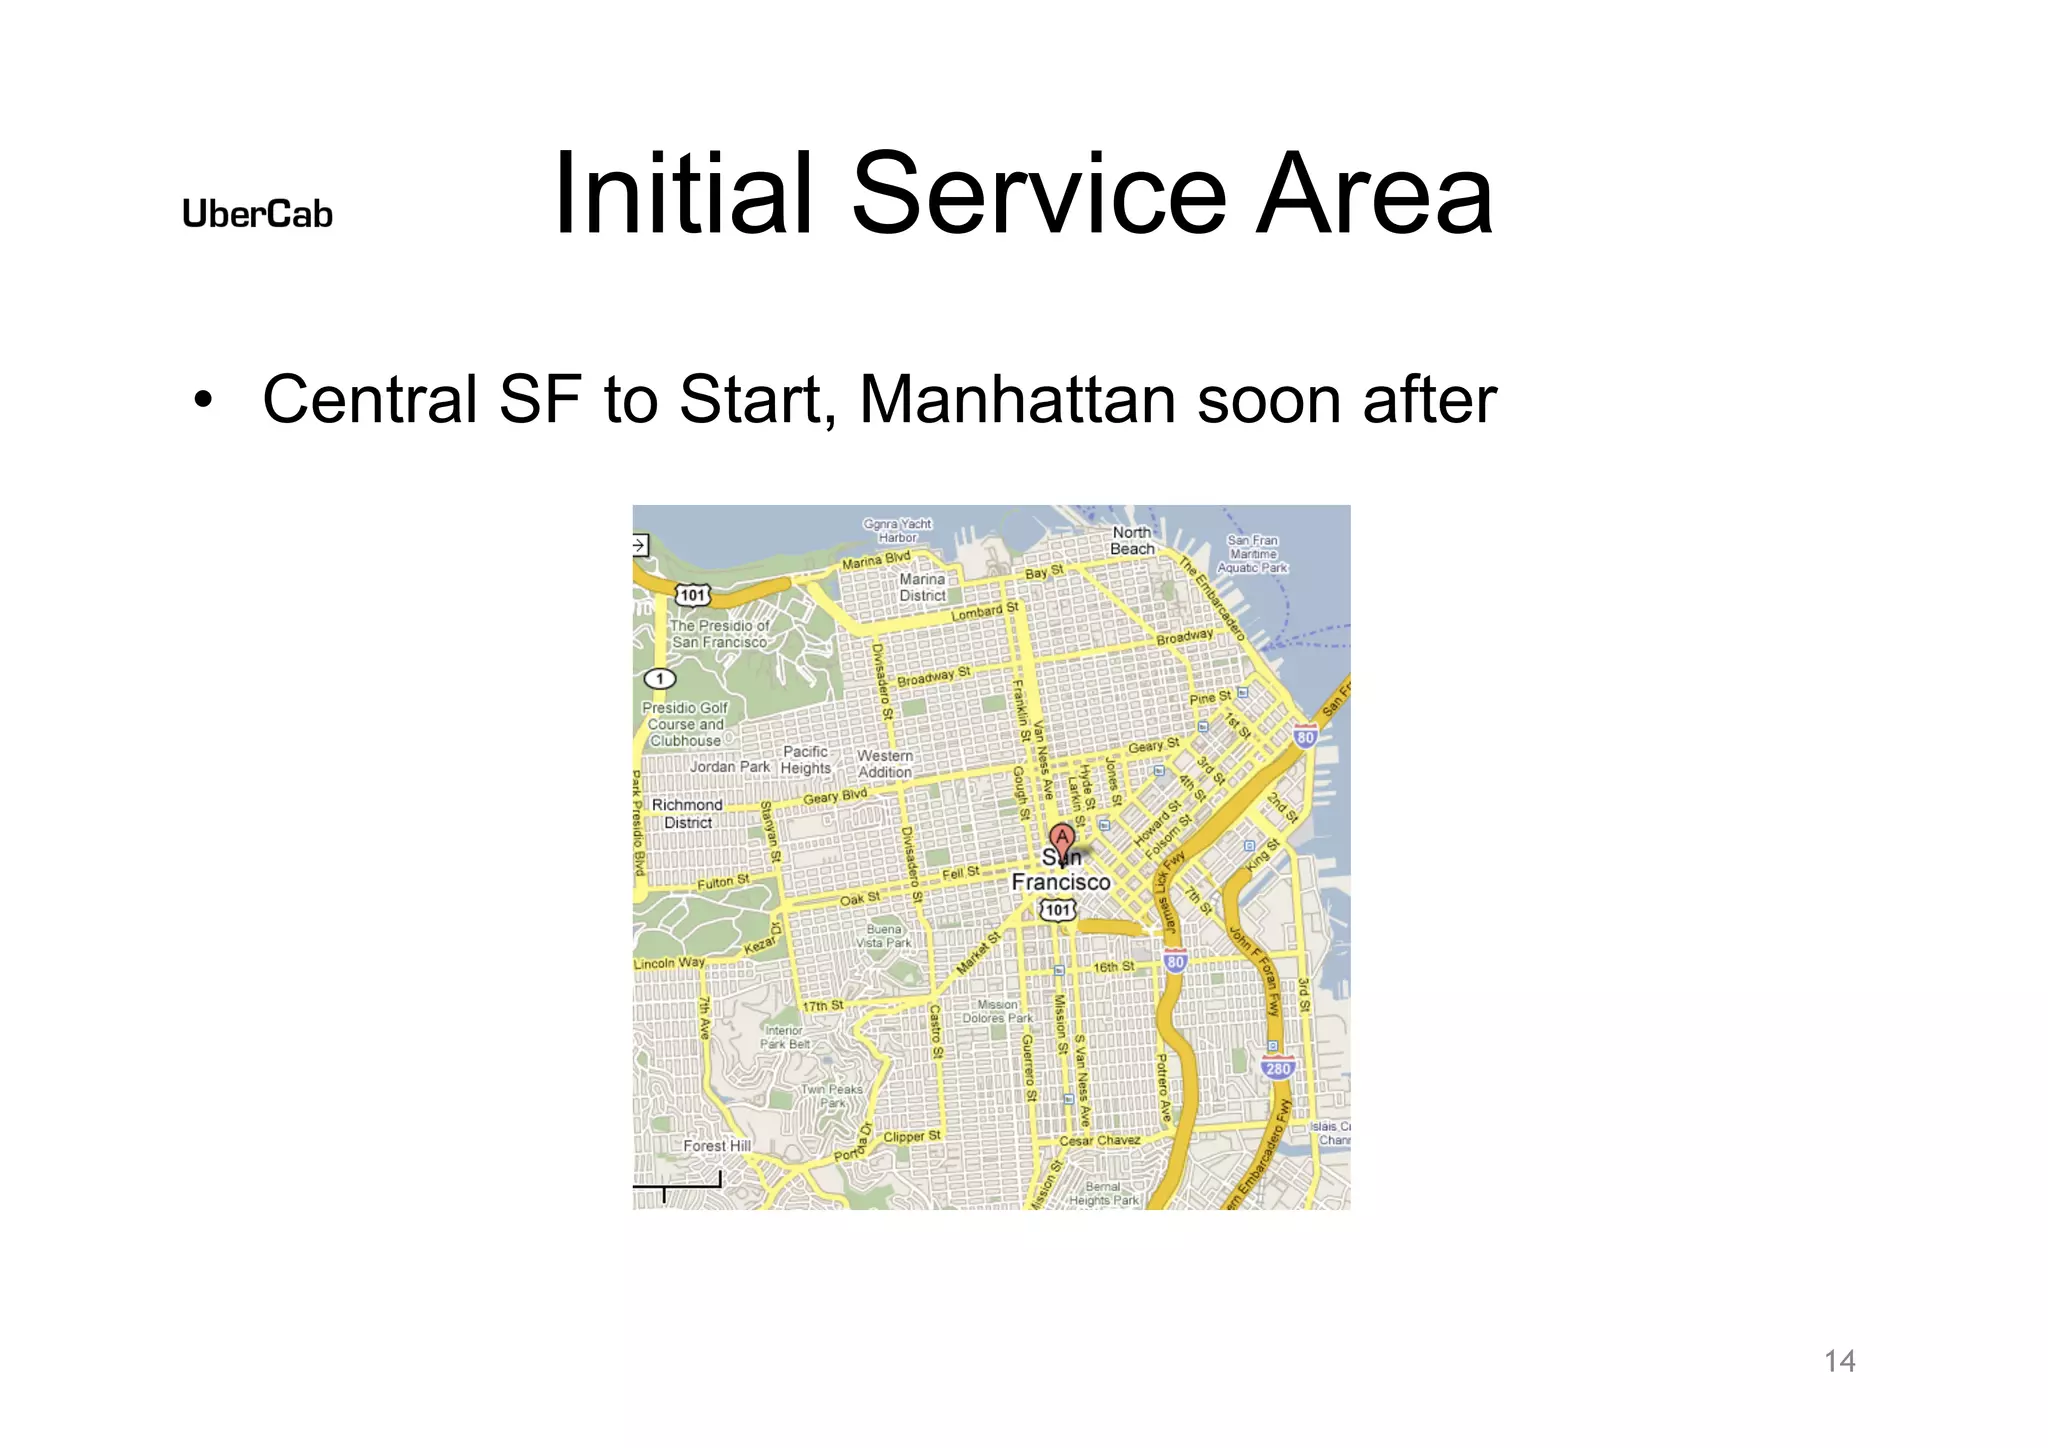
  • Geography: Central San Francisco first
  • Target customer: Affluent professionals, tech-savvy early adopters
  • Rationale: High density, favorable regulatory environment, tech-savvy population

Phase 2 - Flagship Market:

  • Geography: Manhattan (NYC)
  • Timing: “Soon after” SF launch (timeline not specified)
  • Rationale: Largest market ($978M), most prestigious, validates national scalability

Phase 3 - Systematic Expansion:

  • Cities: LA, Chicago, Houston, PA, Dallas
  • Coverage: 50% of entire US market
  • Rationale: Next-largest markets by revenue

Acquisition Strategy (Slide 23):

  • “Invite Only, referred from an existing member” — Referral-based growth
  • Network effects: Each member can invite others; creates viral loop
  • Quality control: Curated membership ensures professional clientele
  • Brand positioning: “The One-click cab” or “The NetJets of Limos”

Marketing Ideas (Slide 23):

  • Become the ubiquitous “premium” cab service (vs. YellowCab)
  • Possible slogans: “The One-click cab,” “The NetJets of Limos,” “Cabs2.0”
  • Leverage brand positioning as premium alternative

Challenges Not Addressed:

  • How to acquire initial critical mass of customers (chicken-and-egg problem)
  • How to recruit drivers (supply-side problem)
  • How to navigate regulatory approval in each city
  • How to respond to competitive threats from incumbents

The Ask

Funding Round: Seed ($200K) - already raised
Series A Ask: “A few million” (vague; likely $2-5M)

Use of Funds (Slide 25):

  • Buy 3 cars (initial fleet)
  • Develop app (iOS, BlackBerry, Symbian)
  • Hire General Manager
  • Establish small office in SF
  • Implied: Driver recruitment, customer acquisition, operations

Funding Timeline:

  • Seed: $200K (already raised)
  • Series A: “A few million” (to be raised)
  • Target: Feb 1st demo (3 months from pitch date)

Valuation Context:

  • Seed round: $200K investment (valuation not stated)
  • Series A: “A few million” (valuation not stated)
  • Outcome: IPO at $75B valuation (2019)
  • Return multiple: ~375,000x on seed investment (if $200K seed at $0.0002/share)

Investor Deep Dive

Executive summary, strengths & red flags

Executive Summary

The Uber seed pitch deck from 2008 presents a compelling vision for disrupting the fragmented taxi and car service market through mobile technology and algorithmic dispatch. The founders identified a clear structural problem (medallion system inefficiency, aging technology, poor customer experience) and proposed a premium, app-based solution targeting affluent professionals in major US cities. What makes this deck notable is its combination of **specific market data** (medallion prices, market segmentation, city-by-city TAM), **technical sophistication** (predictive positioning, route optimization, multi-platform support), and **realistic financial projections** that proved massively conservative relative to Uber's actual trajectory. The deck demonstrates founders who understood both the regulatory landscape and the enabling technology (smartphone adoption) that would make their business model viable.

Key Strengths

8 identified

1

Specific, Data-Driven Problem Definition

- Slides 2-3 quantify the problem with concrete data (35% NYC taxi dead-time, $700K medallion prices, $31K driver salary)

2

Clear Market Fragmentation Insight

- Slide 17 shows $4.2B market with top 4 players = only 22% of revenues

3

Realistic Financial Projections

- Slide 20 presents three scenarios (best/realistic/worst) with specific numbers ($1B+ revenue, $20-30M profit, 10 cars/100 clients)

4

Technology Differentiation

- Slides 15-16 describe predictive positioning algorithm, route optimization, and patent-pending system design

5

Regulatory Strategy

- Slide 5 identifies membership model as regulatory loophole (avoid medallion requirements)

6

Multi-Platform Mobile Strategy

- Slides 8, 21 show support for iPhone, BlackBerry, Symbian, plus SMS fallback

7

Environmental & Social Impact

- Slide 12 addresses environmental benefits (hybrid vehicles, reduced dead-time, ridesharing)

8

Omnichannel Approach

- Slides 8-9 show web (UberCab.com), mobile apps, and SMS access

Red Flags & Weaknesses

10 identified

1

No Team Credentials

- Deck lacks a "Team" slide with founder bios, relevant experience, or advisor names

2

Minimal Traction

- Only 15 pre-launch clients and 5 advisors (names not provided)

3

Vague Funding Ask

- Series A ask is "a few million" (not specific)

4

Contradictory Positioning

- Deck positions as "premium" (Mercedes, luxury) but also discusses cost reduction (used cars, Prius)

5

Regulatory Risk Underestimated

- Slide 5 assumes membership model avoids medallion requirements; doesn't address potential TLC/regulatory challenges

6

Driver Supply Problem Not Addressed

- No mention of driver recruitment strategy, driver compensation, or driver supply constraints

7

Membership Model Limits Growth

- Invite-only, referral-based model constrains addressable market and growth rate

8

Smartphone Adoption Assumption

- Business model depends on smartphone adoption; in 2008, smartphones were still niche (iPhone = 10% of market)

9

Unsupported Claims

- Several claims lack supporting data:

10

No Competitive Analysis

- Deck doesn't identify or analyze specific competitors

More Pitch Decks To Study

Compare structure, fundraising context, and investor-facing story across similar startup decks.