Compare your deck to Headout

Compare Your Deck

Headout Pitch Deck (2015)

Marketplace
Stage: Seed
Raised: $1.8M
Year: 2015
Slides: 18
Outcome: Raised $60M+ total; leading experiences marketplace

Pitch Deck

1 / 18
Headout pitch deck - Cover & Positioning: clear brand and headline value prop
Click to expand

Deck Analysis

This deck for Headout (Seed, 2015) presents a tight, visually-driven pitch for an on‑demand mobile marketplace that connects travelers with last‑minute tours and activities. It clearly frames a large, addressable market for spontaneous local experiences, lays out the two‑sided pain (travelers lack simple last‑minute booking; suppliers have unsold inventory), and shows early traction and unit economics that justify expansion. Notable is the mobile‑first positioning, concise metrics and competitive comparisons that together make a compelling case for seed investors focused on marketplace scale.

Cover & Positioning: clear brand and headline value prop

Cover & Positioning: clear brand and headline value prop

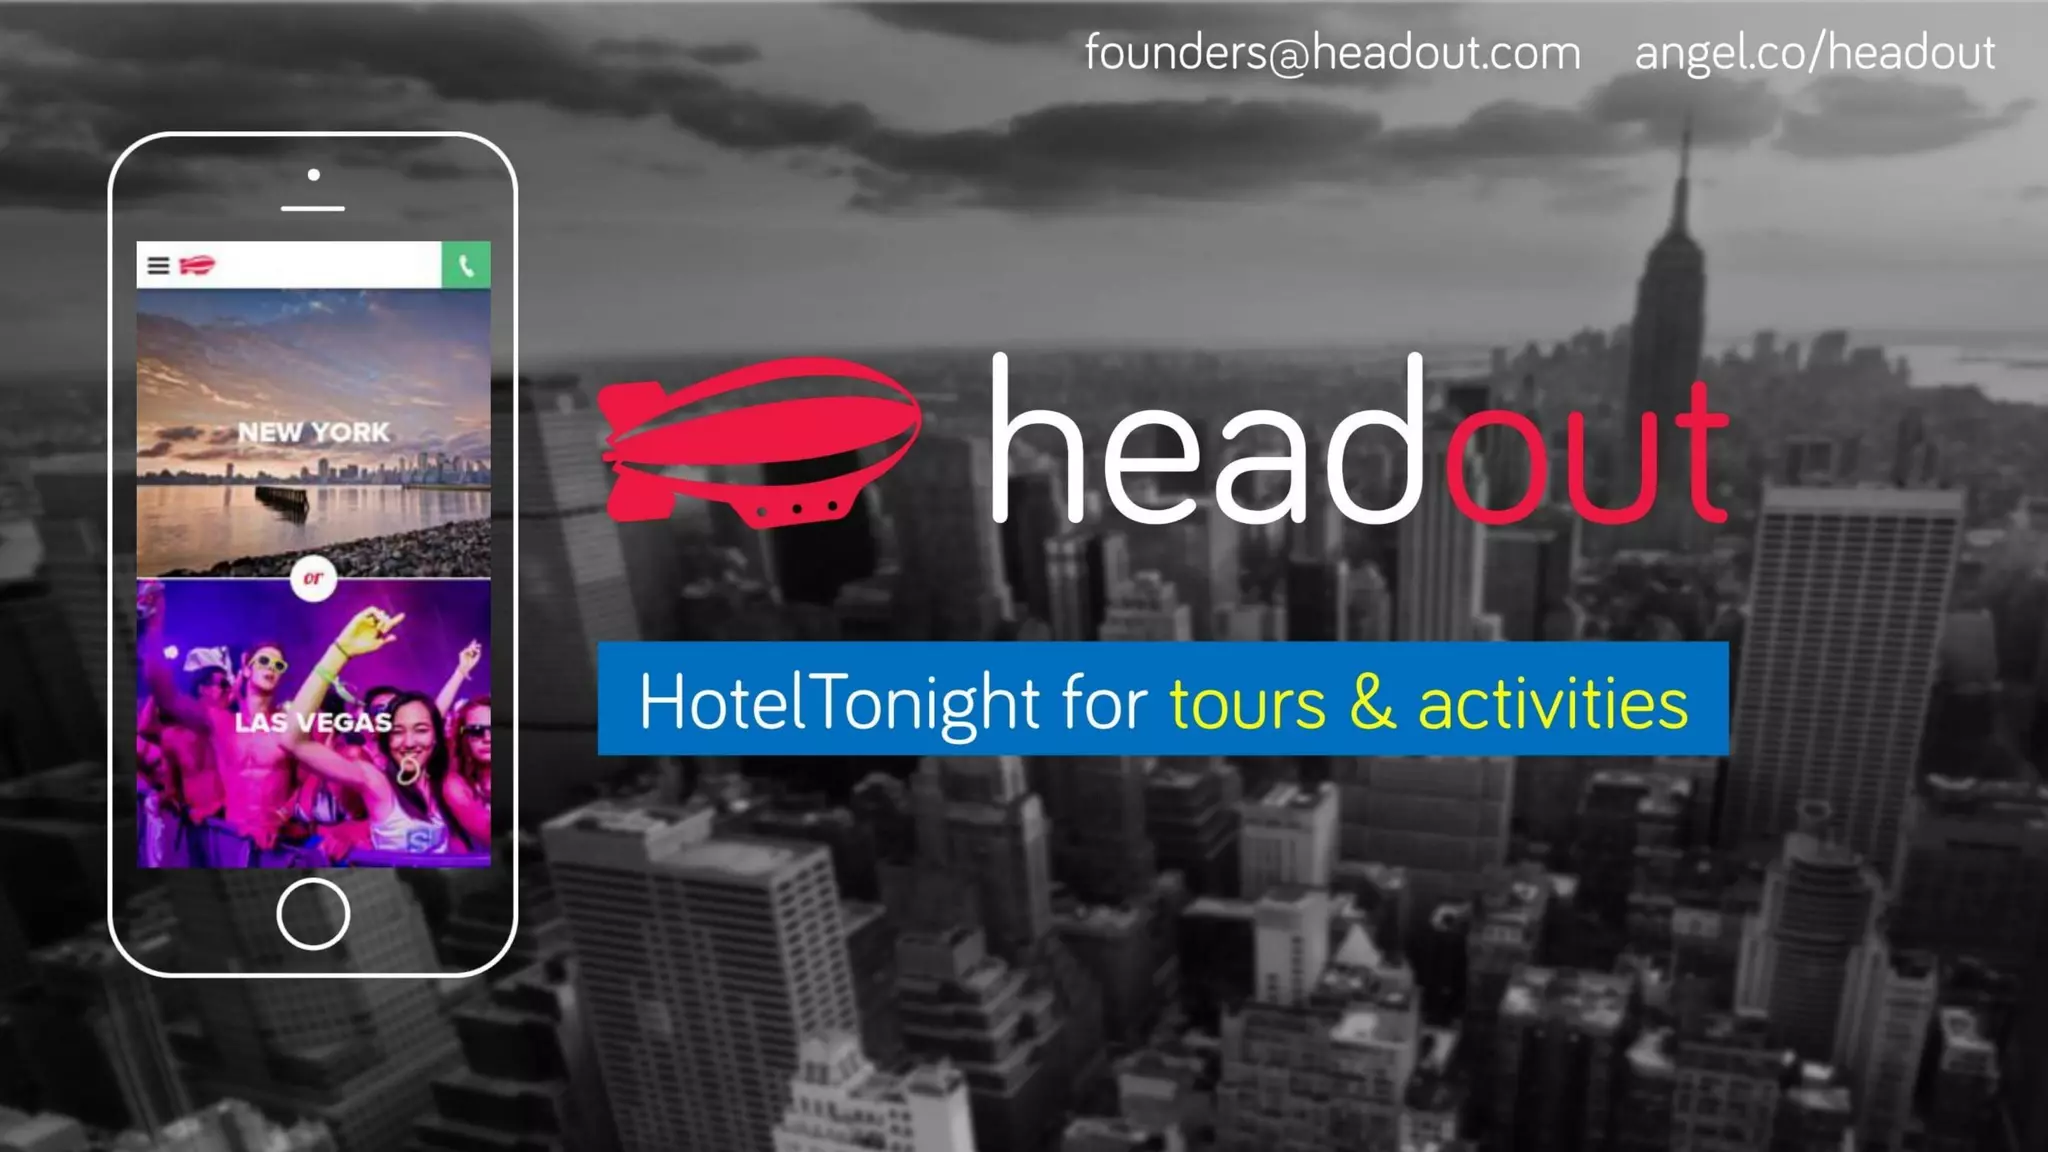
The opening slide (logo, phone mockup and “HotelTonight for tours & activities”) delivers immediate context — mobile, last‑minute, experiences — using a familiar benchmark to speed investor understanding. Visuals are bold and relevant (city skyline, app screen) making it obvious what the product is and who it targets.
Founders can learn from the clarity: leading with a tight one‑line positioning plus a recognizable comparator (HotelTonight) reduces cognitive load and makes the rest of the deck easier to digest. The contact details subtly placed at the top signal readiness to engage without cluttering the frame.

Key Takeaway: Start with a single, crystal‑clear positioning line (and, if helpful, a short well‑chosen comparator) to orient listeners immediately.

Market Opportunity: quantify demand for last‑minute experiences

Market Opportunity: quantify demand for last‑minute experiences

Slide 2 uses a large, central figure ($84 billion) to anchor the market opportunity, with lifestyle imagery showing diverse experience categories (tours, skyline, adventure). This is an effective visual shorthand to communicate scale and relevance: large number + evocative photos = big, tangible market.
The slide also emphasizes the specific behavior (spent on local experiences less than 24h in advance), which narrows the TAM into a focused, defendable segment. Founders should emulate this: big TAM numbers are useful, but pairing them with a concrete user behavior (last‑minute bookings) makes the opportunity actionable and easier to model.

Key Takeaway: Quantify the market and pair it with a specific user behaviour to turn a large TAM into a concrete, investible opportunity.
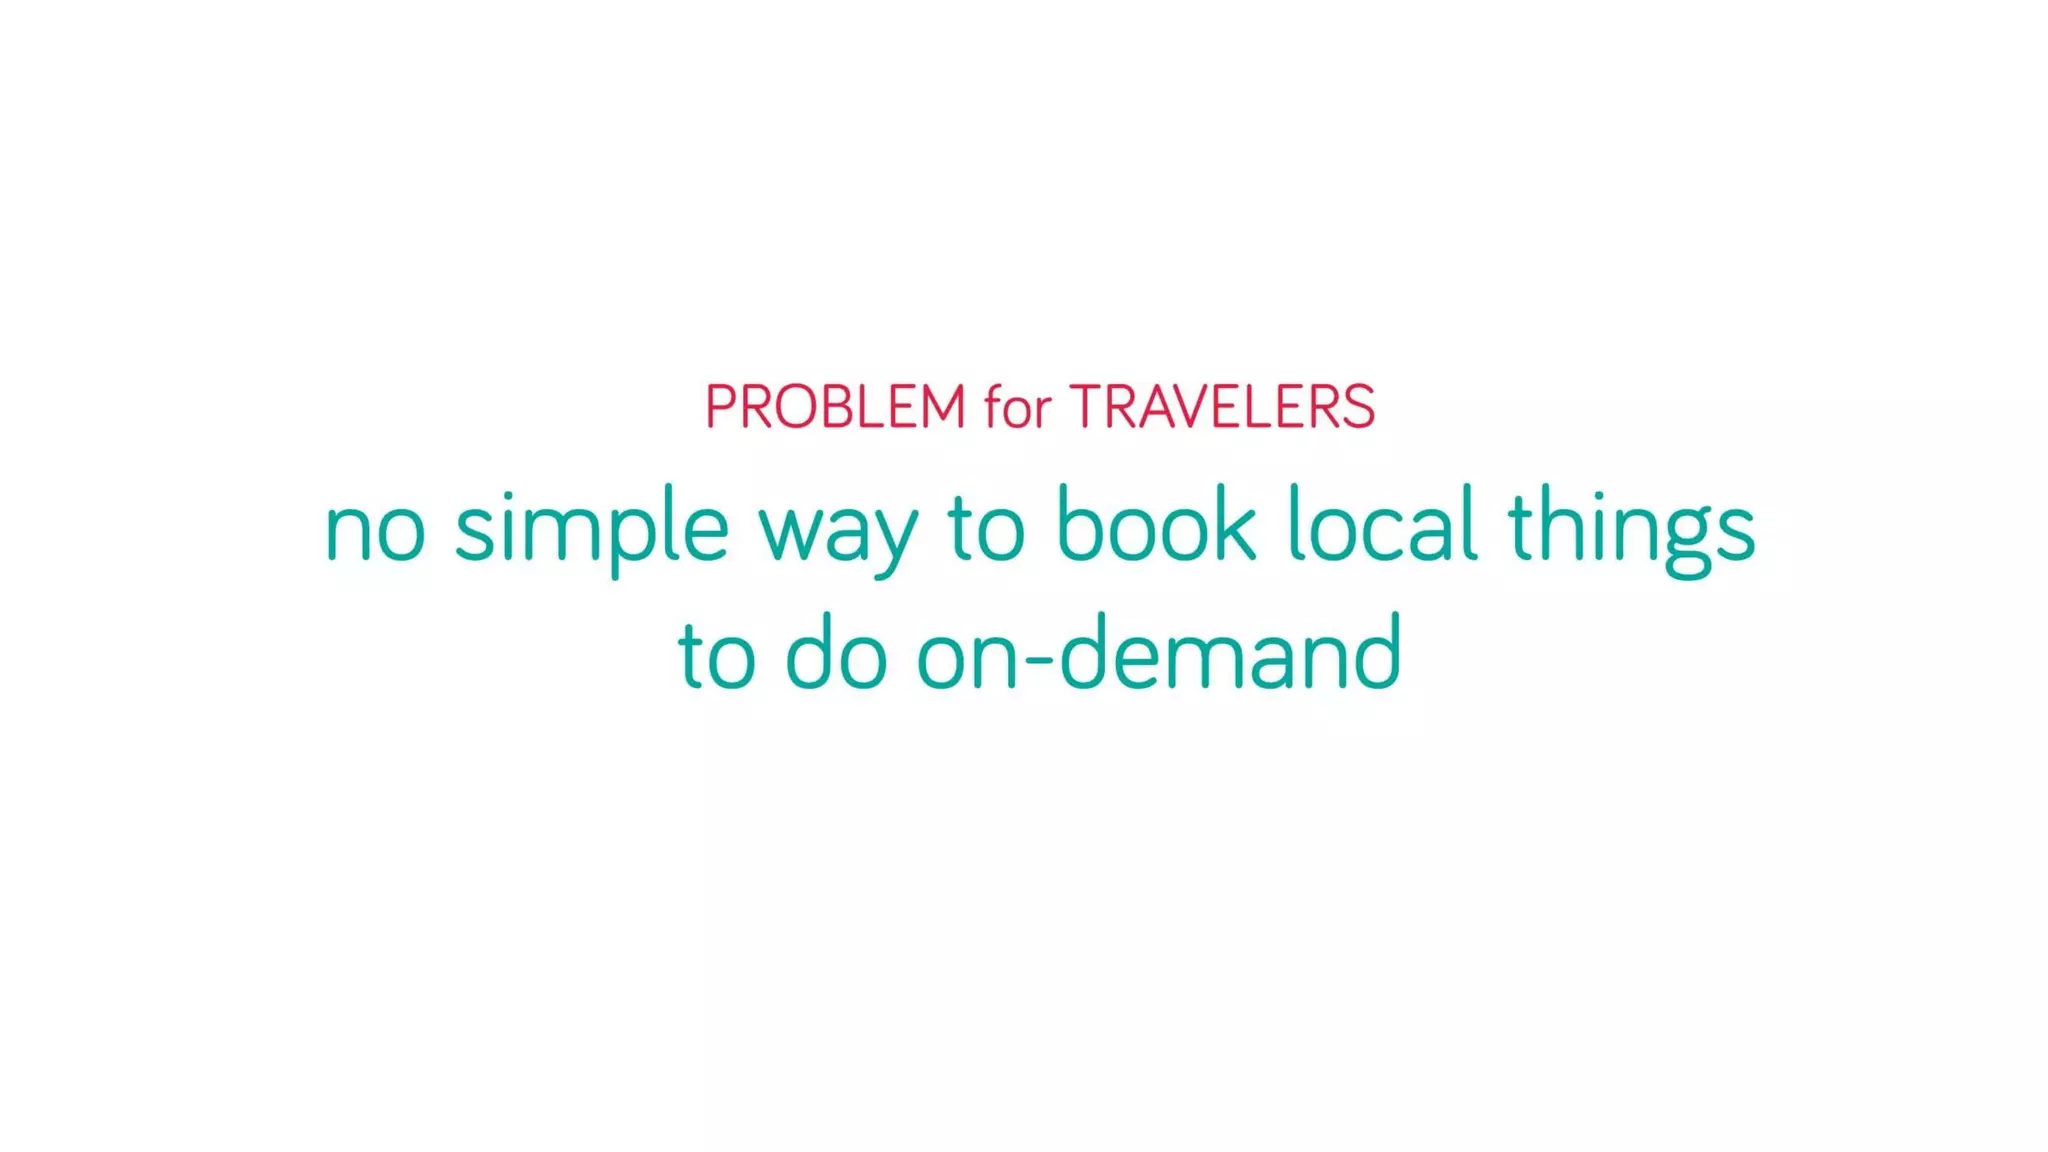
Customer Problem: last‑minute bookings happen offline

Customer Problem: last‑minute bookings happen offline

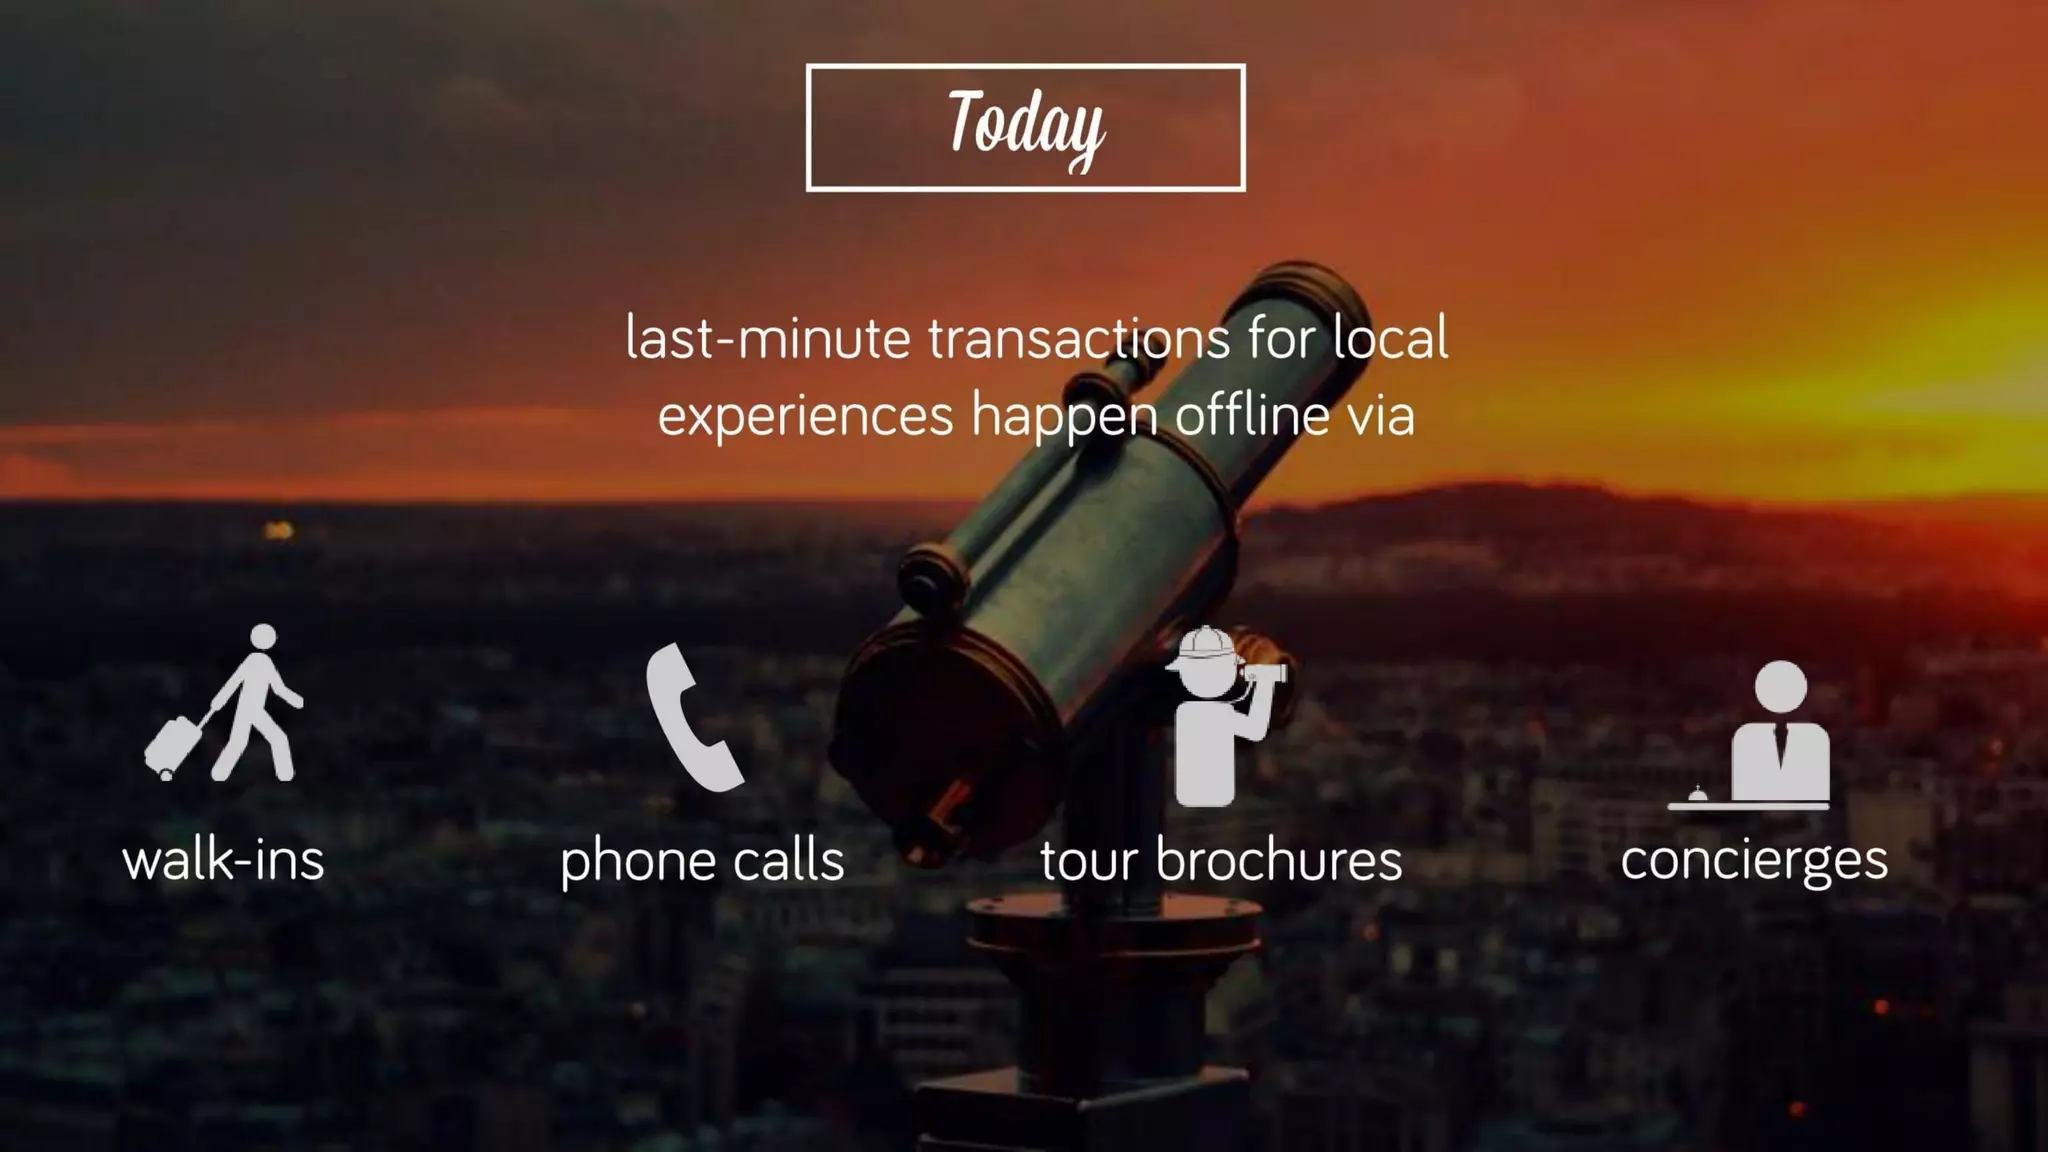
Slide 3 succinctly states the traveler problem — last‑minute transactions happen offline via walk‑ins, phone calls, brochures and concierges — using clear iconography and short copy. This demonstrates a real UX gap: convenience and speed are missing from the offline flow that travelers currently use.
The strength here is simplicity and empathy: the deck shows the exact existing behaviors the product will replace. Startups should map the incumbent behaviour and channels they disrupt — this makes the value proposition believable and shows a direct path to changing customer habits.

Key Takeaway: Illustrate the incumbent customer journey explicitly and show how your product replaces each friction point with a simpler flow.
Supplier Problem: unsold inventory & monetization leverage

Supplier Problem: unsold inventory & monetization leverage

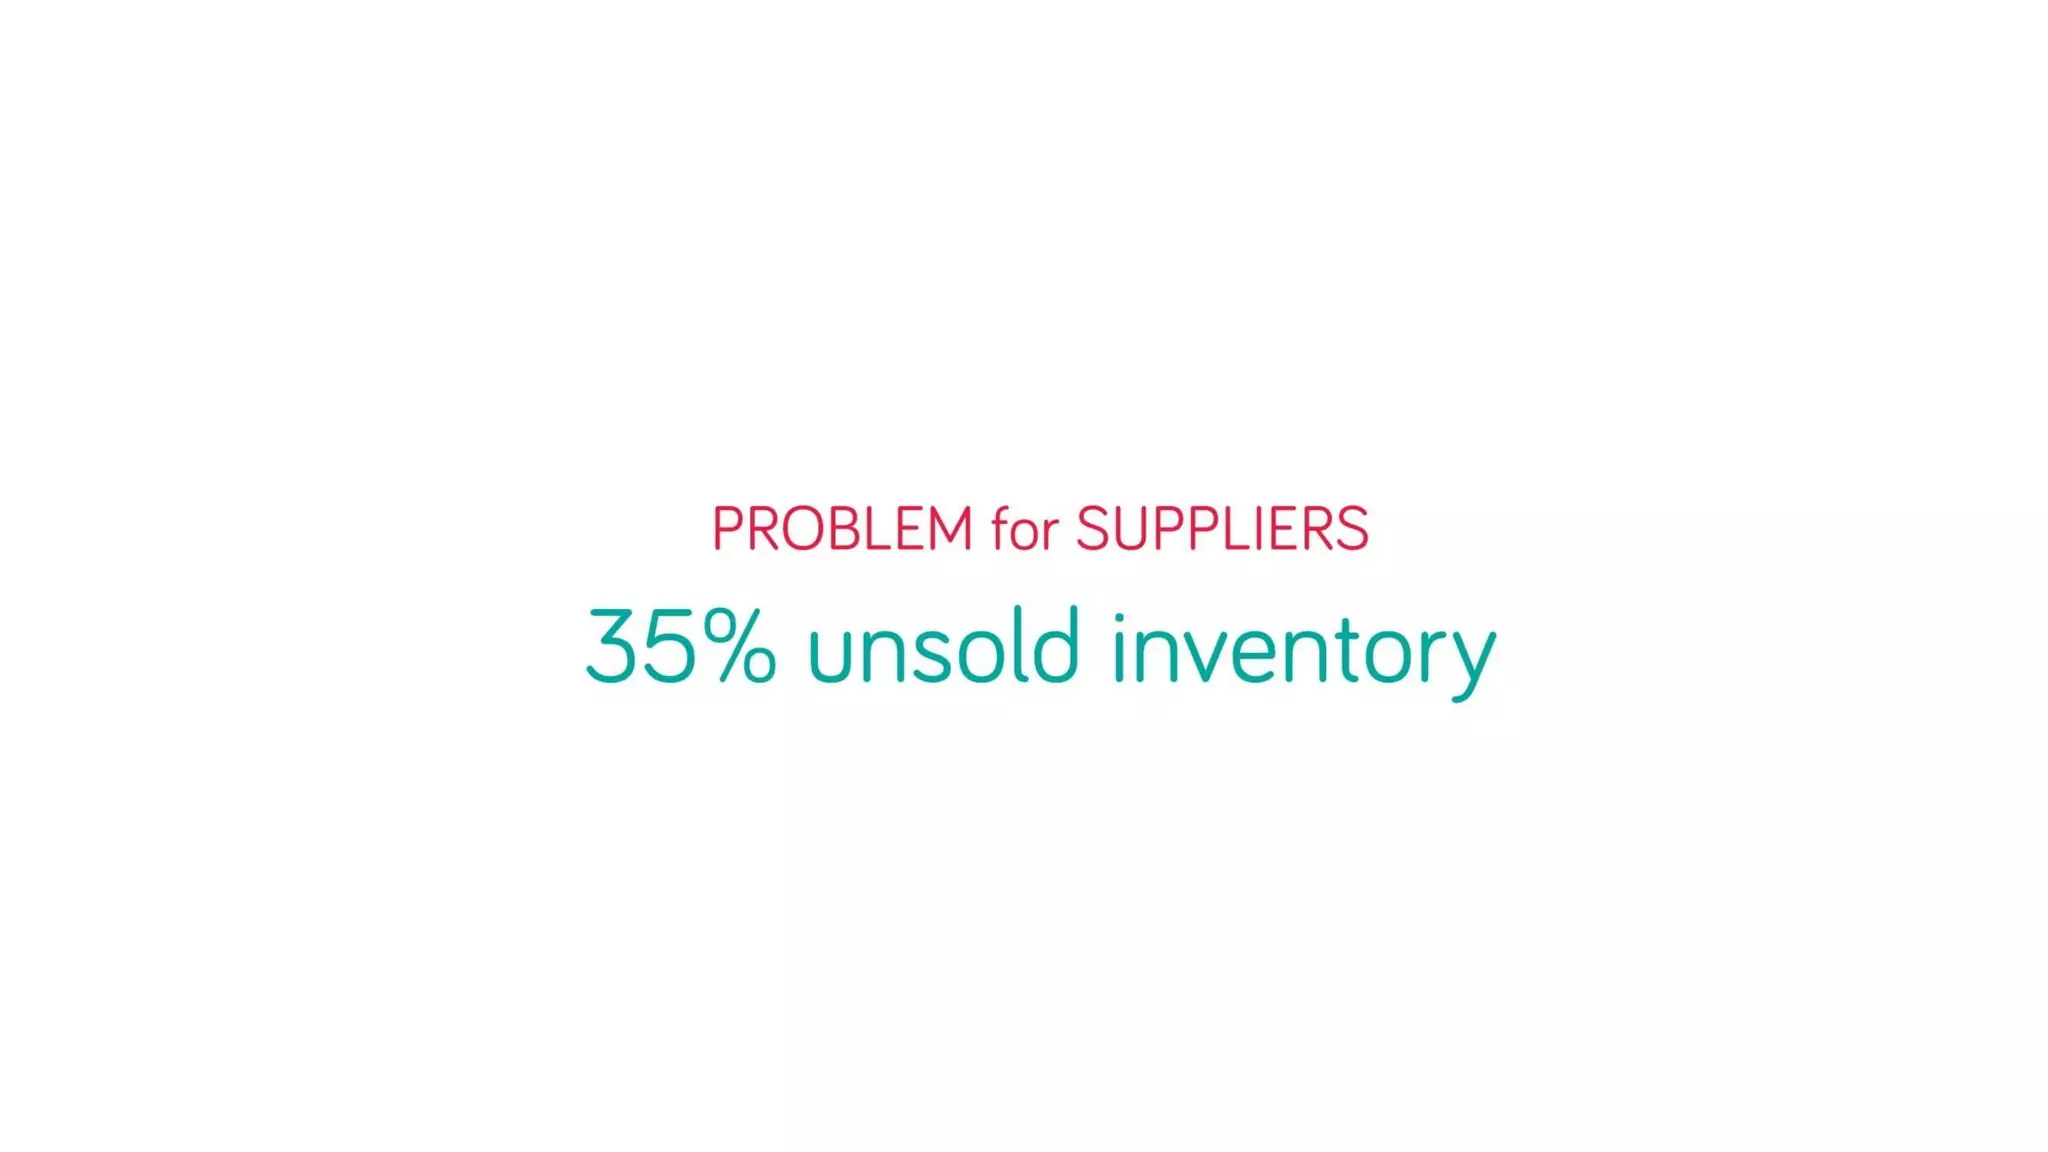
Slide 5 calls out '35% unsold inventory' as the supplier pain point — short, numeric, and compelling. By highlighting supplier economics the deck establishes why partners would list on the marketplace, addressing the two‑sided platform challenge (supply must be motivated to participate).
This is an important lesson: marketplaces live and die by supplier economics. Showing a clear quantifiable pain (empty seats) positions the business as not just customer‑facing but supply‑enabling, which strengthens go‑to‑market and monetization narratives for investors.

Key Takeaway: Demonstrate a measurable supplier pain (e.g., unsold inventory) so investors see why supply will engage and why marketplace liquidity is achievable.
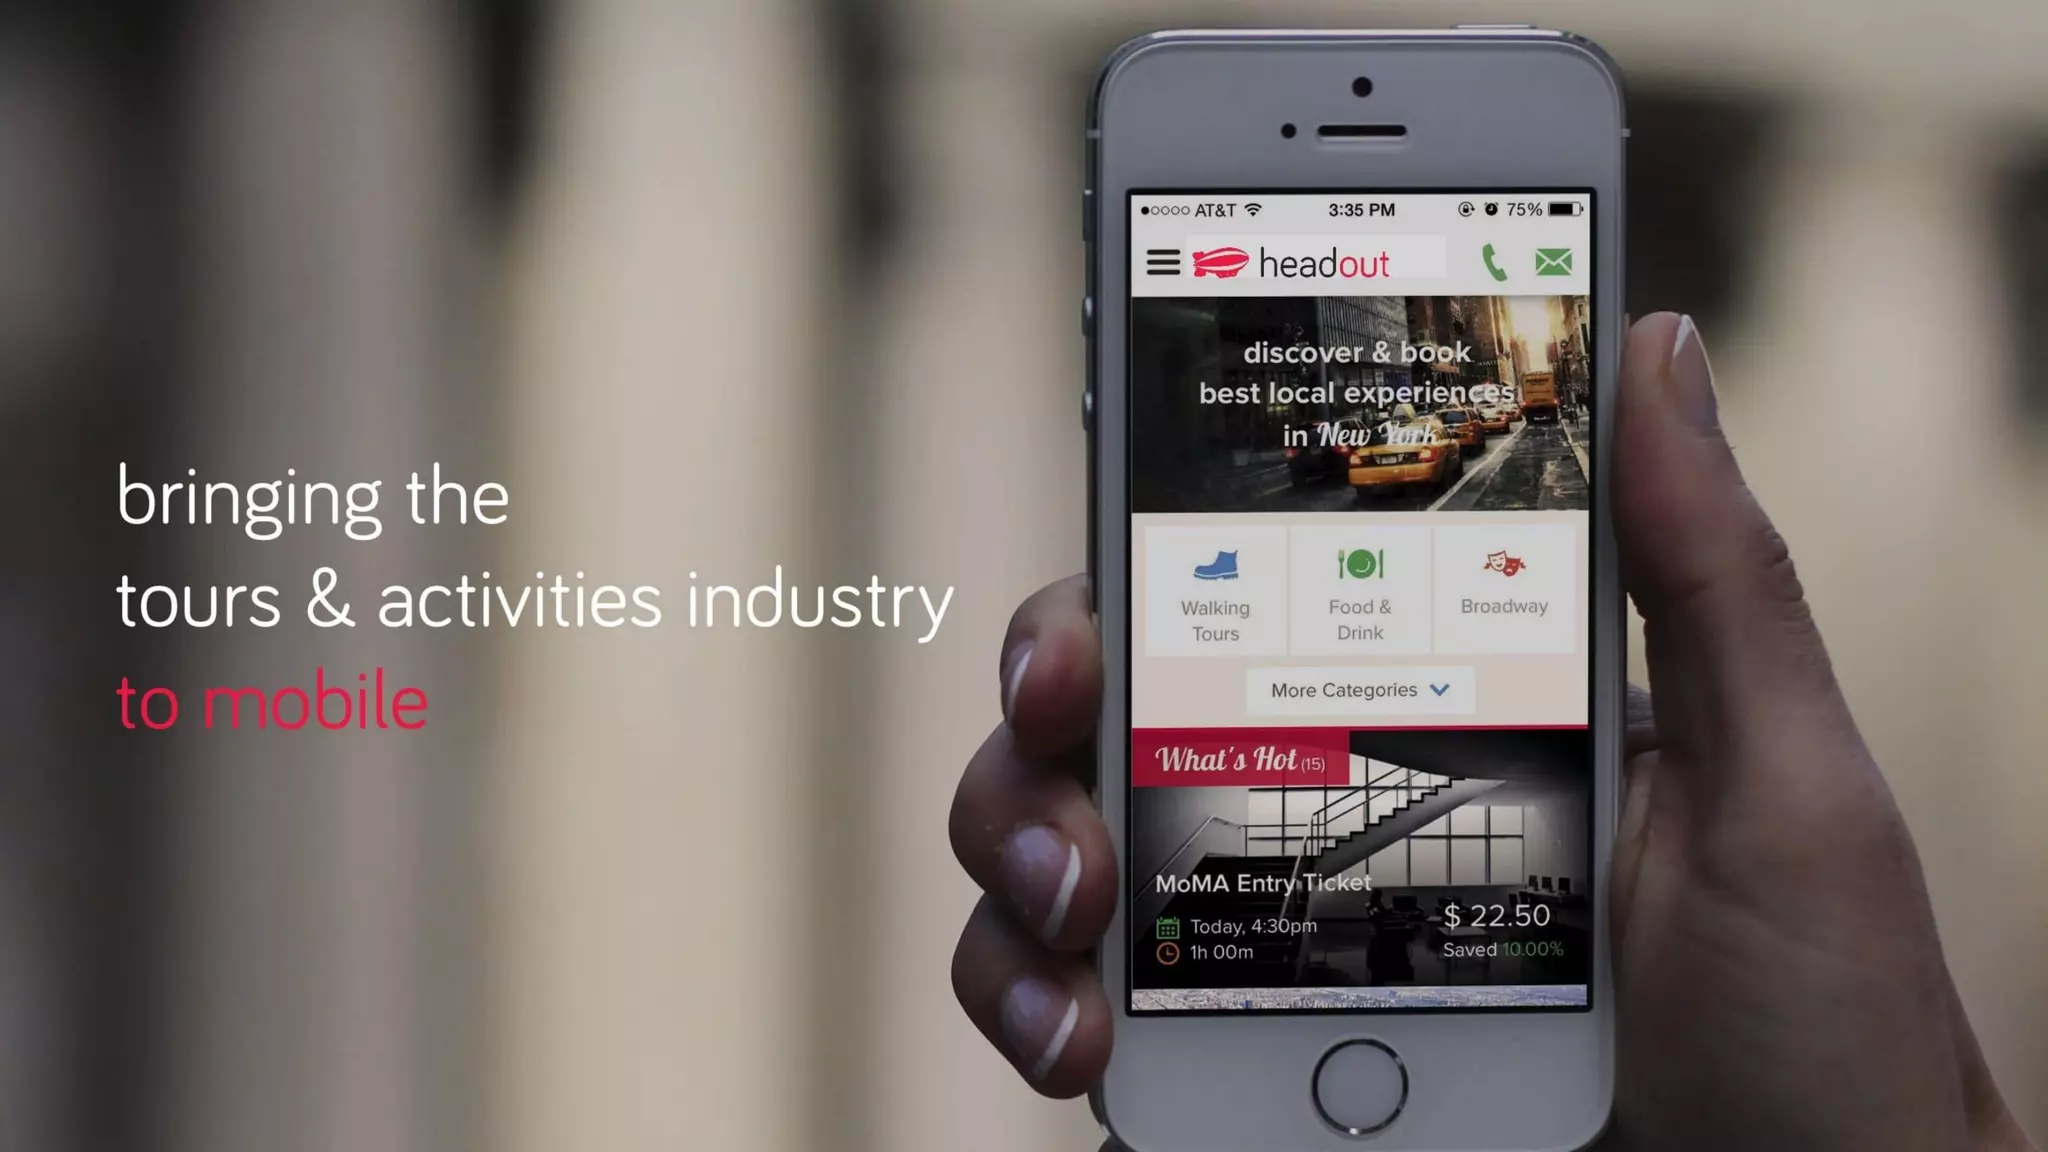
Product: mobile‑first, 24‑hour on‑demand marketplace

Product: mobile‑first, 24‑hour on‑demand marketplace

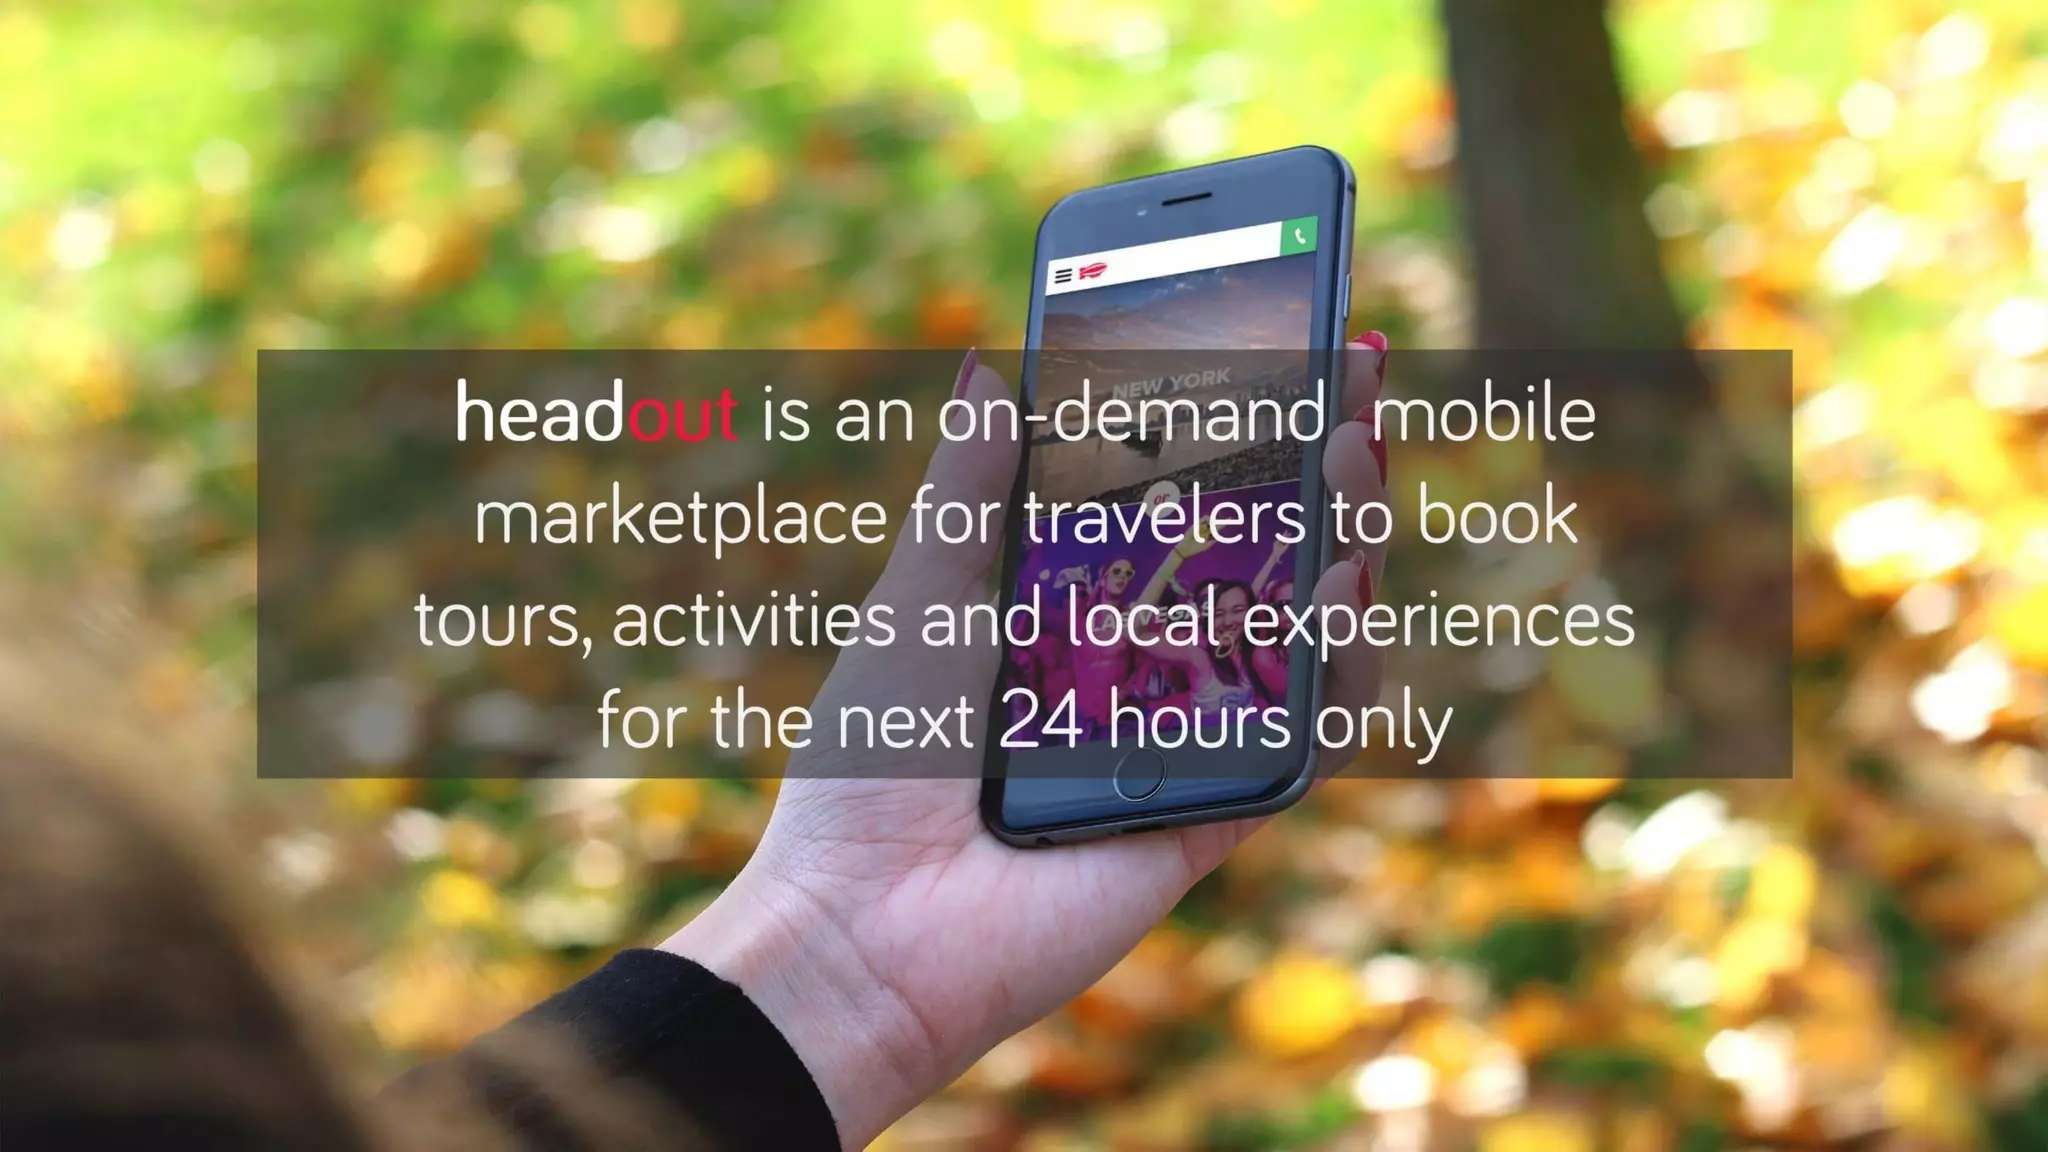
Slide 6 describes the product concisely: 'an on‑demand mobile marketplace for travelers to book tours, activities and local experiences for the next 24 hours only.' The slide combines a realistic app screenshot with readable overlay text, reinforcing the mobile‑first design and time‑bounded nature of the offering.
This is effective because it ties product features (mobile, last‑minute) directly to the defined user behavior and market. Founders should aim for this alignment — product claims must map back to the market and the problems previously laid out so the narrative remains cohesive.

Key Takeaway: Make the product positioning explicit and directly link features to the customer behavior and supplier pain you previously defined.
Traction: early users and month‑over‑month growth

Traction: early users and month‑over‑month growth

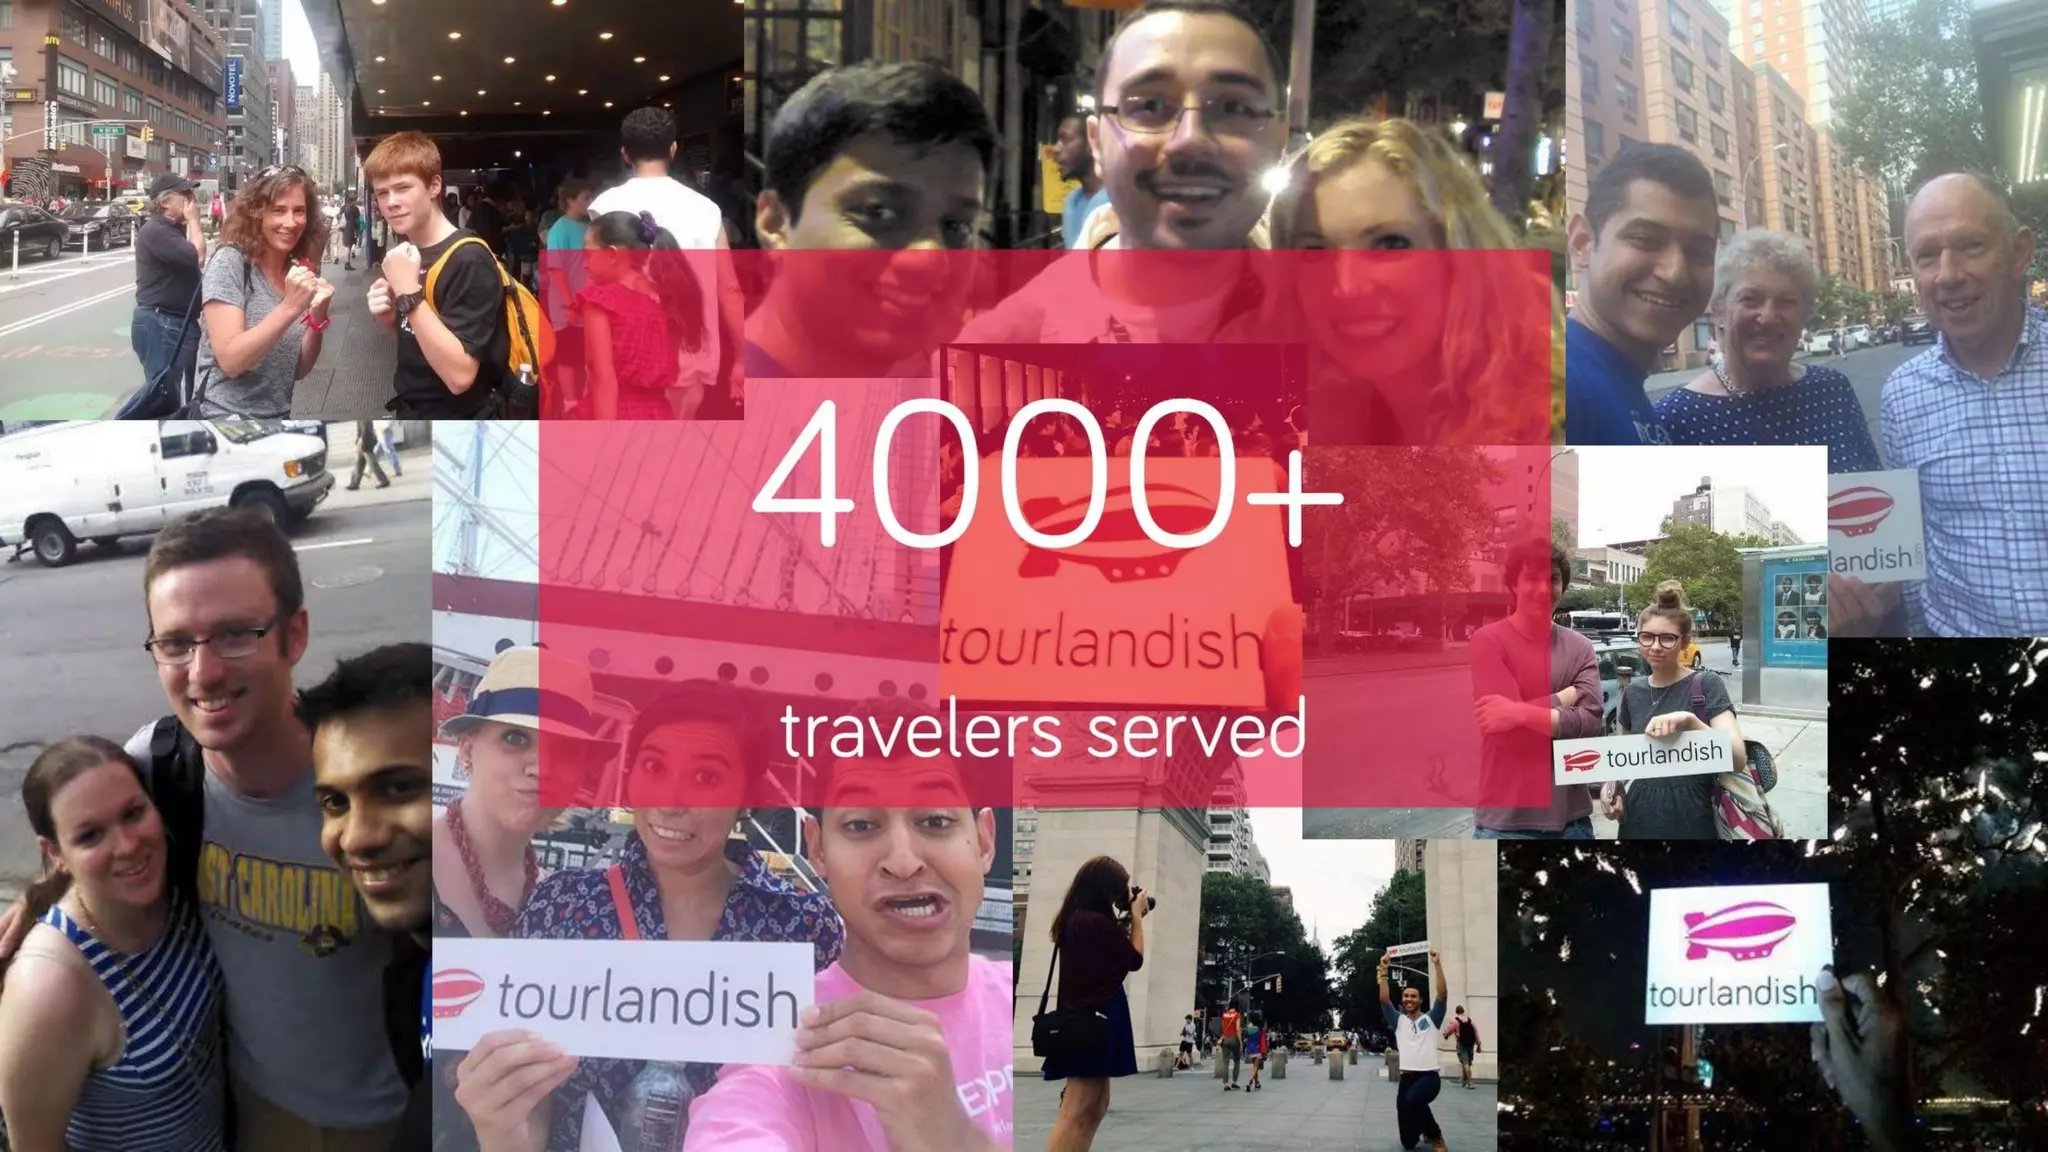
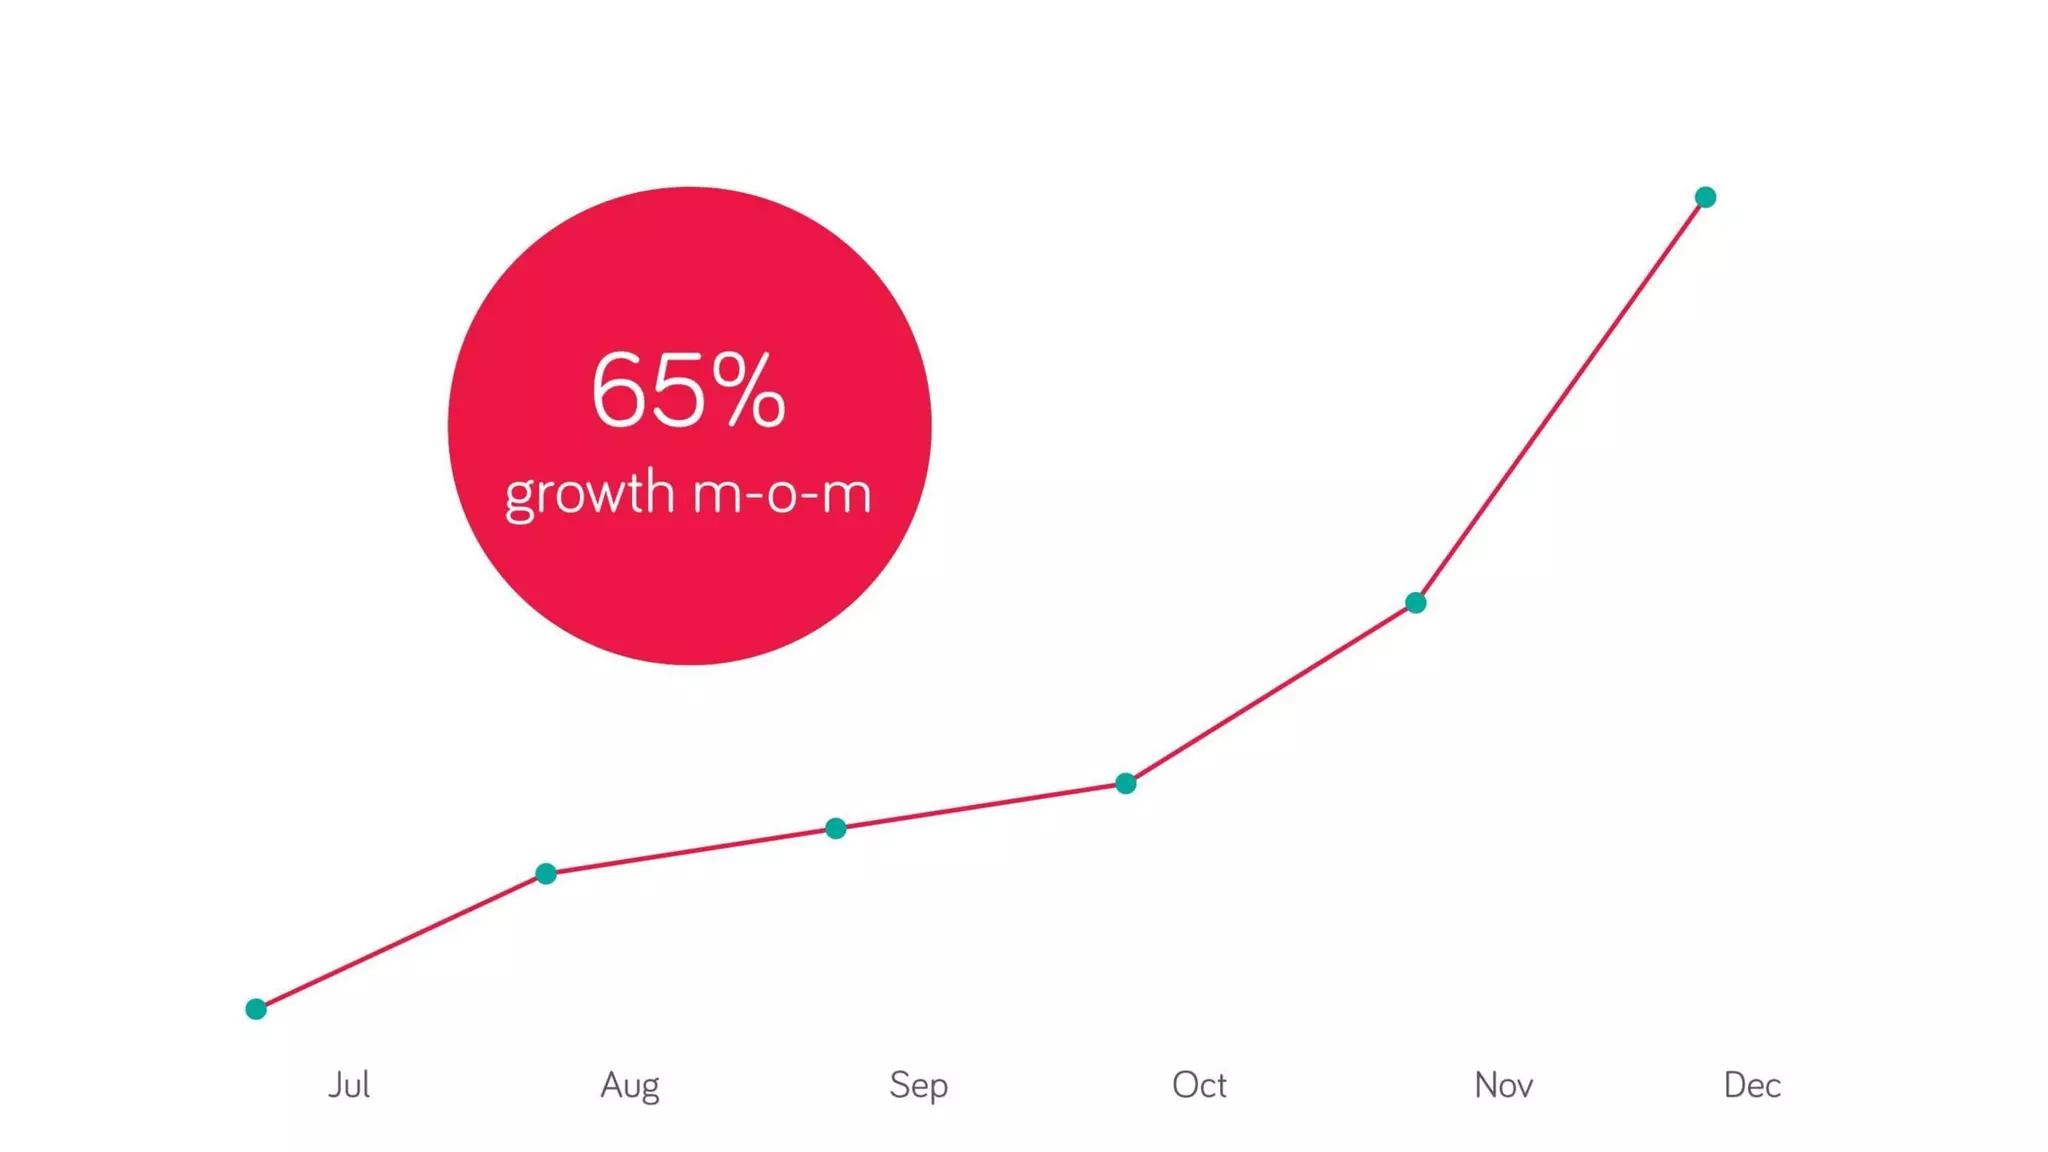
Slide 9 showcases user traction (4000+ travelers served) using a photo collage that humanizes the metric; slide 11 shows a month‑over‑month growth curve with a highlighted 65% growth figure. Together they communicate both social proof and fast growth velocity — two critical investor signals at seed stage.
The combination of qualitative (photos of happy users) and quantitative (growth chart) is a strong technique: numbers prove scale while imagery proves real user adoption. Founders should present both to create a fuller picture of traction and to convert abstract growth into tangible customer stories.

Key Takeaway: Pair hard traction metrics with human stories or photos to make growth feel real and credible to investors.
Differentiation & Go‑to‑Market: unit advantage and rapid roll‑out

Differentiation & Go‑to‑Market: unit advantage and rapid roll‑out

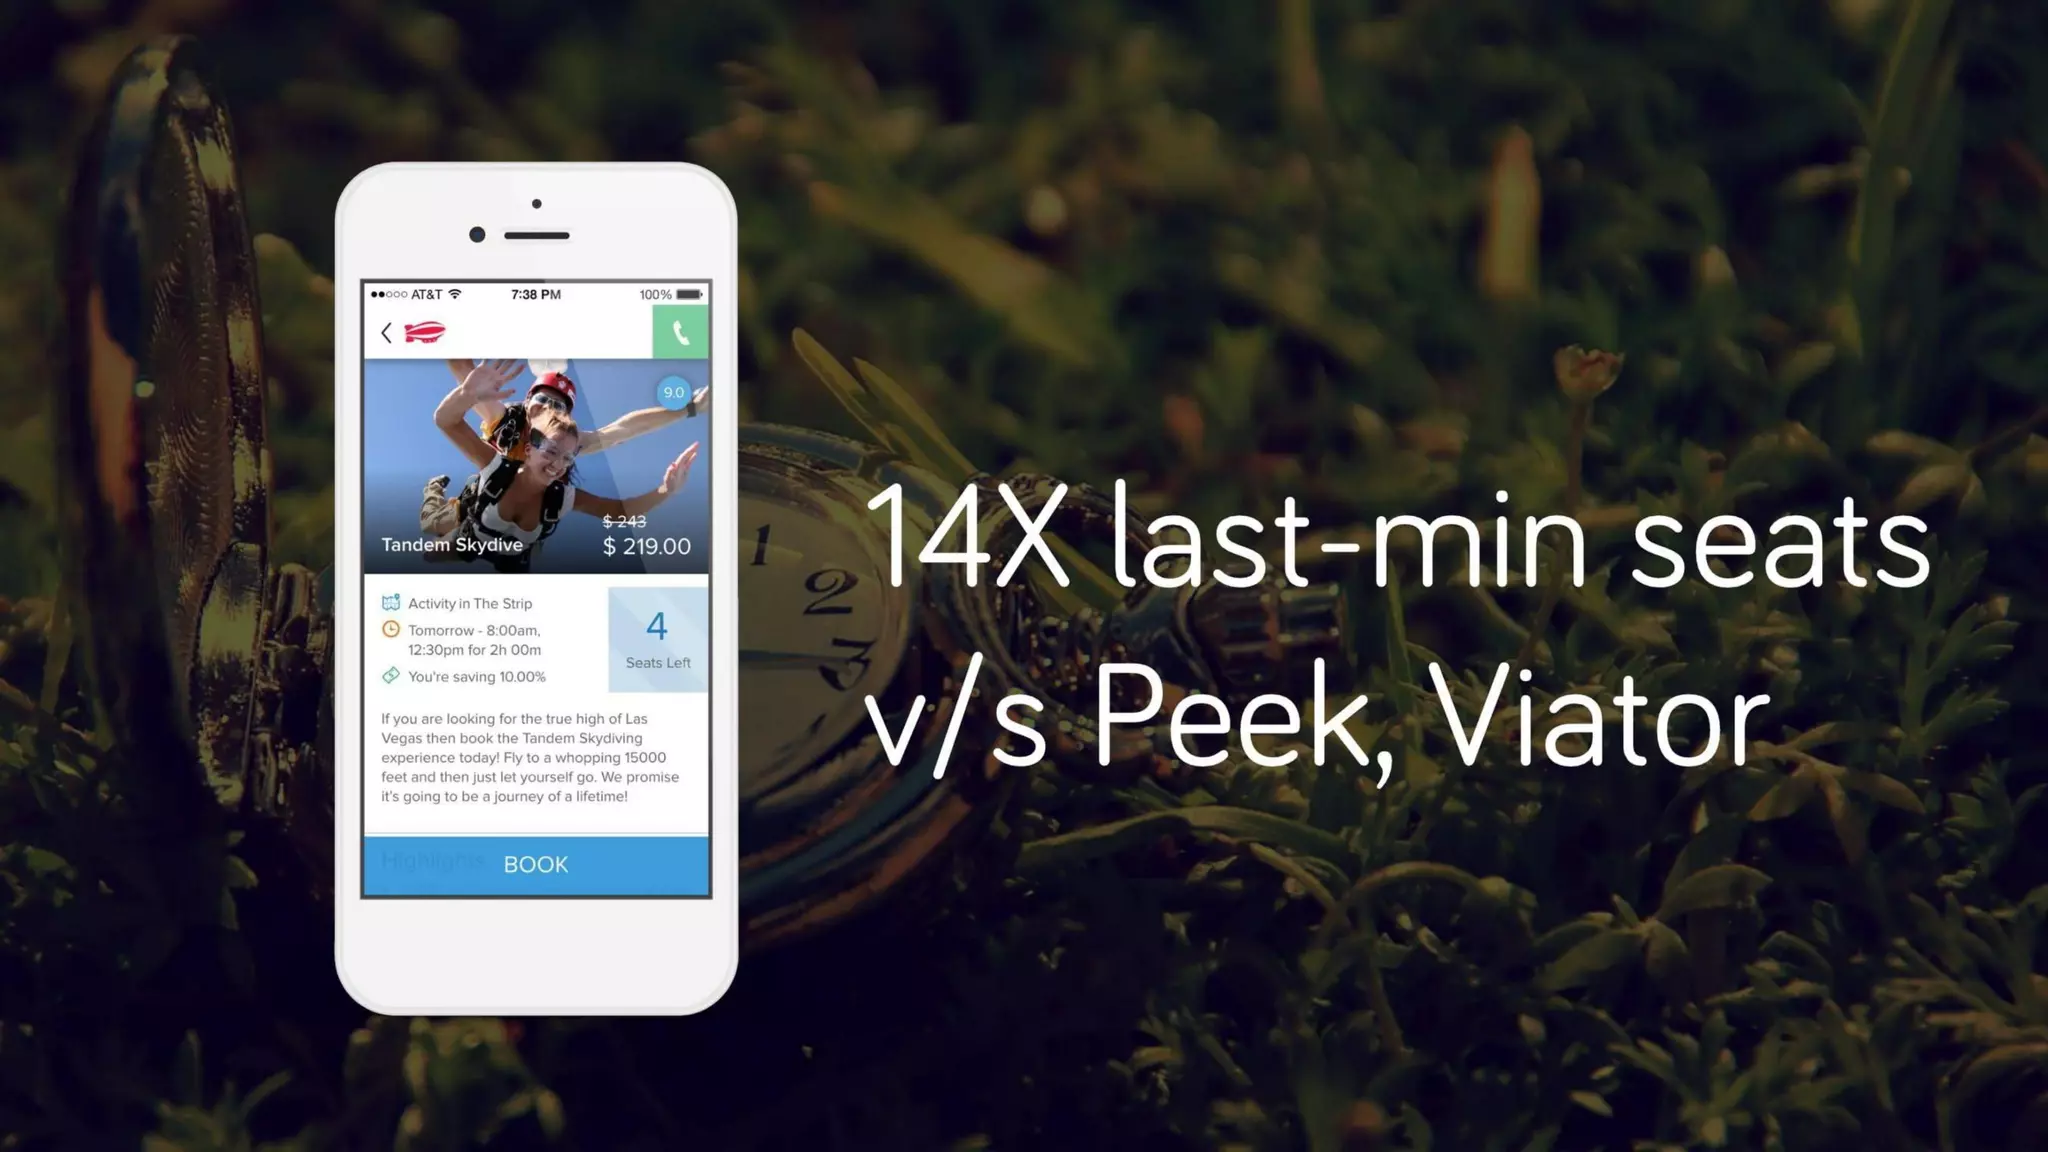
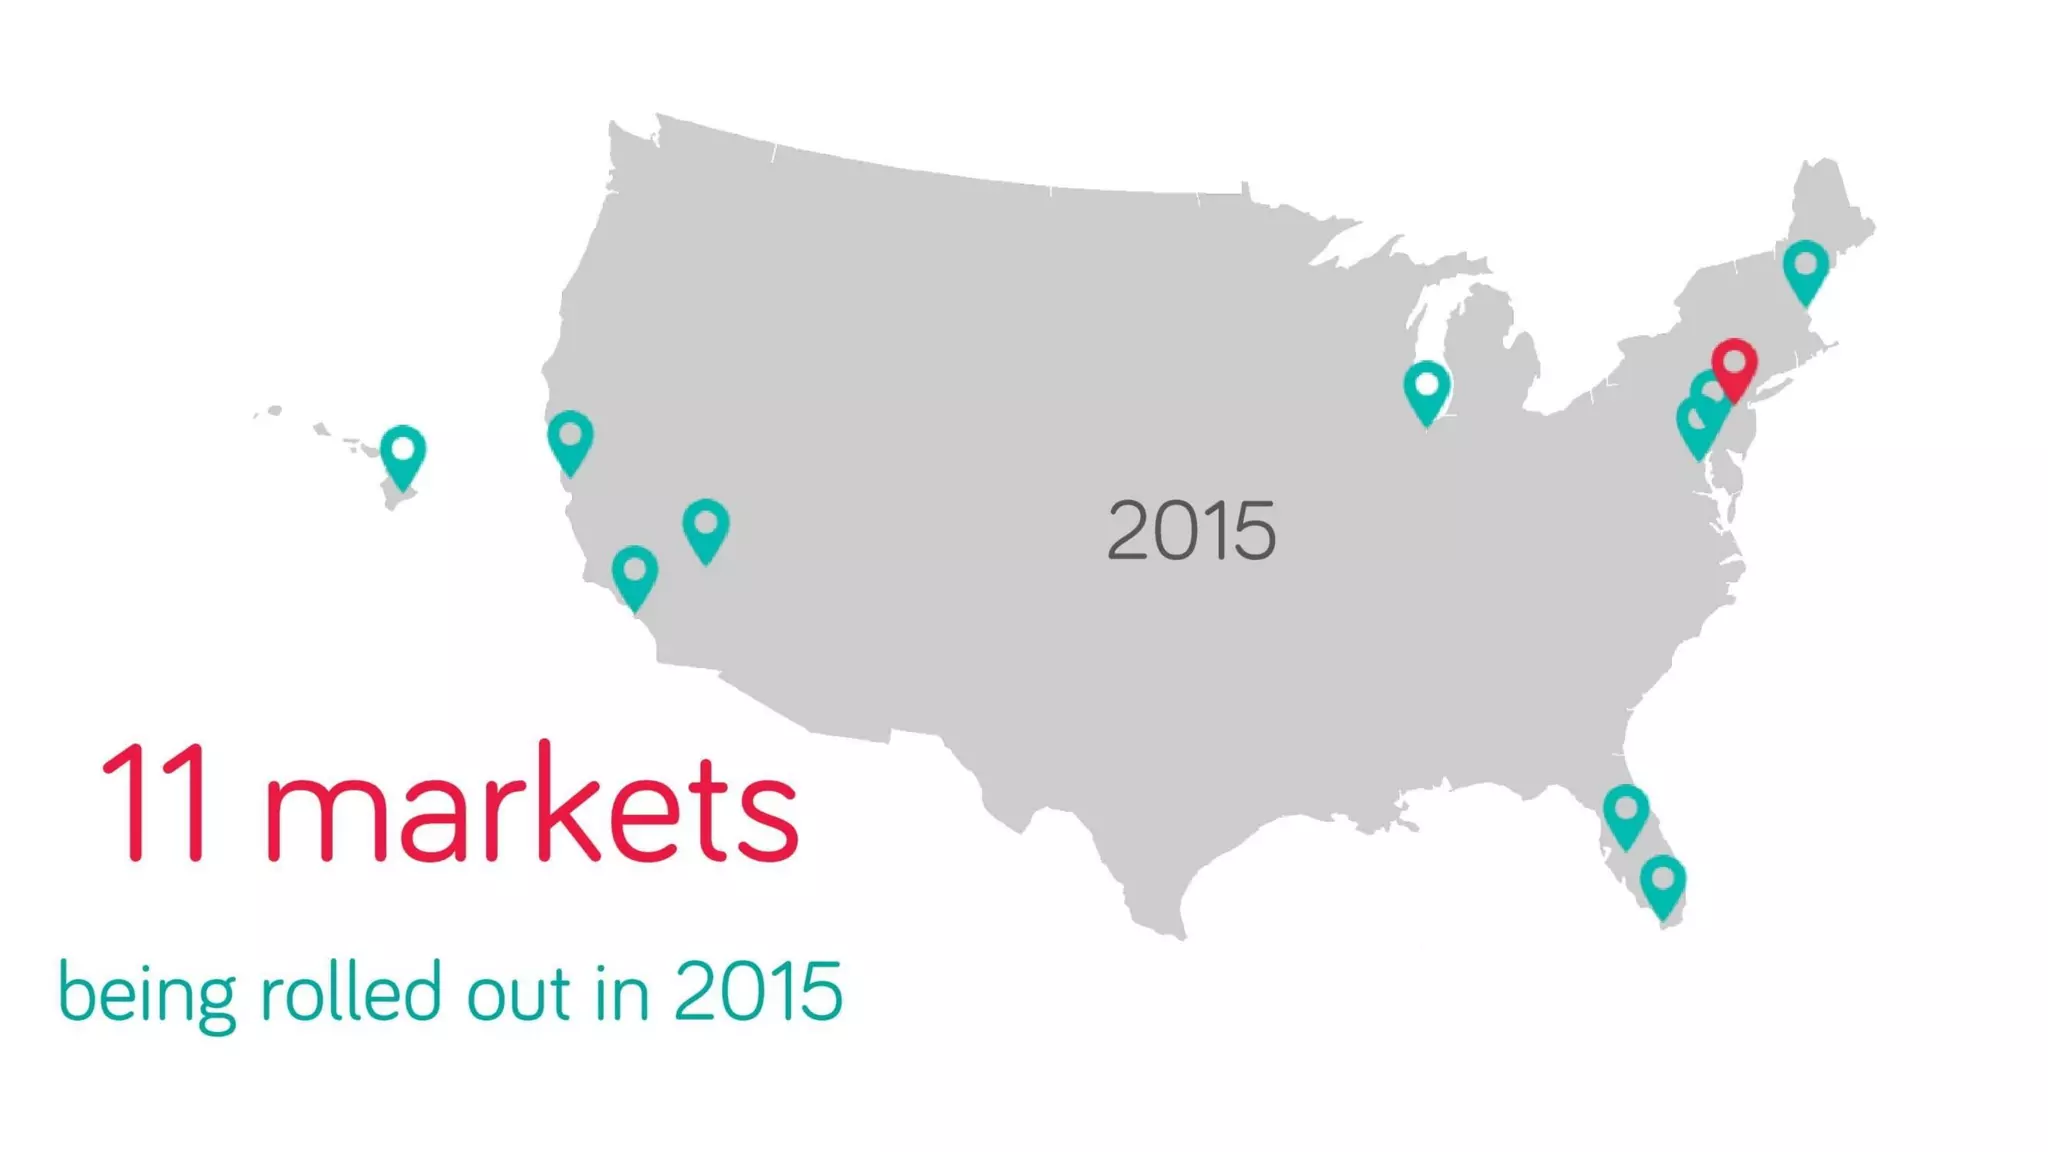
Slide 14 claims a 14x advantage in last‑minute seats versus competitors (Peek, Viator) and Slide 12 outlines an 11‑market roll‑out plan for 2015. These slides together convey defensibility (inventory capture advantage) and a disciplined geographic expansion plan, both of which are key for marketplace scale.
This approach is practical: quantify where you win versus incumbents and show how you will expand that lead geographically. Founders should provide competitor comparisons tied to concrete operational metrics and a phased market expansion that demonstrates replicable playbooks rather than vague global ambitions.

Key Takeaway: Quantify competitive advantages in operational terms (e.g., available last‑minute inventory) and present a phased market roll‑out to show scalable execution.
Call to action & final positioning

Call to action & final positioning

The closing slide (slide 18) uses a strong CTA 'Download the app NOW!' with contact info — a direct ask that’s appropriate for a pitch aimed at raising or recruiting users. The imagery of the founders and friendly tone make the company feel accessible and ready to engage.
A clear, visible CTA at the end of a deck helps focus conversations that follow the presentation — whether it’s fundraising, partnership discussions or user acquisition. Founders should end with an explicit next step and accessible contact channels to convert interest into action.

Key Takeaway: End with an explicit, simple call to action and accessible contact details so interested parties know exactly how to follow up.

Conclusion: Key Lessons

Headout’s seed deck is a concise example of marketplace storytelling: it aligns a clear market behaviour (last‑minute bookings) with a mobile‑first product, quantifiable supplier pain, early traction and a defensible operational advantage. The visual design prioritizes large numbers, clean headlines and evocative imagery — all of which make the narrative fast to read and persuasive.
For founders: lead with crisp positioning, quantify both customer and supplier problems, show early traction with human context, and present competitor advantages in operational metrics. Finish with a direct ask so next steps are obvious — that combination makes for a seed deck that investors can quickly evaluate and act on.

Full Deck Analysis

11 sections

Overview

Company: Headout
Round: Seed ($1.8M)
Year: 2015
Outcome: Raised $60M+ total; became a leading experiences marketplace

Executive Summary

Headout’s 2015 seed deck crisply positions the company as a mobile-first, last-minute marketplace for tours, activities and local experiences (bookable for the next 24 hours only). The deck combines a clear market thesis (an $84B last‑minute spend opportunity), early traction (4,000+ travelers served, 65% m‑o‑m growth) and product/value claims (faster booking, better prices, higher last‑minute inventory) — all delivered in a visually strong presentation. It is notable for its focused niche (last‑minute mobile) and for showing early operational momentum even though several investor‑level metrics (unit economics, CAC/LTV) are missing.

Problem Statement

How the deck articulates the problem:

  • Slide 3–5: Travelers lack a simple, on‑demand way to book local things in the moment — current last‑minute transactions are primarily offline (walk‑ins, phone calls, brochures, concierges — slide 3).
  • Slide 6: Suppliers face significant unused capacity — the deck cites “35% unsold inventory” for suppliers.
  • Slide 2: Demonstrates market scale and urgency with the stat “$84 billion spent by travelers on local experiences less than 24h in advance in 2014,” highlighting the large, addressable last‑minute spend.

Solution

How the deck positions the solution:

  • Slide 7: Headout is an “on‑demand mobile marketplace for travelers to book tours, activities and local experiences for the next 24 hours only.”
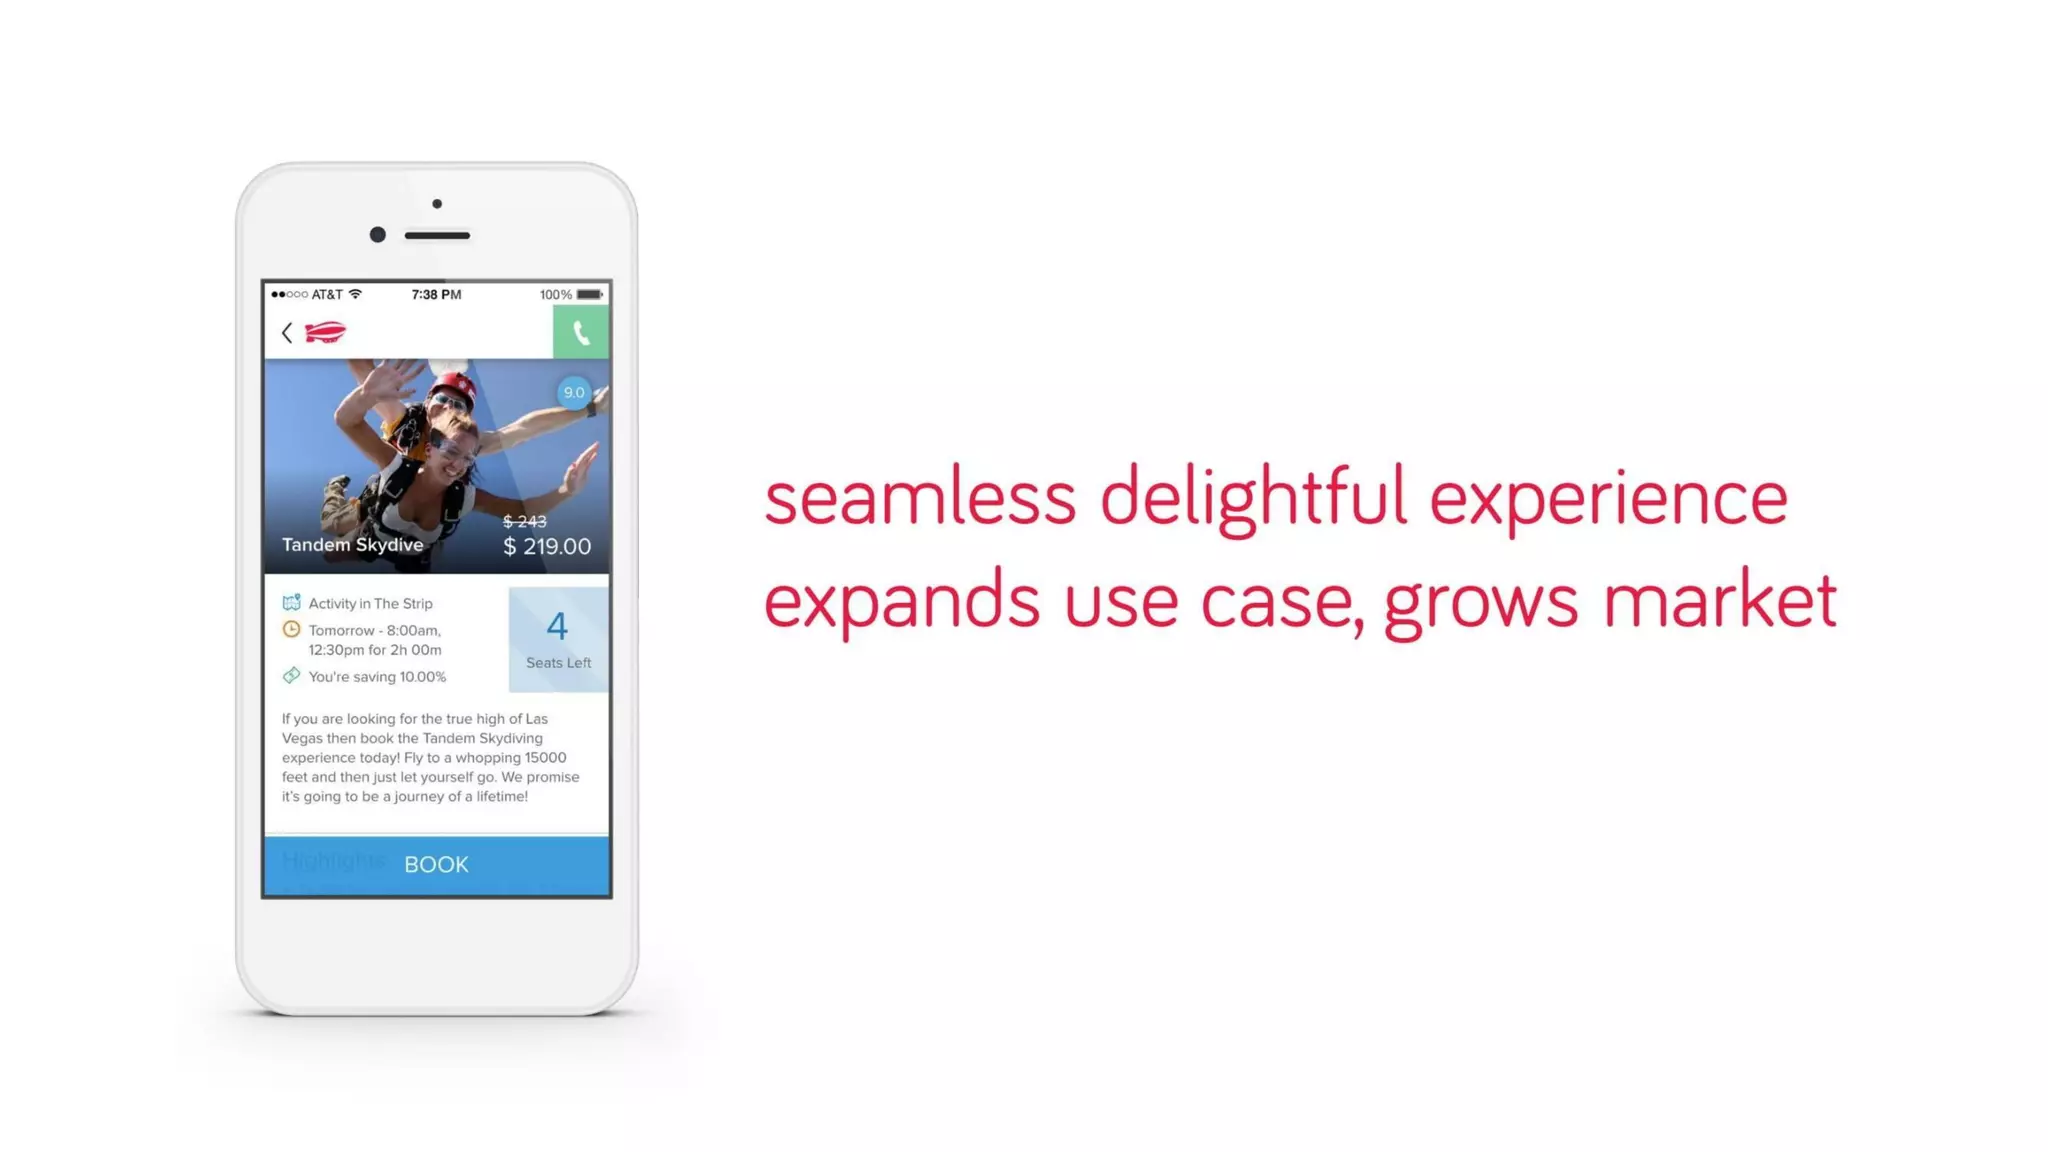
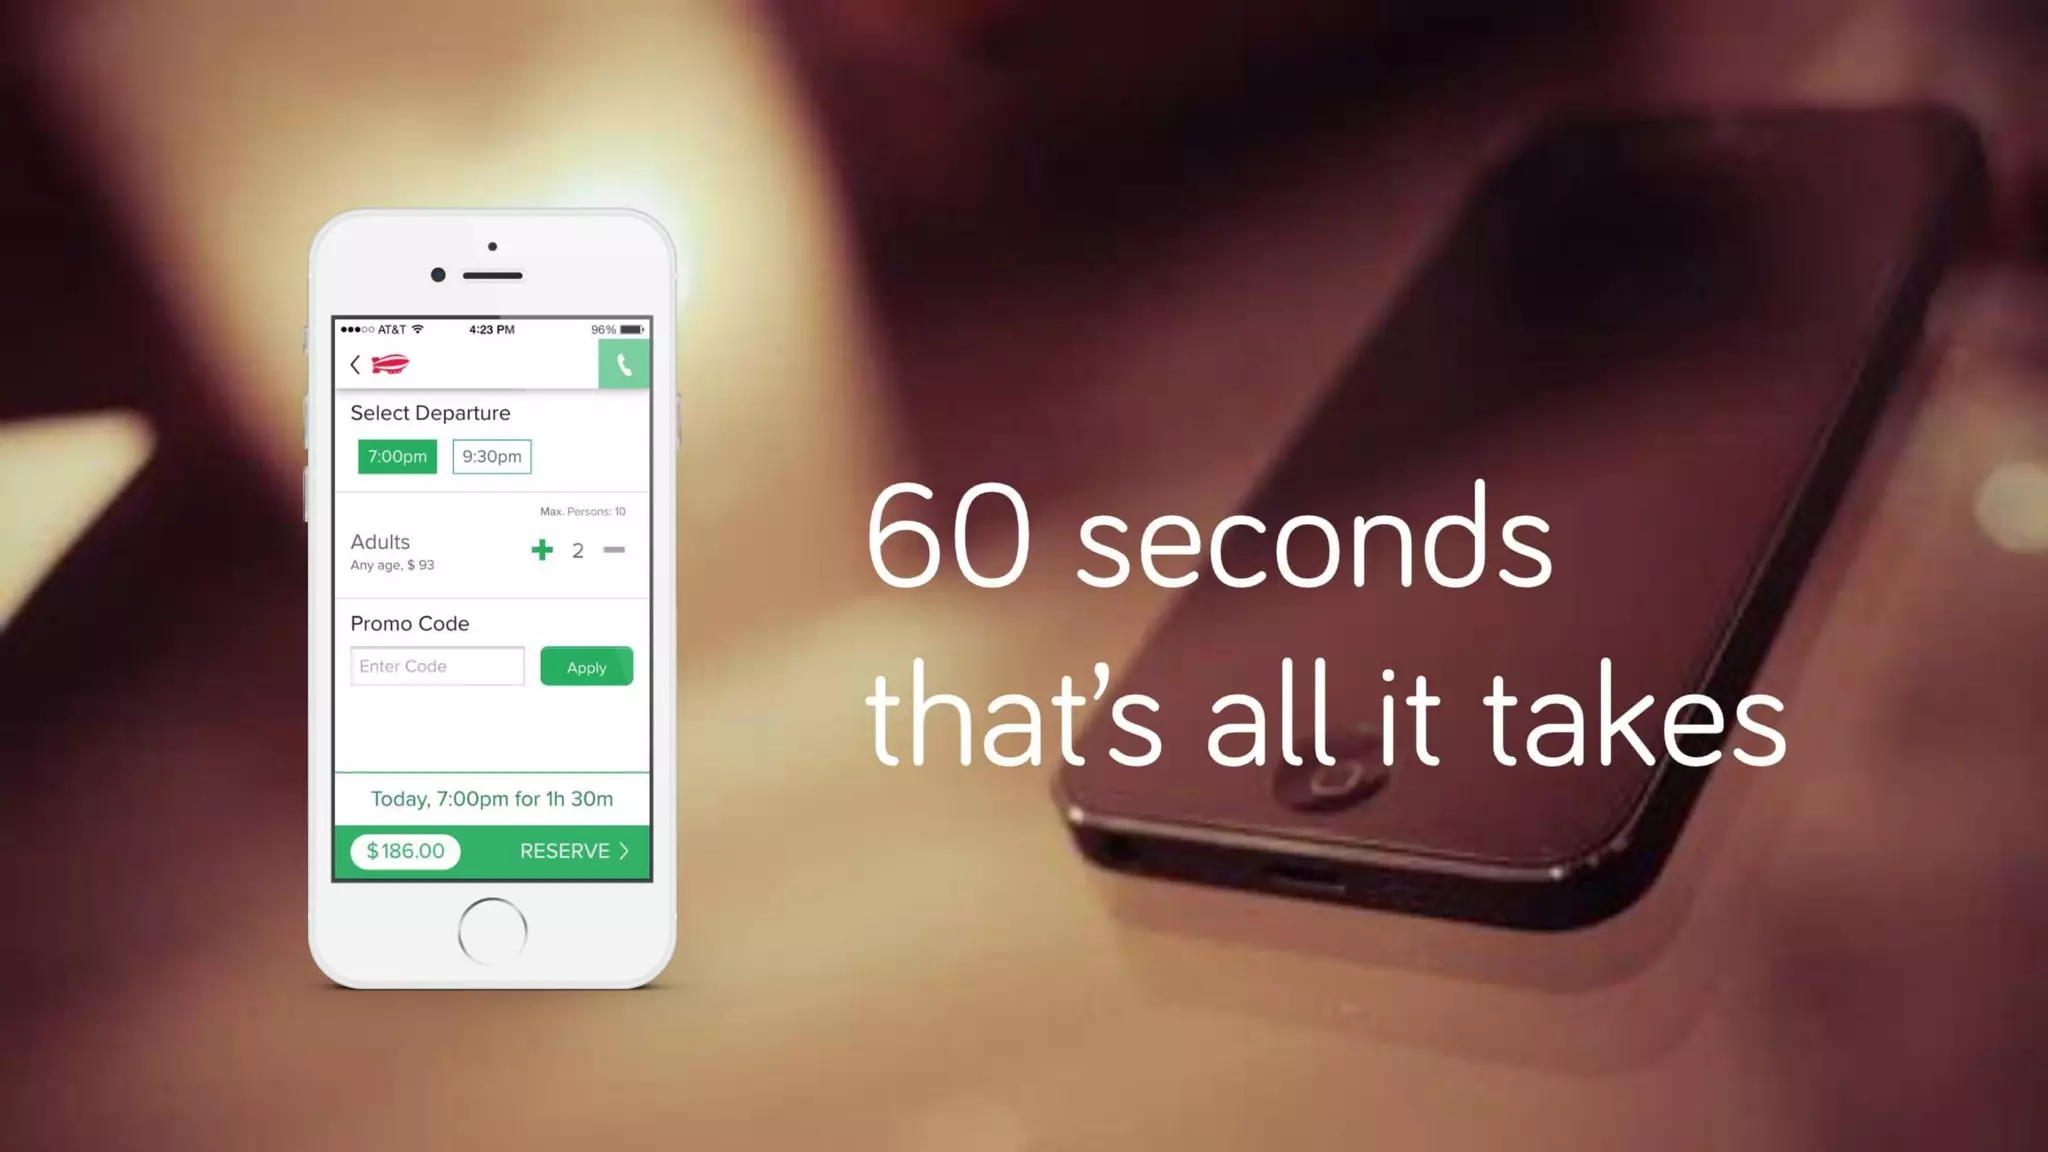
  • Slides 8–9 & 14–16: Emphasizes a mobile-first UX (60 second booking on slide 16), superior last‑minute seat availability (14x vs Peek/Viator on slide 14), better prices (20% better prices on slide 15) and a seamless mobile experience that unlocks the latent last‑minute market.
  • The product claim is to aggregate suppliers’ unsold inventory, present it on mobile with streamlined booking and undercut/beat incumbent pricing and distribution.

Market Opportunity

  • Explicit number shown: $84 billion — the amount “spent by travelers on local experiences less than 24h in advance in 2014” (slide 2). This is the clearest TAM figure presented.
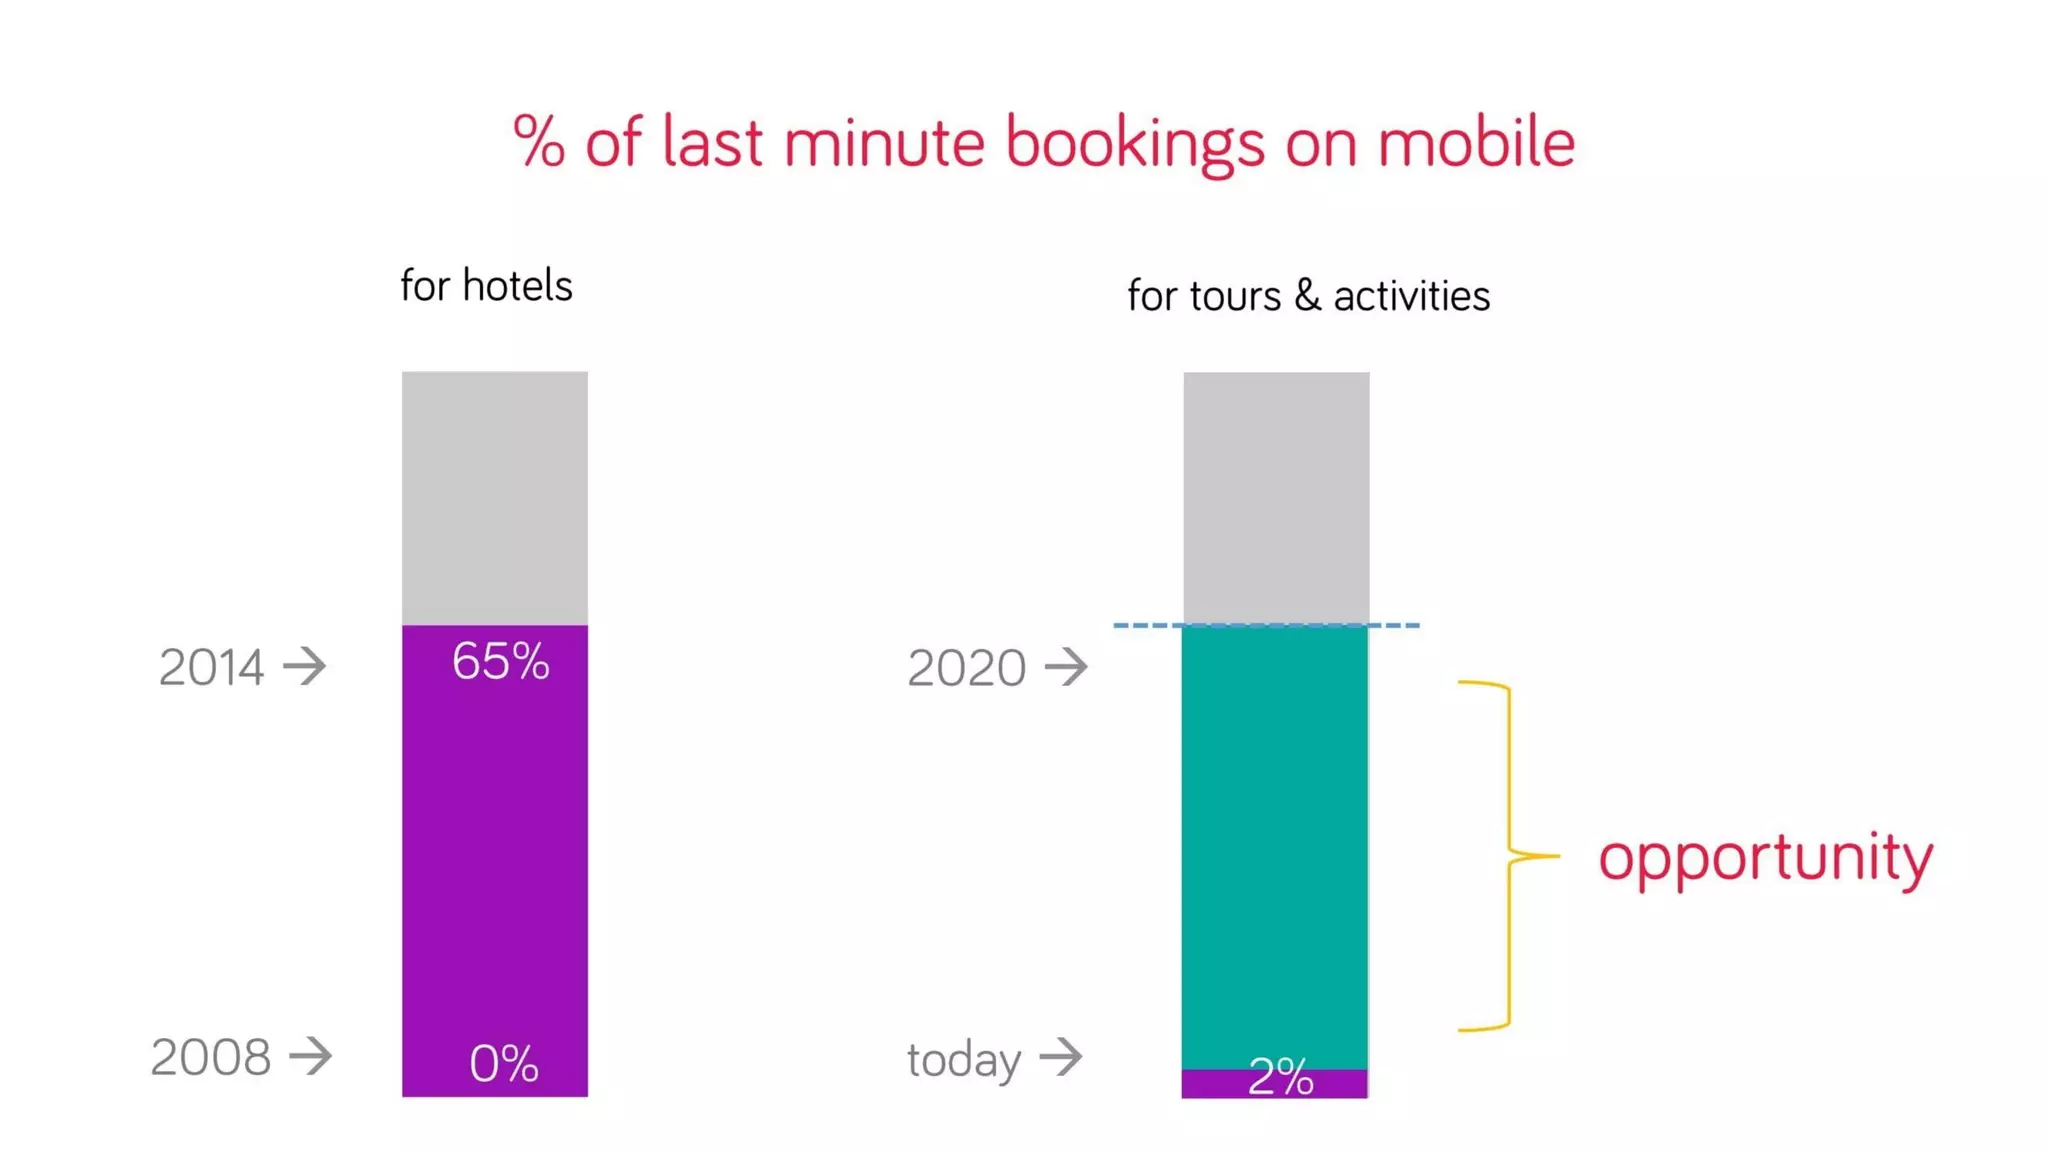
  • The deck also frames a mobile adoption gap: hotels moved from 0% → 65% last‑minute mobile in ~2008–2014 while tours & activities were only ~2% mobile at the time (slide 17), implying a large future mobile SAM for tours & activities.
  • No granular TAM/SAM/SOM breakdown by geography, category or pricing was provided beyond the $84B stat and the mobile adoption forecast.

Business Model

  • The deck implies a marketplace/commission model (typical of OTA/experiences marketplaces): supplier inventory is listed and sold via Headout’s mobile app, with Headout capturing value via negotiated pricing and likely a cut/commission.
  • Value props that imply revenue mechanics: “20% better prices” (slide 15) and “14x last‑min seats vs Peek, Viator” (slide 14) suggest Headout negotiates discounted last‑minute inventory and monetizes some portion of that.
  • The deck does not show explicit pricing, commission rates, margin profile, or concrete unit economics (ARPU, take rate, average booking value).

Traction & Metrics

Concrete traction shown in the deck:

  • 4,000+ travelers served (slide 9).
  • 65% month‑over‑month growth (slide 10) shown on a Jul→Dec trend line (points for Jul, Aug, Sep, Oct, Nov, Dec).
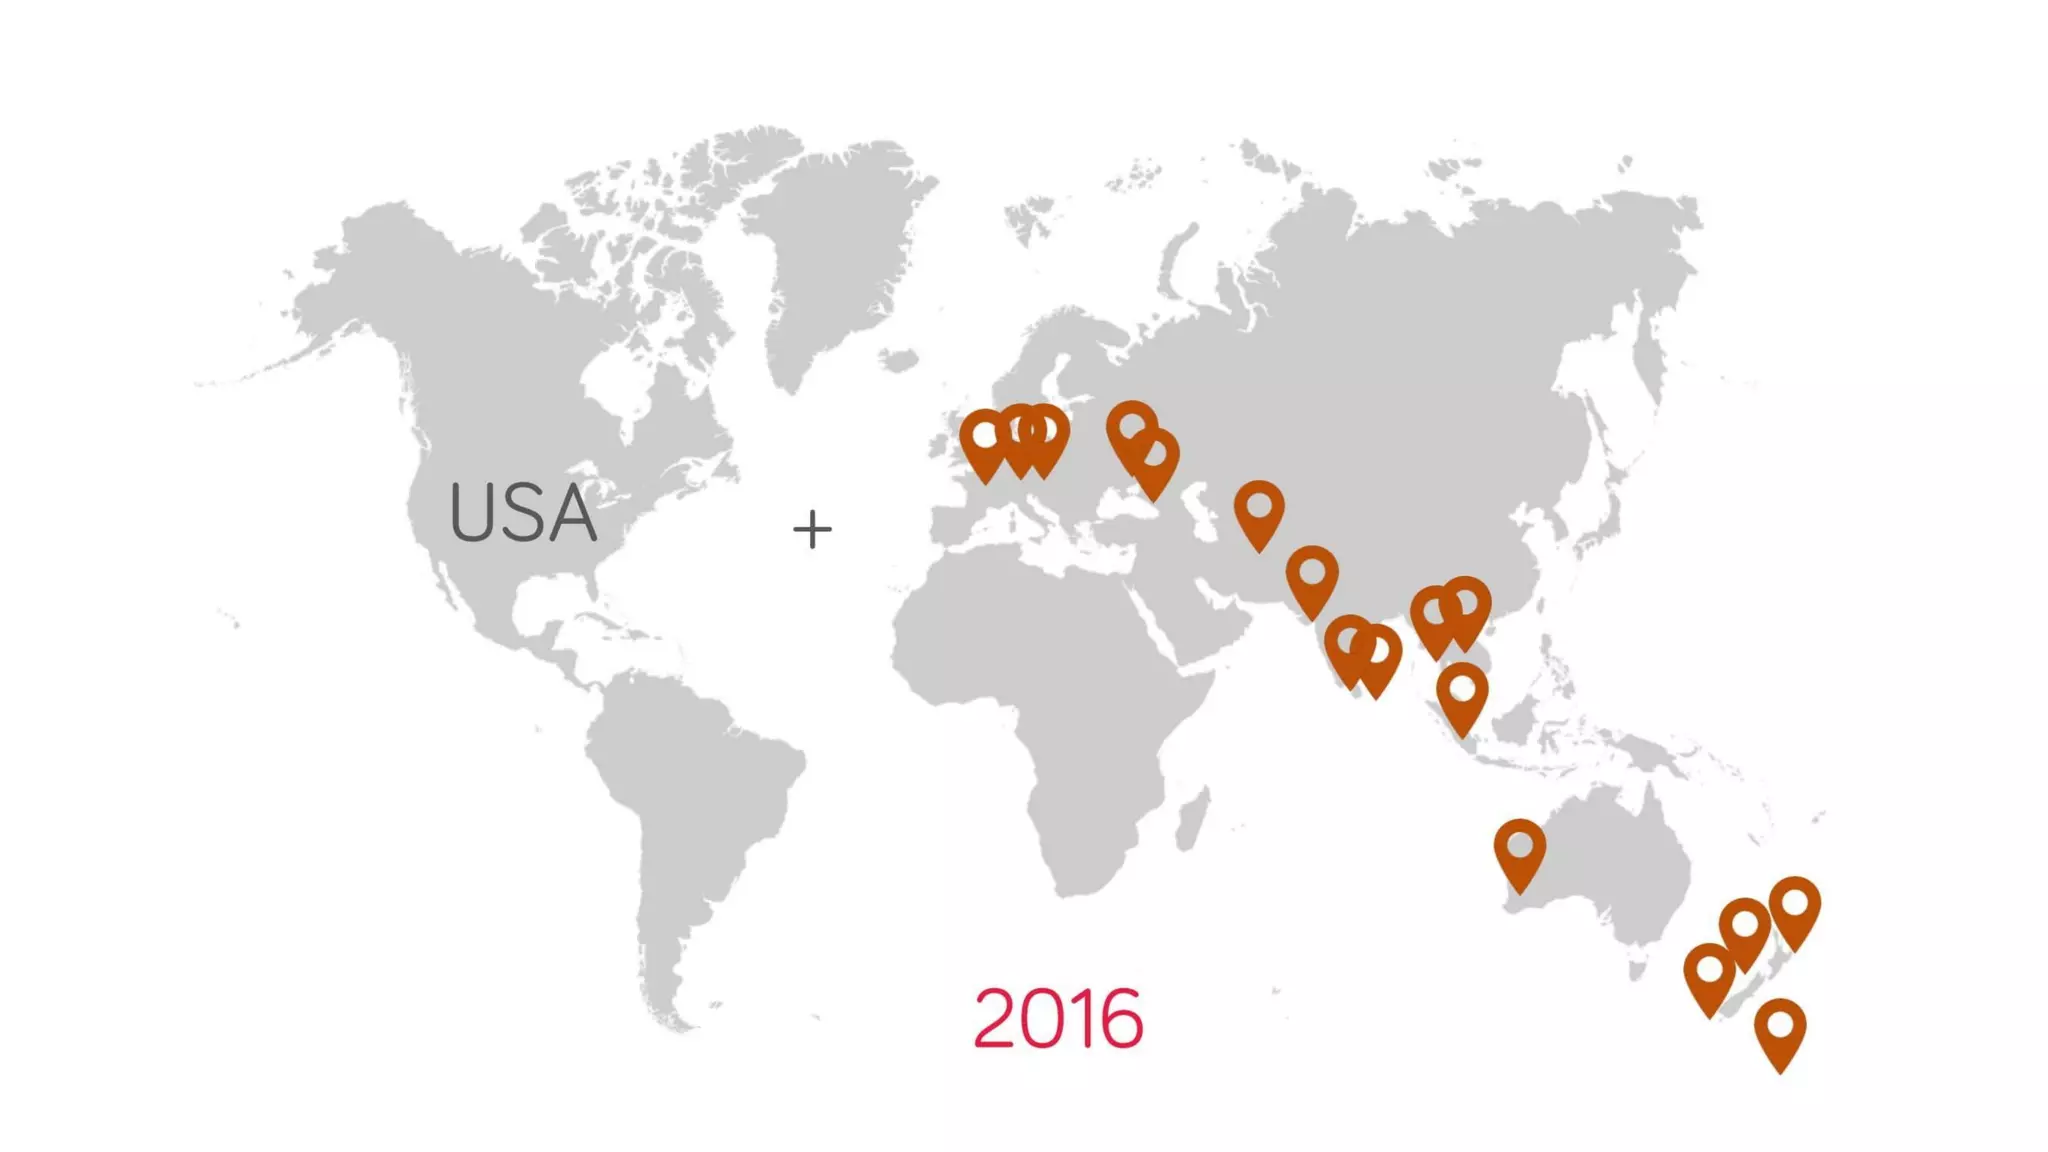
  • Market rollout: 11 markets being rolled out in 2015 (slide 11) and a broader international expansion plan shown for 2016 (slide 12).
  • Product/market validation claims: 14x more last‑minute seats vs competitors (slide 14), 20% better prices (slide 15), 60 seconds to book (slide 16).
  • Supplier pain point quantified: 35% unsold inventory (slide 6).
  • Missing: gross booking volume (GBV), revenue, ARR/MRR, bookings per customer, repeat rate, conversion rates, CAC, LTV.

Competitive Positioning

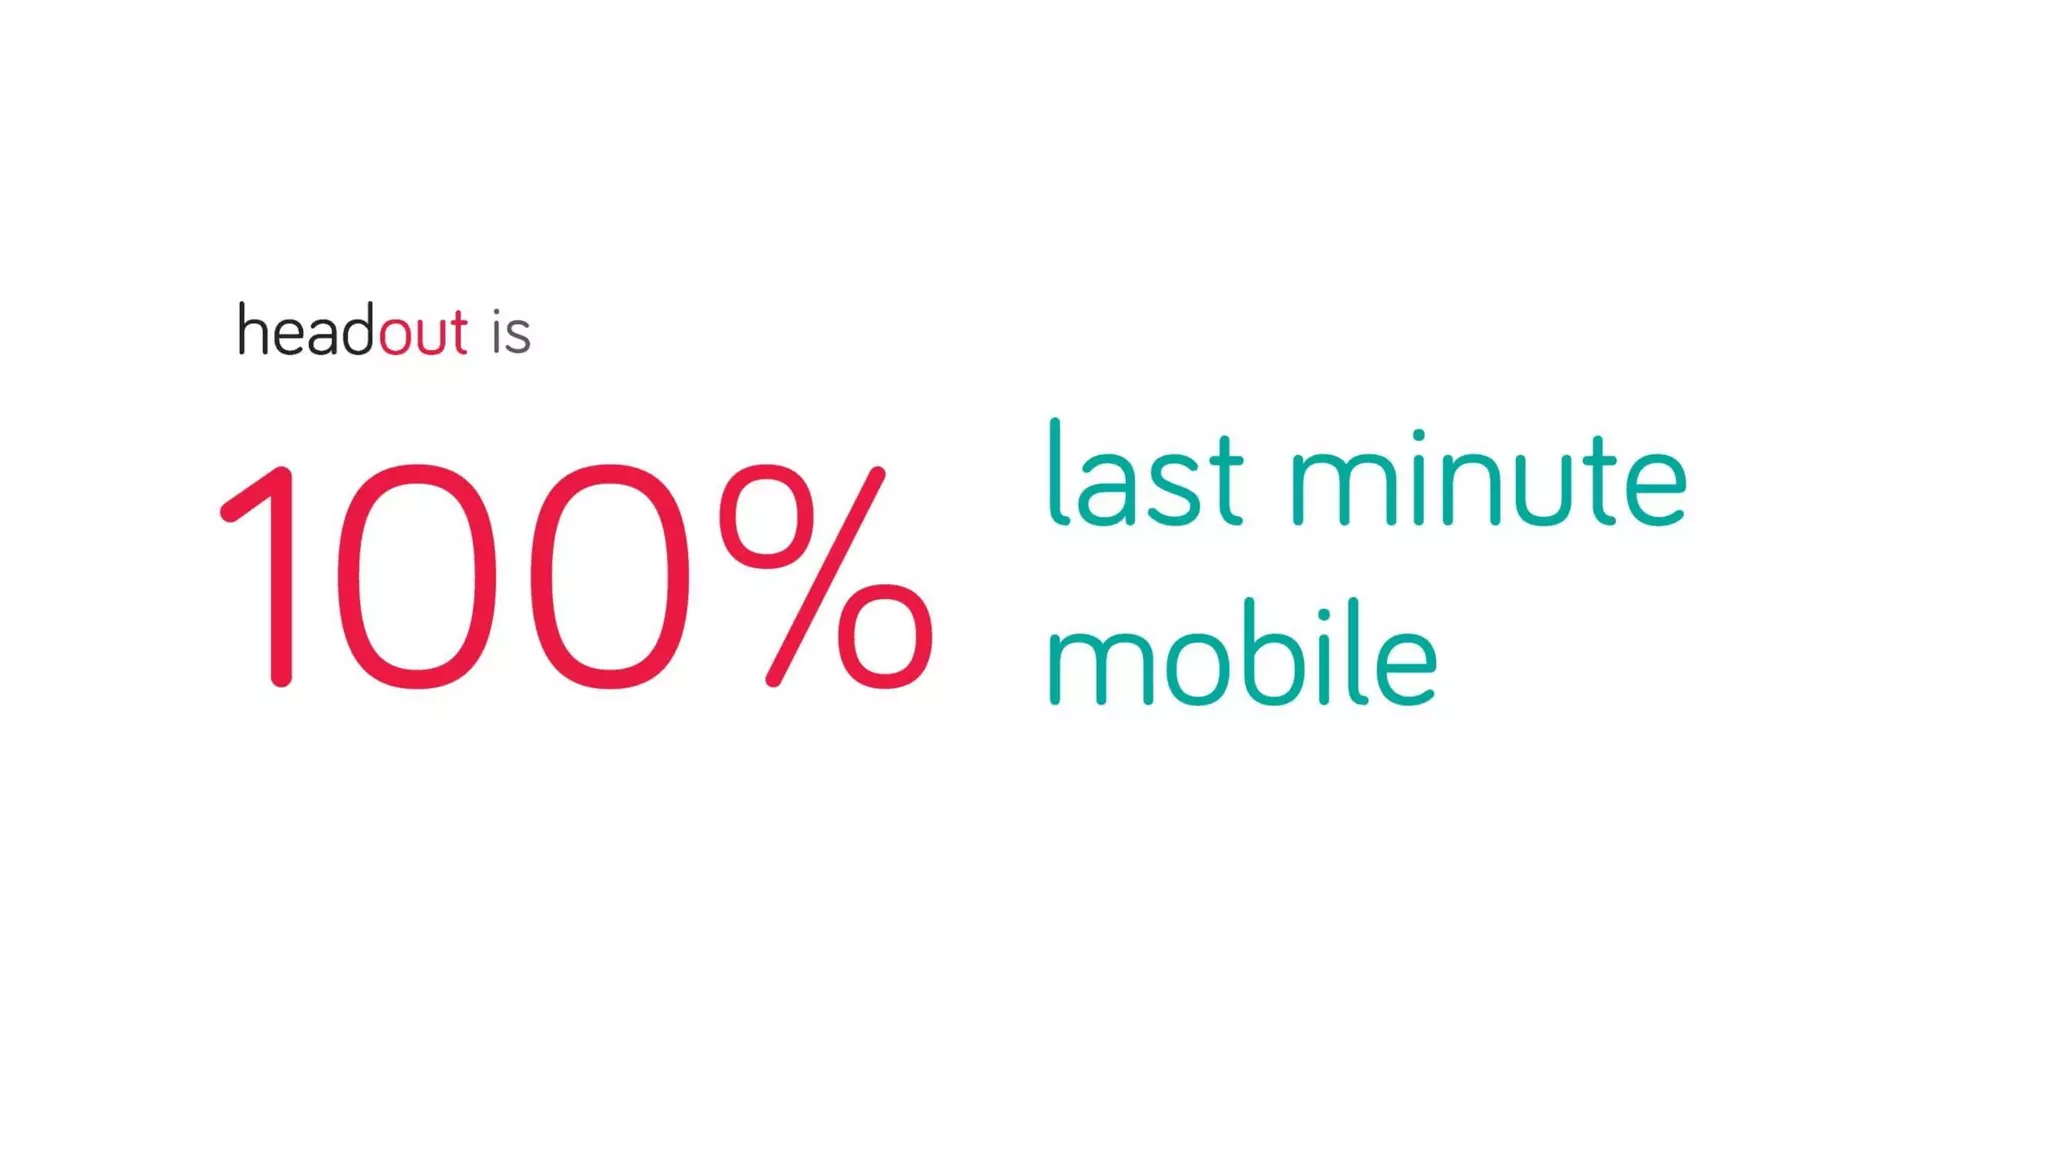
  • Differentiation: laser focus on last‑minute, mobile‑only booking for experiences (slide 13: “100% last minute mobile”) vs more general incumbents (Viator, Peek). Claims of materially greater last‑minute seat availability (14x) and faster UX (60s) are central differentiators (slides 14 & 16).
  • Price positioning: claims of better pricing (20% better, slide 15) intended to capture price‑sensitive last‑minute buyers.
  • The deck does not present a detailed competitor matrix, comparative unit economics, or defensibility strategy (network effects, supplier exclusivity, margins).

Team

  • Founders are visually shown on the final slides (slide 18) with contact info on cover and final slide, but the deck does not provide bios, relevant previous exits, domain expertise, or organizational structure in the deck images provided.
  • As an investor would note: team identity and background are present but under‑documented in the slides (no explicit CVs/resumes or prior track record shown).

Go-to-Market Strategy

  • Mobile first user acquisition via app (core distribution channel) — repeated emphasis on mobile UX (slides 7, 8, 13).
  • Supply onboarding: directly onboards suppliers to capture unsold last‑minute inventory (implied by slide 6 + supply claims).
  • Geographic rollouts by market (11 markets in 2015; aggressive international rollout in 2016 shown on slides 11–12).
  • Channels not explicitly detailed: marketing levers (paid UA, partnerships with hotels/concierges, OTA partnerships, SEO), enterprise partnerships, or supplier incentives aren’t specified.

The Ask

  • Round shown/known externally: Seed raise of $1.8M (Company Context). The deck does not explicitly show a slide with a funding ask, valuation, or planned use of funds in the images supplied.
  • Use of funds / runway plan: not provided in the visible slides.

Investor Deep Dive

Executive summary, strengths & red flags

Executive Summary

Headout’s 2015 seed deck crisply positions the company as a mobile-first, last-minute marketplace for tours, activities and local experiences (bookable for the next 24 hours only). The deck combines a clear market thesis (an $84B last‑minute spend opportunity), early traction (4,000+ travelers served, 65% m‑o‑m growth) and product/value claims (faster booking, better prices, higher last‑minute inventory) — all delivered in a visually strong presentation. It is notable for its focused niche (last‑minute mobile) and for showing early operational momentum even though several investor‑level metrics (unit economics, CAC/LTV) are missing.

Key Strengths

3 identified

1

Laser focus on a clear, sizable niche: last‑minute, mobile bookings for experiences — supported by a concrete $84B stat (slide 2) and mobile adoption gap (slide 17).

2

Early traction and momentum with clear, attention‑grabbing metrics: 4,000+ travelers served and 65% m‑o‑m growth (slides 9–10).

3

Strong visual storytelling and simple, compelling value props: faster booking (60s), better prices (20%), and superior last‑minute inventory (14x) (slides 14–16).

Red Flags & Weaknesses

3 identified

1

Lack of unit economics and revenue detail.

2

Sparse team detail and operational plan.

3

Competitive / defensibility gaps not quantified.

More Pitch Decks To Study

Compare structure, fundraising context, and investor-facing story across similar startup decks.