Compare your deck to Poshmark

Compare Your Deck

Poshmark Pitch Deck (2011)

Marketplace
Stage: Seed
Raised: $3.5M
Year: 2011
Slides: 16
Outcome: Acquired by Naver for $1.2B (2023)

Pitch Deck

1 / 16
Poshmark pitch deck - Title slide and positioning
Click to expand

Deck Analysis

This deck is an early seed pitch for GoshPosh (what became Poshmark) from 2011. It presents a mobile-first, social marketplace for fashion focused on simplifying listing and discovery for casual sellers and shoppers. Notable features of the story are a clear articulation of buyer and seller pain points, a visual product demo showing how a phone photo is transformed into magazine-quality listings, simple monetization assumptions, and an explicit go-to-market/viral loop — a combination that helped the company raise seed capital and eventually scale to a billion-dollar exit.

Title slide and positioning

Title slide and positioning

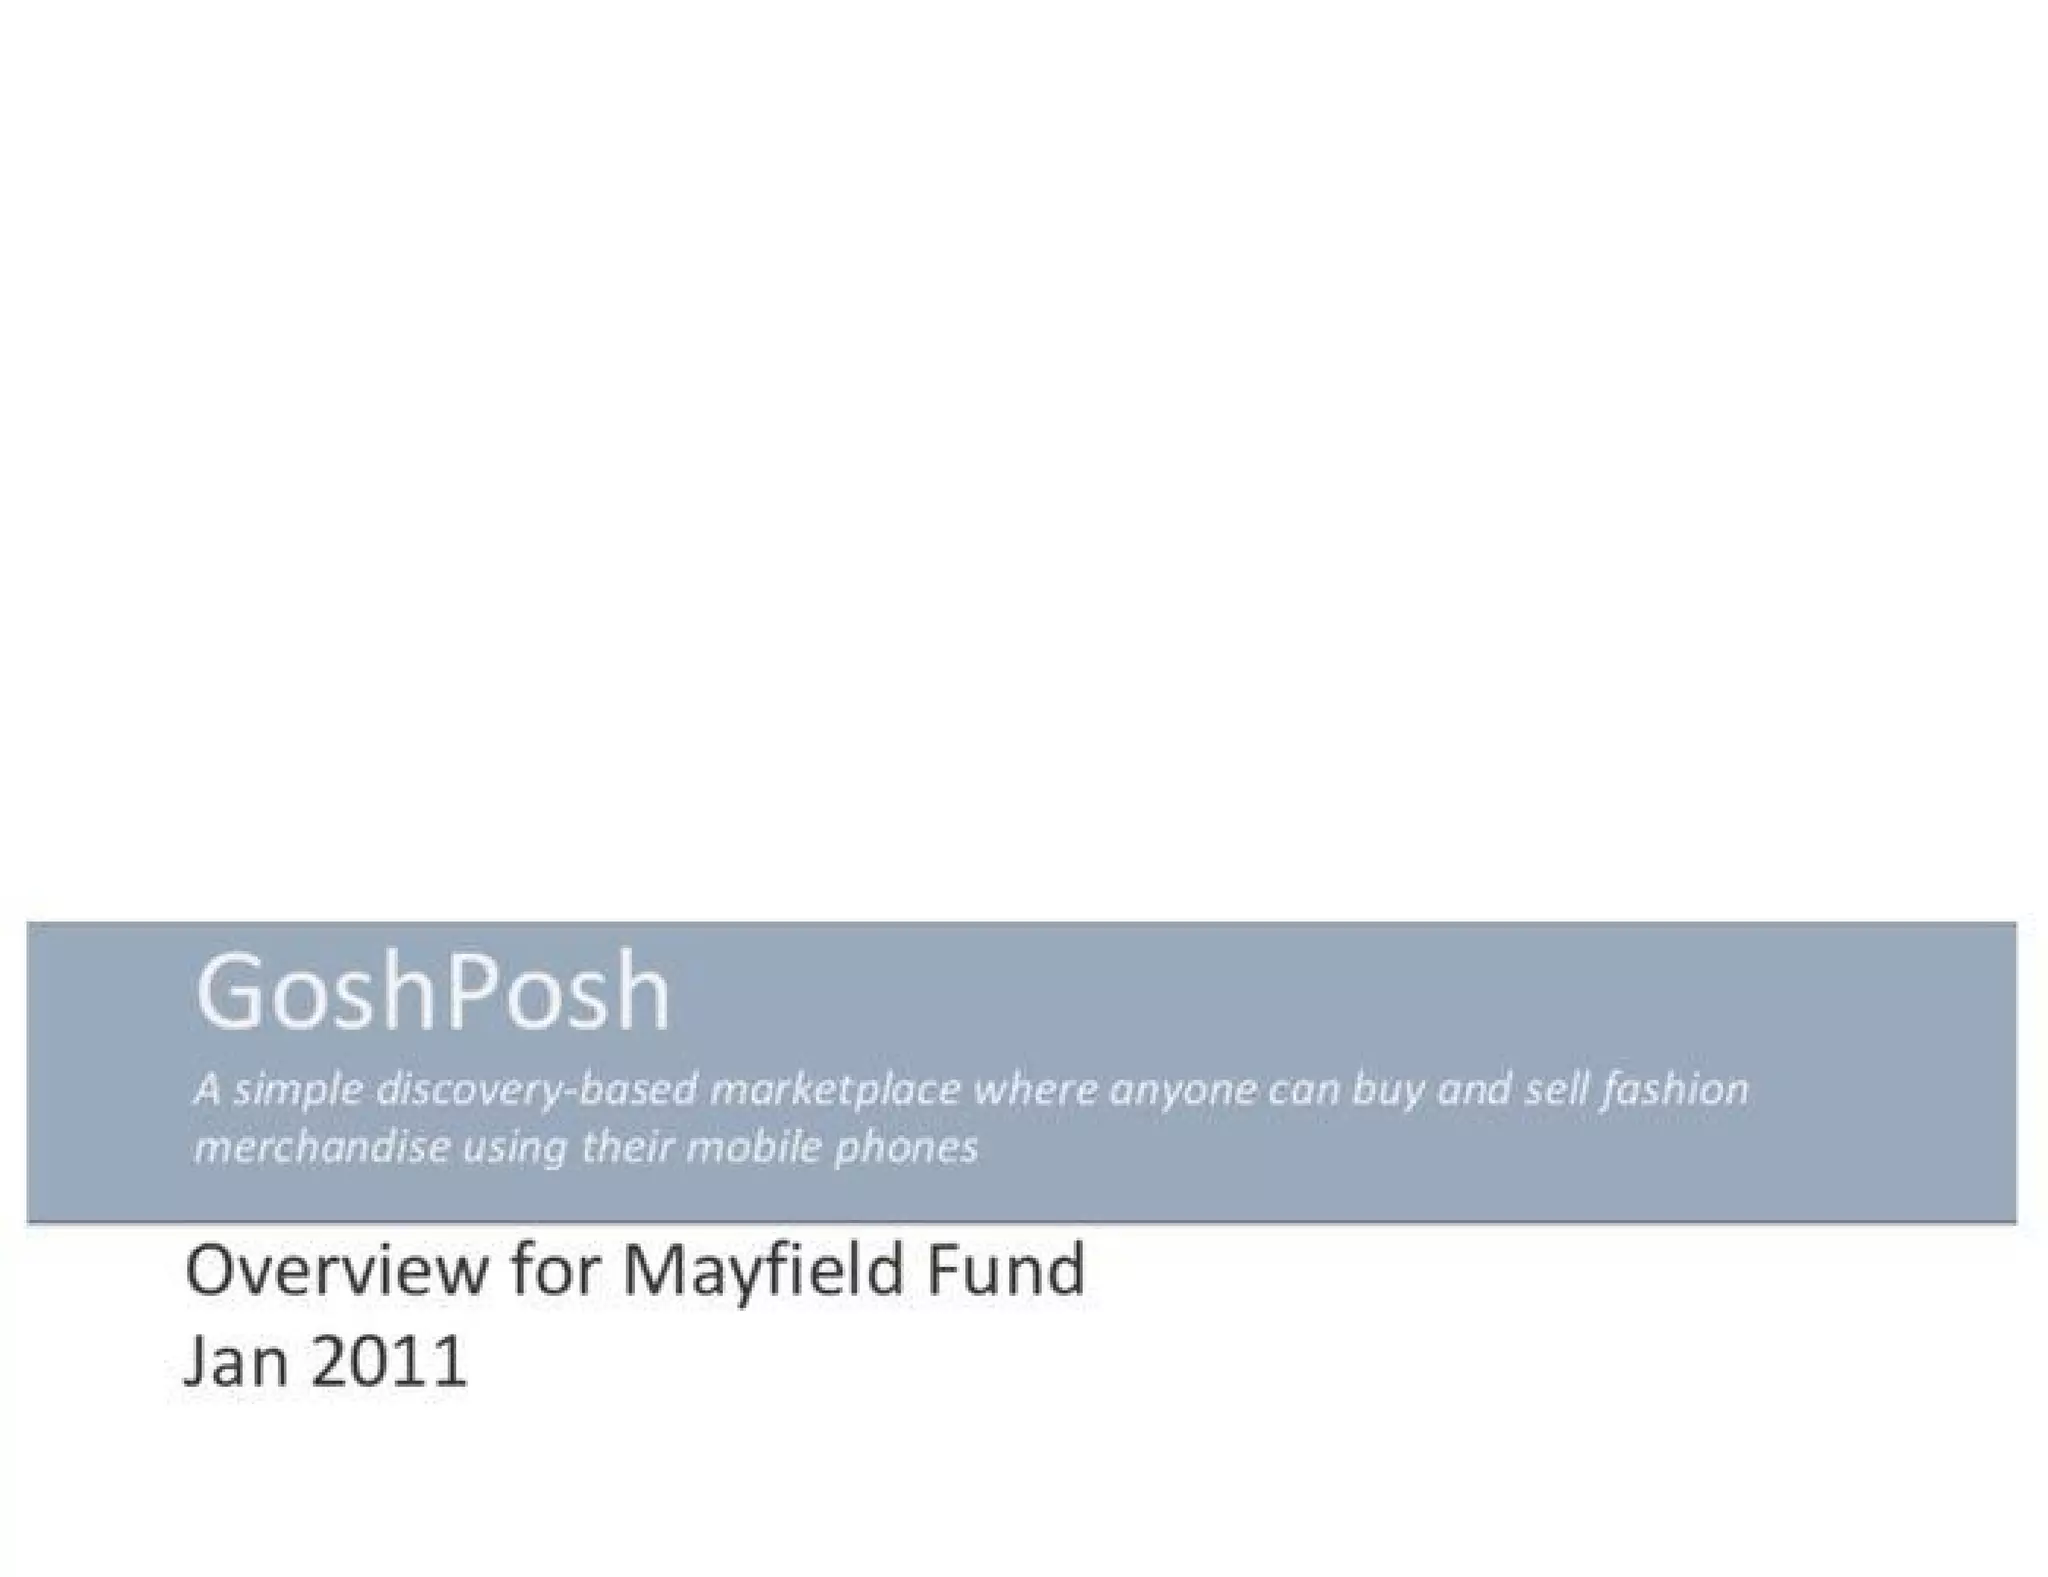
The opening slide (slide 1) is spare and focused: brand name, a one-line value proposition, and the audience/date. It frames the product as a "simple discovery-based marketplace" for buying and selling fashion on mobile phones. The economy of words makes the core idea easy to remember — mobile + fashion + discovery.

For founders, this is a reminder that the title slide should do heavy-lifting: convey identity, target user, channel (mobile) and the core benefit in one breath. It sets expectations for the rest of the deck and primes investors to evaluate everything through that lens.

Key Takeaway: Use the title slide to communicate your product, target customer, and unique channel in a single, memorable sentence.
Unmet market needs and pain points

Unmet market needs and pain points

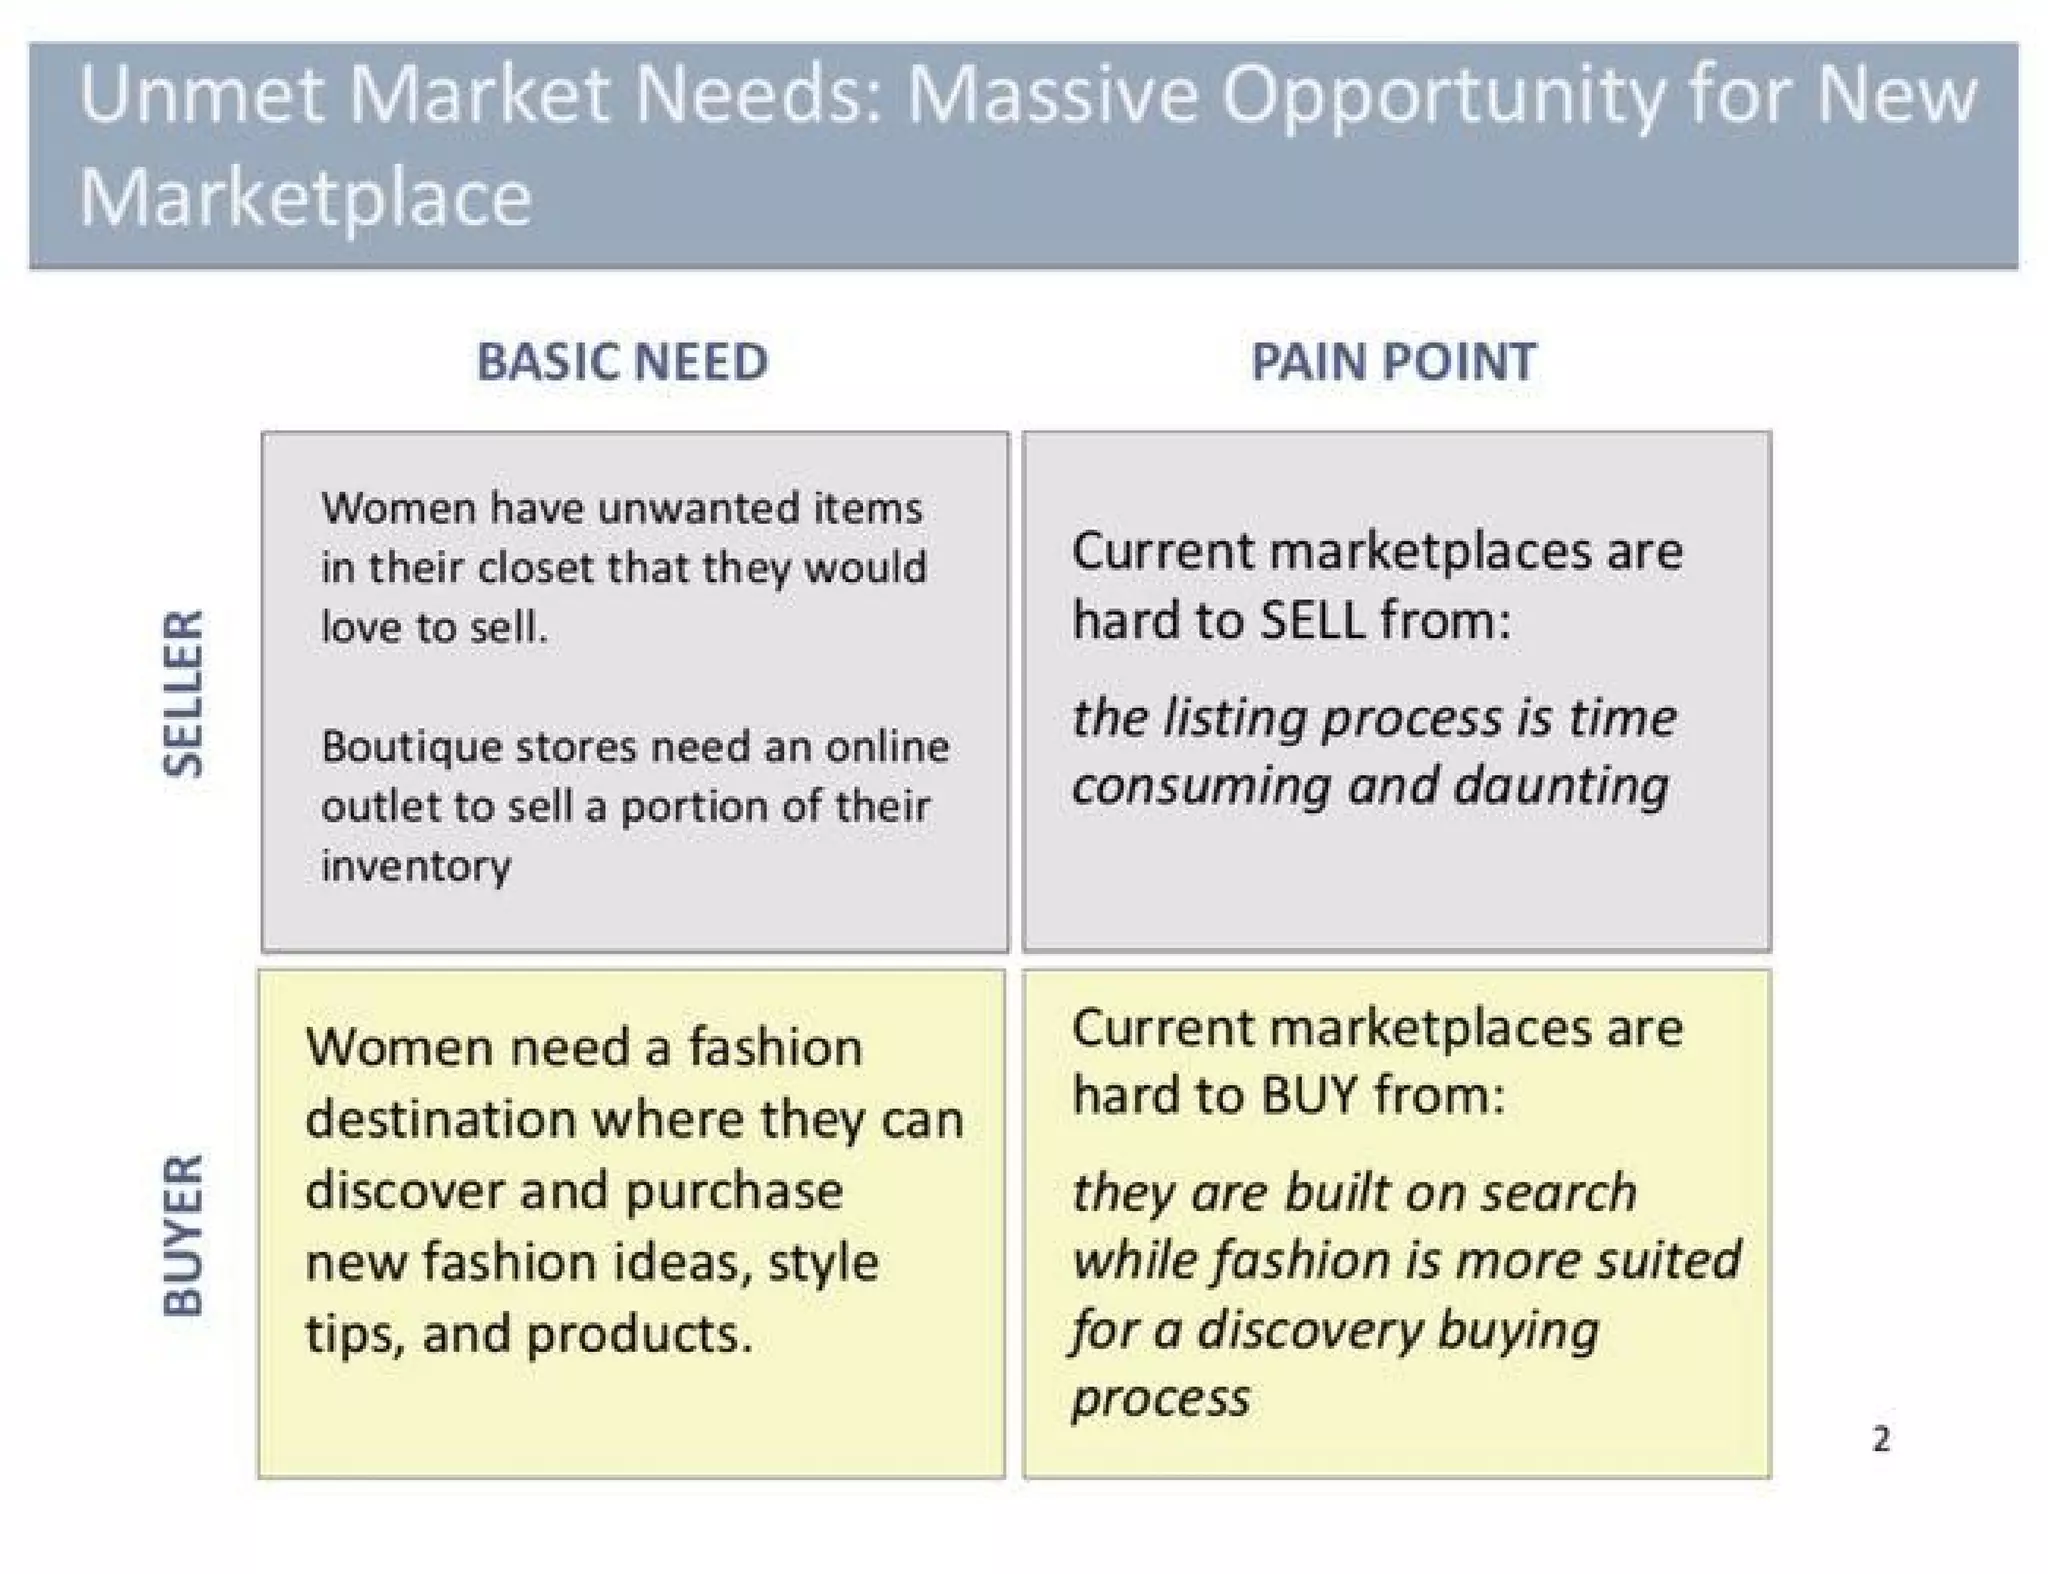
Slide 2 articulates the two-sided market problem clearly by separating seller and buyer needs and their respective pain points. Sellers: many have unwanted items and boutiques need online outlets, but listing is time-consuming. Buyers: want discovery and fashion inspiration, not search-based product hunts. The quadrant layout is easy to scan and quickly communicates that the product addresses both supply and demand frictions.

This slide is effective because it pairs a real emotional/behavioral insight (fashion is discovery-driven) with an operational friction (listing is daunting). Founders can learn to treat problem slides as customer narratives — quote behaviors, show why incumbents are mismatched to the category, and present the problem in a way that makes the solution obvious.

Key Takeaway: Frame problems as paired buyer and seller narratives to show you understand the two-sided dynamics and why incumbents fail.
Product demo and listing UX

Product demo and listing UX

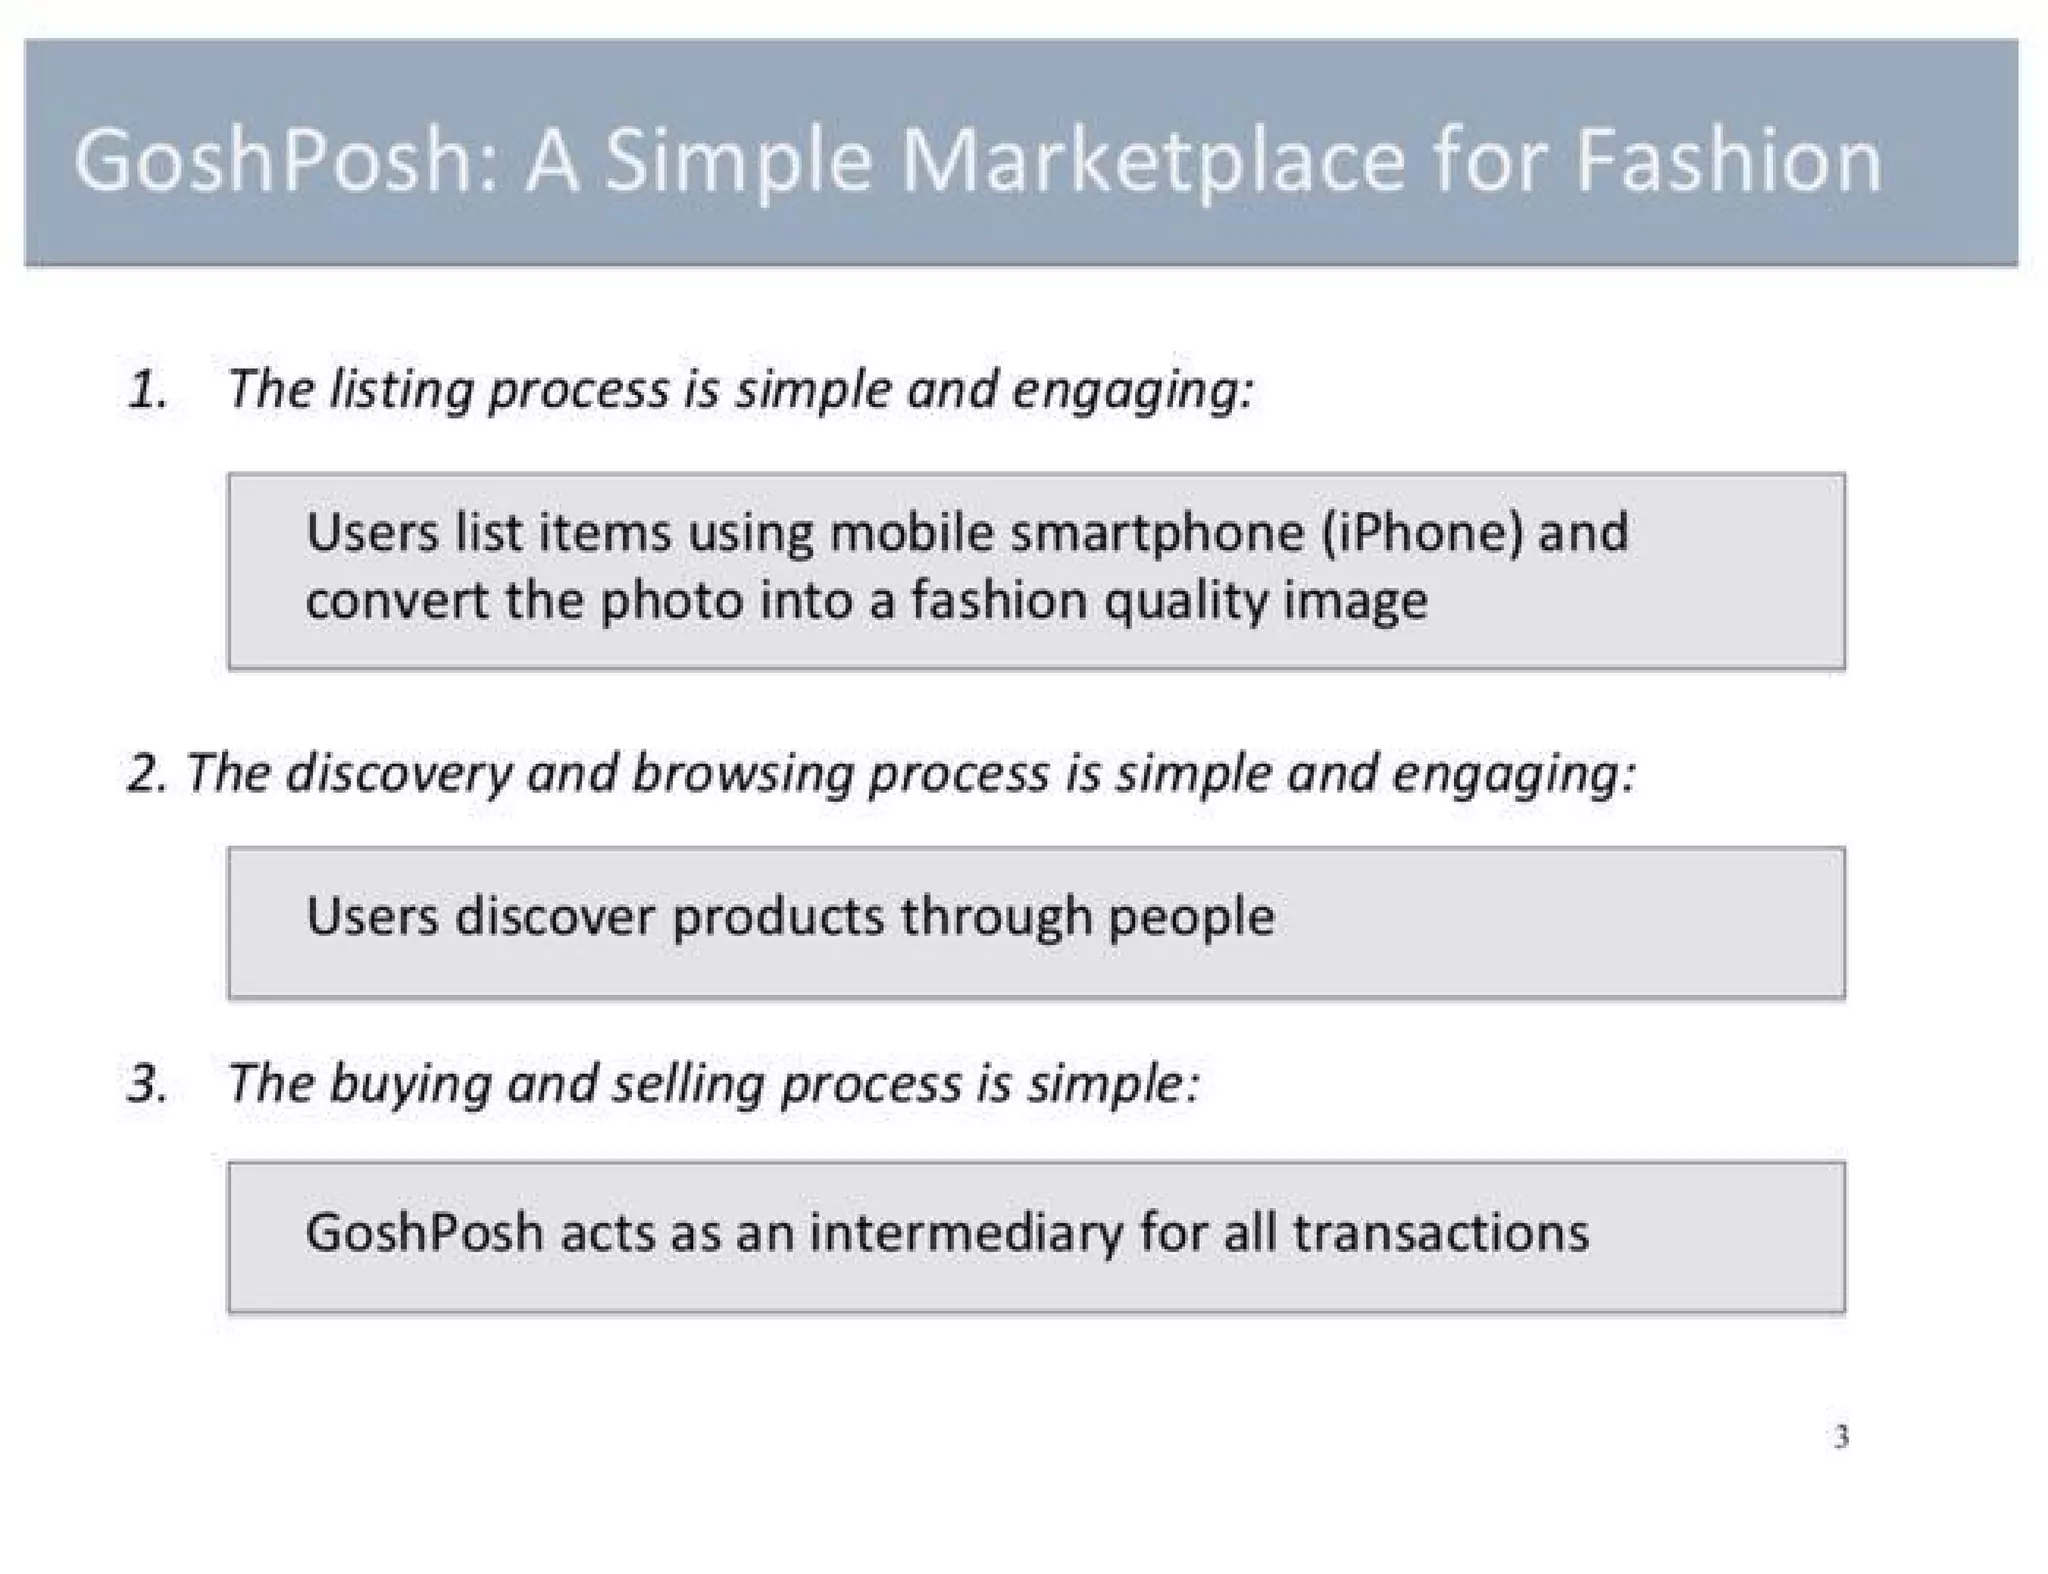
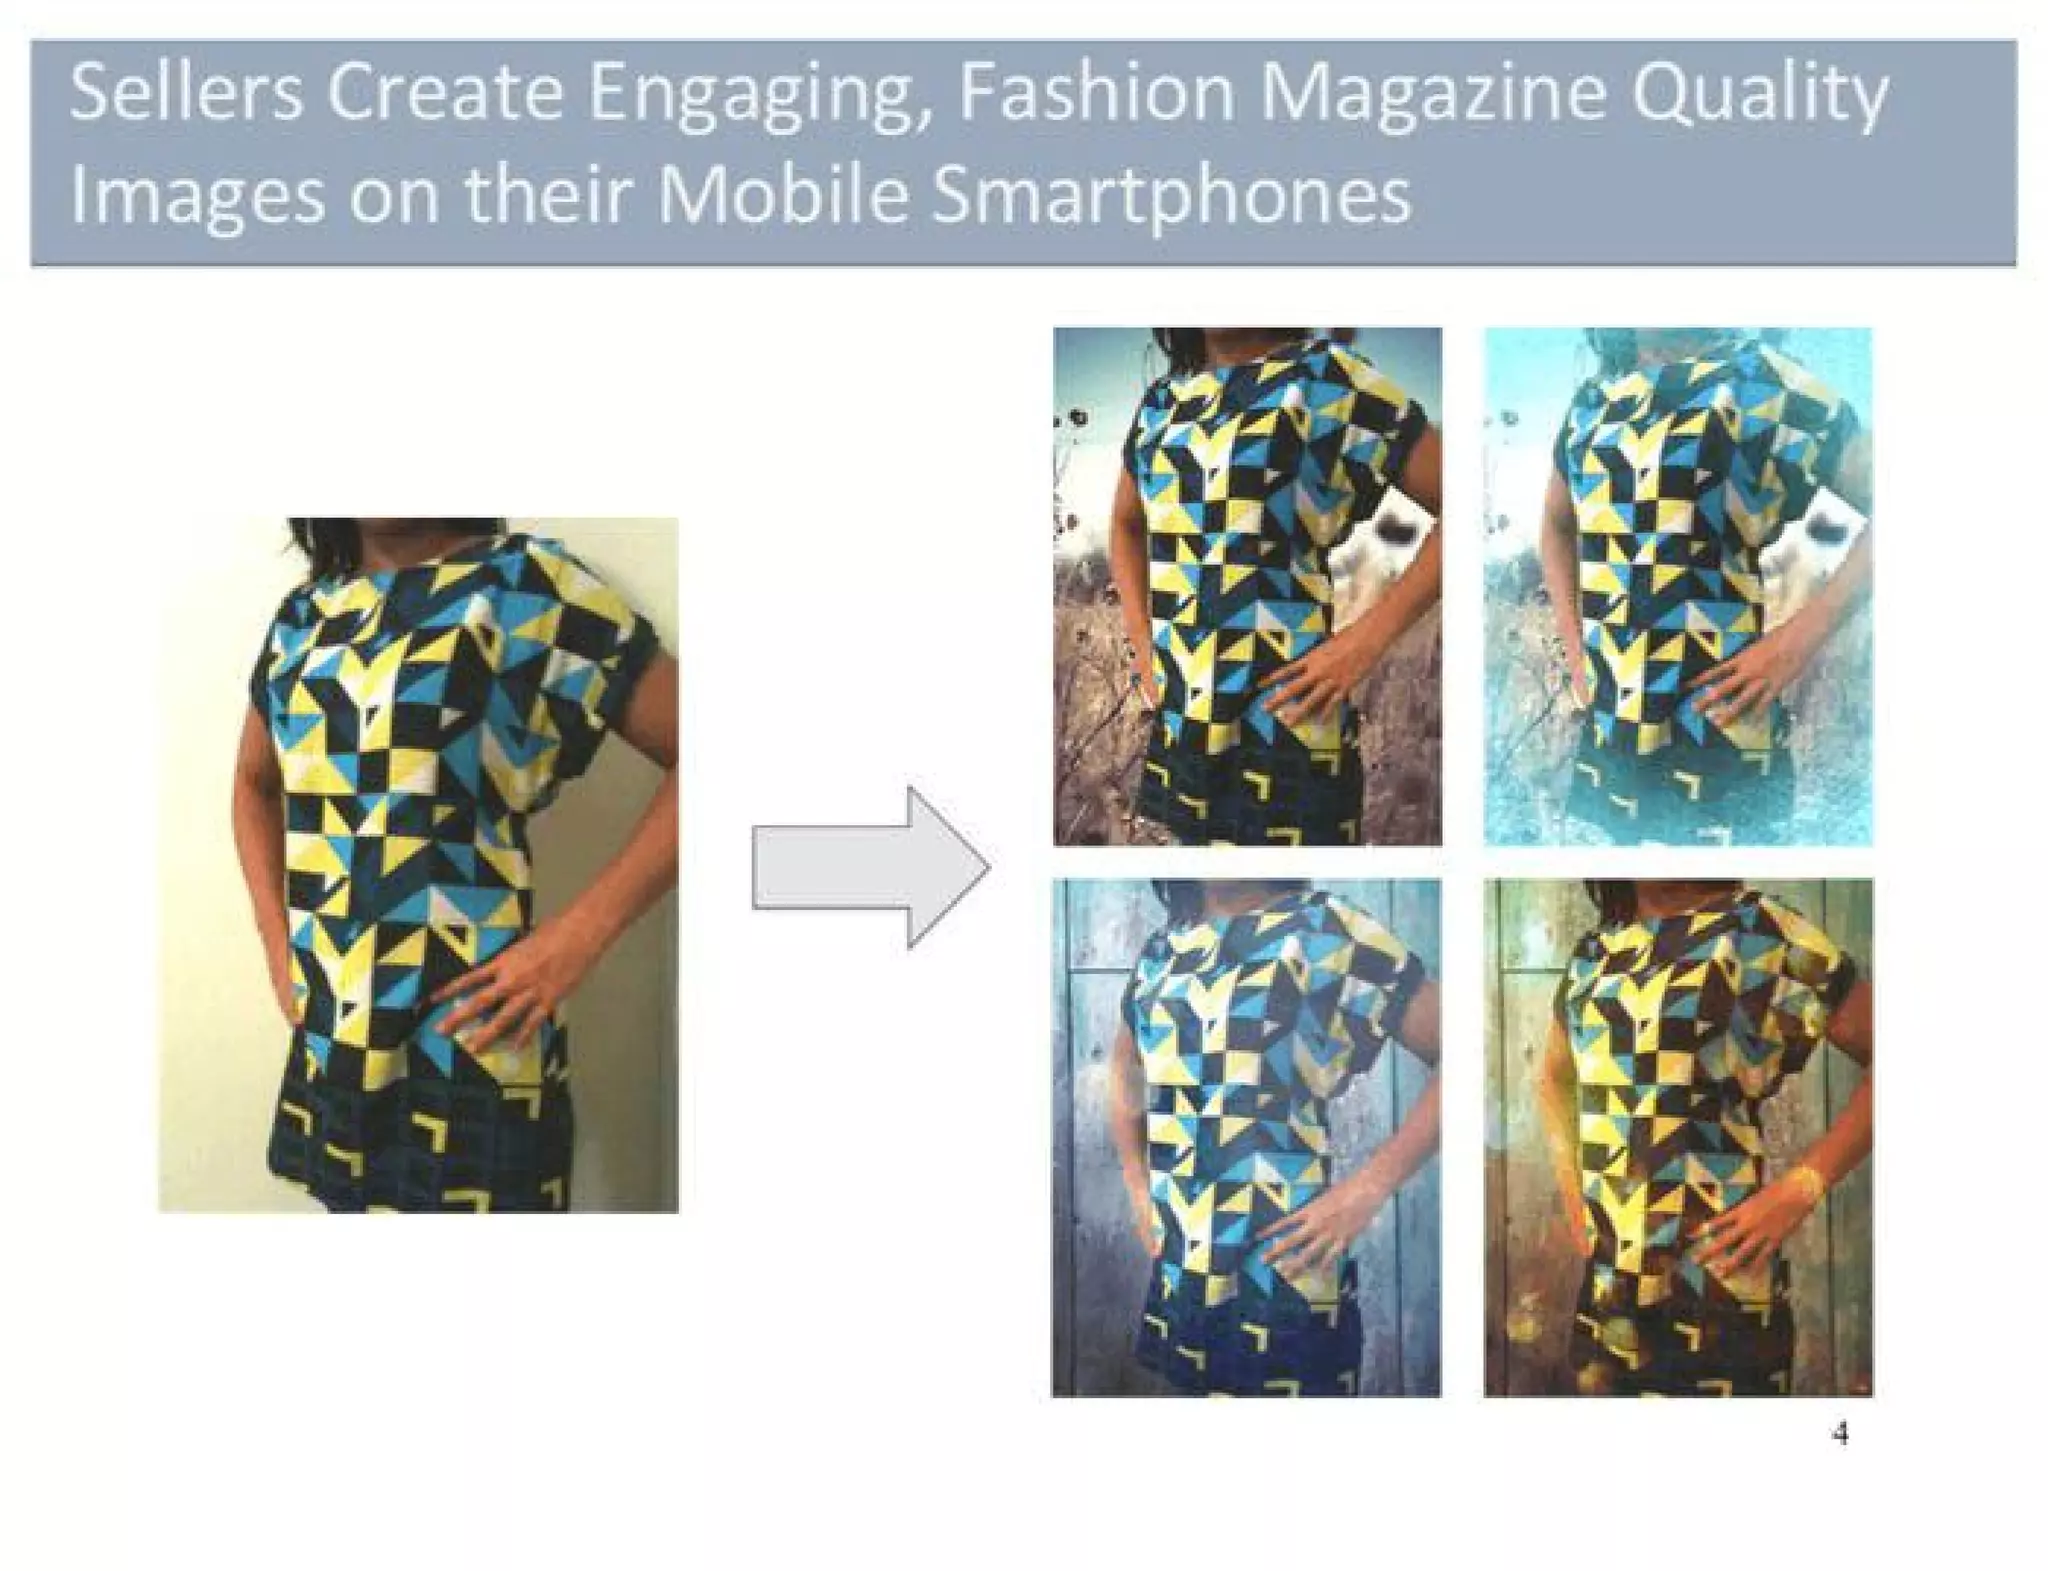
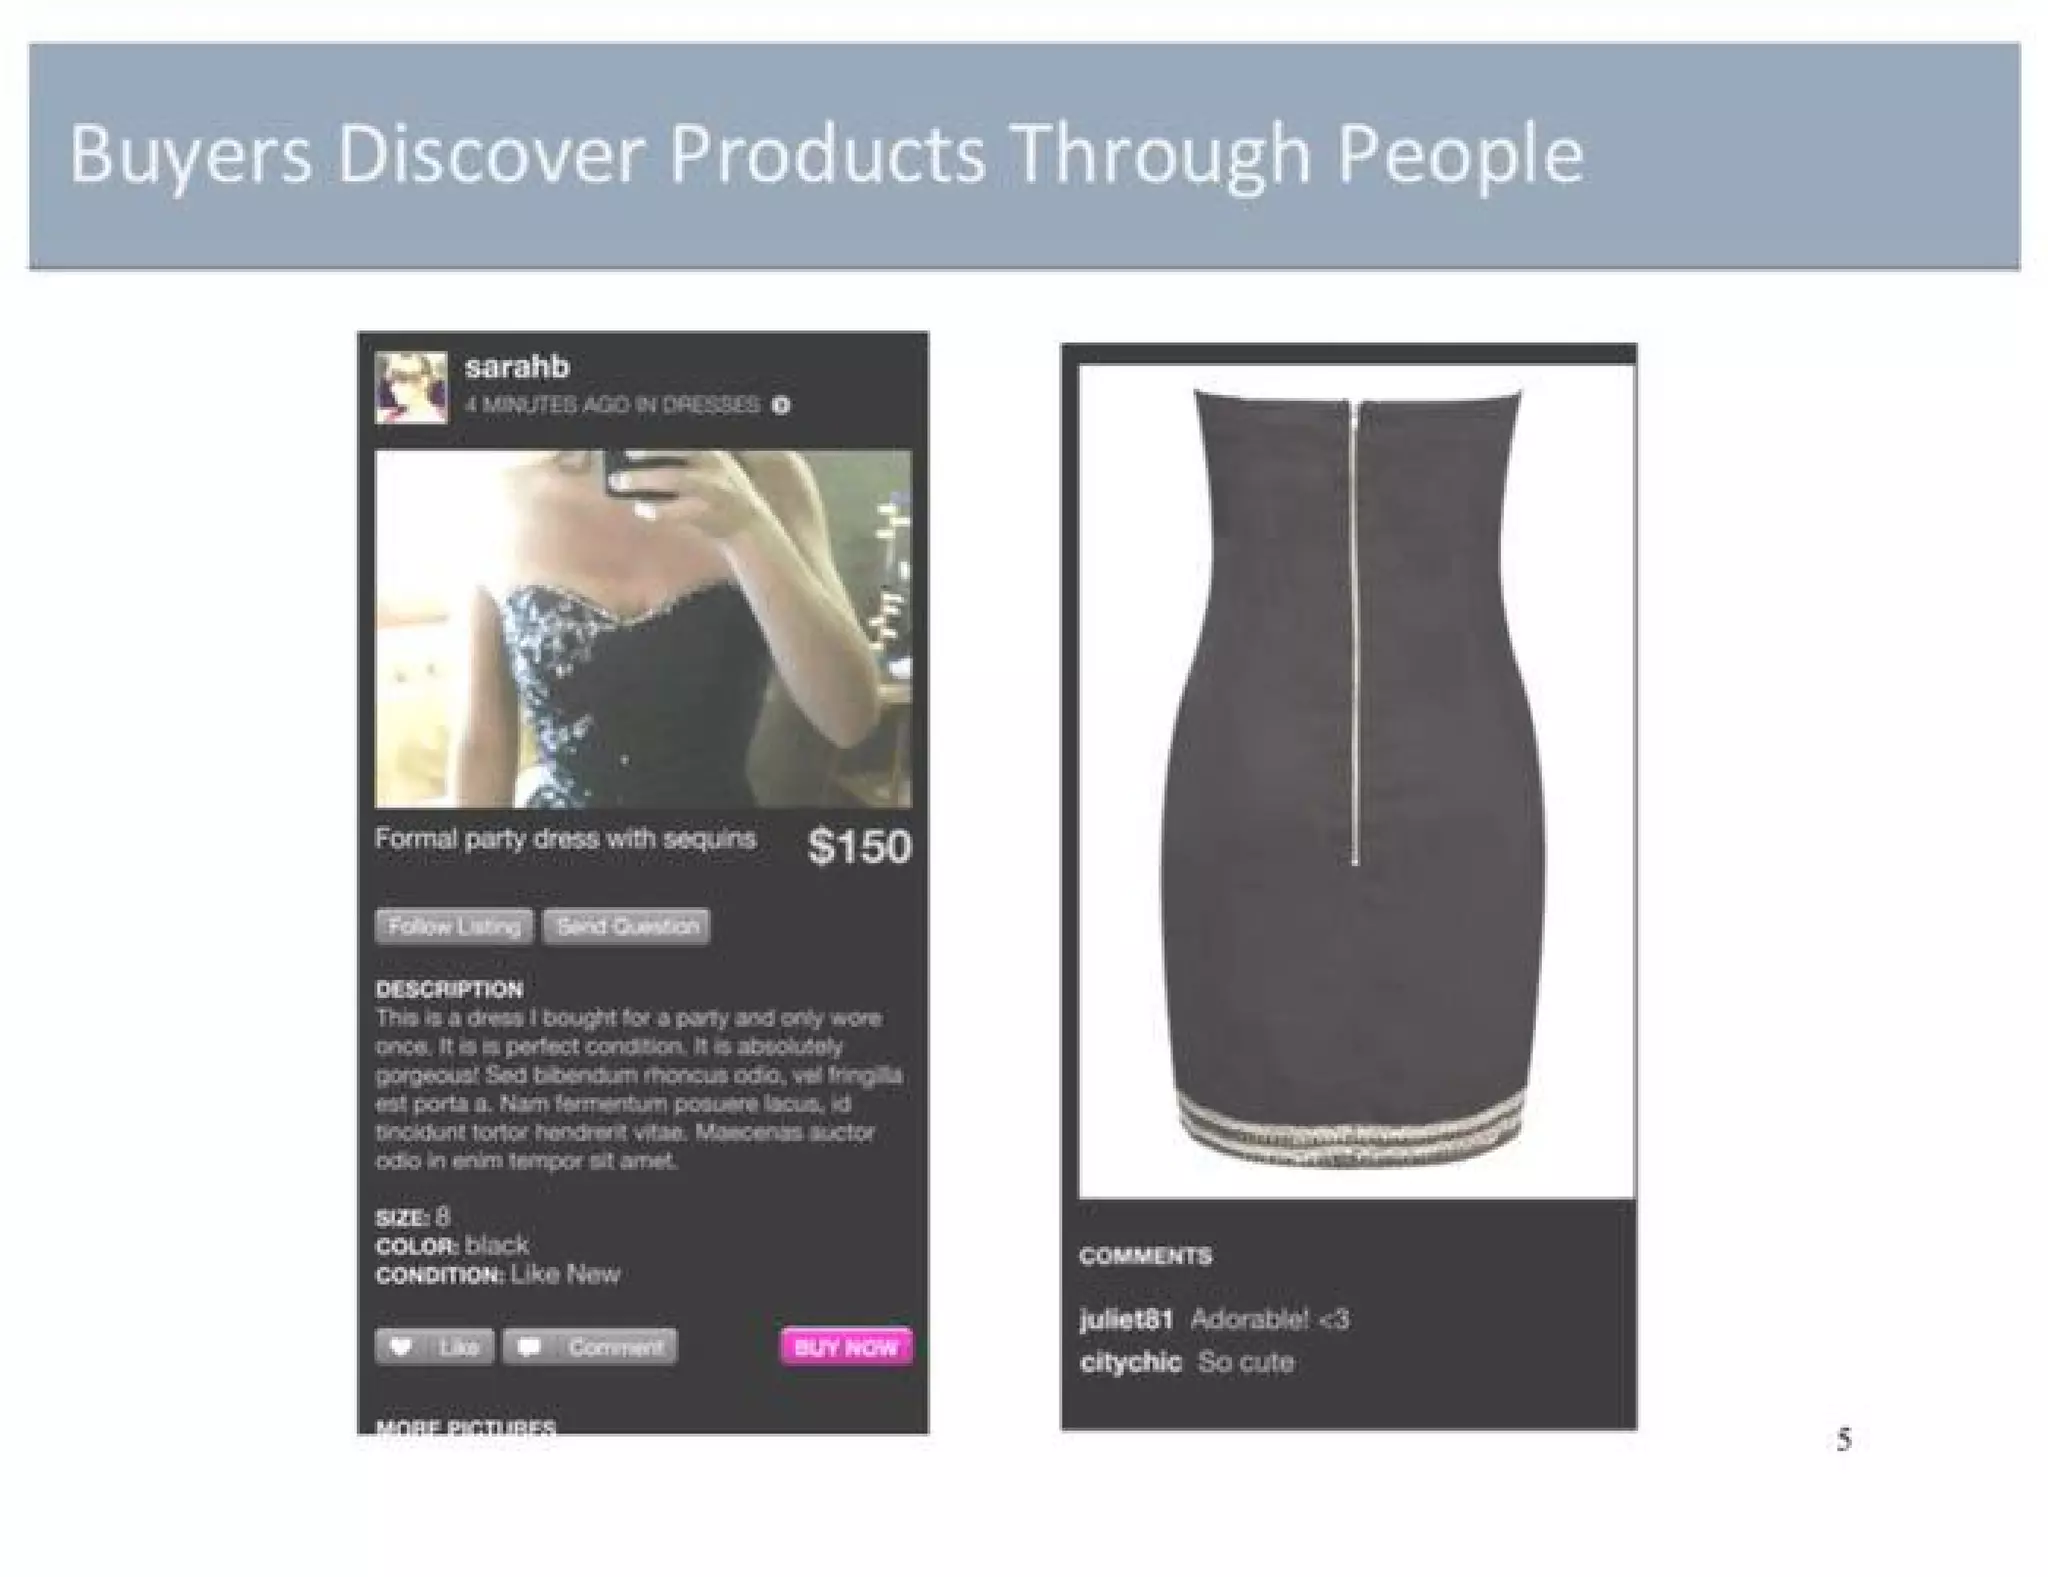
Slides 3–5 (represented by slide 3 here) show the product experience: how simple phone photos are converted into polished, fashion-forward listings, and how discovery flows through people rather than search. The deck uses before/after imagery and mockups of a listing to demonstrate product differentiation — visual quality, social browsing, and easy listing flows. Visual storytelling makes the functionality tangible without needing technical detail.

This approach teaches founders the power of showing rather than telling. When your product’s competitive advantage is user experience, include high-fidelity visuals and a short narrative of the primary user flow (take photo → stylize → list → discover). That convinces non-technical investors that the UI/UX is a core asset and reduces reliance on abstract product claims.

Key Takeaway: If UX is your advantage, show actual flows and before/after visuals — make the experience visceral for the viewer.
Market opportunity and sizing

Market opportunity and sizing

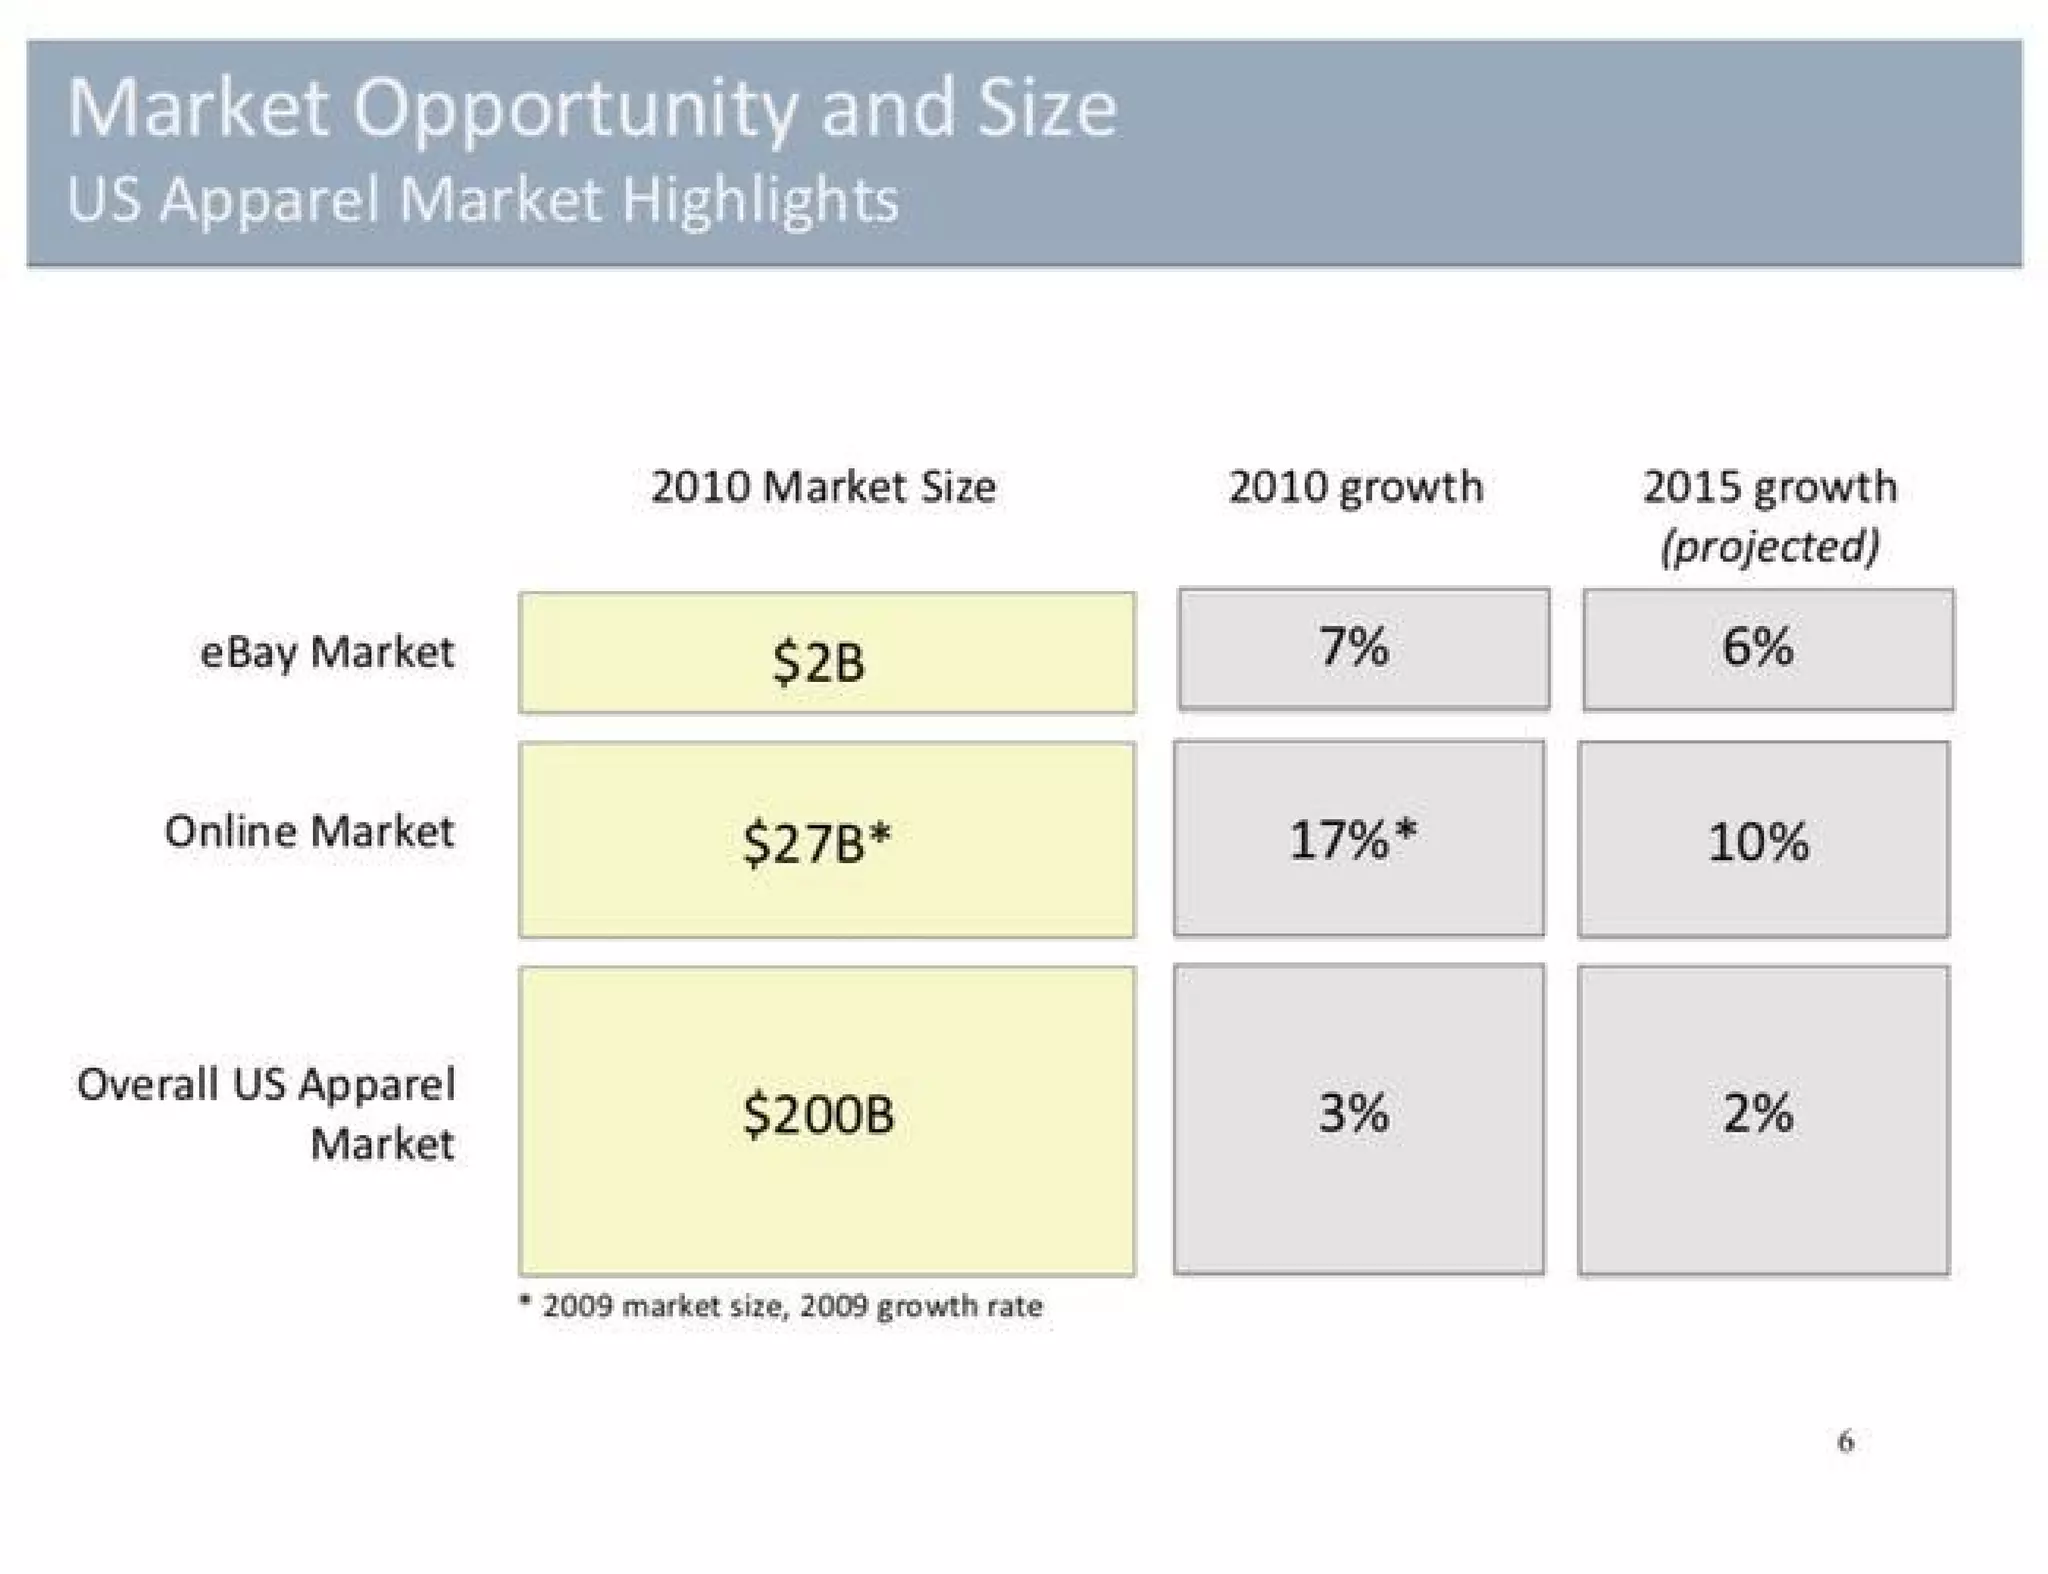
Slide 6 lays out market sizing: eBay fashion market, online apparel market, and overall US apparel market with growth rates. The numbers are high-level and framed to show a large addressable market with faster online growth — a classic investor-friendly structure. The slide balances conservative incumbent numbers (eBay $2B) and macro upside ($200B apparel market) to justify ambition without overreach.

The lesson: present market size with clear categories (existing marketplace, online segment, overall TAM) and include growth context. Investors want both the immediate, addressable segment and the long-term upside. Use credible public benchmarks and separate current market share from potential expansion paths.

Key Takeaway: Break TAM into relevant tiers (current marketplace, online segment, total market) and cite growth rates to justify both near-term traction and long-term upside.
Go-to-market / network effects (virtuous cycle)

Go-to-market / network effects (virtuous cycle)

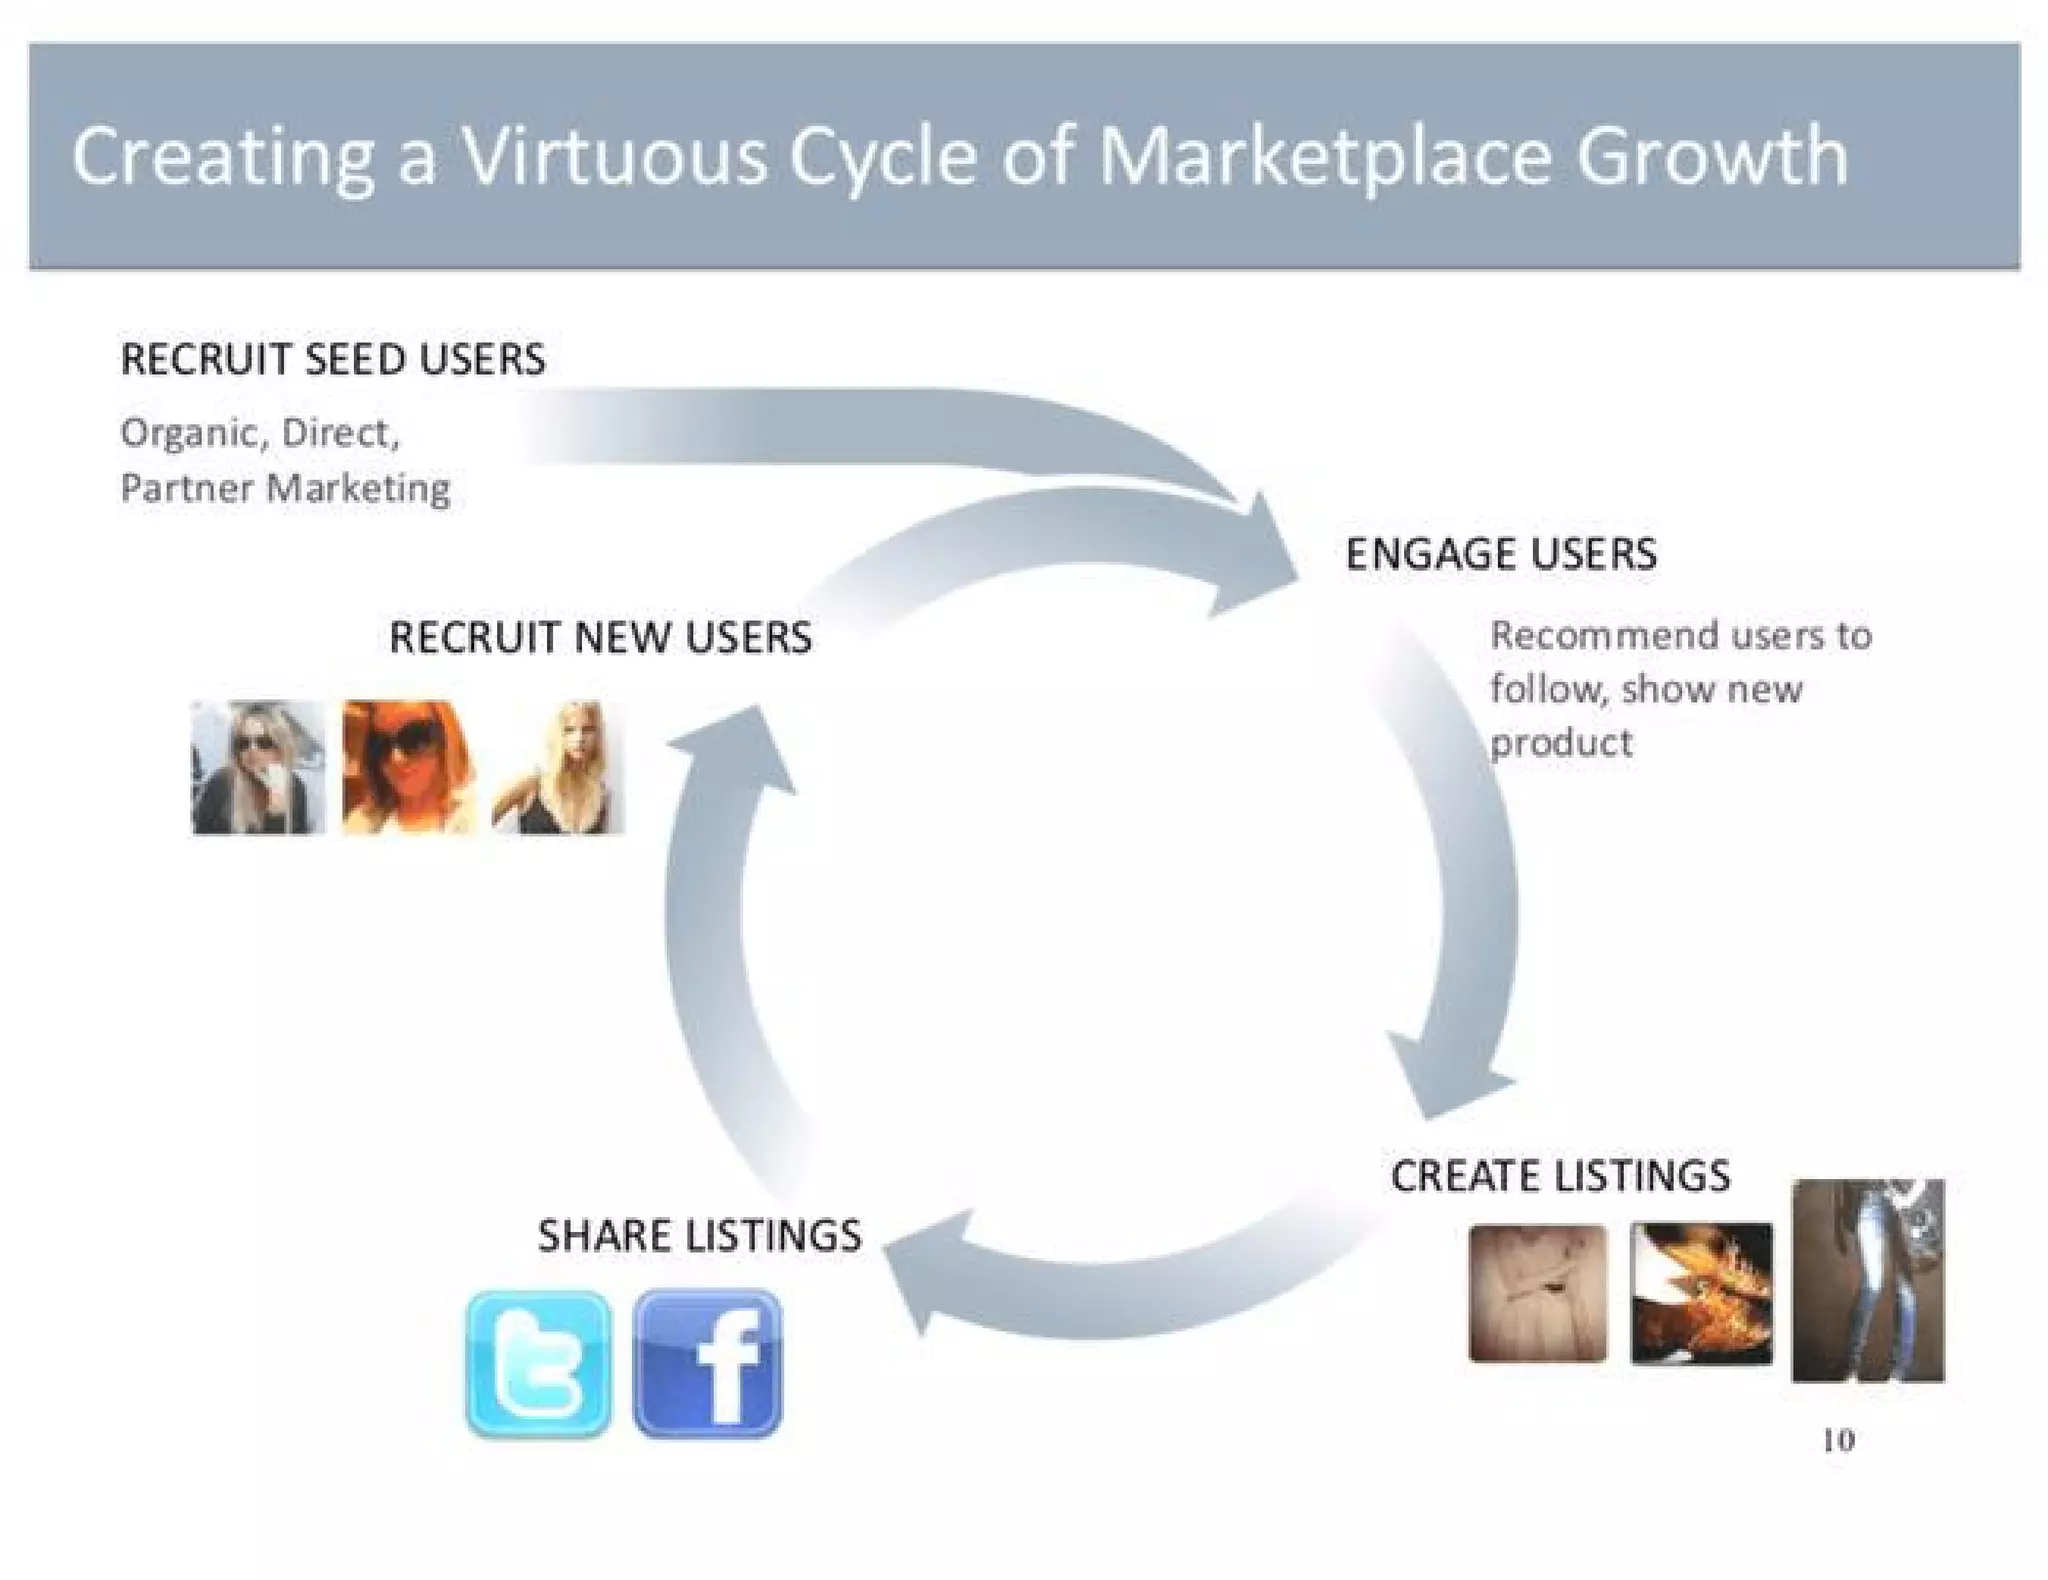
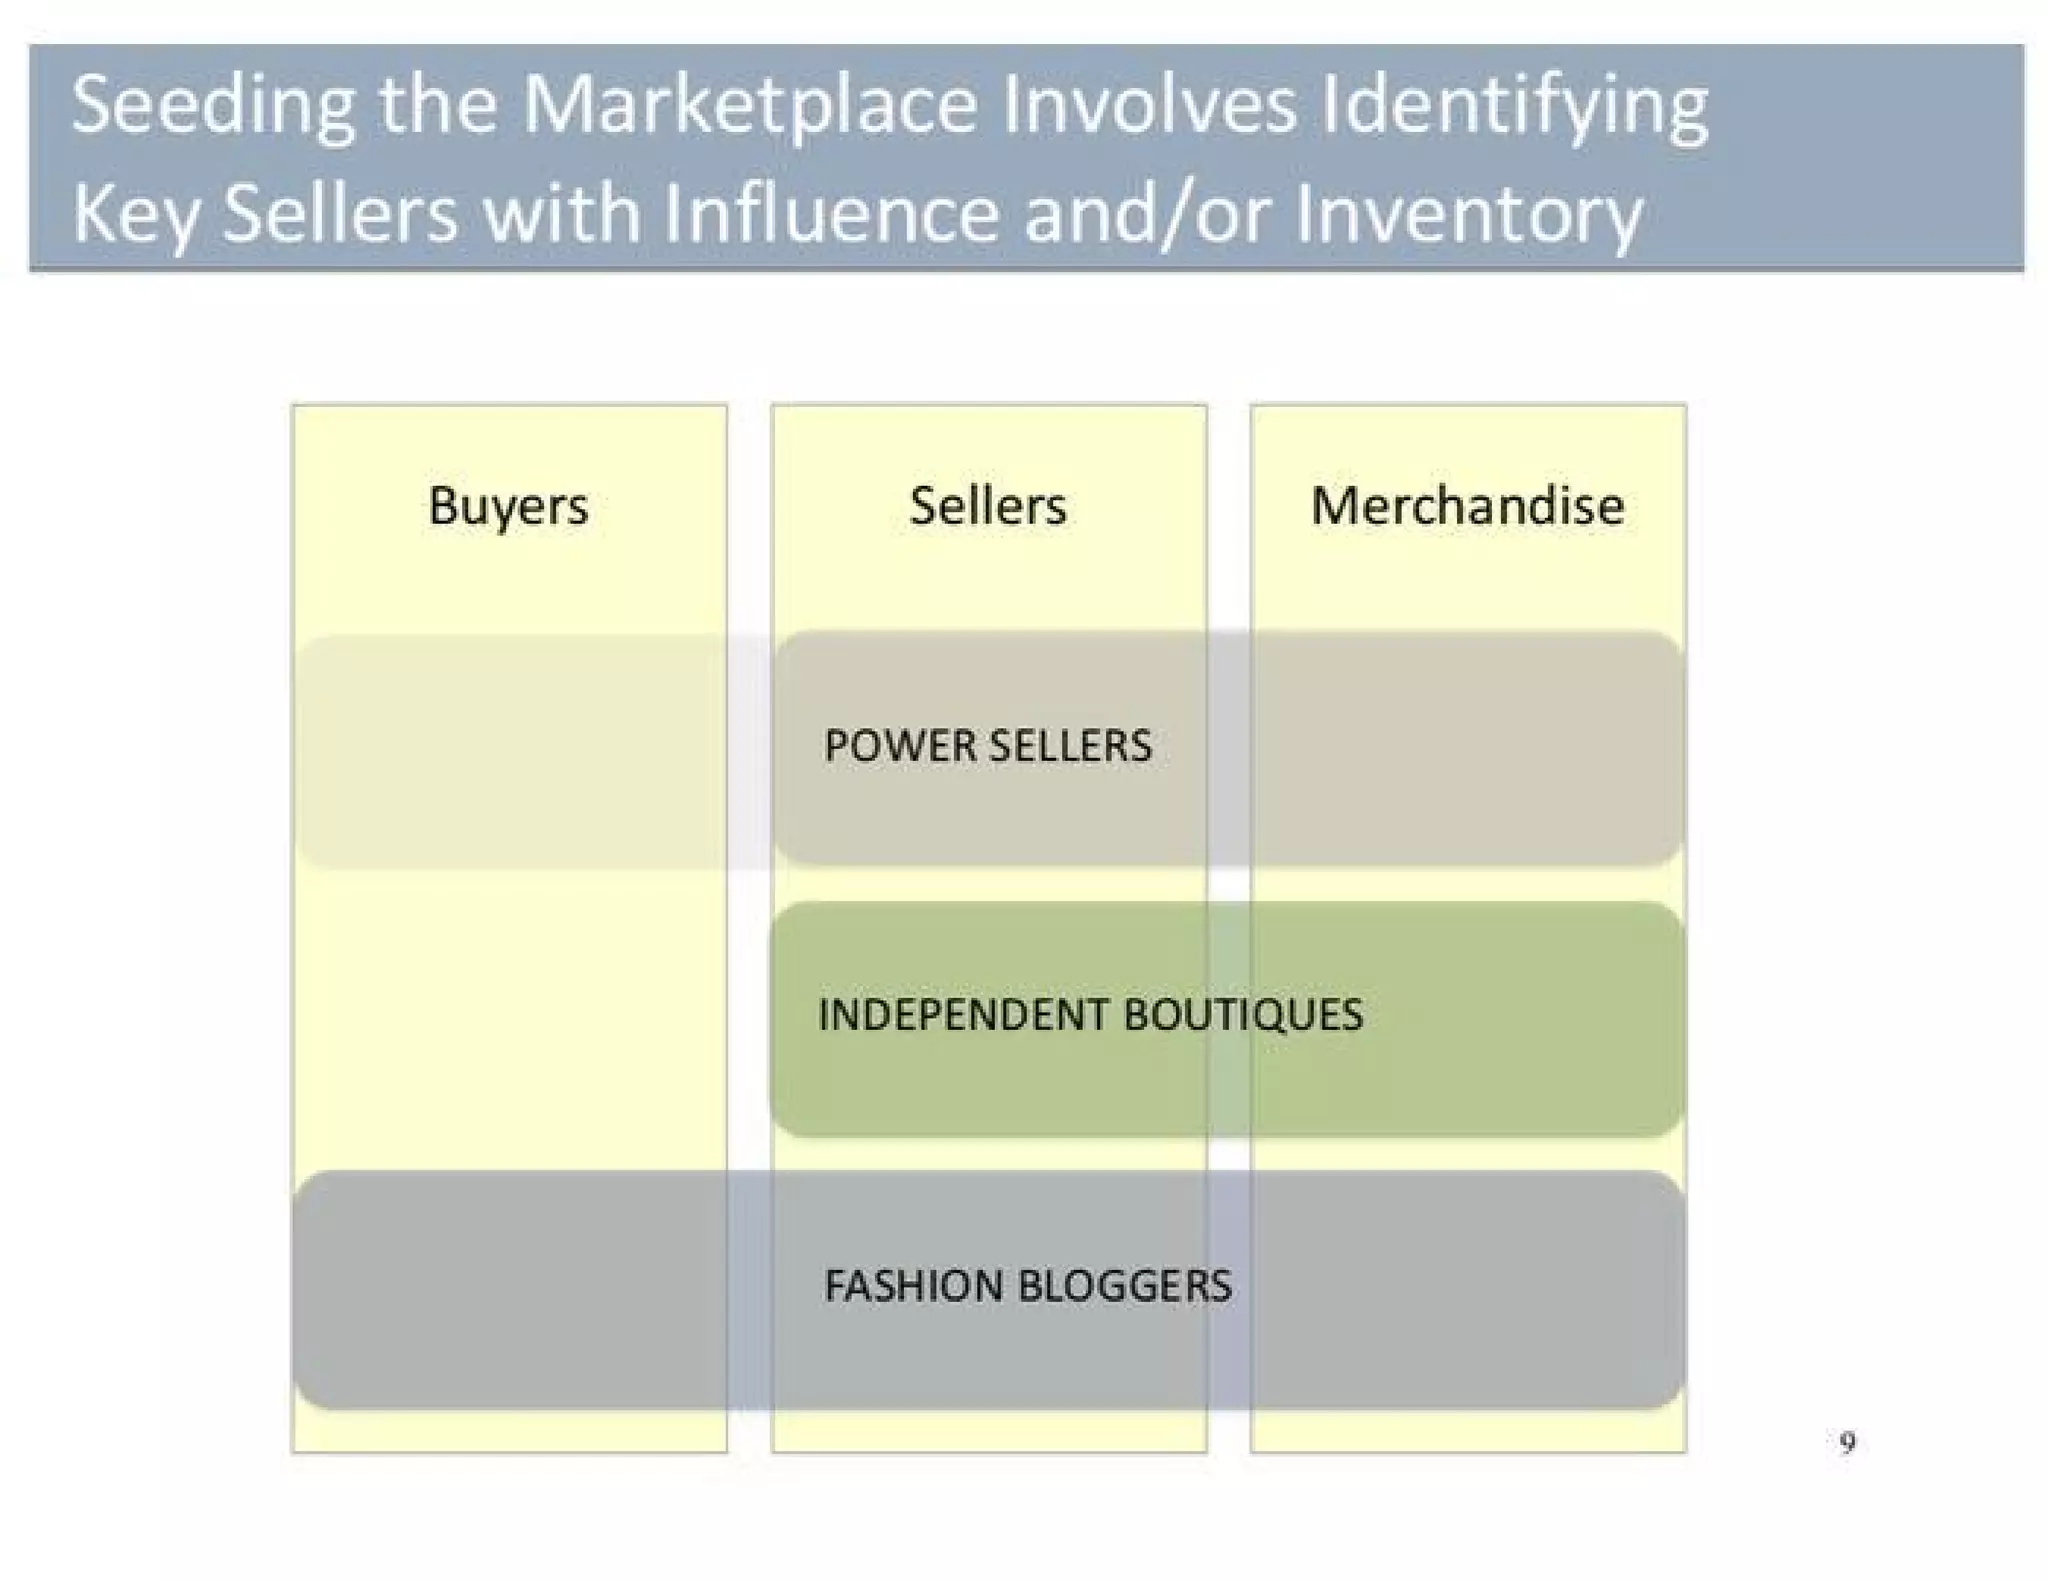
Slide 10 maps a clear viral growth loop: recruit seed users → engage users → create listings → share listings → recruit new users. Visualizing the cycle clarifies how product, social behavior and distribution interlock. The deck pairs this with tactics for seeding the marketplace (slide 9 in the deck set, but represented here by the loop) so investors can see both the mechanism and the early activation strategy.

This is an instructive example of how to present growth: show an explicit, repeatable loop and attach acquisition channels or seeding tactics to each stage. Founders should demonstrate that their product design inherently supports virality or retention, and that they have concrete plans to kick-start the loop with identifiable communities or power users.

Key Takeaway: Illustrate a repeatable growth loop and attach concrete seeding tactics to each step so investors understand path-to-scale.
Platform role and transaction intermediation

Platform role and transaction intermediation

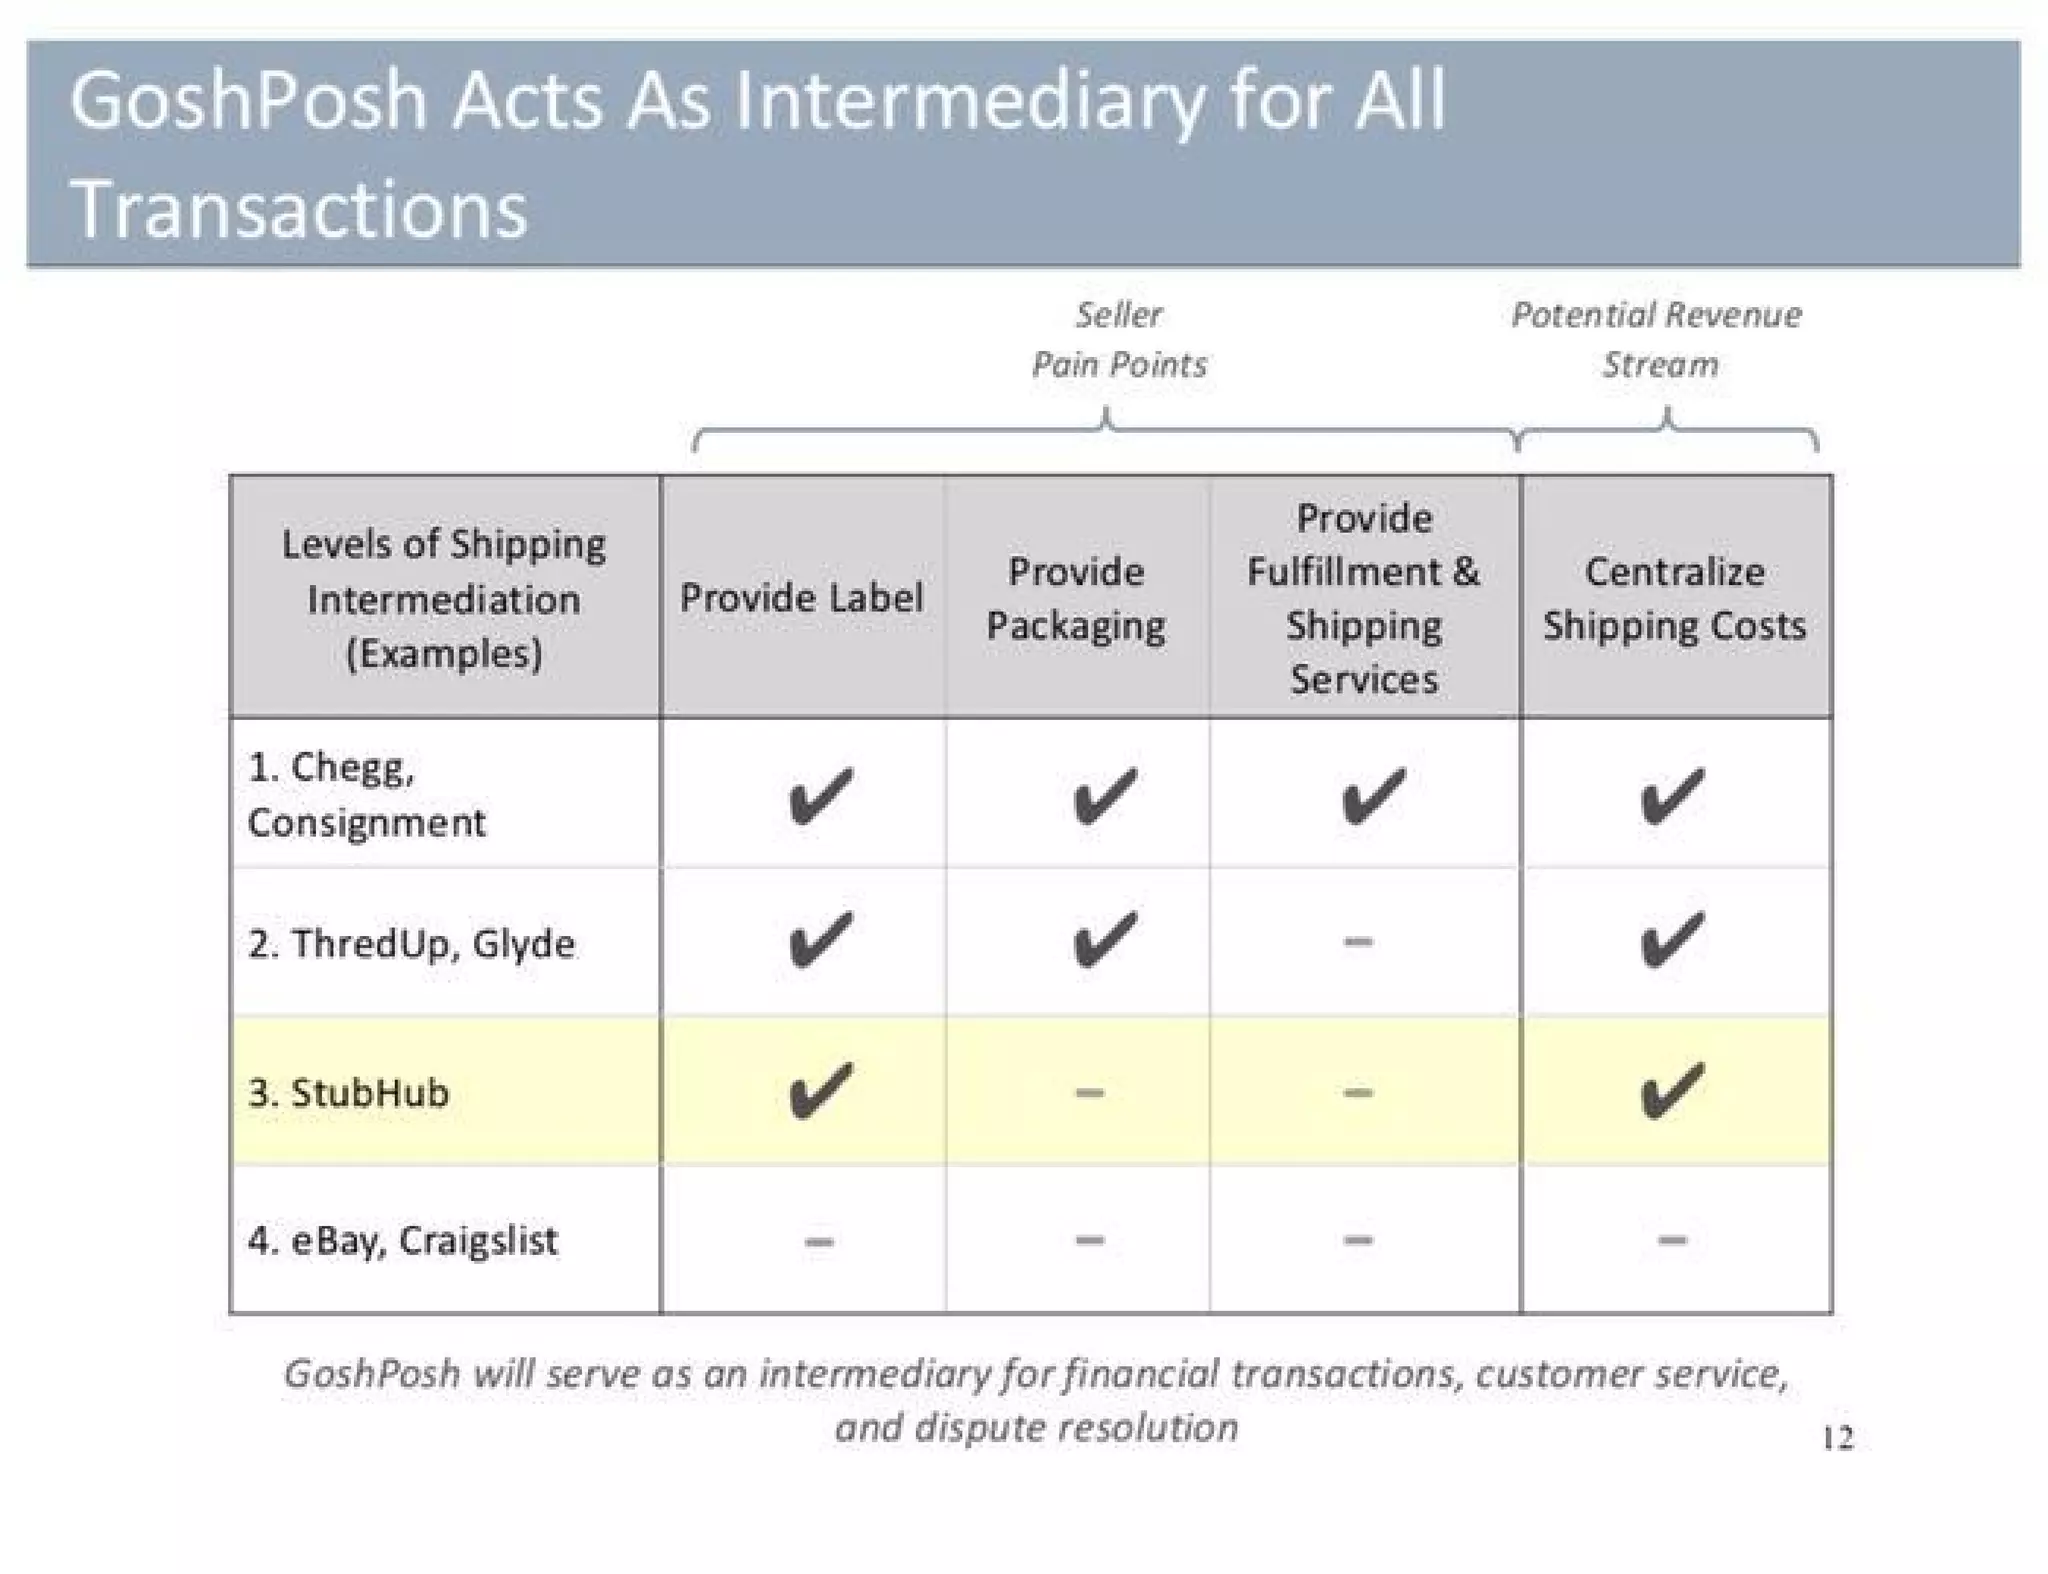
Slide 12 positions GoshPosh as an intermediary for transactions and highlights possible value-added services (labels, packaging, fulfillment, centralized shipping). By comparing examples (Chegg, ThredUp, StubHub, eBay) the slide shows where incumbents sit on the spectrum and where Poshmark intends to differentiate. It makes clear that control of payments/shipping is a potential revenue stream and trust builder.

Founders should note how this slide connects operations to monetization: intermediating logistics can both solve seller pain and become a defensible revenue stream. The slide also signals awareness of execution complexity; it’s a realistic move to commit to an intermediary role only when you can plan the operational playbook and unit economics.

Key Takeaway: Show how operational services (payments, shipping, fulfillment) both solve user pain and create monetizable, defensible capabilities — but be explicit about execution implications.
Business model, metrics and scale assumptions

Business model, metrics and scale assumptions

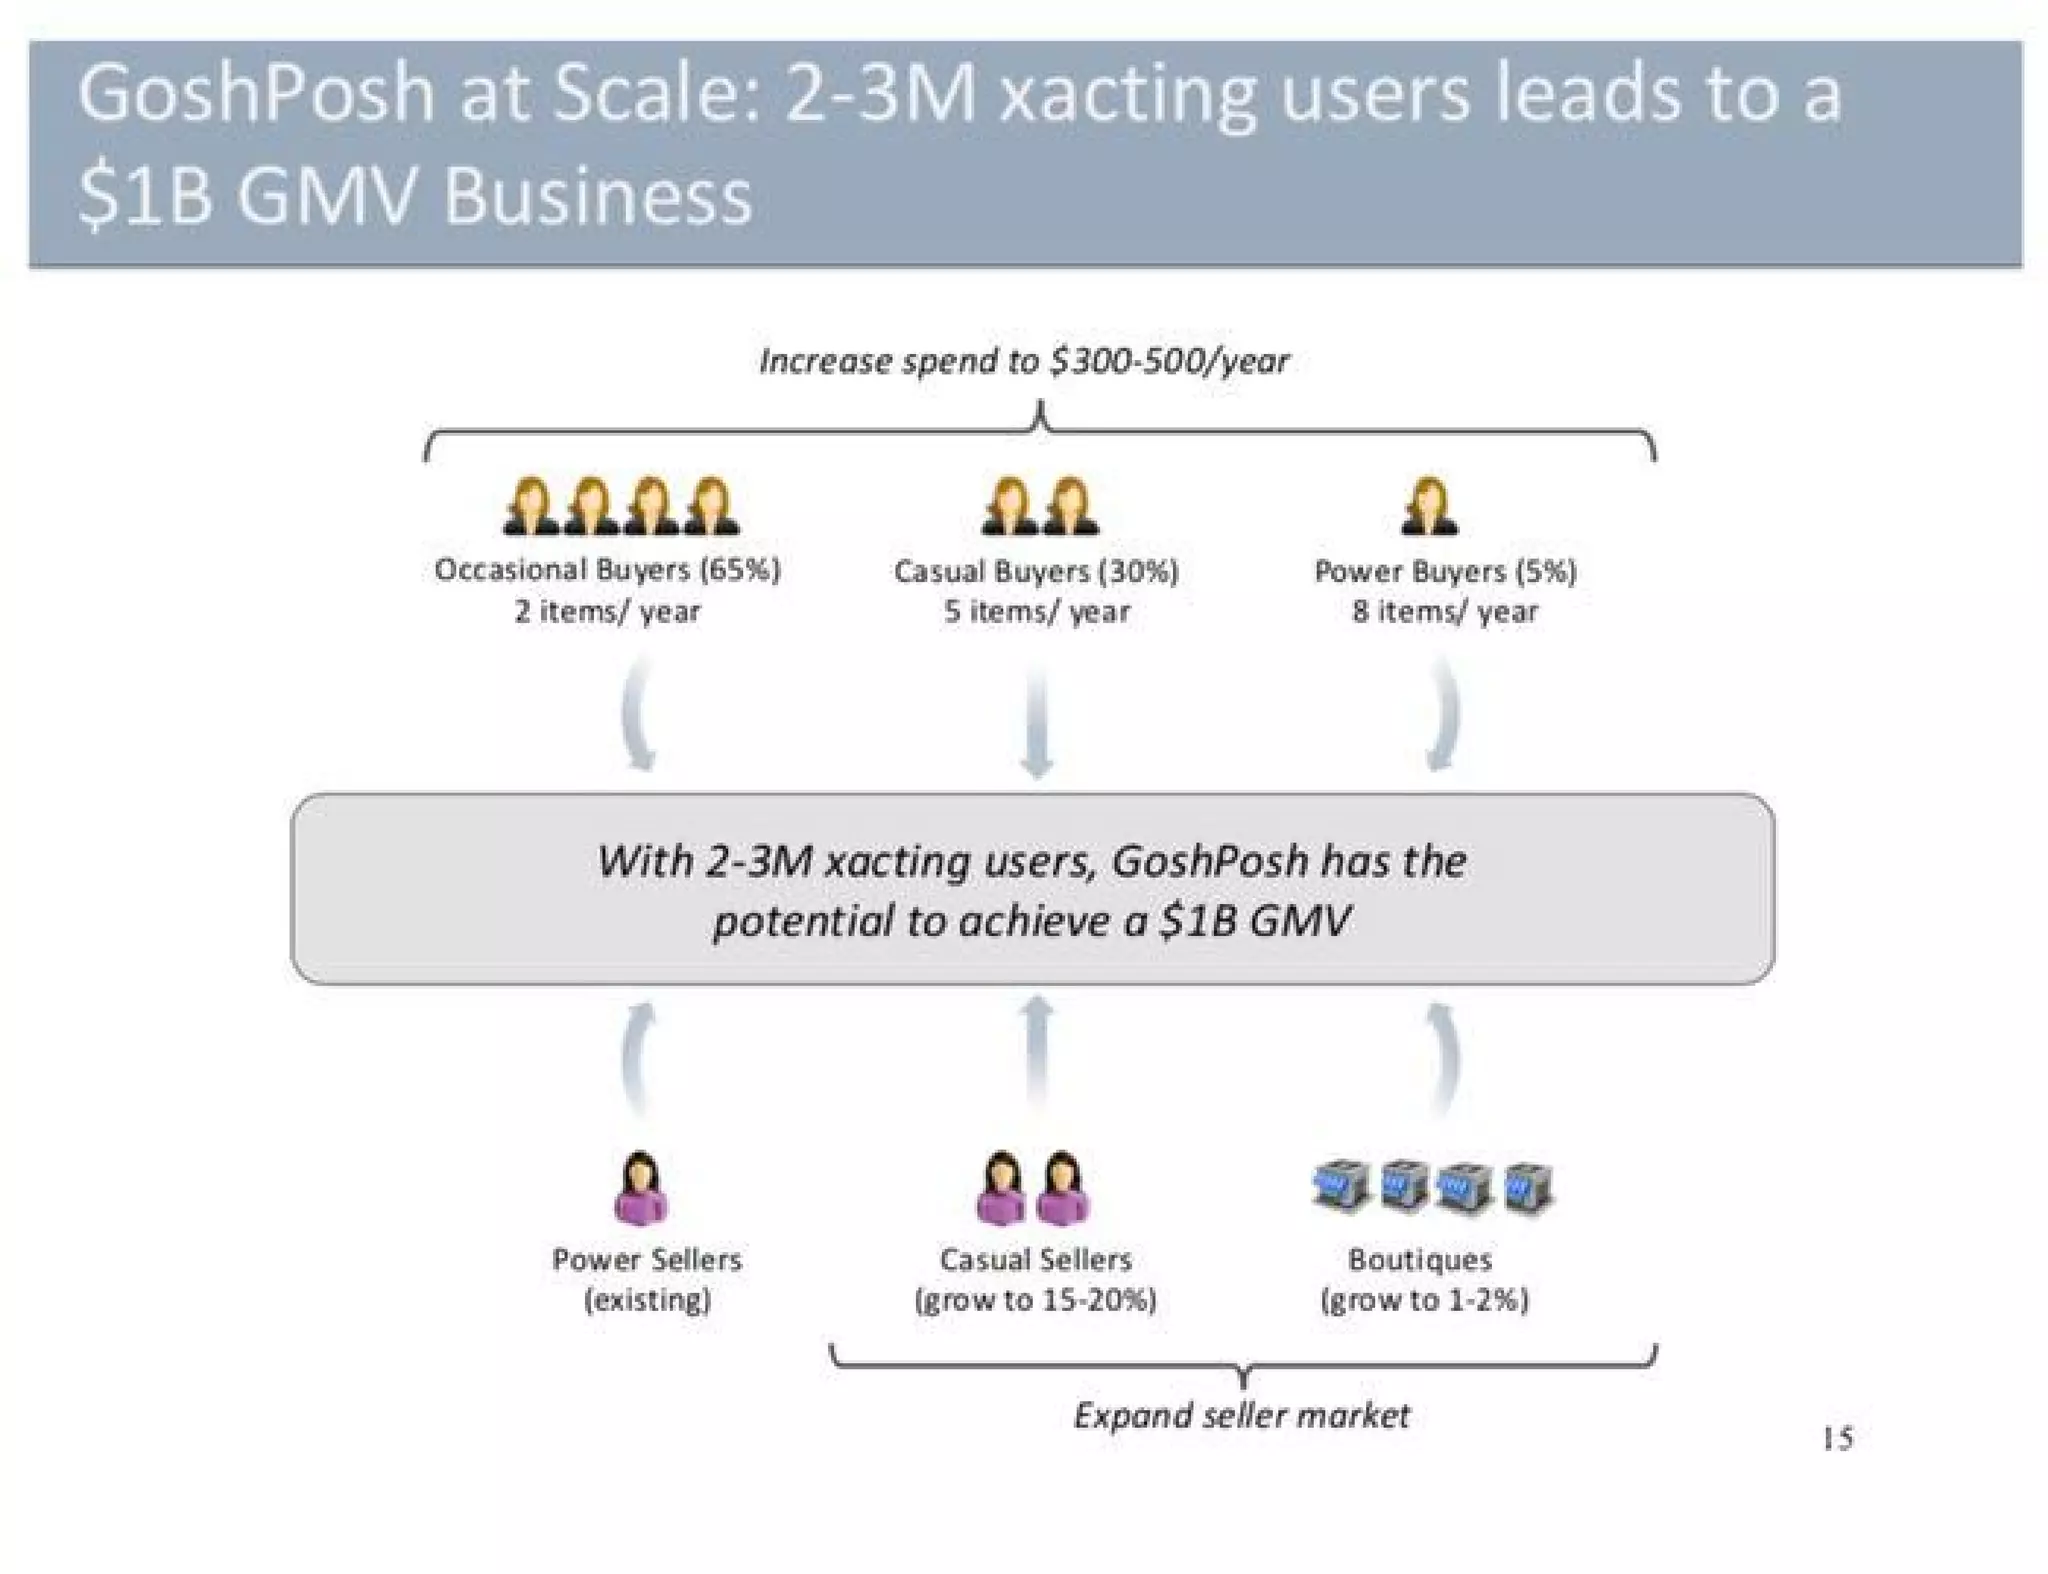
Slide 15 (and slide 13 earlier) present monetization and scale: a simple fee structure (20% transaction fee, $9.95 shipping) and a projection that 2–3M active transacting users could produce a $1B GMV business. The deck pairs unit economics with conversion assumptions (buyer cohorts, items per year) and seller expansion plans. The framing is high-level but ties fees to top-line GMV targets, which investors use to back-of-the-envelope valuations.

For founders, this demonstrates the importance of explicit, simple monetization models and transparent conversion assumptions. It’s better to show a clear GMV path with conservative user cohorts than to hide behind vague revenue claims. Also, linking pricing to user behavior (items/year, buyer segmentation) makes the model testable as you scale.

Key Takeaway: Present a simple pricing model tied to explicit user cohort and GMV assumptions so investors can validate your path to scale.

Conclusion: Key Lessons

This deck succeeds by combining a crisp problem statement, a tangible product demo, credible market sizing, a clear growth loop, and straightforward monetization. It balances emotion (fashion discovery) with operational detail (listing UX, shipping intermediation) and uses visuals to make the user experience and growth mechanics obvious. Actionable advice for founders: lead with a one-line positioning, visually demonstrate your core user flow if UX is the advantage, structure market size into tiers, map a repeatable go-to-market loop with seeding tactics, and tie pricing to explicit user behavior so your scaling assumptions are testable. Keeping slides simple, metric-focused, and narrative-driven — as Poshmark did — makes it far easier for investors to grasp both the opportunity and the plan to capture it.

Full Deck Analysis

11 sections

Overview

Company: Poshmark (presented as “GoshPosh” in deck)
Round: Seed ($3.5M)
Year: 2011
Outcome: Acquired by Naver for $1.2B (2023)

Executive Summary

The deck is a focused seed pitch for a mobile-first fashion marketplace that makes listing as easy as taking a photo and makes discovery social (people → products). It pairs a clear product demo/visual play (mobile images + image filters) with market data around apparel and resale to justify an addressable opportunity, a simple transaction-based business model, and a social distribution loop.

Problem Statement

How the deck articulates the problem (slides referenced)

  • Sellers: many consumers and small boutiques have excess inventory but current marketplaces are time-consuming and hard to sell from (Slide 2: “the listing process is time consuming and daunting”).
  • Buyers: fashion e‑commerce is search-driven whereas fashion purchases are discovery-driven — buyers need a place to discover new ideas, tips and products (Slide 2).
  • The deck emphasizes friction at listing and discovery as the core pain points to solve (Slides 2, 3).

Solution

How the deck positions the solution

  • Mobile-first listing flow: users list via smartphone (iPhone) and the app converts photos into “fashion magazine quality” images (Slides 3–4).
  • Discovery is social: users find products through people they follow (Slide 3, Slide 5).
  • Transaction intermediary: Poshmark plans to handle payments, shipping labels and partial shipping/fulfillment intermediation to simplify transactions for sellers and buyers (Slides 3, 12).

Market Opportunity

TAM/SAM/SOM analysis — numbers pulled from slides

  • Overall US apparel market (2010): $200B (Slide 6).
  • Online apparel market (2009 number shown in deck): $27B (Slide 6).
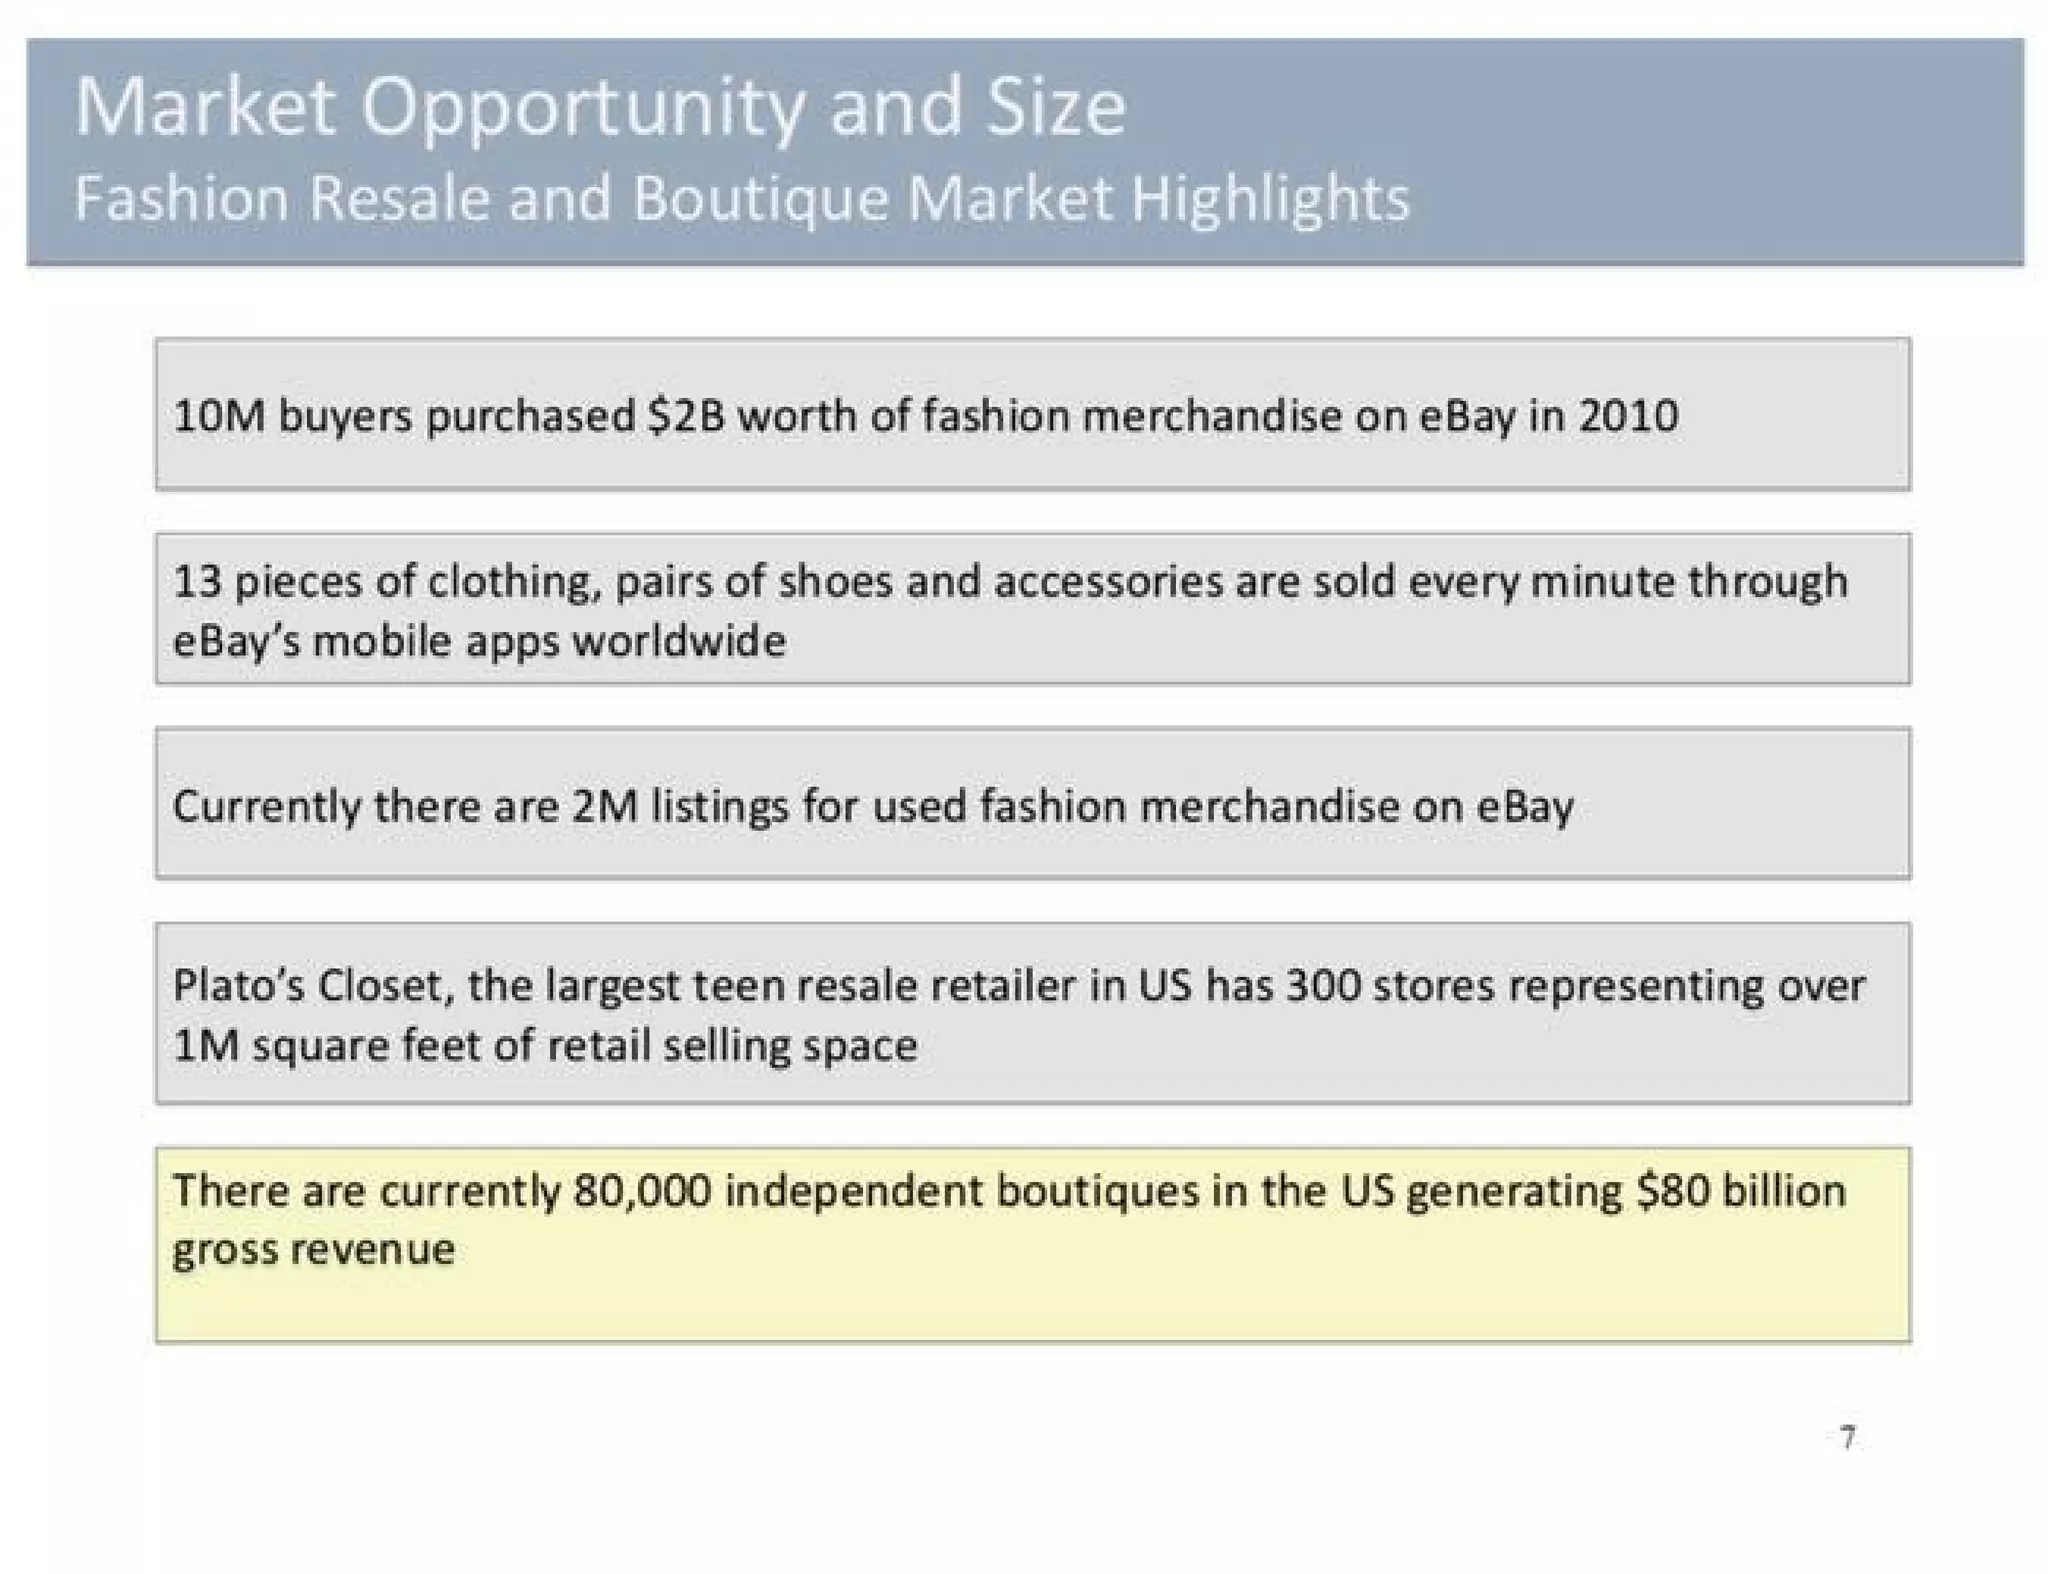
  • eBay fashion market (2010): $2B (Slide 6 & Slide 7 shows 10M buyers bought $2B on eBay in 2010).
  • Other resale indicators: 2M used-fashion listings on eBay and 13 pieces of clothing/shoes/accessories sold every minute via eBay mobile (Slide 7).
  • Boutique opportunity: deck cites 80,000 independent US boutiques generating $80B gross revenue (Slide 7).
  • Scale target: with 2–3M transacting users, Poshmark projects potential for a $1B GMV business (Slide 15).

Notes: the deck cites large top-line markets (apparel $200B) and a meaningful online/resale subset ($27B / $2B) but does not explicitly break down SOM by geography/user cohort beyond the 2–3M user scale target.

Business Model

Revenue model and unit economics (as presented)

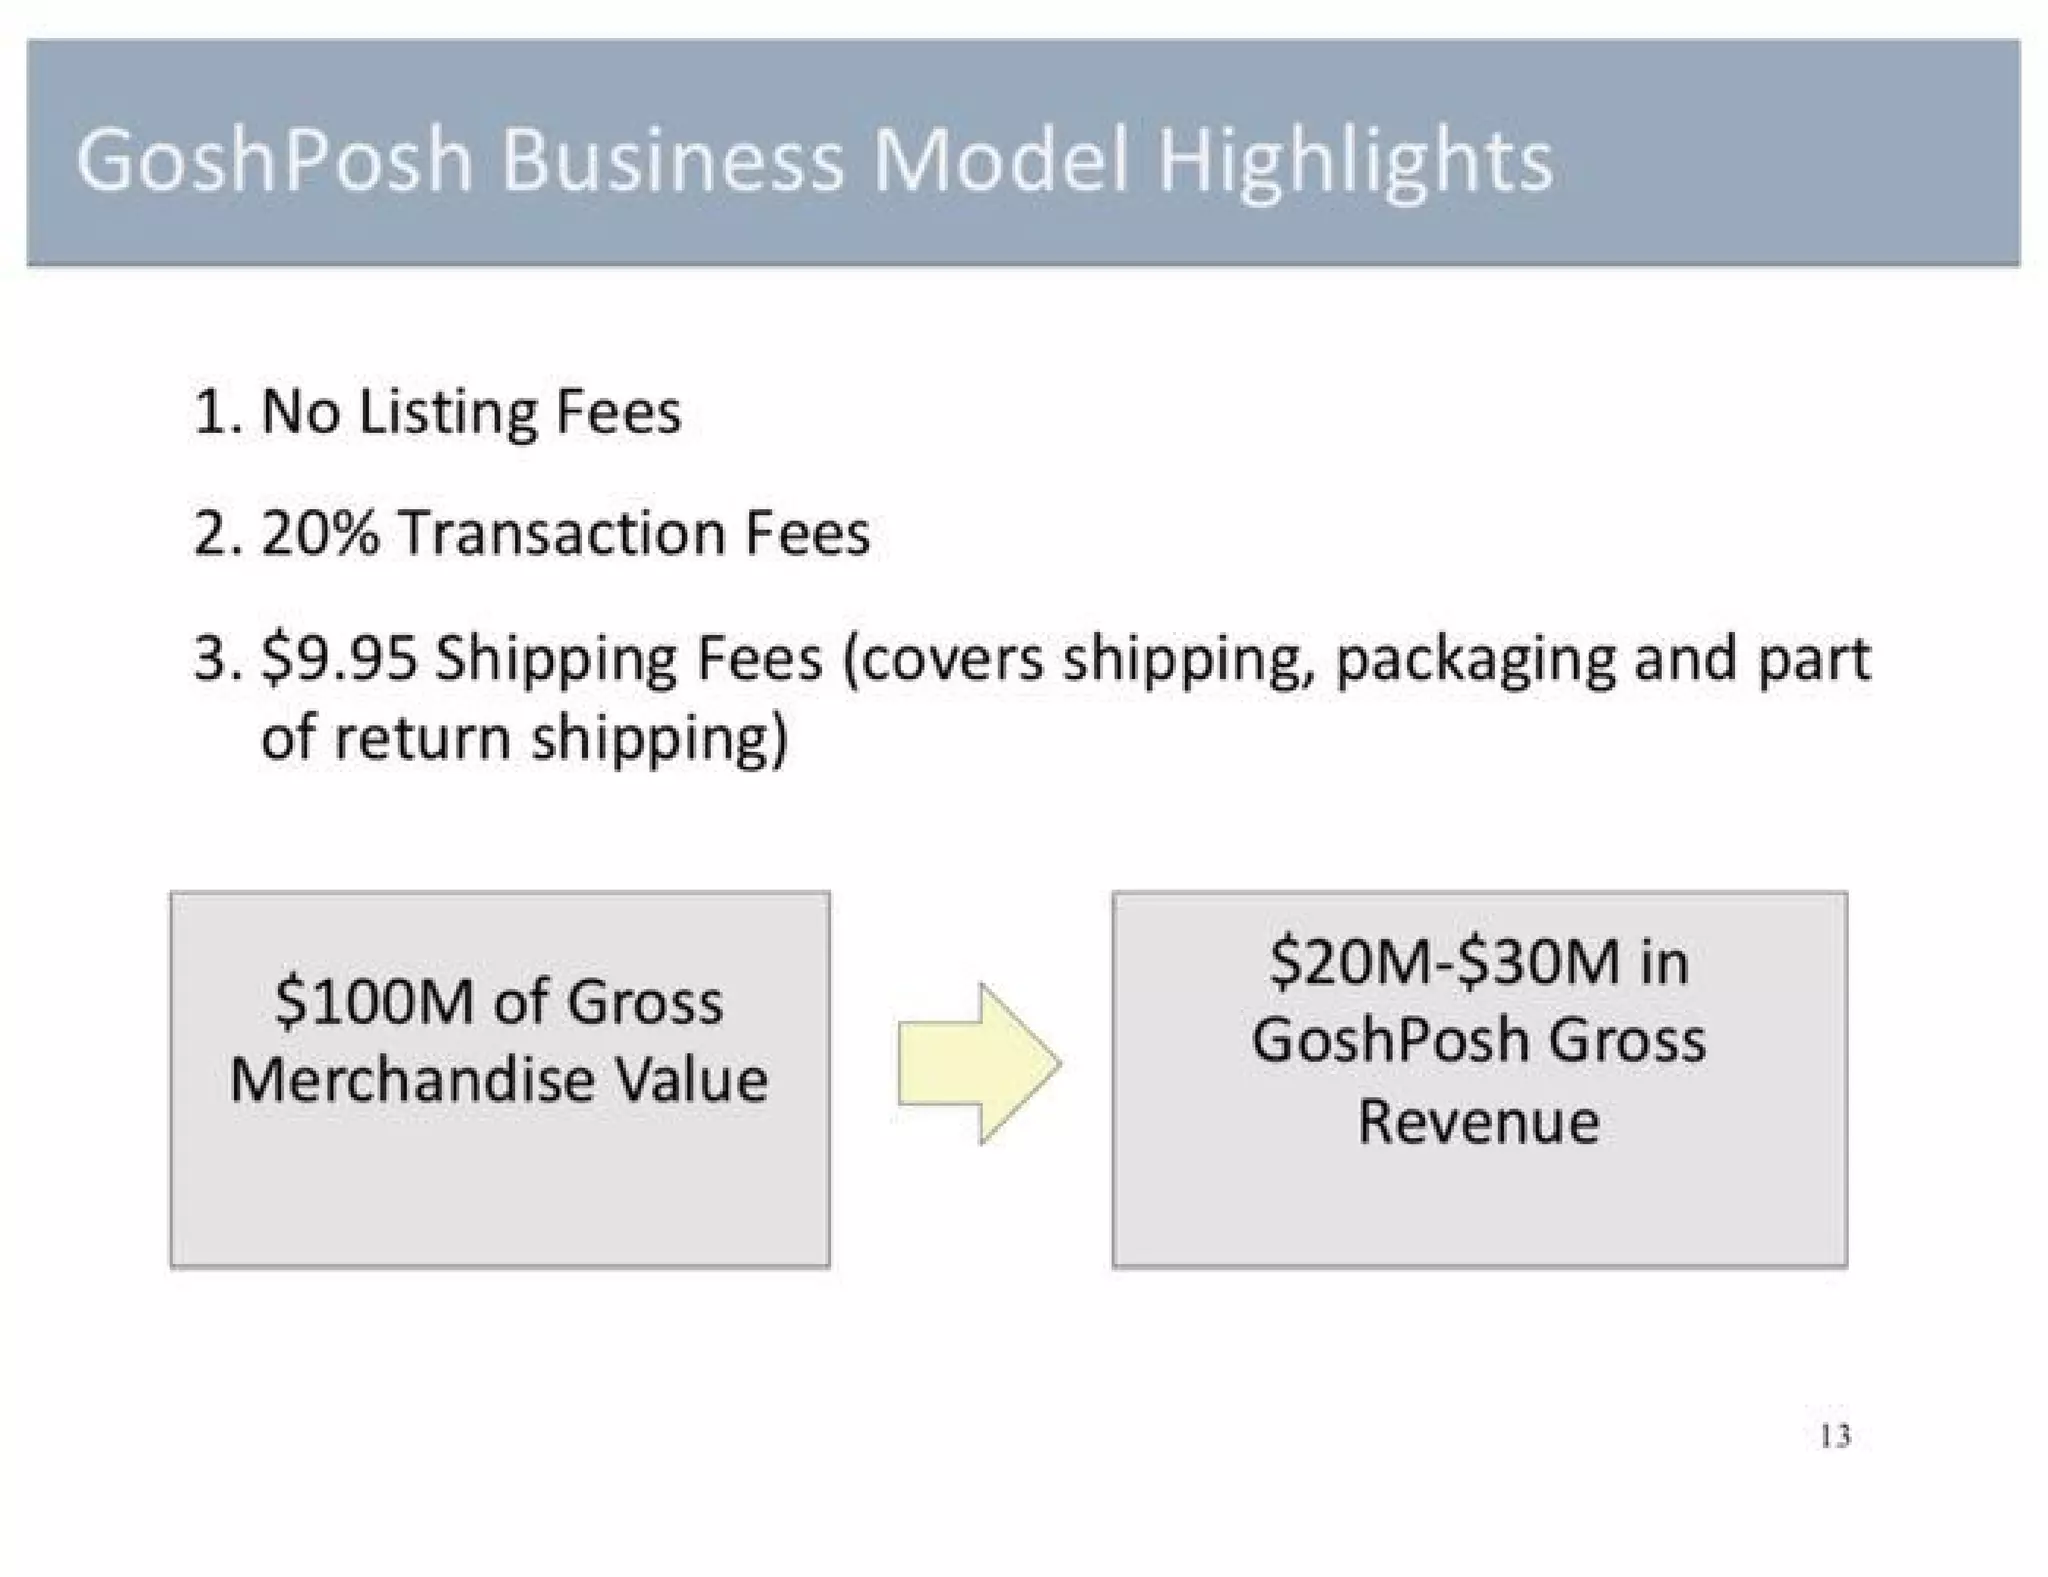
  • No listing fees (to encourage supply) (Slide 13).
  • 20% transaction fee on sales (Slide 13).
  • $9.95 shipping fee to buyers that “covers shipping, packaging and part of return shipping” (Slide 13).
  • Example conversion: if $100M GMV → $20M–$30M gross revenue (Slide 13 projection).
  • Additional monetization: potential fulfillment/shipping services and centralized shipping cost savings (Slide 12).

Unit economics missing from deck: CAC, take-rate net margins after shipping costs/refunds, average order value (AOV) by cohort, LTV.

Traction & Metrics

Growth metrics and proof points with specific numbers (what’s in the deck)

  • Market validation via third-party metrics: 10M buyers purchased $2B in fashion on eBay in 2010; 2M used fashion listings on eBay (Slide 7).
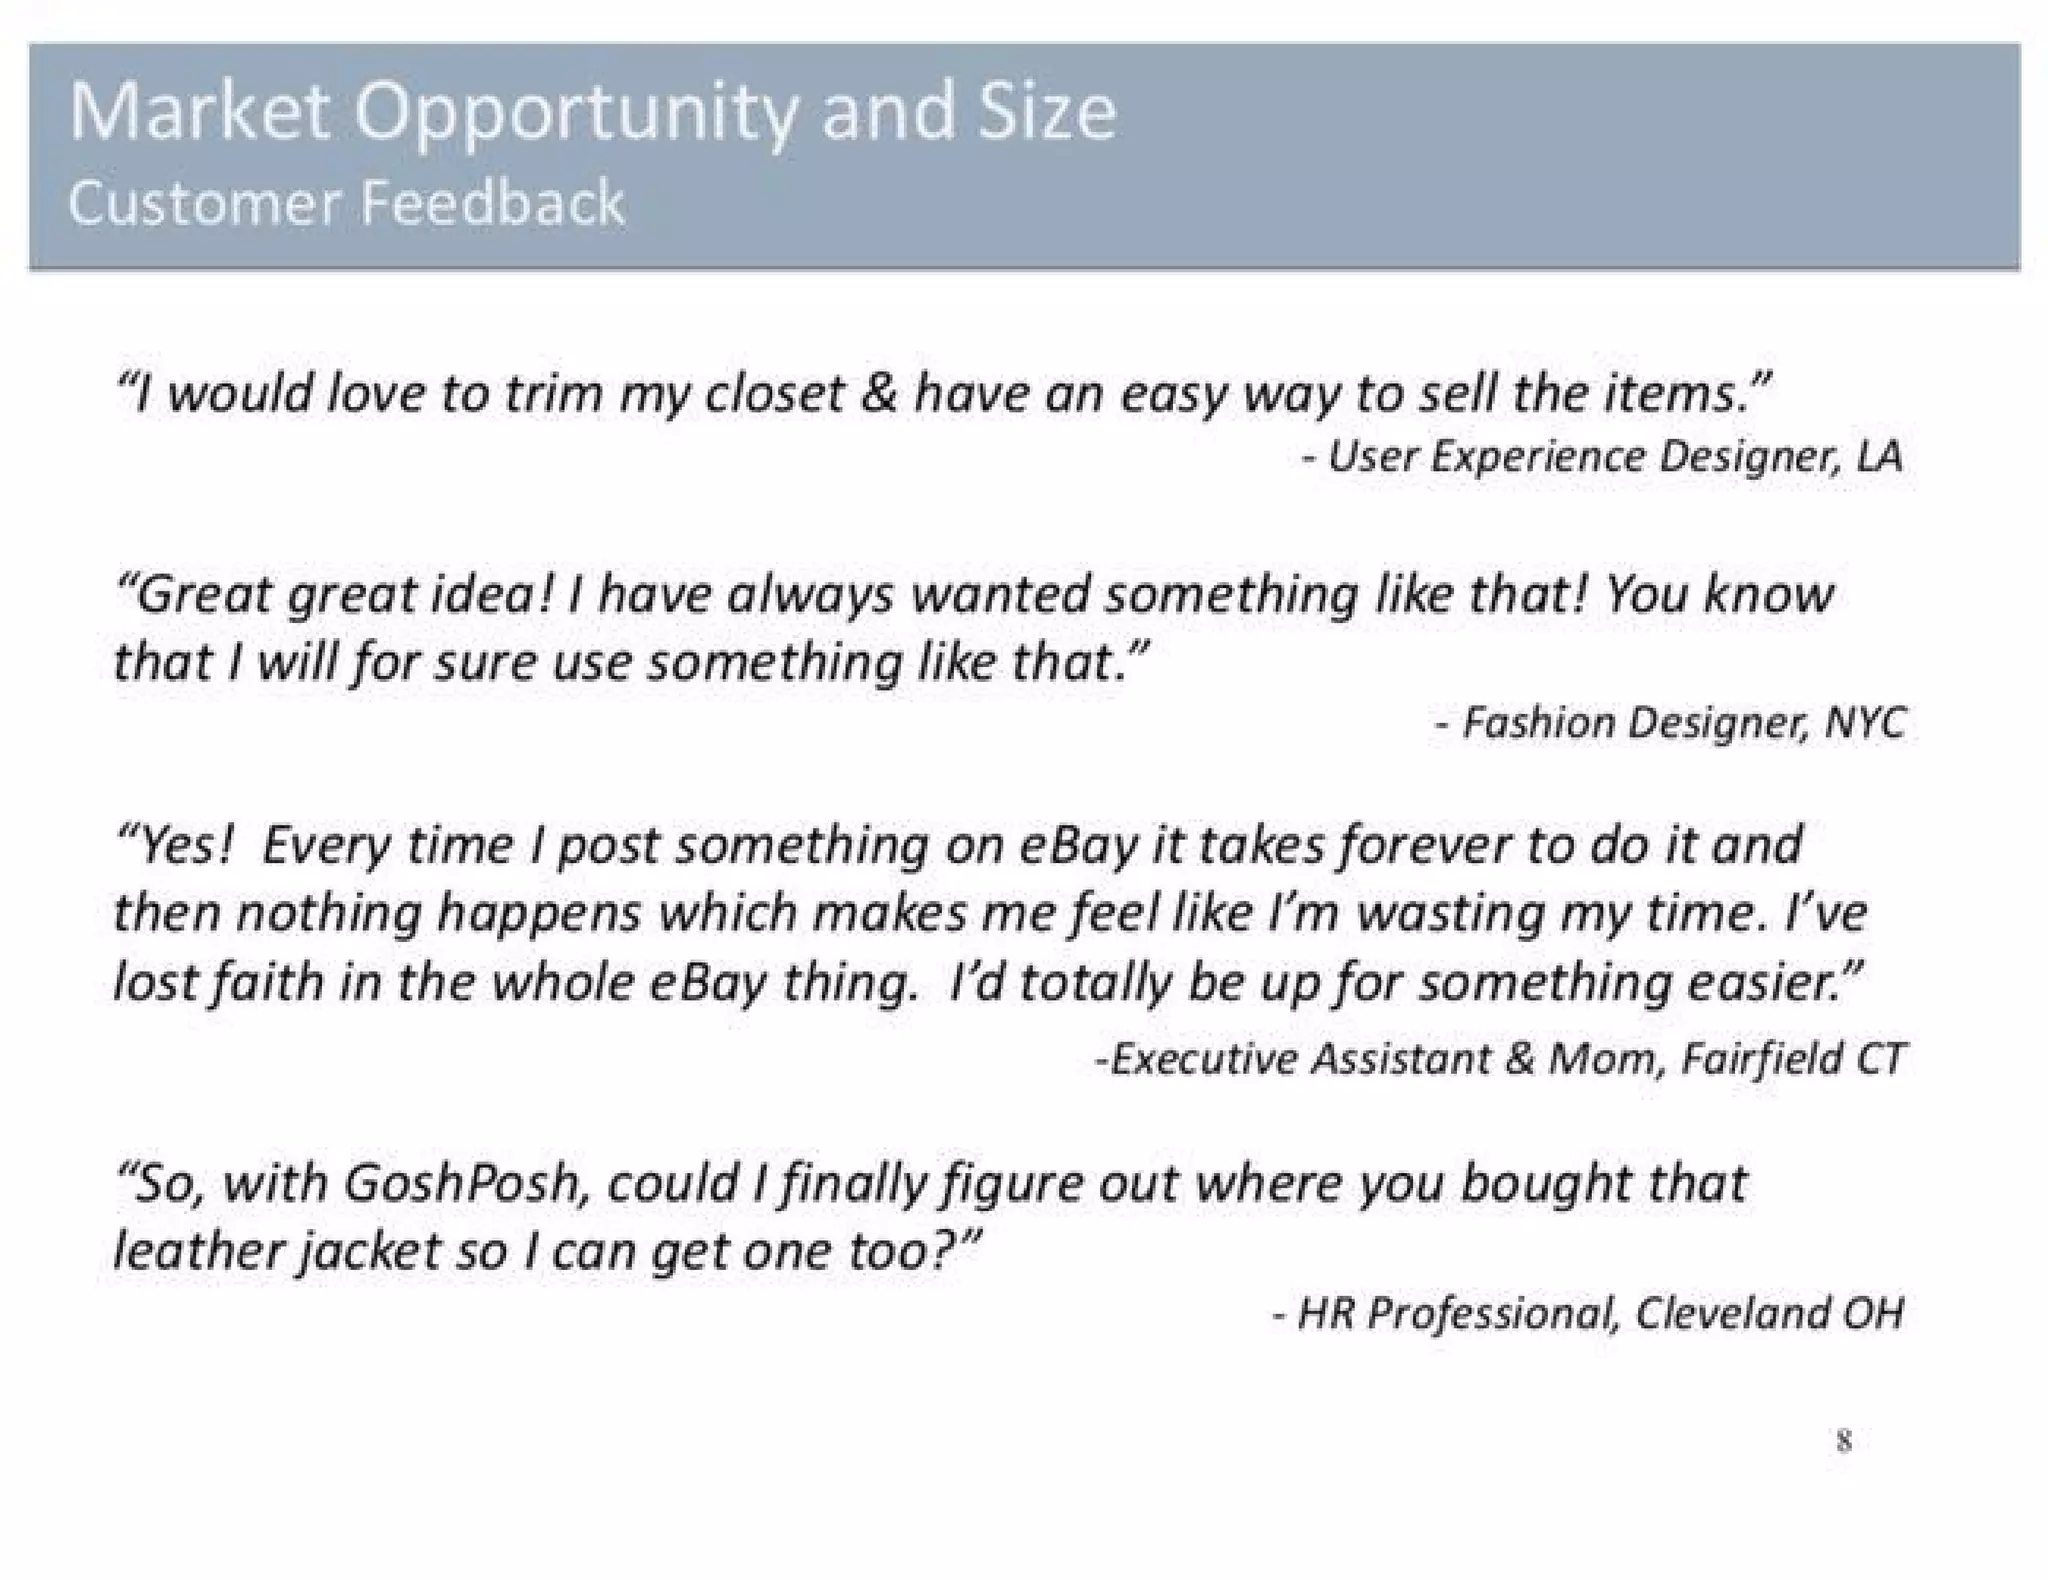
  • Customer feedback / qualitative validation: multiple user quotes enthusiastic about easier selling and discovery vs eBay friction (Slide 8).
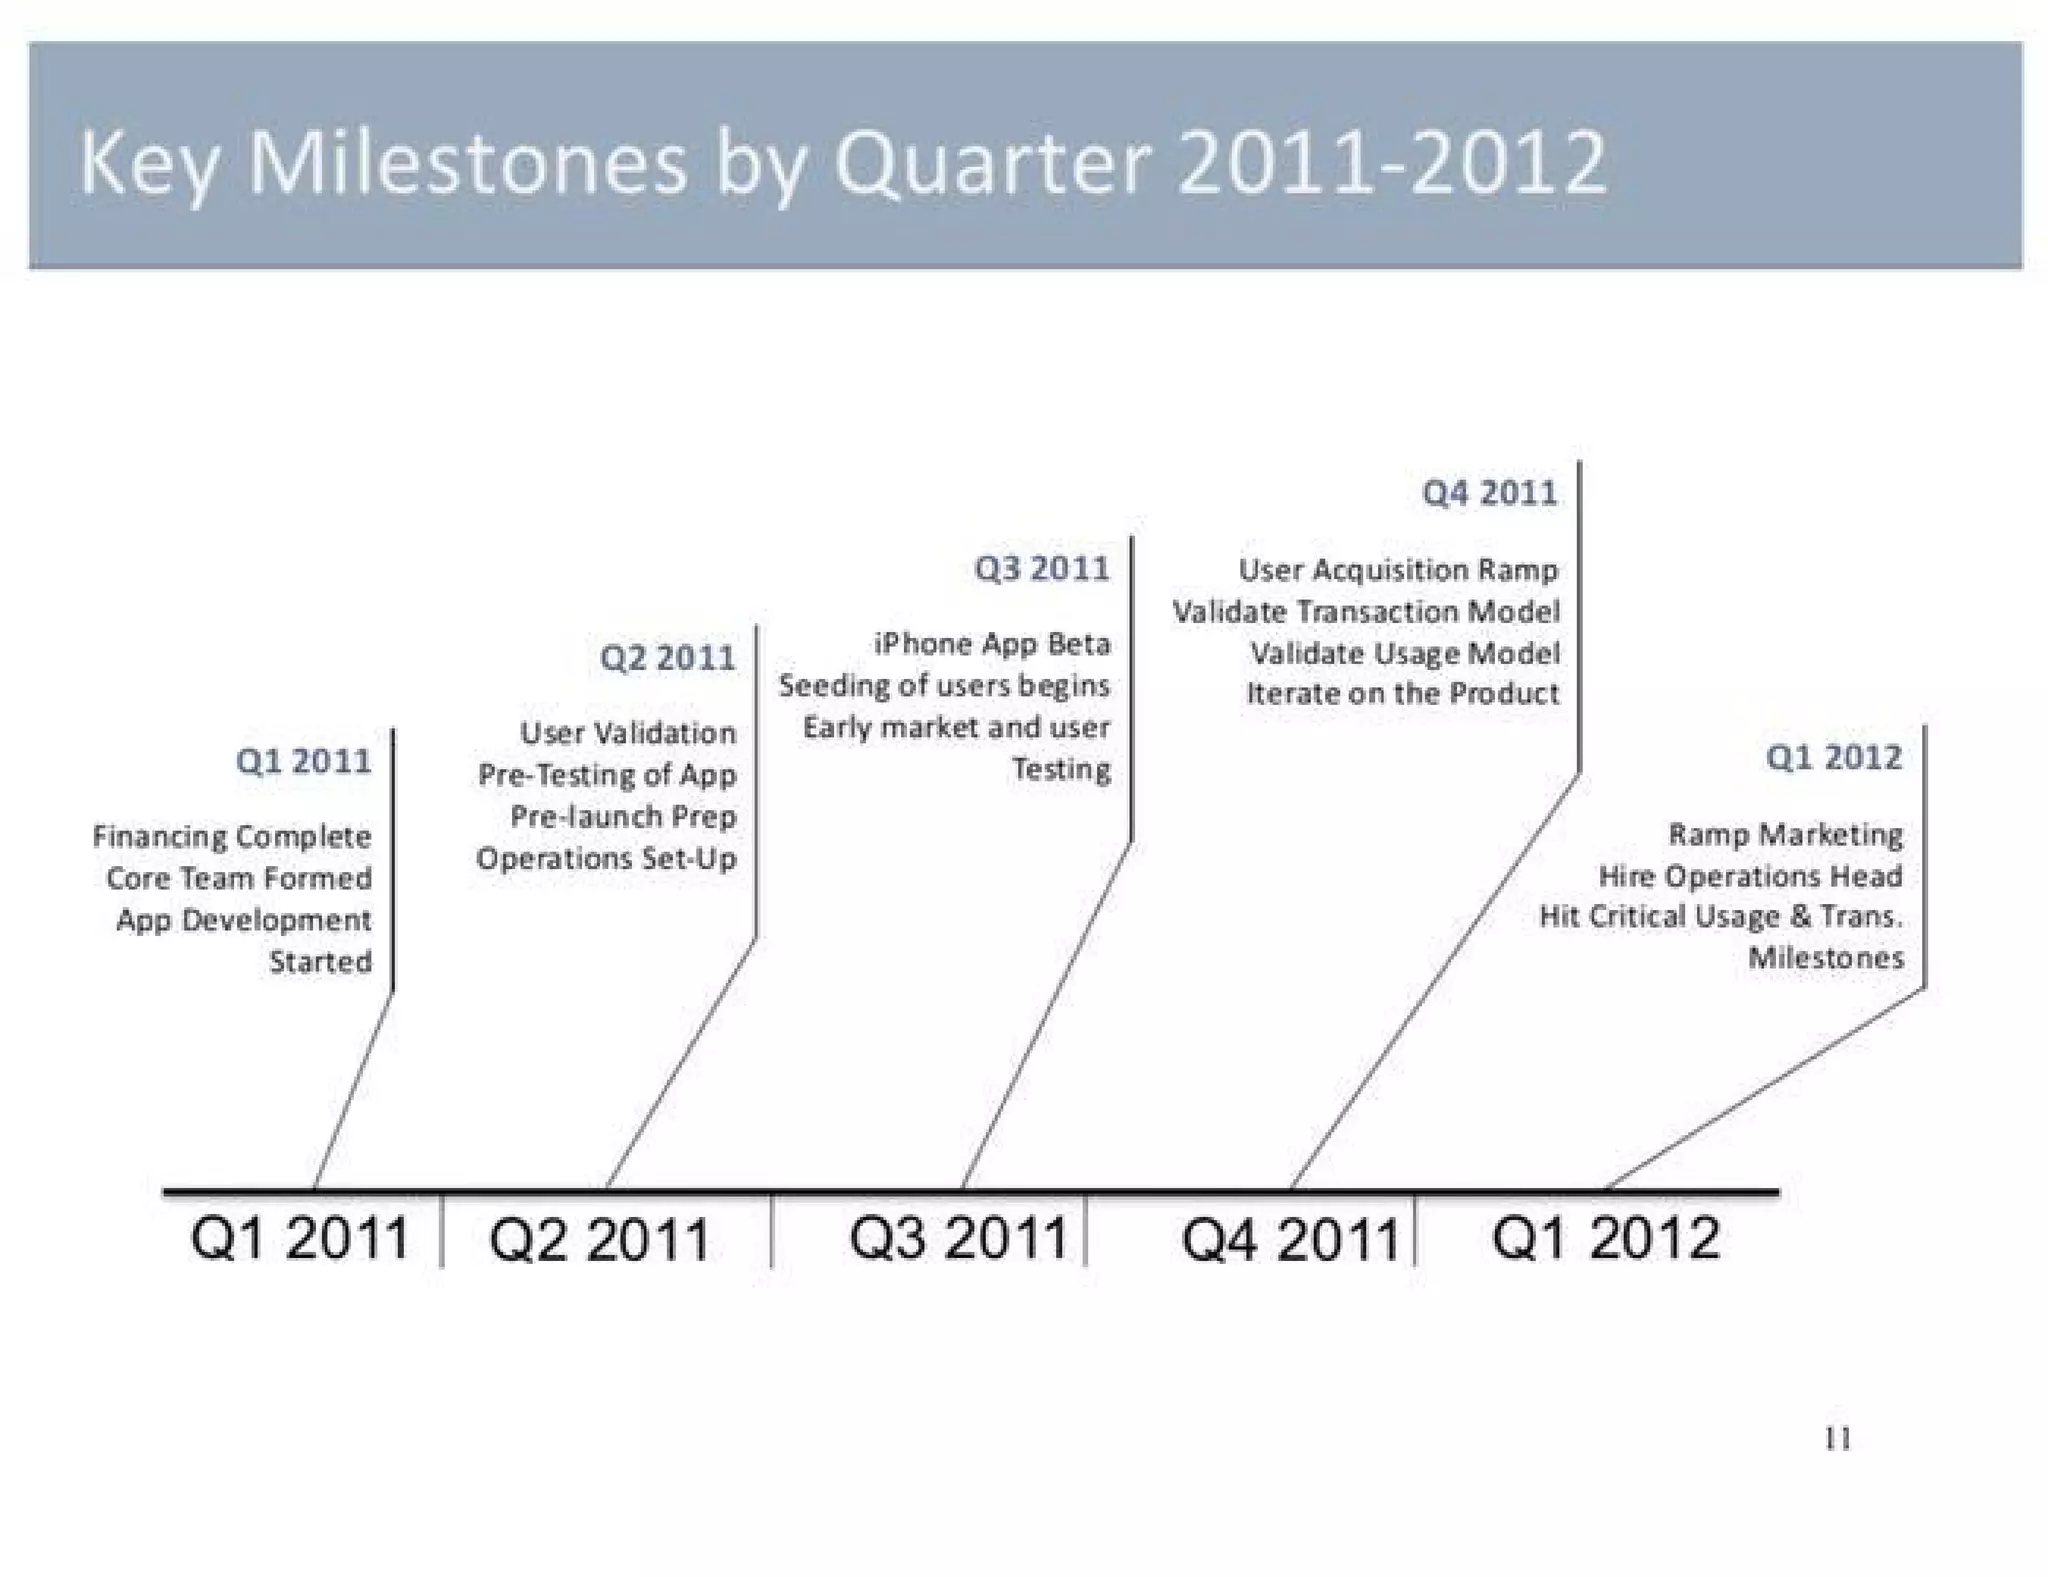
  • Product milestones & timeline: financing complete and core team formed (Q1 2011), iPhone app beta and seeding in Q3 2011, user acquisition ramp and transaction validation in Q4 2011 (Slide 11).
  • Projections (not realized traction at deck time): target of 2–3M transacting users to reach $1B GMV (Slide 15).

Actual product-specific traction (DAUs, signups, GMV to date) is not presented in the slides — traction is mostly market-level validation and qualitative user feedback.

Competitive Positioning

How they differentiate (from slides)

  • Mobile-first and photo-centric: simplified listing via phone + image processing to create attractive, engaging listings (Slide 3–5).
  • Social discovery versus search-driven marketplaces: discovery through people and social sharing (Slide 3, Slide 10).
  • End-to-end intermediary: plan to act as intermediary for transactions, returns and shipping to reduce seller friction (Slides 3, 12).
  • Competitive comparisons are illustrated by shipping/fulfillment level table (Slide 12) contrasting Poshmark’s intended services with incumbents (eBay, Craigslist, ThredUp, consignment models, StubHub).

What’s thin: named competitive landscape (marketplace+mobile plays) is lightly developed — incumbents are implied rather than rigorously compared on TAM/metrics.

Team

Team credentials (as stated in deck)

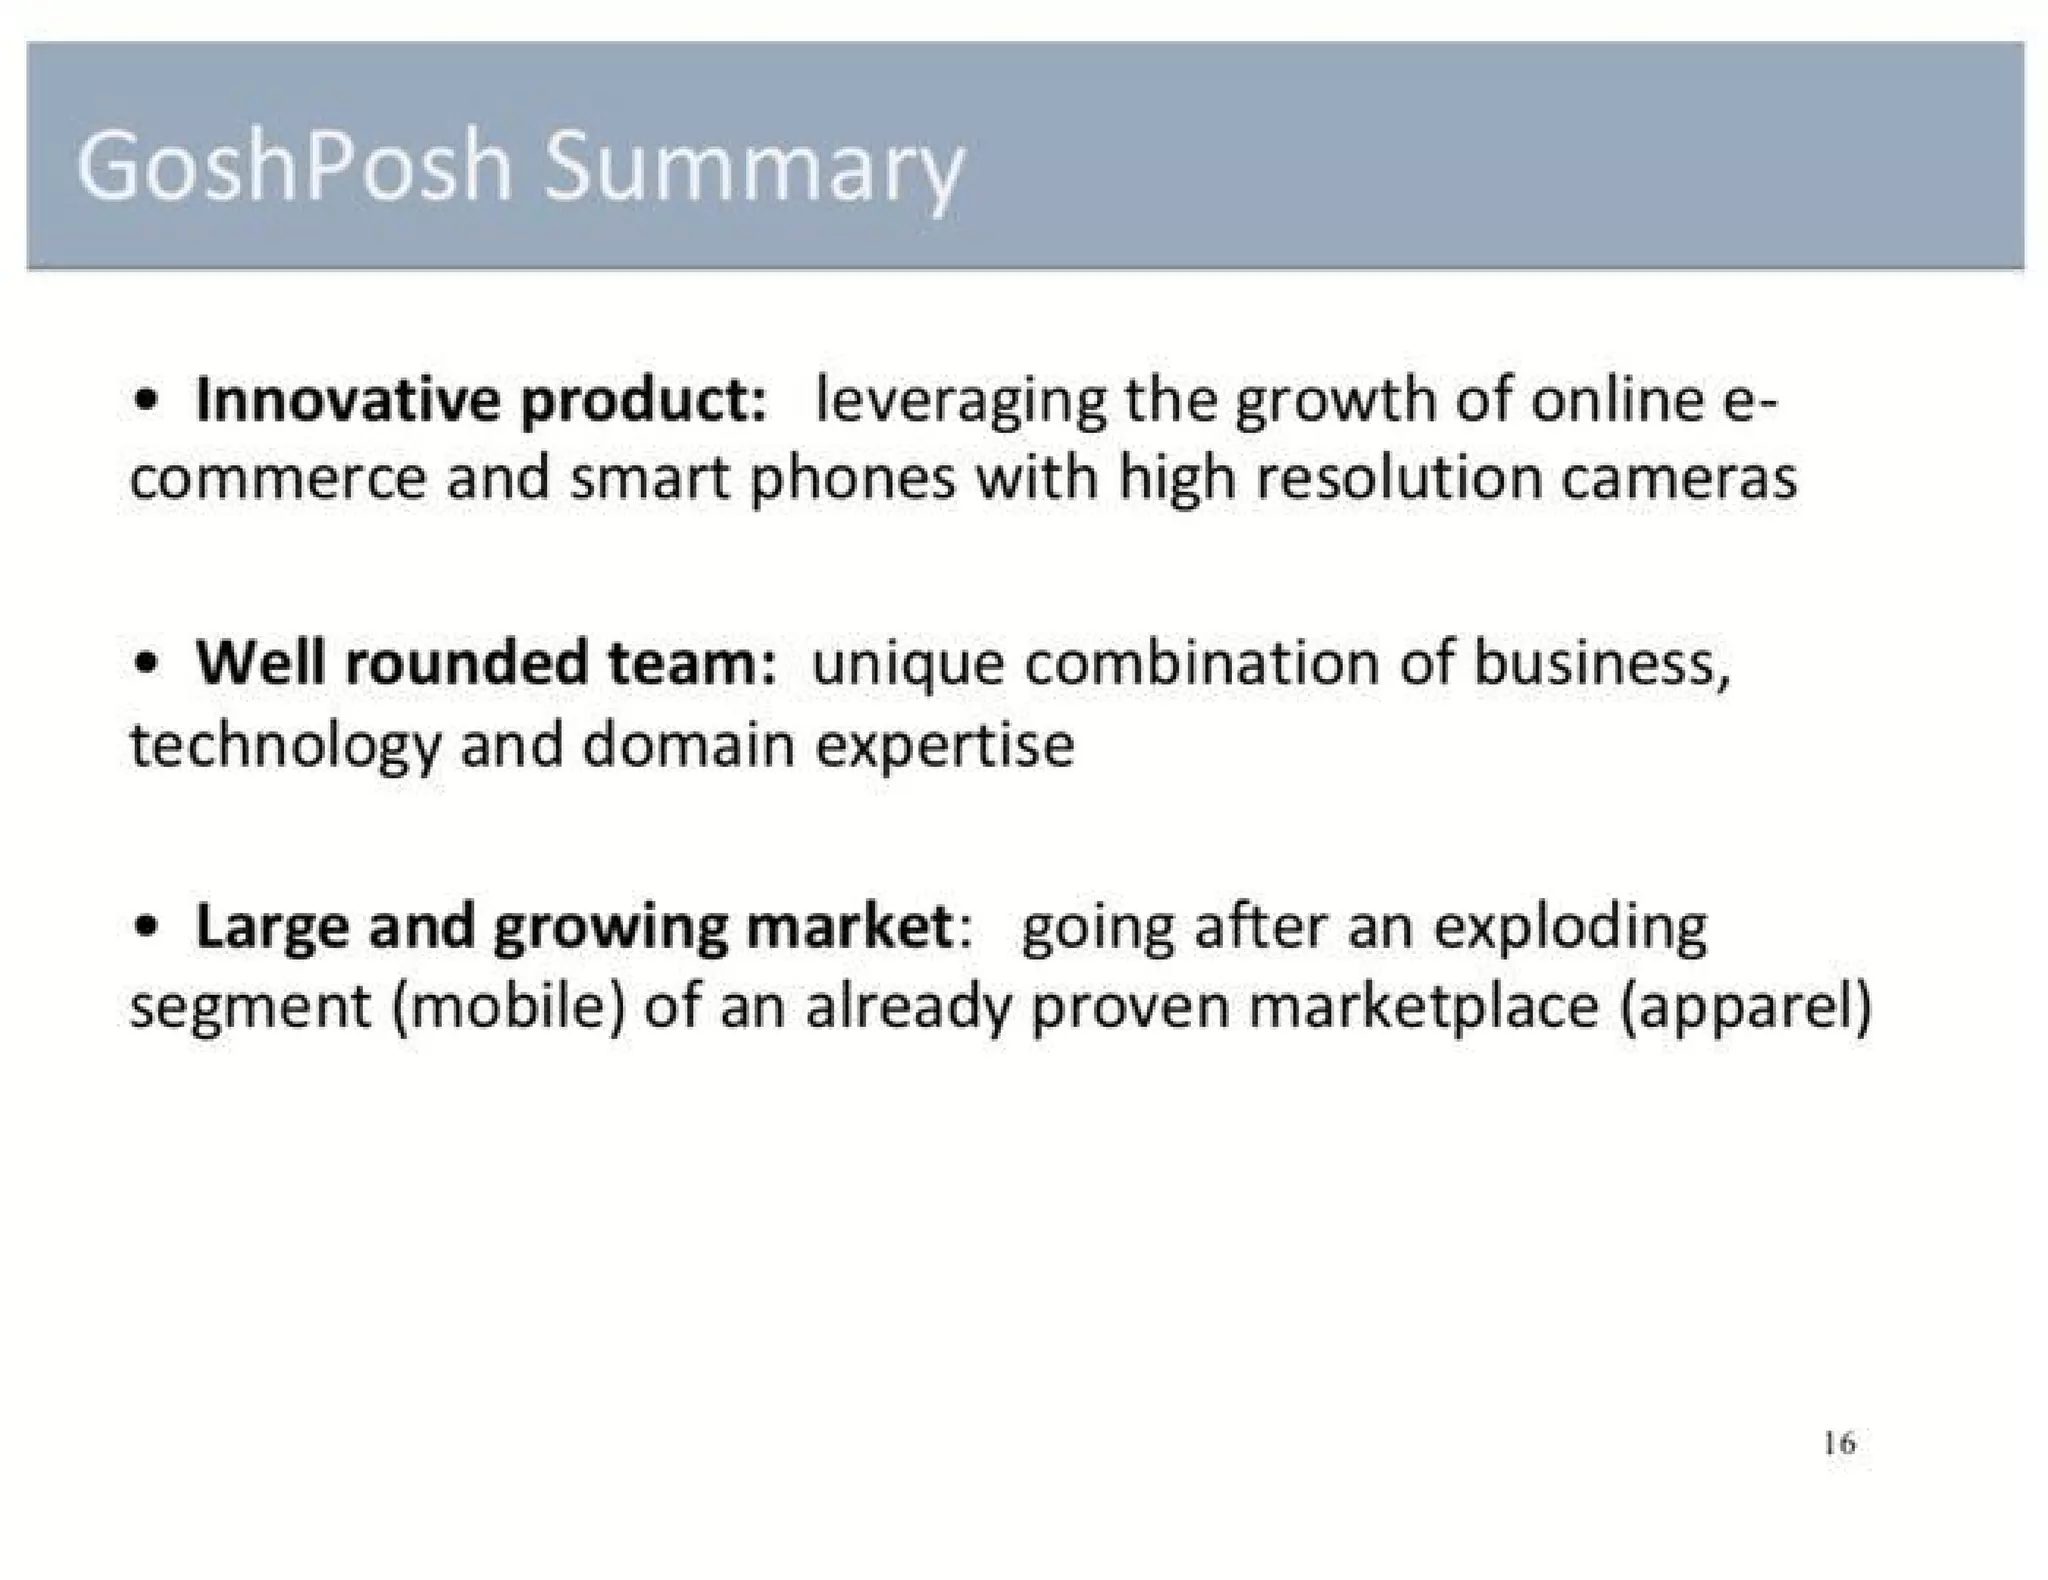
  • Slide 16 emphasizes a “well rounded team: unique combination of business, technology and domain expertise.”
  • Timeline references “core team formed” (Slide 11).

Note: the deck does not include detailed founder bios or operating team resumes in the slides shown. Investors would expect short bios and relevant exits/experience in a seed deck.

Go-to-Market Strategy

Distribution approach (slides)

  • Seeding strategy: target power sellers, independent boutiques and fashion bloggers to seed marketplace (Slide 9).
  • Viral/social distribution: engage users, create listings, and encourage sharing on Twitter and Facebook to recruit new users (Slide 10 — virtuous cycle).
  • Partner and organic/direct marketing mentioned in recruitment step (Slide 10).
  • Milestone plan to validate product with beta users (Q3) then ramp user acquisition in Q4 2011 (Slide 11).

The Ask

What they were raising and use of funds

  • Deck presented to Mayfield (title slide: “Overview for Mayfield Fund, Jan 2011”).
  • User-provided context: Seed round $3.5M (2011).
  • Milestones listed indicate use of funds: app development, user validation, operations setup, seeding users, and ramping user acquisition (Slide 11).

Investor Deep Dive

Executive summary, strengths & red flags

Executive Summary

The deck is a focused seed pitch for a mobile-first fashion marketplace that makes listing as easy as taking a photo and makes discovery social (people → products). It pairs a clear product demo/visual play (mobile images + image filters) with market data around apparel and resale to justify an addressable opportunity, a simple transaction-based business model, and a social distribution loop.

Key Strengths

3 identified

1

Clear product-market fit hypothesis grounded in a real user pain: listing friction + discovery mismatch (Slides 2–3). The deck ties a concrete UX friction to an actionable mobile-first solution.

2

Strong visual/UX play: converting phone photos into “magazine-quality” listings and emphasizing discovery through people differentiates Poshmark as a visually led marketplace (Slides 4–5).

3

Simple, defensible monetization and scaling model: transaction fee + fixed shipping fee with a path to additional shipping/fulfillment revenue (Slides 12–13) and ambitious but concrete user/GMV scaling targets (Slide 15).

Red Flags & Weaknesses

3 identified

1

Lack of hard early traction metrics: the deck relies on market-level stats and quotes rather than showing actual early user/GMV/retention metrics or A/B test results (Slides 7–8, 15). Investors at seed often want initial KPIs (e.g., listings/day, conversion, retention).

2

Sparse team detail: the deck claims a “well rounded team” but does not include bios, prior exits or domain credentials within the slides provided (Slide 16). This makes it harder to evaluate execution risk.

3

Incomplete unit economics: no CAC, LTV, margin after promised shipping/returns or sensitivity of the 20% fee against $9.95 shipping commitment (Slides 12–13). Shipping/returns can quickly erode gross margins and there are operational complexities in scaling fulfillment.

More Pitch Decks To Study

Compare structure, fundraising context, and investor-facing story across similar startup decks.