Compare your deck to Square

Compare Your Deck

Square Pitch Deck (2010)

Fintech
Stage: Various
Raised: Multiple rounds
Year: 2010
Slides: 20
Outcome: IPO, now Block at $40B+

Pitch Deck

1 / 20
Square pitch deck slide 1
Click to expand

Deck Analysis

This deck is an early-stage investor presentation for Square (2010-era), a fintech startup that turned a simple headphone-jack card reader and intuitive app into a mass-market payments platform. It combines a crisp product demo, market-sizing, founding team credibility, go-to-market strategy and financial projections to make a VC-investable case. The deck is notable because it balances storytelling (simple value prop and vision) with the quantitative elements investors expect (market growth, unit economics, and exit pathways), which helped Square raise follow-on capital and eventually IPO.

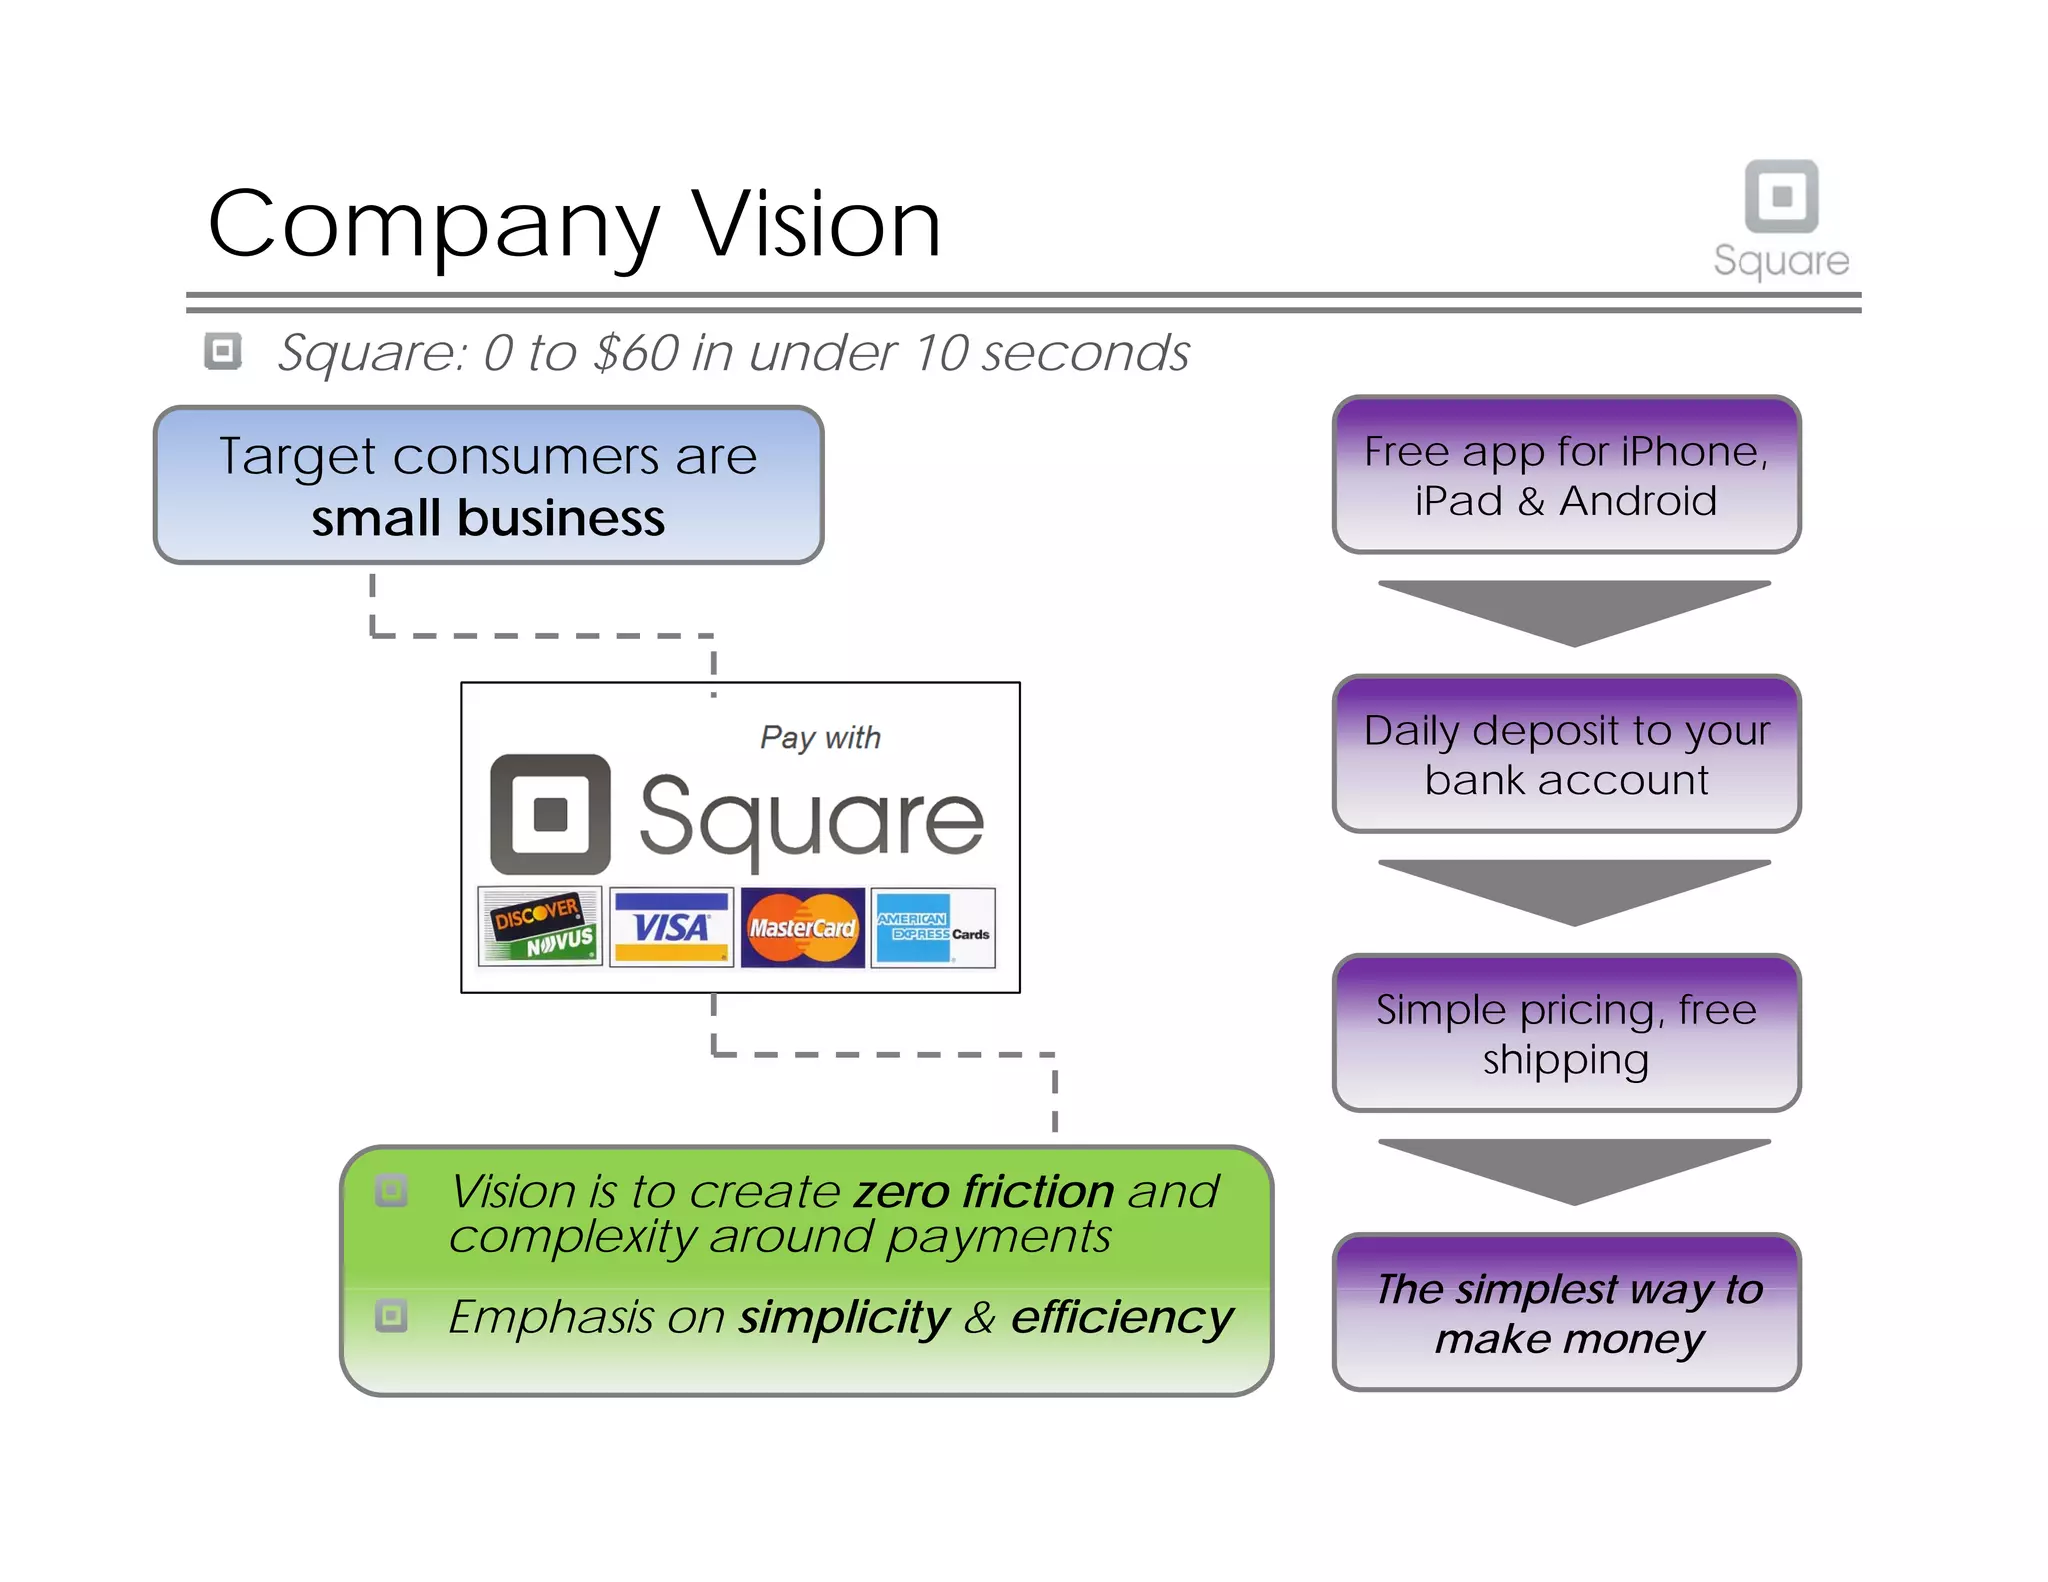
The Proposition: Clear, simple value (slide: product & pricing)

The Proposition: Clear, simple value (slide: product & pricing)

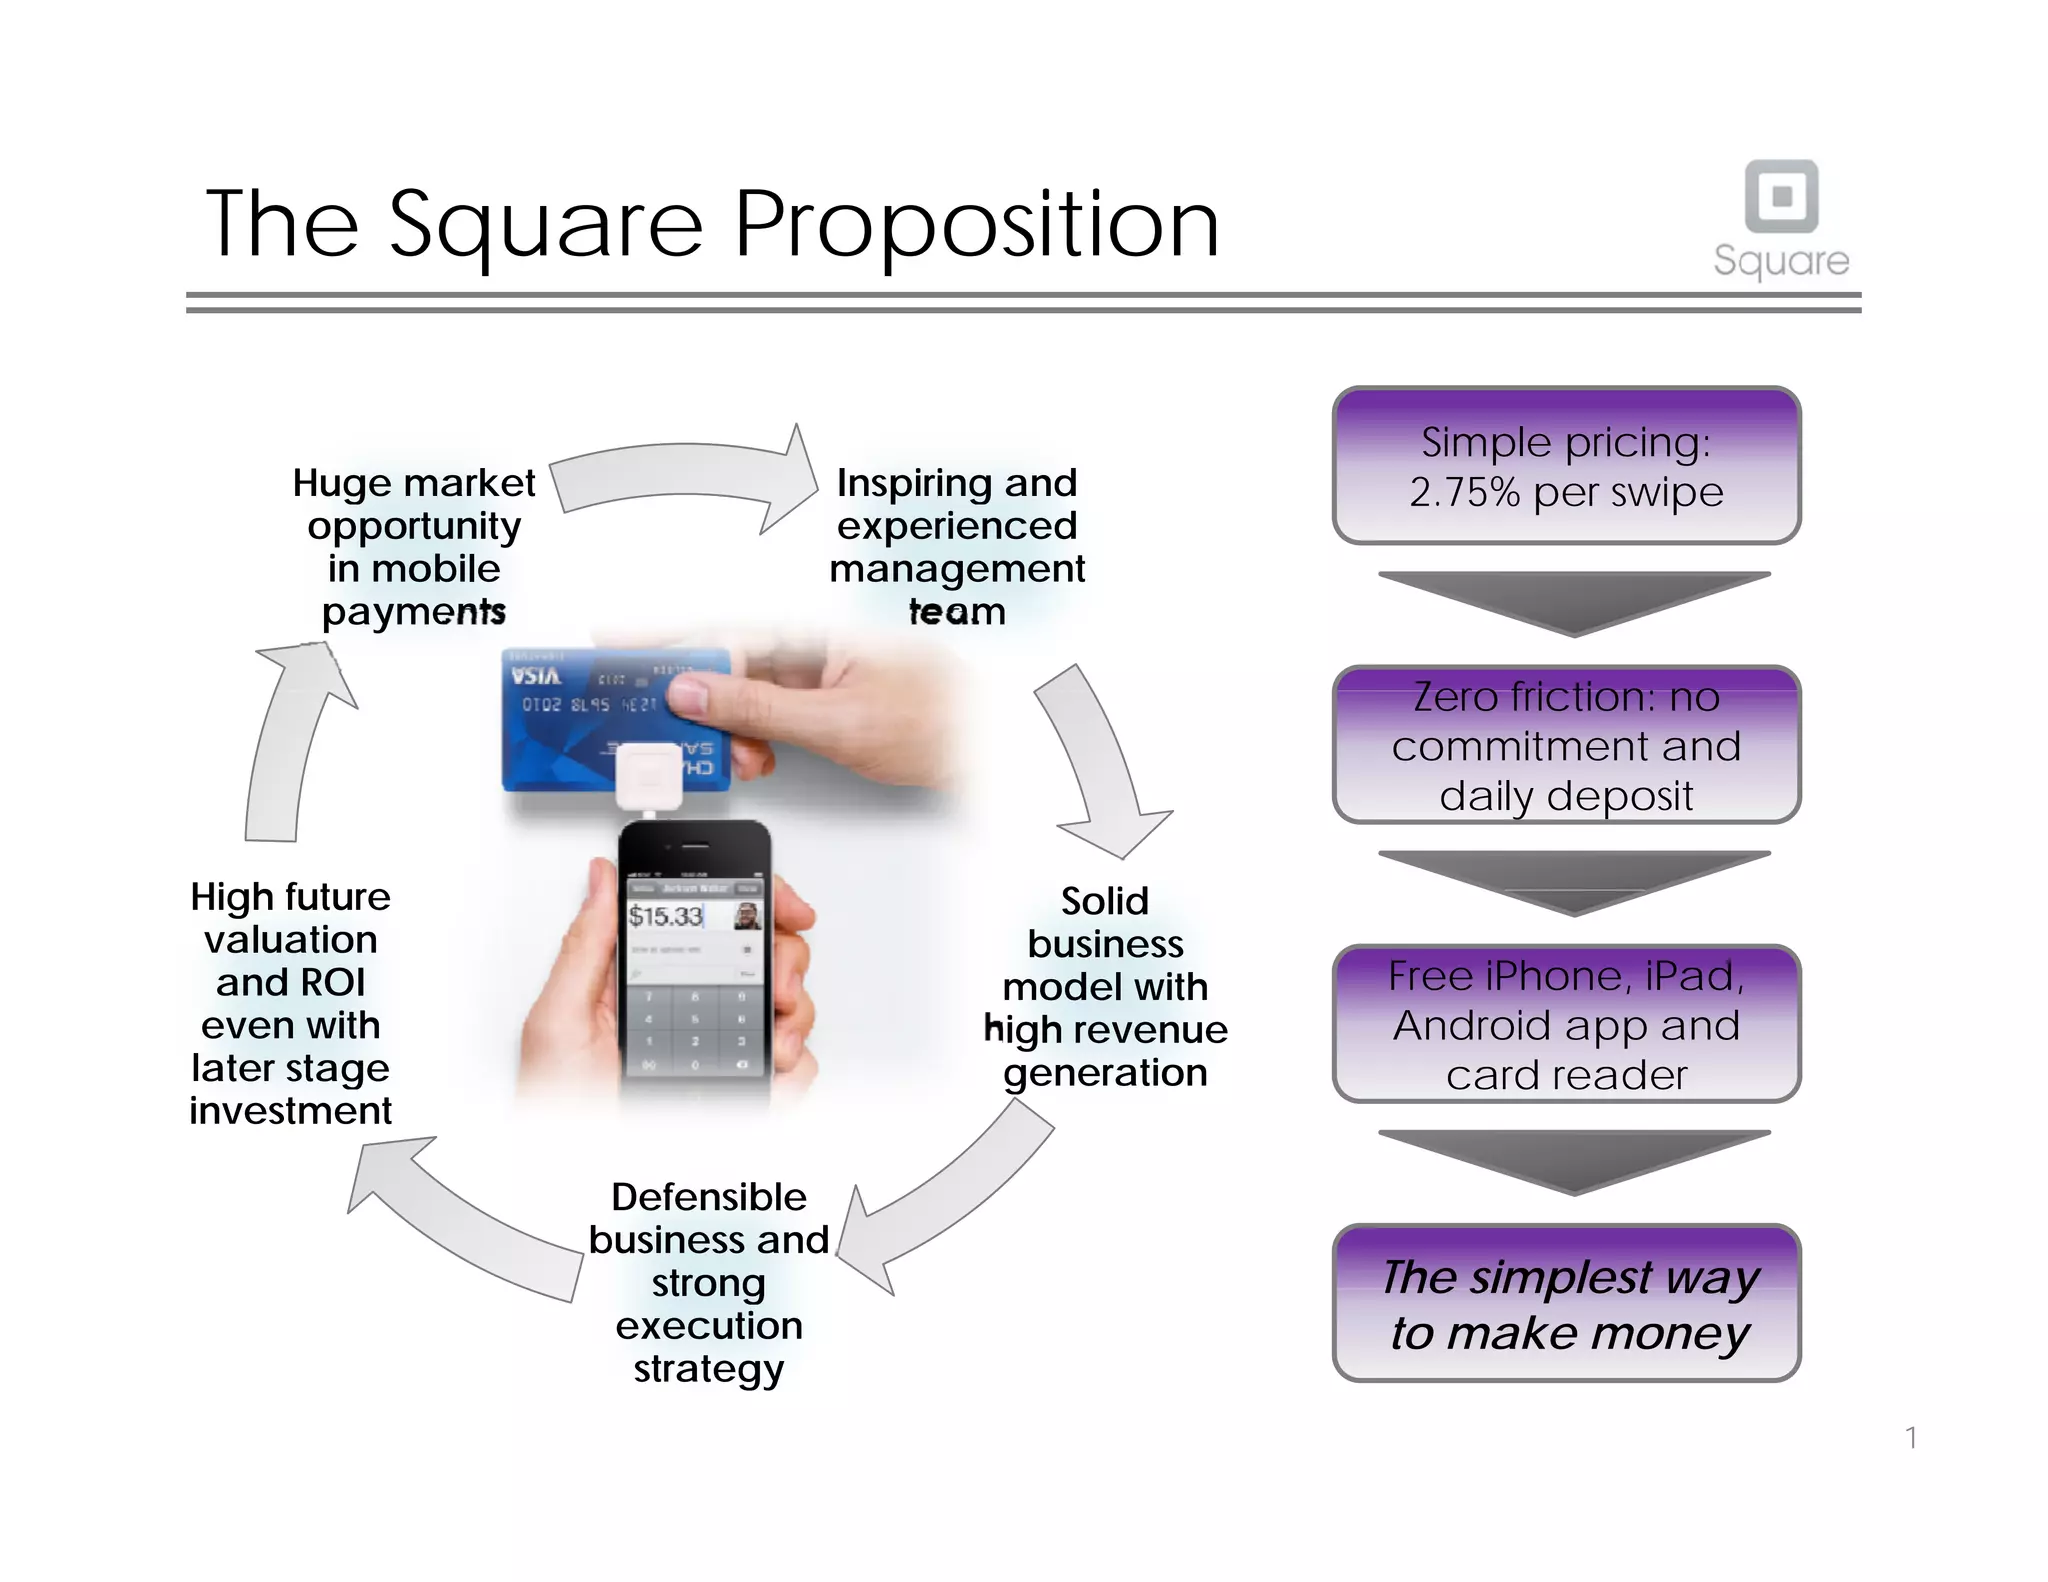
Slide analyzed: The Square Proposition (SLIDE 2) uses a visual center (card reader + phone) surrounded by a concise value-cycle and a right-hand column that reduces the offering to three simple bullets: simple pricing (2.75%), zero friction (no commitments/daily deposits), and free hardware. This layout makes the product both tangible (you can picture the card reader) and immediately attractive to merchants (transparent fees + free device). The circular arrows around the image imply defensibility and compounding value (team → business model → valuation), which frames the product as both practical and investable.

What founders can learn: start with one clean, visual value proposition and lead with the simplest commercial terms your customers care about. The slide is effective because it answers “what is it?”, “how does it make money?”, and “why is it defensible?” in one glance. Use an actual product image, boil pricing and friction down to a few words, and show a concise path from product to return so investors can quickly connect product-market fit to monetization.
Key Takeaway: Lead with a single, visually obvious value prop and highlight the simple customer-facing economics (price, friction, and hardware) to make the business instantly understandable.
Team: high-signal founding roster and social proof

Team: high-signal founding roster and social proof

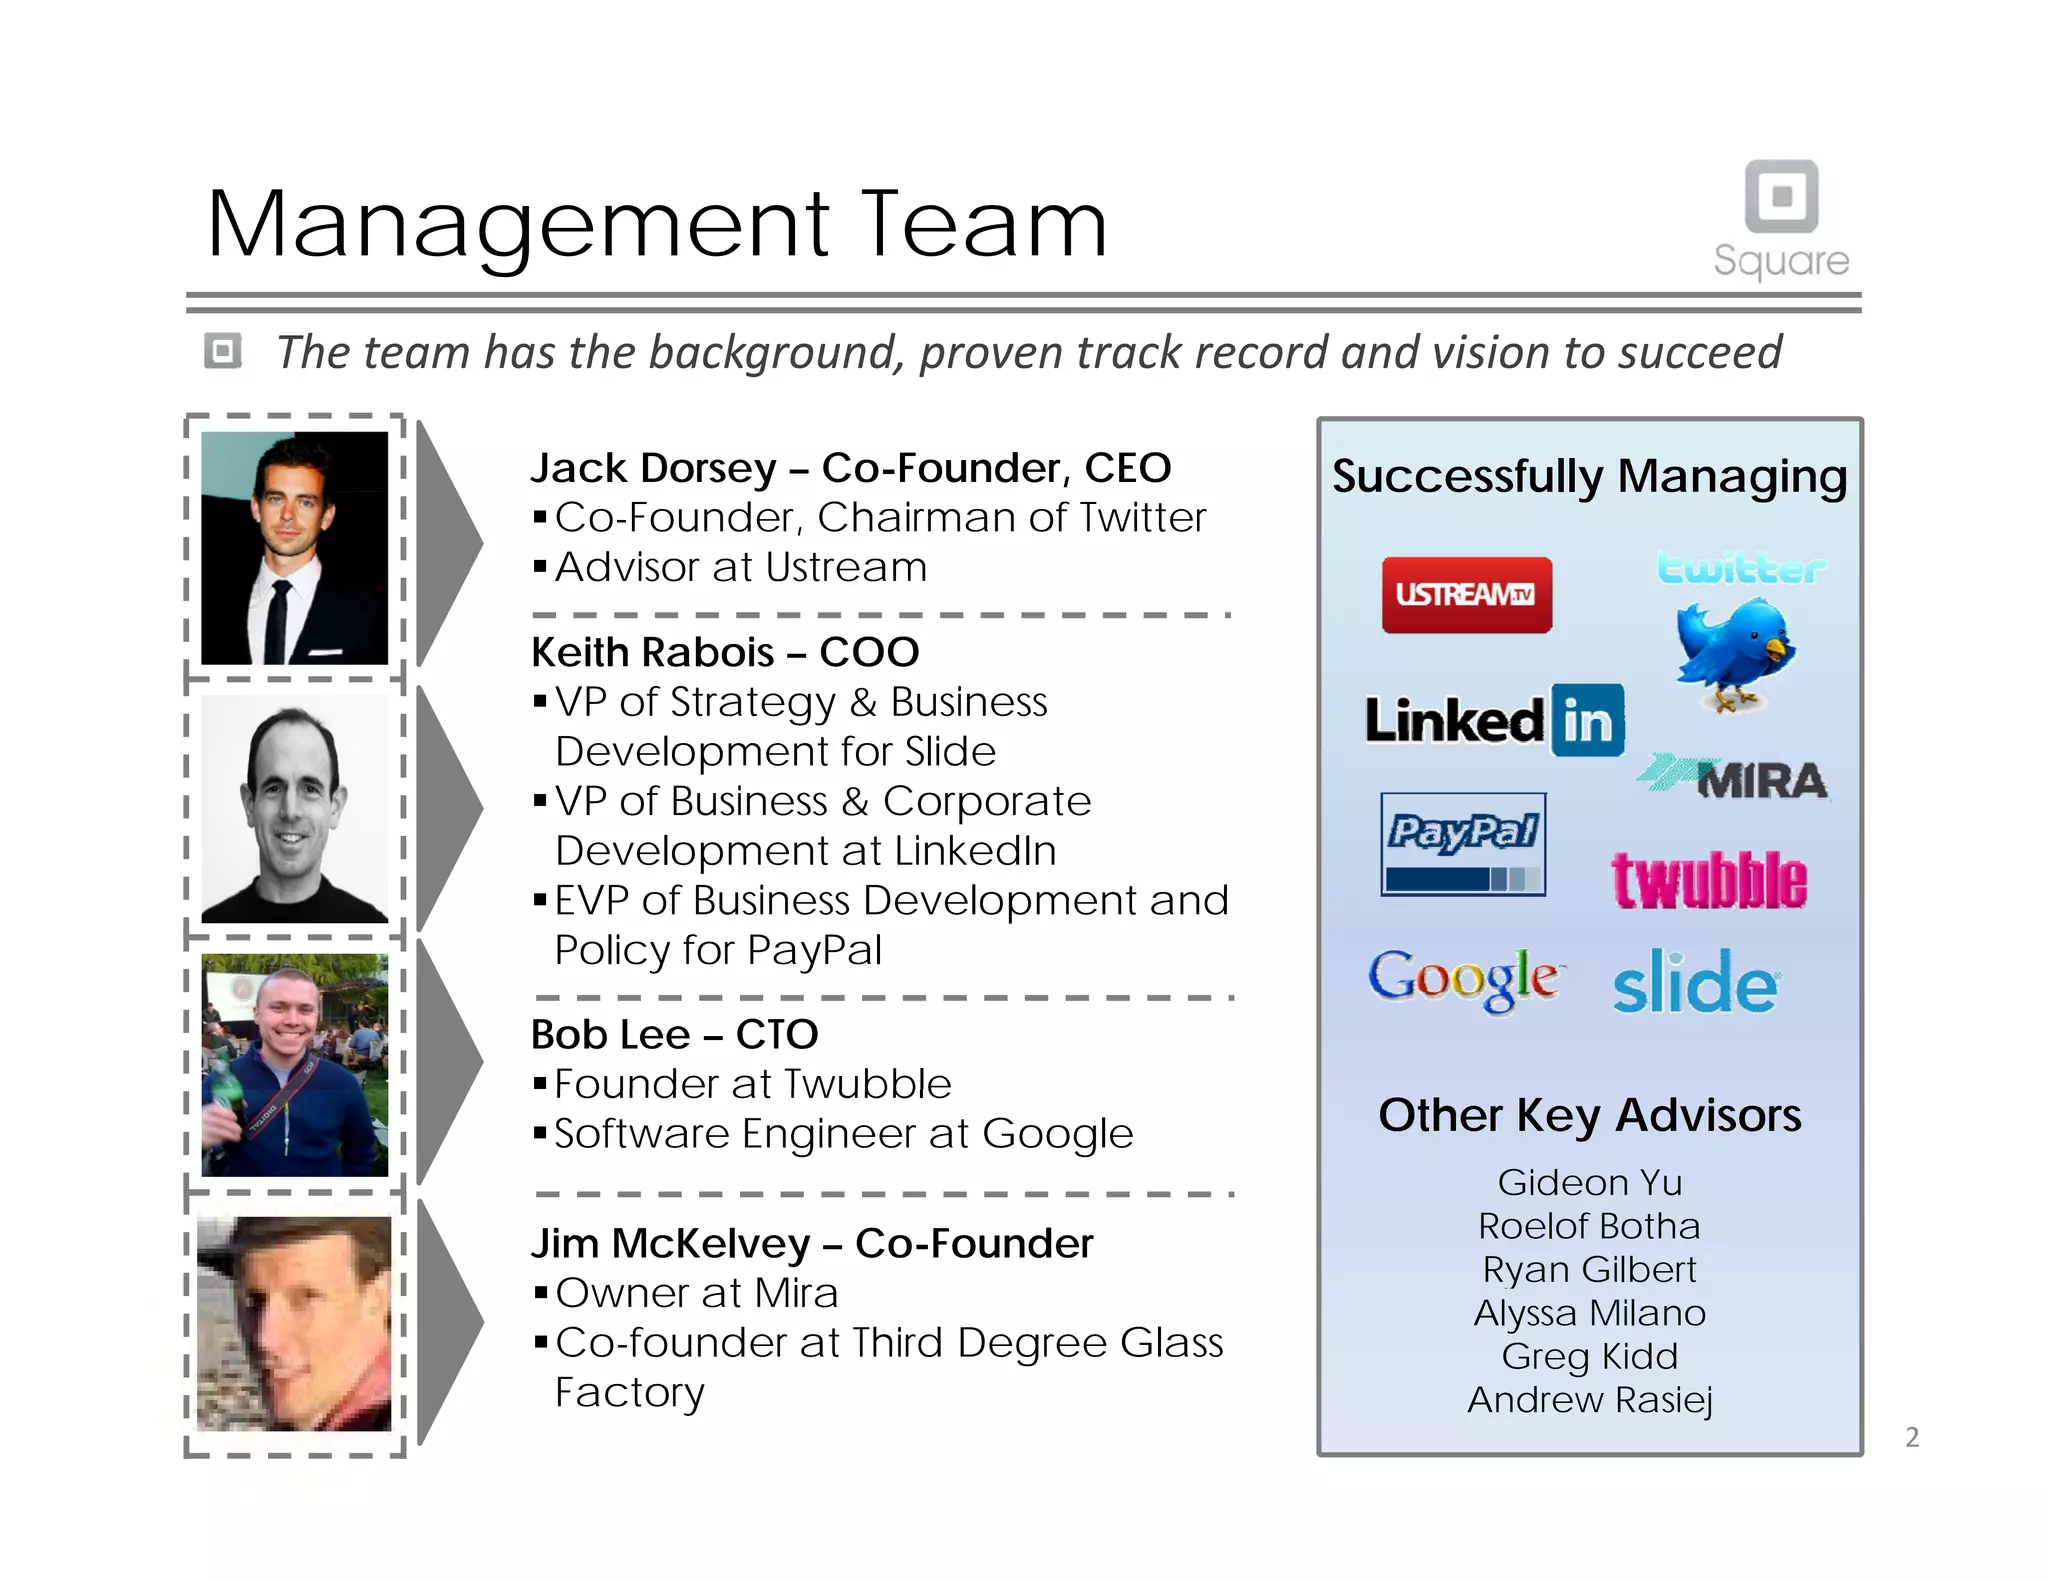
Slide analyzed: The Management Team slide (SLIDE 3) foregrounds well-known, credible founders (Jack Dorsey, Keith Rabois, Bob Lee, Jim McKelvey) with photos, short bios, and recognizable logos of companies they’ve been associated with. On the right it groups logos of companies the team has successfully managed at, which acts as quick social proof and reduces perceived execution risk. This slide trades density for clarity: short bullets for each founder plus visual endorsements (logos) that resonate with investors.

What founders can learn: when you have high-signal team members, make the slide about credibility and execution capacity—use photos, one-line relevant experience, and familiar brand logos to convey network and track record. If your team is less famous, prioritize specific, measurable accomplishments (revenue built, customers acquired, product launches) that show execution capability in the same compact format.

Key Takeaway: Use photos, one-line bios and credible partner logos to turn team resumes into a rapid trust-builder for investors.
Market: large, fast-growing TAM with simple slices

Market: large, fast-growing TAM with simple slices

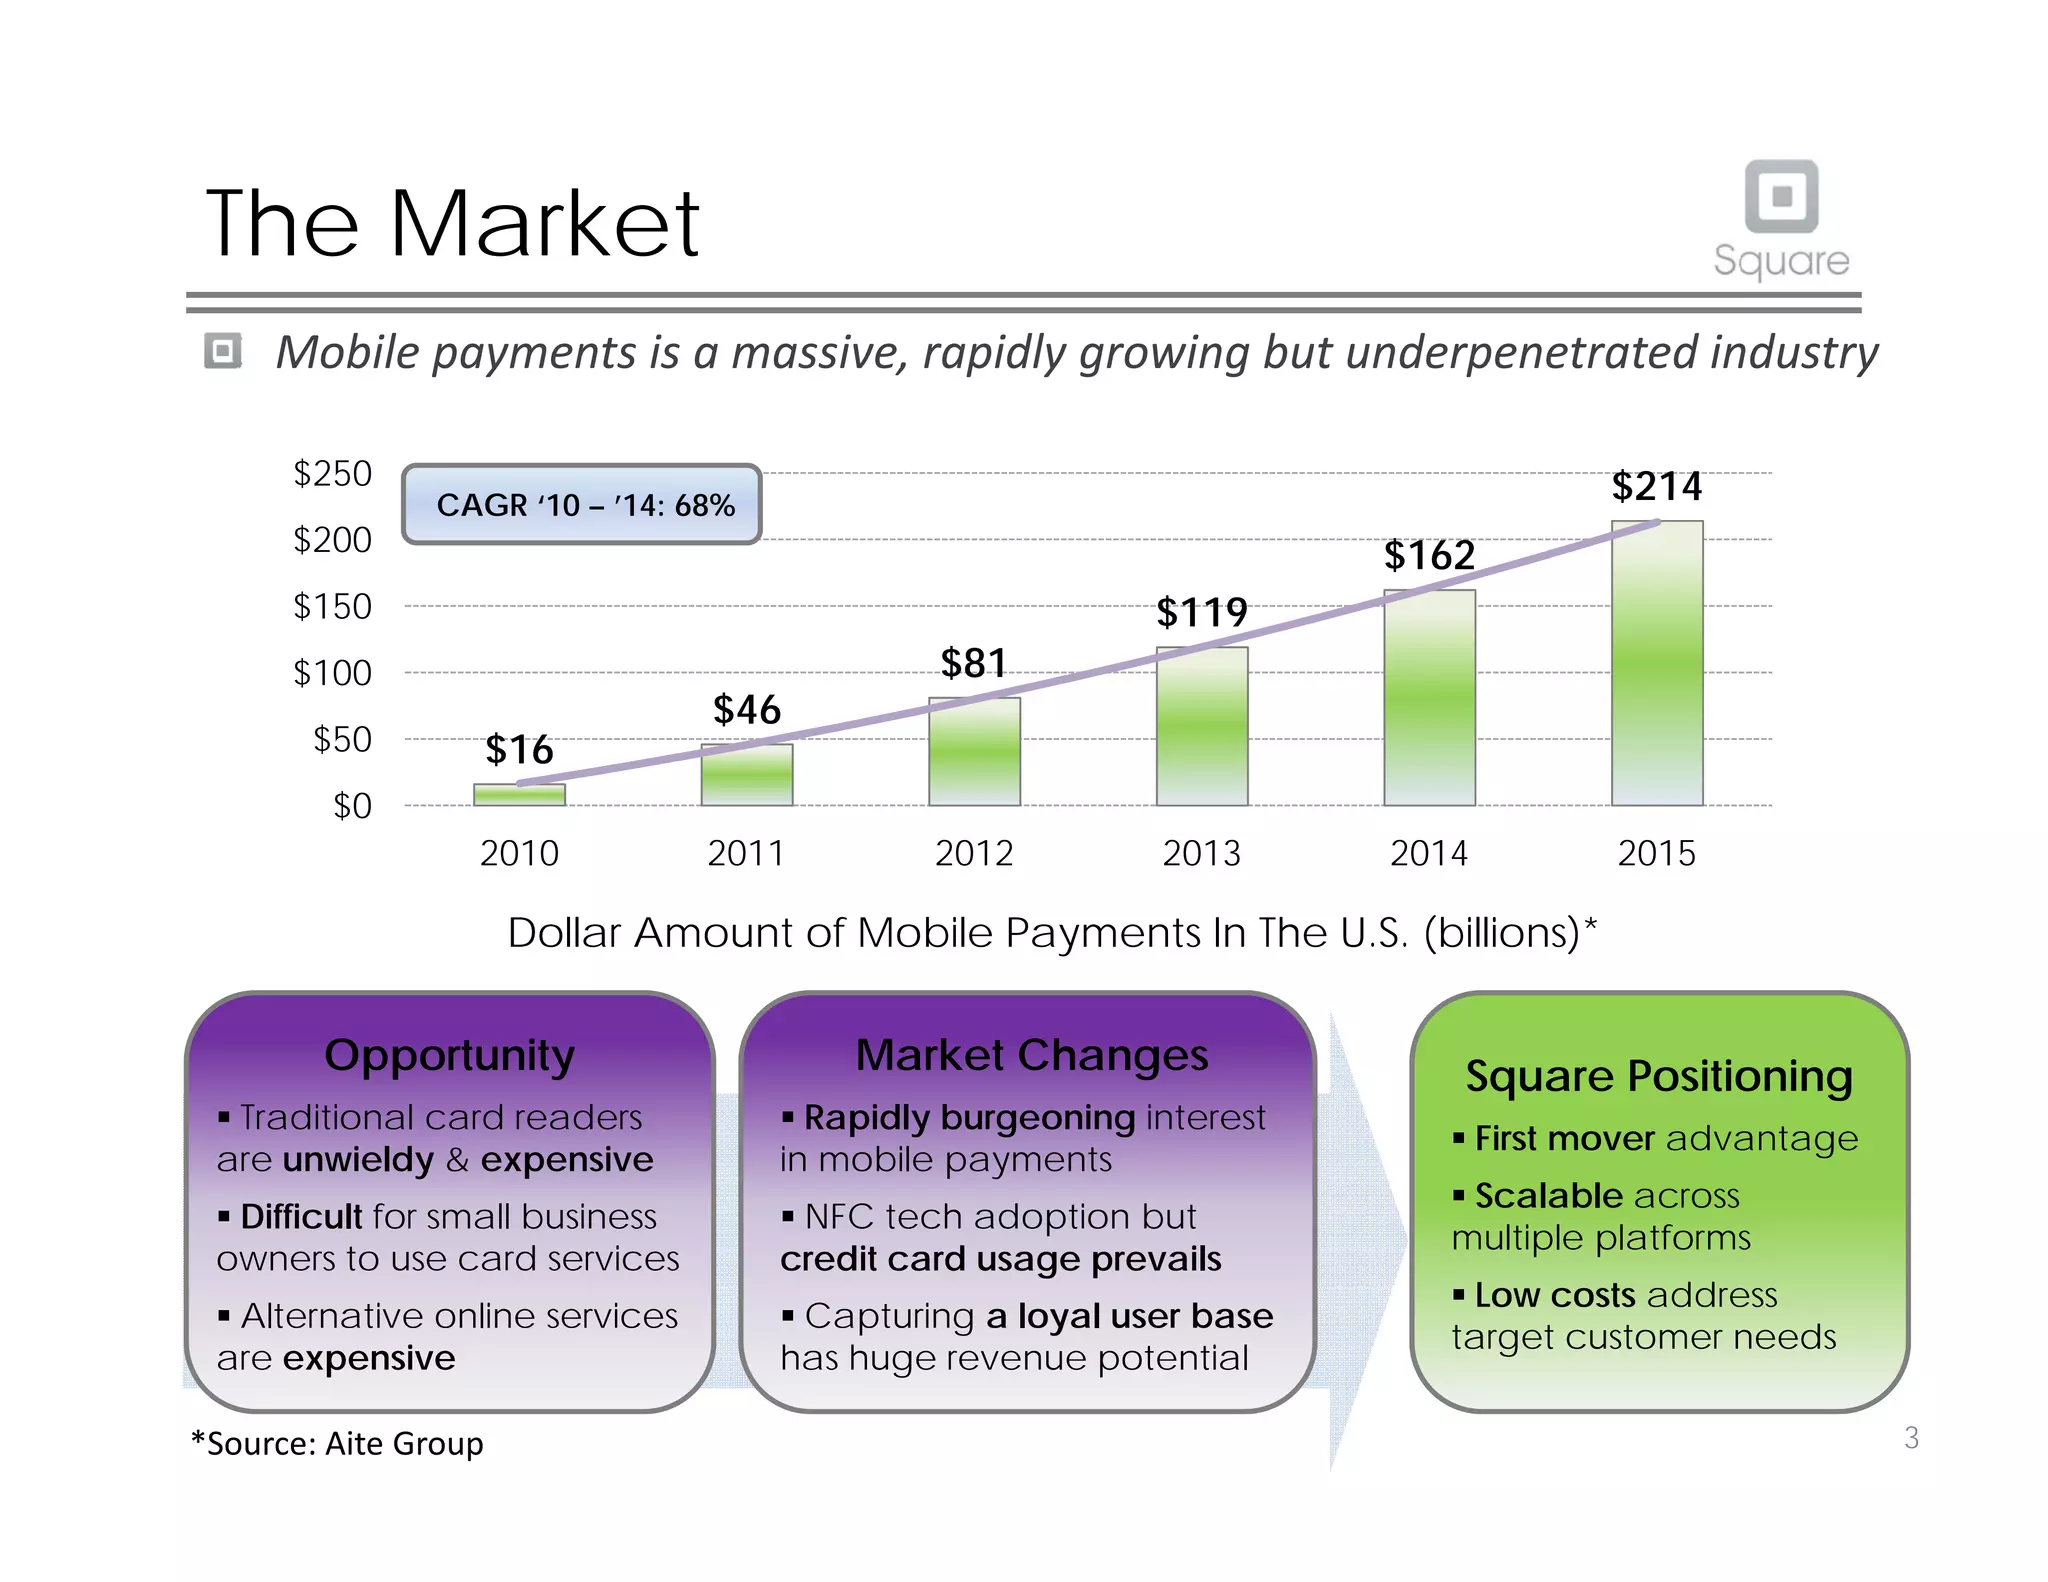
Slide analyzed: The Market slide (SLIDE 4) pairs a clear bar/line chart of rapid growth in US mobile payments (2010–2015) with three boxes that spell opportunity, market changes and positioning. The chart quantifies the addressable market (from $16B to $214B by 2015) and cites a CAGR figure, while the boxes translate that growth into actionable reasons Square can win: traditional readers are unwieldy/expensive, NFC adoption lags, and capturing loyal users creates recurring revenue. This combination ties macro opportunity to product-specific advantages.

What founders can learn: investors want both macro context and direct reasons your product is positioned to capture that market—show a credible growth chart and pair it with 2–3 focused bullets that map market dynamics (pain points, tech adoption gaps, customer economics) to your positioning. Cite sources for market numbers and keep the narrative focused on how market forces amplify your go-to-market.

Key Takeaway: Frame TAM with credible numbers and immediately map market trends to specific product advantages; show why the timing favors you.
Product & Technology: demo-first with concise tech assurances

Product & Technology: demo-first with concise tech assurances

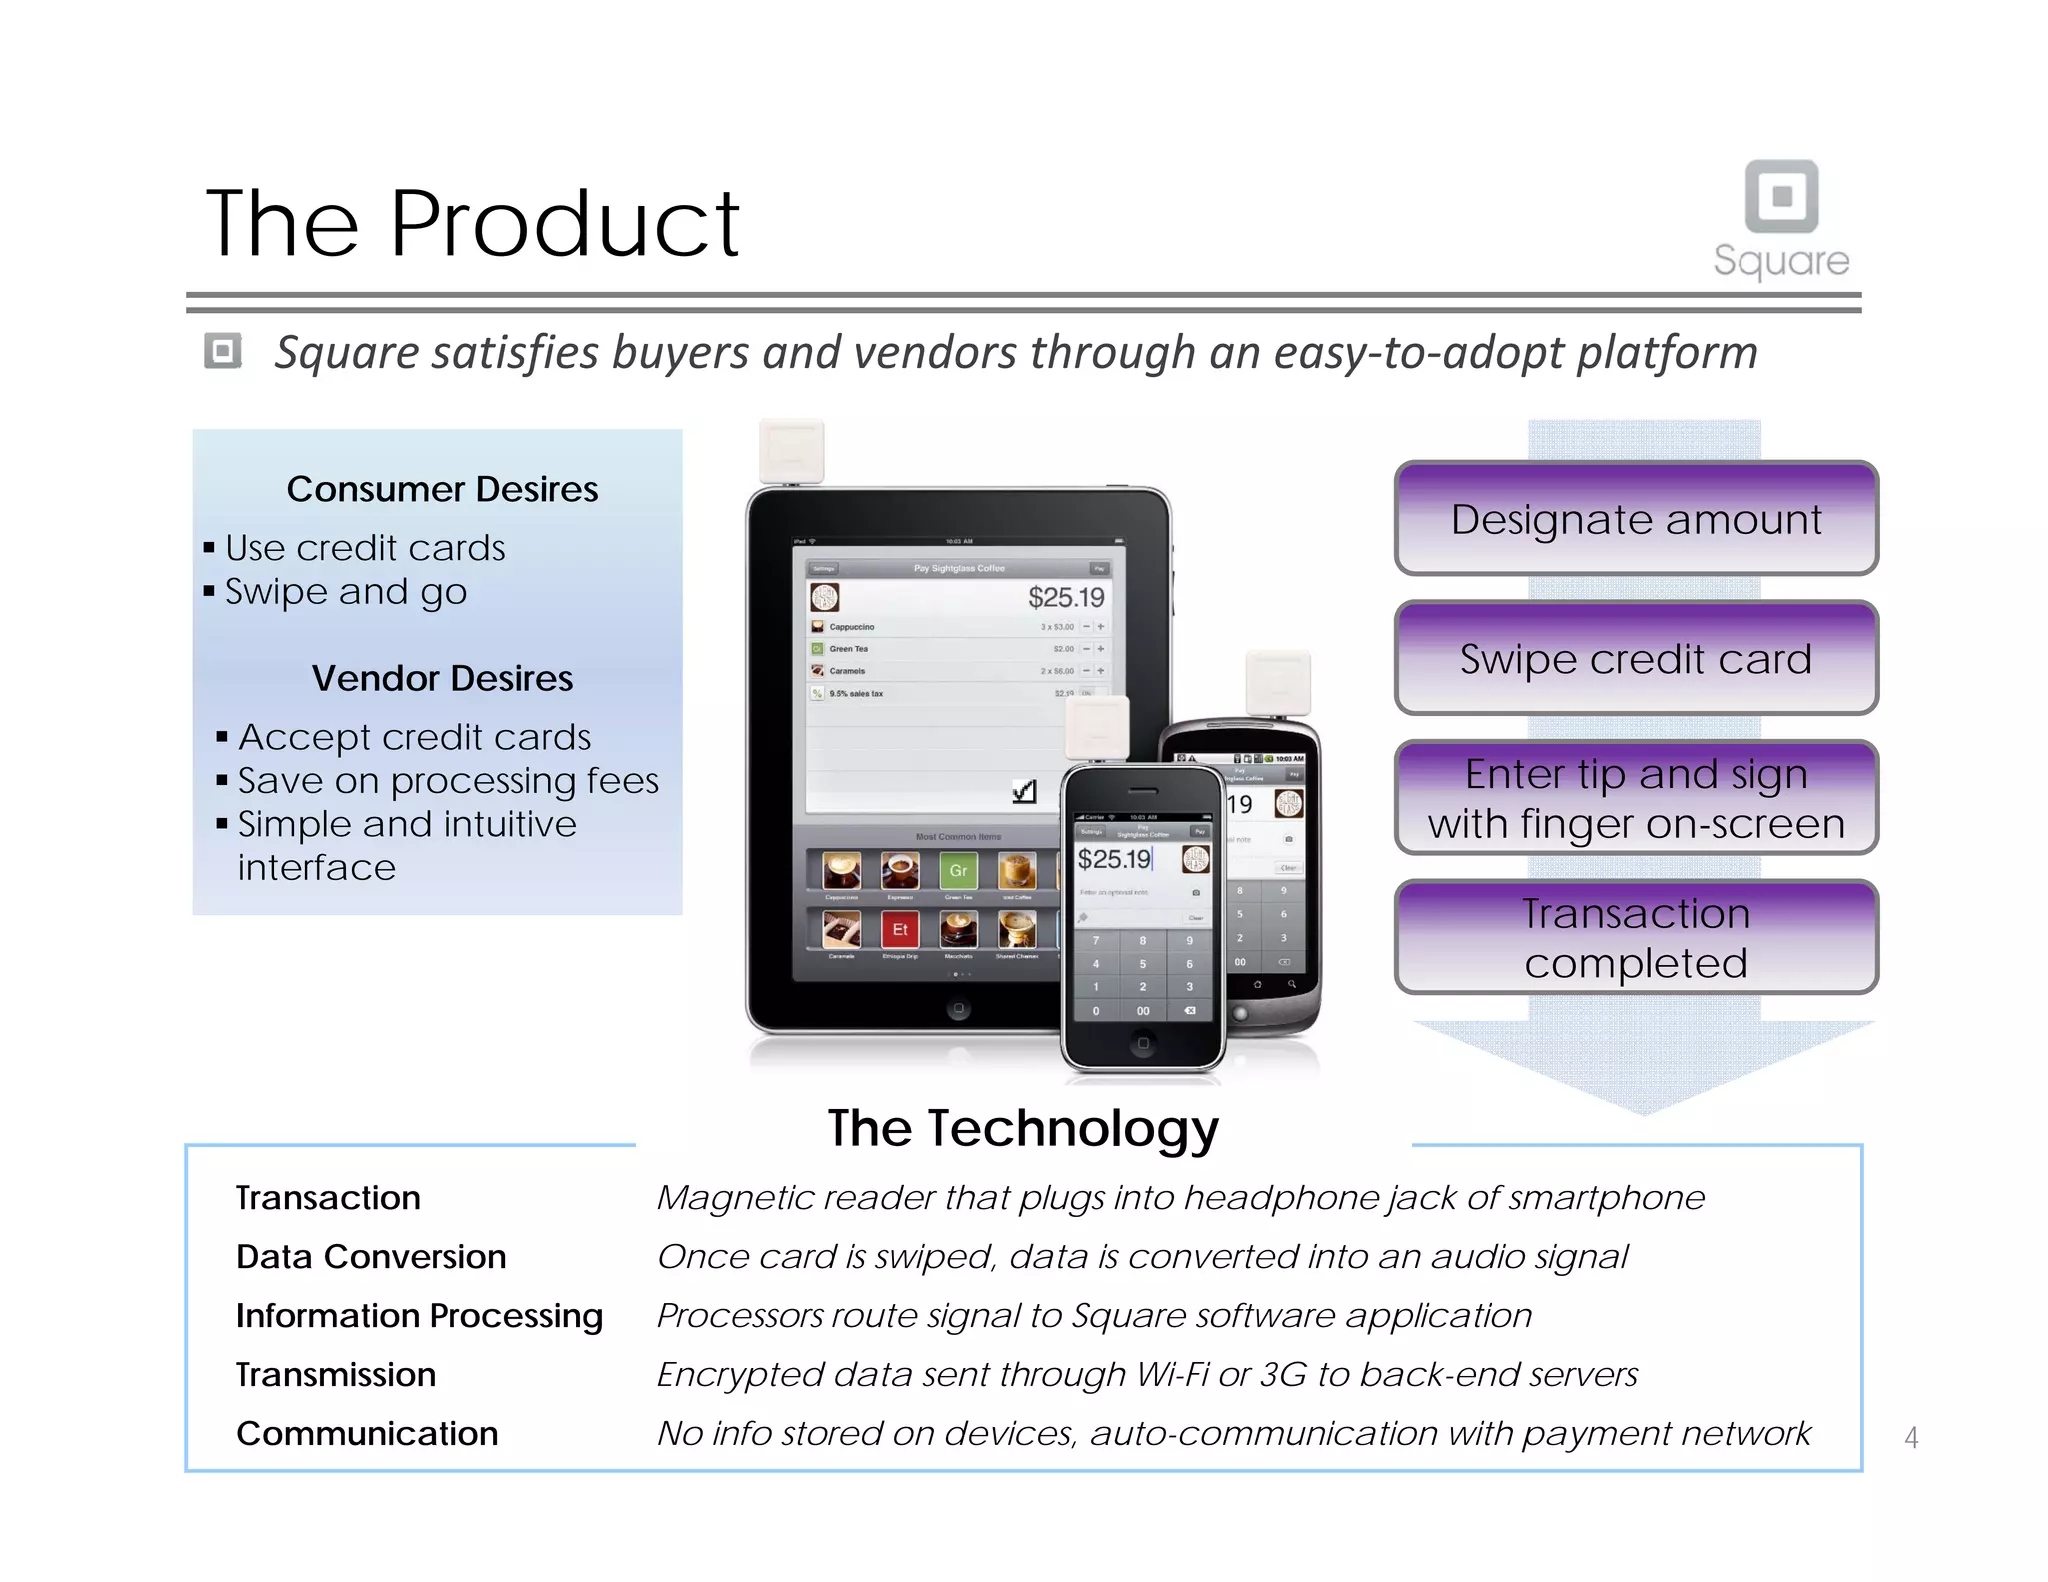
Slide analyzed: The Product slide (SLIDE 5) centers on an image of devices running the Square app and a step-by-step right column showing the seller flow (designate amount → swipe → sign → complete). The left column contrasts consumer and vendor desires while a bottom box succinctly describes the technology (magnetic reader → audio signal → encrypted transmission; no data stored on device). That combination does three things: demonstrates UX simplicity, reassures about security/architecture, and aligns both sides of the marketplace (buyers and sellers).

What founders can learn: show the user flow visually and then back it up with a brief technical explanation that addresses the top investor concerns (security, data flow, compatibility). A product-first slide that demonstrates an elegant UX plus a single-paragraph technical assurance can reduce friction in follow-up conversations and preempt basic diligence questions.

Key Takeaway: Lead with a short visual demo of the core user flow and add a compact technical note addressing security and data handling to preempt early concerns.
Customer Acquisition & Growth: distribution clarity and credible traction

Customer Acquisition & Growth: distribution clarity and credible traction

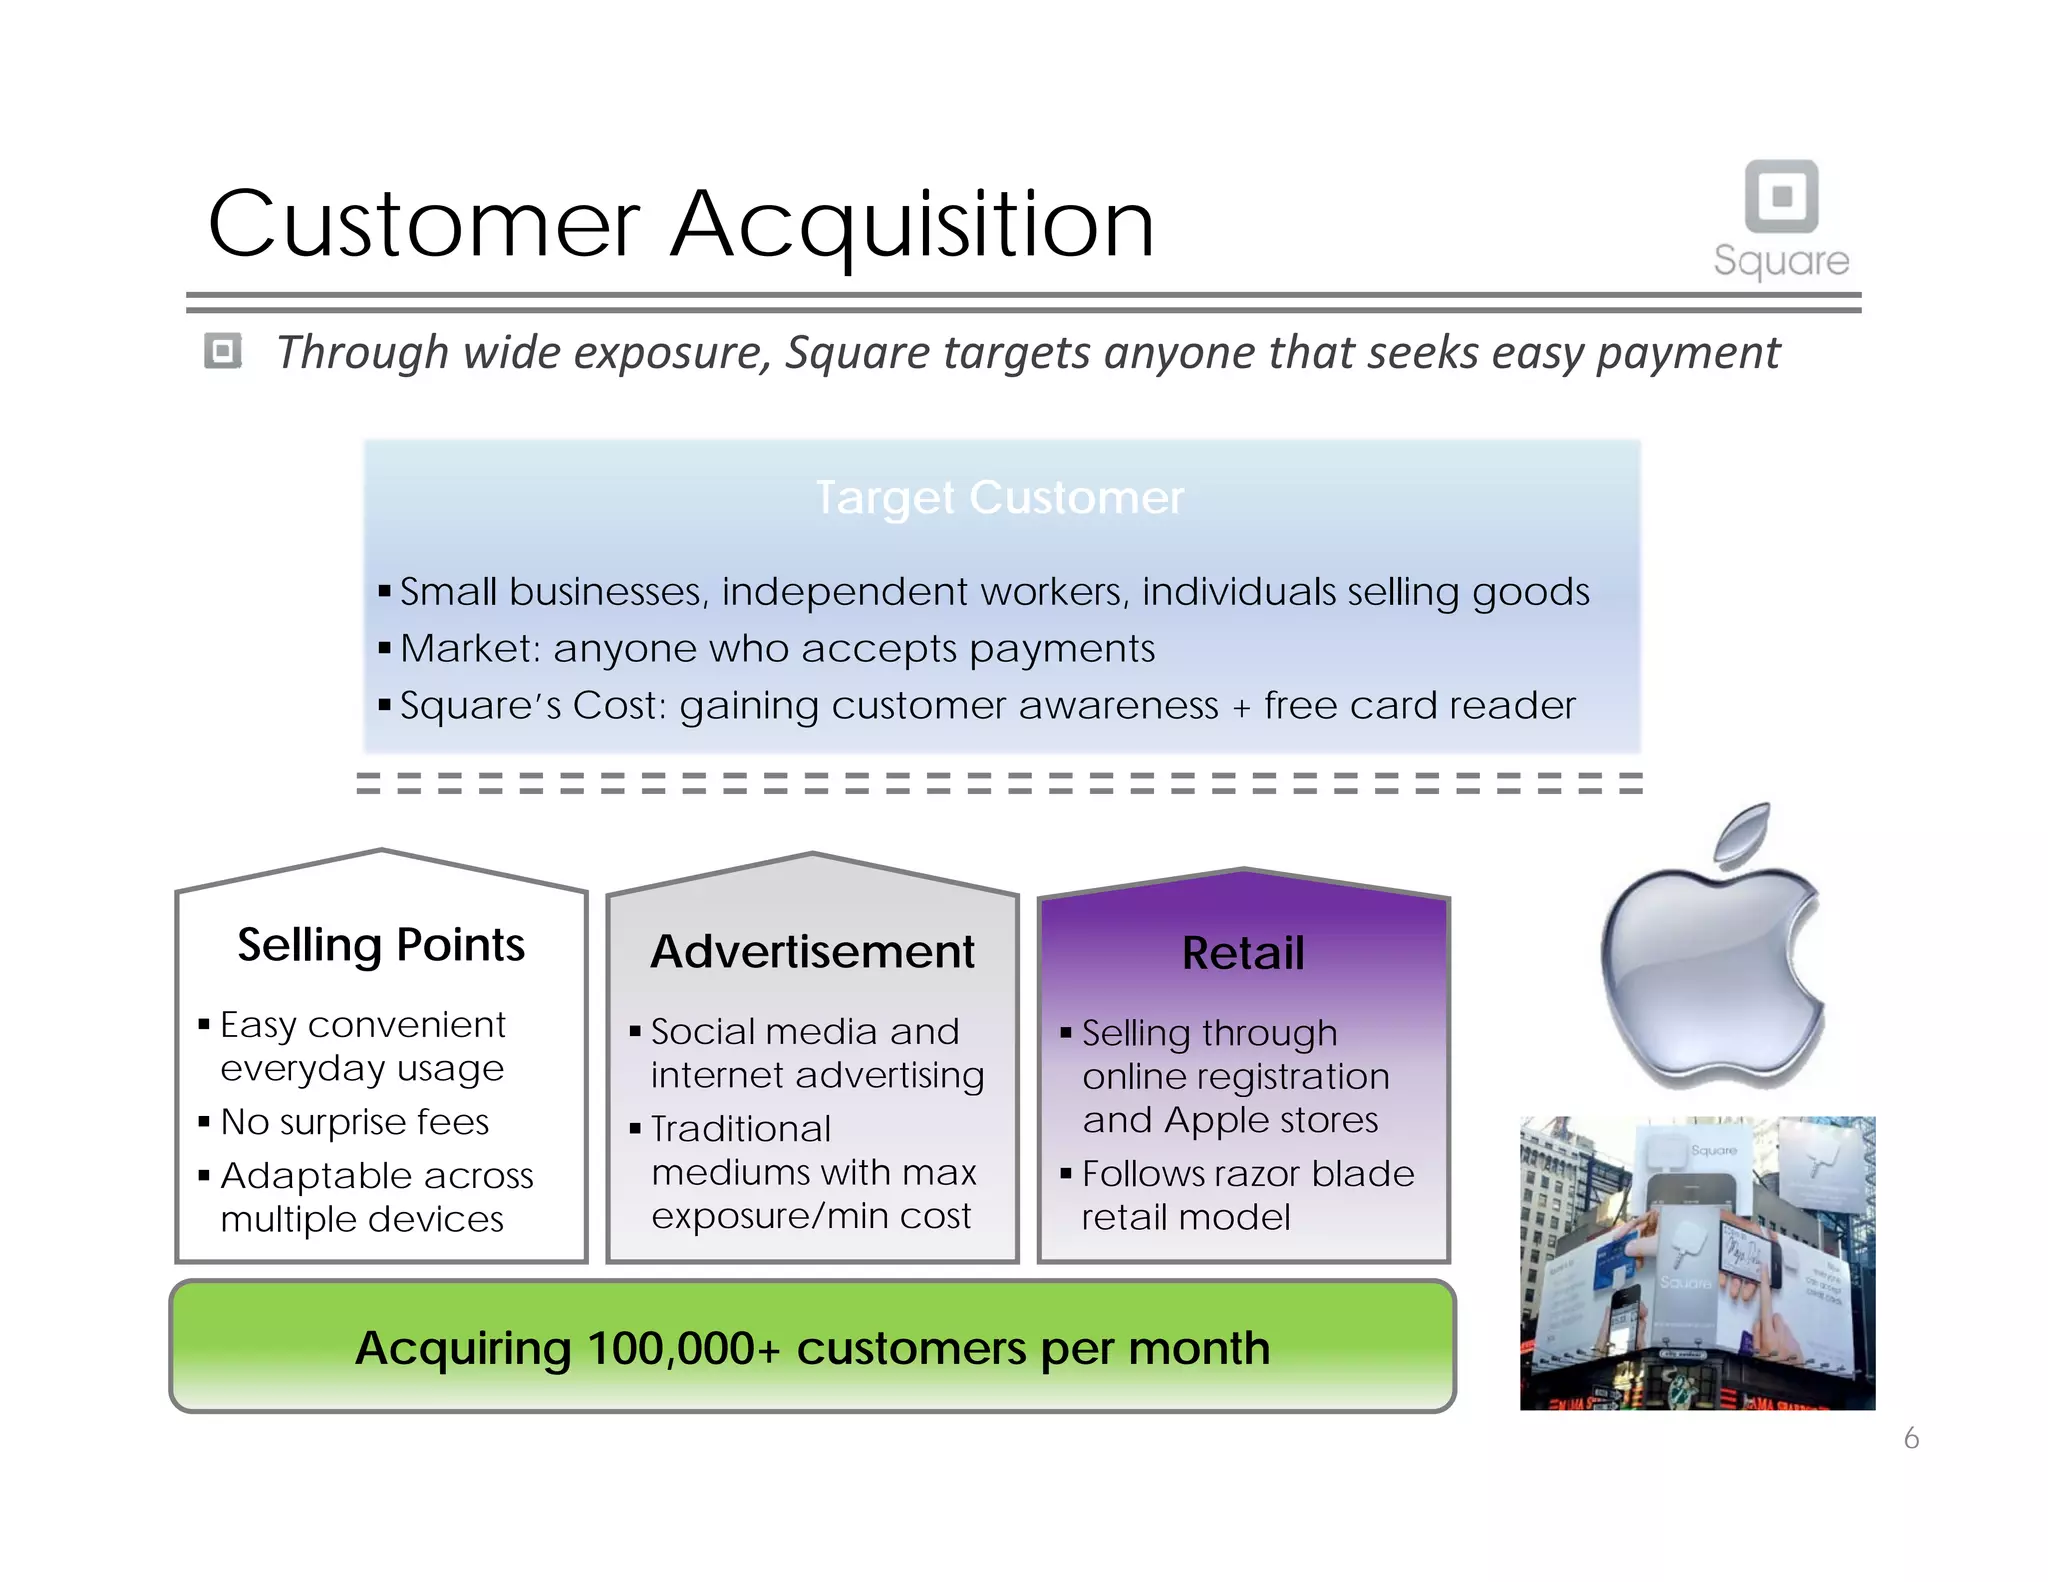
Slide analyzed: The Customer Acquisition slide (SLIDE 7) spells out target segments (small businesses, individuals), selling points, advertising channels (social media, traditional) and a retail/Apple-store play—concluding with a bold claim: acquiring 100,000+ customers per month. The slide pairs qualitative GTM tactics with a quantitative traction statement, signaling that the product-market fit is already turning into growth. The presence of Apple logos and retail references also imply channel partnerships and credibility.

What founders can learn: investors look for both how you will reach customers and evidence it’s working; present a multi-channel acquisition plan (organic, paid, retail, partnerships) and follow it with a traction metric that’s easy to verify or explain. Be specific about costs and unit economics if possible (e.g., cost to acquire, conversion rates) to make the growth claim investable rather than aspirational.

Key Takeaway: Combine a clear, multi-channel GTM plan with a concrete, verifiable growth metric to turn storytelling into investable traction.
Financials & Ask: aggressive but transparent projections

Financials & Ask: aggressive but transparent projections

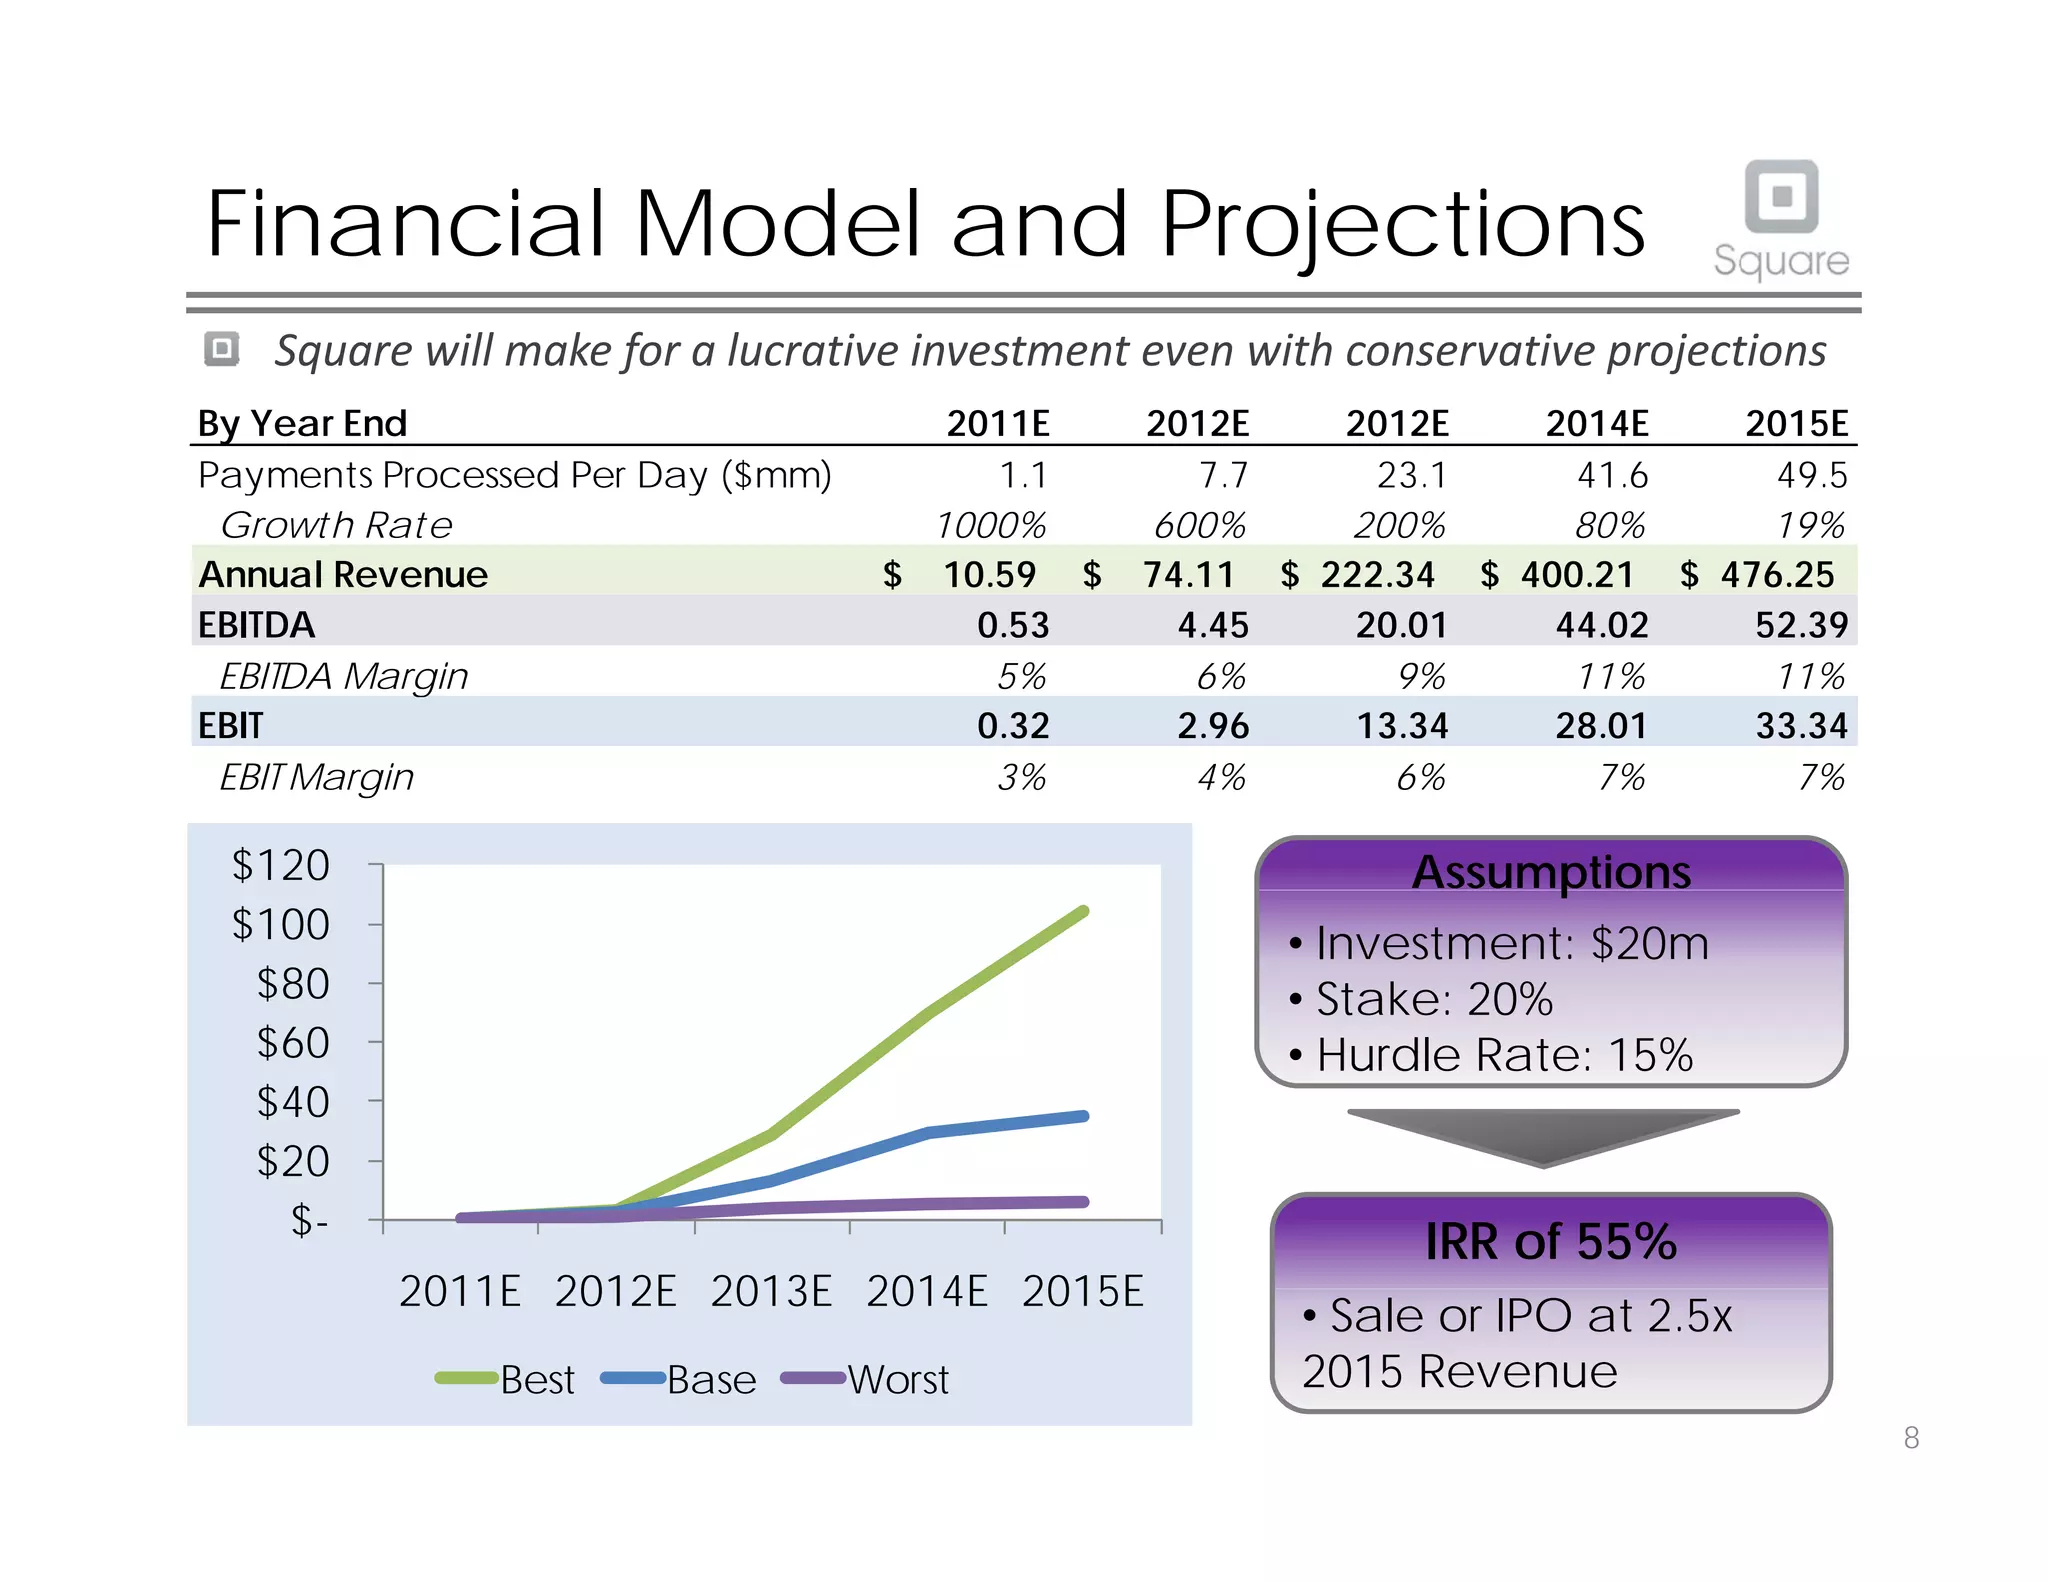
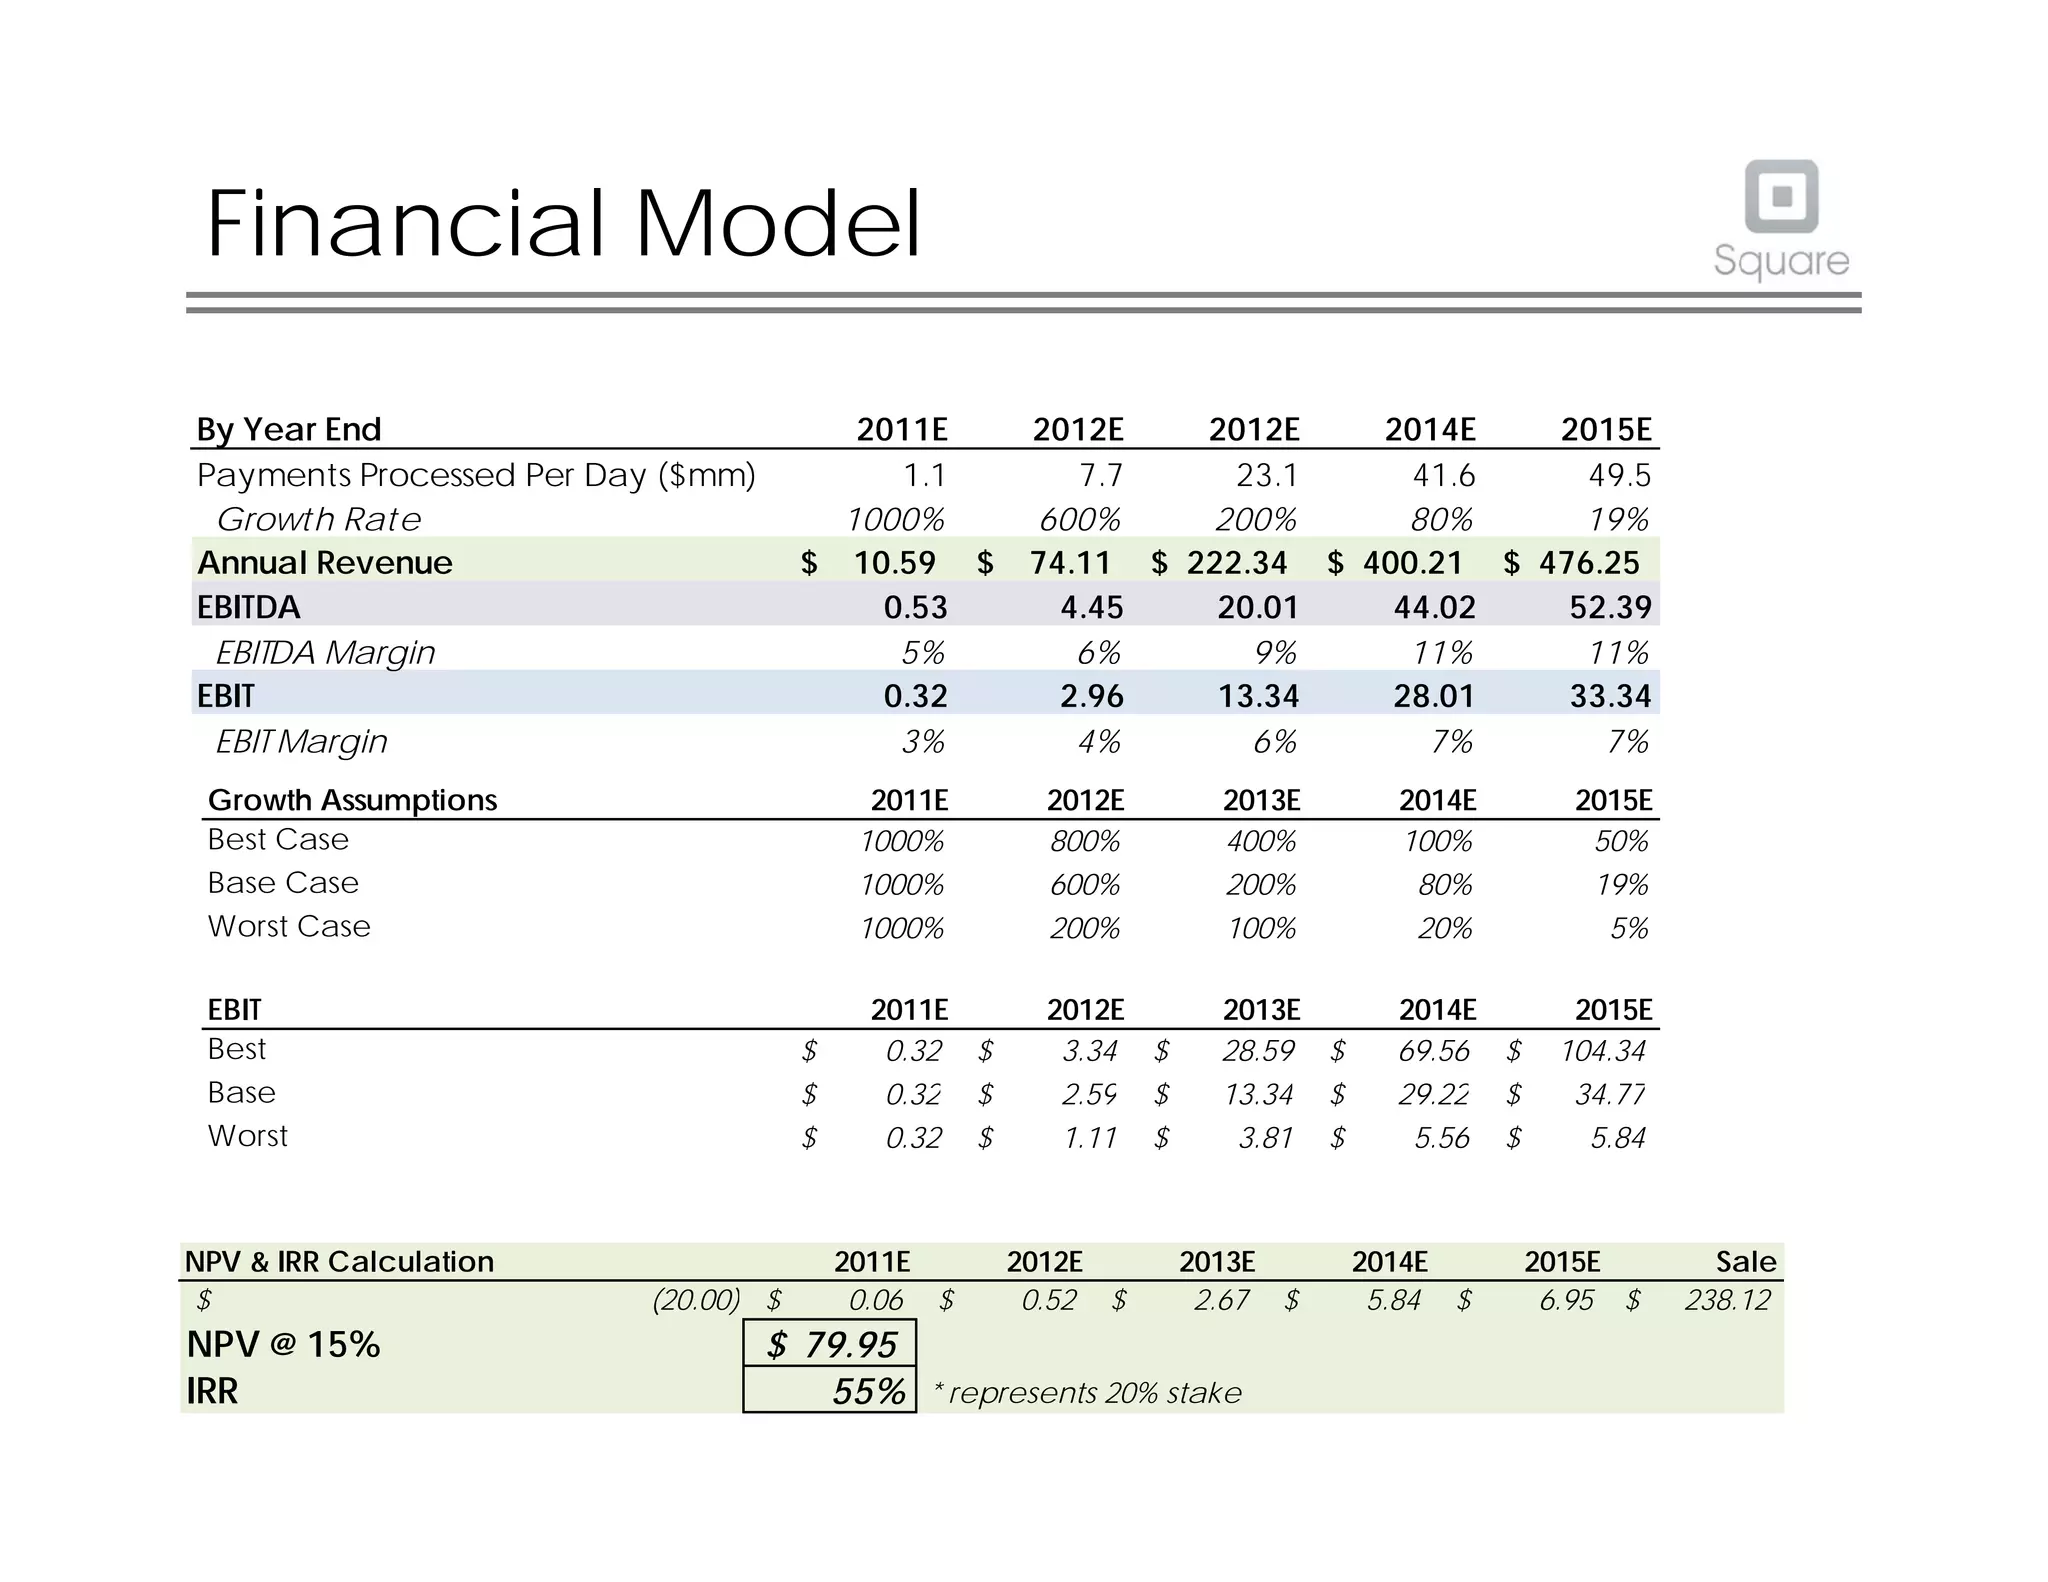
Slide analyzed: The Financial Model and Projections slide (SLIDE 9) lays out payments processed per day, revenue, EBITDA, EBIT, margin progression, and scenario curves (best/base/worst) across 2011–2015. It includes assumptions (investment $20m, stake 20%, hurdle rate 15%) and claims an IRR of 55% with a sale/IPO exit multiple. The slide is dense but gives investors the key inputs and outputs and ties them to exit scenarios—showing upside and the capital ask/return expectations.

What founders can learn: provide a readable financial summary with clear drivers (payments processed, take rate), multiple scenarios, and explicit assumptions that lead to investor outcomes (IRR, exit multiple). Avoid unsupported optimism—label assumptions and show sensitivity. Investors prize transparency: show how much capital you need, what stake it buys, and the implied return under credible exit assumptions.

Key Takeaway: Present a driven financial model with clear unit economics, labeled assumptions and scenario outcomes so investors can see the path to returns and the capital required.

Conclusion: Key Lessons

This deck succeeds because it pairs a simple, visual product story with market evidence, credible team social proof, a tangible go-to-market plan and concrete financials. Each slide anticipates investor questions—what is the product, why now, who’s running it, how will customers be acquired, and what are the returns—and answers them succinctly. The result is a cohesive narrative that turns a small hardware add-on and app into a scalable payments business.

Actionable advice for founders: prioritize clarity and verification—lead with a one-sentence value prop and a product image, quantify market size and traction, showcase team credibility in one glance, map GTM channels to real metrics, and provide a financial model with labeled assumptions and exit math. Anticipate the top investor concerns (security, defensibility, CAC, unit economics) and address them directly with short, evidence-backed bullets so your deck invites follow-up diligence rather than more questions.

Full Deck Analysis

11 sections

Overview

Company: Square
Round: Series C (following Series A at $10M and Series B at $27.5M)
Year: 2010
Valuation: $240M post-Series B (January 2011)
Outcome: IPO at $9/share in 2015 ($2.4B valuation); now Block at $40B+ (2024)

Executive Summary

Square’s 2010 pitch deck presents a mobile payments solution targeting small businesses with a simple, low-friction alternative to traditional card processing. Leveraging Jack Dorsey’s credibility as Twitter co-founder, the deck demonstrates early product-market fit (100,000 merchants signing up monthly, $1M in daily payments) and projects aggressive growth to $476M revenue by 2015E with a 55% IRR. The pitch is notable for its combination of compelling market timing (68% CAGR in mobile payments), concrete traction metrics, detailed financial modeling with scenario analysis, and proactive risk management—though it also exhibits aggressive growth assumptions and potentially overstated competitive advantages that warrant scrutiny.

Problem Statement

The Core Problem (Slide 2):
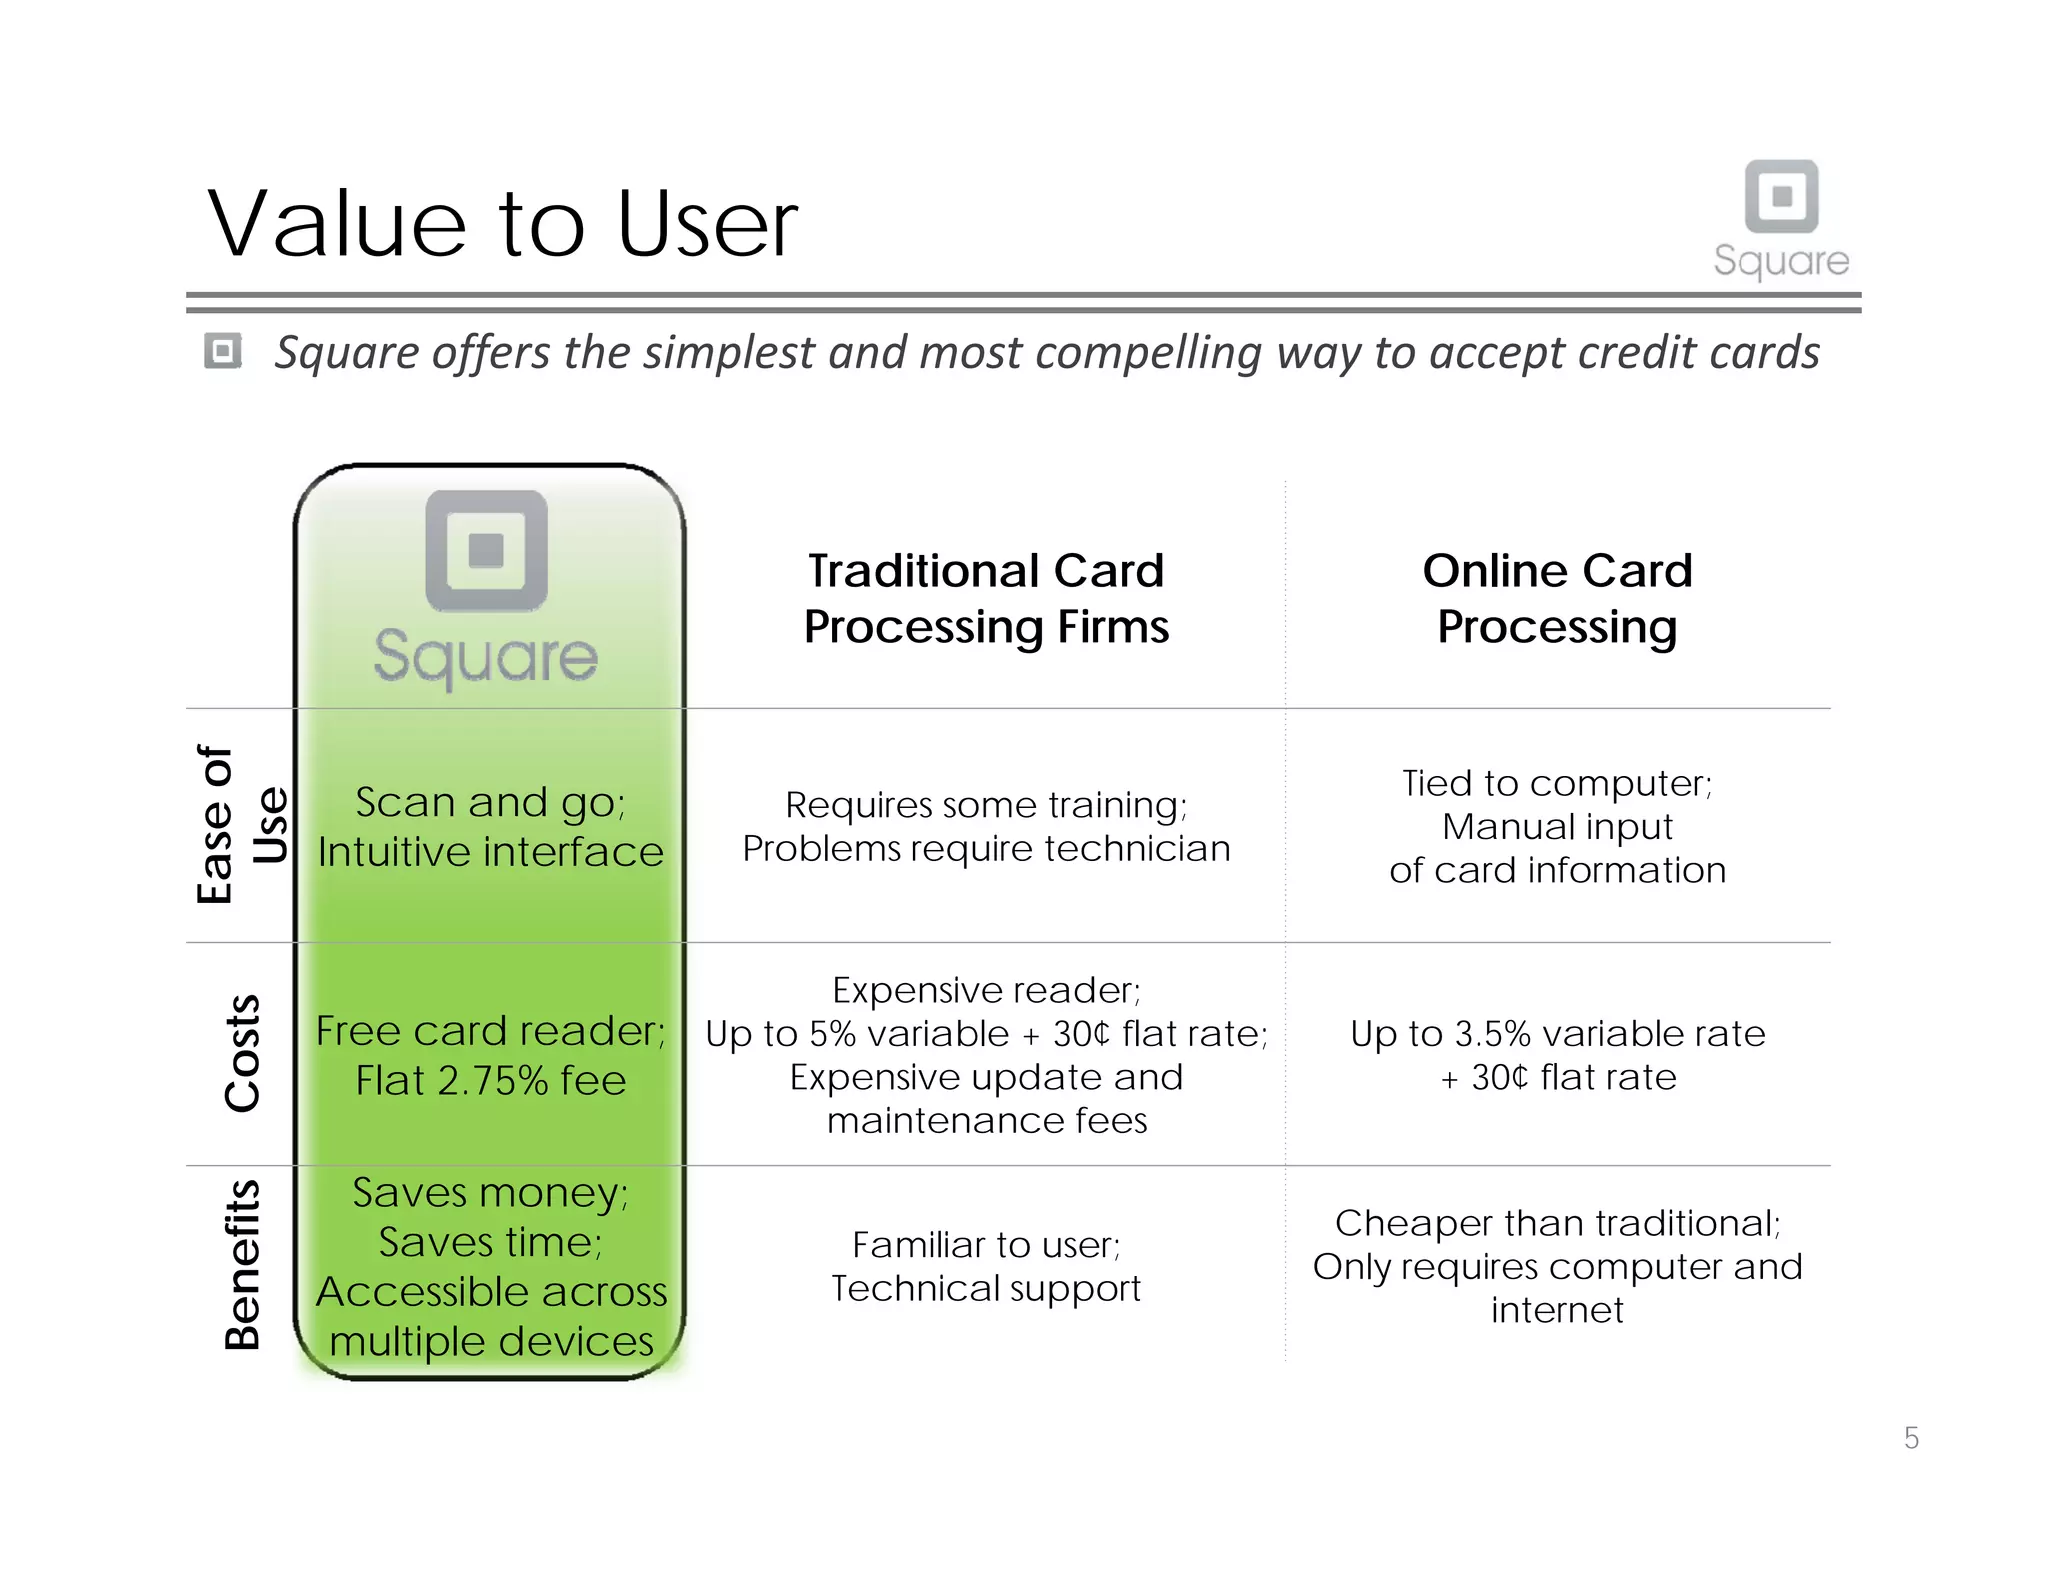
Small businesses, independent workers, and individuals selling goods lack a simple, affordable way to accept credit card payments. Traditional payment processing is characterized by:

  • High friction: Requires training, technician support for problems
  • High costs: Up to 5% variable + 30¢flat rate, plus expensive hardware and maintenance fees
  • Limited accessibility: Tied to desktop computers or complex online systems

Market Context (Slide 4):
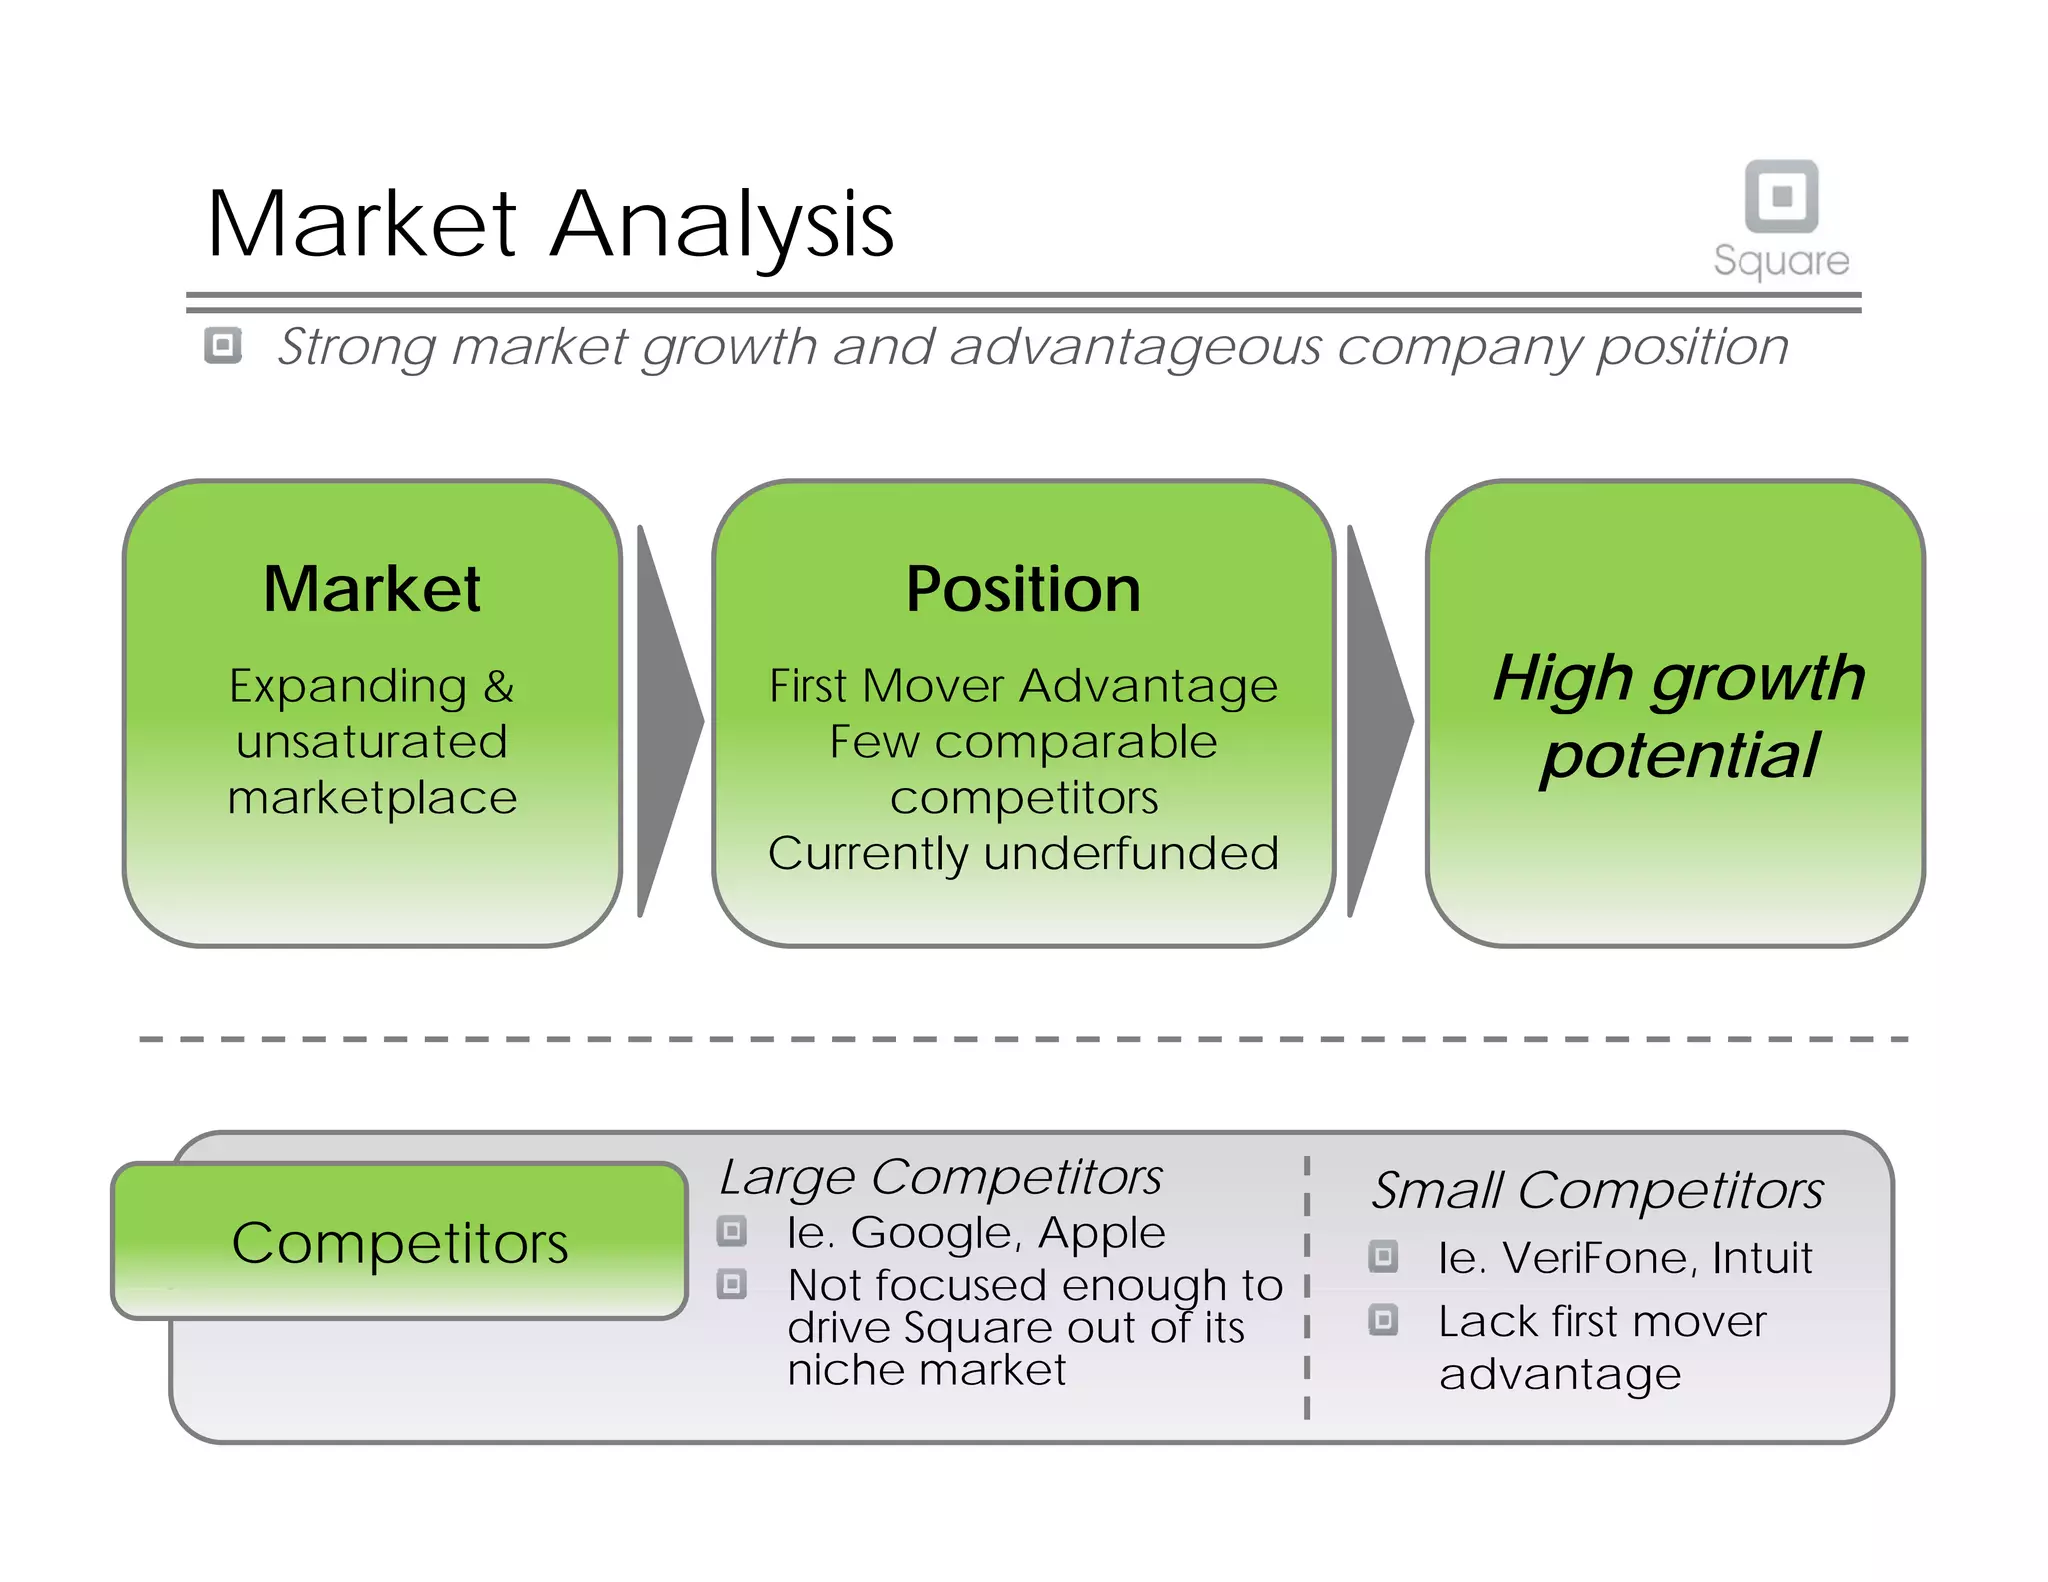
The deck frames this as a “massive, rapidly growing but underpenetrated industry.” Mobile payments were nascent in 2010, with only $16B in U.S. transactions, but projected to grow 68% CAGR through 2014.

Specific Pain Points Articulated:

  • Traditional card readers are “unwieldy & expensive”
  • “Difficult for small business owners to use card services”
  • Alternative online services are “expensive”
  • No simple, mobile-first solution existed for accepting payments on-the-go

Solution

Product Positioning (Slide 5):
Square is a mobile payment system consisting of:

  1. Hardware: A small magnetic card reader that plugs into the headphone jack of any smartphone
  2. Software: Free iOS and Android apps that process transactions
  3. Service: Encrypted payment processing with daily deposits to merchant bank accounts

Key Innovation (Slide 5 - The Technology):

  • Magnetic reader converts card swipe into audio signal
  • Signal processed by Square software application
  • Encrypted data transmitted via Wi-Fi or 3G to back-end servers
  • Auto-communication with payment networks; no data stored on device

Value Delivery (Slide 6):
The solution addresses both buyer and seller needs:

  • Consumer desires: Use credit cards, swipe and go
  • Vendor desires: Accept credit cards, save on processing fees, simple/intuitive interface

Pricing Model (Slide 2, 6):

  • 2.75% flat fee per transaction (vs. 5% + 30¢ or 3.5% + 30¢ for competitors)
  • Free card reader (vs. expensive hardware for traditional processors)
  • No monthly fees (vs. maintenance fees for traditional systems)
  • No credit check required
  • Daily deposits to merchant bank account
  • Zero commitment (can cancel anytime)

Market Opportunity

Total Addressable Market (TAM) - Slide 4:

Year Market Size (Billions) Growth Rate
2010 $16 —
2011 $46 188%
2012 $81 76%
2013 $119 47%
2014 $162 36%
2015 $214 32%

CAGR 2010-2014: 68%

Market Characteristics (Slide 4):

  • “Massive, rapidly growing but underpenetrated industry”
  • Rapidly burgeoning interest in mobile payments
  • NFC technology adoption emerging, but credit card usage still prevails
  • Capturing a loyal user base has “huge revenue potential”

Target Customer Definition (Slide 7):

  • Small businesses
  • Independent workers
  • Individuals selling goods
  • “Anyone who accepts payments”
  • Primary focus: SMB segment underserved by traditional processors

Market Dynamics (Slide 4):
The deck identifies three market forces:

  1. Opportunity: Traditional card readers are unwieldy/expensive; difficult for SMBs; online alternatives are expensive
  2. Market Changes: Rapidly burgeoning mobile interest; NFC adoption emerging; credit card usage still prevails; loyal user base potential
  3. Square Positioning: First-mover advantage; scalable across platforms; low costs address SMB needs

Business Model

Revenue Model (Slide 9, 14):

  • Transaction-based: 2.75% of each payment processed
  • Recurring: Continuous revenue from merchant transaction volume
  • Scalable: Minimal marginal cost per transaction after infrastructure investment

Unit Economics (Implied but not explicitly stated):

Metric 2011E 2015E
Daily Payments Processed $1.1mm $49.5mm
Annual Revenue $10.59M $476.25M
Gross Margin ~95% (implied) ~95% (implied)
EBITDA $0.53M (5%) $52.39M (11%)
EBIT $0.32M (3%) $33.34M (7%)

Margin Expansion Logic (Slide 14):

  • EBITDA margins expand from 5% (2011) to 11% (2015) due to operating leverage
  • EBIT margins expand from 3% to 7% as fixed costs are absorbed by growing revenue base
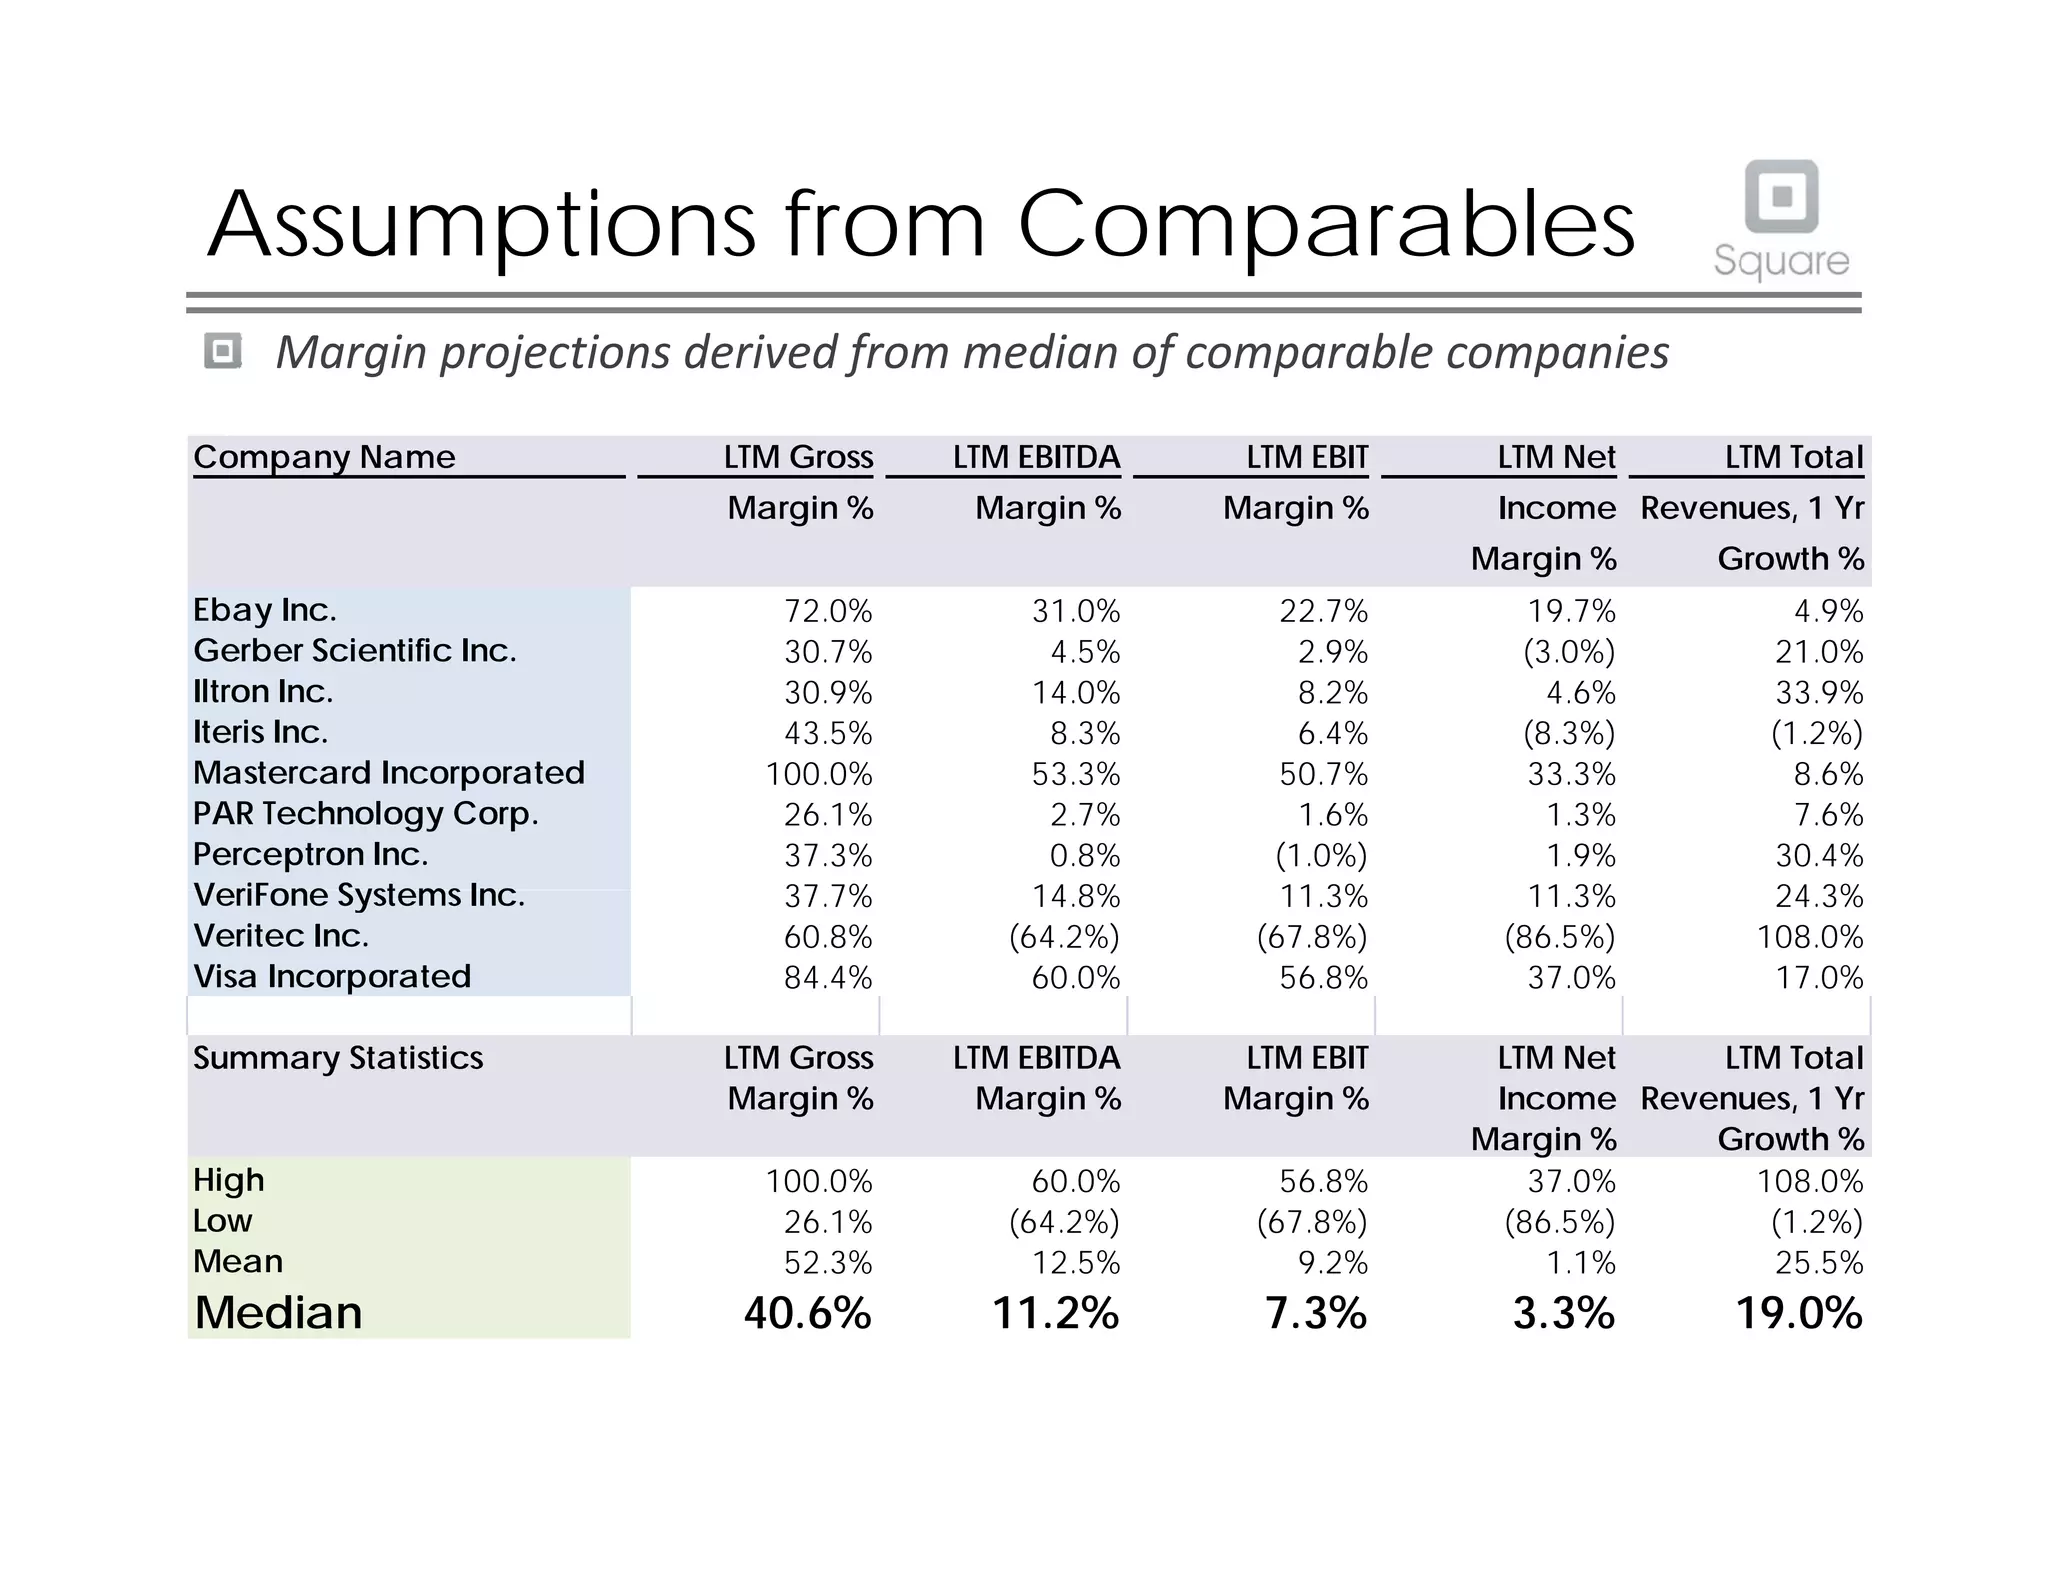
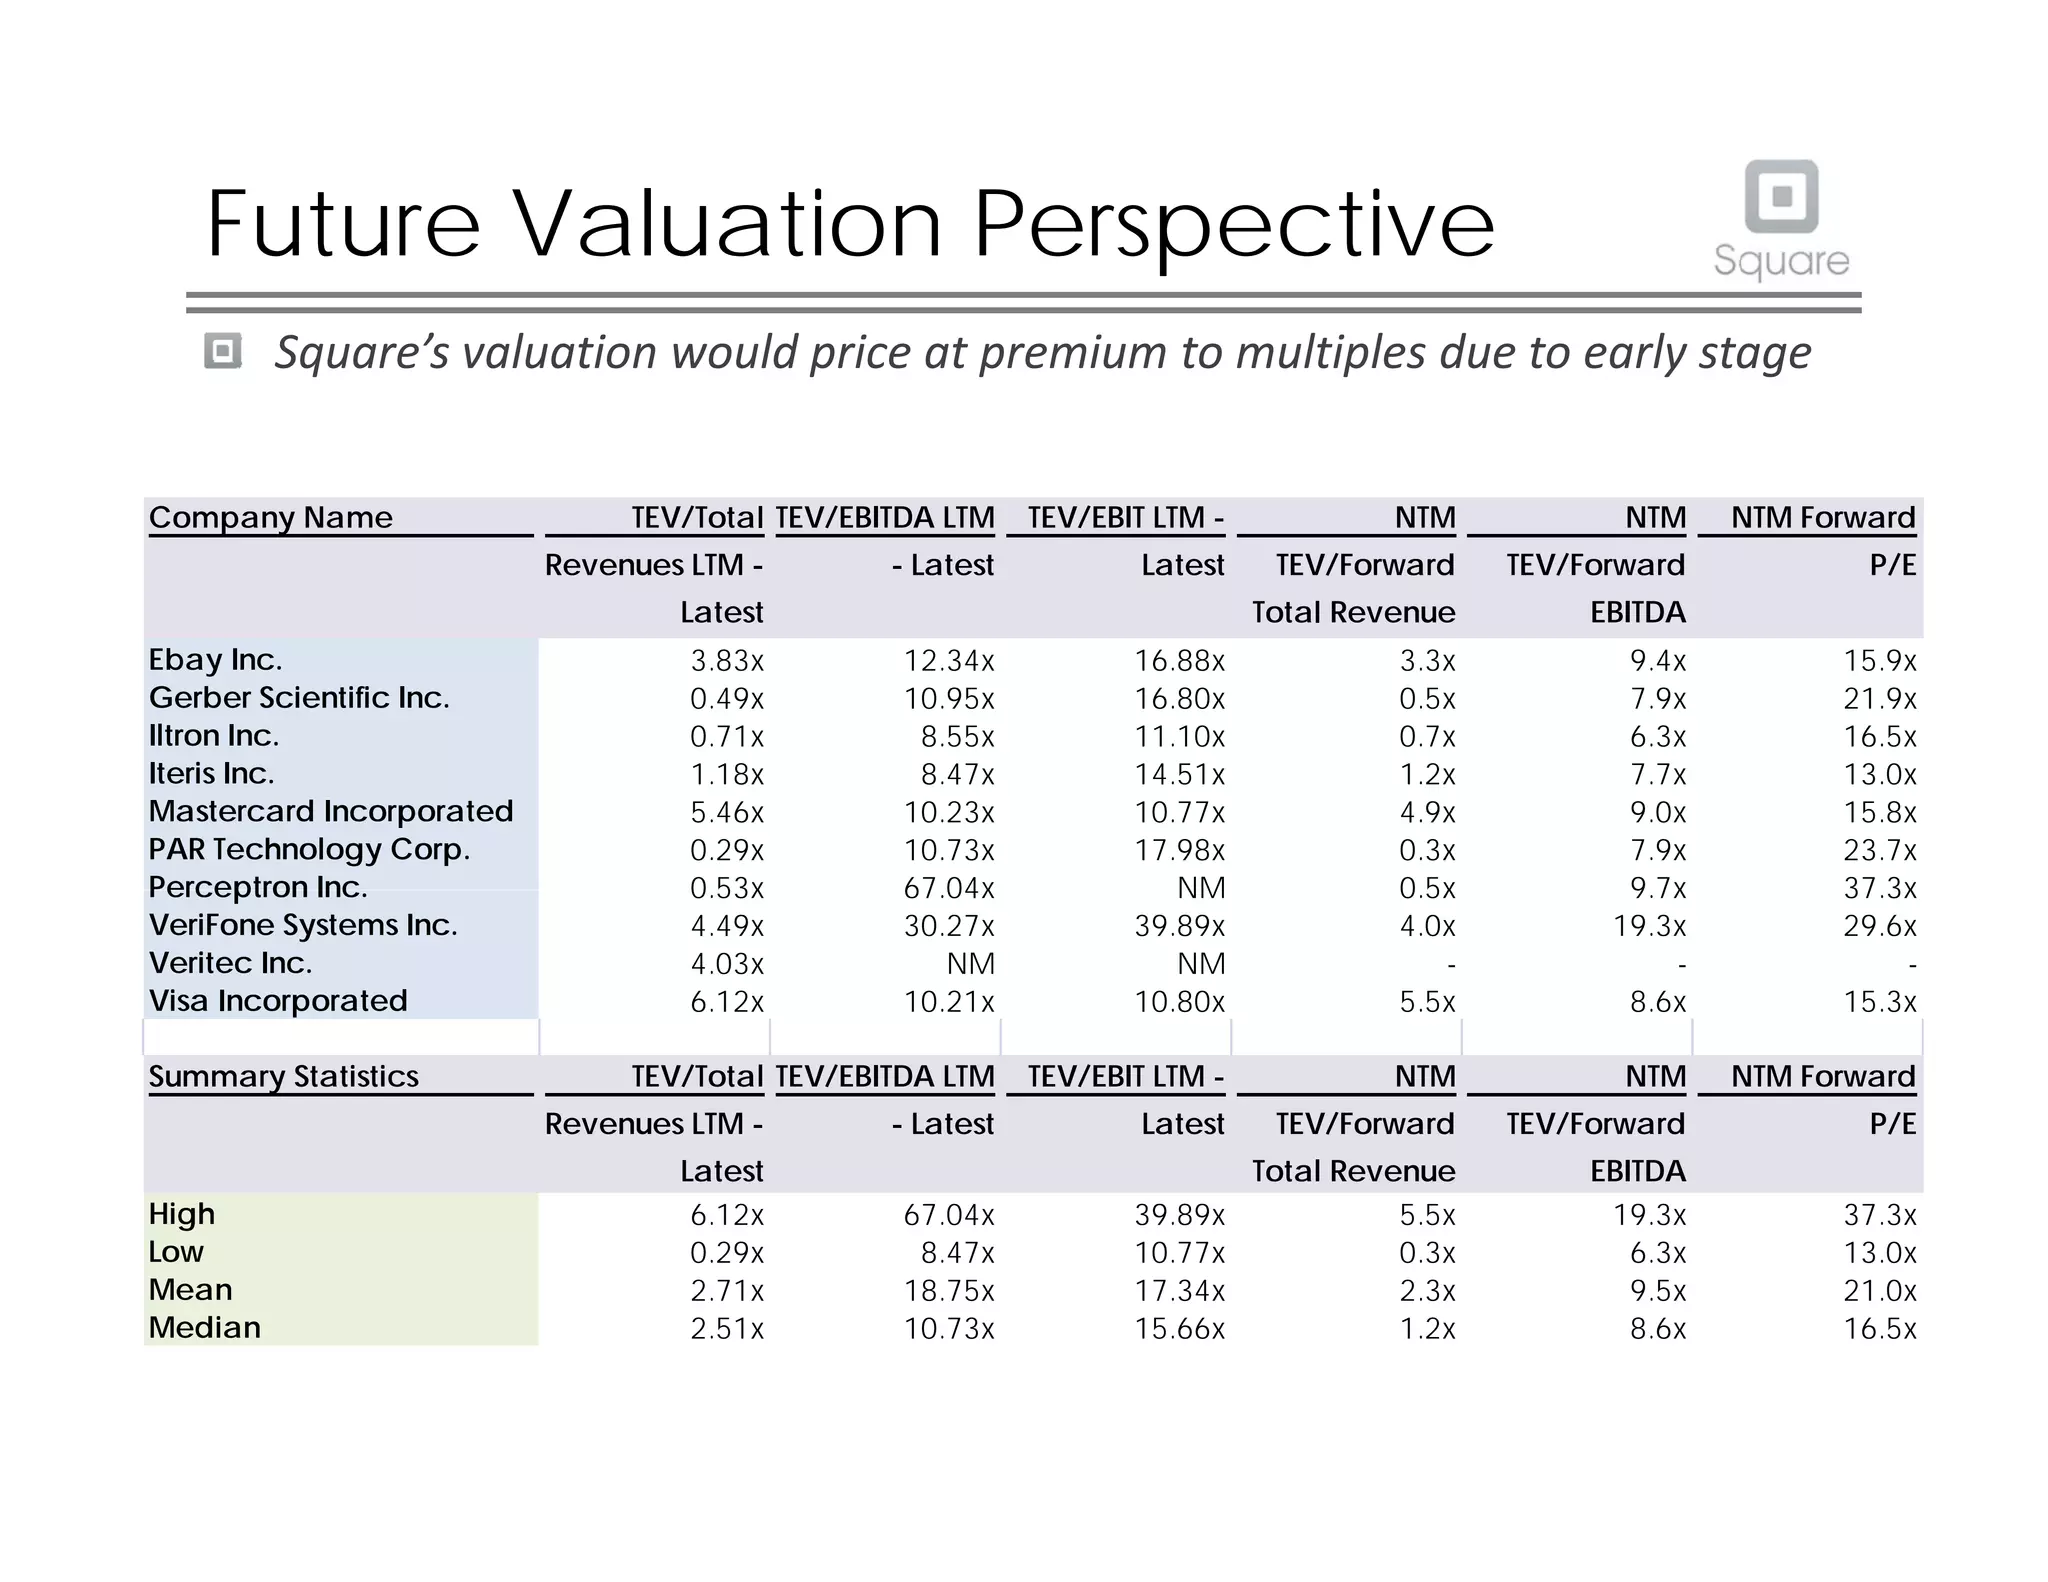
  • Comparable company analysis (Slide 15) shows median EBITDA margin of 11.2% and EBIT margin of 7.3%, validating Square’s projections

Cost Structure (Implied):

  • Hardware subsidy: Free card reader (cost not itemized)
  • Payment processing fees: Acquiring bank fees (cost not detailed)
  • Customer acquisition: Free card reader + marketing/advertising
  • Operations: Engineering, customer support, compliance

Critical Assumption:
The deck does not provide explicit CAC (Customer Acquisition Cost), LTV (Lifetime Value), or churn assumptions—a significant gap in financial transparency.

Traction & Metrics

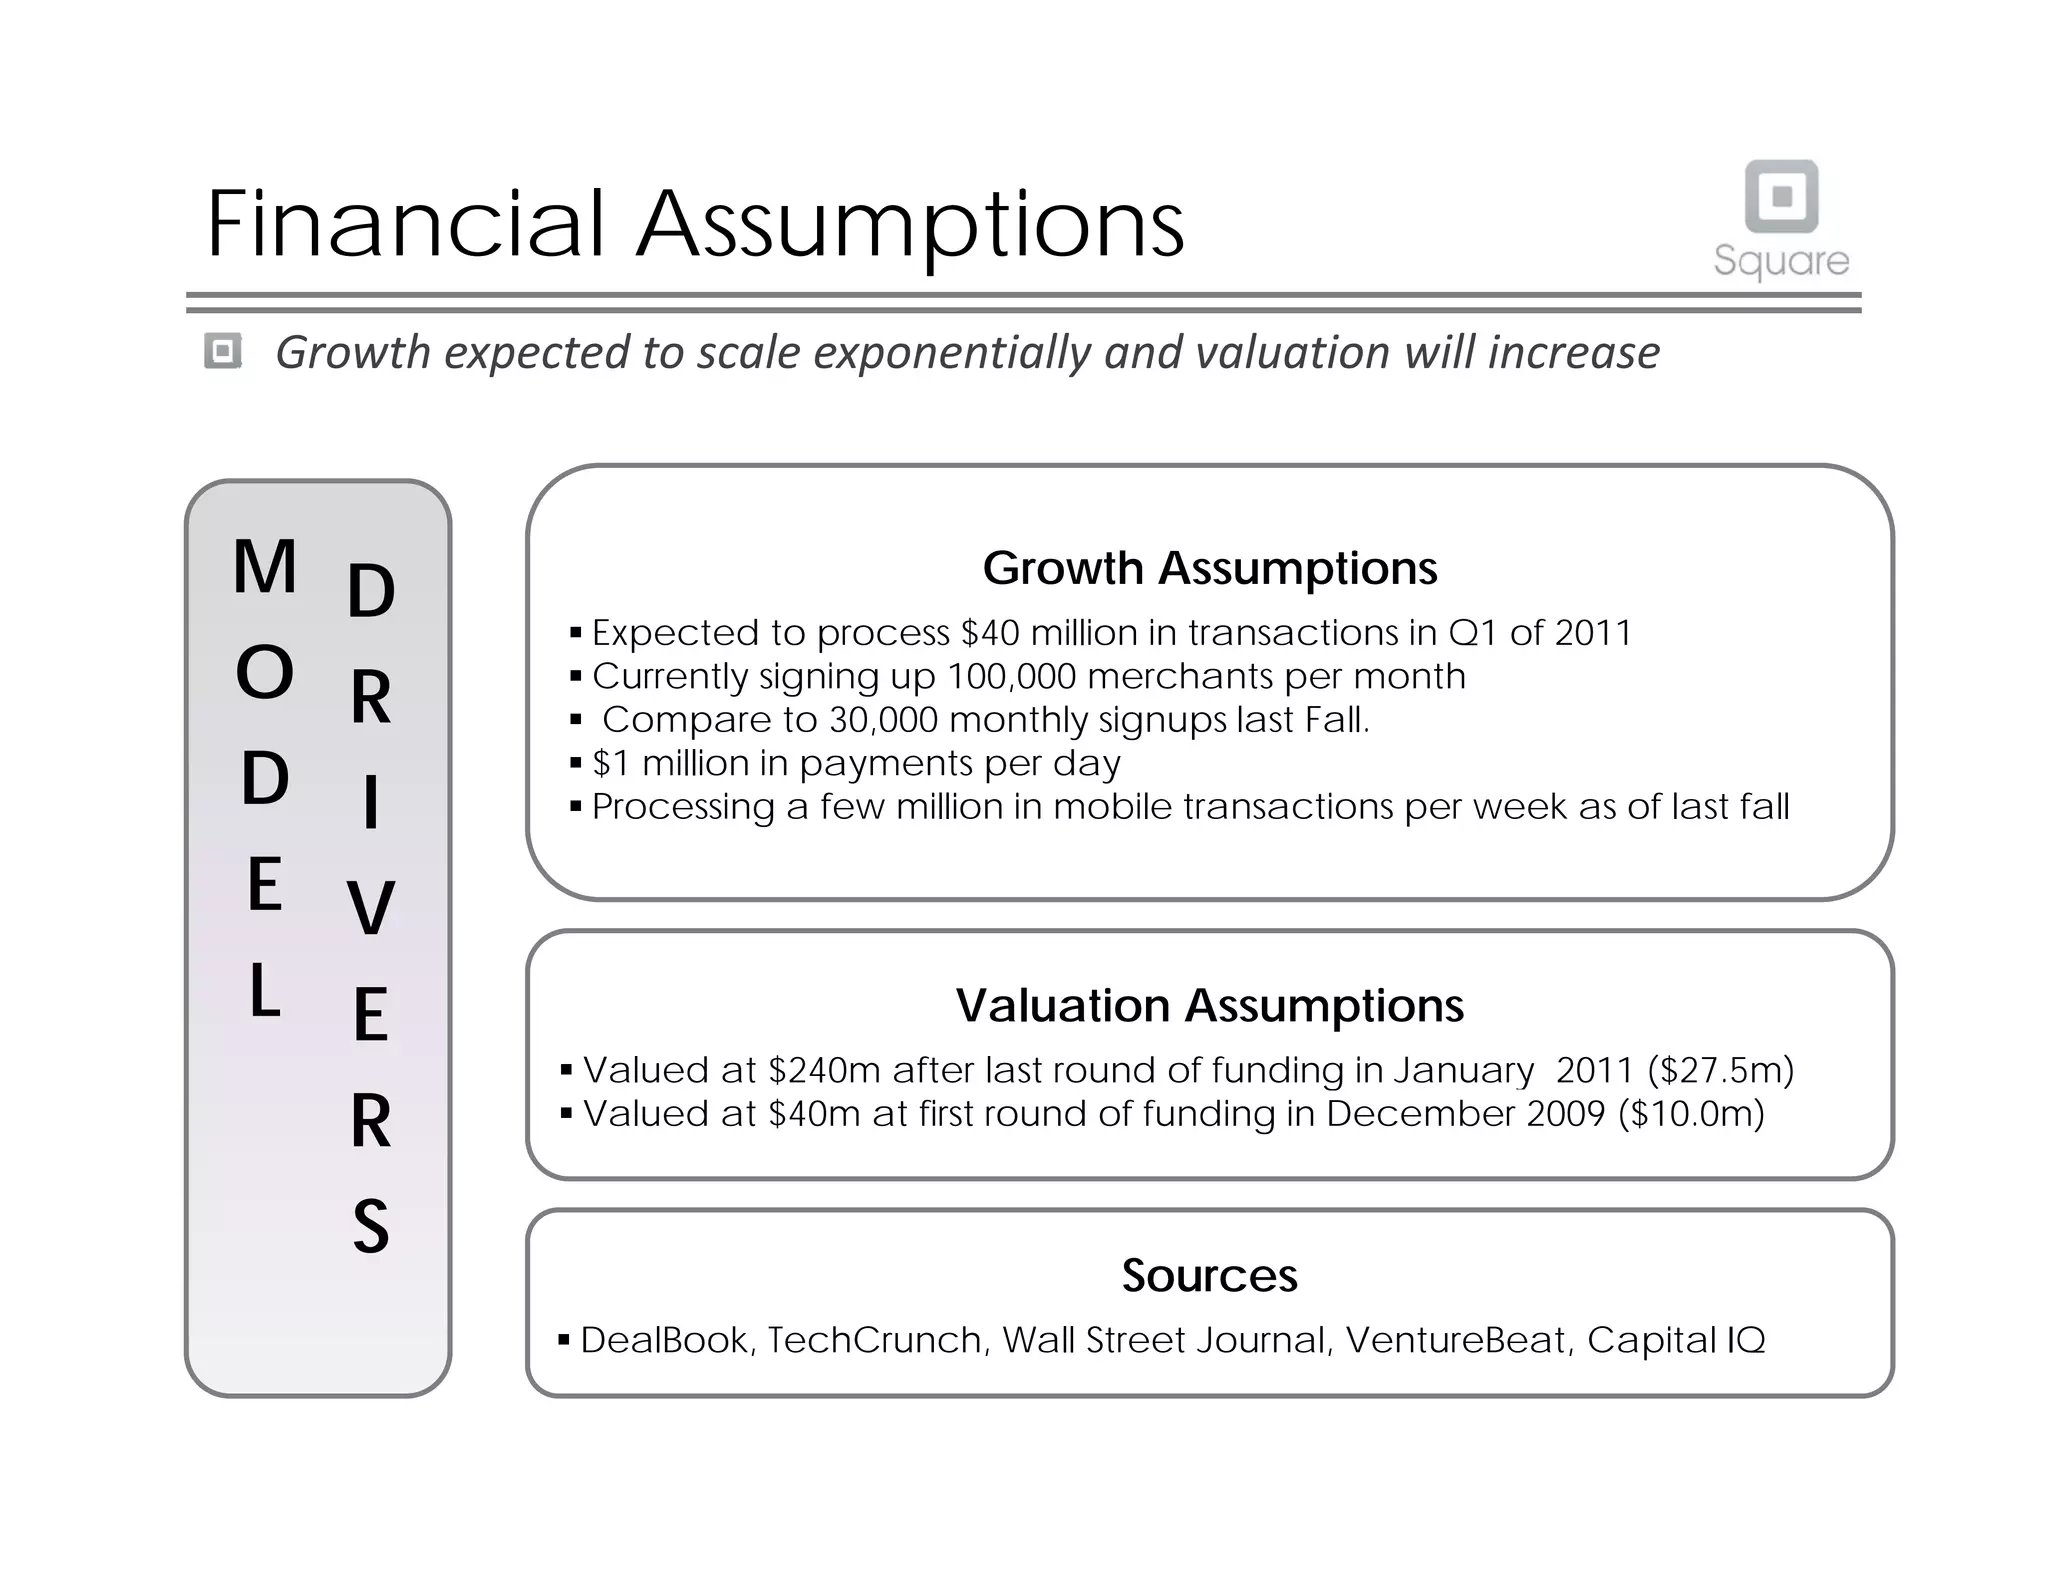
Current Traction (Slide 13 - Financial Assumptions):

Metric Current (as of late 2010) Growth
Monthly merchant signups 100,000 3.3x vs. 30,000 (Fall 2009)
Daily payment volume $1,000,000 —
Weekly mobile transactions “Few million” —
Q1 2011 projection $40M in transactions —

Growth Trajectory (Slide 13):

  • Fall 2009: 30,000 monthly signups
  • Current (late 2010): 100,000 monthly signups
  • Acceleration: 3.3x growth in ~12 months

Valuation Progression (Slide 13):

  • Series A (December 2009): $40M post-money valuation on $10M investment
  • Series B (January 2011): $240M post-money valuation on $27.5M investment
  • Valuation growth: 6x in 13 months

Proof Points:

  • Real merchants using the product (Sight Glass, Zappos partnerships mentioned)
  • Actual transaction data ($1M daily payments)
  • Merchant acquisition momentum (100k/month)
  • Multi-platform availability (iOS, Android)

Competitive Positioning

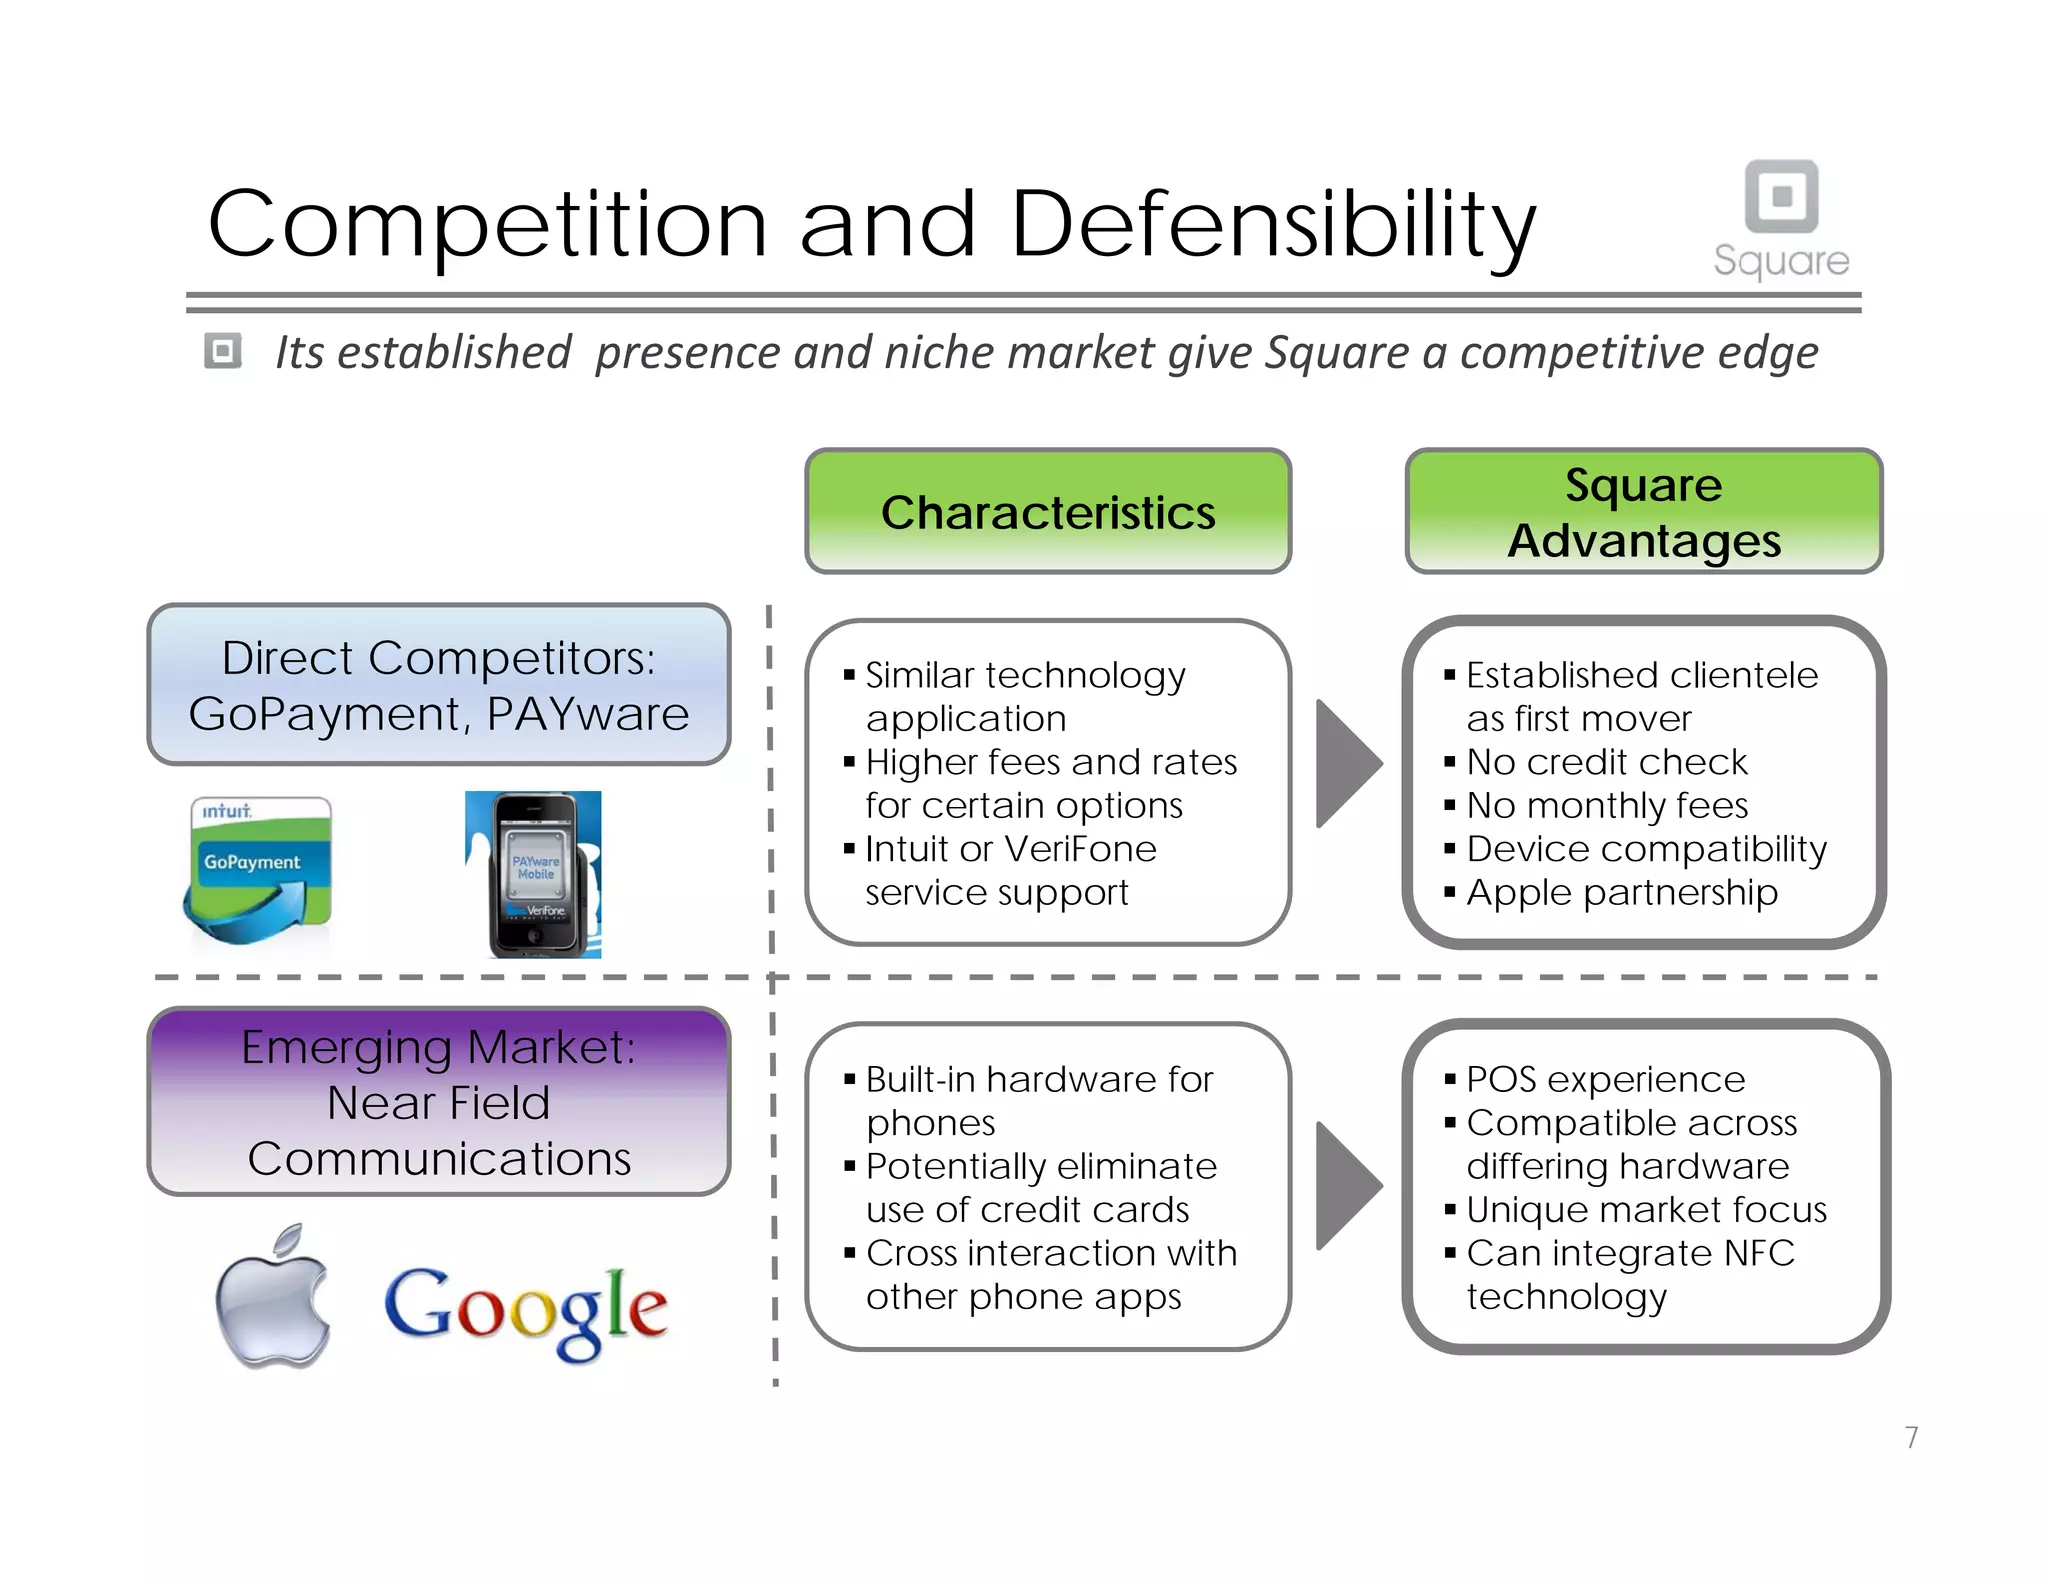
Direct Competitors (Slide 8):

  • GoPayment (Intuit)
  • PAYware (VeriFone)

Competitor Characteristics (Slide 8):

  • Similar technology application
  • Higher fees and rates (up to 5% variable + 30¢)
  • Intuit or VeriFone service support (vs. Square’s simplicity)
  • Expensive update and maintenance fees

Square’s Competitive Advantages (Slide 8):

  1. Established clientele as first mover
  2. No credit check requirement
  3. No monthly fees
  4. Device compatibility across platforms
  5. Apple partnership (nature not detailed)

Emerging Threat (Slide 8):

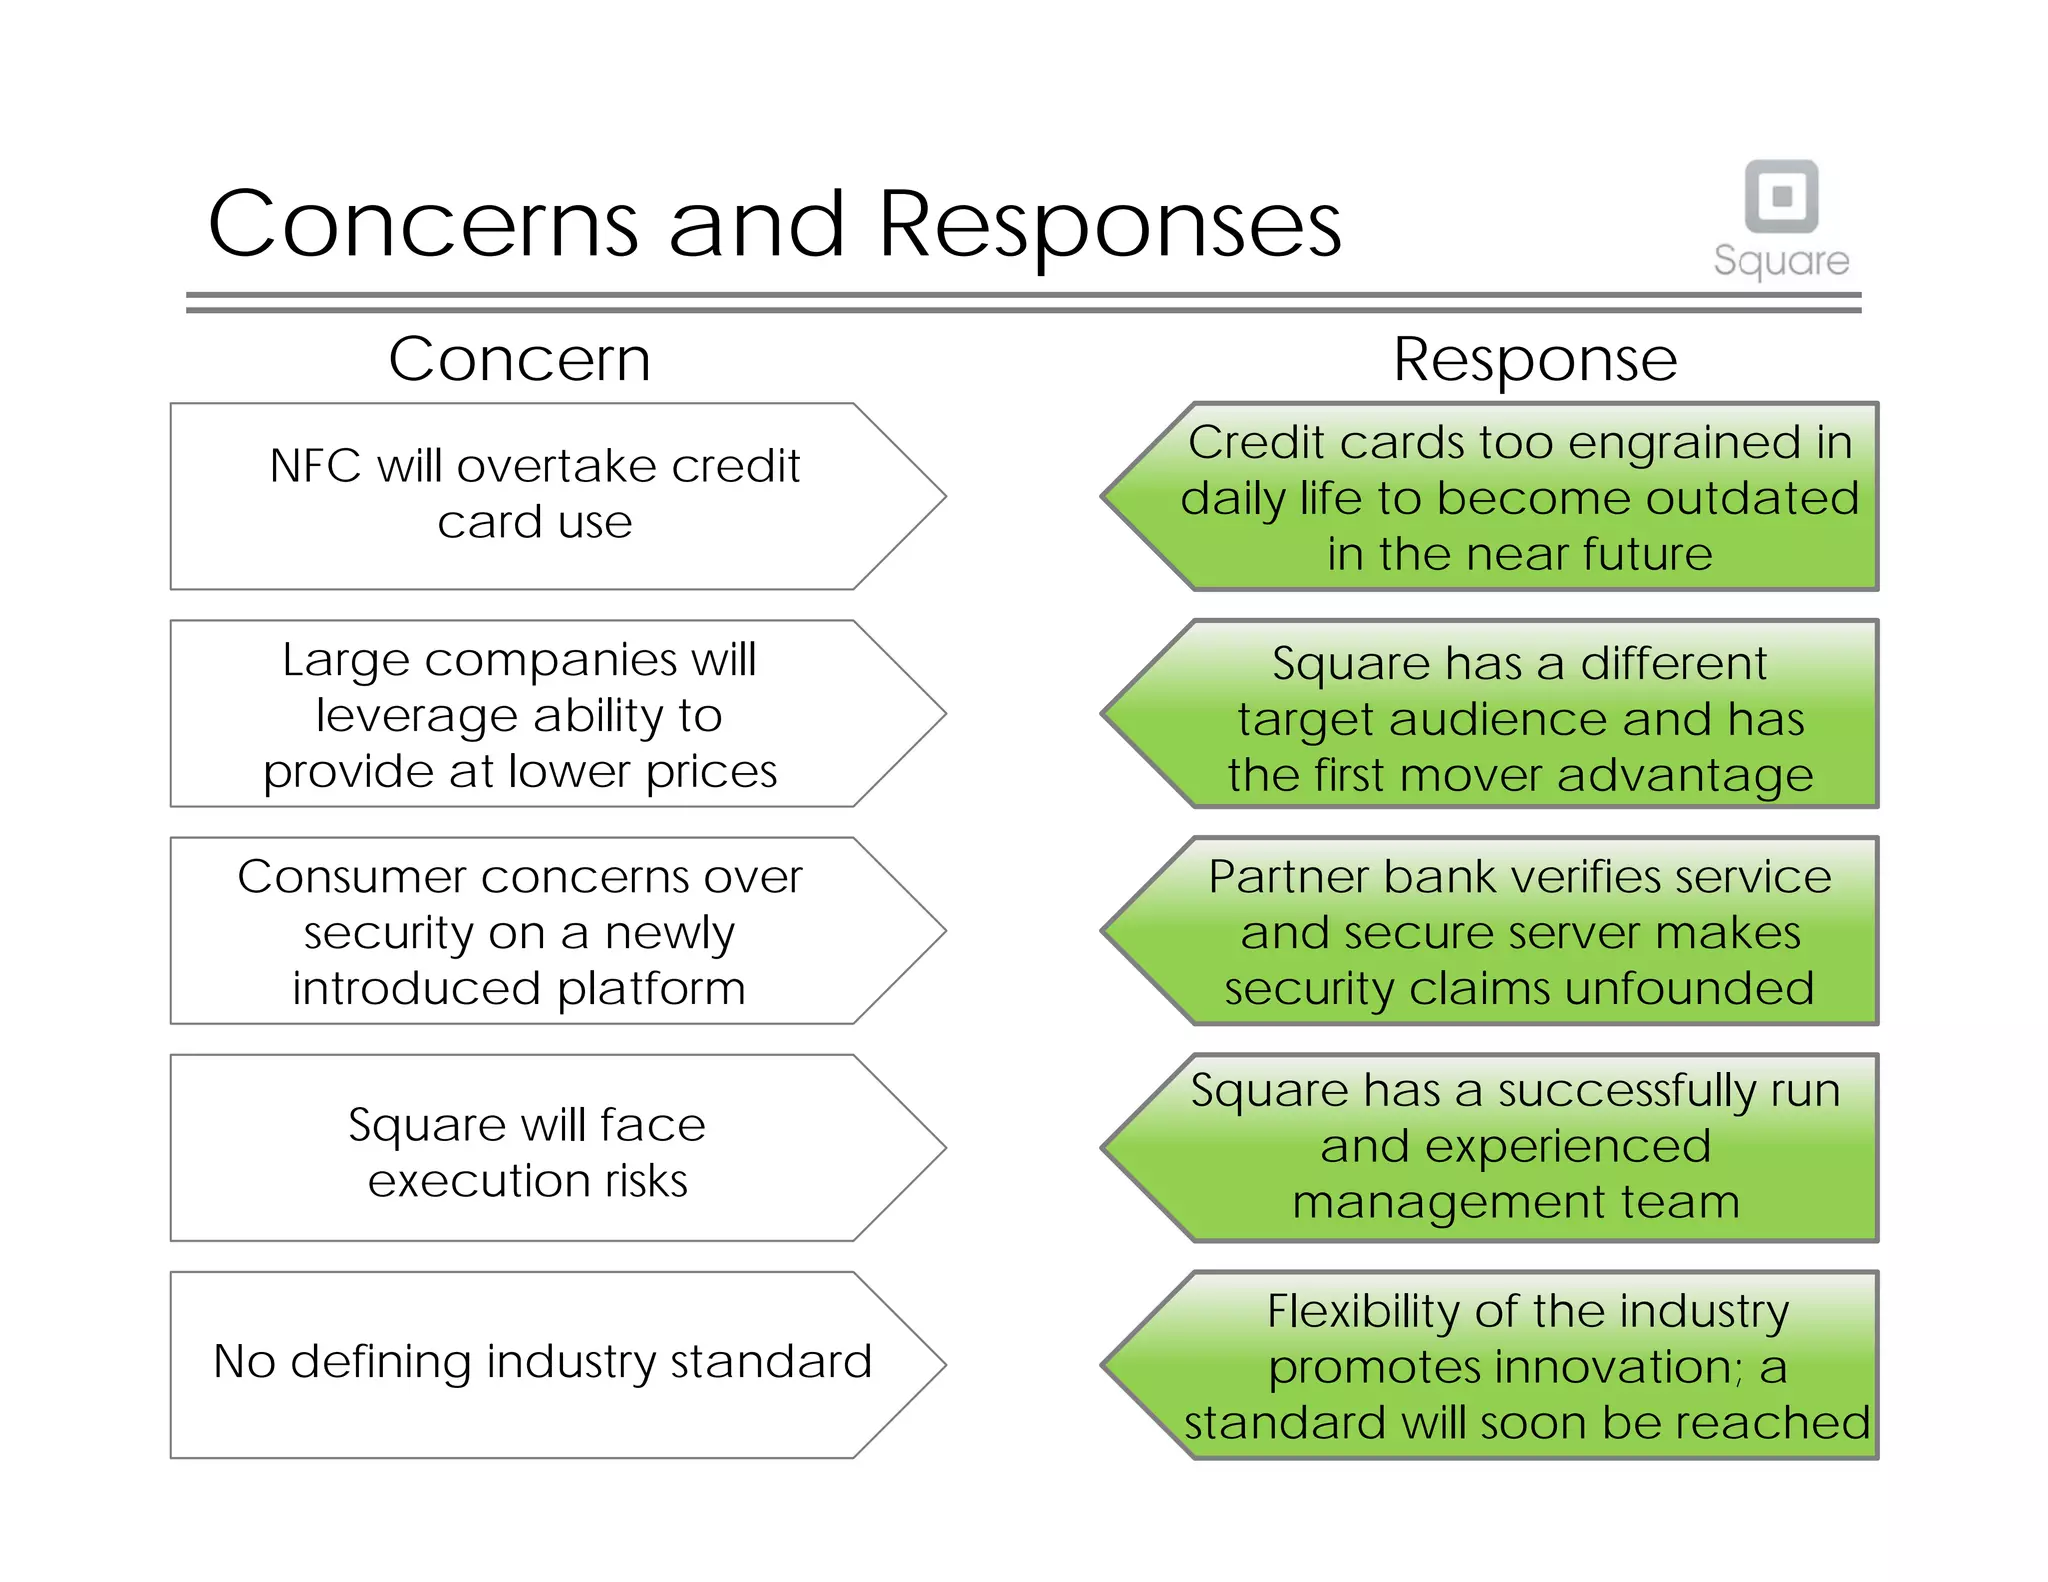
  • Near Field Communications (NFC) from Apple and Google
  • Built-in hardware for phones
  • Potentially eliminate credit card use
  • Cross-interaction with other phone apps

Square’s Response to NFC (Slide 8):

  • POS experience advantage
  • Compatible across differing hardware
  • Unique market focus (SMB)
  • Can integrate NFC technology

Competitive Positioning Summary (Slide 20):

  • First-mover advantage with few comparable competitors
  • Currently underfunded relative to market opportunity
  • Large competitors (Google, Apple) “not focused enough to drive Square out of its niche market”
  • Small competitors (VeriFone, Intuit) lack first-mover advantage

Critical Assessment:
The deck overstates competitive advantages. While first-mover status is real, the claim of “few comparable competitors” contradicts earlier acknowledgment of GoPayment and PAYware. The dismissal of Google and Apple as non-threats is speculative and proved partially incorrect (Apple Pay launched 2014, Google Wallet 2011).

Team

Core Management Team (Slide 3):

Name Title Background
Jack Dorsey Co-Founder, CEO Co-Founder & Chairman of Twitter; Advisor at Ustream
Keith Rabois COO VP Strategy & Business Development at Slide; VP Business Development at LinkedIn; EVP Business Development & Policy at PayPal
Bob Lee CTO Founder of Twubble; Software Engineer at Google
Jim McKelvey Co-Founder Owner at Mira; Co-founder at Third Degree Glass Factory

Advisory Board (Slide 3):

  • Gideon Yu (likely Sequoia partner, though not stated)
  • Roelof Botha (Sequoia partner, not explicitly identified)
  • Ryan Gilbert
  • Alyssa Milano (celebrity/brand value)
  • Greg Kidd
  • Andrew Rasiej

Team Strengths:

  • Jack Dorsey: Massive credibility as Twitter co-founder; proven ability to build billion-dollar companies; deep network in tech/media
  • Keith Rabois: Extensive experience at PayPal (payments expertise), LinkedIn (scaling), Slide (mobile); known as strong operator
  • Bob Lee: Deep technical expertise from Google; founder experience with Twubble
  • Jim McKelvey: Domain expertise in hardware/manufacturing (Mira, Third Degree Glass Factory)
  • Advisory board: Sequoia partnership (Roelof Botha) provides institutional validation

Team Credibility Assessment:
This is one of the deck’s strongest elements. The combination of Dorsey’s brand, Rabois’s operational experience, Lee’s technical depth, and McKelvey’s hardware expertise creates a compelling management narrative. The Sequoia connection adds significant institutional credibility.

Go-to-Market Strategy

Customer Acquisition Approach (Slide 7):

Three Primary Channels:

  1. Selling Points
    • Easy, convenient everyday usage
    • No surprise fees
    • Adaptable across multiple devices
  2. Advertisement
    • Social media and internet advertising
    • Traditional media (max exposure/min cost)
    • Focus on cost-efficient reach
  3. Retail Distribution
    • Online registration via Apple stores
    • Physical retail presence in Apple stores
    • Follows “razor blade” retail model (free hardware, recurring revenue)

Acquisition Metrics (Slide 7):

  • Target: Acquiring 100,000+ customers per month
  • Model: Free card reader as acquisition tool (hardware as marketing)
  • Distribution: Apple retail partnership as primary channel

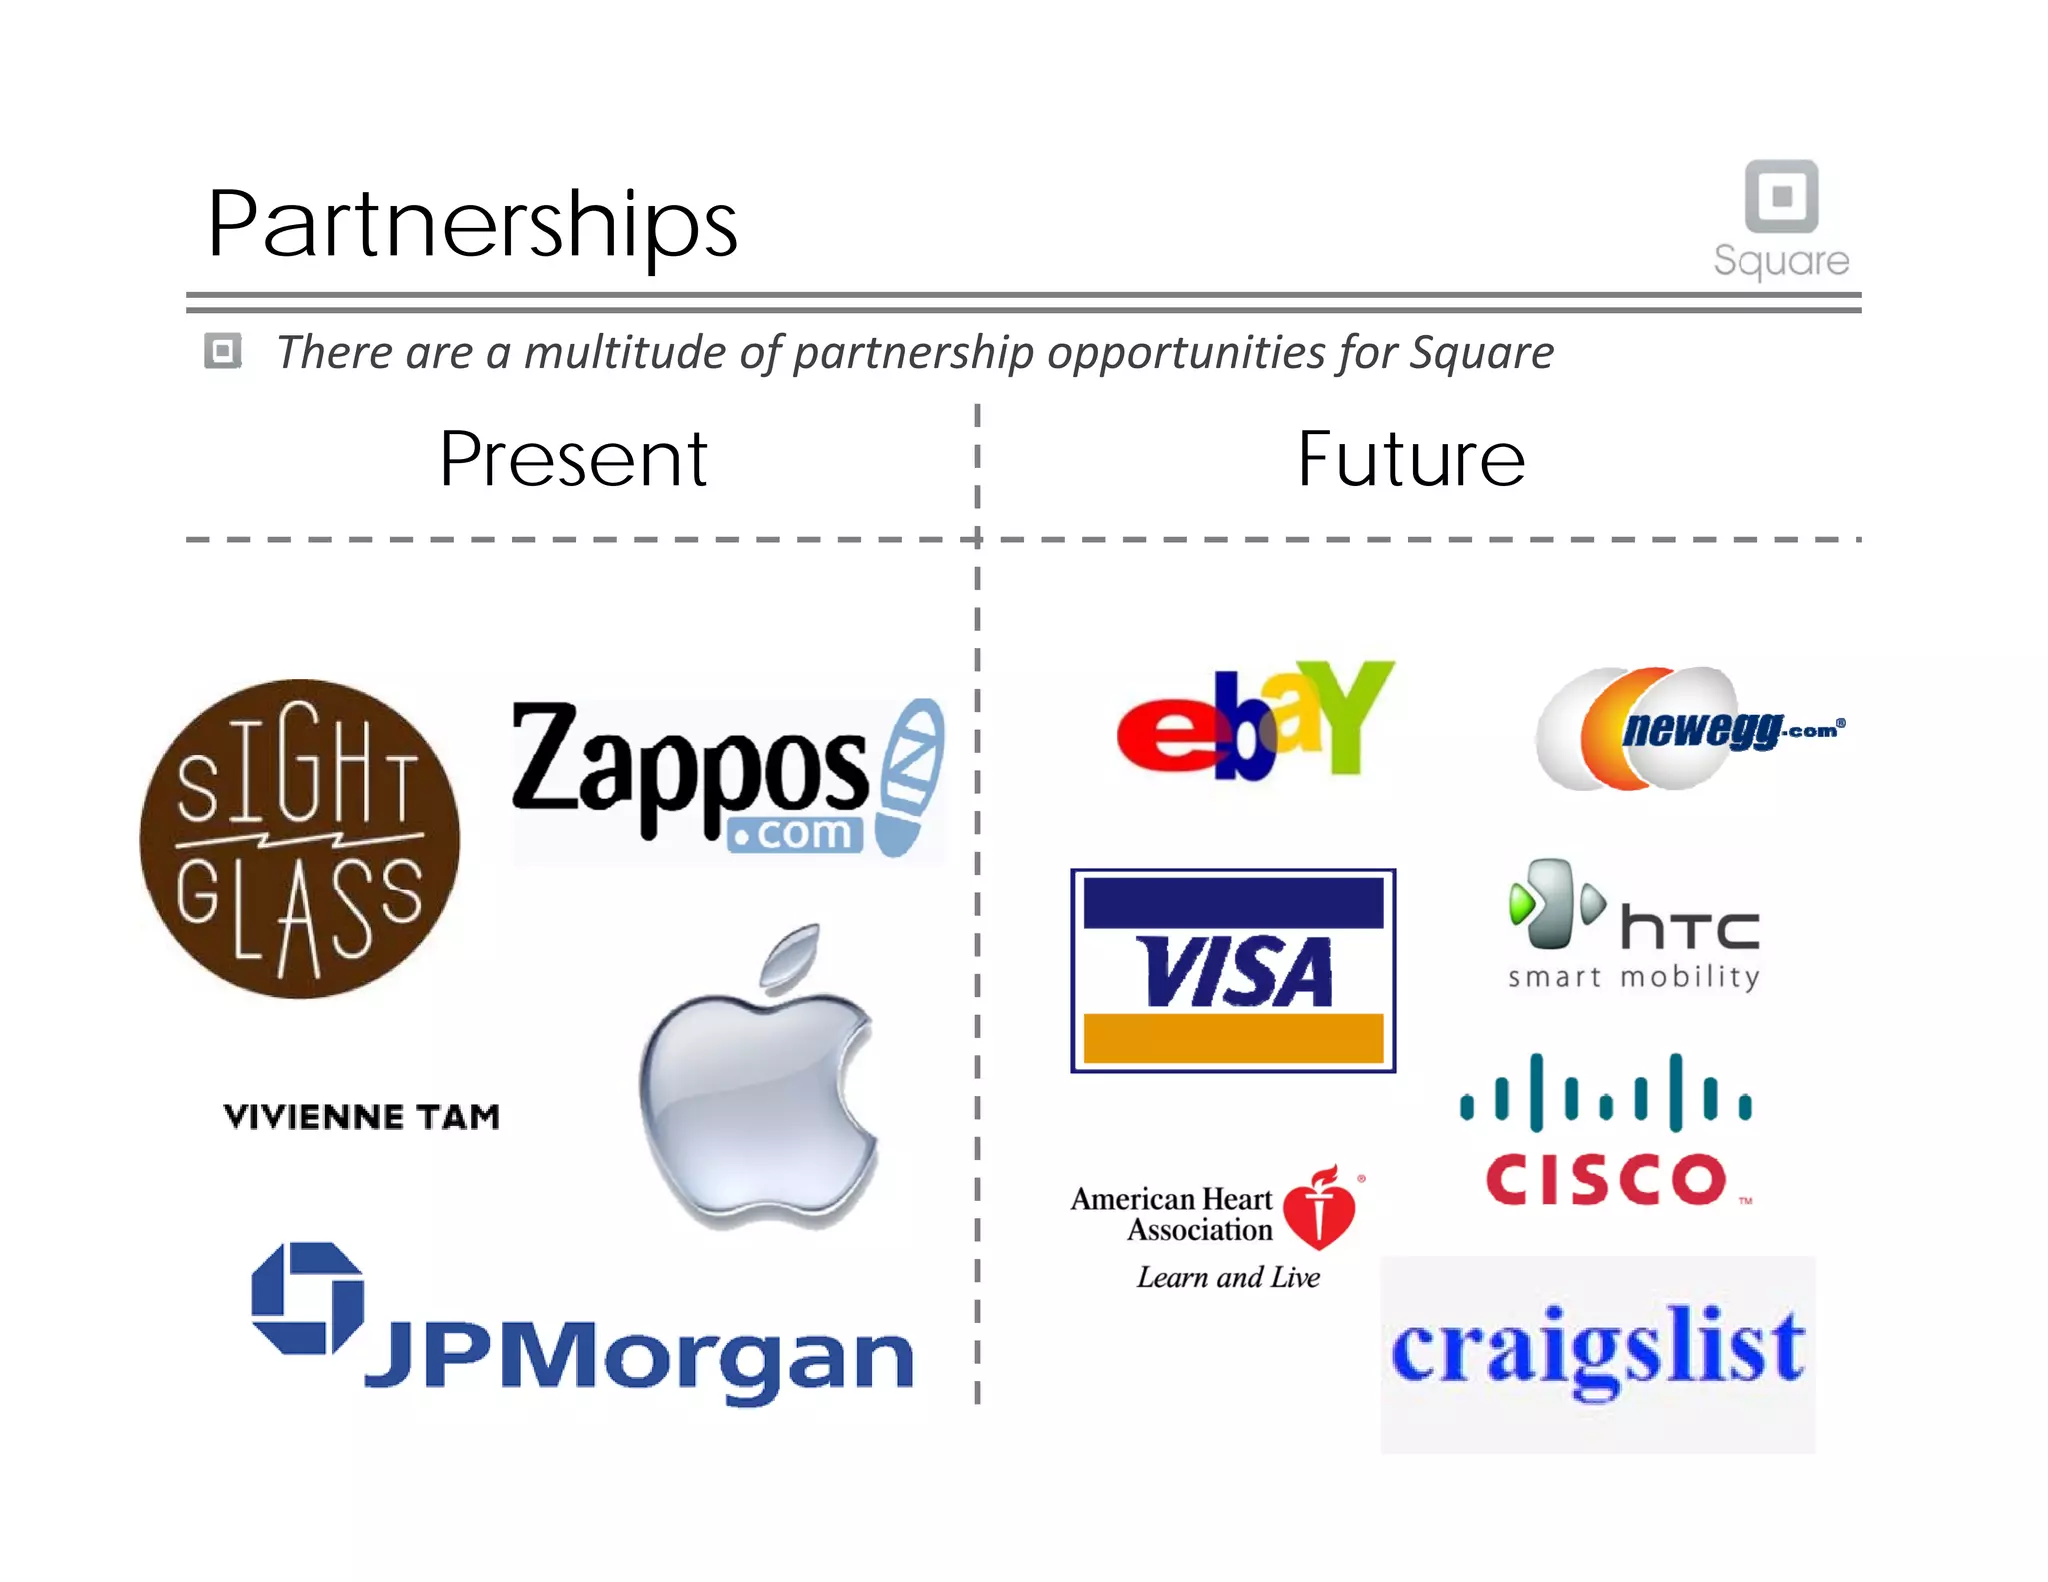
Partnership Strategy (Slide 18):

Present Partnerships:

  • Sight Glass (niche eyewear)
  • Zappos (e-commerce)
  • Apple (hardware/retail)
  • Vivienne Tam (fashion)
  • JPMorgan (financial institution)

Future Partnership Opportunities:

  • eBay (e-commerce marketplace)
  • Newegg (electronics retailer)
  • Visa (payment network)
  • HTC (hardware manufacturer)
  • American Heart Association (nonprofit)
  • Cisco (enterprise)
  • Craigslist (classifieds)

GTM Assessment:
The Apple retail strategy is clever—leveraging Apple’s brand and store traffic to reach tech-savvy merchants. However, the deck doesn’t explain how Square will maintain 100k/month acquisition rates long-term or what the actual CAC is. Partnership depth is vague; some partnerships (Vivienne Tam, Sight Glass) seem more marketing than strategic.

The Ask

Funding Round (Slide 10):

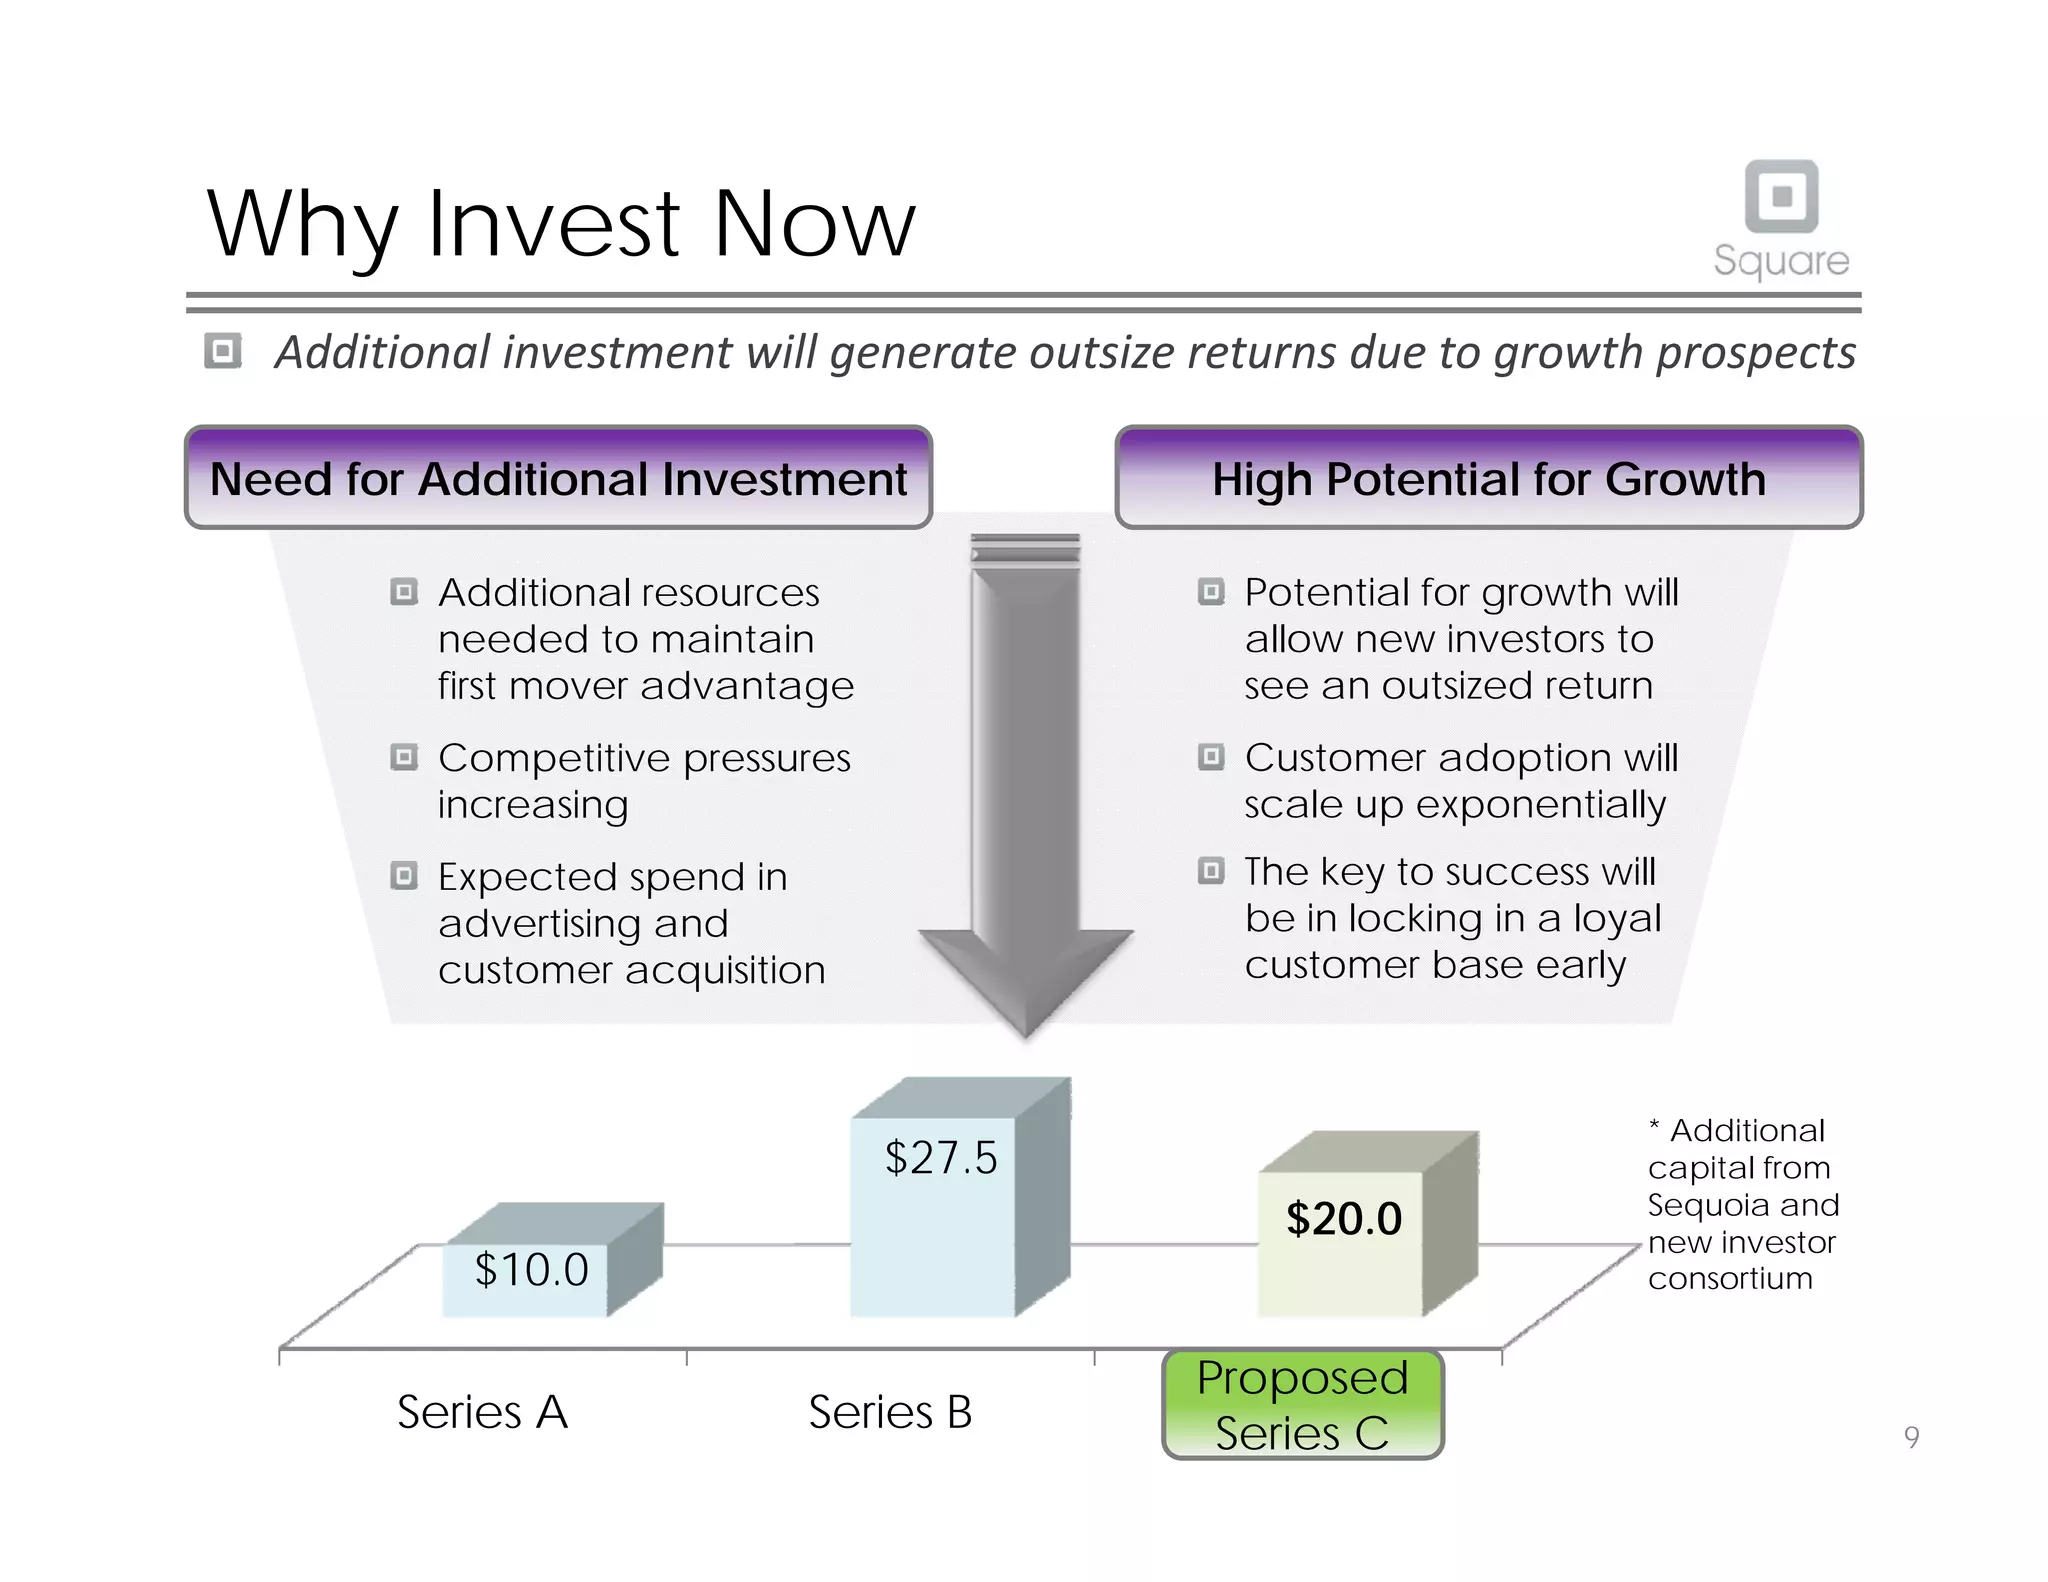
Round Amount Date Valuation
Series A $10.0M December 2009 $40M post-money
Series B $27.5M January 2011 $240M post-money
Series C (Proposed) $20.0M 2010 TBD

Total Capital Raised (A + B): $37.5M
Proposed Total (A + B + C): $57.5M

Use of Funds (Slide 10 - Implied):
The deck states capital is needed to:

  • Maintain first-mover advantage
  • Respond to competitive pressures
  • Fund advertising and customer acquisition
  • Scale operations

Specific use breakdown not provided.

Investment Terms (Slide 10):

  • Proposed stake: 20% (for $20M investment)
  • Implied post-money valuation: $100M (if 20% = $20M)
  • Existing investors: Sequoia (Series B), new investor consortium (Series C)

Return Expectations (Slide 9, 14):

  • NPV @ 15% hurdle rate: $79.95M
  • IRR: 55%
  • Exit valuation (2015): $238.12M (2.5x revenue multiple)
  • Equity stake return: $79.95M NPV on $20M investment = 4x return

Investor Deep Dive

Executive summary, strengths & red flags

Executive Summary

Square's 2010 pitch deck presents a mobile payments solution targeting small businesses with a simple, low-friction alternative to traditional card processing. Leveraging Jack Dorsey's credibility as Twitter co-founder, the deck demonstrates early product-market fit (100,000 merchants signing up monthly, $1M in daily payments) and projects aggressive growth to $476M revenue by 2015E with a 55% IRR. The pitch is notable for its combination of compelling market timing (68% CAGR in mobile payments), concrete traction metrics, detailed financial modeling with scenario analysis, and proactive risk management—though it also exhibits aggressive growth assumptions and potentially overstated competitive advantages that warrant scrutiny.

Key Strengths

7 identified

1

Exceptional Team Credibility

Jack Dorsey as CEO is a massive validation signal. His success at Twitter (founded 2006, already a major platform by 2010) immediately establishes credibility. Keith Rabois's experience at PayPal (...

2

Clear, Compelling Product-Market Fit Signals

The deck provides concrete traction metrics:

3

Massive, Growing Market Opportunity

The 68% CAGR in mobile payments (2010-2014) and $16B → $214B market growth provides compelling TAM expansion. The market is nascent, growing rapidly, and underpenetrated—classic venture conditions.

4

Detailed Financial Modeling with Scenario Analysis

The deck provides:

5

Simple, Differentiated Value Proposition

2.75% flat fee vs. 5% + 30¢ (traditional) or 3.5% + 30¢ (online) is a clear, quantifiable advantage. Free hardware removes adoption friction. No monthly fees or credit checks simplify the merchant ...

6

Proactive Risk Management

Slide 17 acknowledges five key investor concerns and provides responses:

7

Multiple Exit Paths

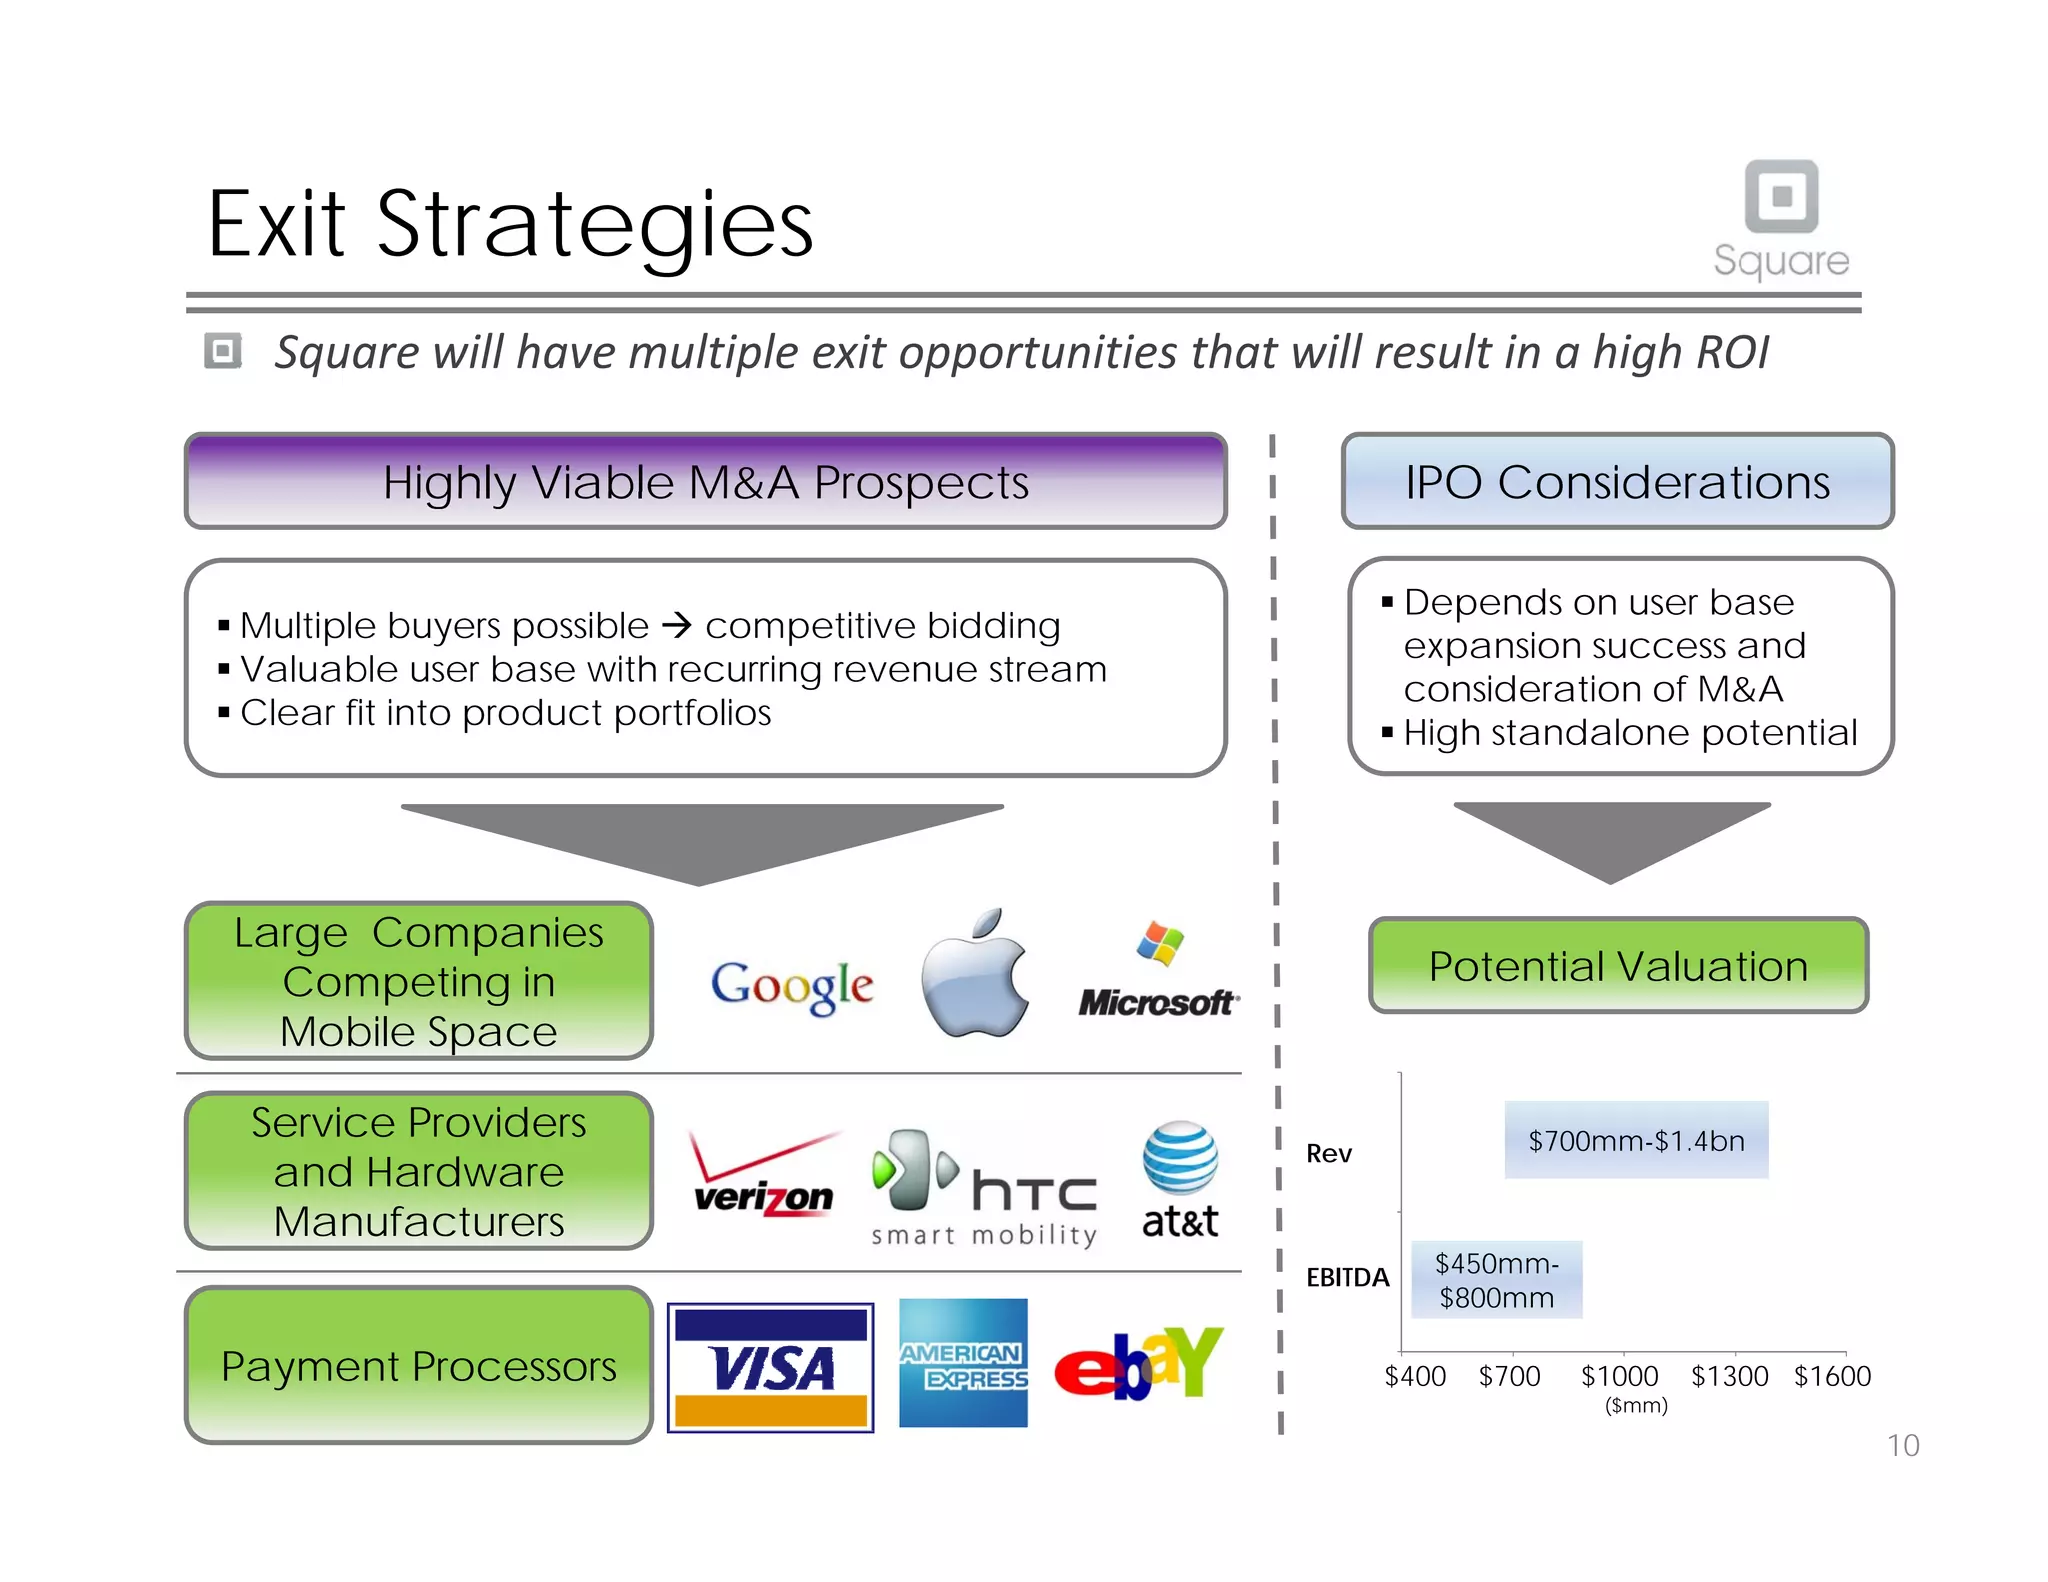
The deck identifies three categories of potential acquirers:

More Pitch Decks To Study

Compare structure, fundraising context, and investor-facing story across similar startup decks.