Compare your deck to LinkedIn

Compare Your Deck

LinkedIn Pitch Deck (2004)

Social
Stage: Series B
Raised: $10M
Year: 2004
Slides: 28
Outcome: Acquired by Microsoft for $26.2B

Pitch Deck

1 / 28
LinkedIn pitch deck slide 1
Click to expand

Deck Analysis

This Series B pitch deck from LinkedIn (August 2004) frames the company as 'Professional People Search 2.0' — a network-driven marketplace that leverages verified relationships to create trust and derive revenue. Notable for its clean narrative arc, the deck uses analogies to eBay, PayPal and Google to explain how network effects enable better product outcomes and monetization, then follows with traction, competitive positioning, and a pragmatic three-pronged revenue plan. It's an early example of a product-led, network-effect-first fundraising story that later scaled into one of the largest tech exits in history.

Value proposition: Professional People Search 2.0

Value proposition: Professional People Search 2.0

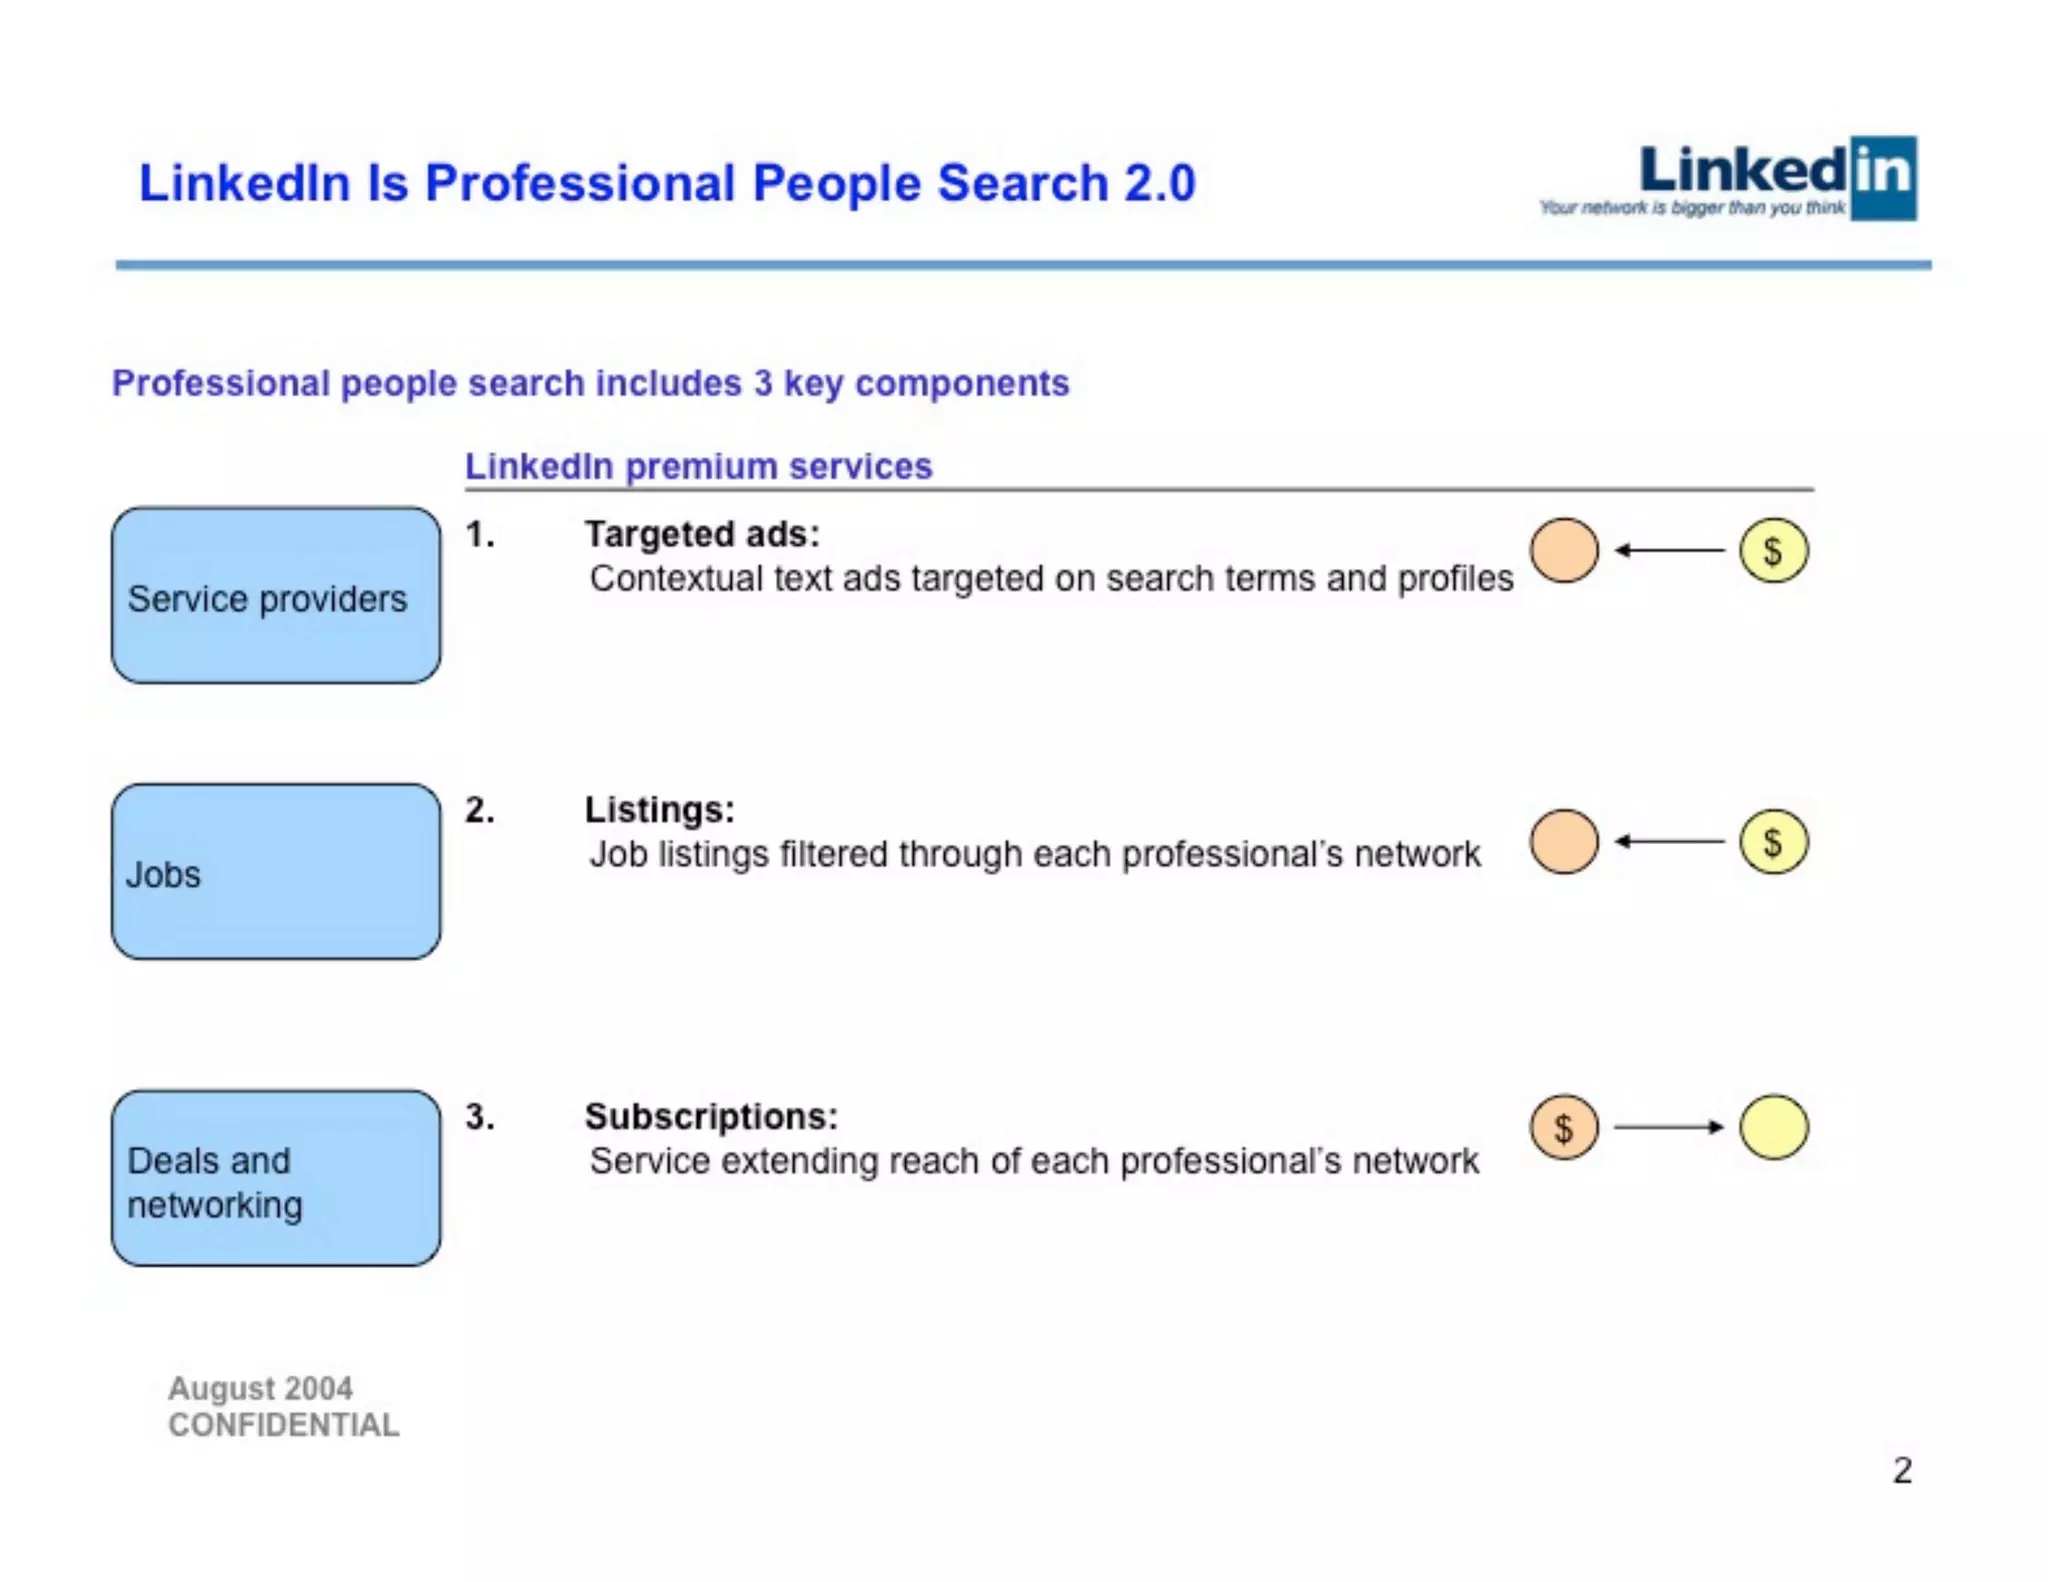
Slide 2 succinctly defines LinkedIn's product thesis: transform people search by using professional networks rather than flat directories. The slide is effective because it states the three revenue levers (targeted ads, job listings, subscriptions) while anchoring them to user value categories (service providers, jobs, deals and networking) — tying monetization directly to product utility.

Founders can learn from the clarity here: begin with the customer problem, show how your product uniquely solves it, and then map each major monetization channel to the user experience it extends. That reduces investor suspense and shows you understand both product and business model alignment.

Key Takeaway: Lead with a clear product thesis that ties each revenue stream to explicit user value.
Why networks beat flat directories

Why networks beat flat directories

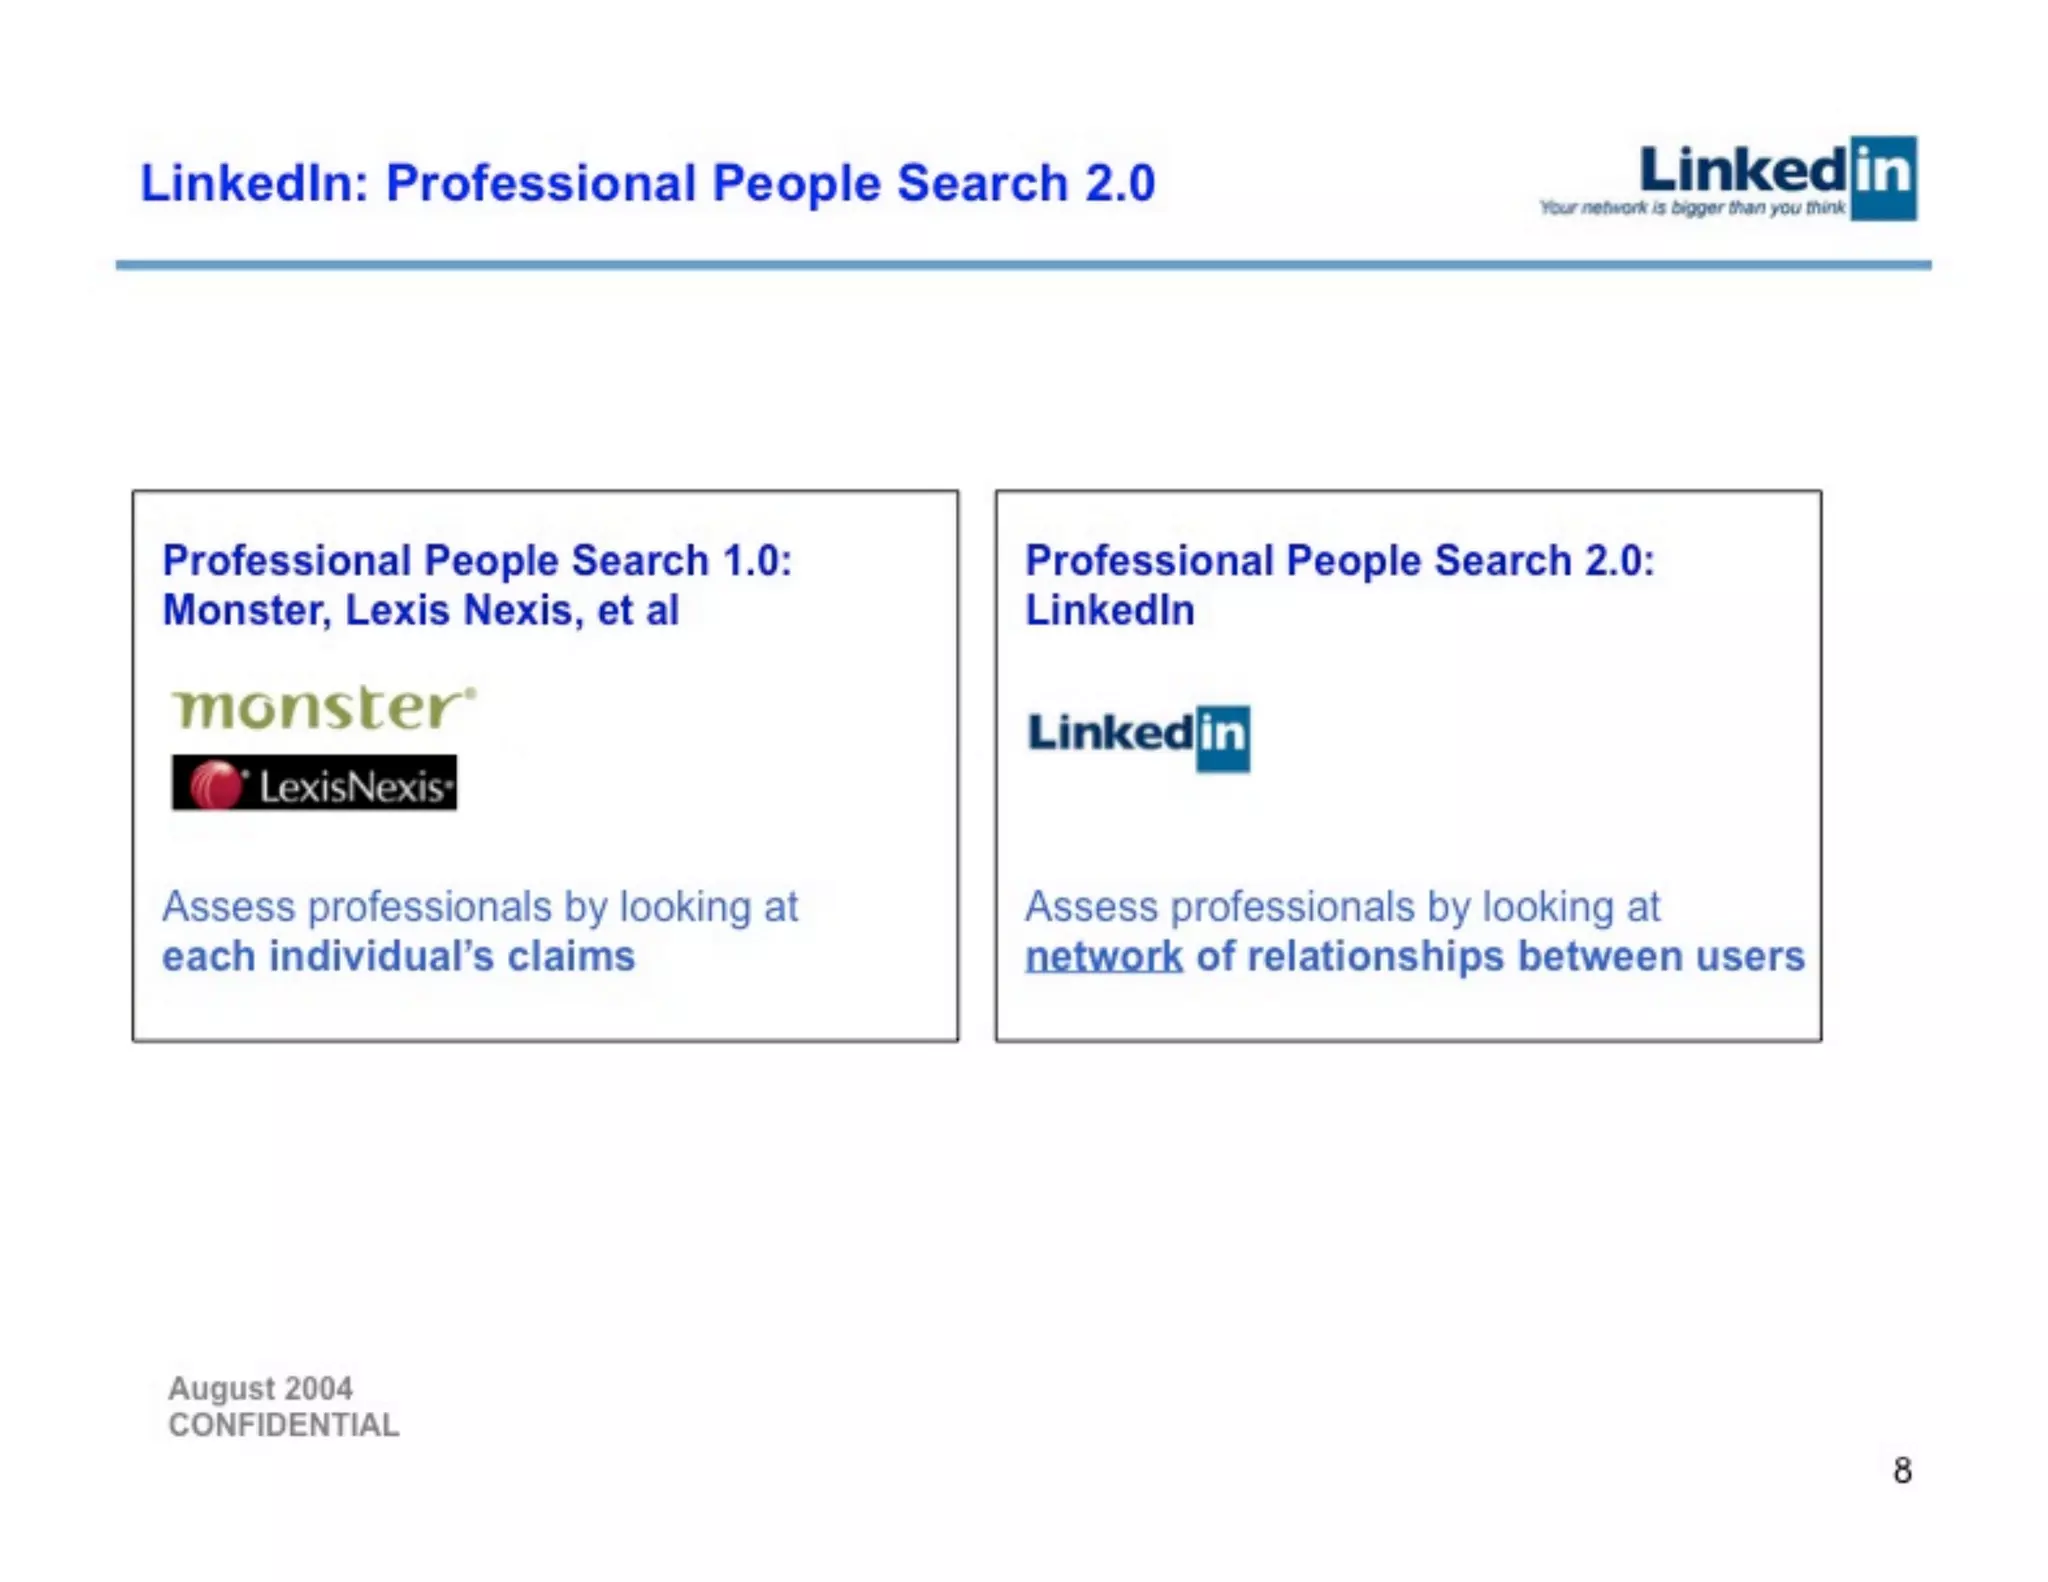
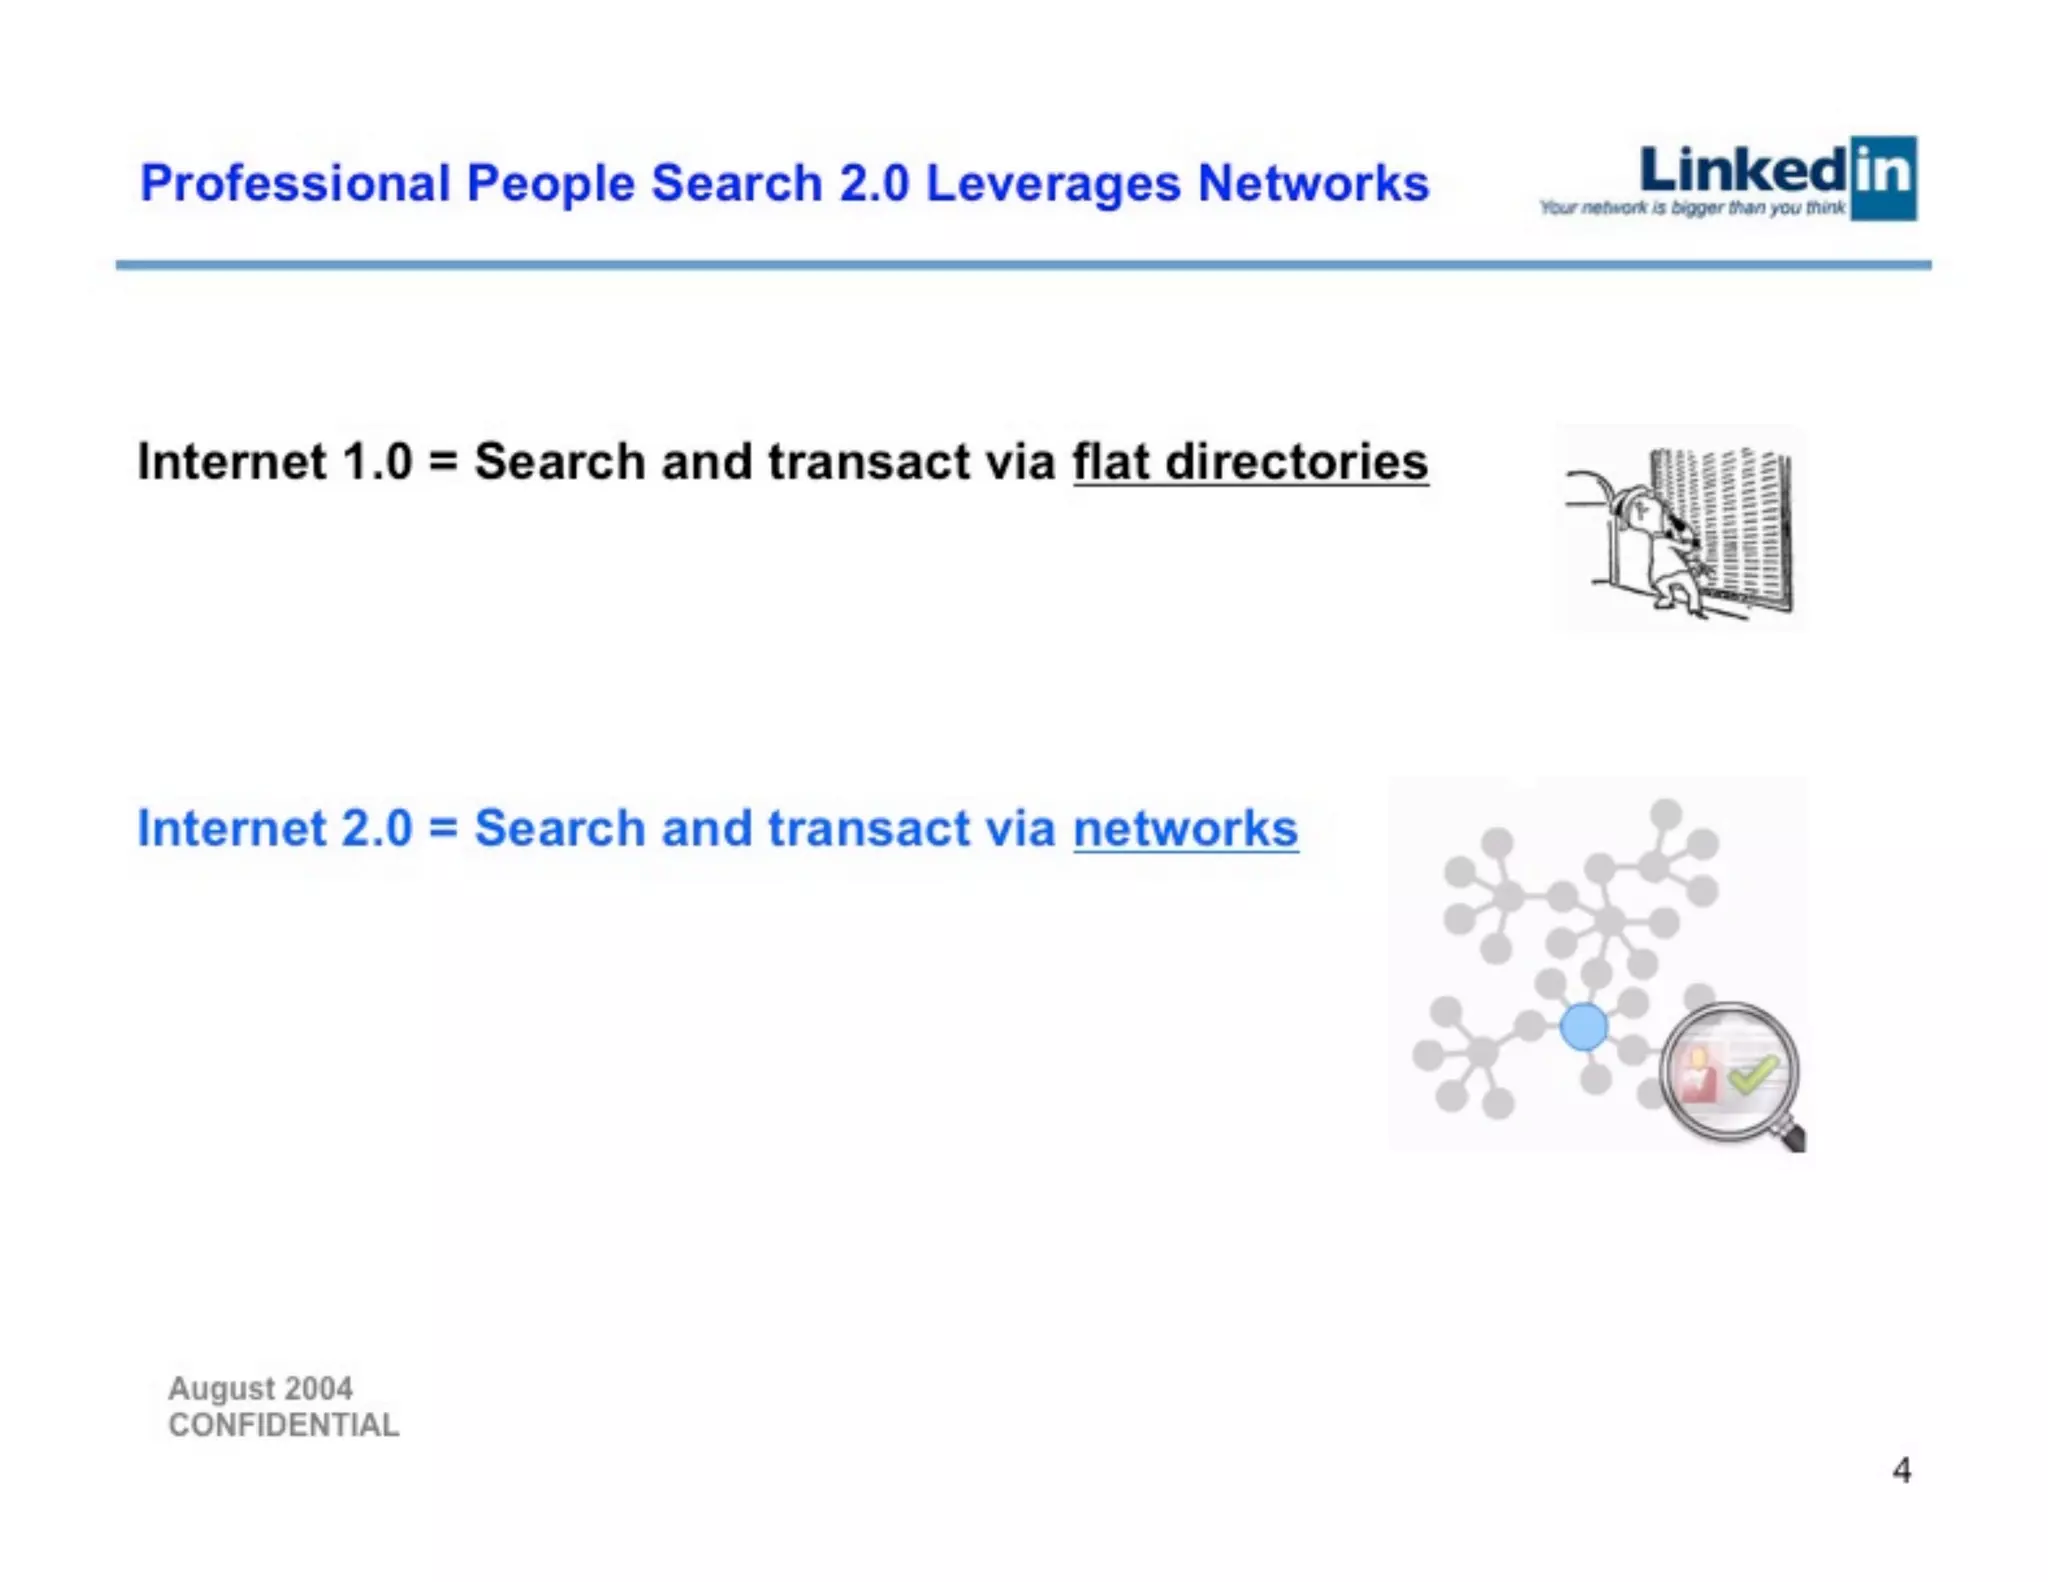
Slide 4 contrasts Internet 1.0 (flat directories) with Internet 2.0 (networks) and uses simple imagery to make the conceptual leap intuitive. The idea — that relationships provide verification, context, and reach that isolated records cannot — is both the product insight and the defensibility argument. Framing the business as a platform improvement rather than just another directory reframes market dynamics in LinkedIn's favor.

For founders, this slide demonstrates the power of a one-slide conceptual pivot: show the old paradigm, show the new paradigm, and make clear why the new one scales and locks in value. It’s especially helpful when your advantage is network-driven or algorithmically amplified, because it concisely communicates why incumbents struggle to replicate your moat.

Key Takeaway: Use a single clear comparison to show how your product creates a structural advantage over legacy alternatives.
Analogies to proven '2.0' businesses (trust & network effects)

Analogies to proven '2.0' businesses (trust & network effects)

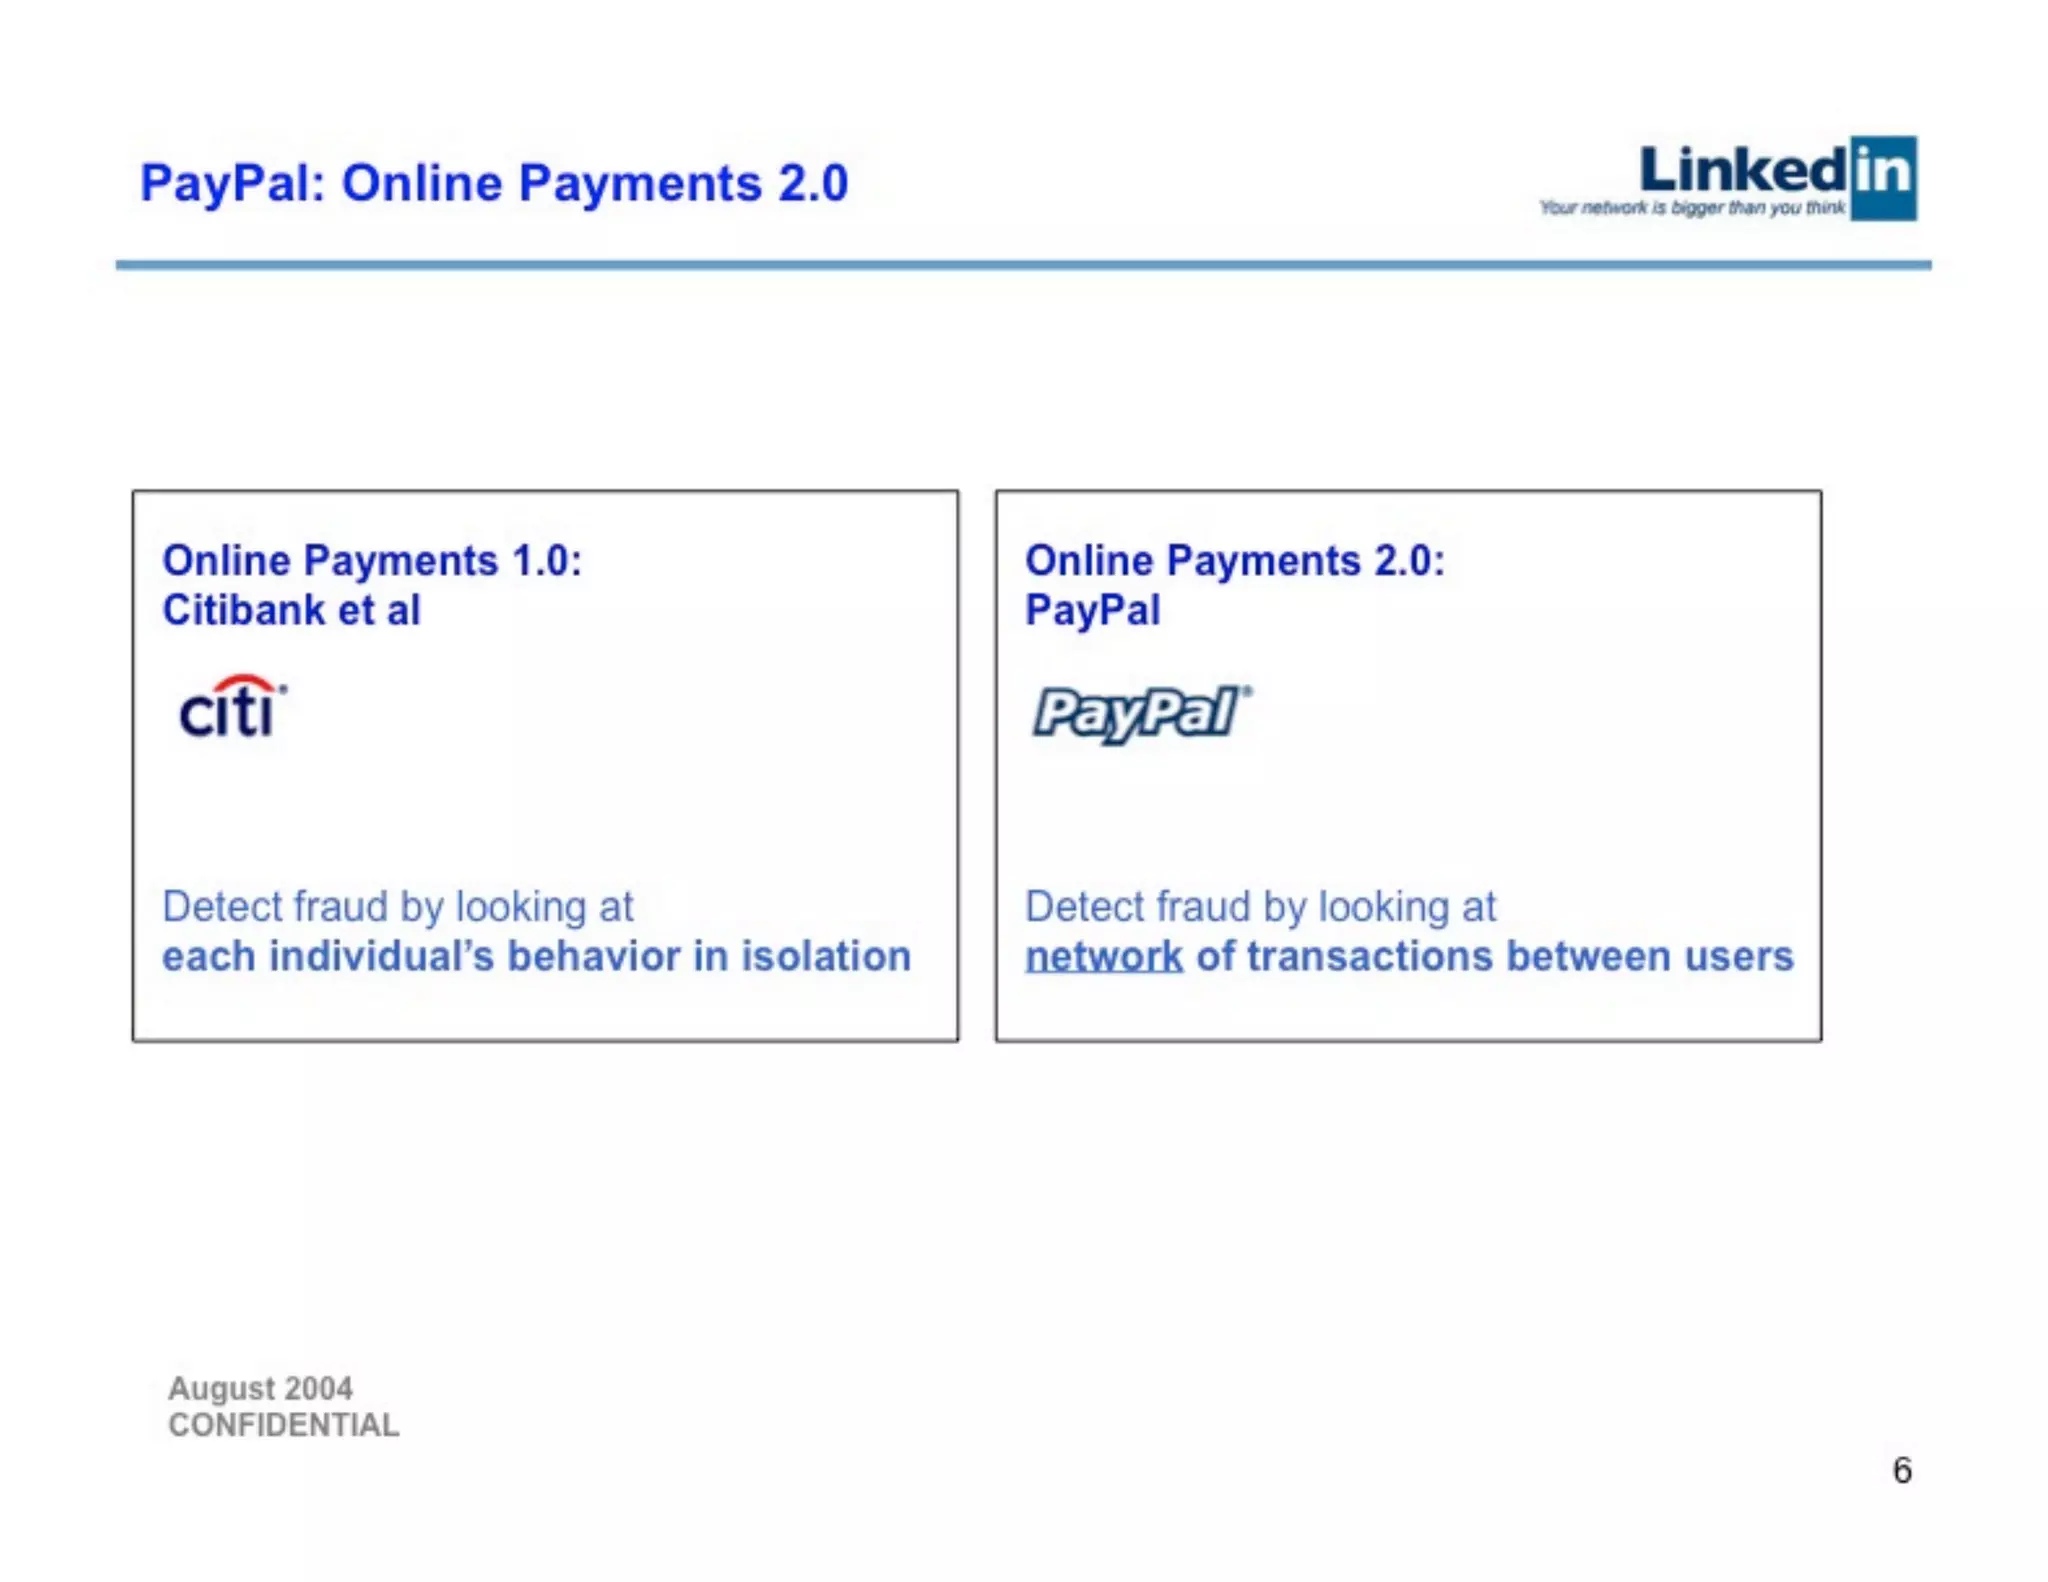
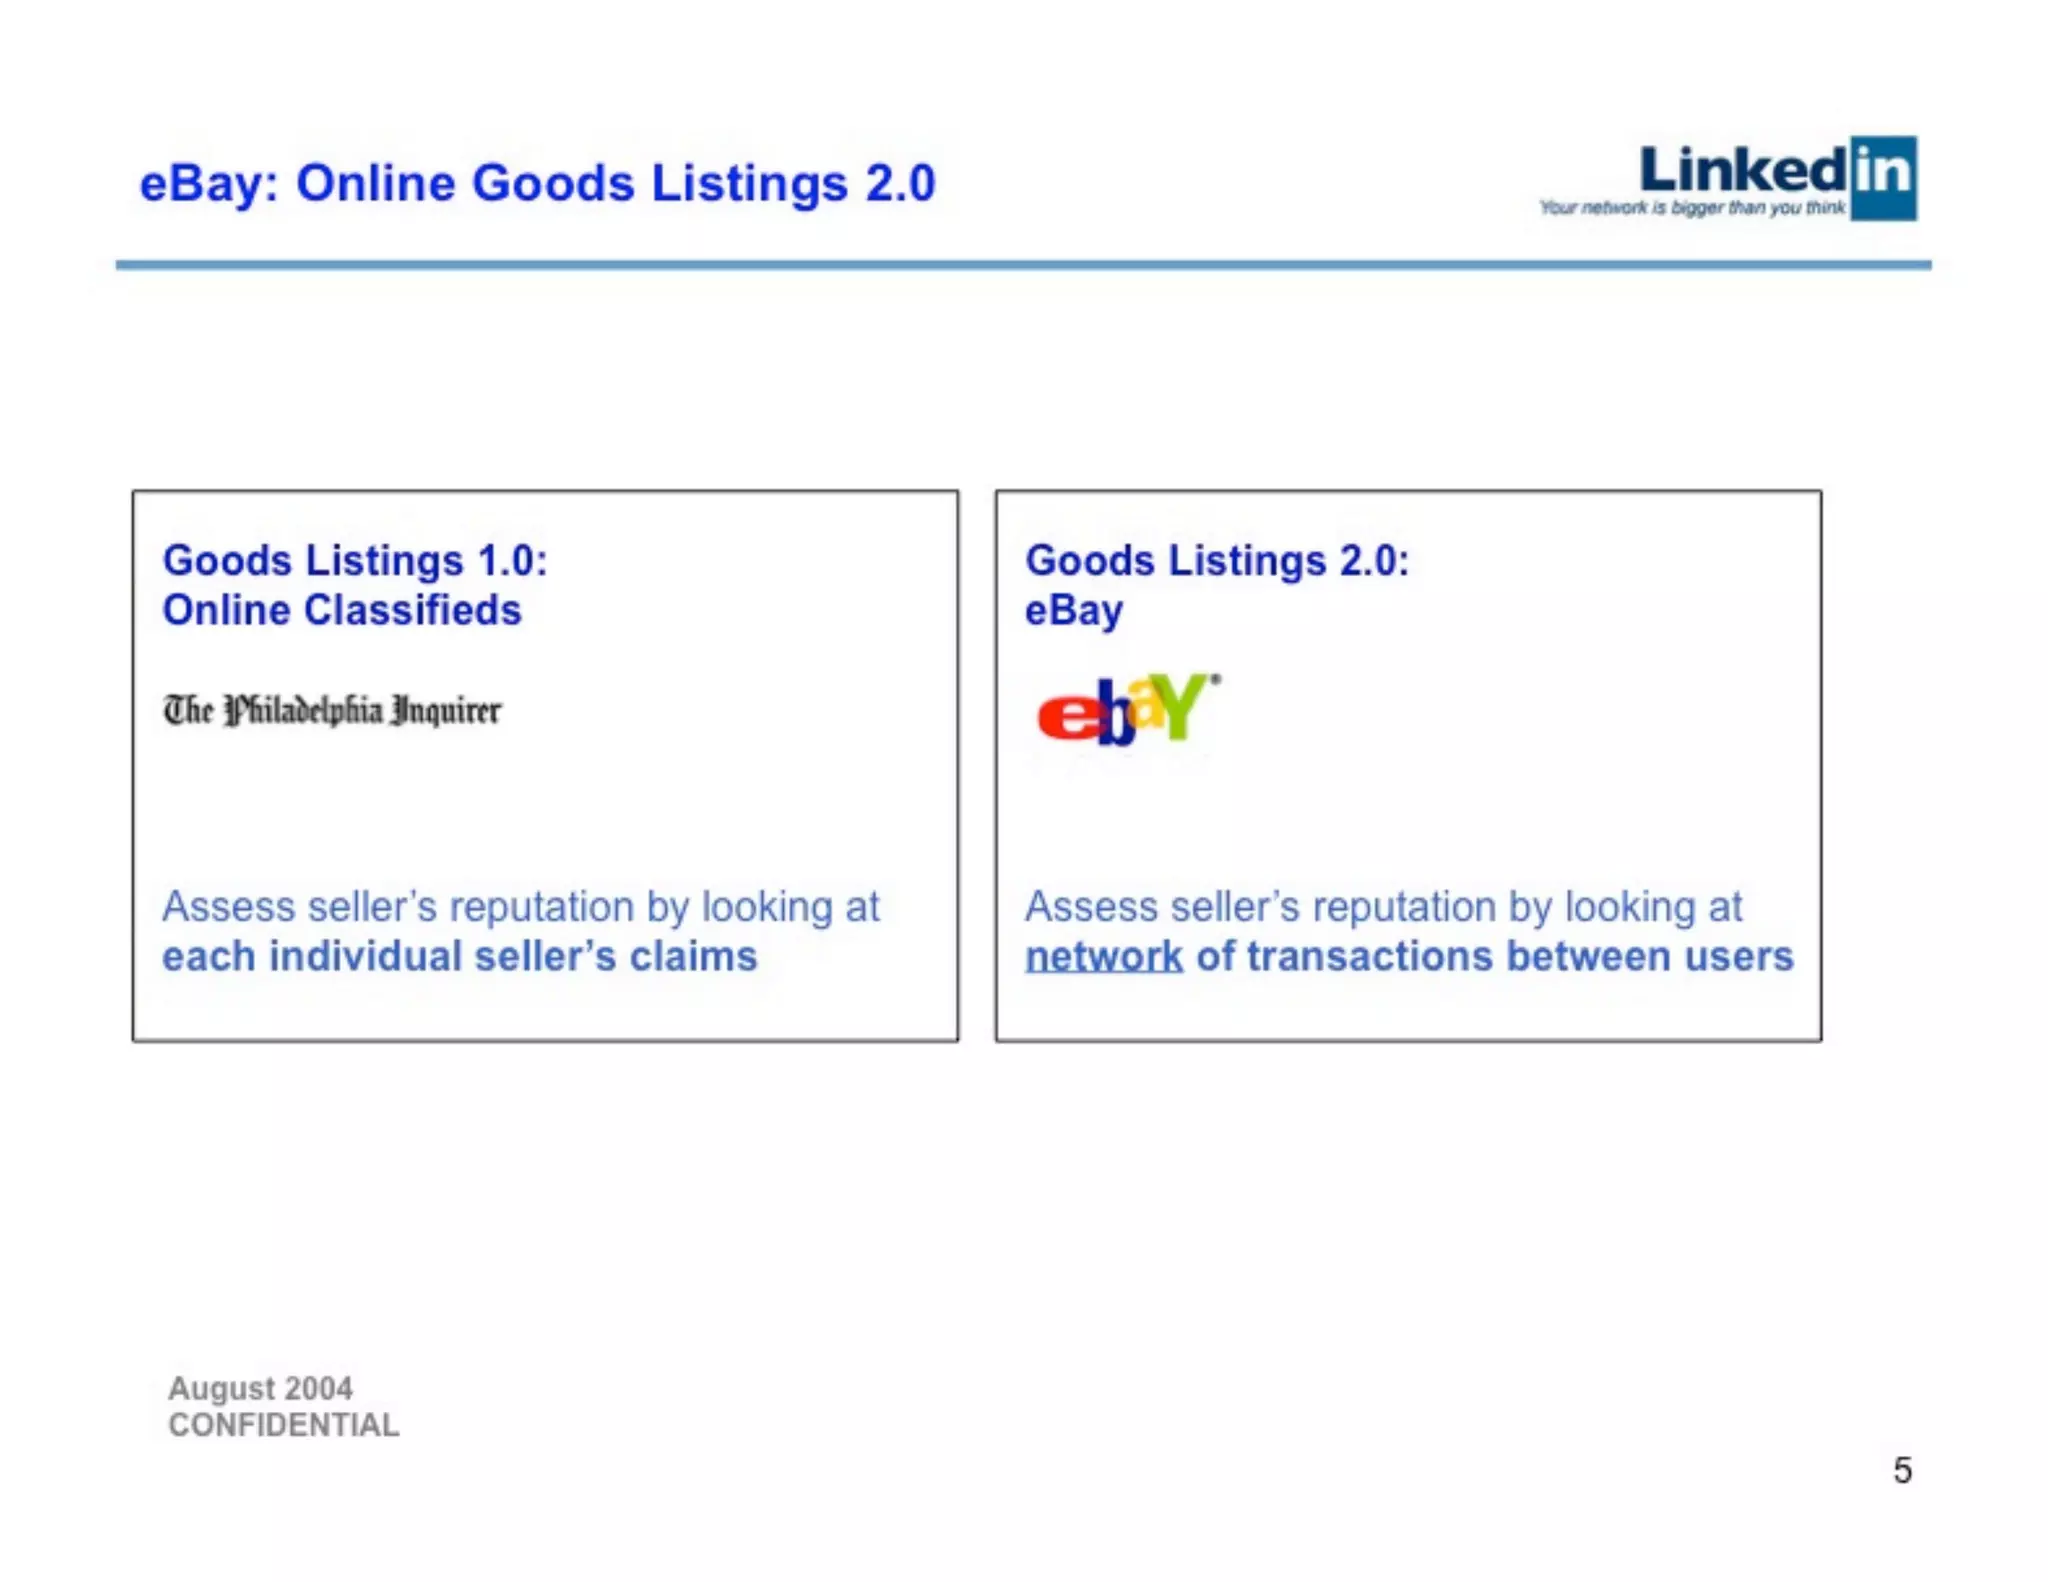
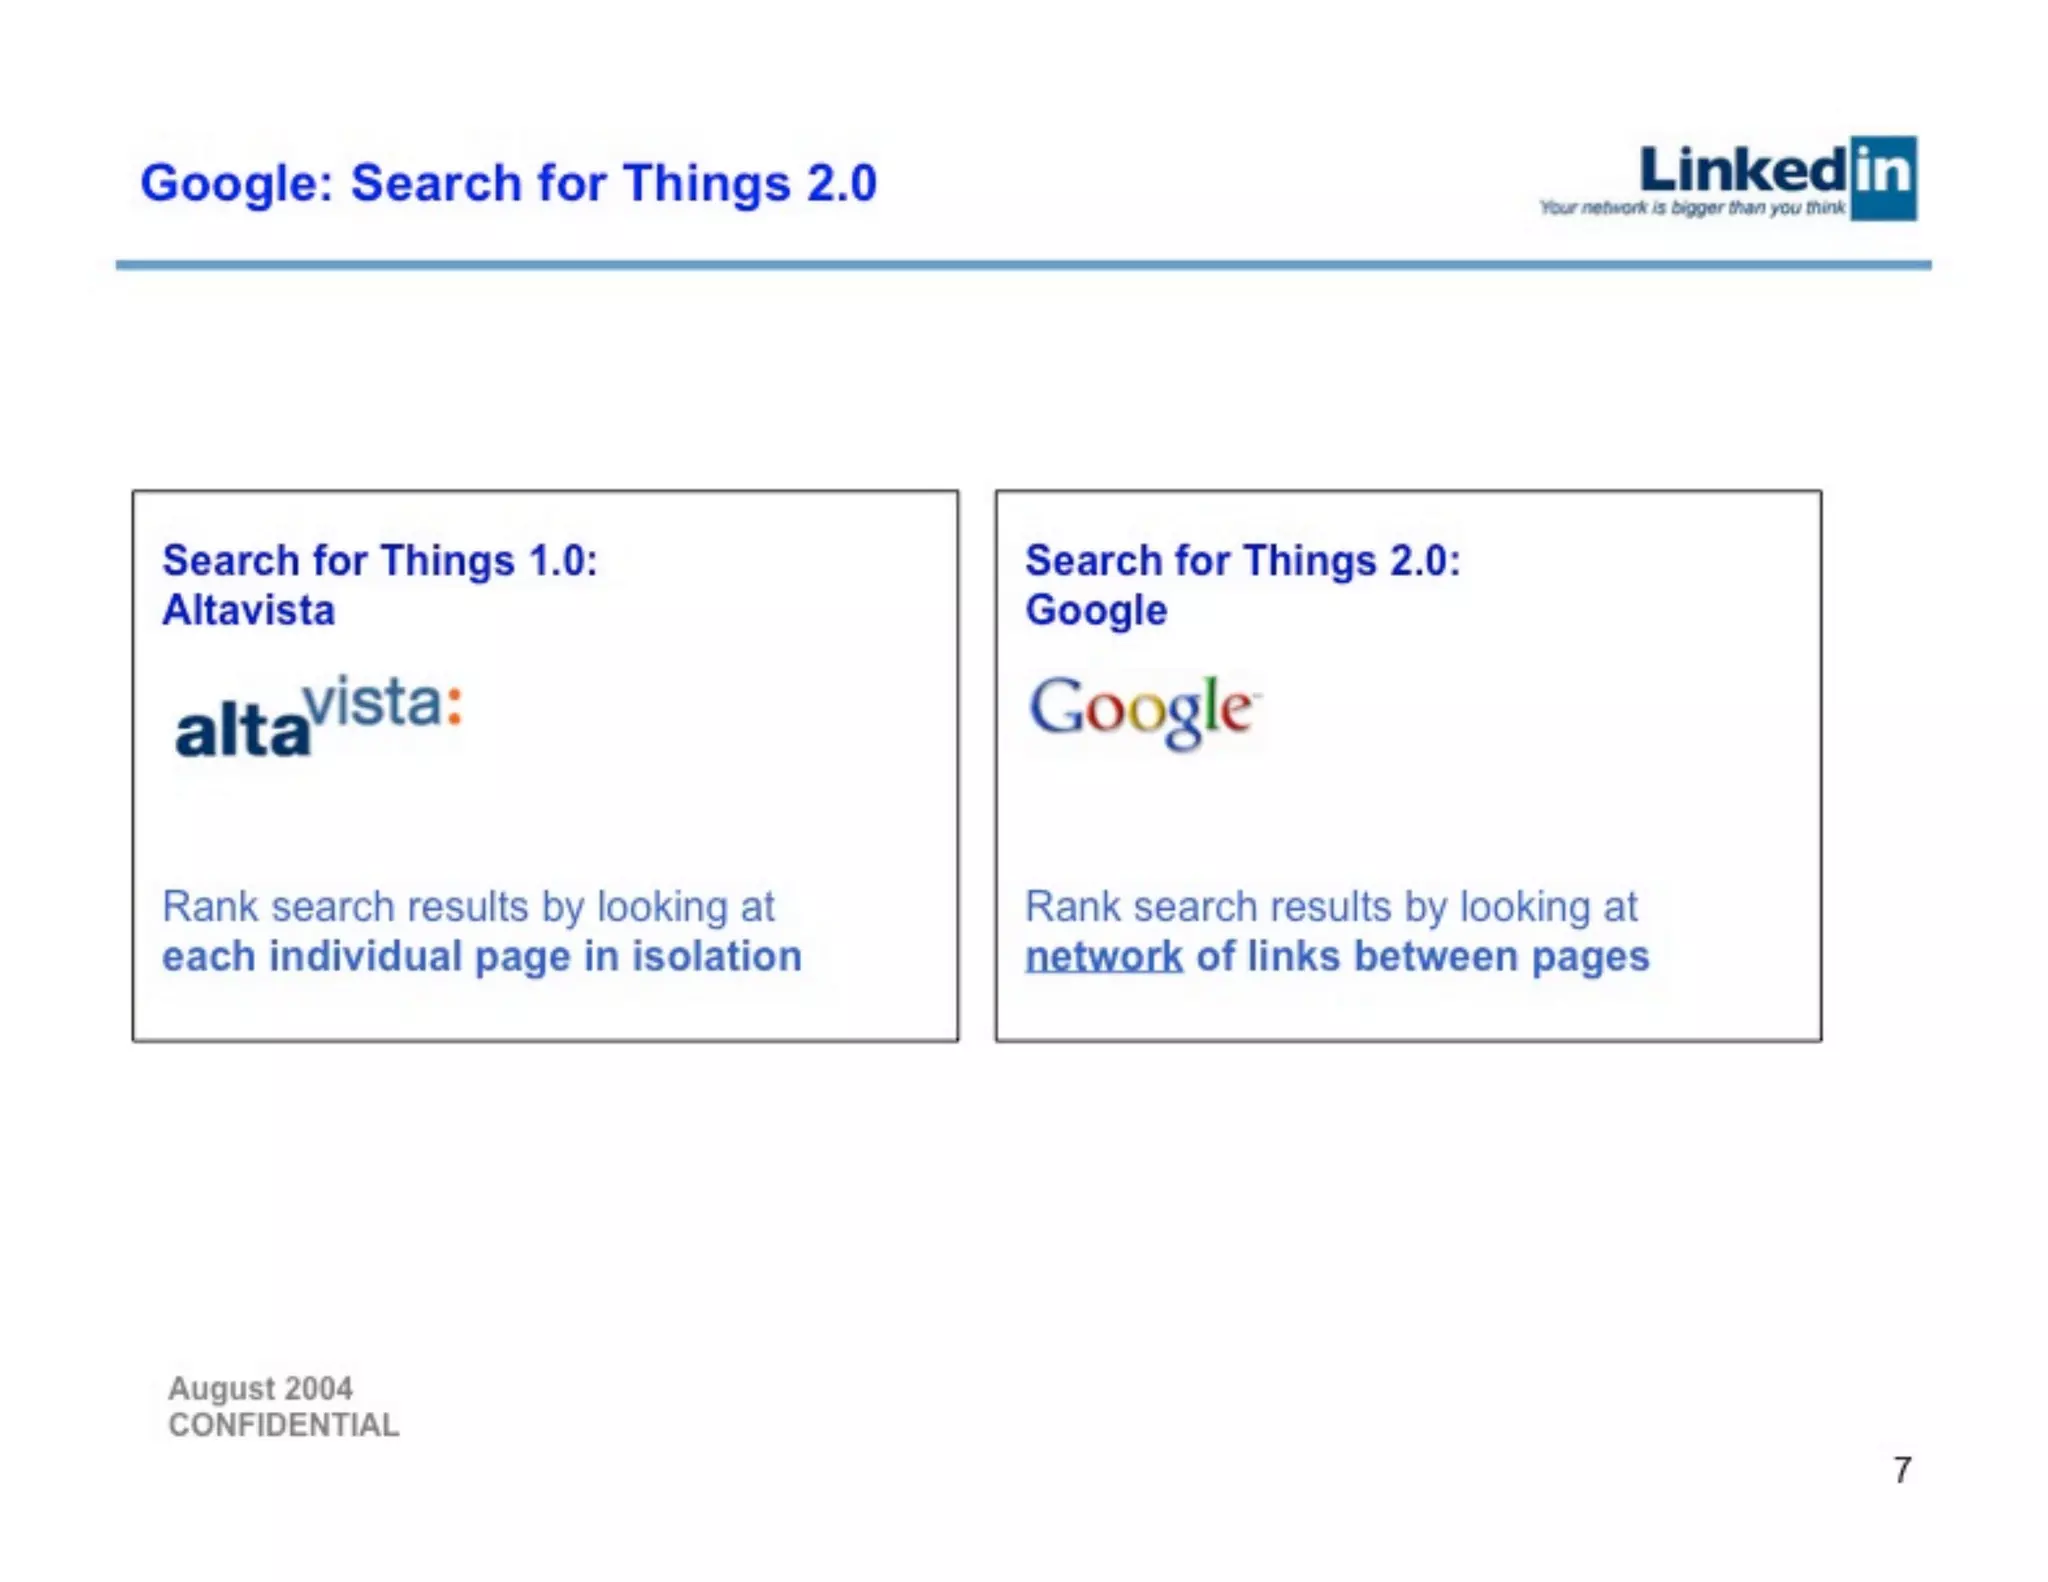
Slide 6 (PayPal: Online Payments 2.0) positions LinkedIn within a family of companies that replaced isolated signals with network-derived signals (e.g., eBay's feedback, PayPal's fraud detection, Google's PageRank). By aligning LinkedIn with companies investors already understand and have rewarded, the deck borrows credibility and explains how a network-reputation system creates economic value.

Founders should note how effective analogies can accelerate comprehension: pick 2–3 familiar winners with similar mechanics (reputation, network effects, data-driven ranking) and explain the parallel succinctly. This reduces investor cognitive load and converts abstract product claims into familiar business models.

Key Takeaway: Use analogies to well-known businesses to quickly convey mechanics and credibility for your network-driven approach.
Traction and the inflection: growth projections vs actuals

Traction and the inflection: growth projections vs actuals

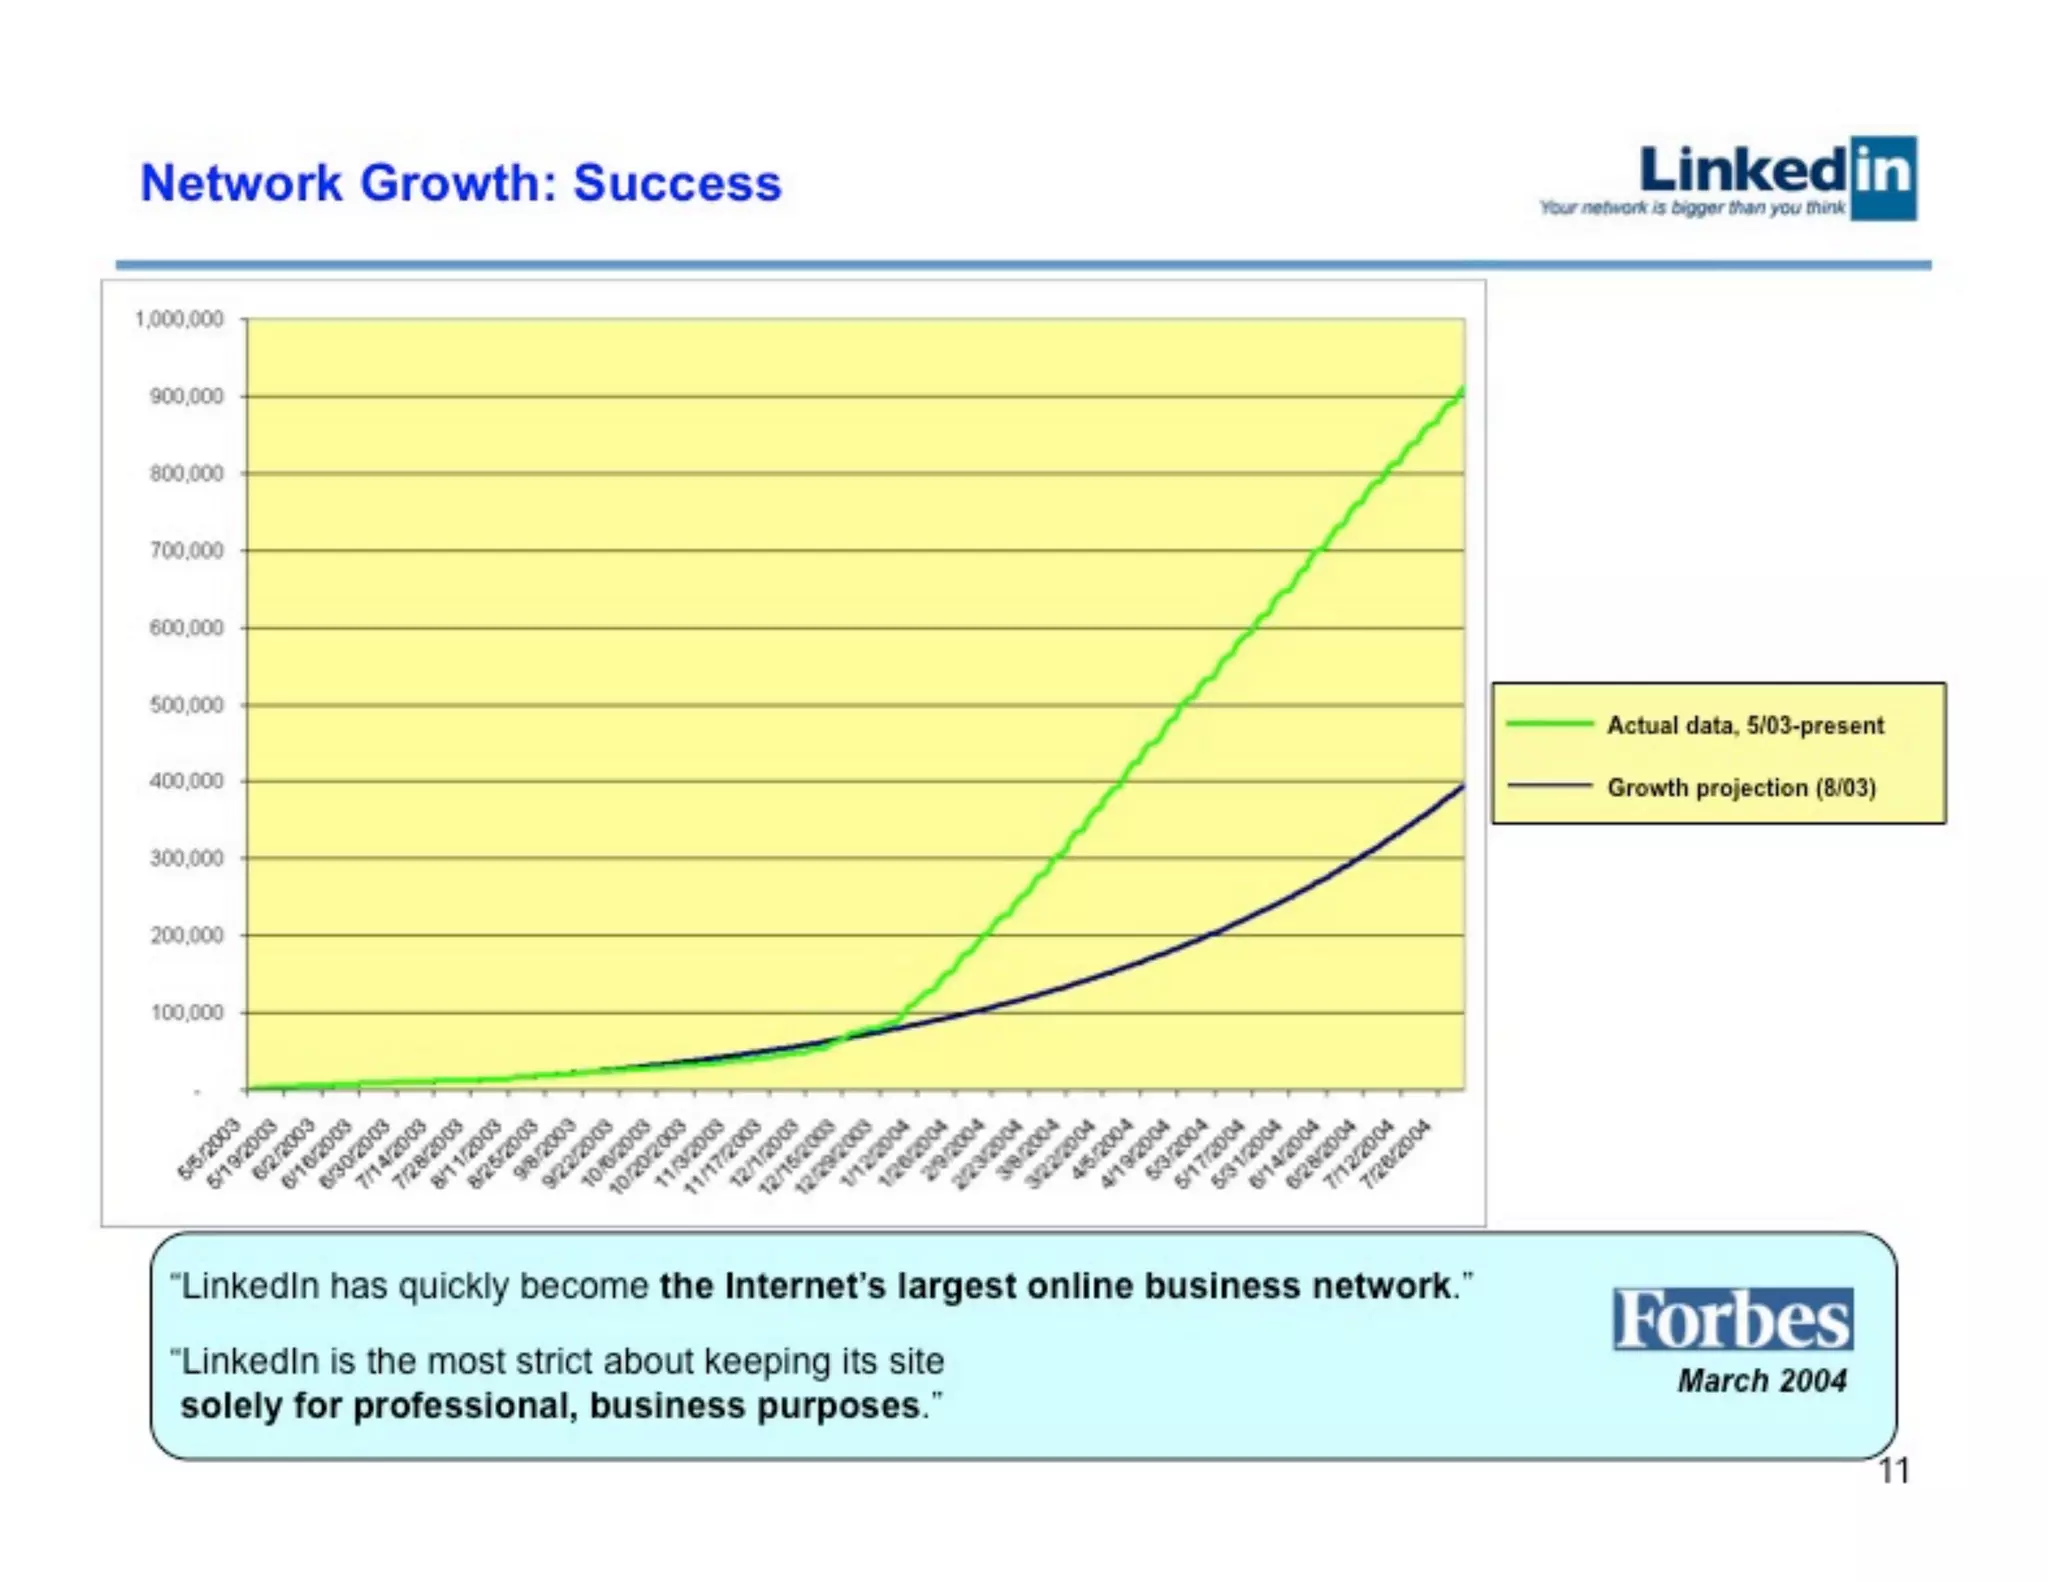
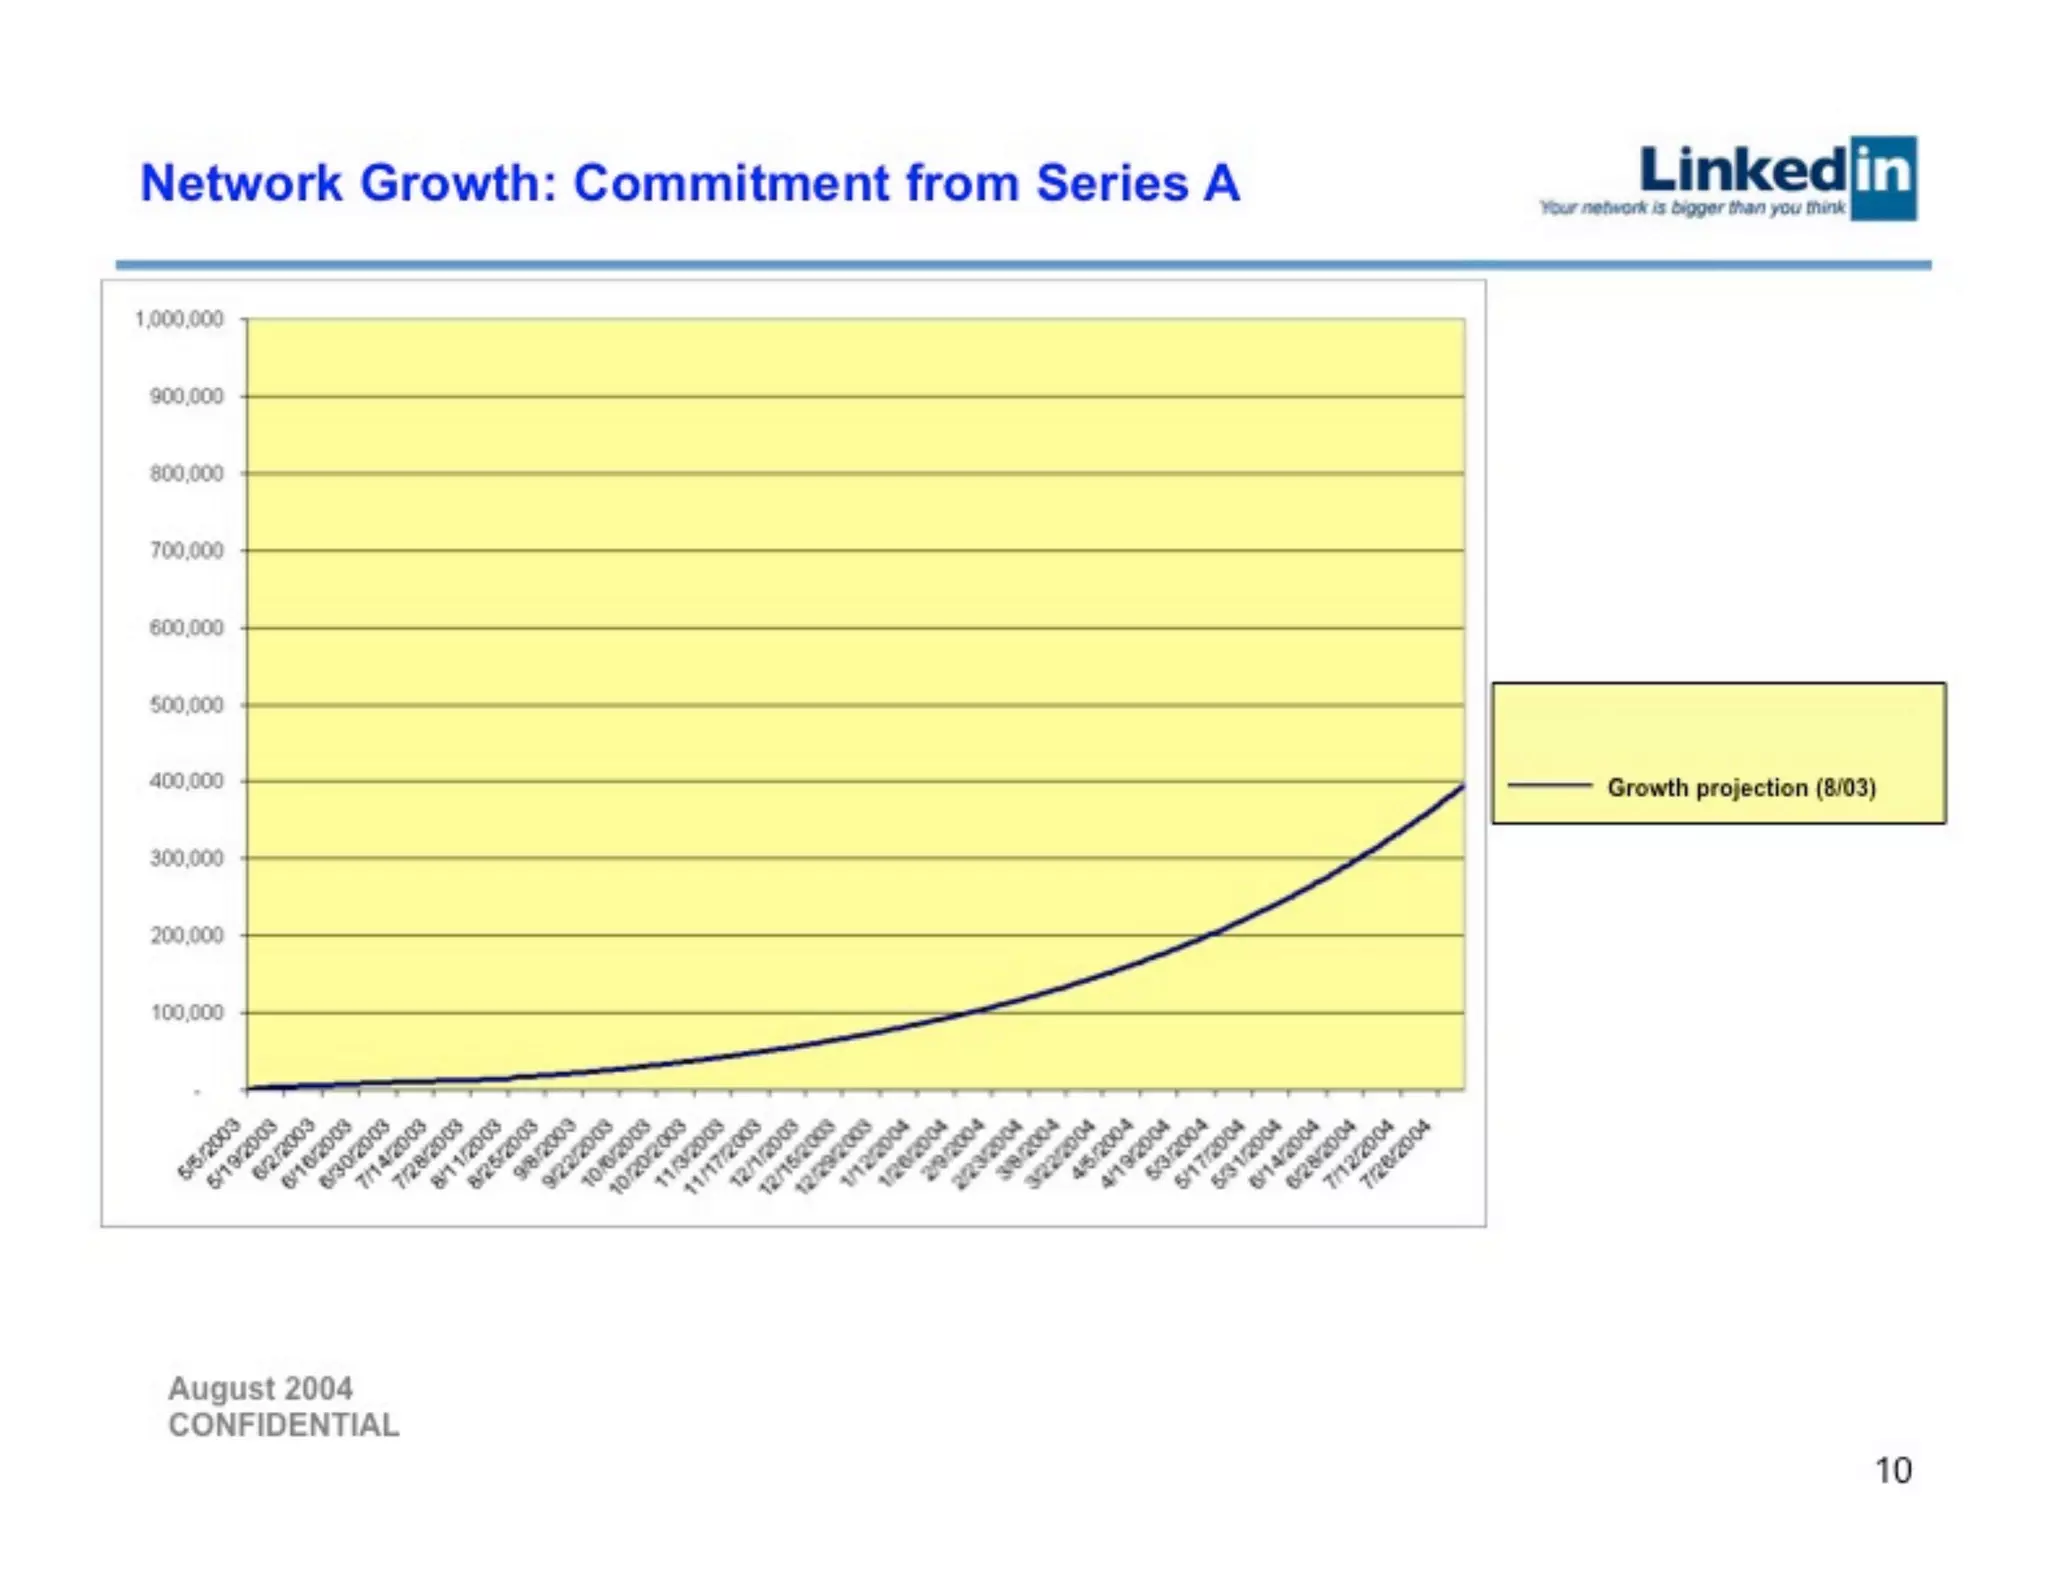
Slide 11 shows actual growth (green) well above the earlier projection (blue), presenting a clean, dramatic visualization of momentum. The slide combines a credible timeline with a third-party quote and positions growth as evidence that the product has reached viral lift-off and is approaching a tipping point. For investors, seeing realized outperformance versus plan is much more convincing than projections alone.

For founders, the lesson is to present growth transparently and contextually: use simple graphs that compare projections to actuals, highlight inflection points, and provide narrative color (e.g., partnerships, product launches) that explain why the curve moved. Demonstrating consistent overperformance builds trust and helps justify valuation increments.

Key Takeaway: Show real traction vs prior forecasts to demonstrate momentum and reduce reliance on hypothetical projections.
Market leadership and competitive map

Market leadership and competitive map

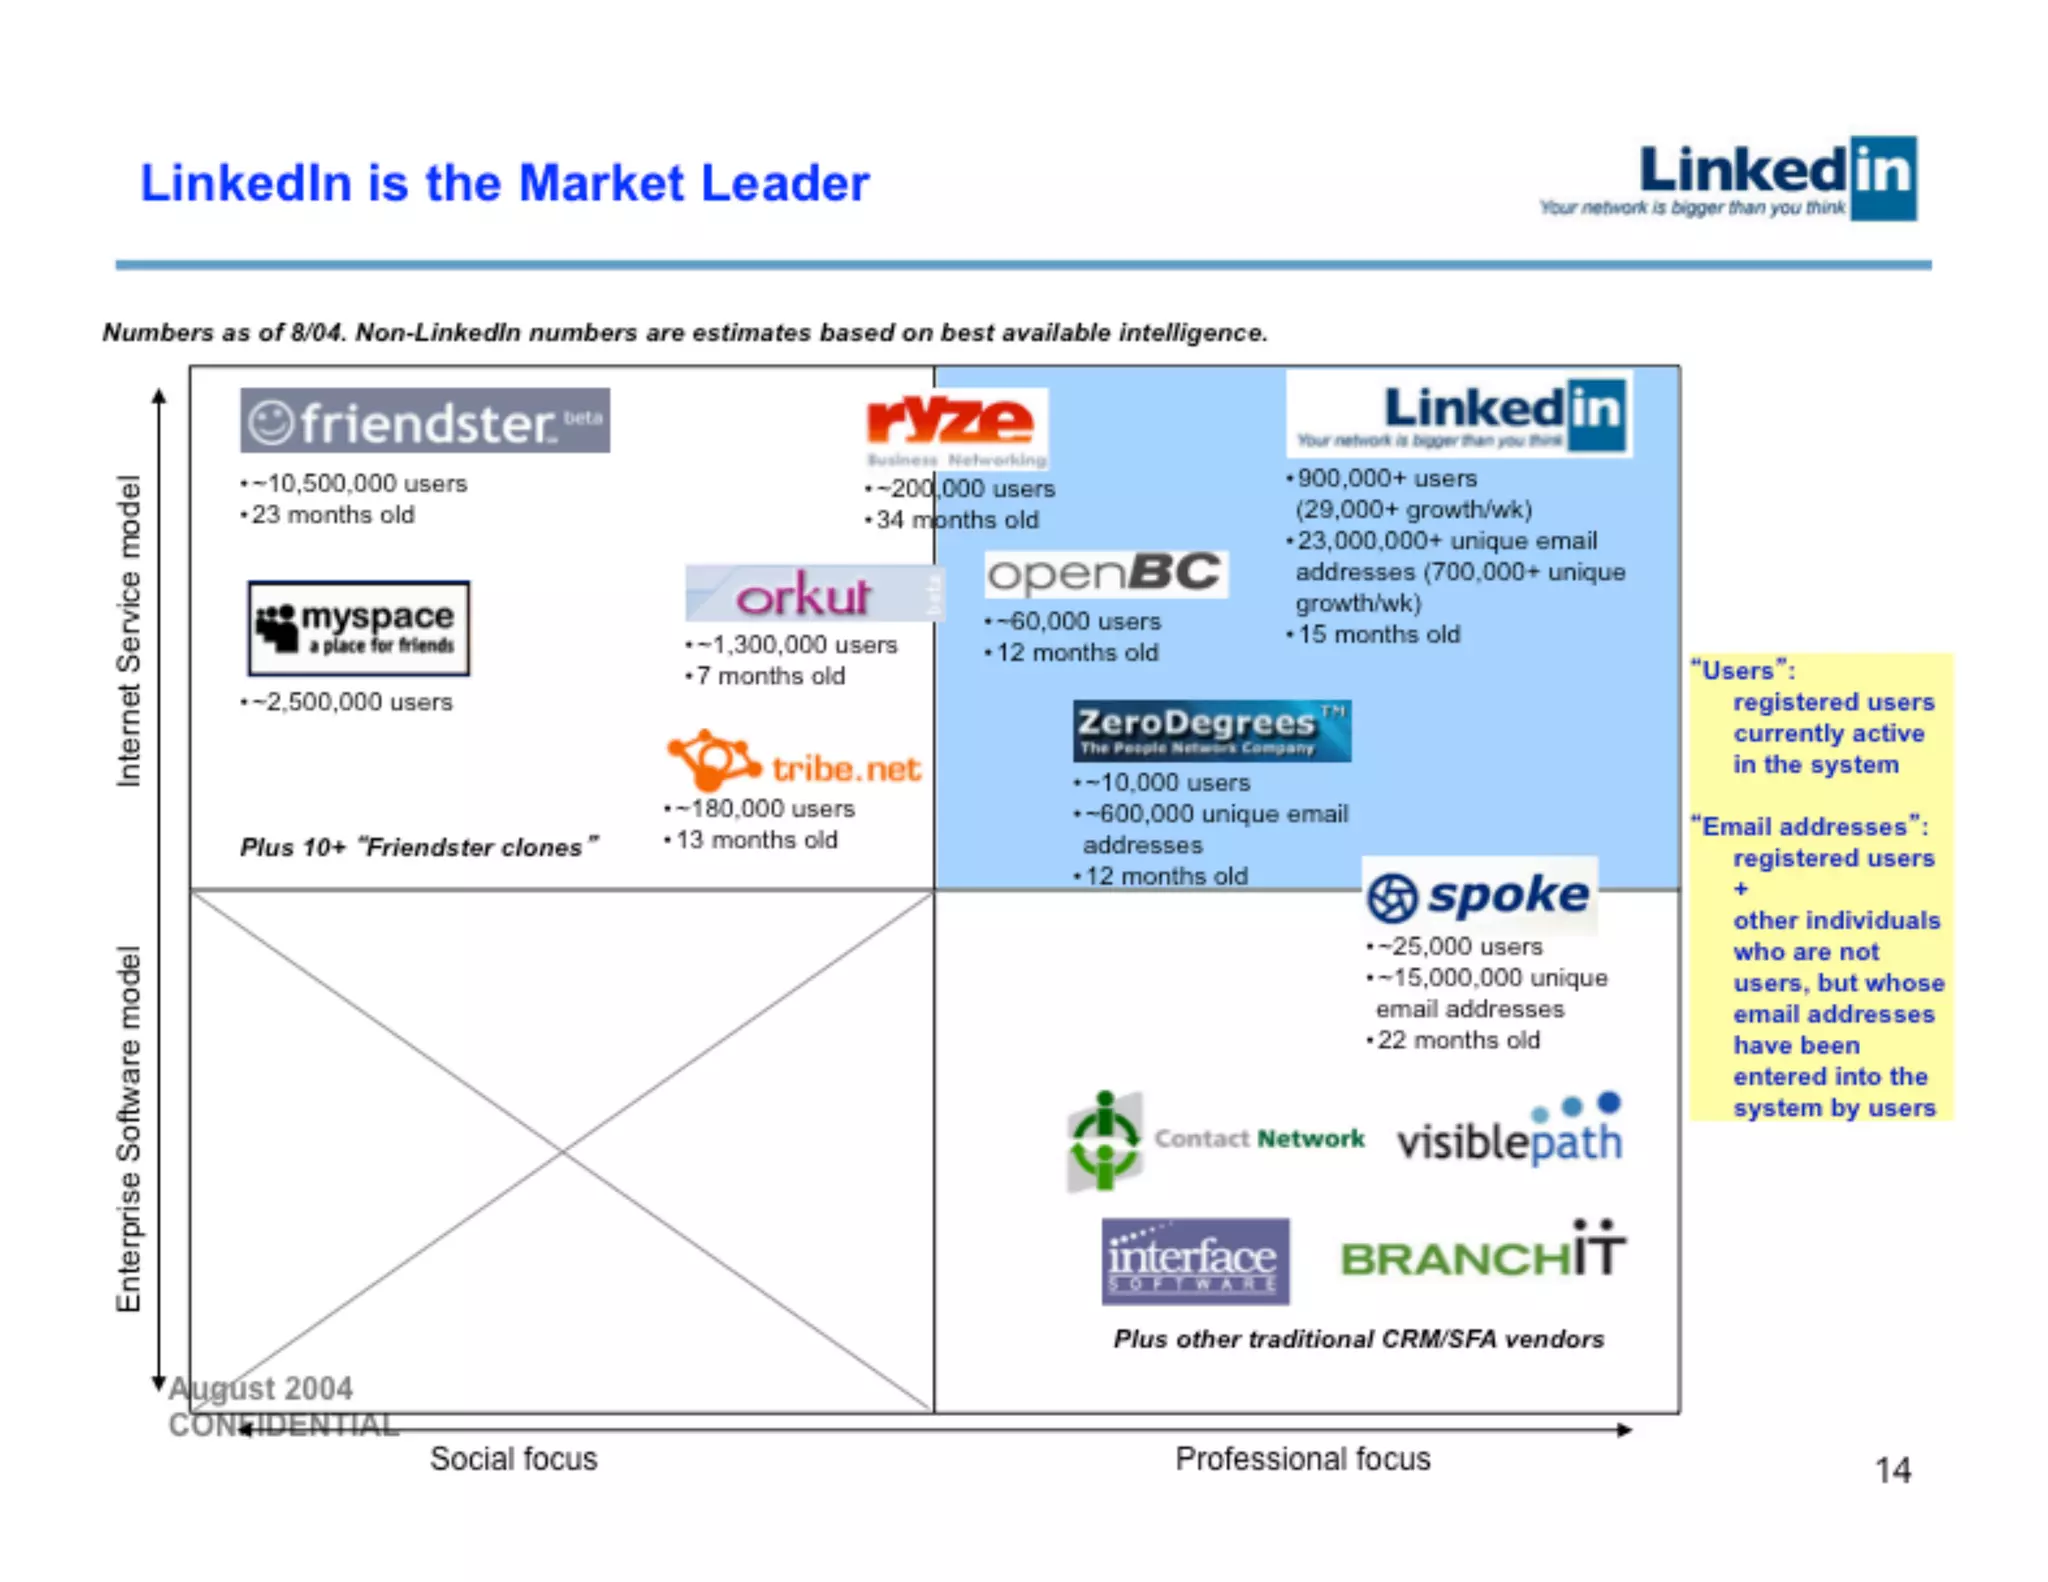
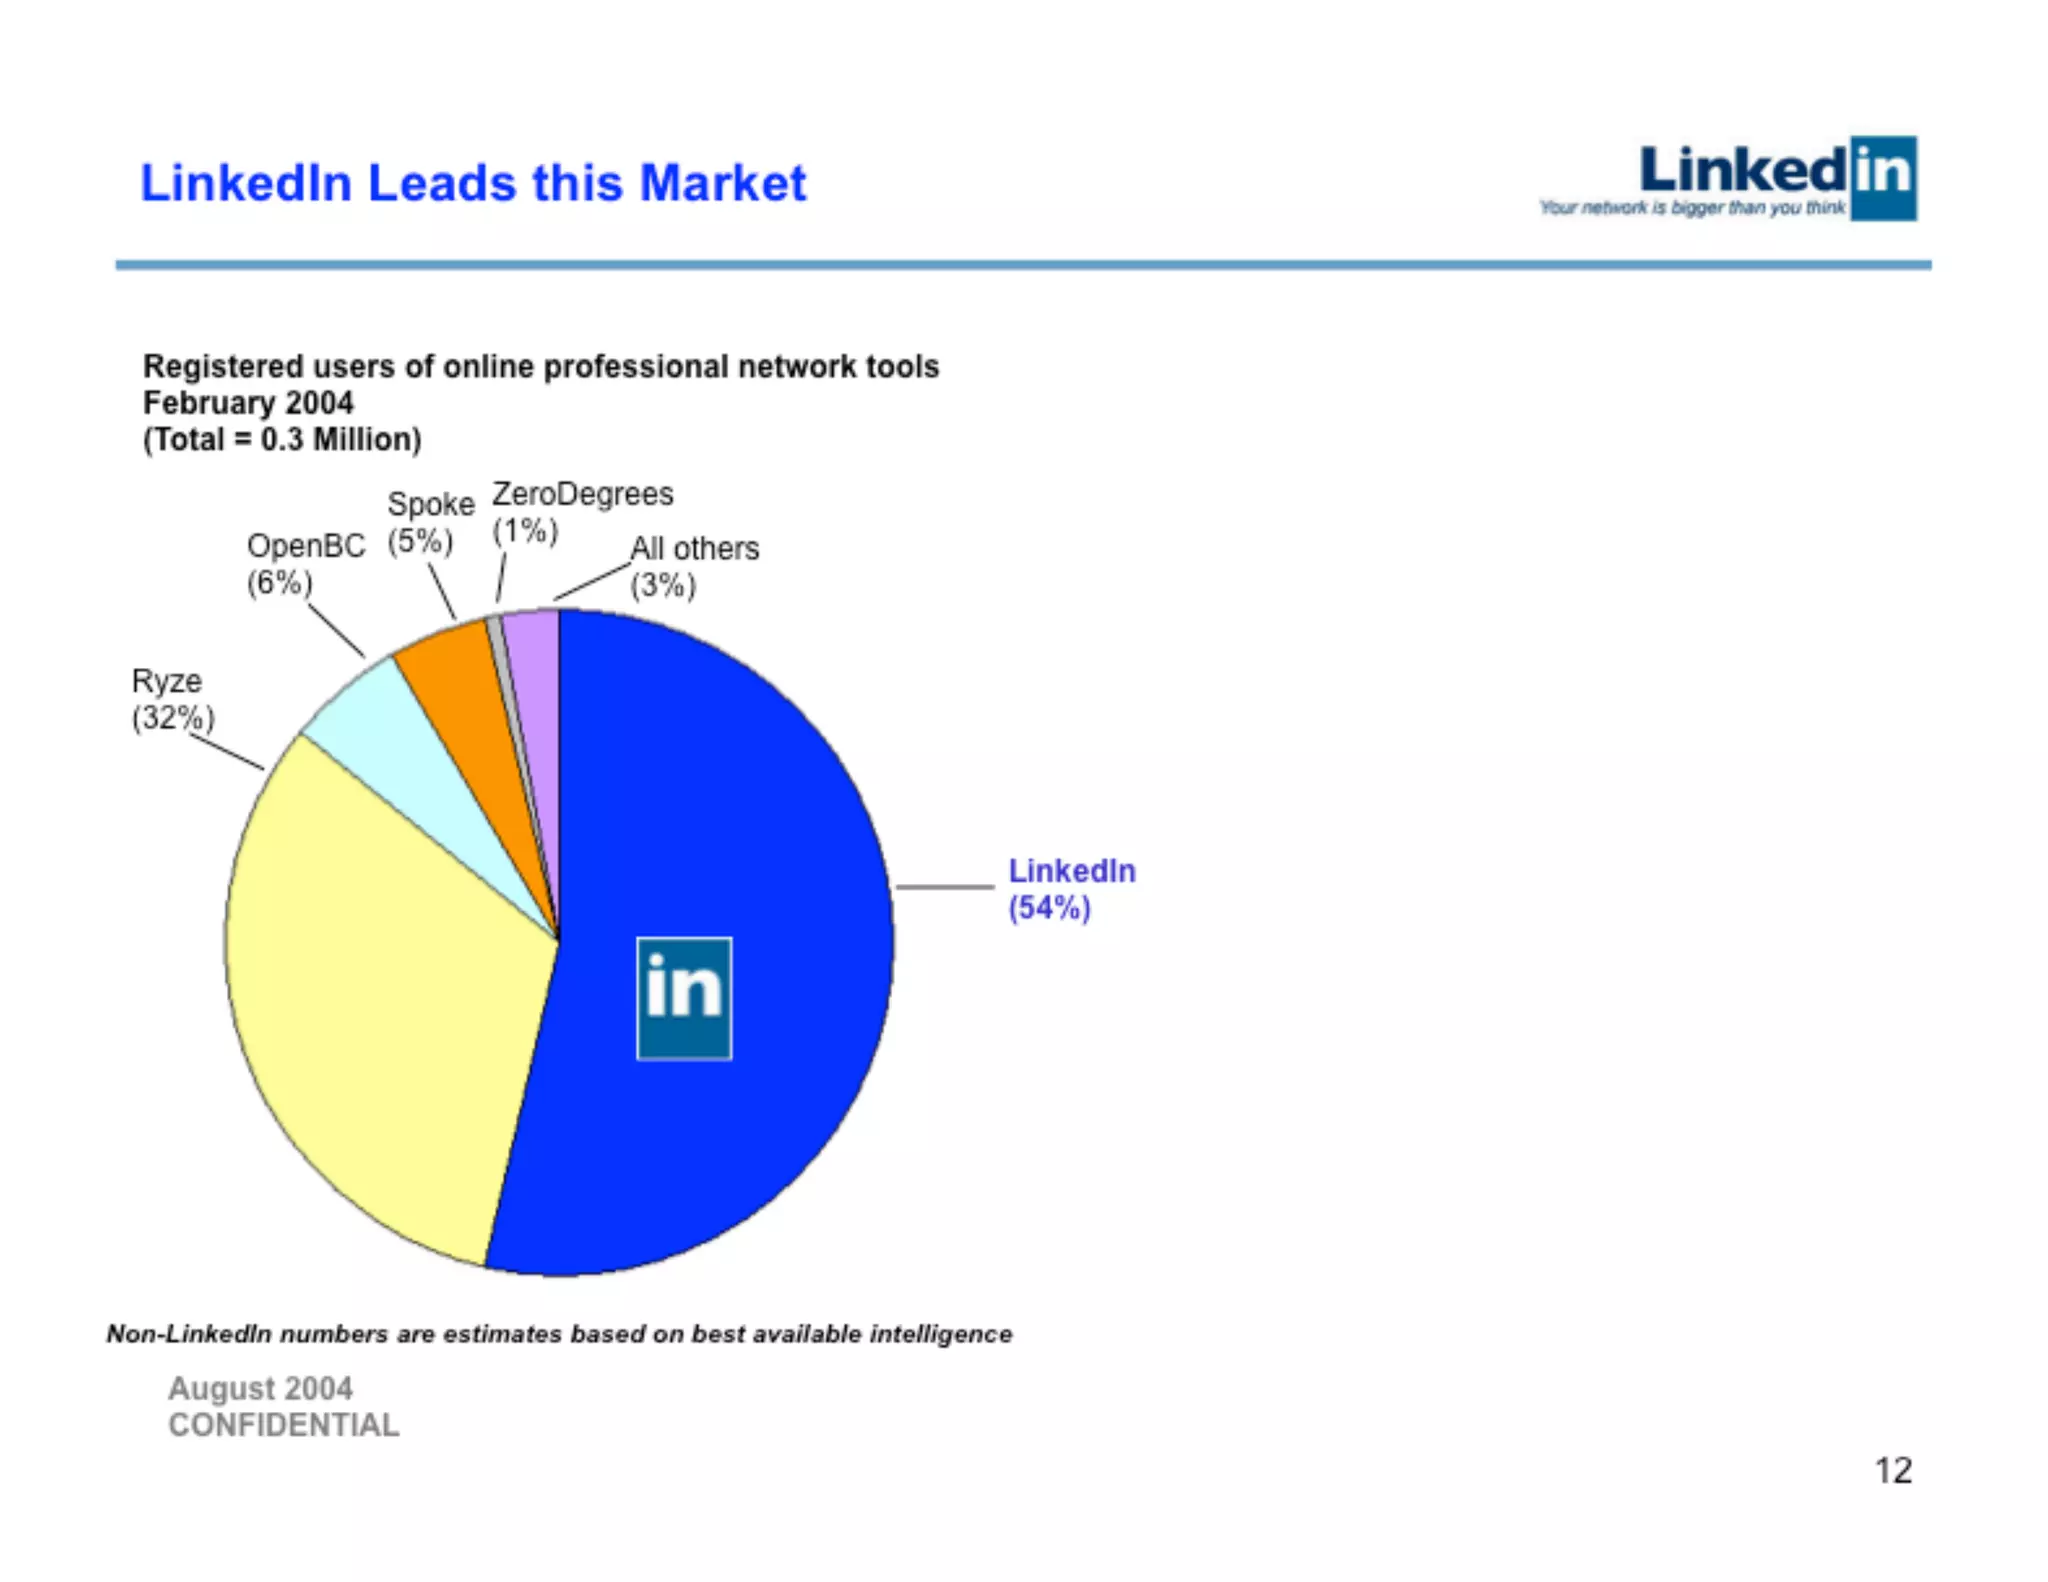
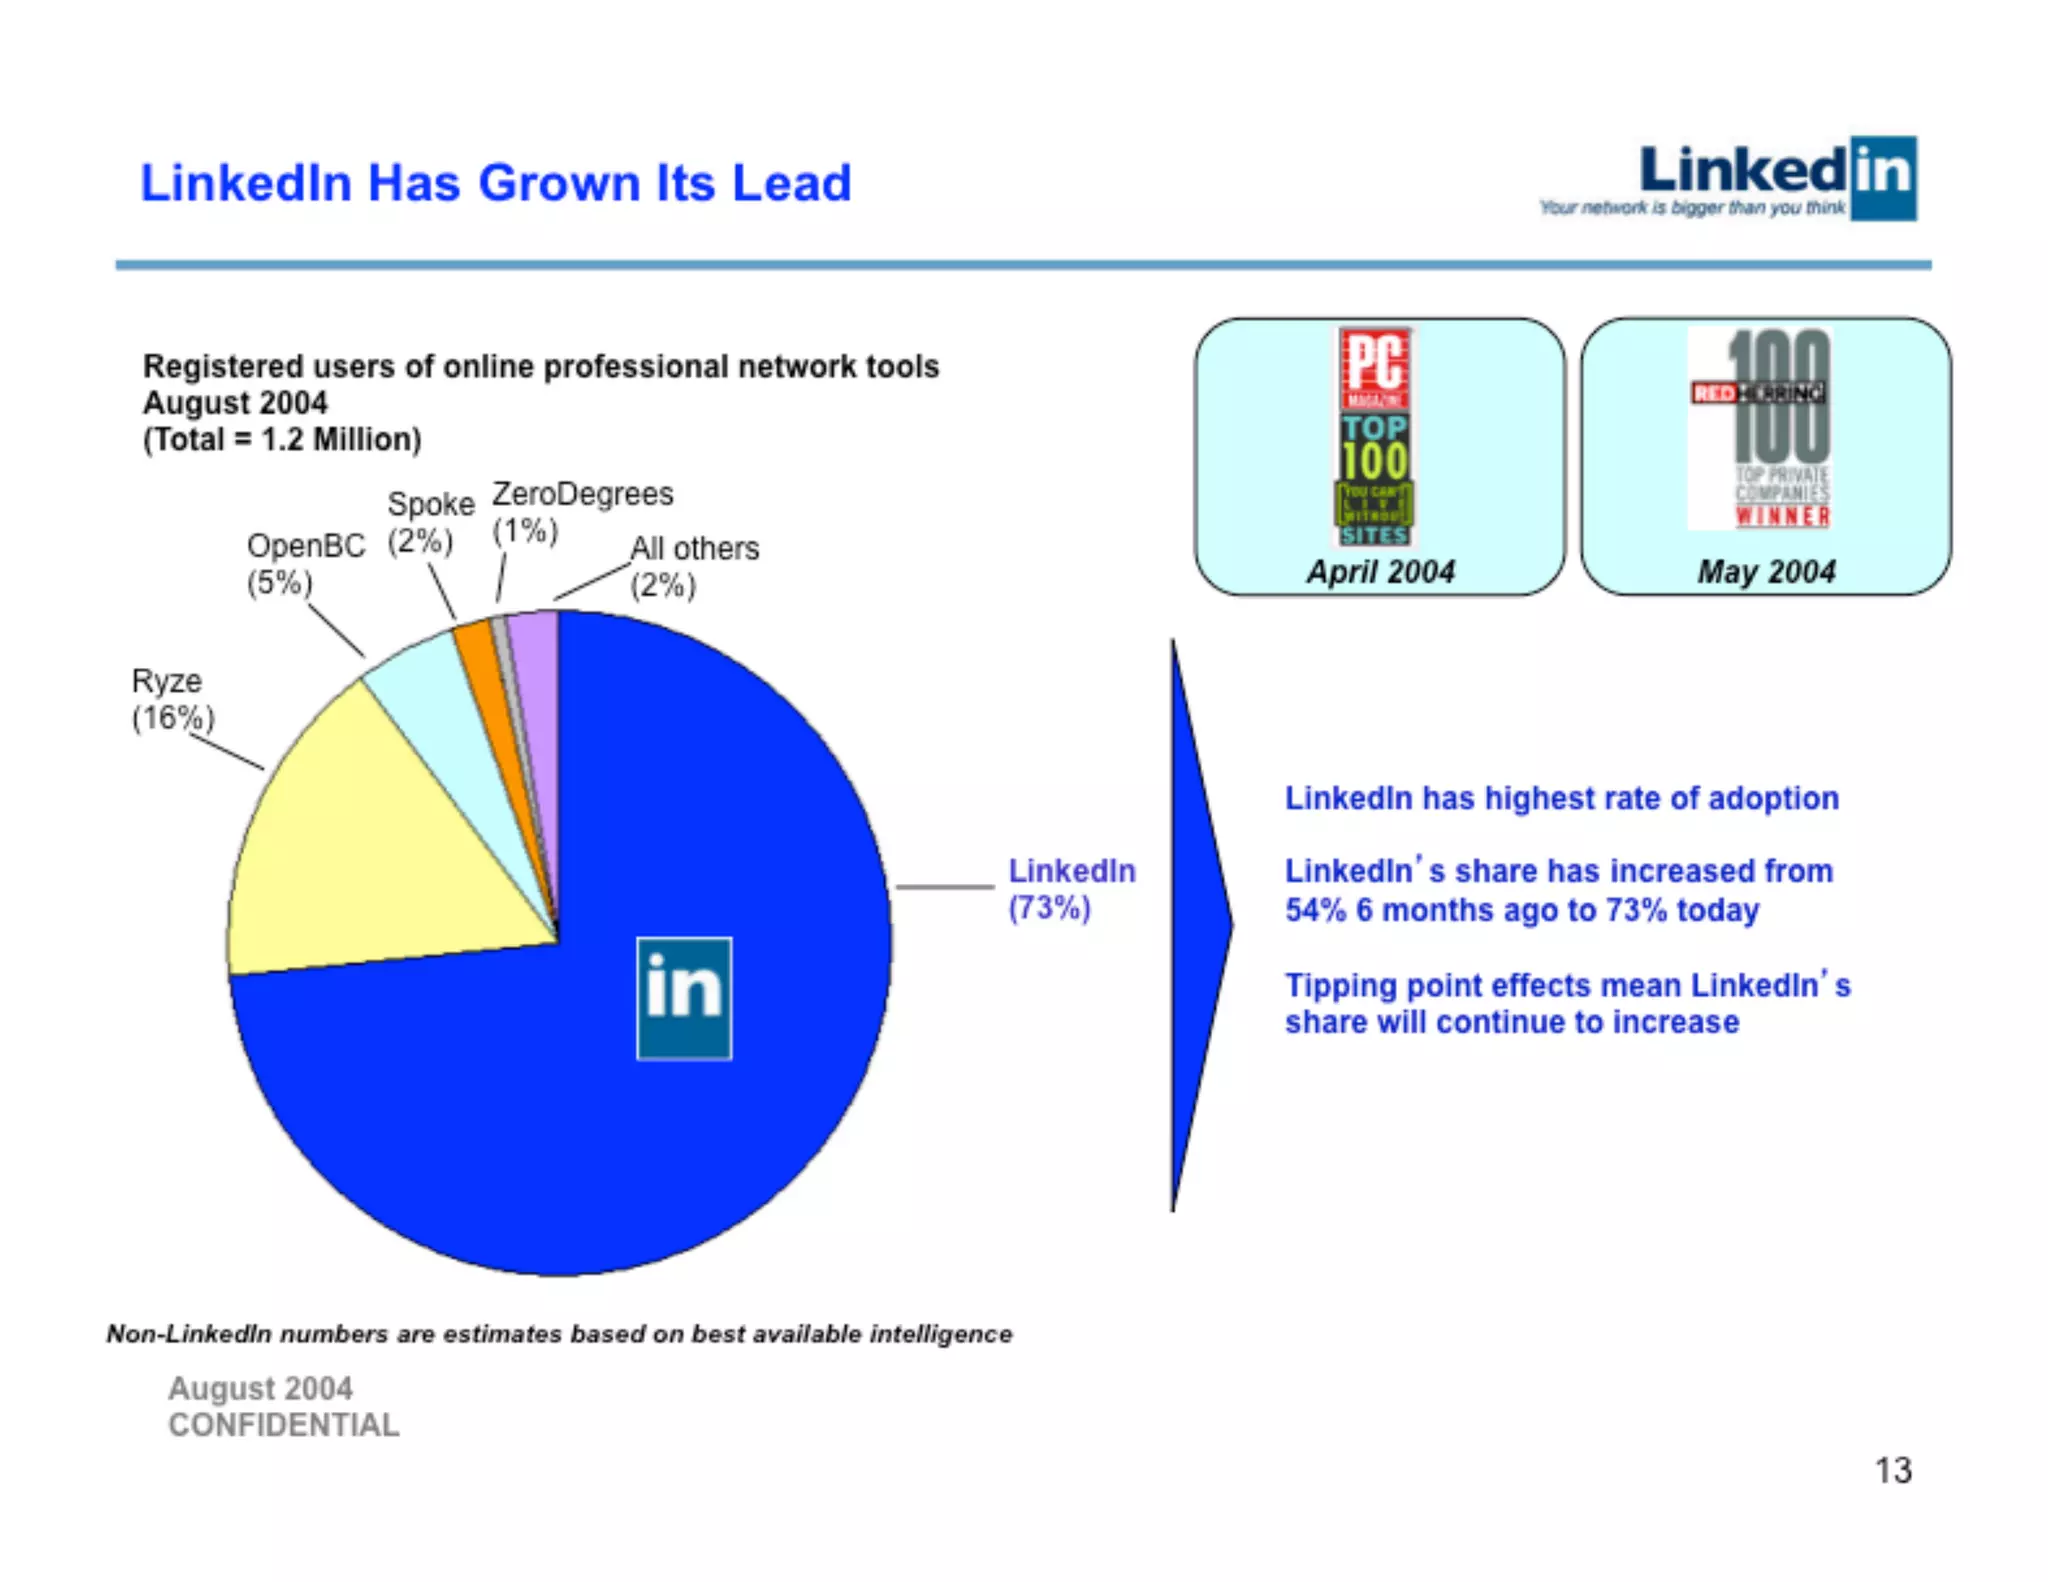
Slide 14 presents competitive positioning via a quadrant and pie charts that quantify LinkedIn’s share in the professional networking space, showing rapid share growth (from 54% to 73%). This visualization does three things: it shows category leadership, quantifies scale, and illustrates momentum relative to competitors. The inclusion of publication recognition (PC Magazine, Red Herring) further legitimizes the claim.

Founders should emulate the dual approach: combine qualitative positioning (who are the competitors and why you’re different) with quantitative share or usage data. When possible, show how your share has changed over time — growth in share is often as persuasive as absolute share because it signals adoption velocity.

Key Takeaway: Pair qualitative competitive positioning with concrete market-share or adoption metrics to demonstrate both leadership and momentum.
High-level revenue model: network enables revenue

High-level revenue model: network enables revenue

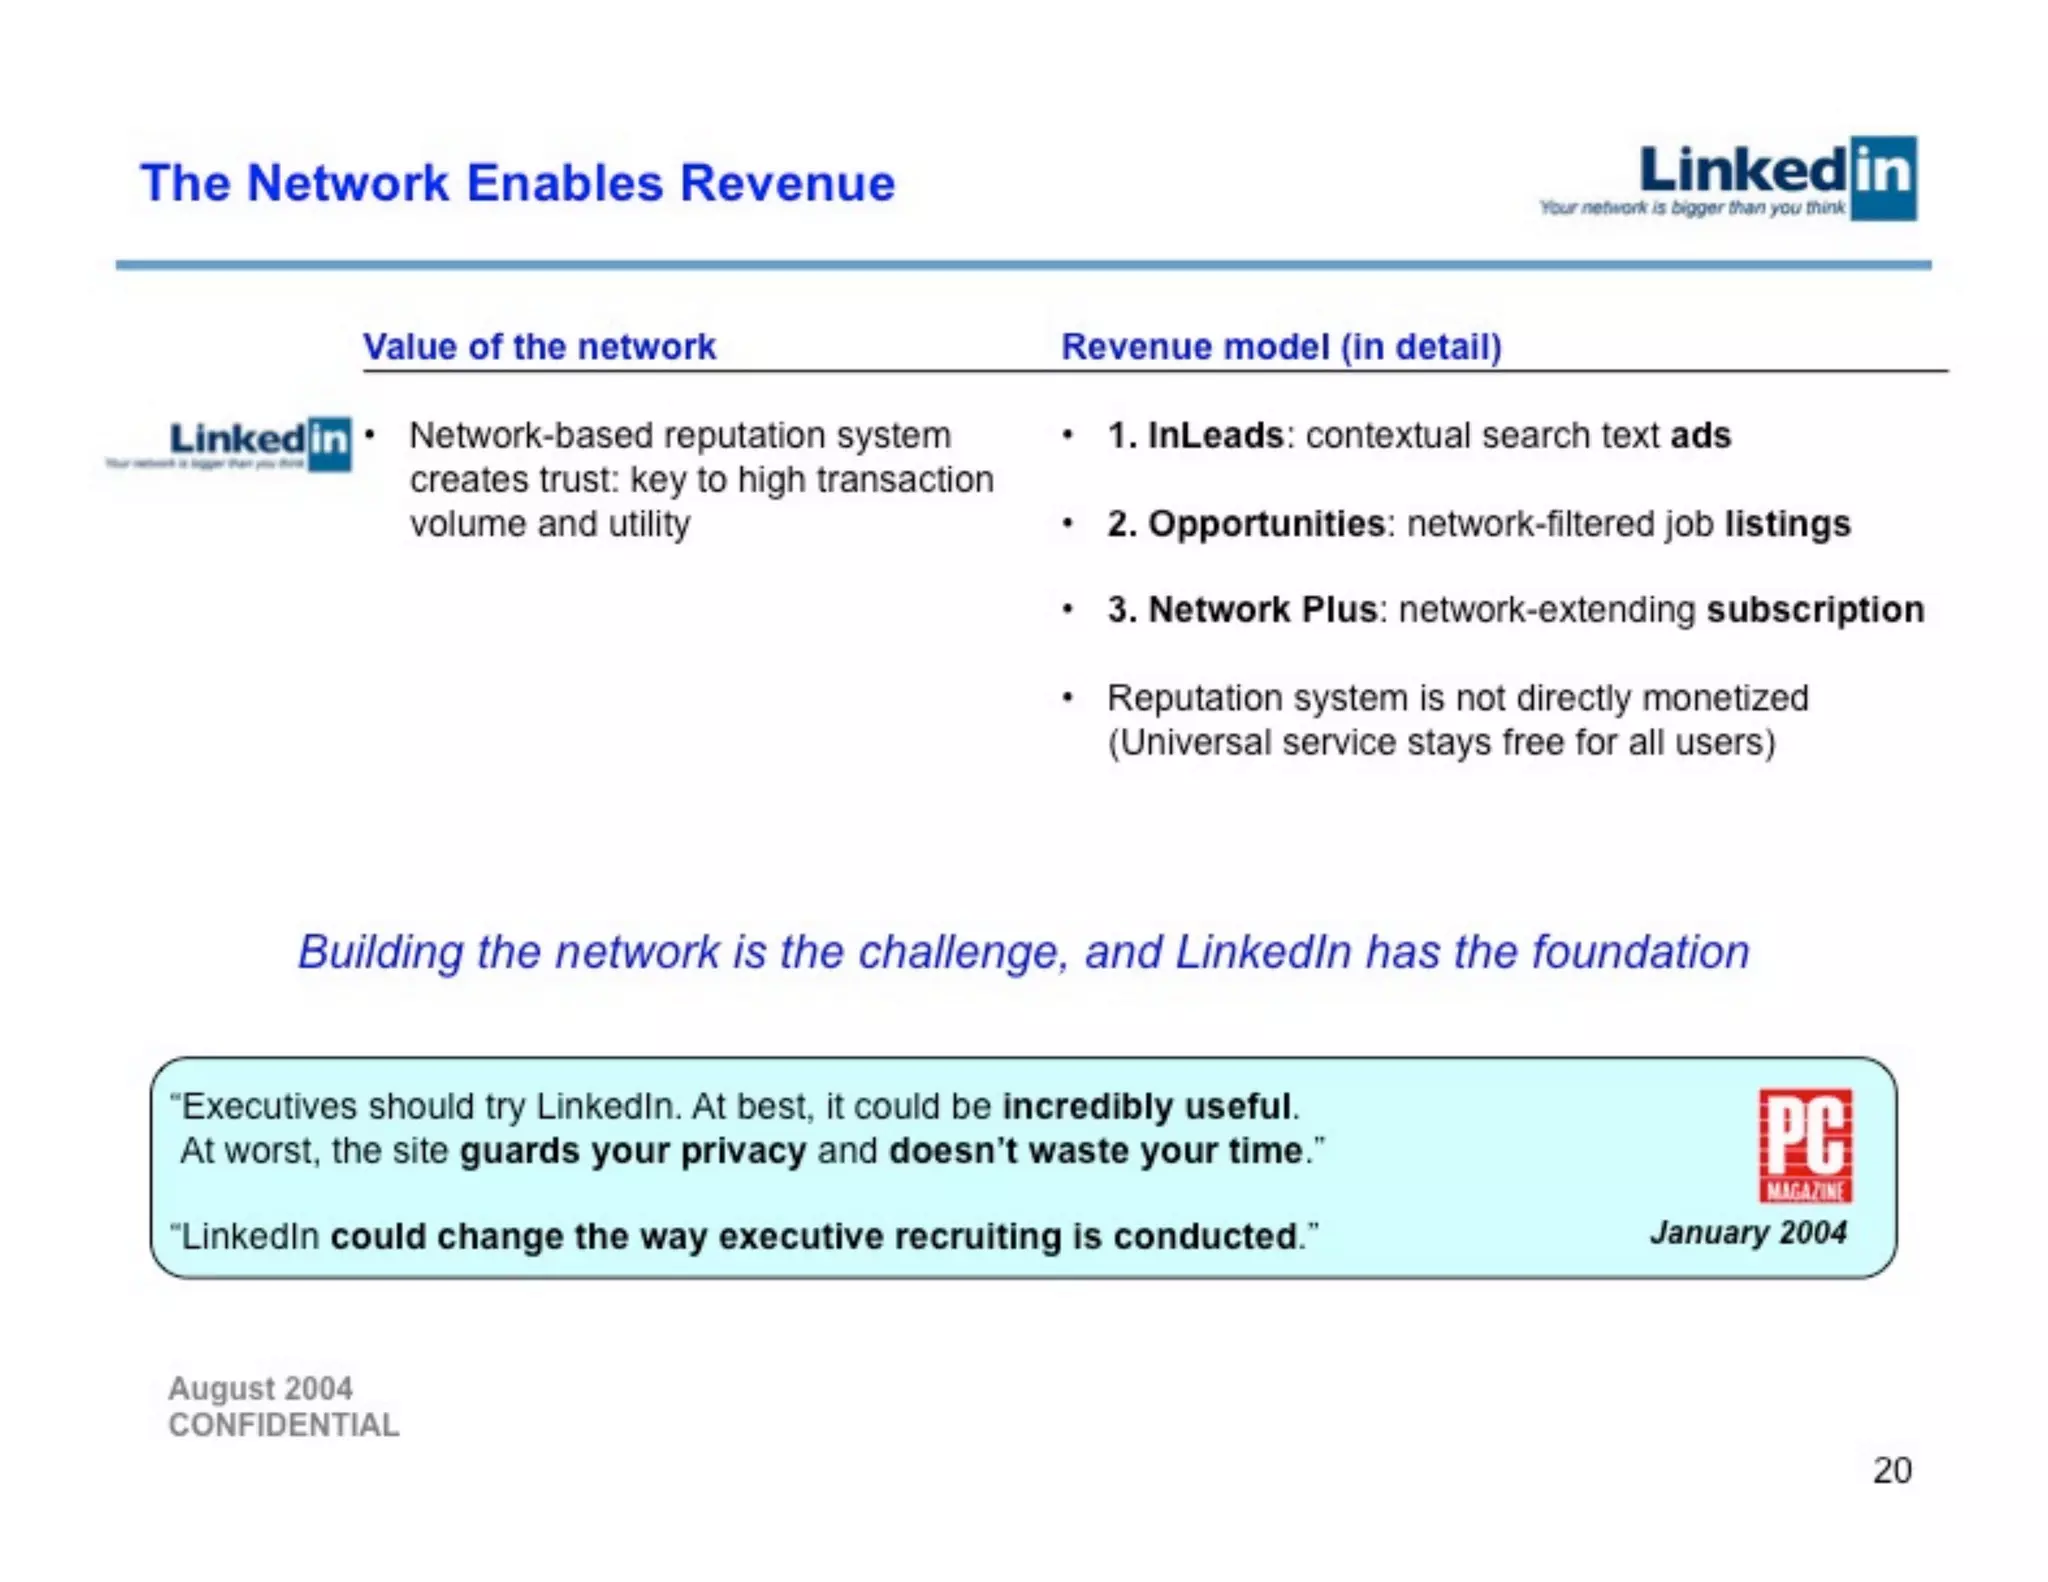
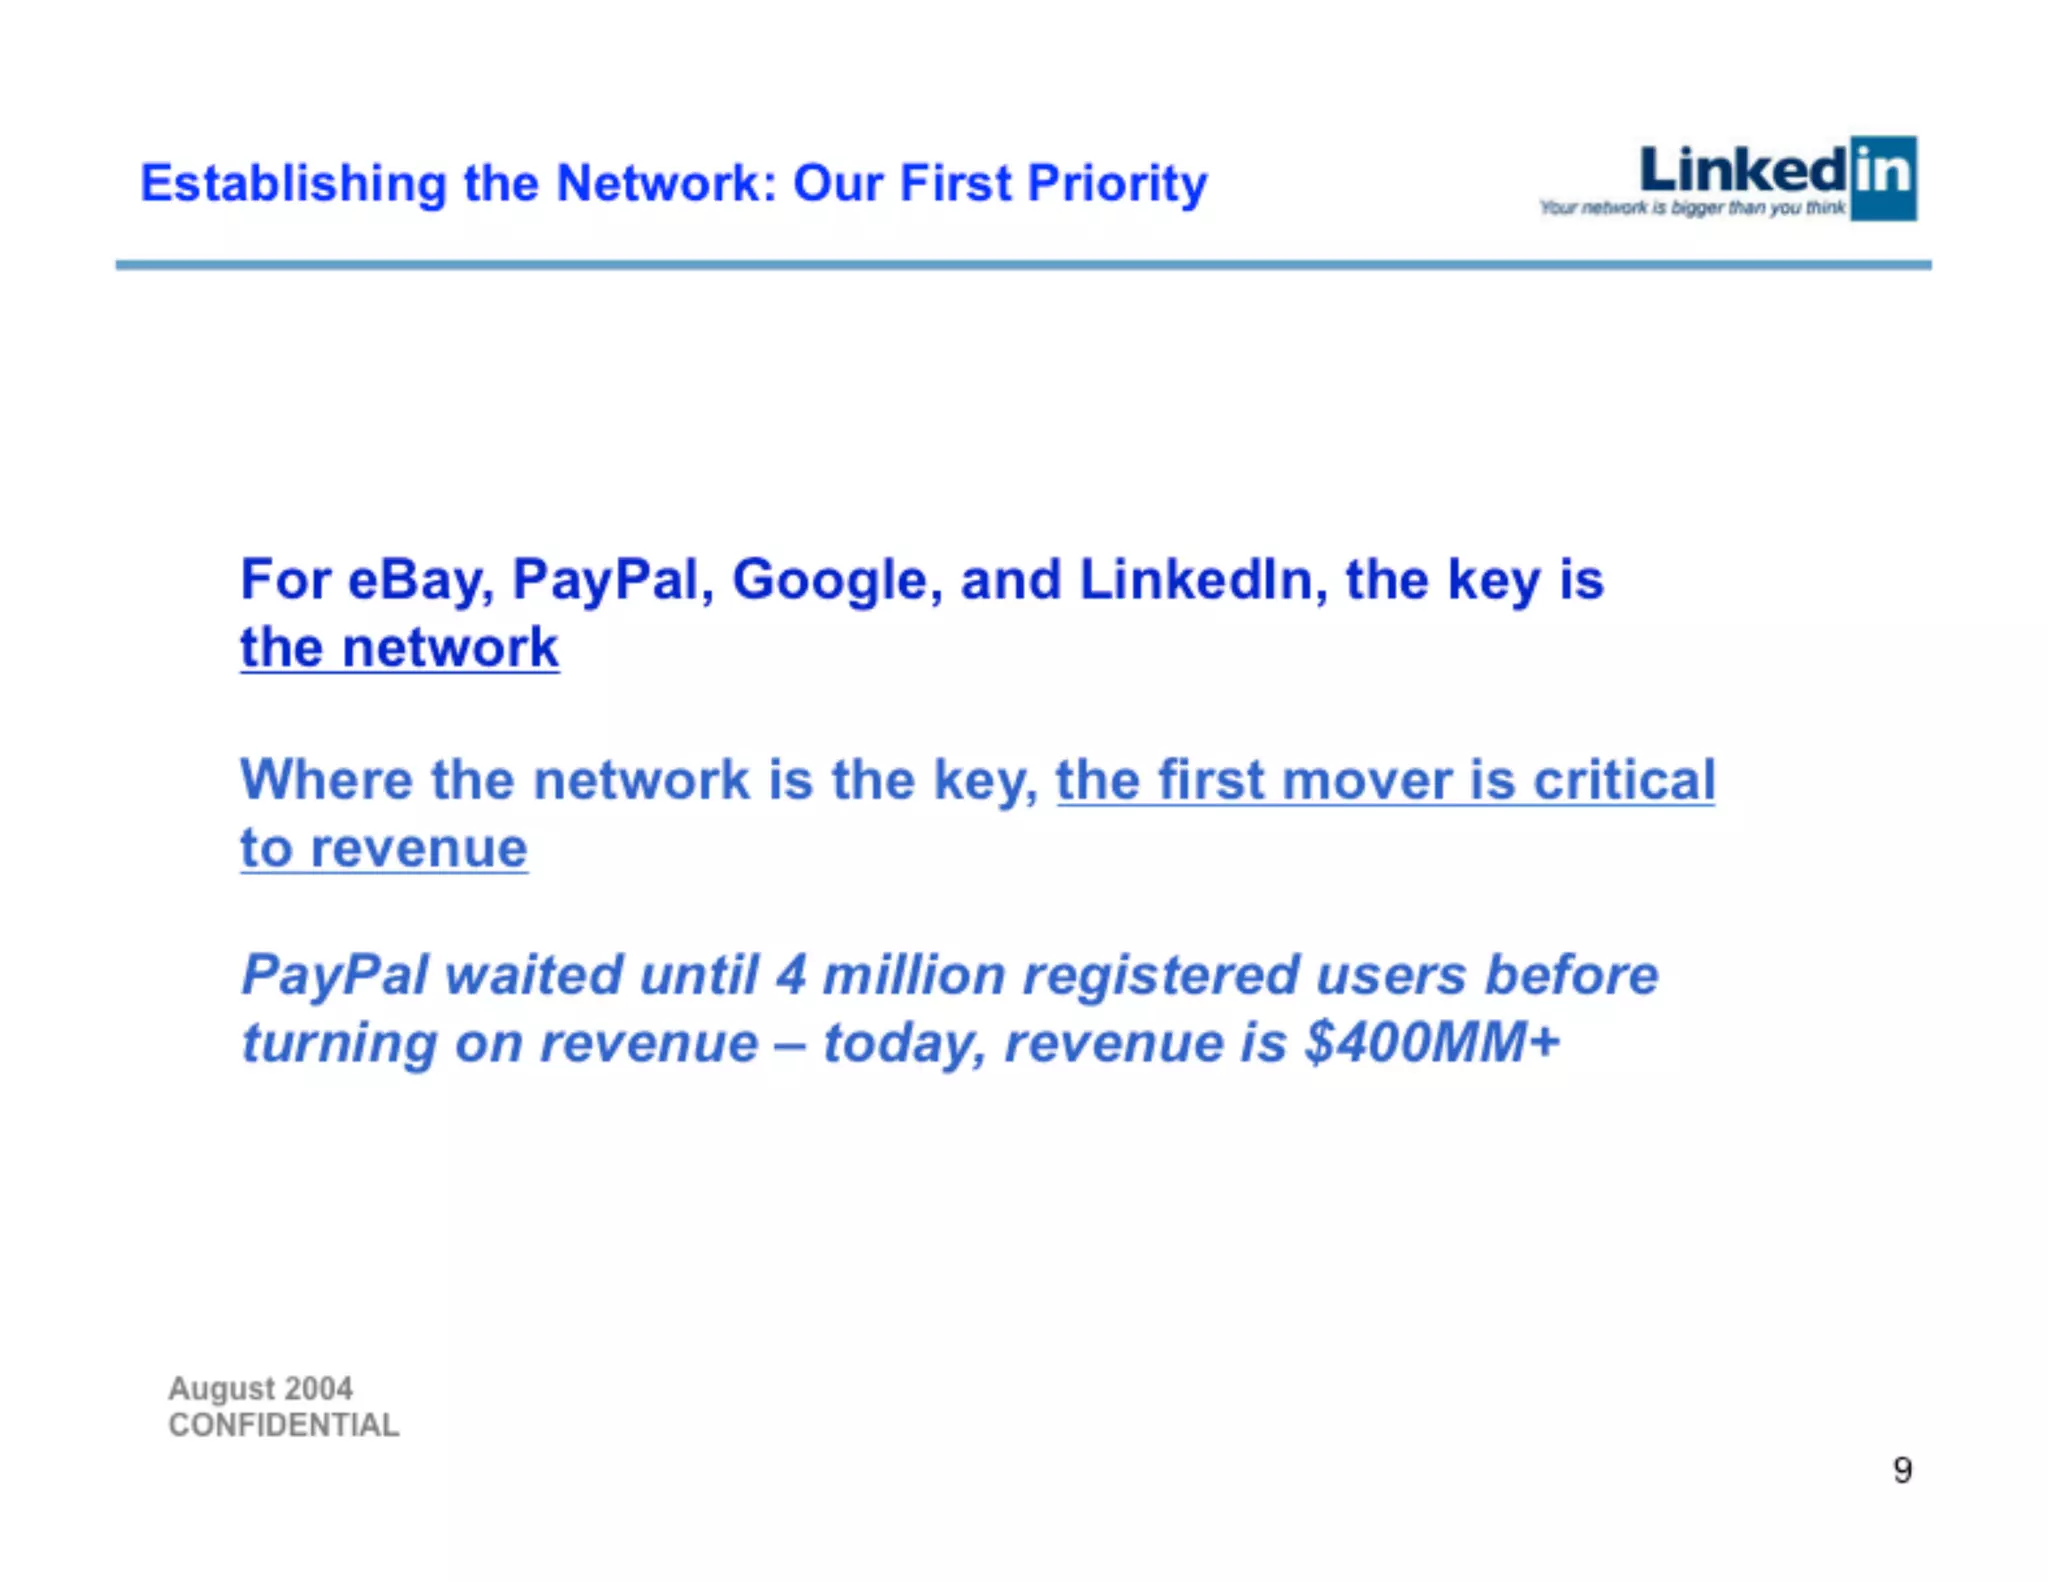
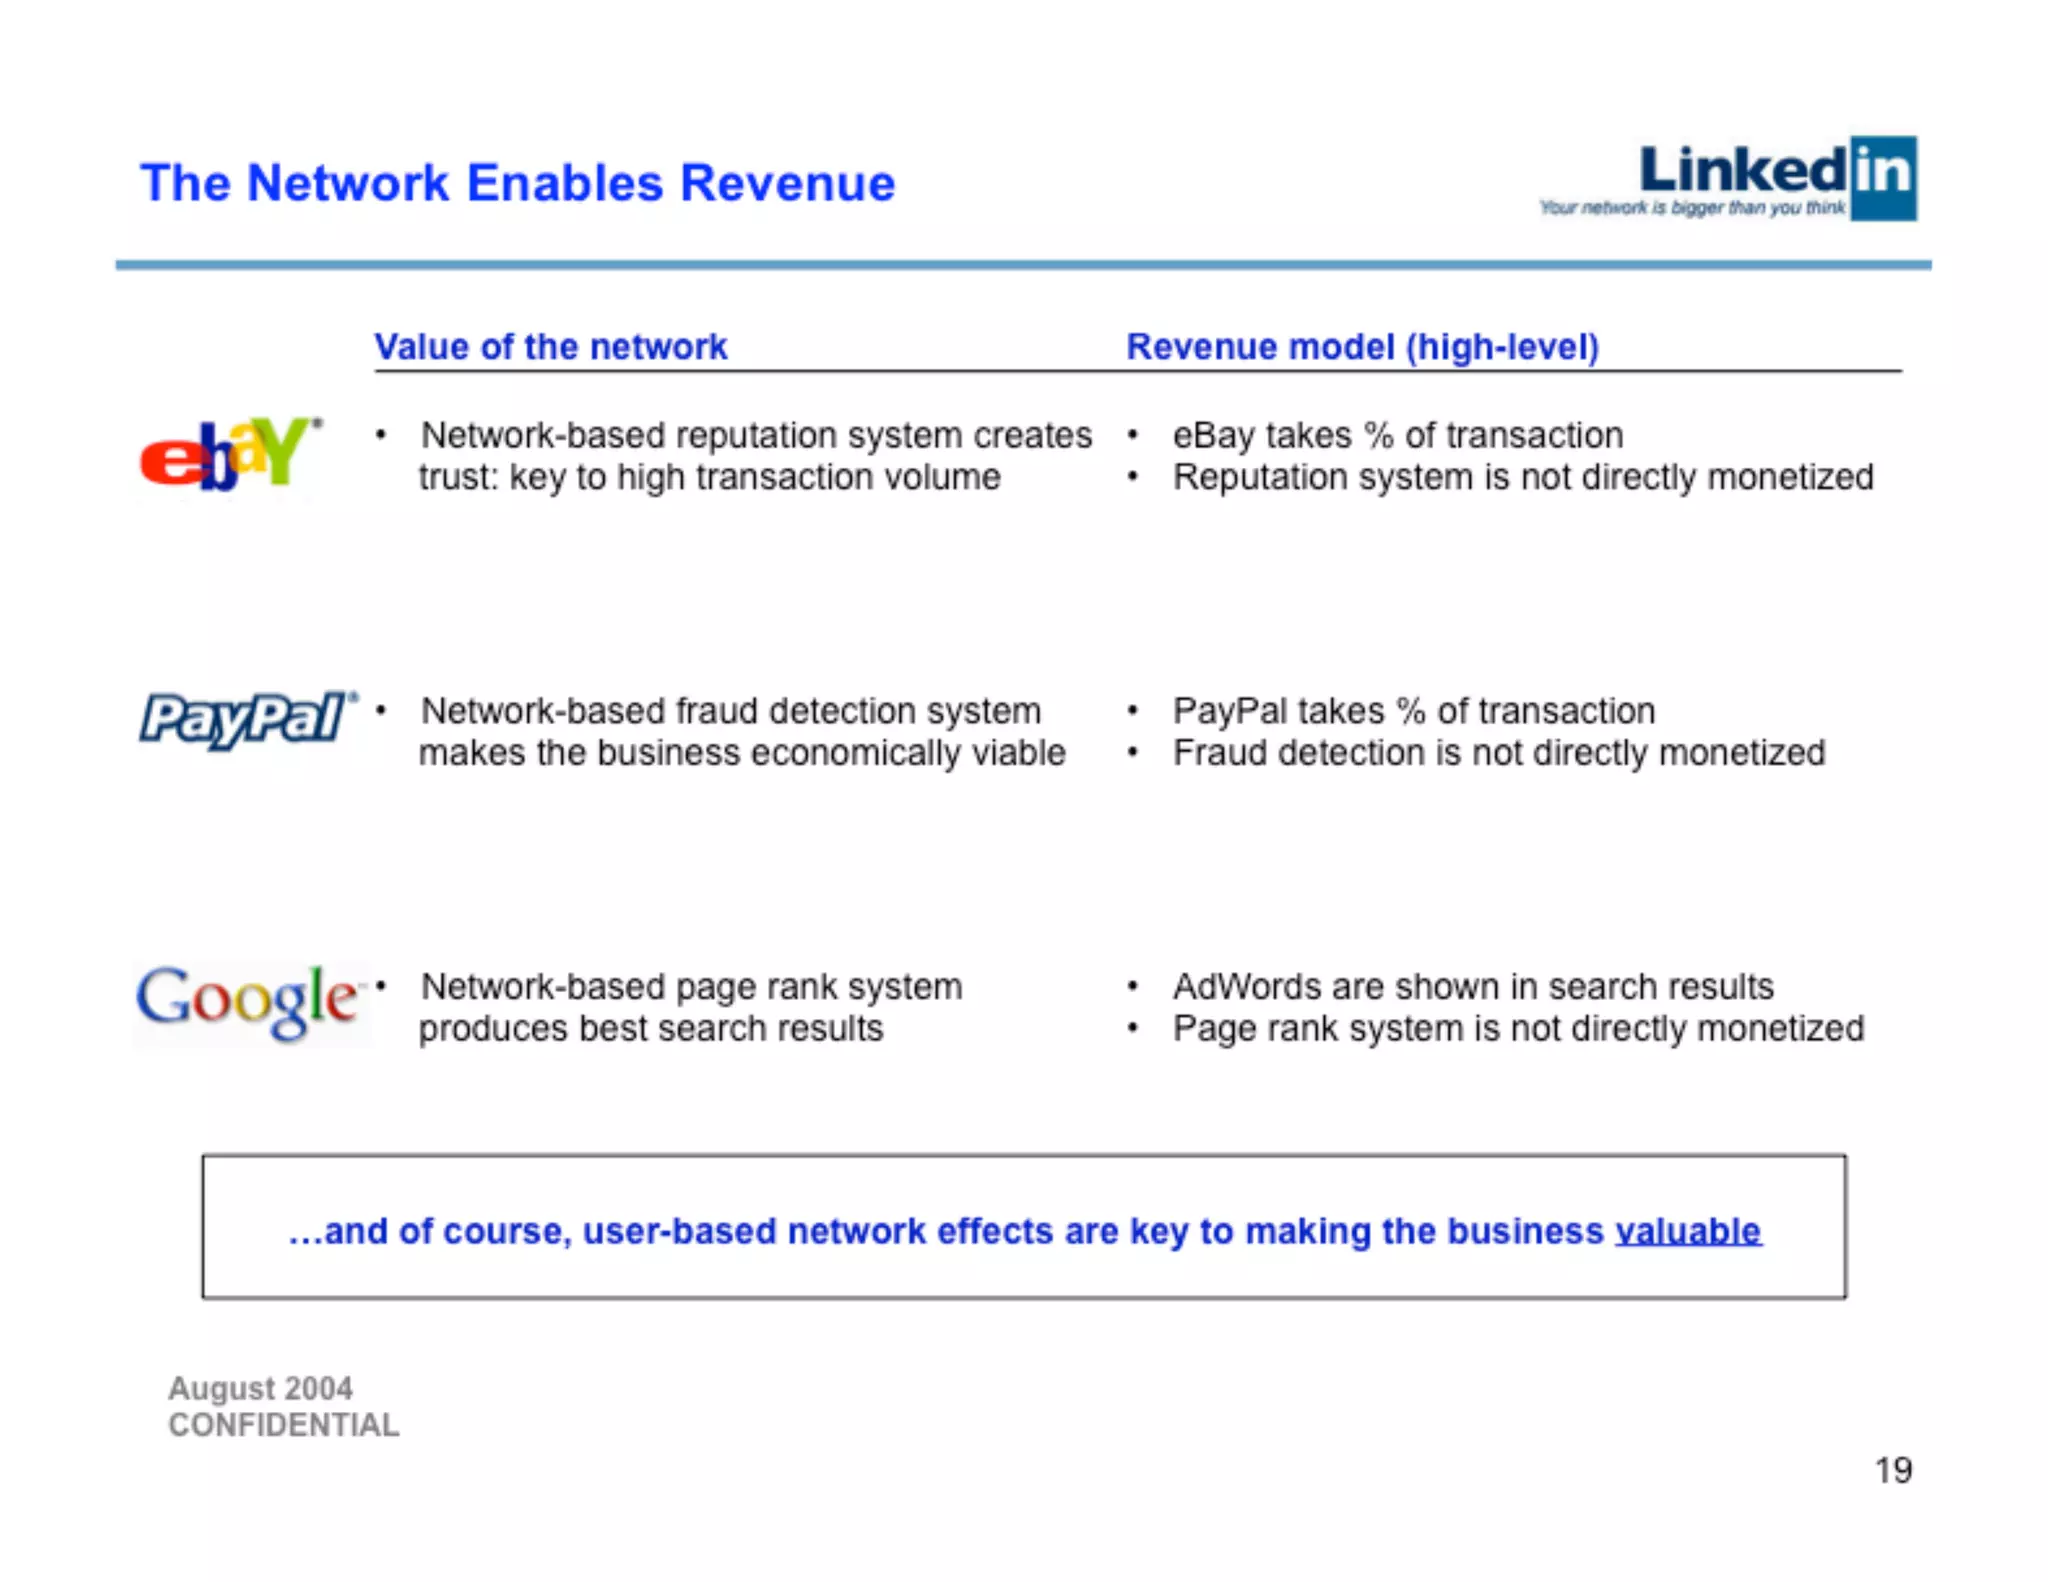
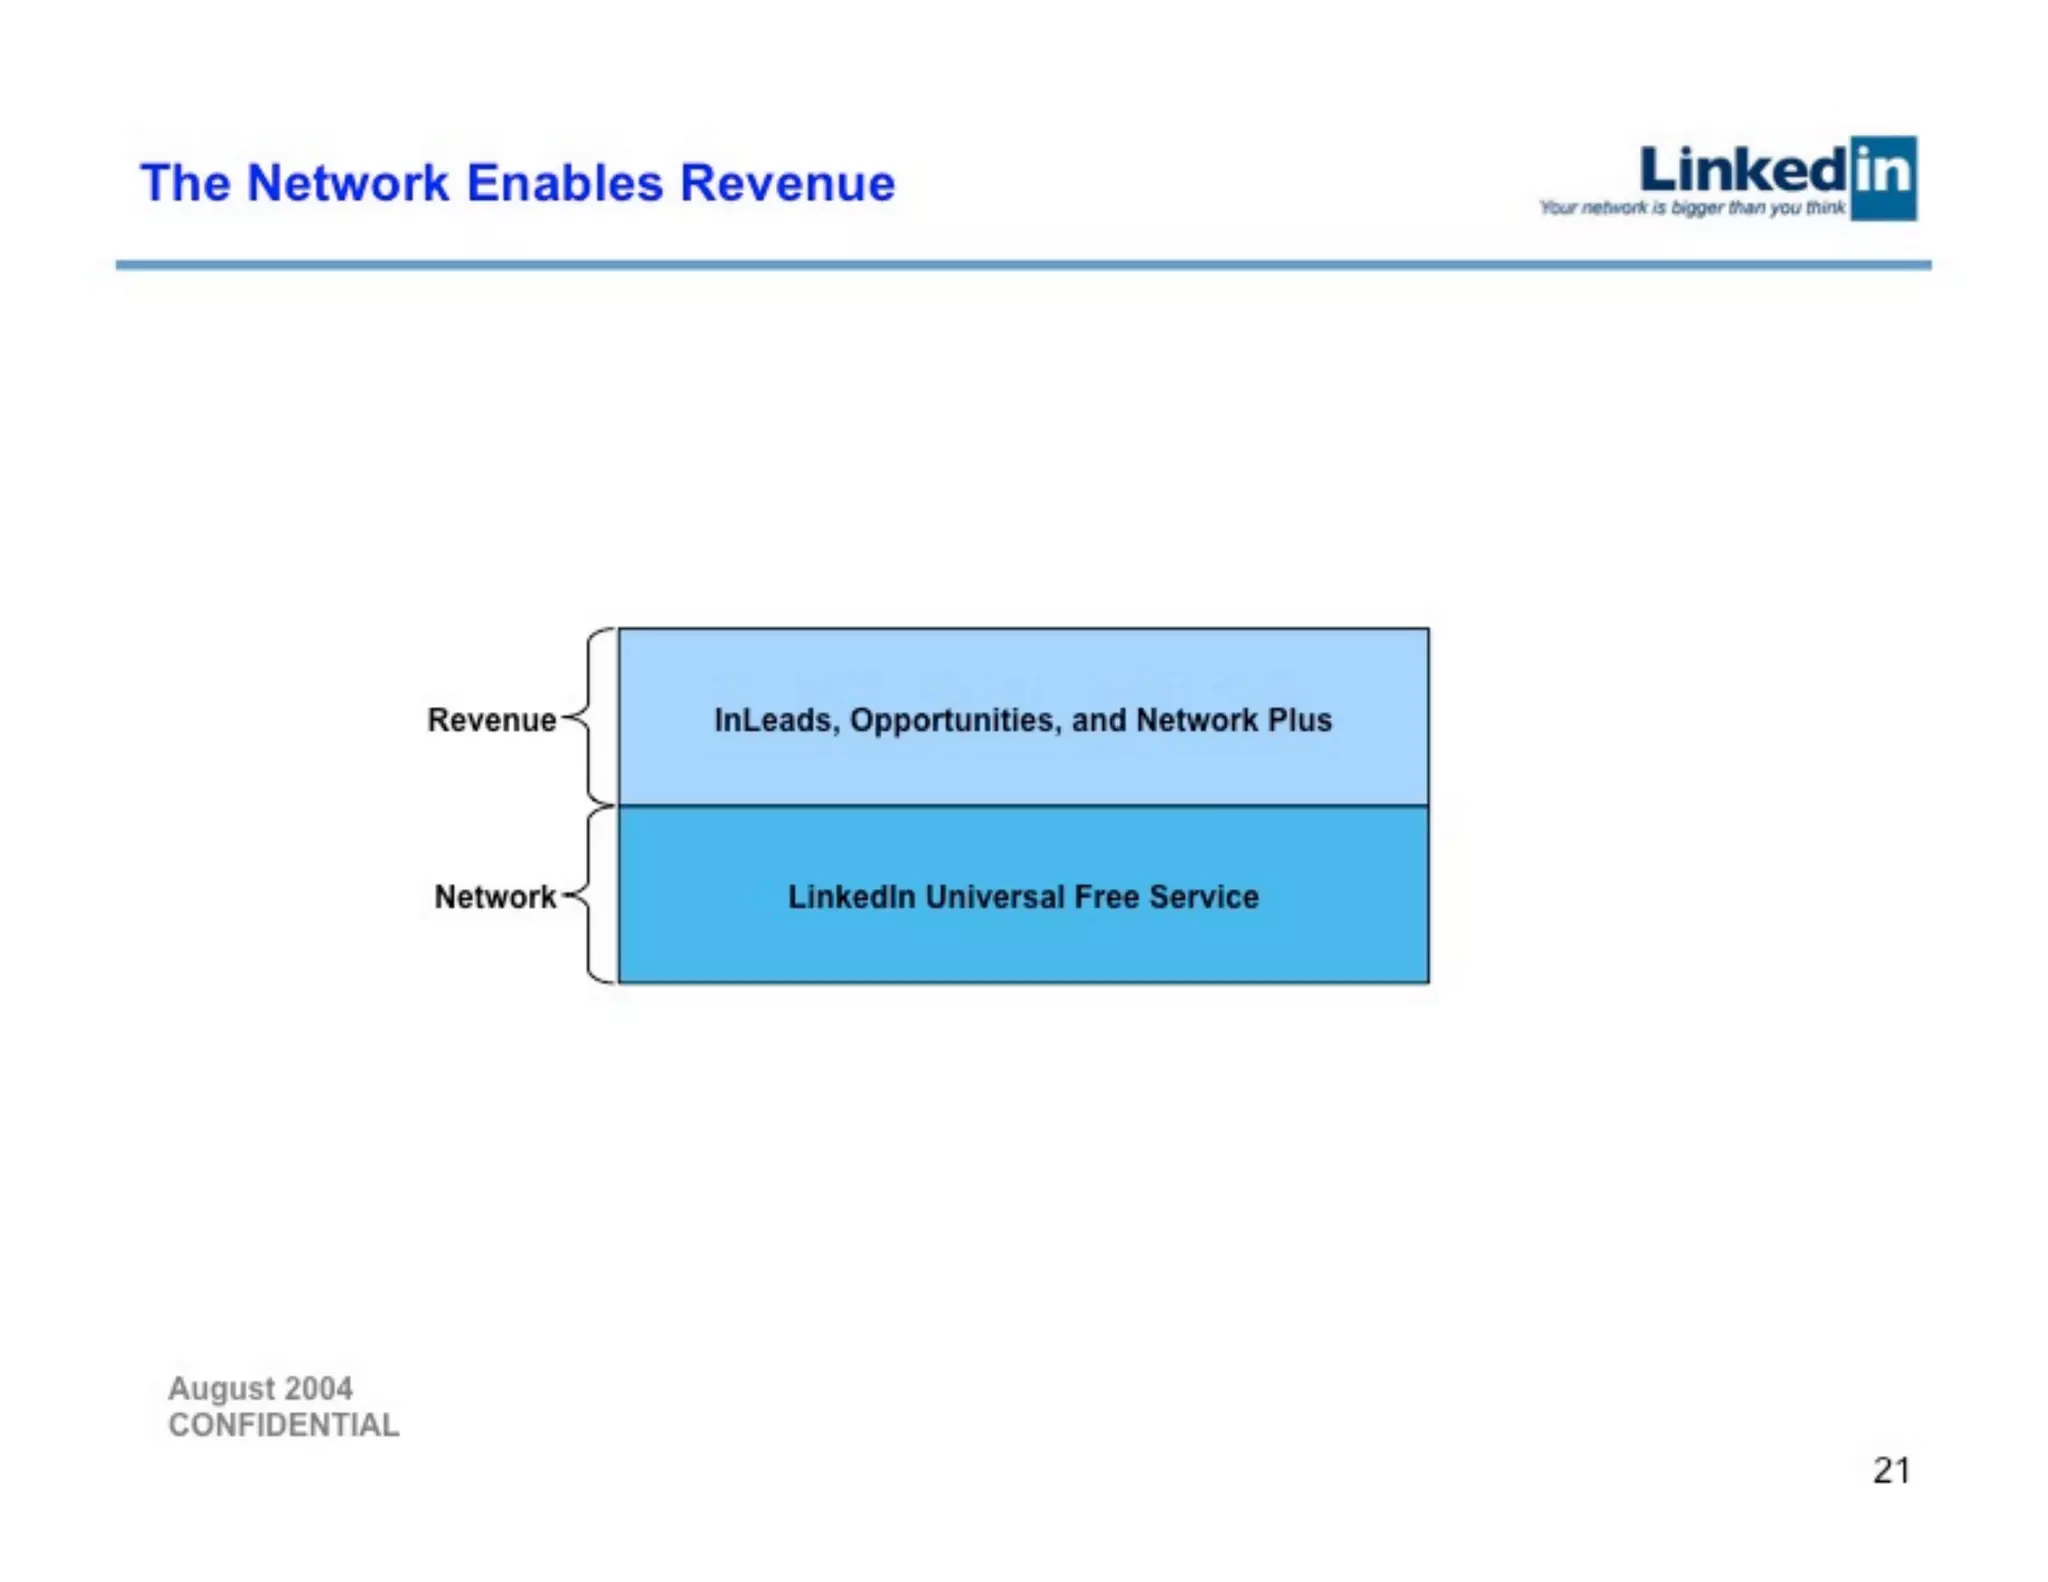
Slide 20 provides a concise mapping from the network's value to revenue models by comparing LinkedIn to eBay, PayPal and Google: reputation, fraud detection and PageRank are valuable but rarely monetized directly — instead these enable high-volume transactions or targeted advertising. LinkedIn’s three-pronged plan (InLeads ads, Opportunities job listings, Network Plus subscriptions) is presented as logical derivatives of network utility rather than ad-hoc monetization attempts.

This is a strong pattern for founders: show that monetization isn't divorced from product value; it follows organically. Present each revenue stream as a natural extension of the product's core utility and clarify which parts of the system are kept free (to grow the network) versus monetized (to capture value).

Key Takeaway: Tie each revenue stream directly to an aspect of product utility so monetization feels organic and scalable.
Product-level monetization: InLeads and job features

Product-level monetization: InLeads and job features

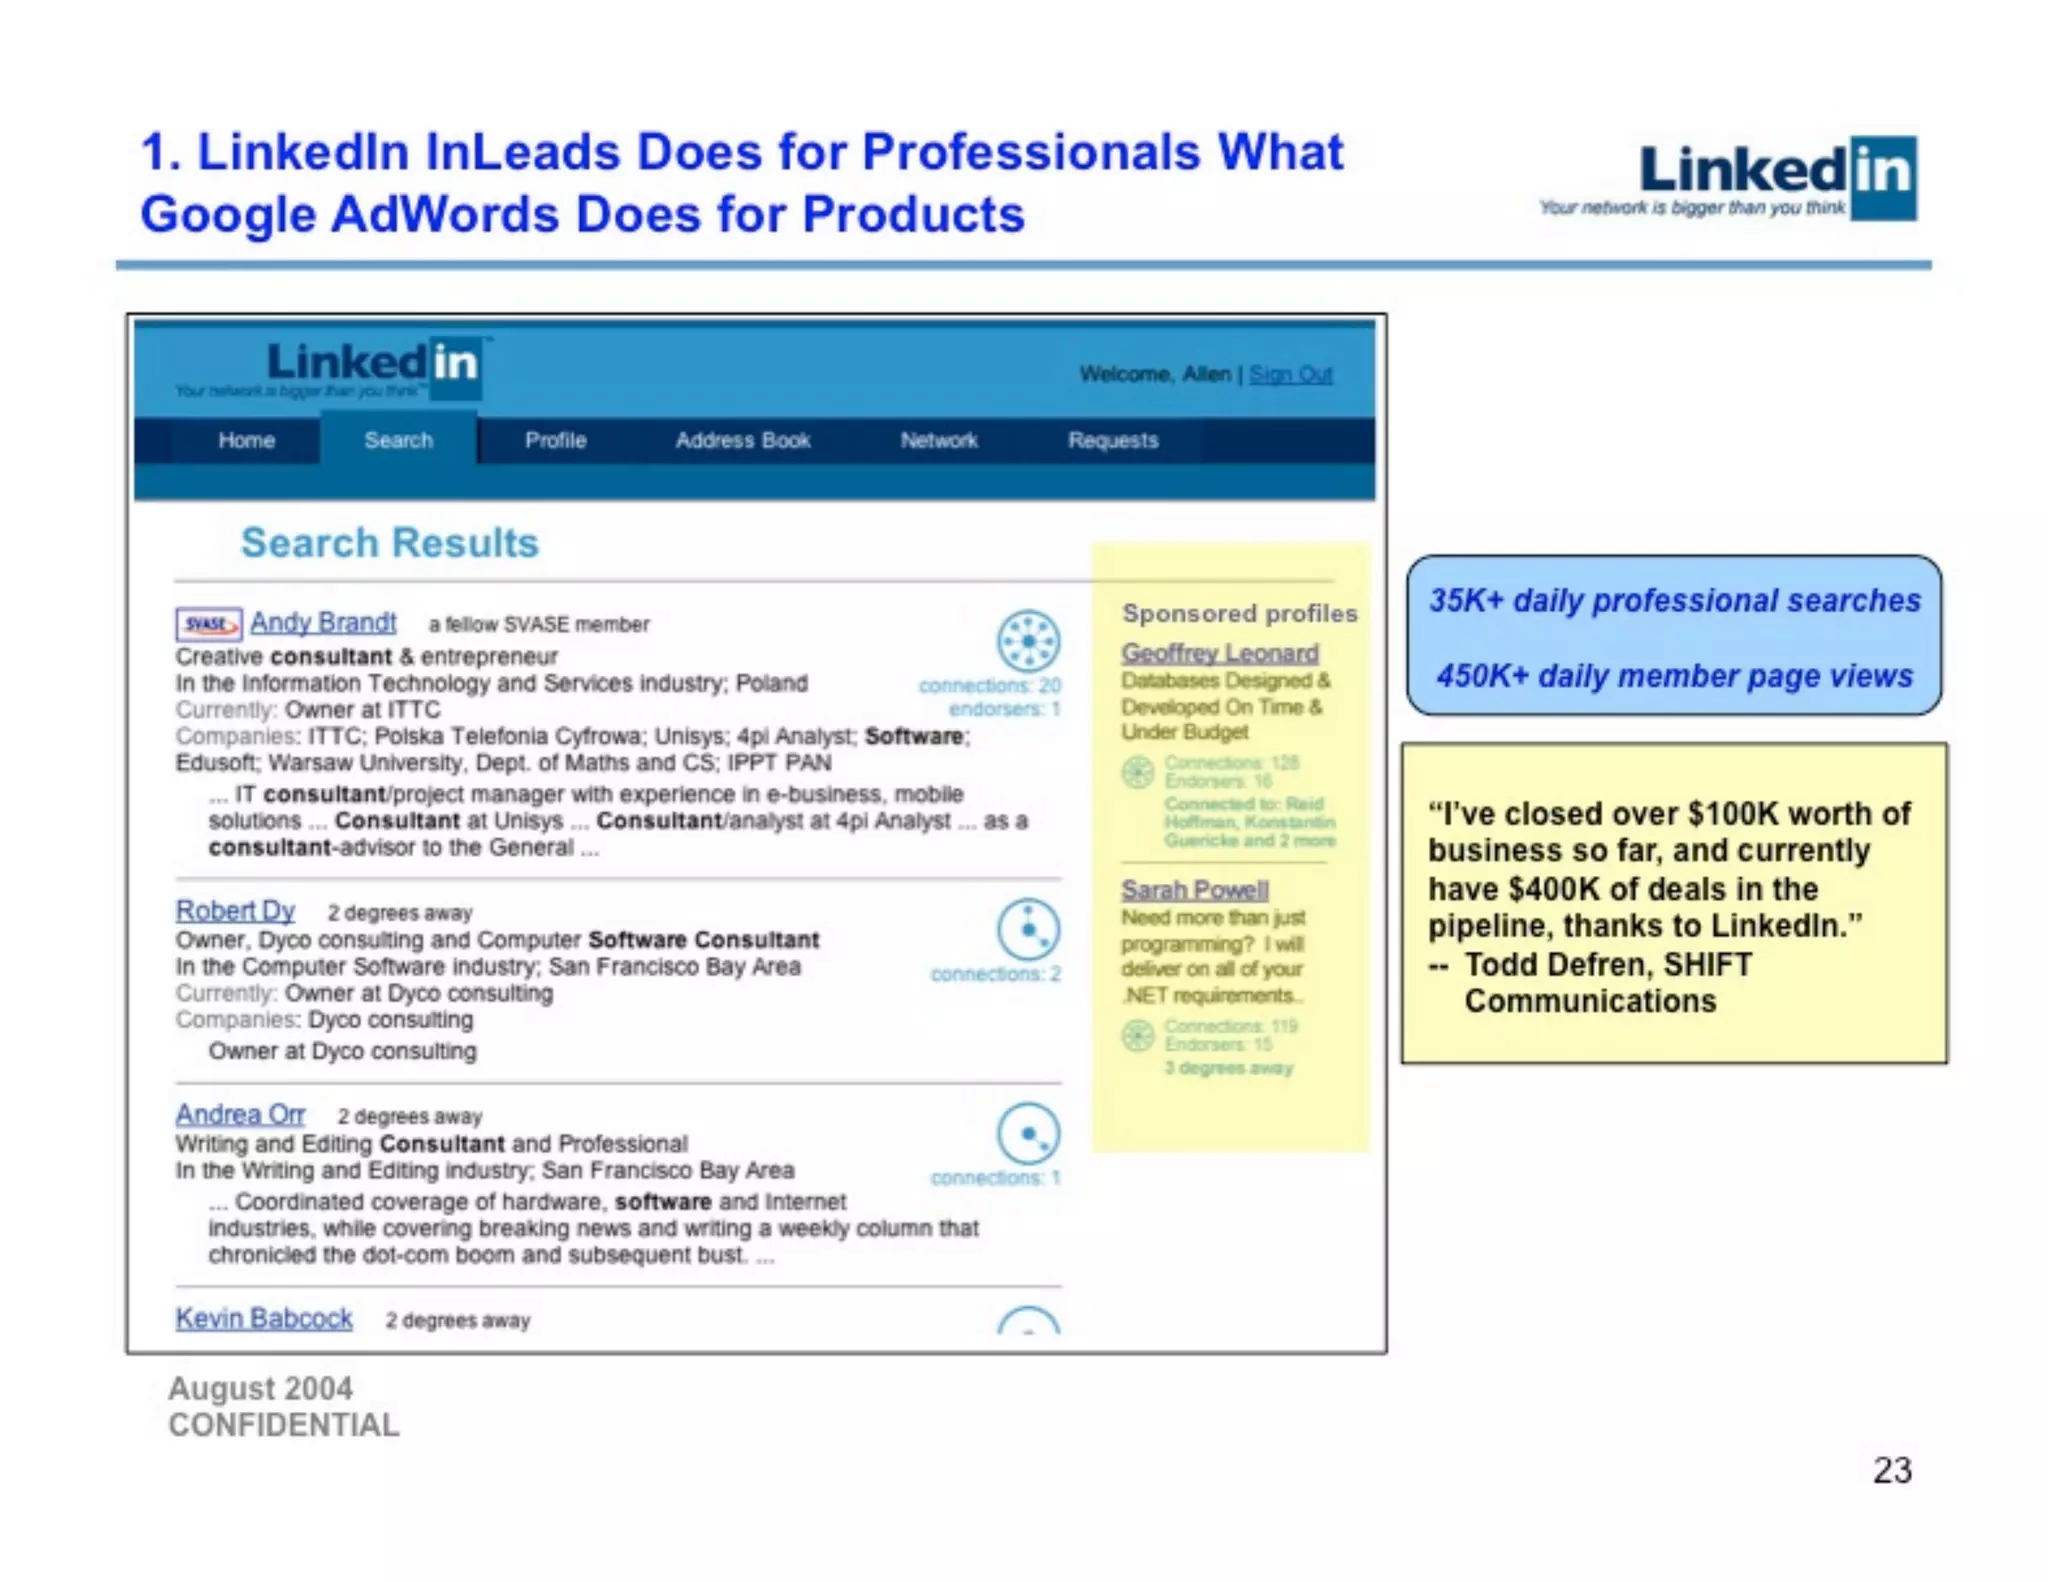
Slide 23 shows product mockups for InLeads (contextual search ads) and cites usage statistics (35K+ daily searches, 450K+ daily page views) plus customer testimonials about revenue impact. The slide is pragmatic: it visualizes how ads integrate into search results and offers evidence of early funnel metrics and business outcomes. That combination of UI example + usage + customer quote turns an abstract ad product into a credible revenue engine.

Founders should learn to demonstrate monetization pilots with real user metrics and UI examples. Investors want to see where and how dollars will appear in the product flow, early signal of willingness-to-pay, and customer stories that validate LTV or pipeline impact. A small pilot with clear KPIs is stronger than an elaborate long-term revenue model without product proof.

Key Takeaway: Present concrete product mockups plus early usage and customer evidence to validate each monetization path.
Market sizing & category opportunity (jobs & advertising)

Market sizing & category opportunity (jobs & advertising)

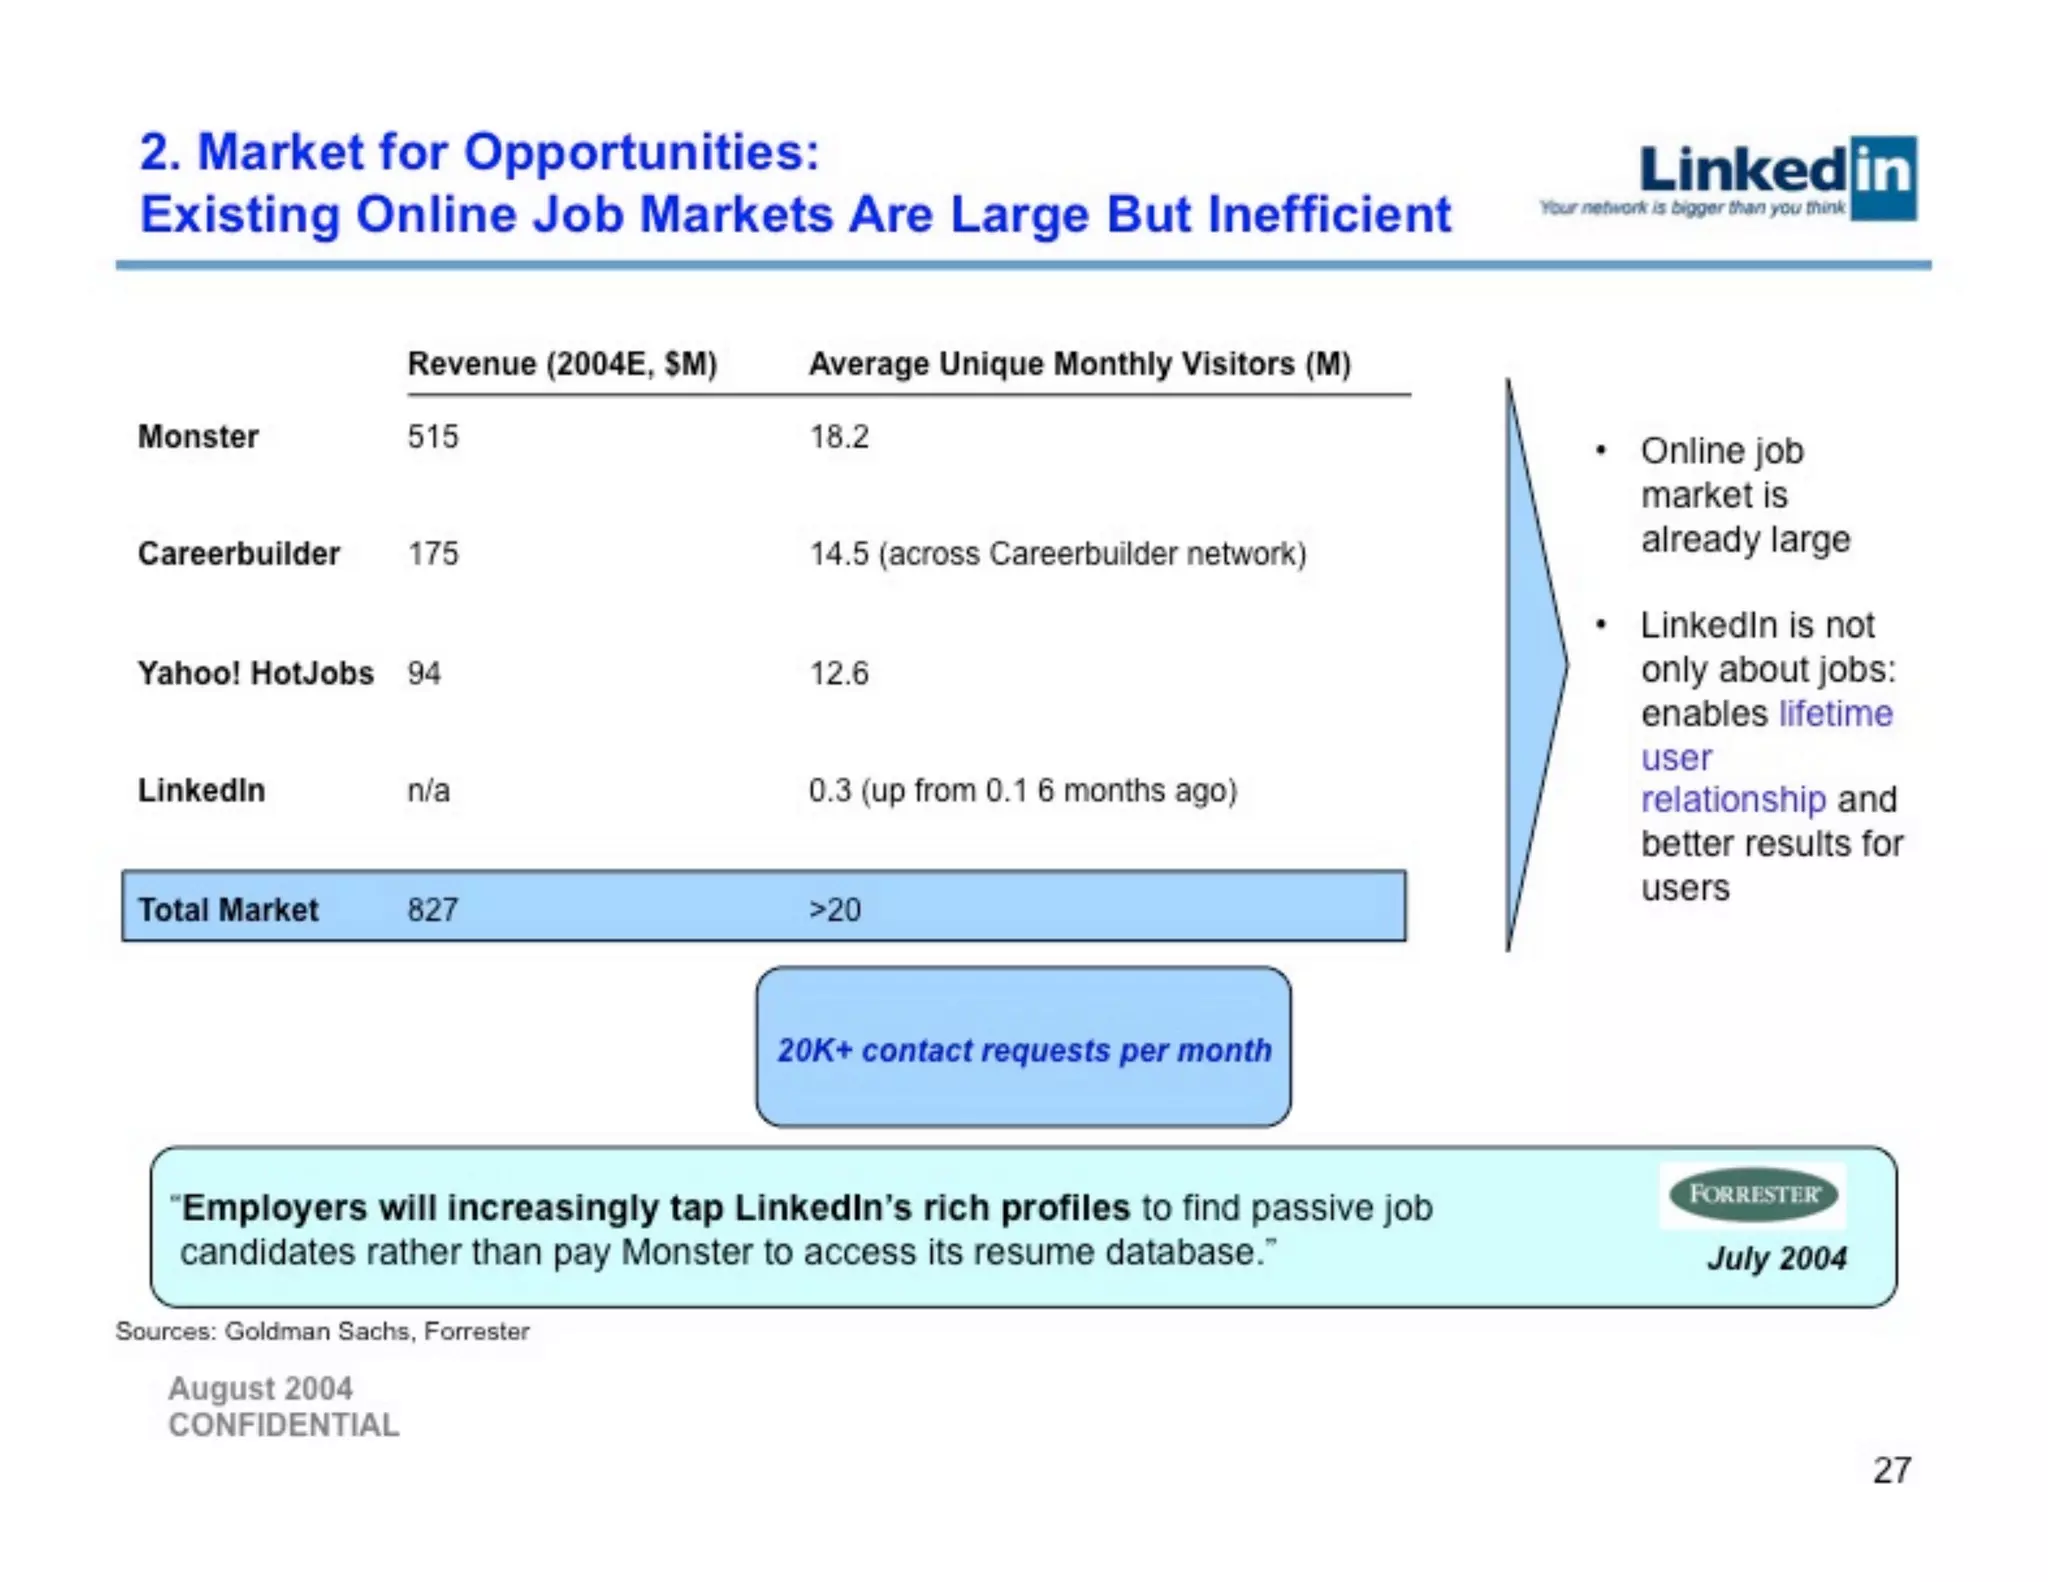
Slide 27 quantifies the existing job-market incumbents (Monster, Careerbuilder, HotJobs) and positions LinkedIn as a differentiated, high-value entrant that enables lifetime user relationships. The slide couples traditional TAM figures with operational signals (20K+ contact requests per month), bridging market size with early engagement metrics. It frames the opportunity as both large and inefficient — an opening for a networked product to capture share.

Founders should use this approach to make TAM credible: juxtapose market dollar estimates with real platform activity to show both why the market matters and that users are already demonstrating the behavior that will unlock revenue. Include both macro numbers and micro signals to make the case actionable.

Key Takeaway: Combine credible market sizing with platform engagement metrics to show both opportunity and early product-market fit.

Conclusion: Key Lessons

LinkedIn’s Series B deck is a model of clarity: it establishes a crisp product thesis (networked people search), explains why that thesis creates defensible advantages (reputation, trust, and network effects), benchmarks against familiar winners, demonstrates real traction, and lays out coherent, product-aligned monetization. The deck balances narrative, numbers and product visuals so each claim is supported by either theory (analogy), data (growth/market share), or product proof (mockups and customer quotes).

Actionable advice for founders: start with a single, defensible insight about why your product is structurally better; use well-chosen analogies to accelerate understanding; prioritize real traction visuals (actual vs projected growth, engagement metrics); link each revenue idea directly to product value; and show product UI or pilot evidence where possible. Above all, make it easy for investors to connect product, growth and monetization in a single unbroken line.

Full Deck Analysis

12 sections

Overview

Company: LinkedIn
Round: Series B ($10M)
Year: August 2004
Outcome: Acquired by Microsoft for $26.2B (2016)
Time to Exit: 12 years

LinkedIn’s Series B pitch deck is a masterclass in problem-solution narrative and market validation, but a cautionary tale in financial transparency. The company demonstrates exceptional user growth (900K users, 29K/week), market dominance (73% share), and prestigious partnerships, yet the entire 28-slide deck contains zero revenue metrics, pricing information, or financial projections—a critical gap that would be unacceptable in modern Series B pitches.


Executive Summary

LinkedIn articulates a compelling thesis: professional networks (like eBay for goods, PayPal for payments, Google for search) will revolutionize how professionals find jobs, build relationships, and conduct business. The deck builds this narrative through four analogies (Slides 5-8), then validates it with impressive growth metrics (900K users in 15 months, 73% market share) and prestigious partnerships (DirectEmployers, American Express OPEN). However, the pitch is fundamentally incomplete—it demonstrates product-market fit and user traction but provides zero evidence that the business model generates revenue or a path to profitability. This represents a significant risk for Series B investors, who typically expect to see unit economics, financial projections, and clear monetization evidence.


Problem Statement

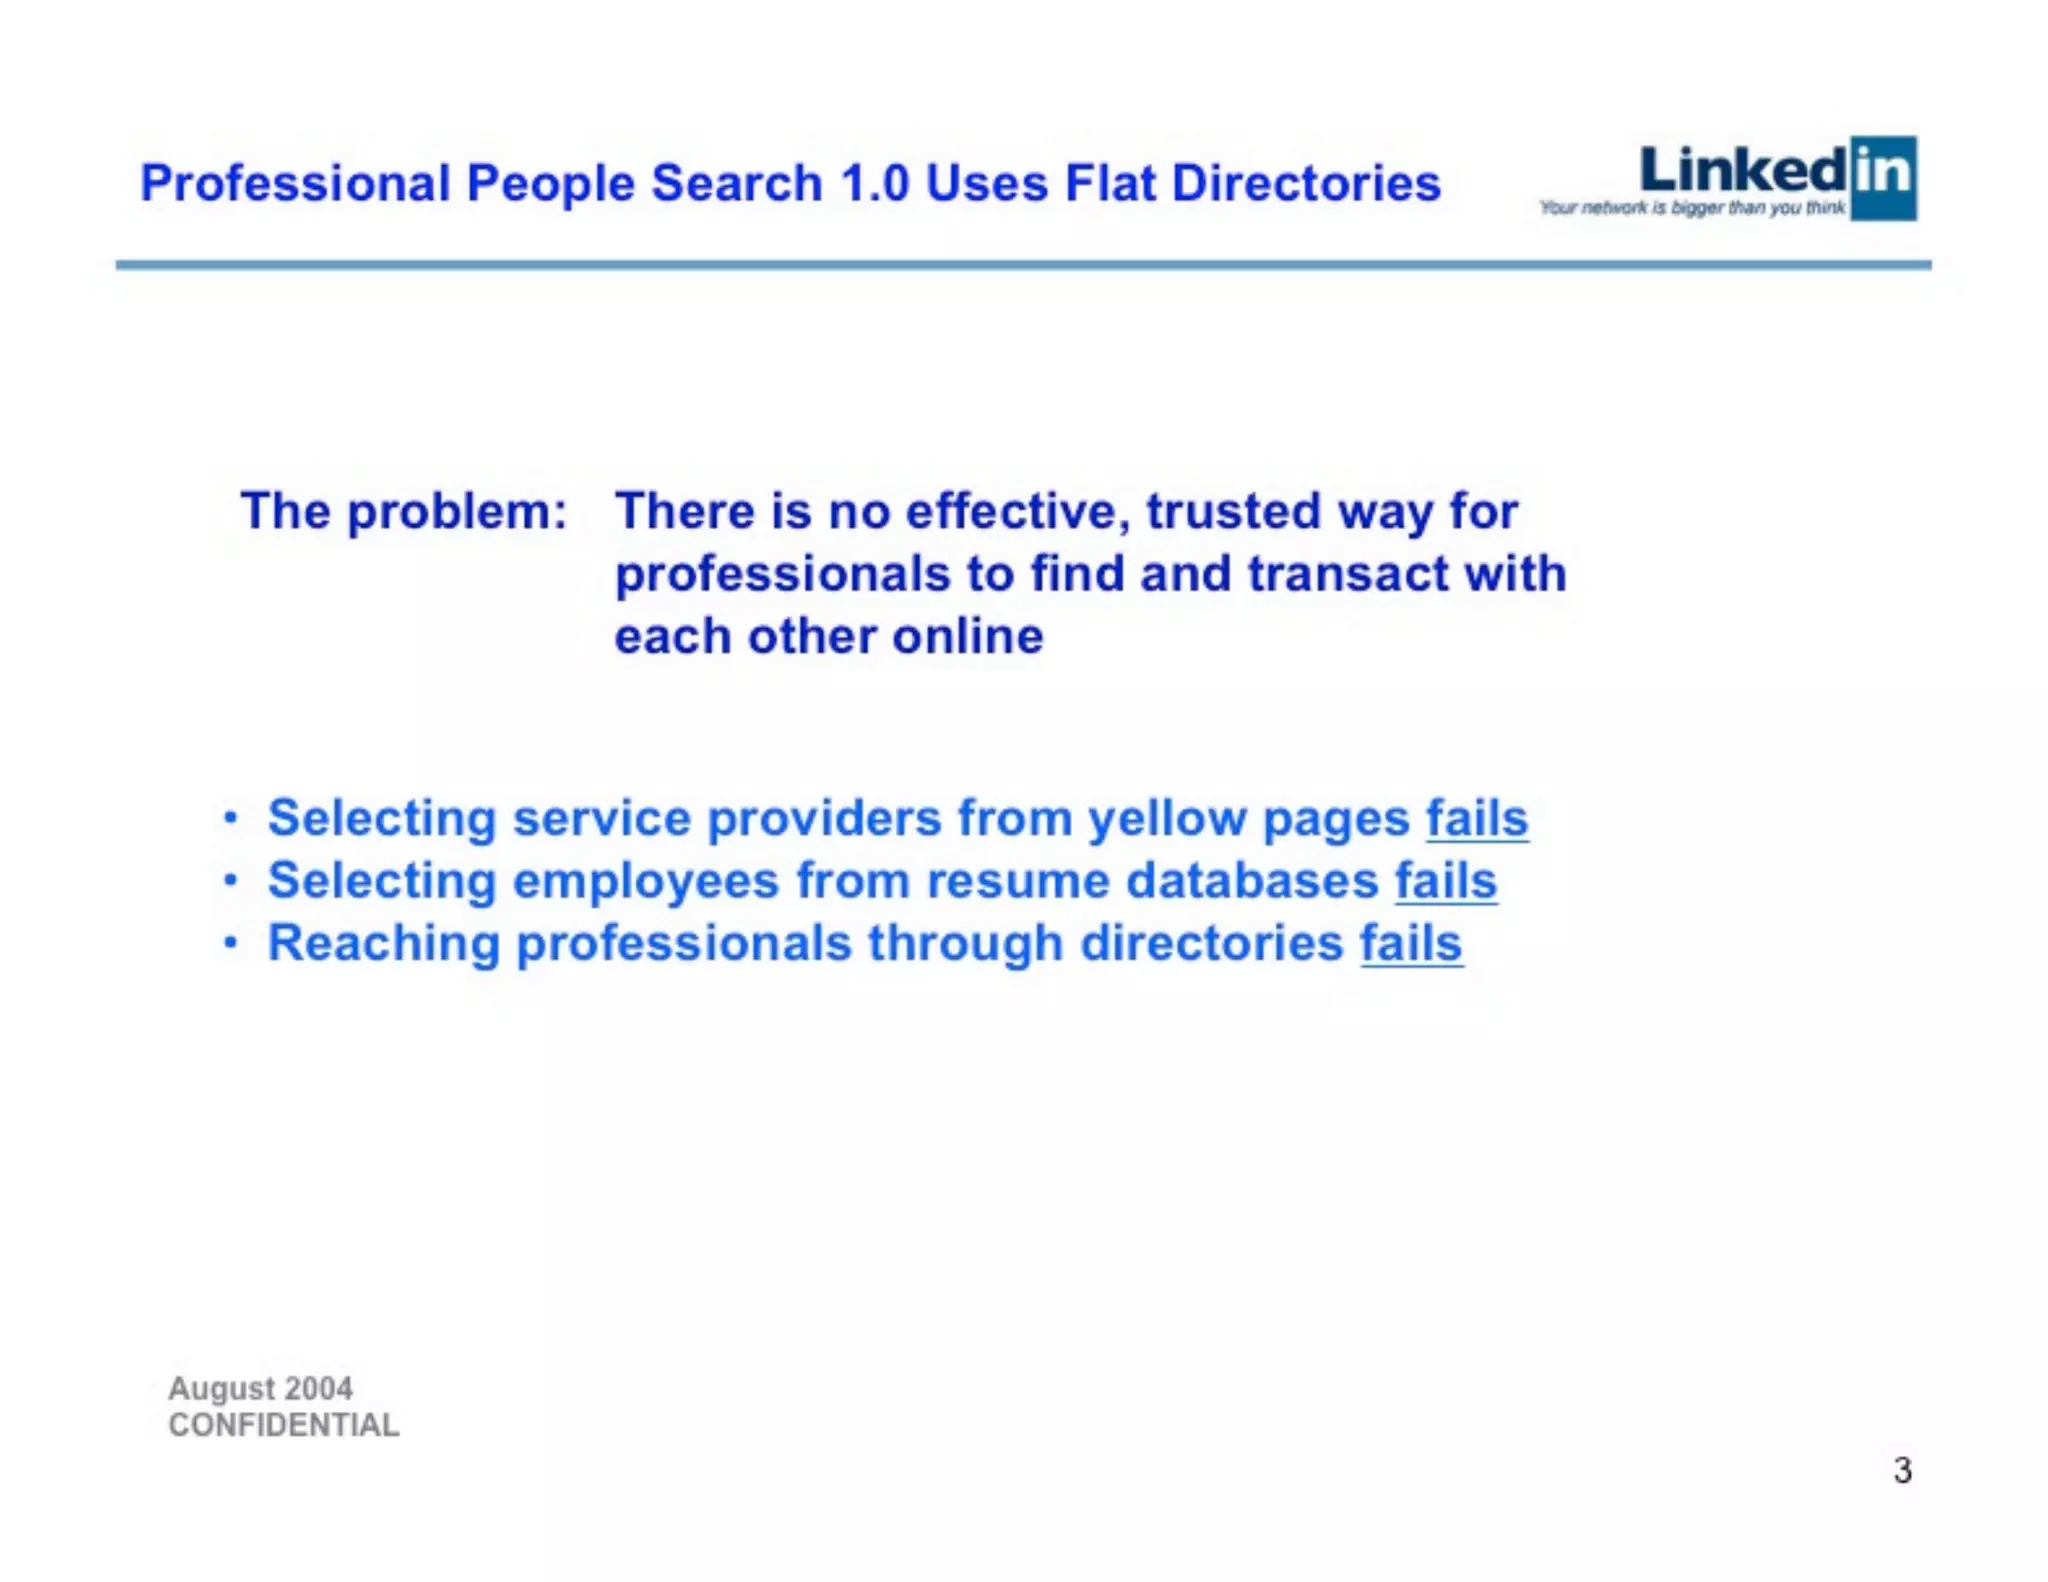
Slides 3-4: “Professional People Search 1.0 Uses Flat Directories”

LinkedIn frames the problem as a trust and efficiency gap in professional discovery:

“There is no effective, trusted way for professionals to find and transact with each other online”

Three specific pain points identified:

  1. Selecting service providers from yellow pages fails
  2. Selecting employees from resume databases fails
  3. Reaching professionals through directories fails

Why this matters: The problem is framed as a trust deficit, not just a convenience issue. Existing solutions (yellow pages, resume databases, directories) lack verification mechanisms, making it difficult for professionals to assess credibility.

Competitive context: The deck positions Monster, Lexis Nexis, and traditional directories as “1.0” solutions that rely on individual claims rather than network-based verification.


Solution

Slides 4, 8: “Professional People Search 2.0 Leverages Networks”

LinkedIn’s solution is elegantly simple: replace flat directories with network-based discovery.

Core insight: Network-based reputation systems create trust through verified relationships, not self-reported claims.

Three-part business model (Slides 20, 21):

  1. InLeads — Contextual search text ads (like Google AdWords for professionals)
  2. Opportunities — Network-filtered job listings (like Monster, but with network context)
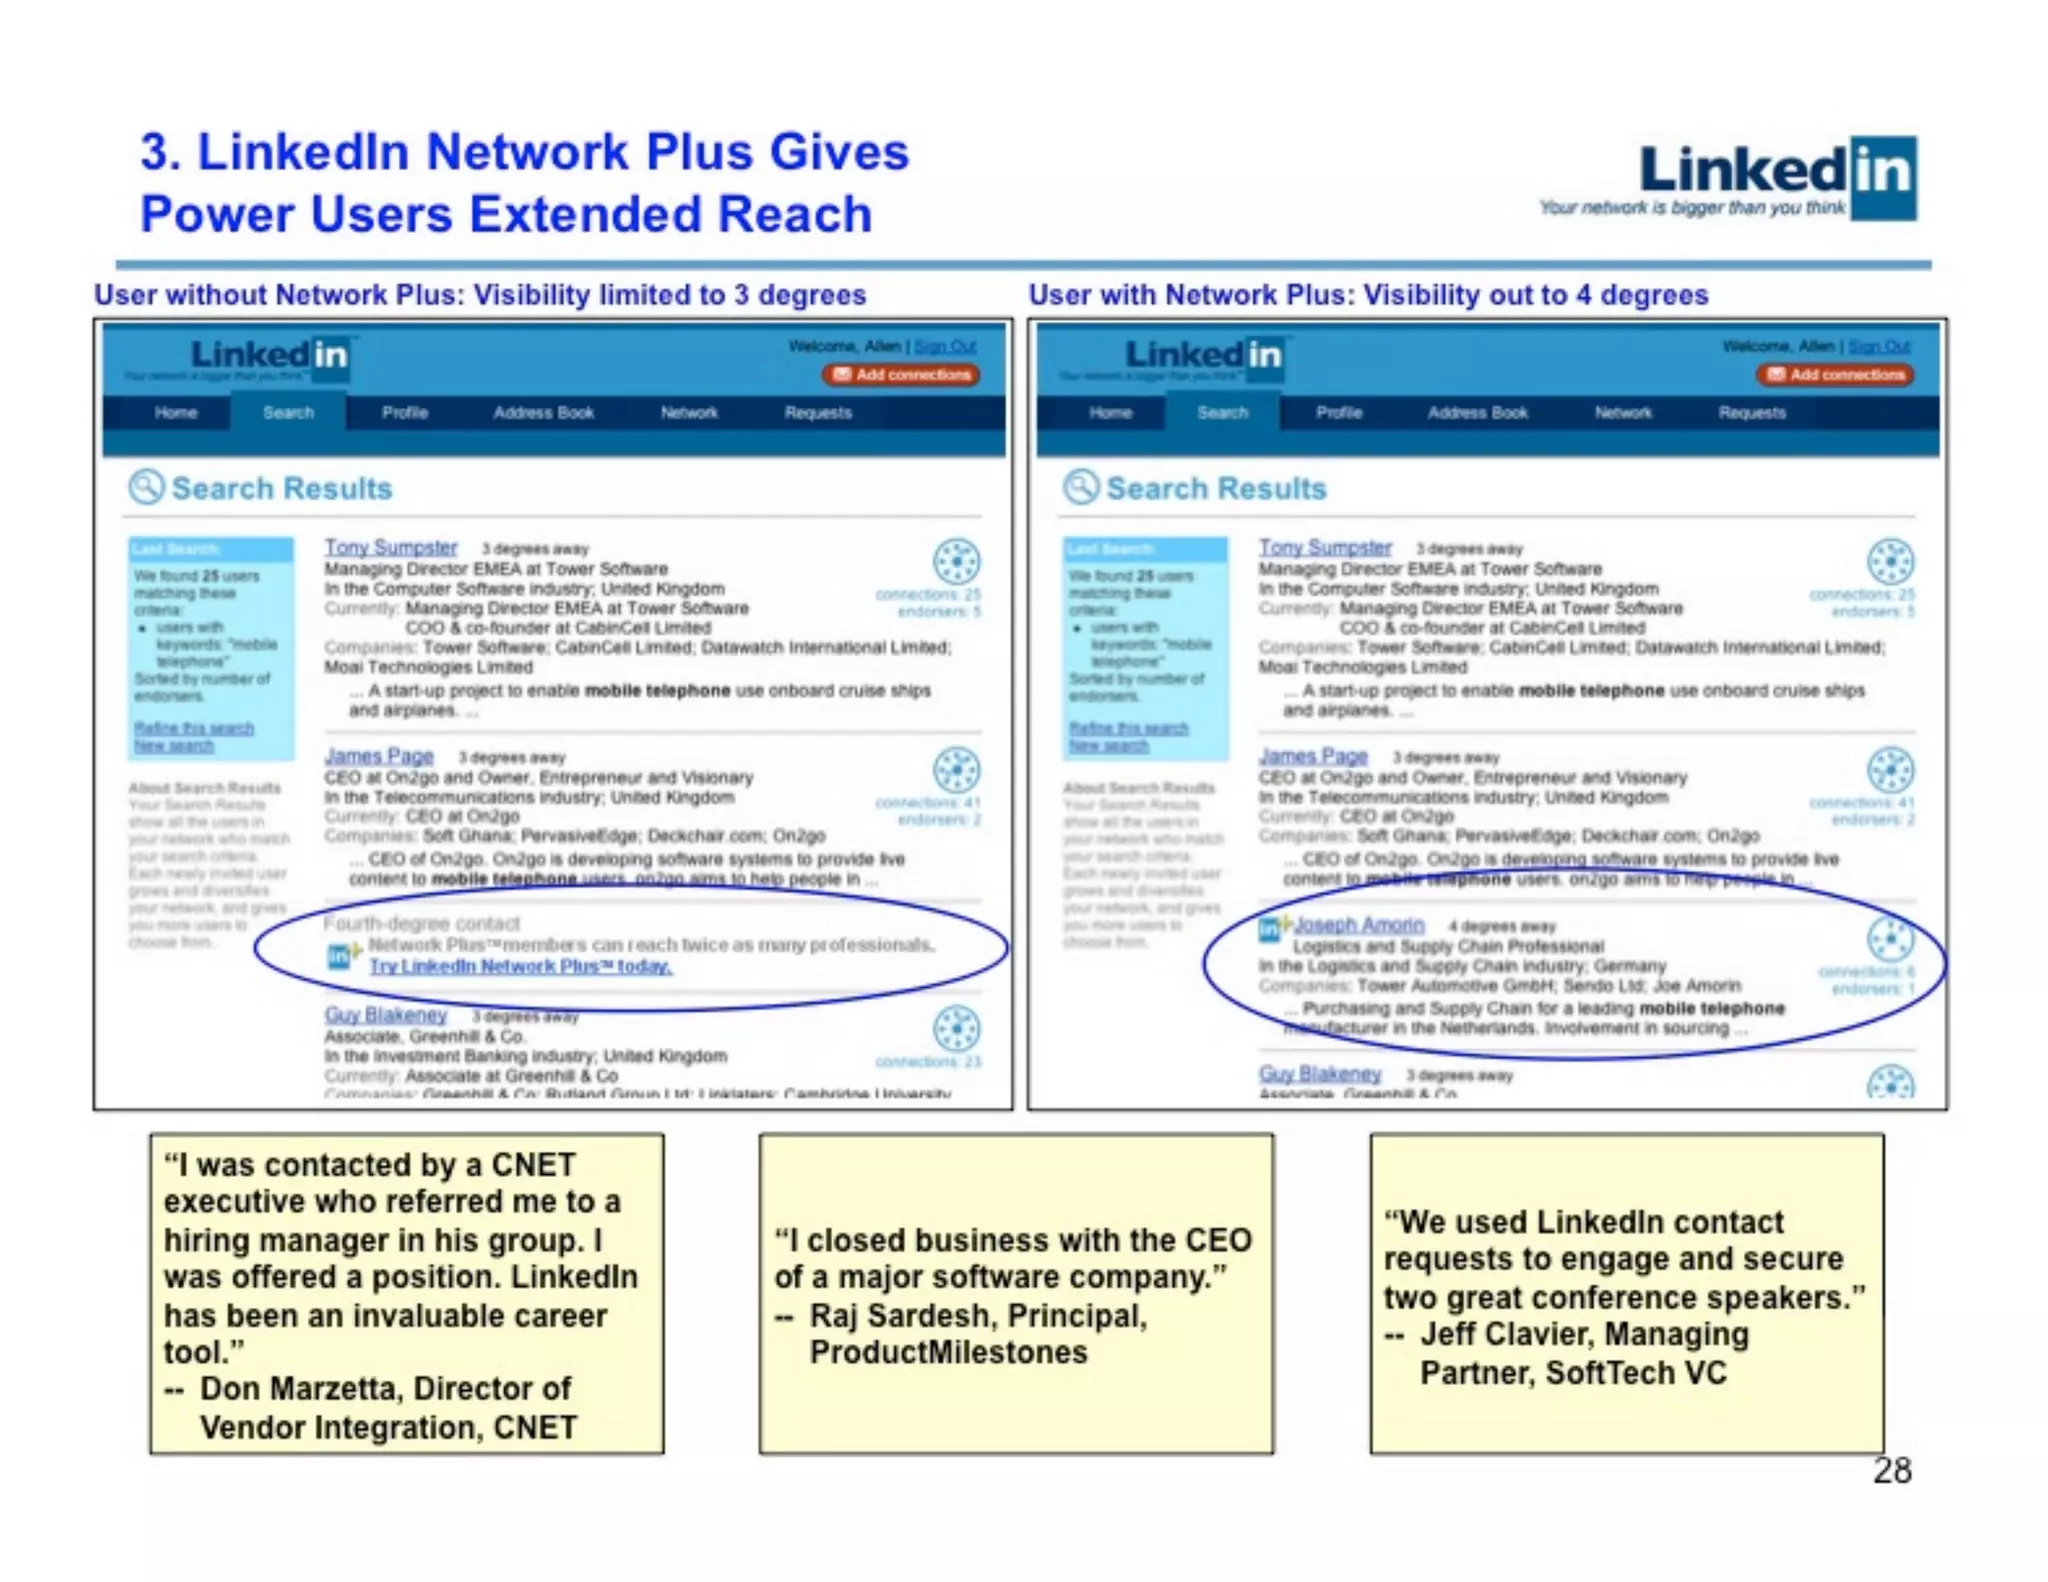
  3. Network Plus — Premium subscription for extended network reach (3 degrees → 4 degrees)

Freemium strategy: Core network stays free for all users (to drive network effects), while premium features monetize engaged power users.

Key positioning: LinkedIn is not just a job board—it’s a lifetime professional relationship platform that enables recruiting, business development, and networking.


Market Opportunity

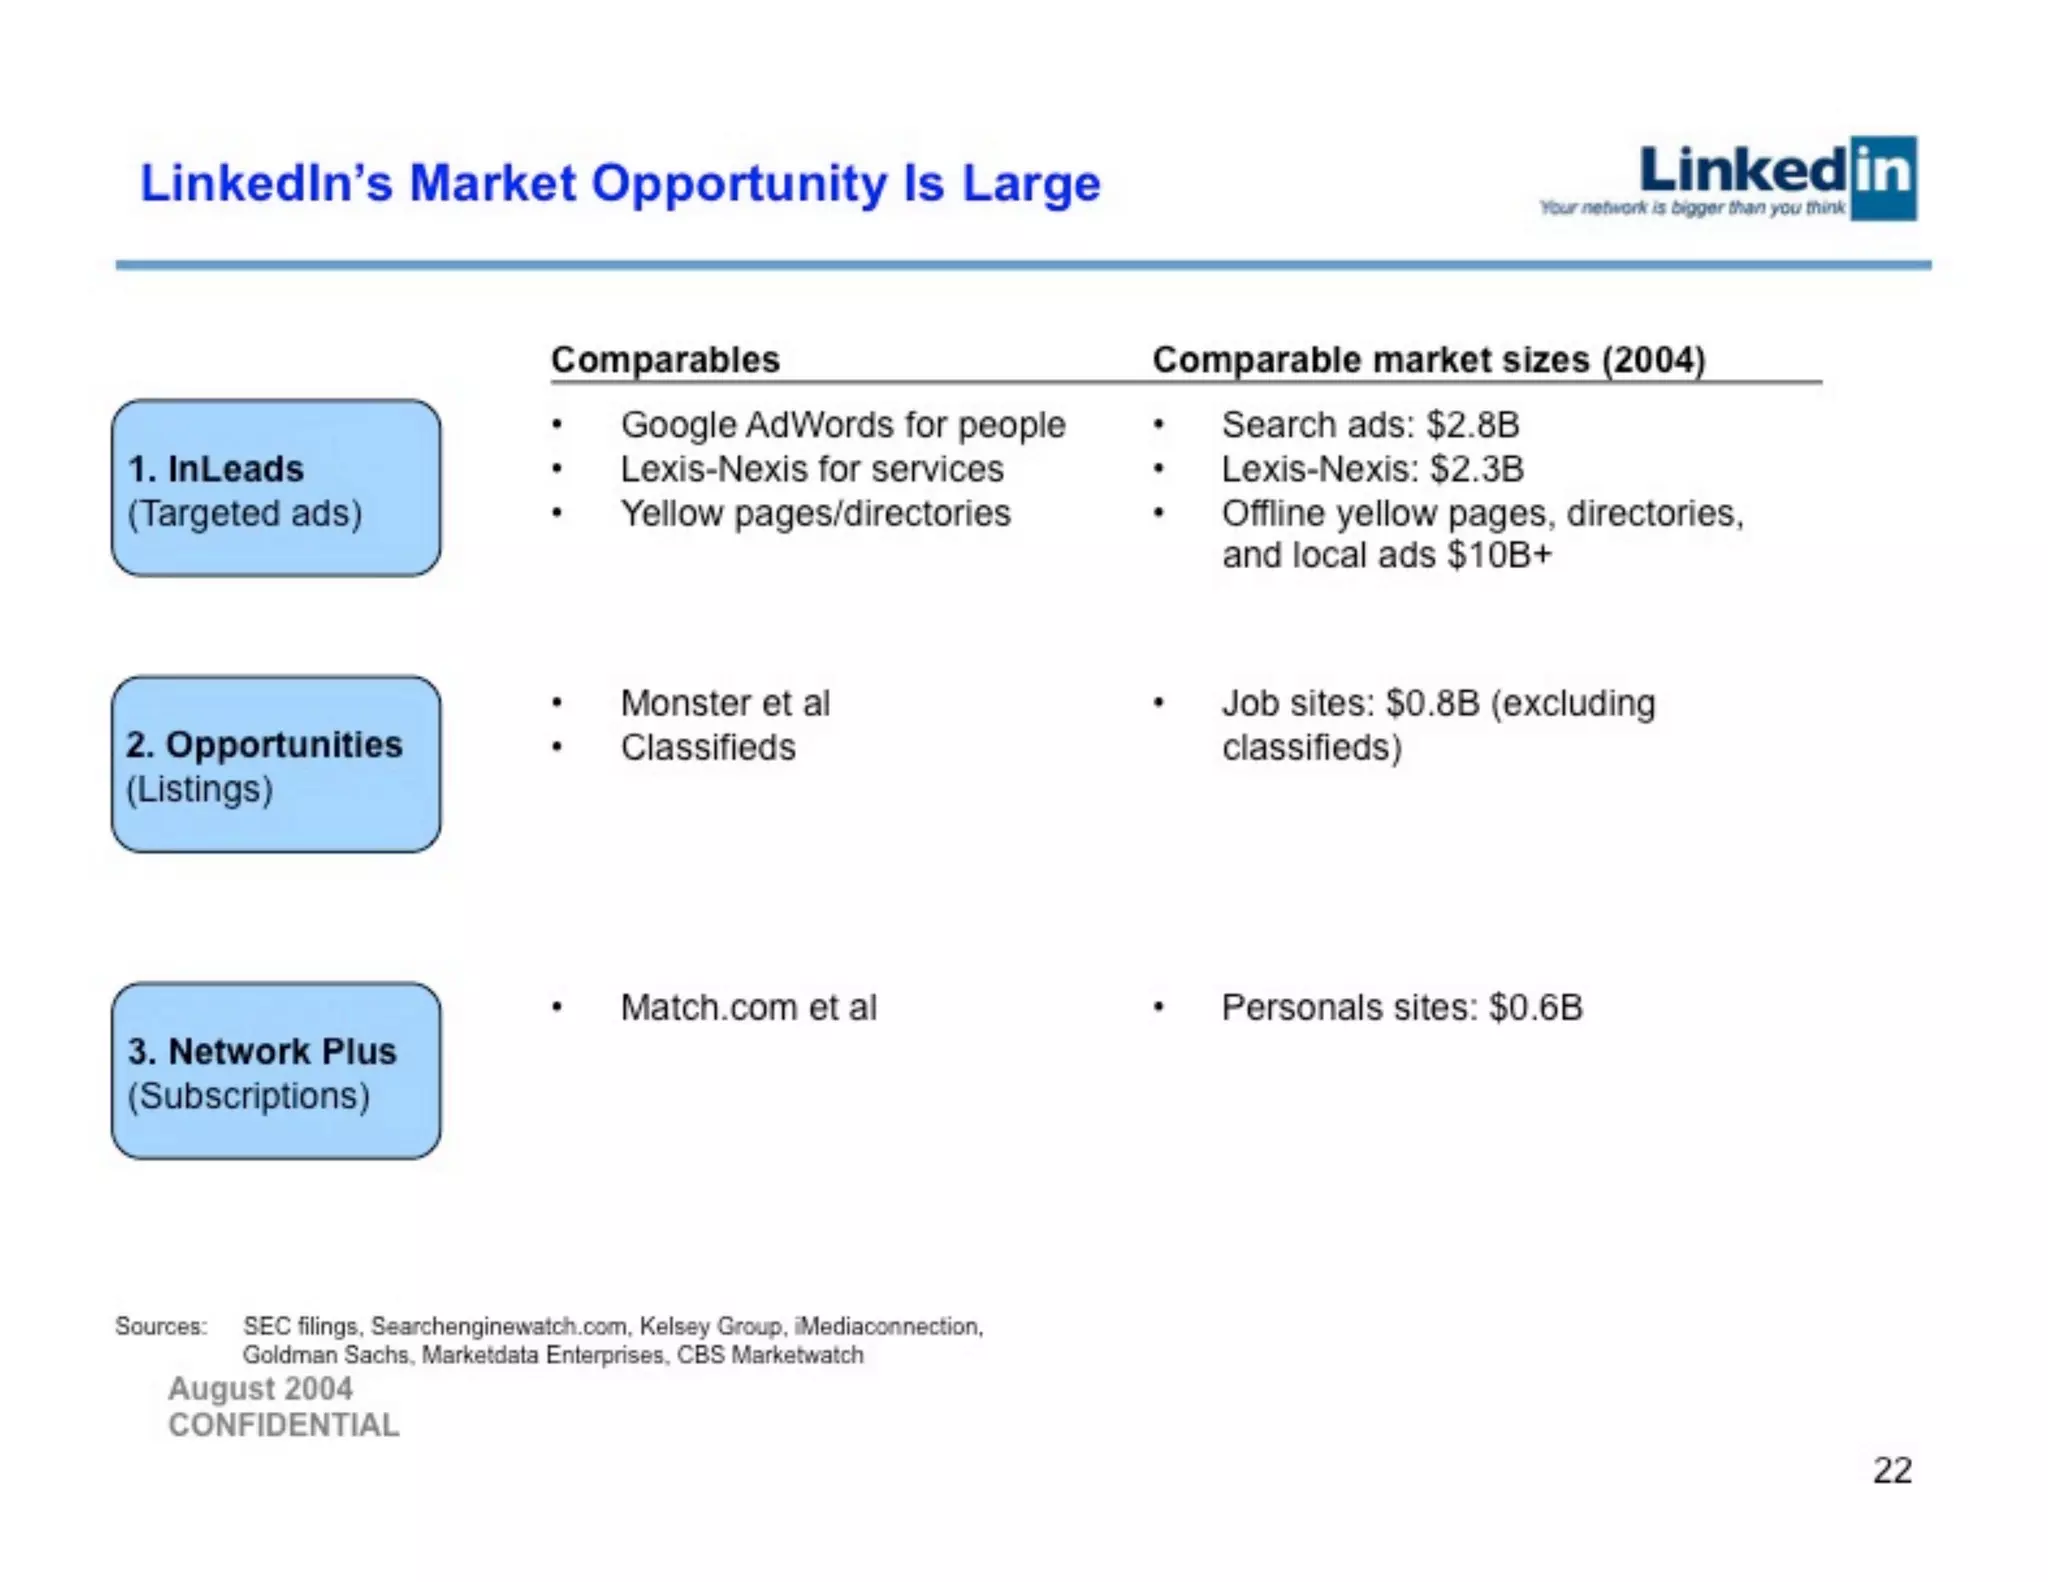
Slide 22: TAM Analysis

LinkedIn identifies three addressable markets:

Revenue Stream Comparable Market Market Size (2004E)
InLeads (Ads) Google AdWords, Lexis-Nexis, Yellow Pages $2.8B (search ads) + $2.3B (Lexis-Nexis) + $10B+ (yellow pages) = $15B+
Opportunities (Listings) Monster, Classifieds $0.8B (job sites, excluding classifieds)
Network Plus (Subscriptions) Match.com, Personals $0.6B (personals sites)
TOTAL TAM — ~$16.2B+

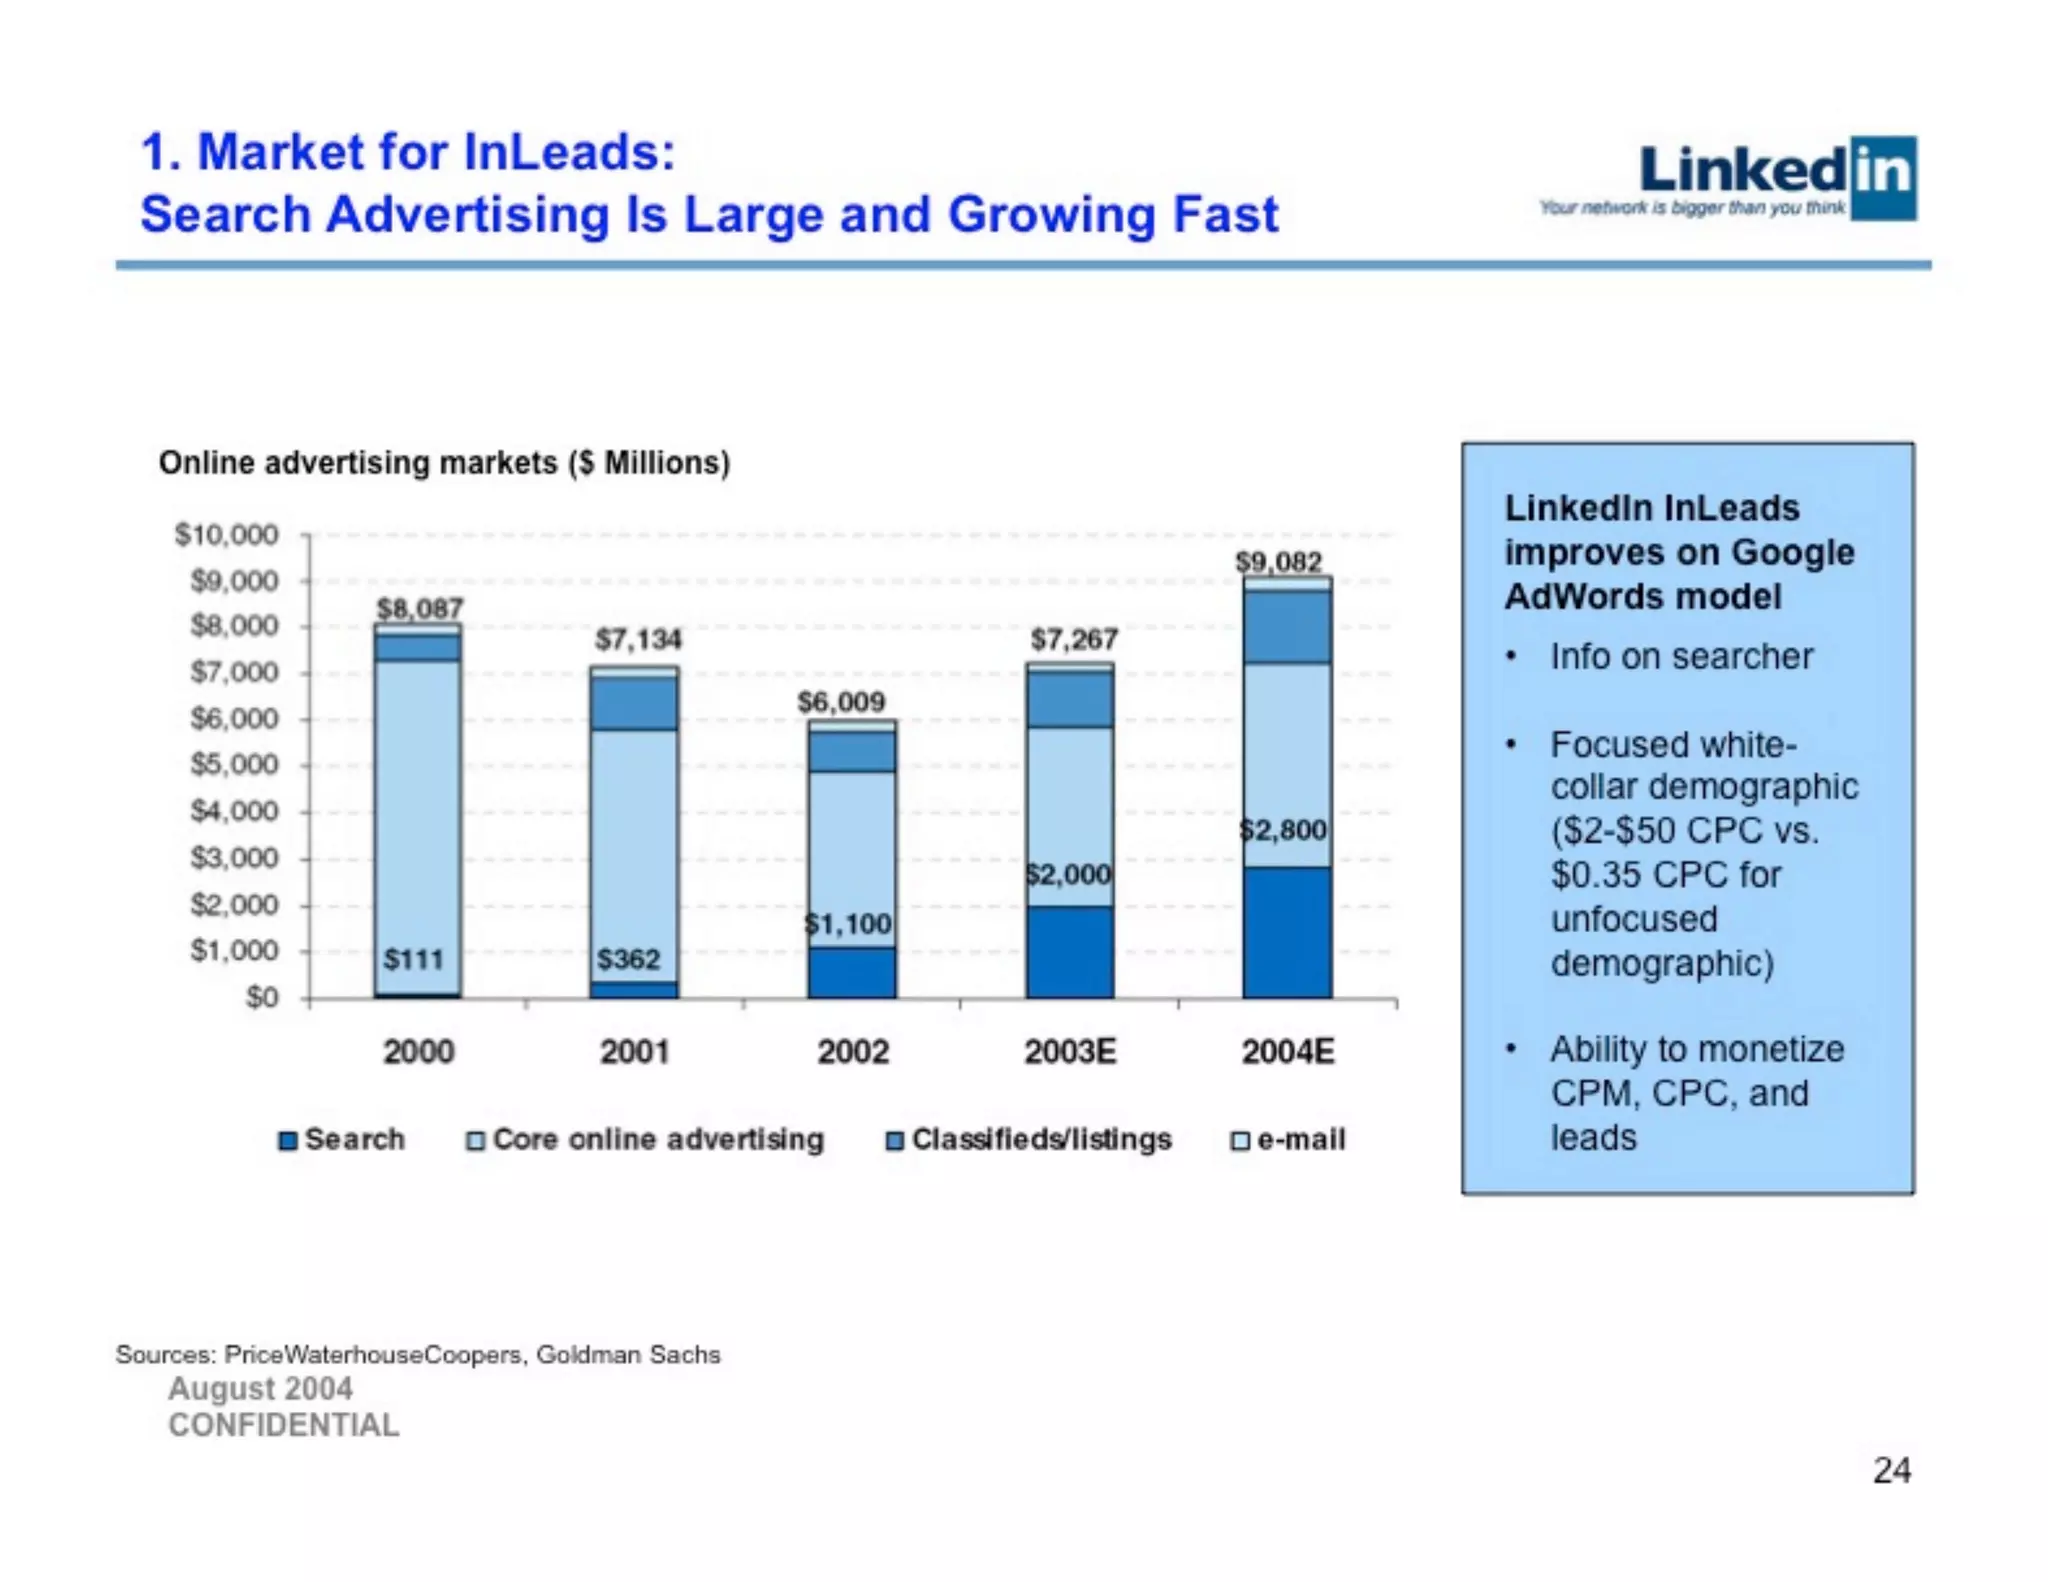
Slide 24: InLeads Market Validation

  • Search advertising market growing explosively: $111M (2000) → $2,800M (2004E) = 25x growth in 4 years
  • Search advertising as % of online advertising: 1.4% (2000) → 30.8% (2004E)
  • LinkedIn’s competitive advantage: $2-$50 CPC for white-collar professionals vs. $0.35 CPC for unfocused demographic (6-143x premium)

Slide 27: Opportunities Market Validation

  • Online job market: $827M total (2004E)
    • Monster: $515M revenue, 18.2M visitors
    • Careerbuilder: $175M revenue, 14.5M visitors
    • Yahoo! HotJobs: $94M revenue, 12.6M visitors
    • LinkedIn: n/a revenue, 0.3M visitors (up from 0.1M 6 months ago)

Critical gap: While TAM is large (~$16B), the deck doesn’t provide SAM (Serviceable Addressable Market) analysis or realistic market share projections for LinkedIn.


Business Model

Slides 19-21: Revenue Model Framework

LinkedIn’s three-part monetization strategy:

1. InLeads (Contextual Search Ads)

  • Comparable: Google AdWords
  • Mechanism: Contextual text ads shown in professional search results
  • Pricing: $2-$50 CPC for white-collar demographic (vs. $0.35 CPC for general search)
  • Traction: 35K+ daily professional searches, 450K+ daily member page views
  • Status: Live with sponsored profiles visible in search results (Slide 23)

2. Opportunities (Network-Filtered Job Listings)

  • Comparable: Monster, Careerbuilder
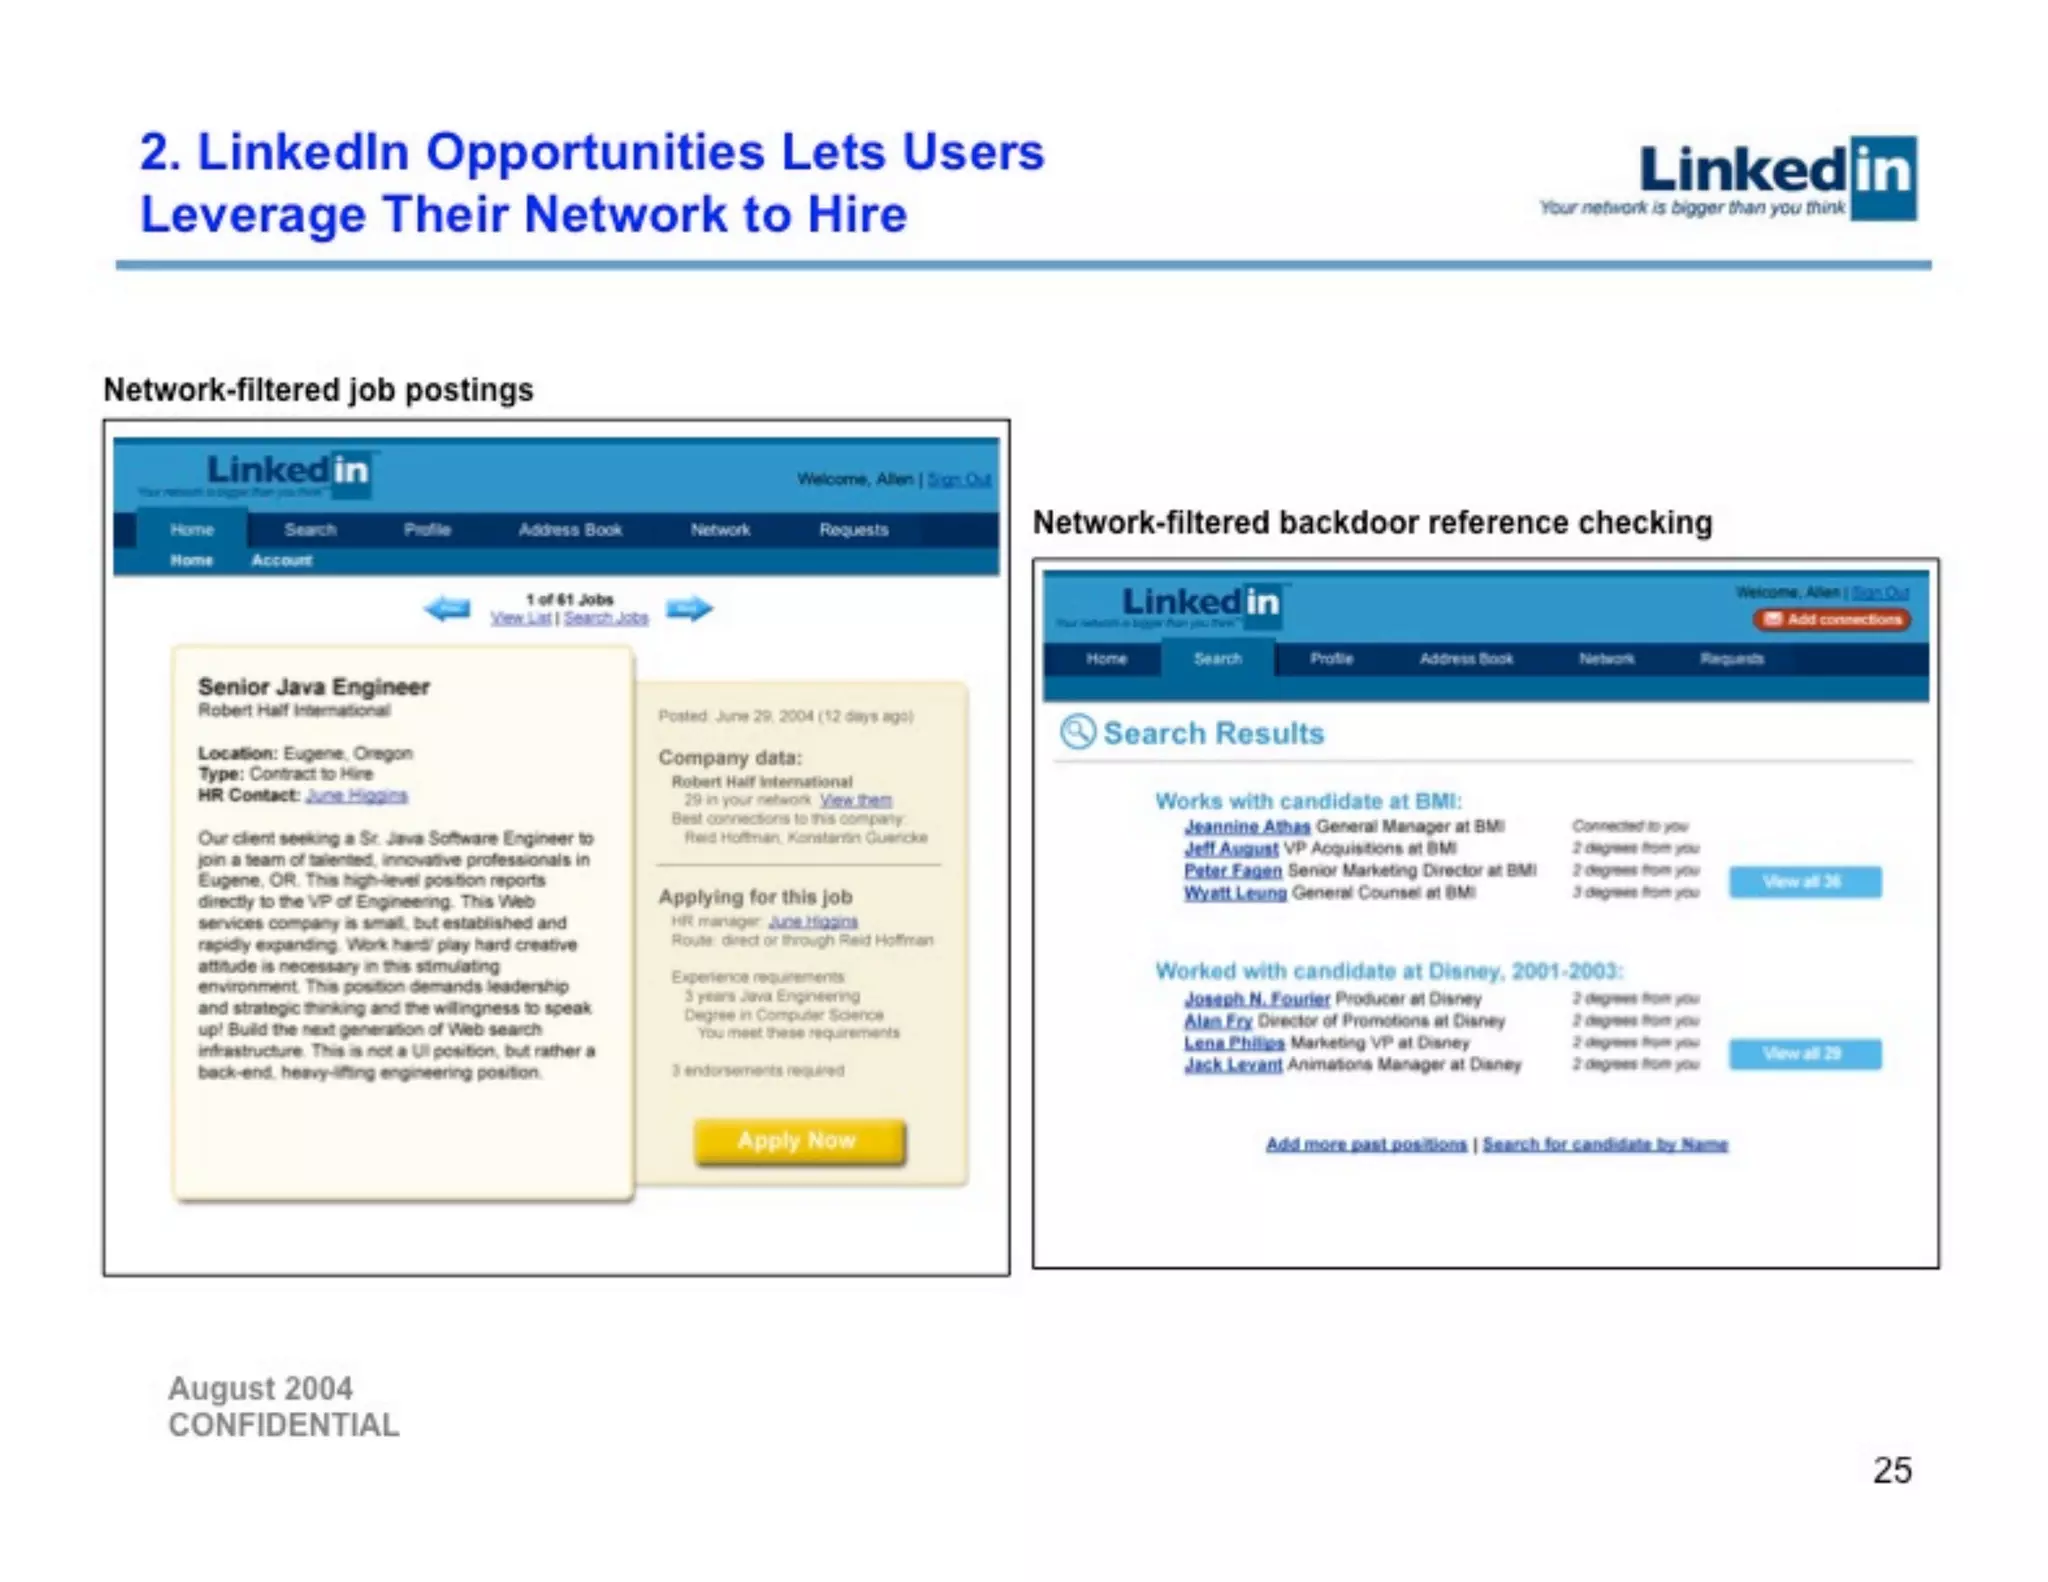
  • Mechanism: Job listings filtered through professional’s network; backdoor reference checking
  • Pricing: Not disclosed
  • Traction: 41+ jobs live (as of June 2004), 20K+ contact requests per month
  • Status: Live with DirectEmployers partnership (240K+ jobs)

3. Network Plus (Premium Subscription)

  • Comparable: Match.com
  • Mechanism: Extended network visibility (3 degrees → 4 degrees)
  • Pricing: Not disclosed
  • Traction: Customer testimonials show value (career advancement, business development)
  • Status: Live with adoption among power users

Critical weakness: The deck provides zero pricing information, customer counts, or revenue figures for any product. This is a major red flag for Series B investors.


Traction & Metrics

Slide 10-11: User Growth

Metric Value Context
Registered Users (July 2004) 900K+ Actual data (green line)
Projected Users (July 2004) 400K August 2003 projection (blue line)
Outperformance 2.25x Actual vs. projected
Weekly User Growth 29K+ Current growth rate
Timeline 15 months May 2003 (launch) to August 2004 (Series B)

Slide 12-13: Market Share

Metric Feb 2004 Aug 2004 Change
LinkedIn Share 54% 73% +19 pts
LinkedIn Users 162K 876K 5.4x
Ryze Share 32% 16% -16 pts
Total Market 0.3M 1.2M 4x

Key insight: LinkedIn is growing faster than the market (5.4x vs. 4x), capturing disproportionate share of new users.

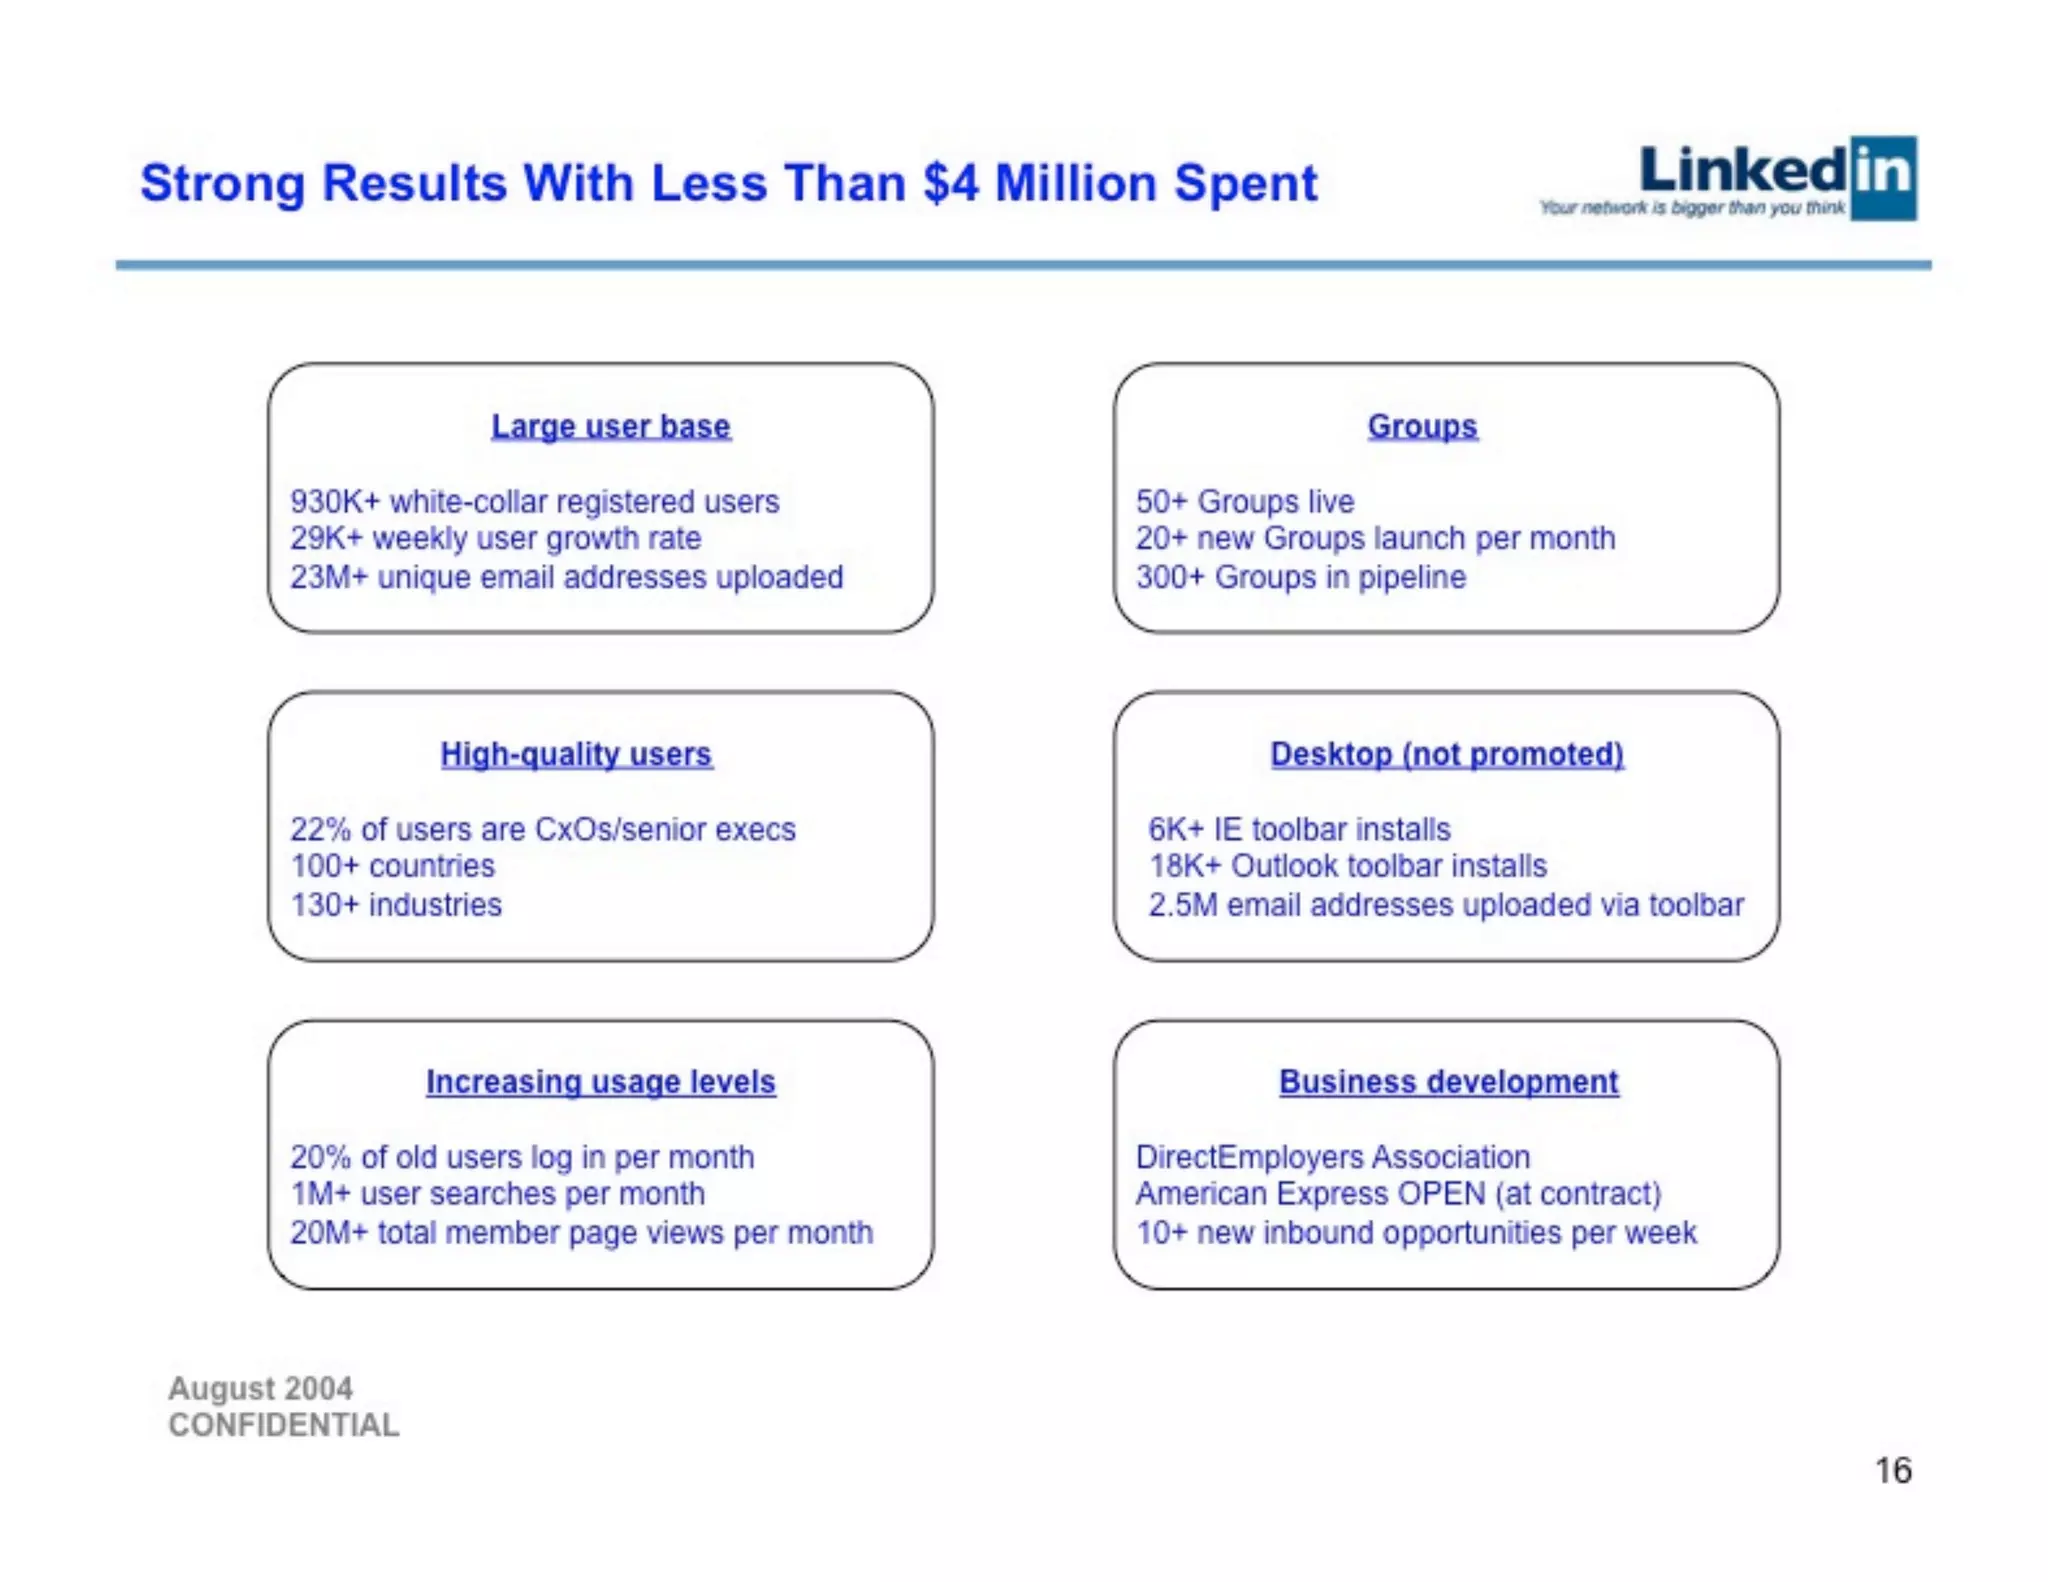
Slide 16: Operational Metrics

Metric Value
White-collar users 930K+
CxO/Senior exec % 22%
Geographic reach 100+ countries
Industry diversity 130+ industries
Monthly active users 20% of base
Monthly searches 1M+
Monthly page views 20M+
Groups live 50+
New groups/month 20+
Groups in pipeline 300+
IE toolbar installs 6K+
Outlook toolbar installs 18K+
Email addresses via toolbar 2.5M+

Slide 9: Capital Efficiency

“Strong Results With Less Than $4 Million Spent”

LinkedIn achieved 930K users and market leadership on less than $4M Series A funding—suggesting strong unit economics and viral growth.

Third-party validation:

  • Forbes (March 2004): “LinkedIn has quickly become the Internet’s largest online business network”
  • PC Magazine (April 2004): PC Magazine Top 100
  • Red Herring (May 2004): Red Herring 100
  • Forrester (July 2004): “Employers will increasingly tap LinkedIn’s rich profiles to find passive job candidates rather than pay Monster to access its resume database”

Competitive Positioning

Slide 14: Competitive Landscape Matrix

LinkedIn positions itself in the “professional focus + enterprise software model” quadrant, distinct from:

Social networks (lower left):

  • Friendster: 10.5M users, 23 months old
  • MySpace: 2.5M users, 7 months old
  • Orkut: 1.3M users, 7 months old

Mixed focus (center):

  • Ryze: 200K users, 34 months old
  • OpenBC: 60K users, 12 months old
  • Spoke: 25K users, 22 months old

Professional focus (right):

  • LinkedIn: 900K+ users, 15 months old
  • Contact Network, VisiblePath, Interface Software, BranchIT
  • Traditional CRM/SFA vendors

Key insight: LinkedIn is the clear leader in the professional networking category, but faces potential threats from:

  1. Social networks (Friendster, MySpace, Orkut) pivoting to professional focus
  2. Traditional job boards (Monster) adding network features
  3. Tech giants (Google, Microsoft) entering professional search

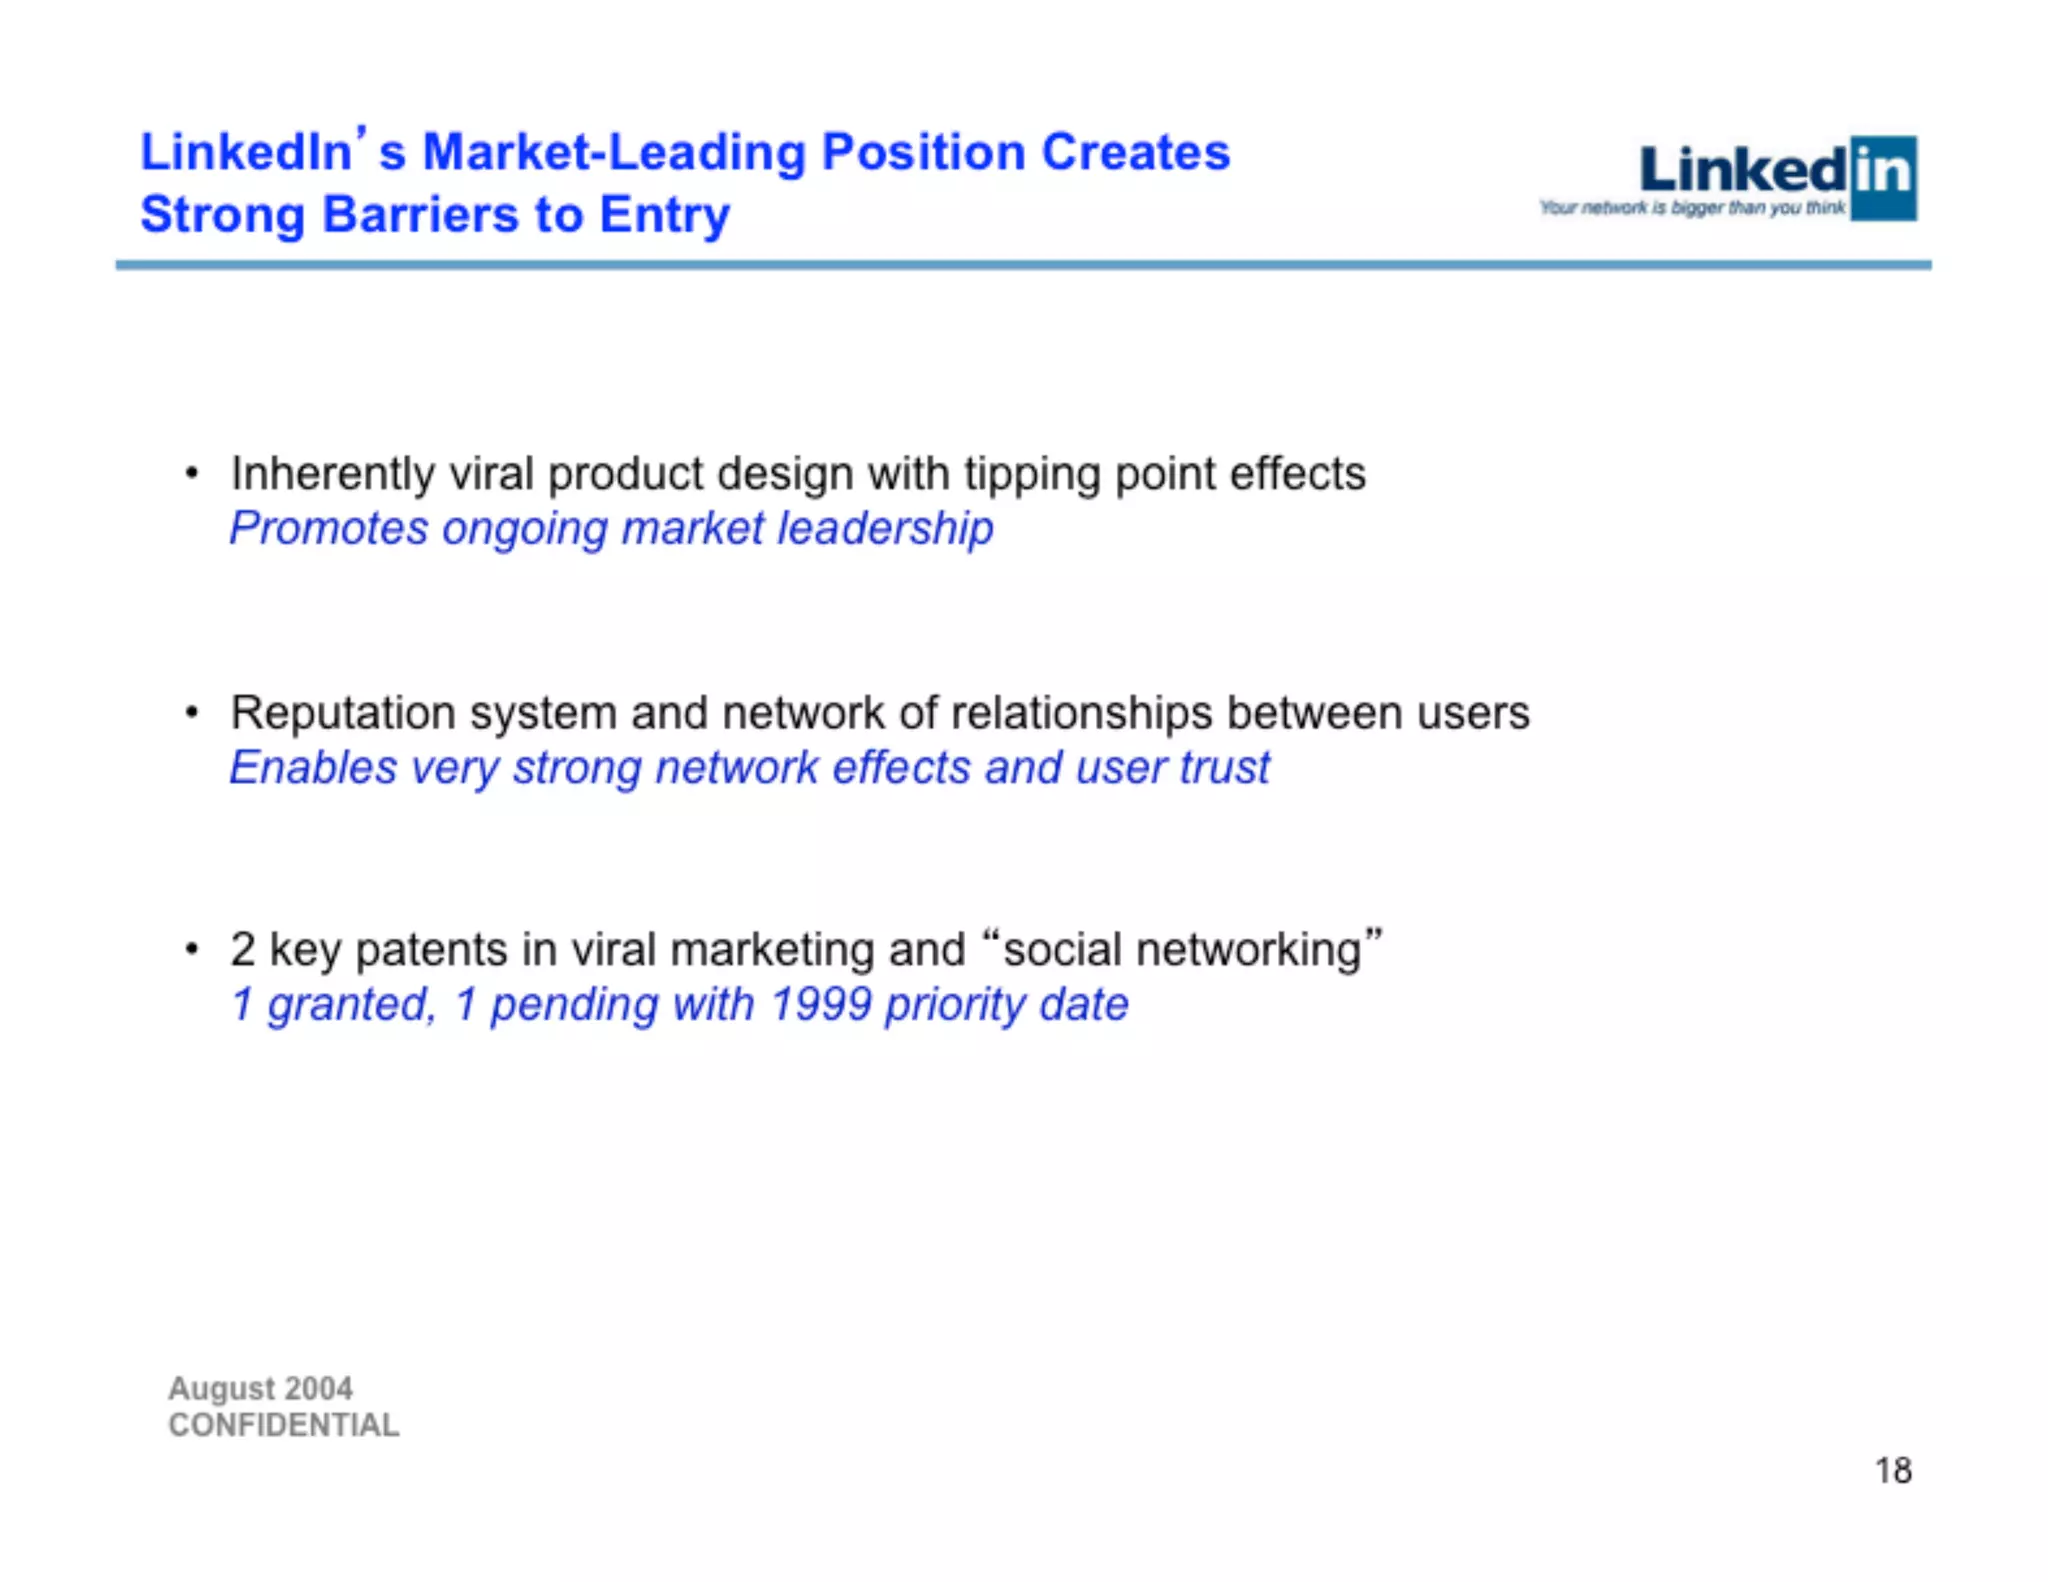
Slide 18: Competitive Moats

LinkedIn claims three defensible advantages:

  1. Viral product design with tipping point effects — Network effects create self-reinforcing growth
  2. Reputation system and network of relationships — Trust-based discovery is hard to replicate
  3. Patent portfolio — 2 patents (1 granted, 1 pending) in viral marketing and social networking (1999 priority date)

Weakness: These moats are not deeply explained or quantified. Competitors could potentially replicate the network model.


Team

Critical gap: The deck contains zero information about the founding team, management, or board members.

This is a significant omission for a Series B pitch. Investors typically want to see:

  • Founder backgrounds and relevant experience
  • Management team credentials
  • Board composition
  • Key hires and organizational structure

The absence of team information suggests either:

  1. The team was discussed verbally in the pitch meeting (not captured in slides)
  2. The team credentials were weak and intentionally de-emphasized
  3. The deck prioritized product/market over team (unusual for Series B)

Go-to-Market Strategy

Slide 15: User Acquisition Through Groups

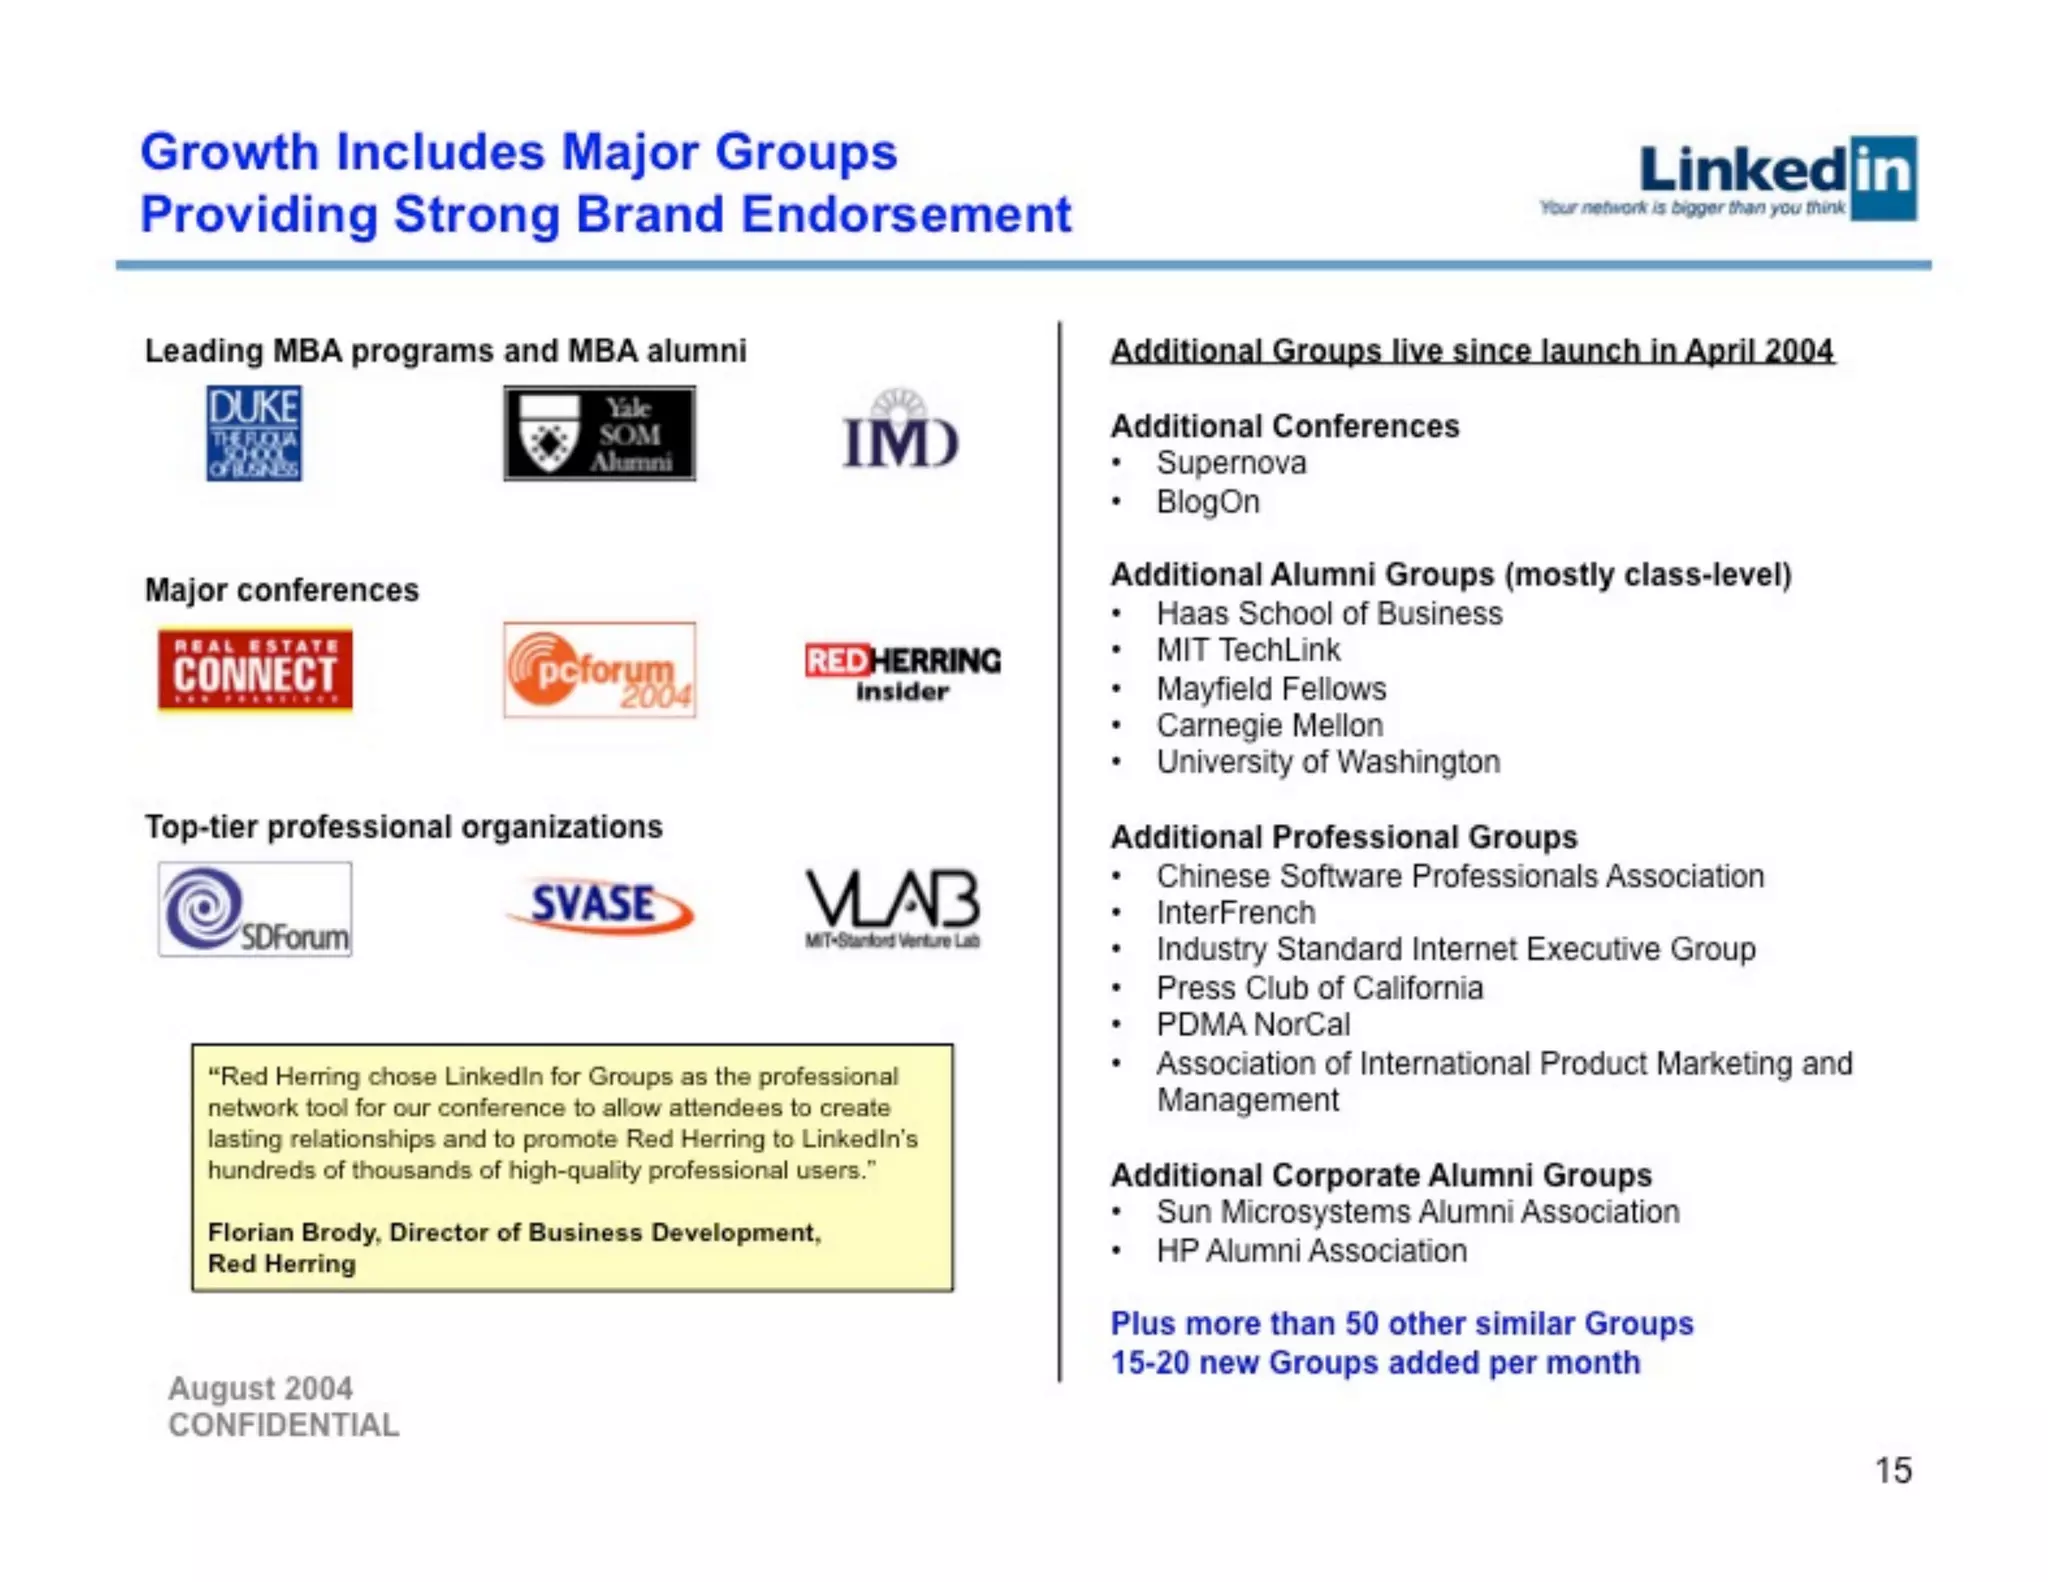
LinkedIn’s primary user acquisition strategy appears to be organic adoption through prestigious groups:

Leading MBA programs and alumni:

  • Duke, Yale SOM, IMD

Major conferences:

  • Real Estate Connect, DC Forum 2004, Red Herring Insider

Top-tier professional organizations:

  • SDForum, SVASE, MIT-Stanford Venture Lab (VLAB)

Growth metrics:

  • 50+ groups live (as of August 2004)
  • 20+ new groups launched per month
  • 300+ groups in pipeline

Testimonial from Red Herring:

“Red Herring chose LinkedIn for Groups as the professional network tool for our conference to allow attendees to create lasting relationships and to promote Red Herring to LinkedIn’s hundreds of thousands of high-quality professional users.”

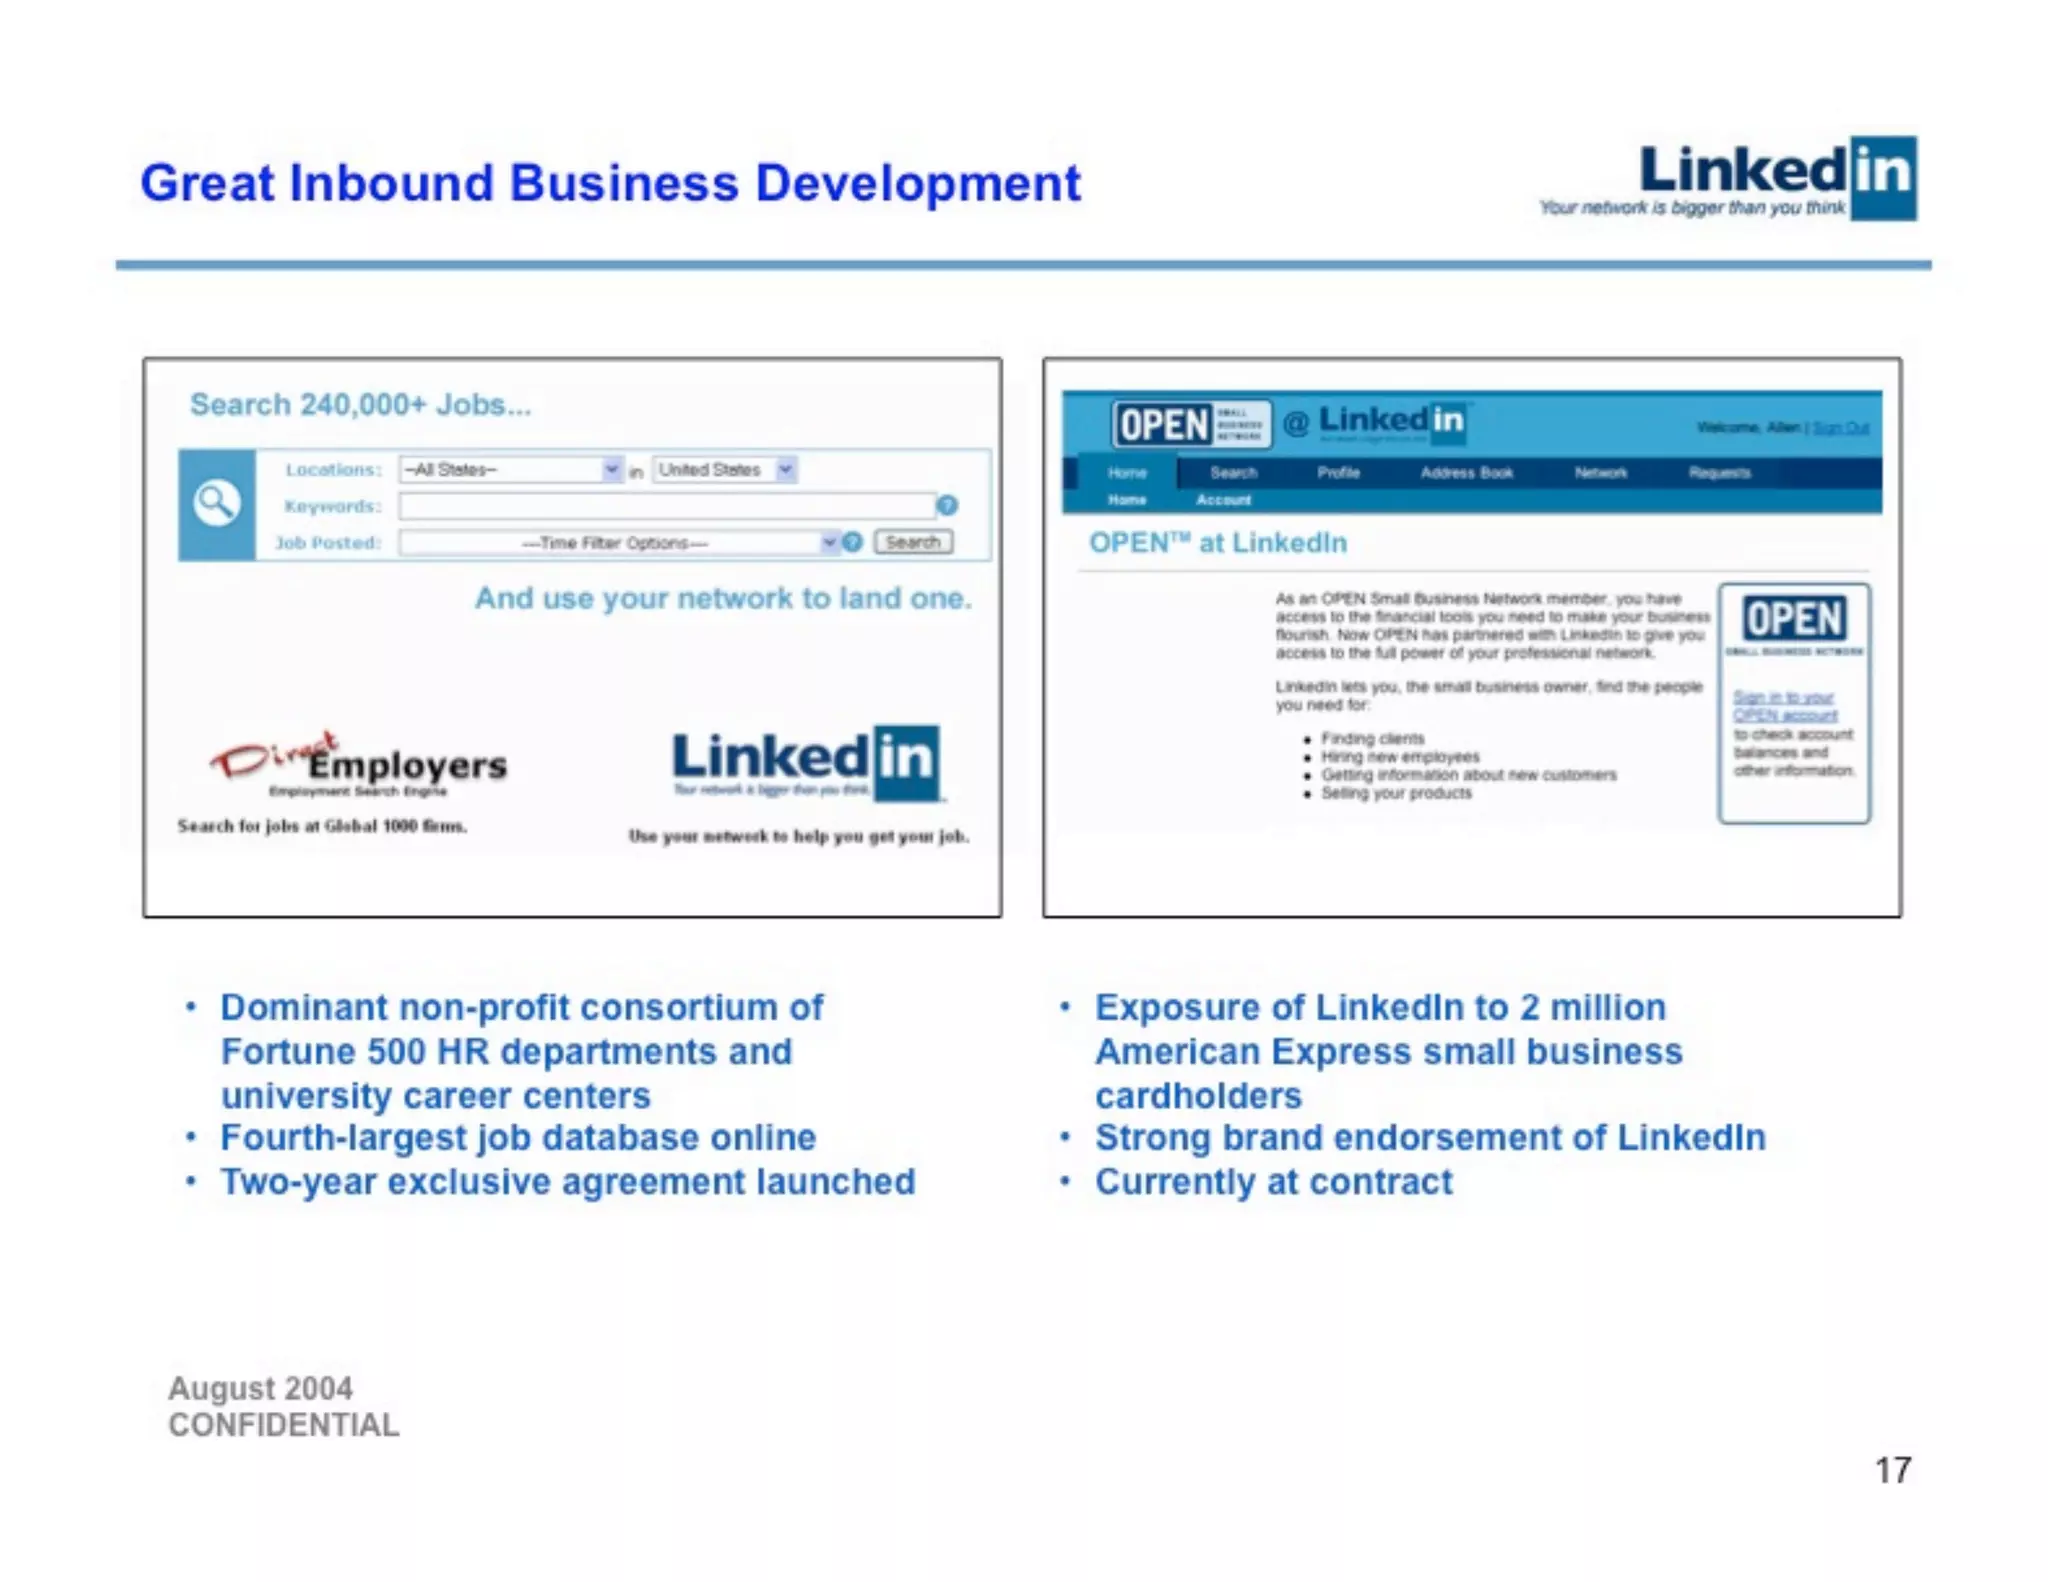
Slide 17: Strategic Partnerships

  1. DirectEmployers Association — Two-year exclusive agreement
    • 240K+ jobs in database
    • Dominant consortium of Fortune 500 HR departments and university career centers
    • Fourth-largest job database online
  2. American Express OPEN — Currently at contract (not yet signed)
    • Reach: 2 million small business cardholders
    • Use cases: Finding clients, hiring, customer research, product sales

Go-to-market insight: LinkedIn is pursuing an inbound business development strategy where partners approach LinkedIn (rather than vice versa), suggesting strong market demand.


The Ask

Critical gap: The deck does not explicitly state:

  • The amount being raised ($10M is known from context, but not stated in slides)
  • Use of funds breakdown
  • Hiring plans
  • Product roadmap
  • Financial projections or profitability timeline

This is a major omission. Series B investors need to understand:

  1. How much capital is needed? ($10M)
  2. What will it be spent on? (Not disclosed)
  3. What milestones will it achieve? (Not disclosed)
  4. When will the company reach profitability? (Not disclosed)
  5. What’s the expected return? (Not disclosed)

Key Takeaways

What LinkedIn Did Right:

  1. Clear problem-solution narrative — Investors understand the insight by Slide 8
  2. Exceptional growth metrics — 900K users in 15 months is undeniable proof of traction
  3. Market dominance — 73% share validates product-market fit
  4. Prestigious partnerships — DirectEmployers and American Express OPEN add credibility
  5. Third-party validation — Forbes, PC Magazine, Forrester quotes are powerful
  6. Multiple revenue streams — Diversified model reduces risk
  7. Specific numbers — Almost all claims are quantified
  8. Professional design — Clean, consistent visual presentation

What LinkedIn Did Wrong:

  1. Zero revenue metrics — No ARR, ARPU, pricing, or customer counts (critical gap)
  2. No financial projections — No path to profitability or use of funds
  3. Excessive analogies — Slides 5-7 are repetitive
  4. Late revenue model — Introduced at Slide 19, should be earlier
  5. No team information — Complete omission of founder/management credentials
  6. Vague monetization — Product demos without financial traction
  7. No competitive threat analysis — Doesn’t address how to compete with Monster, Google, etc.
  8. Visitor metrics suggest low engagement — 0.3M visitors vs. 900K users implies 67% inactive

Investor Deep Dive

Executive summary, strengths & red flags

Executive Summary

LinkedIn articulates a compelling thesis: professional networks (like eBay for goods, PayPal for payments, Google for search) will revolutionize how professionals find jobs, build relationships, and conduct business. The deck builds this narrative through four analogies (Slides 5-8), then validates it with impressive growth metrics (900K users in 15 months, 73% market share) and prestigious partnerships (DirectEmployers, American Express OPEN). However, the pitch is fundamentally incomplete—it demonstrates product-market fit and user traction but provides zero evidence that the business model generates revenue or a path to profitability. This represents a significant risk for Series B investors, who typically expect to see unit economics, financial projections, and clear monetization evidence.

Key Strengths

5 identified

1

Exceptional Problem-Solution Narrative (Slides 3-8)

The deck uses four powerful analogies (eBay, PayPal, Google) to establish that network-based trust systems work across multiple industries. This pattern recognition is compelling and helps investor...

2

Exceptional User Growth & Market Dominance (Slides 10-13)

900K users in 15 months with 73% market share is undeniable proof of product-market fit. The fact that LinkedIn is growing 2.25x faster than its own projections demonstrates execution excellence.

3

Prestigious Partnerships & Third-Party Validation (Slides 15, 17)

DirectEmployers (Fortune 500 HR departments), American Express OPEN (2M cardholders), and quotes from Forbes, PC Magazine, Red Herring, and Forrester provide credibility that's hard to dispute.

4

Large TAM with Quantified Market Validation (Slides 22, 24, 27)

The deck quantifies three addressable markets ($15B+ for InLeads, $0.8B for Opportunities, $0.6B for Network Plus) and validates each with market data:

5

Multiple Revenue Streams (Slides 19-21)

Rather than relying on a single revenue model, LinkedIn has three distinct monetization approaches:

More Pitch Decks To Study

Compare structure, fundraising context, and investor-facing story across similar startup decks.