Compare your deck to Groupon

Compare Your Deck

Groupon Pitch Deck (2011)

Marketplace
Stage: IPO Roadshow
Raised: $950M IPO
Year: 2011
Slides: 40
Outcome: IPO at $12.7B, later declined

Pitch Deck

1 / 40
Groupon pitch deck - The Opening: Clear brand and framing
Click to expand

Deck Analysis

This is Groupon's 2011 IPO roadshow deck, presented as the company prepared to list publicly after rapid global expansion. The deck is notable for combining simple, brand-forward design with a heavy focus on unit economics, marketing ROI, and scale advantages — communicating both the opportunity and the operating playbook. It showcases a marketplace playbook: how customer acquisition, merchant economics, local density and product/technology features combine to drive revenue and margin expansion.

The Opening: Clear brand and framing

The Opening: Clear brand and framing

Slide 1 is a clean title slide that immediately establishes brand identity and the purpose of the presentation (Initial Public Offering). It uses large, legible typography and a single month/year date to set the time-context — an effective way to orient investors without noise. The design choice (simple, green, strong logo) signals confidence and continuity between consumer product and corporate story.

Founders should note how the slide sets a professional tone quickly. For investor-facing decks, your first slide should do less than you think: brand + purpose + date is often enough. Avoid clutter; the goal is to create a consistent visual identity that carries through the entire presentation so that subsequent slides feel like parts of one integrated story.
Key Takeaway: Start with a simple, brand-forward title slide that communicates purpose and sets a consistent visual tone for the whole deck.
The Offering: Clear IPO terms and structure

The Offering: Clear IPO terms and structure

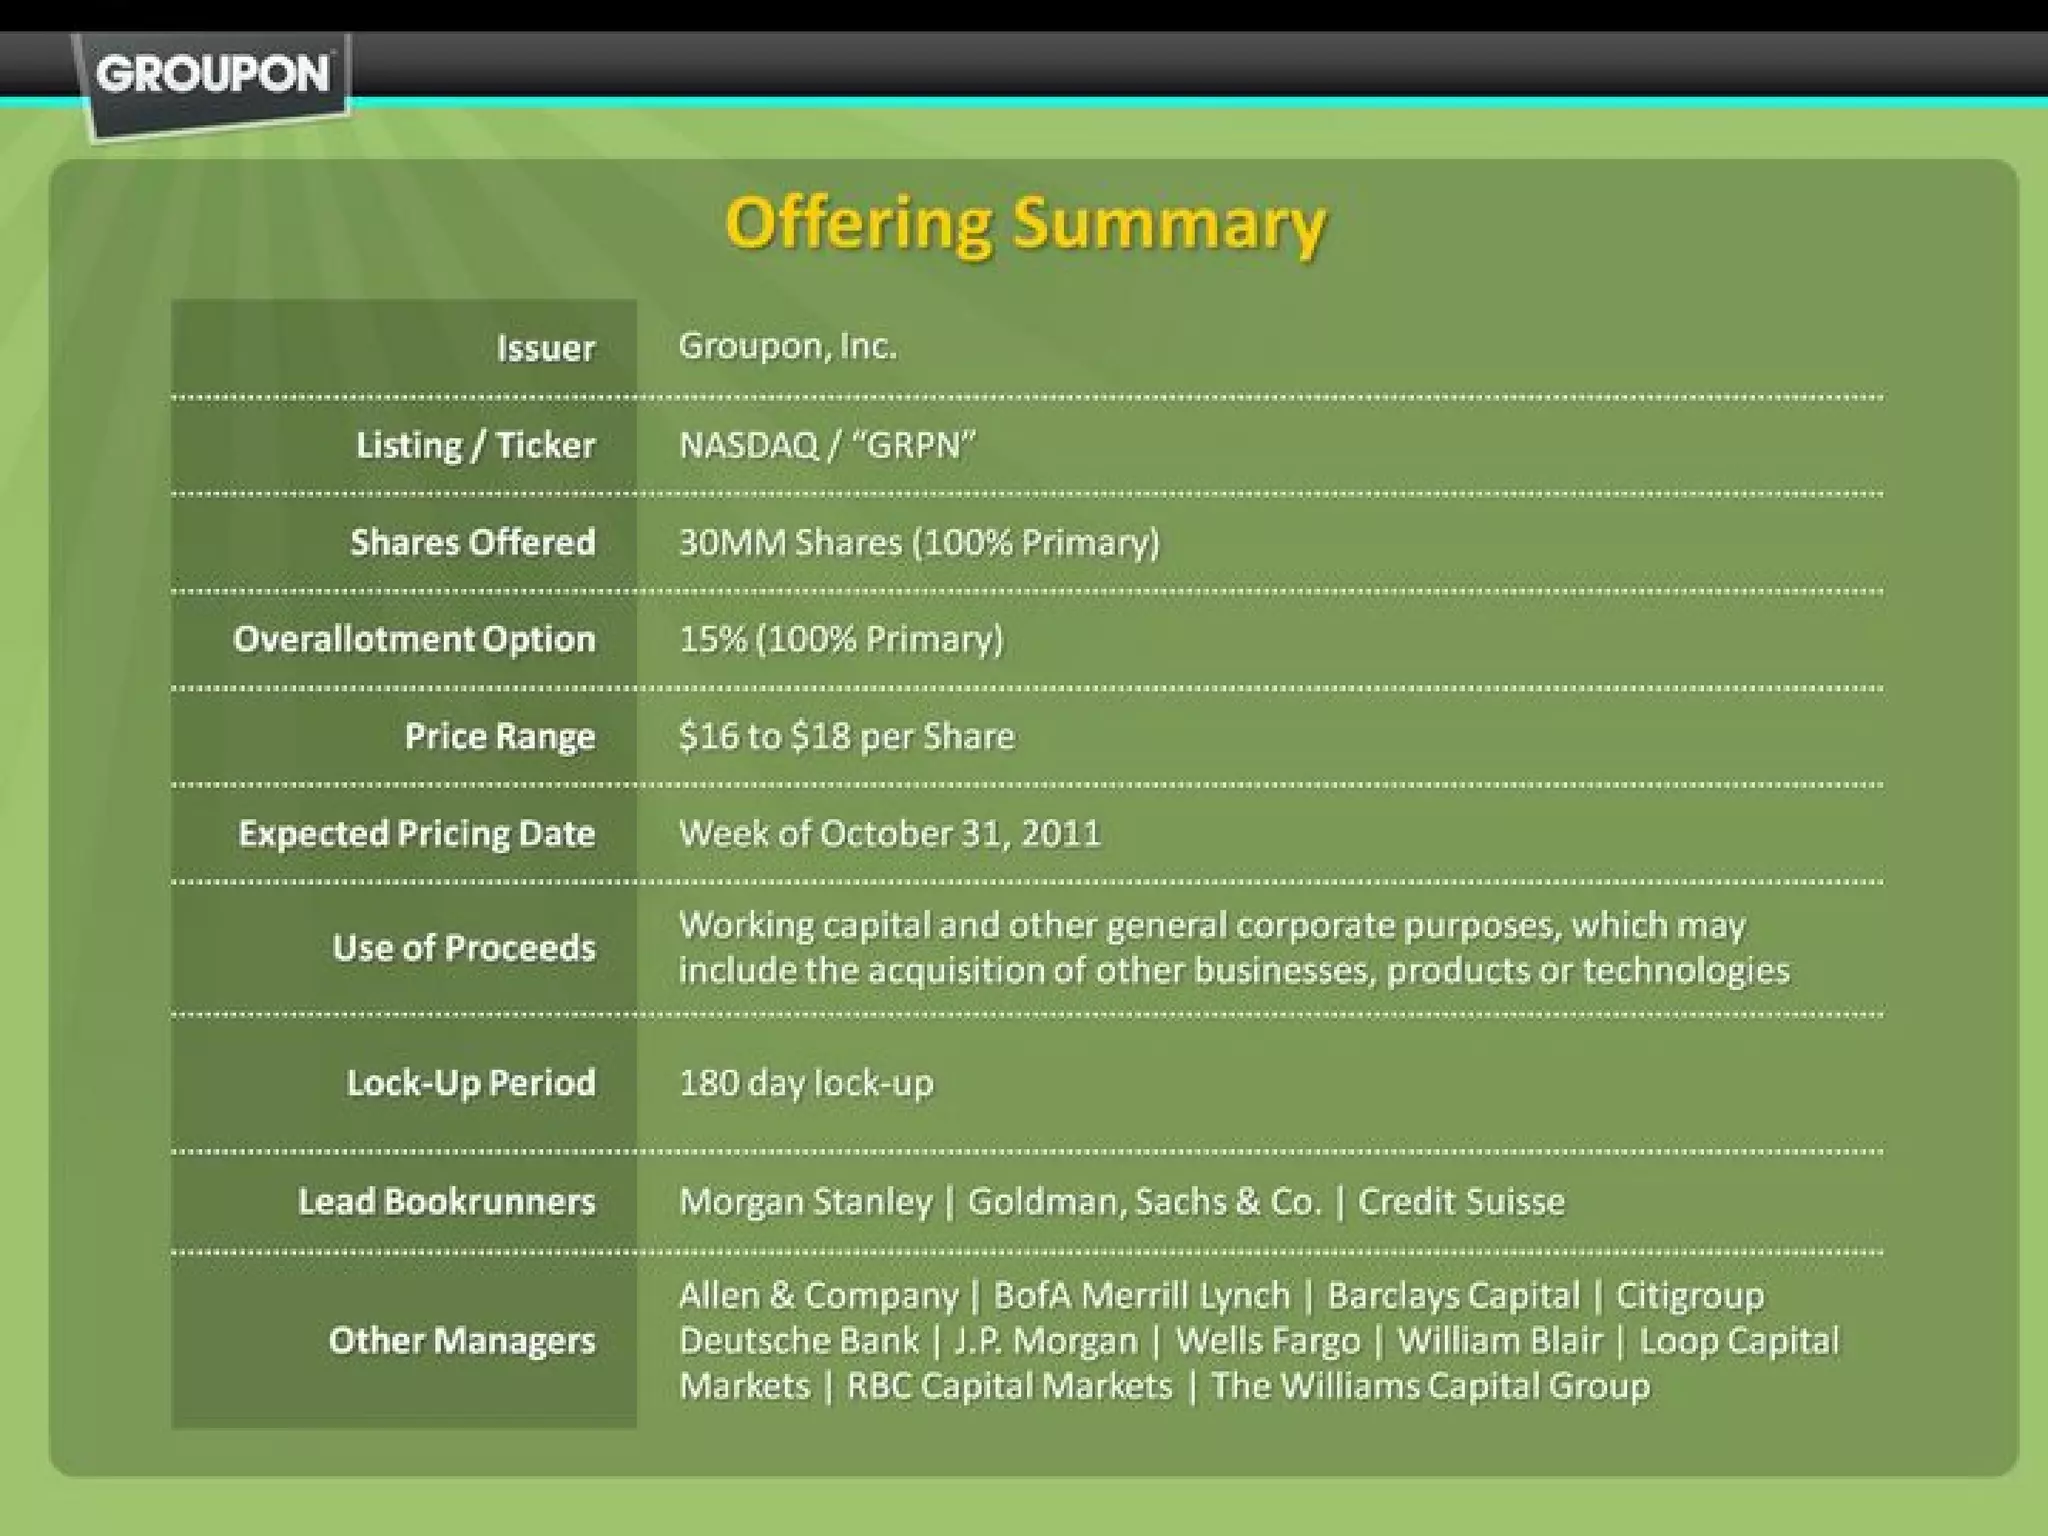
Slide 3 (Offering Summary) lays out the IPO terms and deal structure succinctly: issuer, ticker, shares offered, price range, lock-up, and lead bookrunners. Presenting these facts up-front is important for a roadshow because it answers the immediate transaction-level questions that institutional investors care about.

This slide demonstrates discipline: investors appreciate transparency on size, pricing expectations and use of proceeds. For founders raising capital (public or private), mirroring this clarity — i.e., concise bullet points for the ask, structure, and use of funds — removes friction during diligence and signals professionalism.

Key Takeaway: Be explicit and concise about the financial terms and uses of proceeds — investors want clarity on the ask and structure as early as possible.
Investment Highlights: Framing the value proposition

Investment Highlights: Framing the value proposition

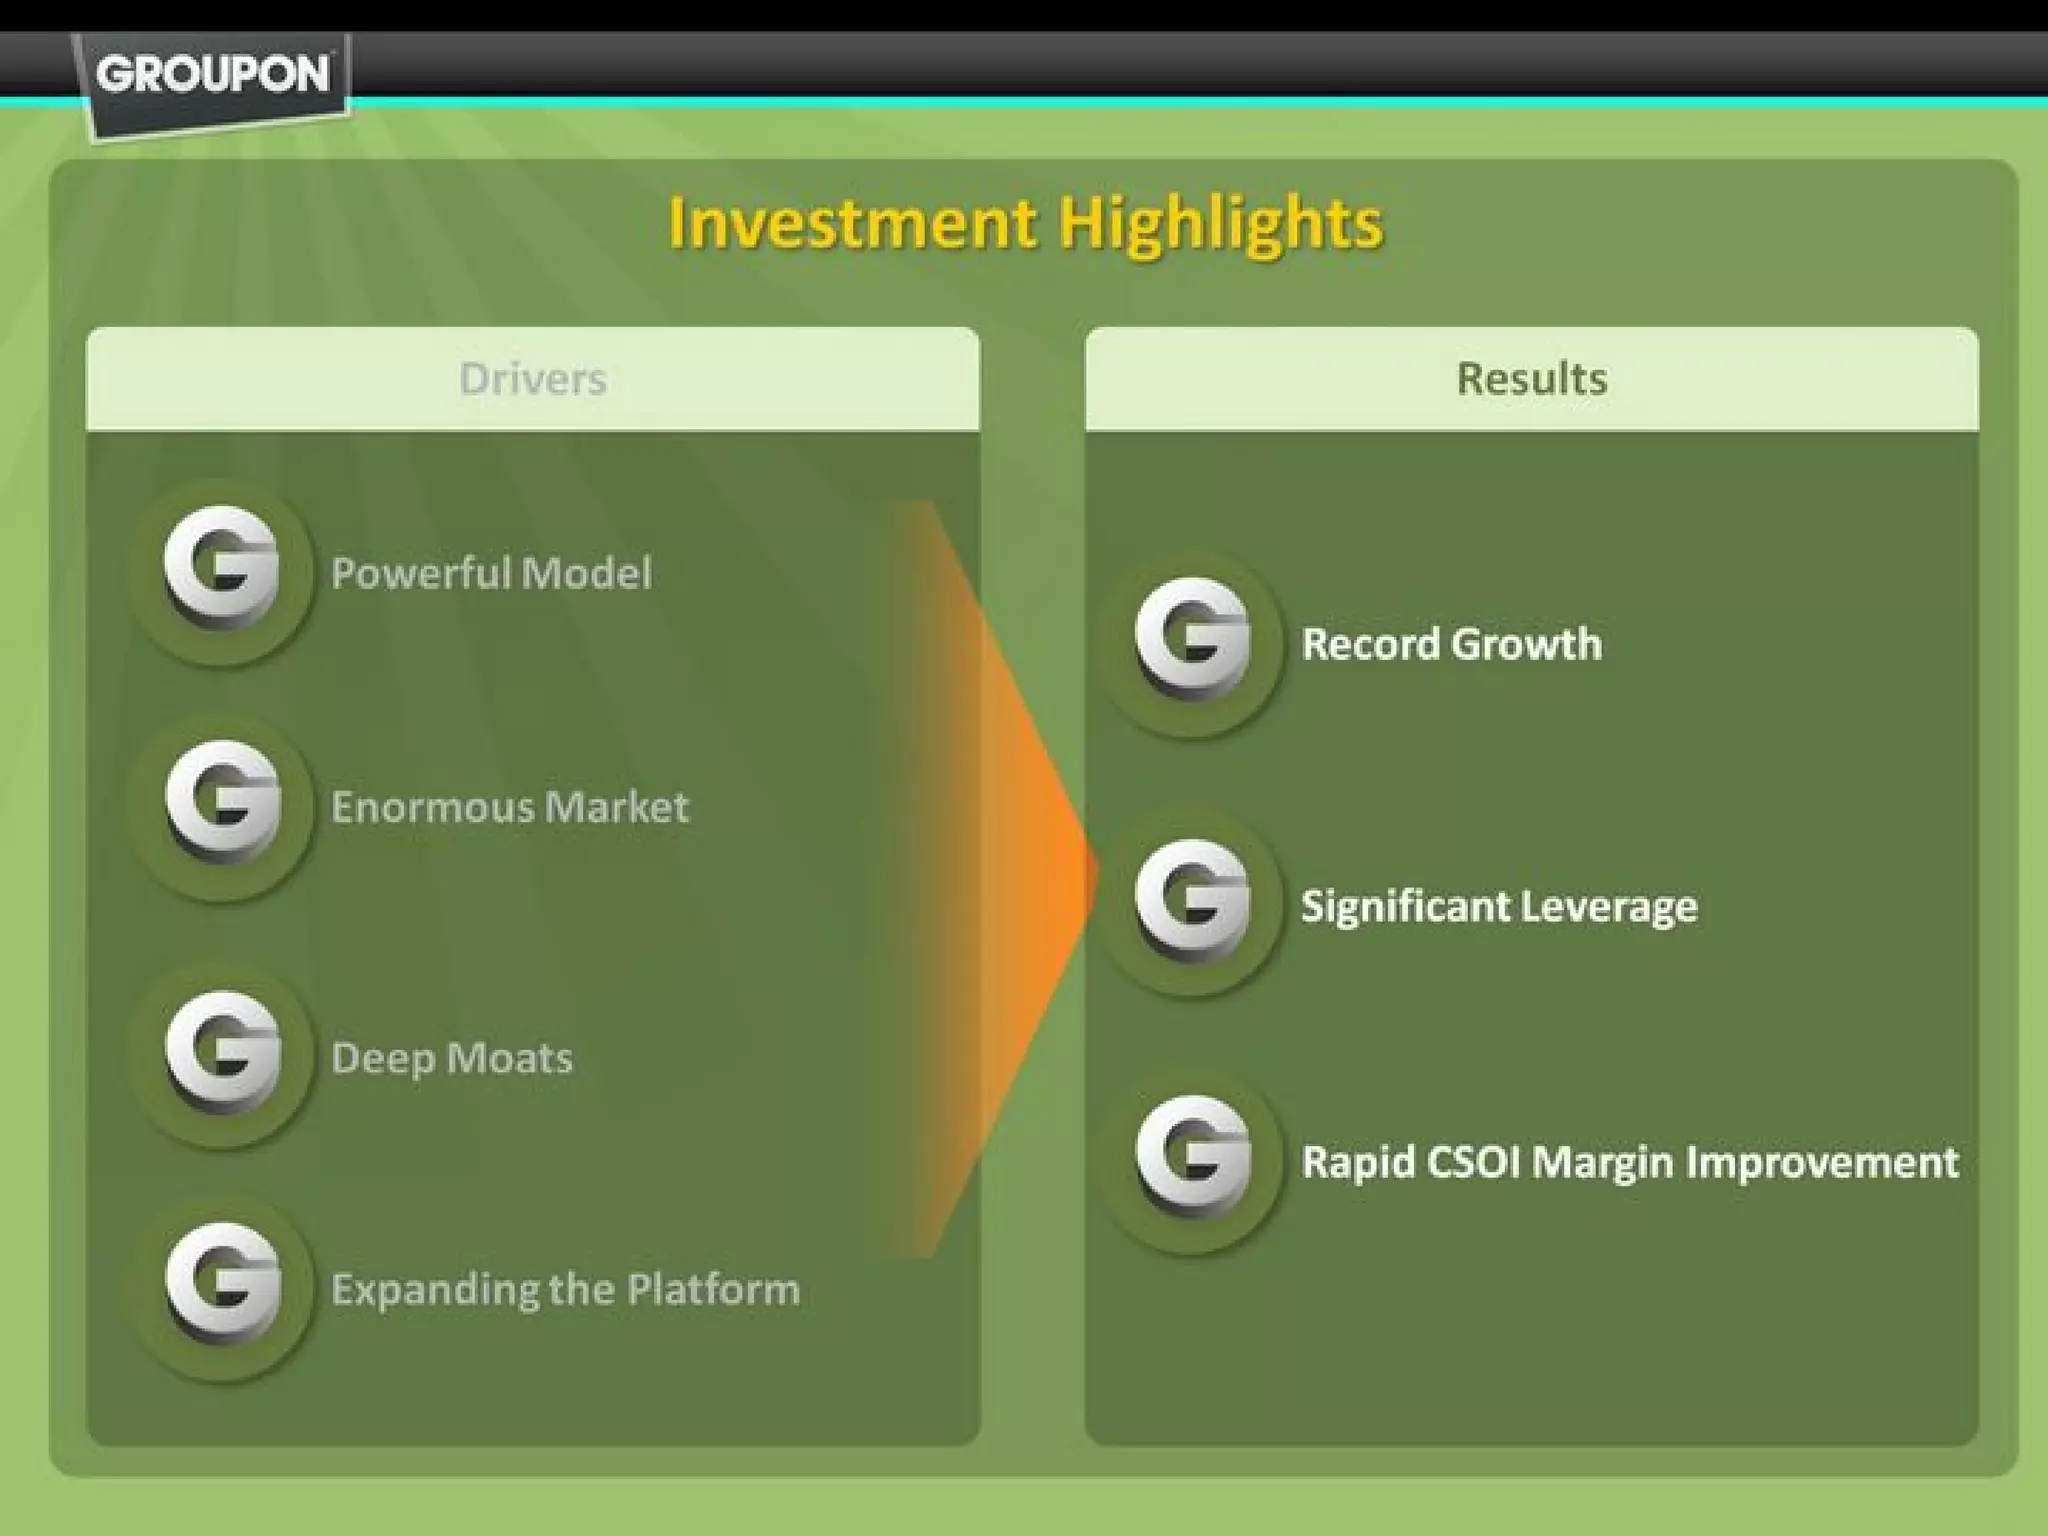
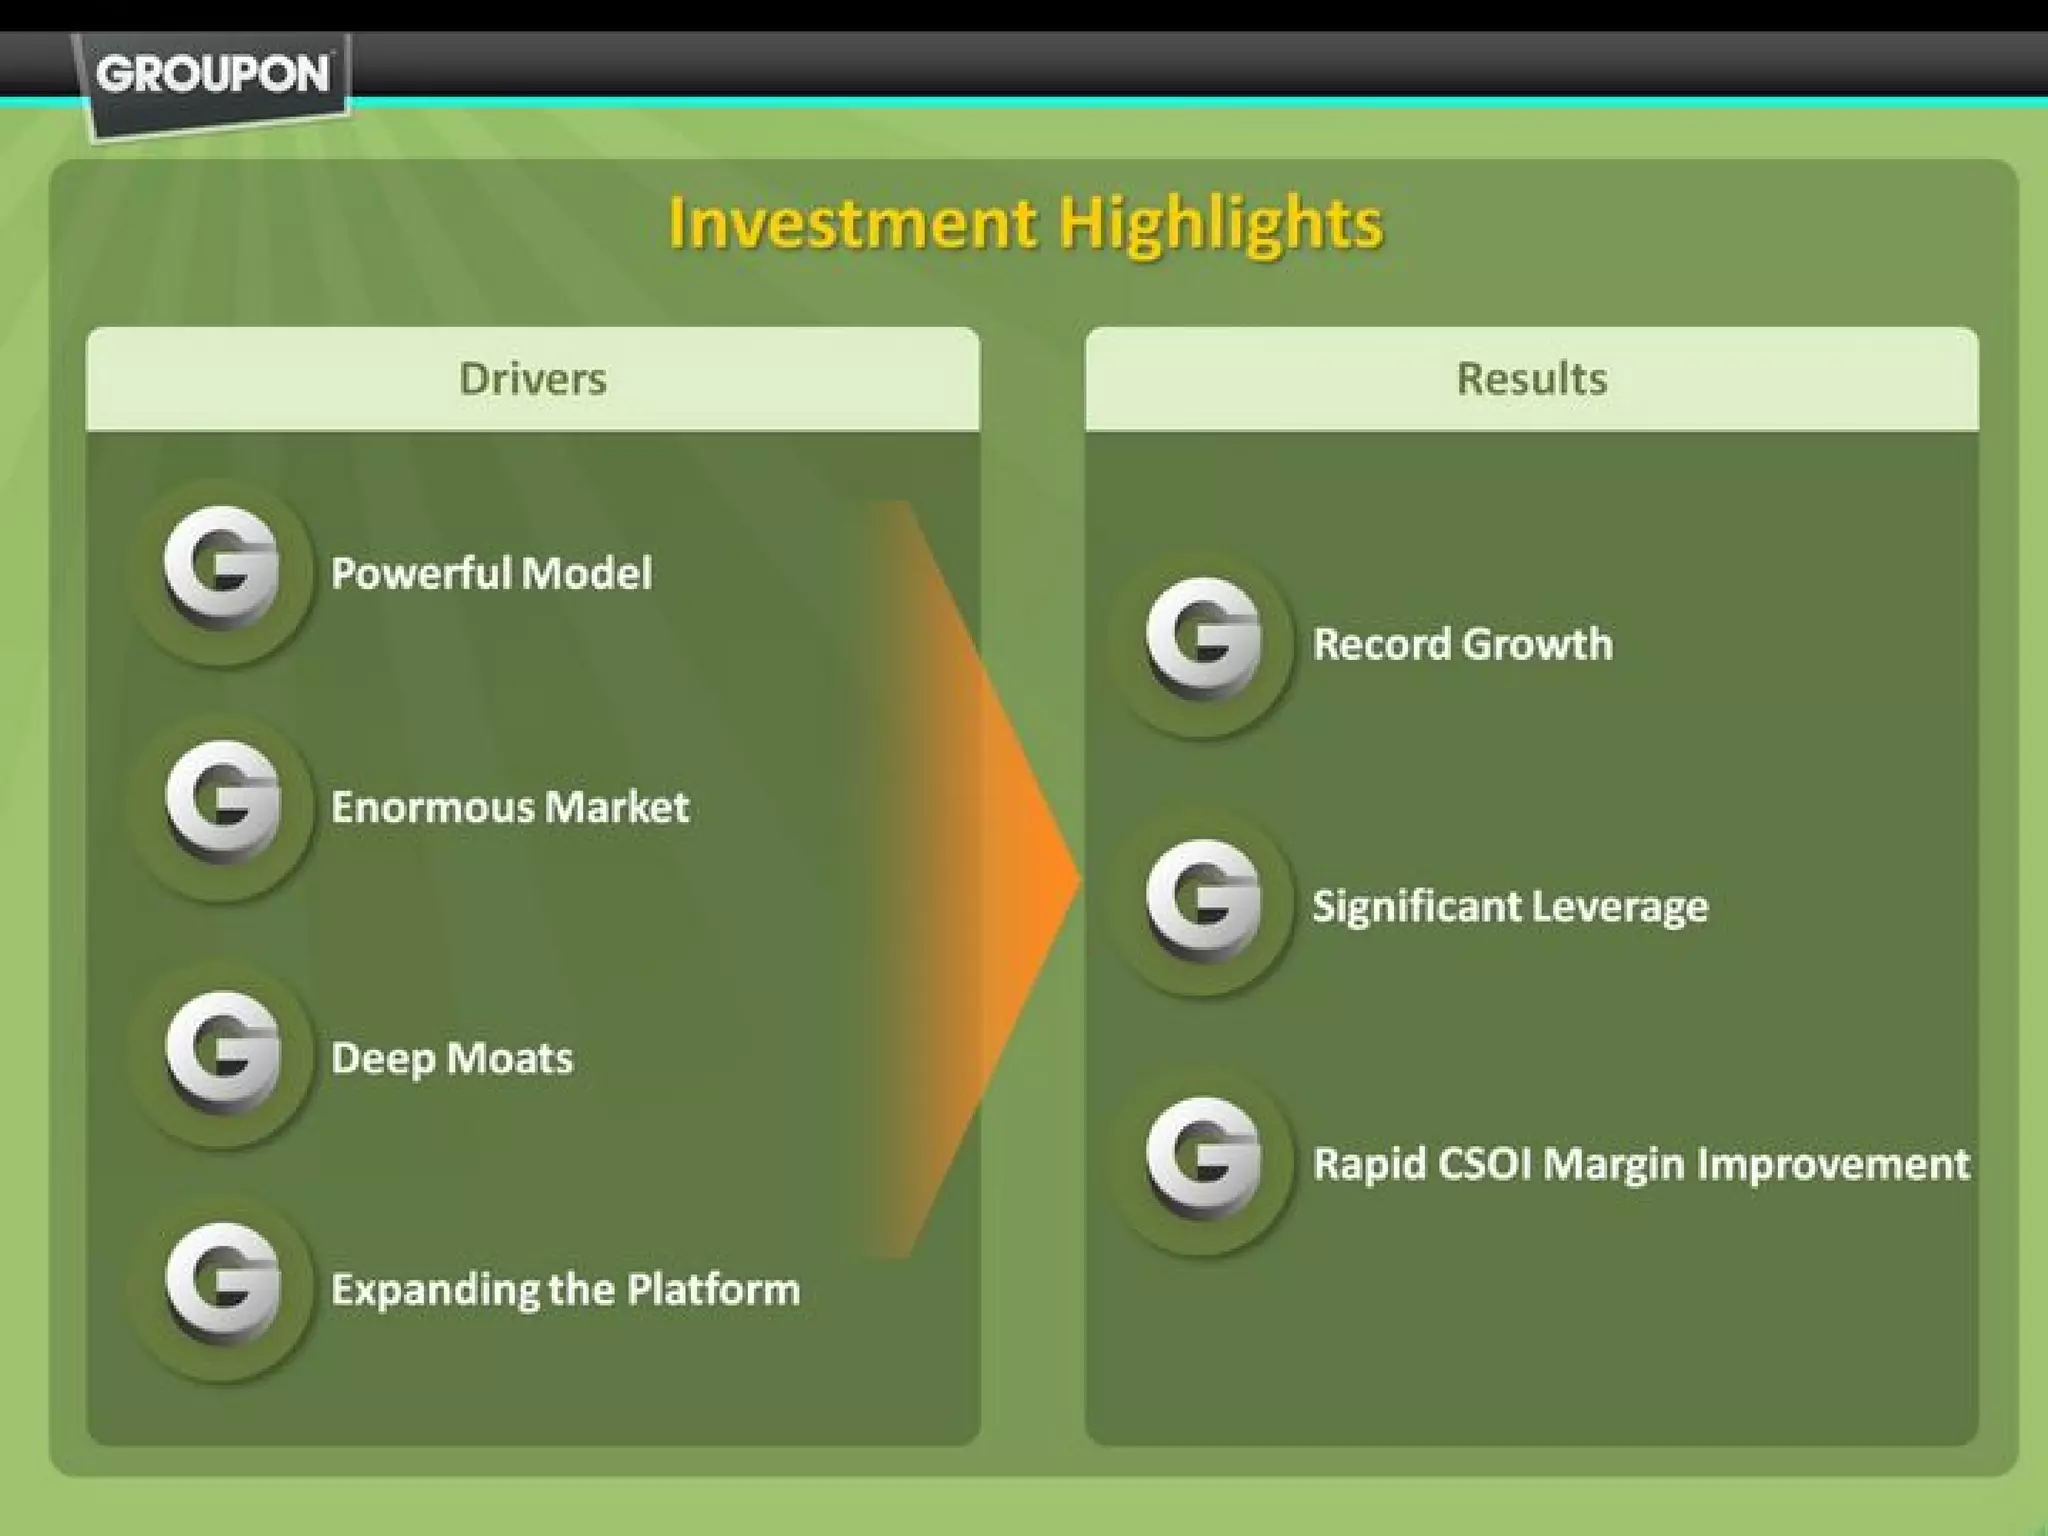
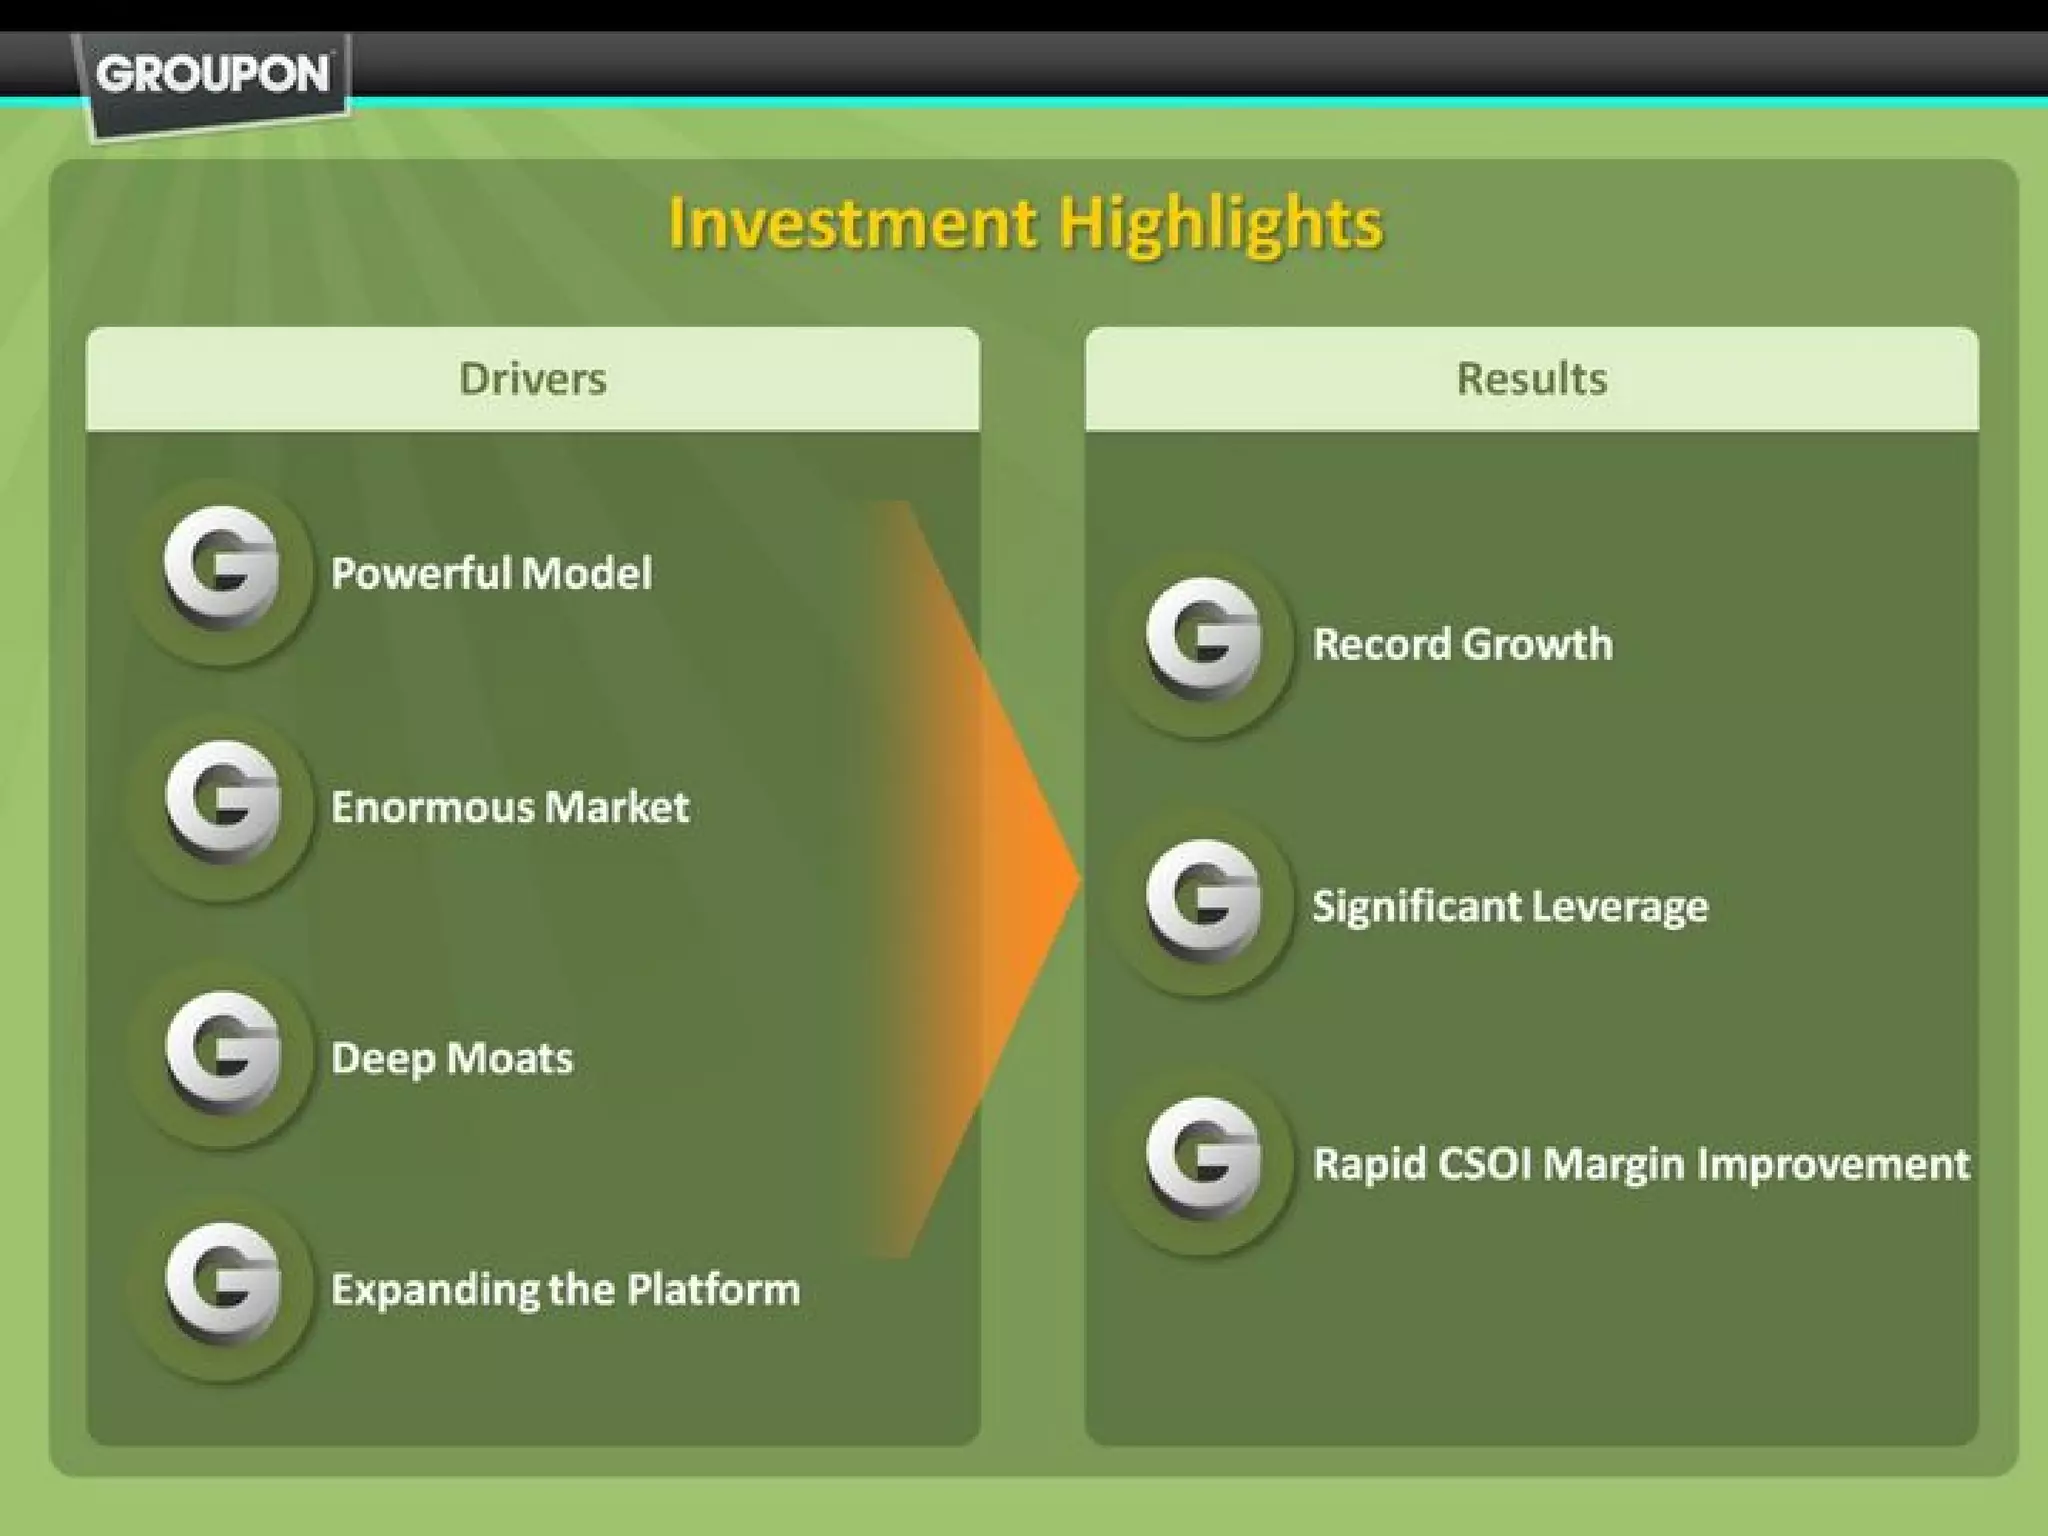
Slide 5 (Investment Highlights) juxtaposes 'Drivers' on the left with 'Results' on the right, turning qualitative strengths (powerful model, enormous market, moats, platform expansion) into measurable outcomes (record growth, leverage, margin improvement). The visual flow (left to right with icons) helps investors map causes to effects quickly.

This is a model slide for any company: start with a few crisp strategic pillars, then show the concrete results they yield. The deck avoids overclaiming; instead, it ties each driver to a specific operational or financial result. Founders should build similar slides to show not just ambition but the mechanism by which ambition translates to measurable outcomes.

Key Takeaway: Link strategic drivers to concrete outcomes — show the causal path from what you do to the measurable results investors care about.
Two-sided marketplace: Simple visualization of supply and demand

Two-sided marketplace: Simple visualization of supply and demand

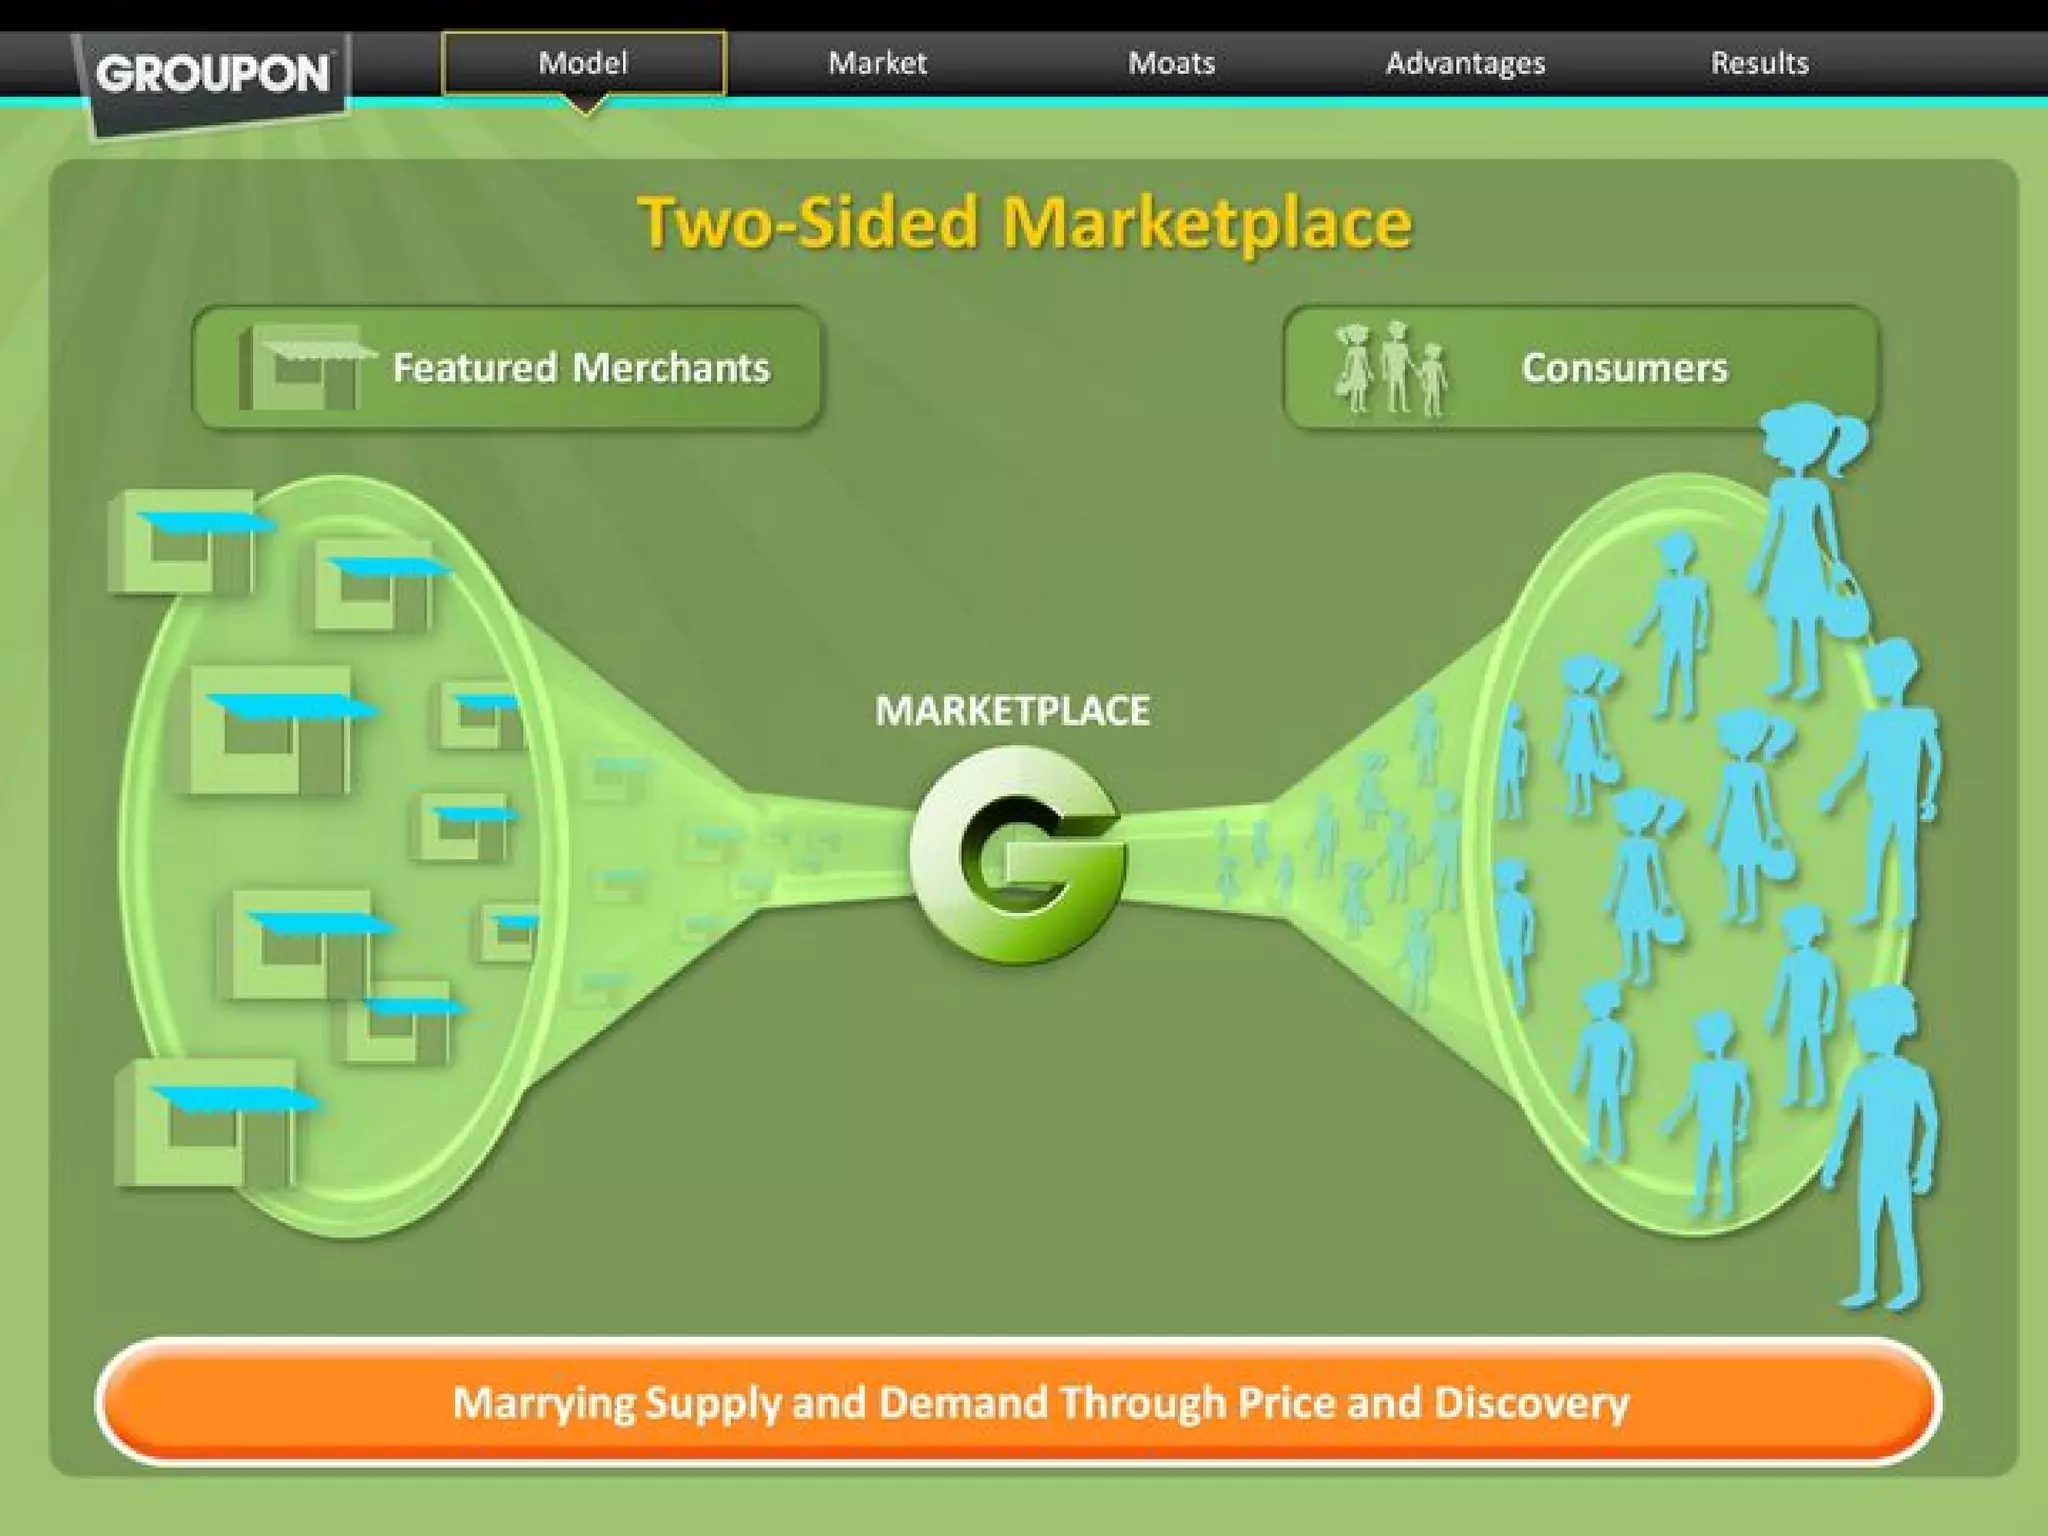
Slide 12 presents Groupon as a two-sided marketplace with merchants on one side and consumers on the other, funneled through a central marketplace. The illustration is intuitive: it communicates matchmaking at scale (mirroring network effects) without heavy copy. The orange callout at the bottom (‘Marrying Supply and Demand Through Price and Discovery’) succinctly encapsulates the mechanism.

For marketplace founders, this slide is a reminder to clearly show the flow between supply and demand and the levers you control (pricing, discovery, distribution). Visual, symmetric diagrams make it easy for investors to see how liquidity, matching efficiency, and pricing power interrelate — and where you plan to capture value.

Key Takeaway: Use a simple two-sided visualization to show how supply and demand meet and where your product captures value.
Market Opportunity: Big total addressable market (TAM) framing

Market Opportunity: Big total addressable market (TAM) framing

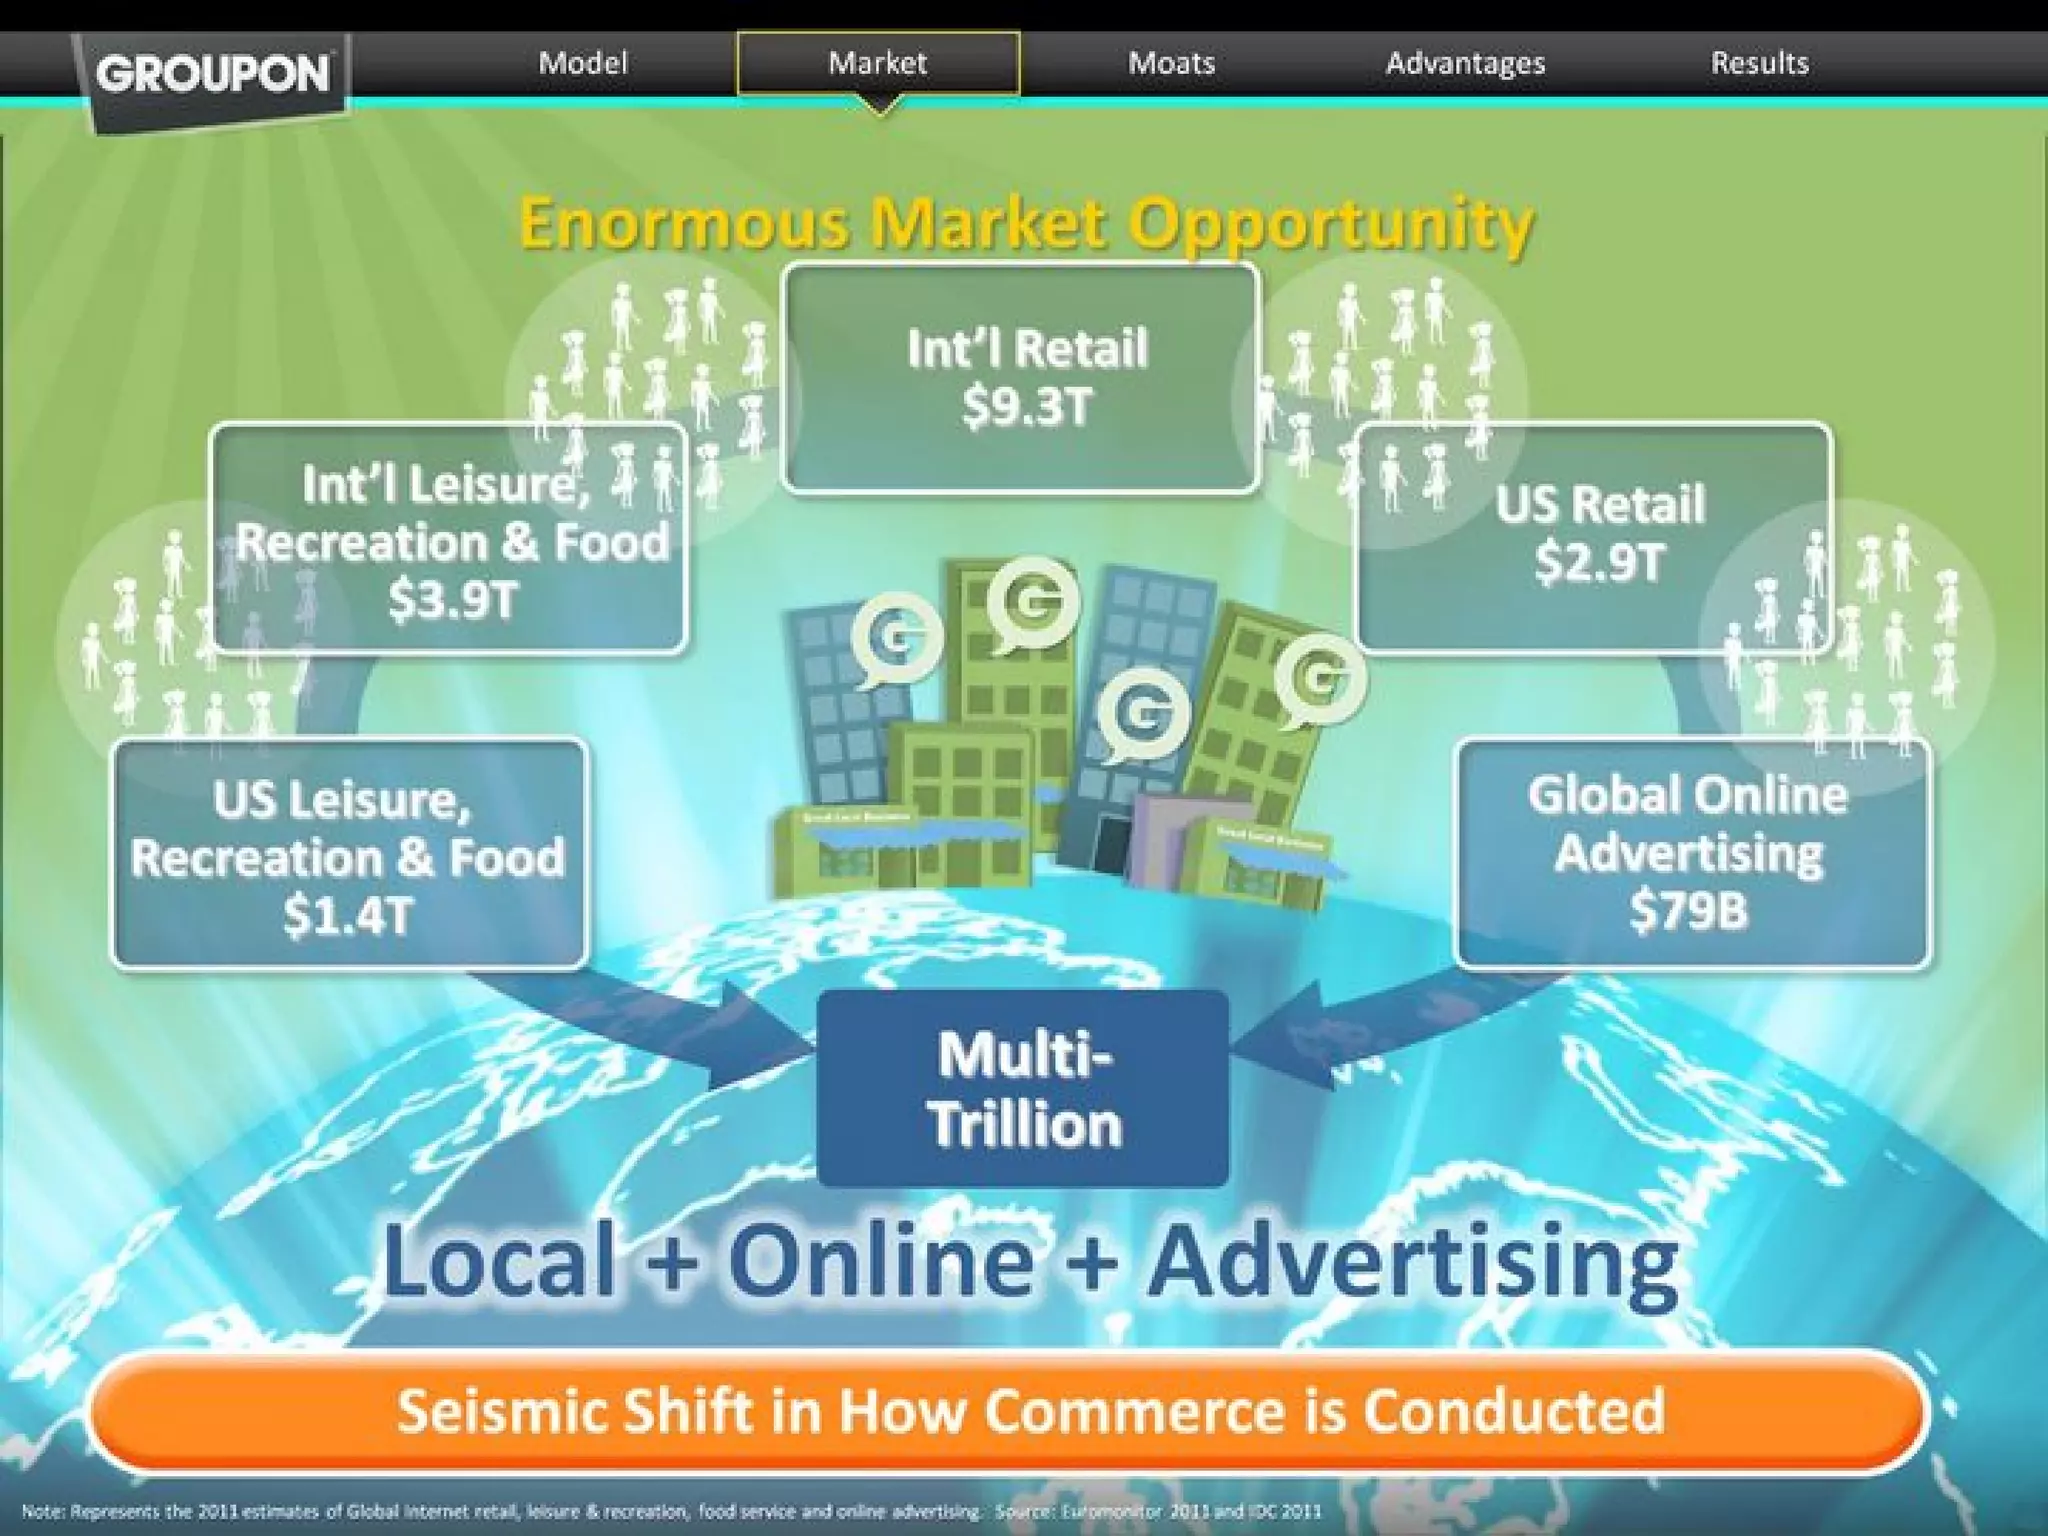
Slide 13 (Enormous Market Opportunity) uses high-level, large-scale market figures (US retail, international retail, leisure, global online advertising) to argue that the opportunity is multi-trillion dollars. The graphics and callouts emphasize breadth (local + online + advertising) to justify the company's fast expansion and product extensions.

This is effective because it addresses a core investor question: 'Is this big enough to justify the investment?' Founders should similarly combine realistic market subsections to show both immediate and longer-term addressable markets. Be explicit about data sources and the segments you expect to capture — investors want credible TAM math and a path to penetration.

Key Takeaway: Quantify and segment your market opportunity clearly, showing both near-term monetizable segments and longer-term expansion possibilities.
Growth and traction: Visualizing rapid scale

Growth and traction: Visualizing rapid scale

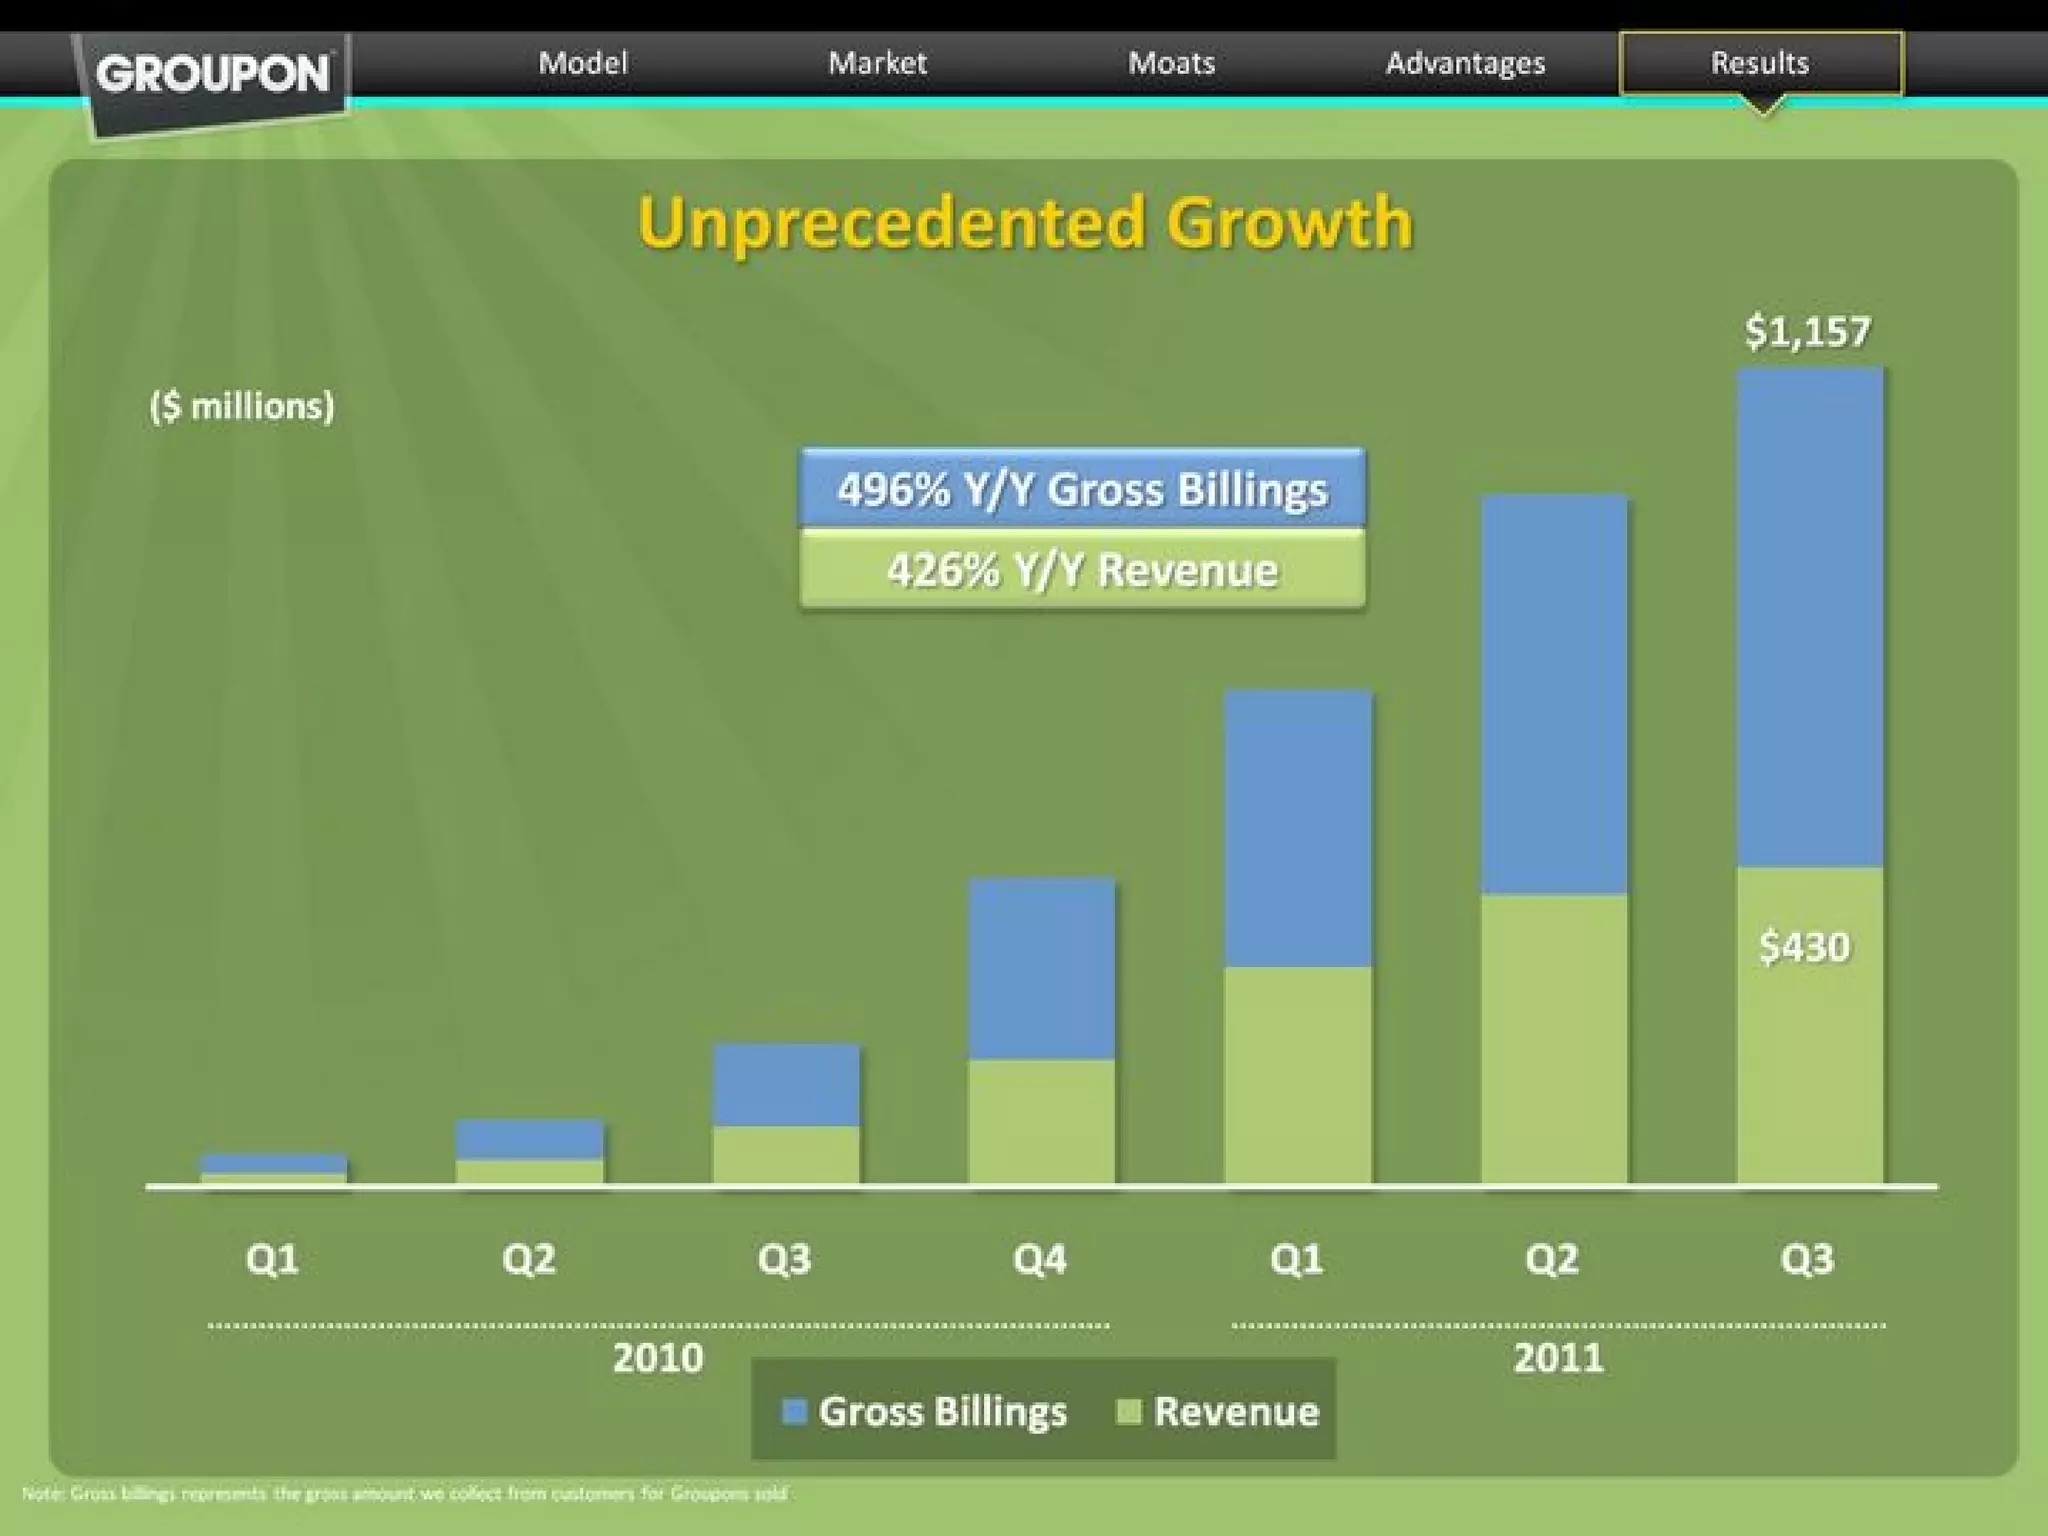
Slide 33 (Unprecedented Growth) shows a clean stacked bar chart of gross billings and revenue growth across quarters, with percentages (496% Y/Y gross billings, 426% Y/Y revenue). The visual emphasizes momentum and scale, a core narrative for a growth-stage company heading to IPO. Using both gross billings and revenue demonstrates understanding of the different top-line metrics relevant to marketplaces.

Investors focus on growth quality as much as rate. Founders should present growth with context: show the drivers (customer acquisition, expansion to new markets) and include important complementary metrics (unit economics, churn, marketing efficiency) nearby so growth doesn't appear disconnected from profitability.

Key Takeaway: Show rapid growth with clear, comparable metrics and contextualize the drivers so investors see both scale and quality.
Unit economics and ROI: Demonstrating payback and contribution

Unit economics and ROI: Demonstrating payback and contribution

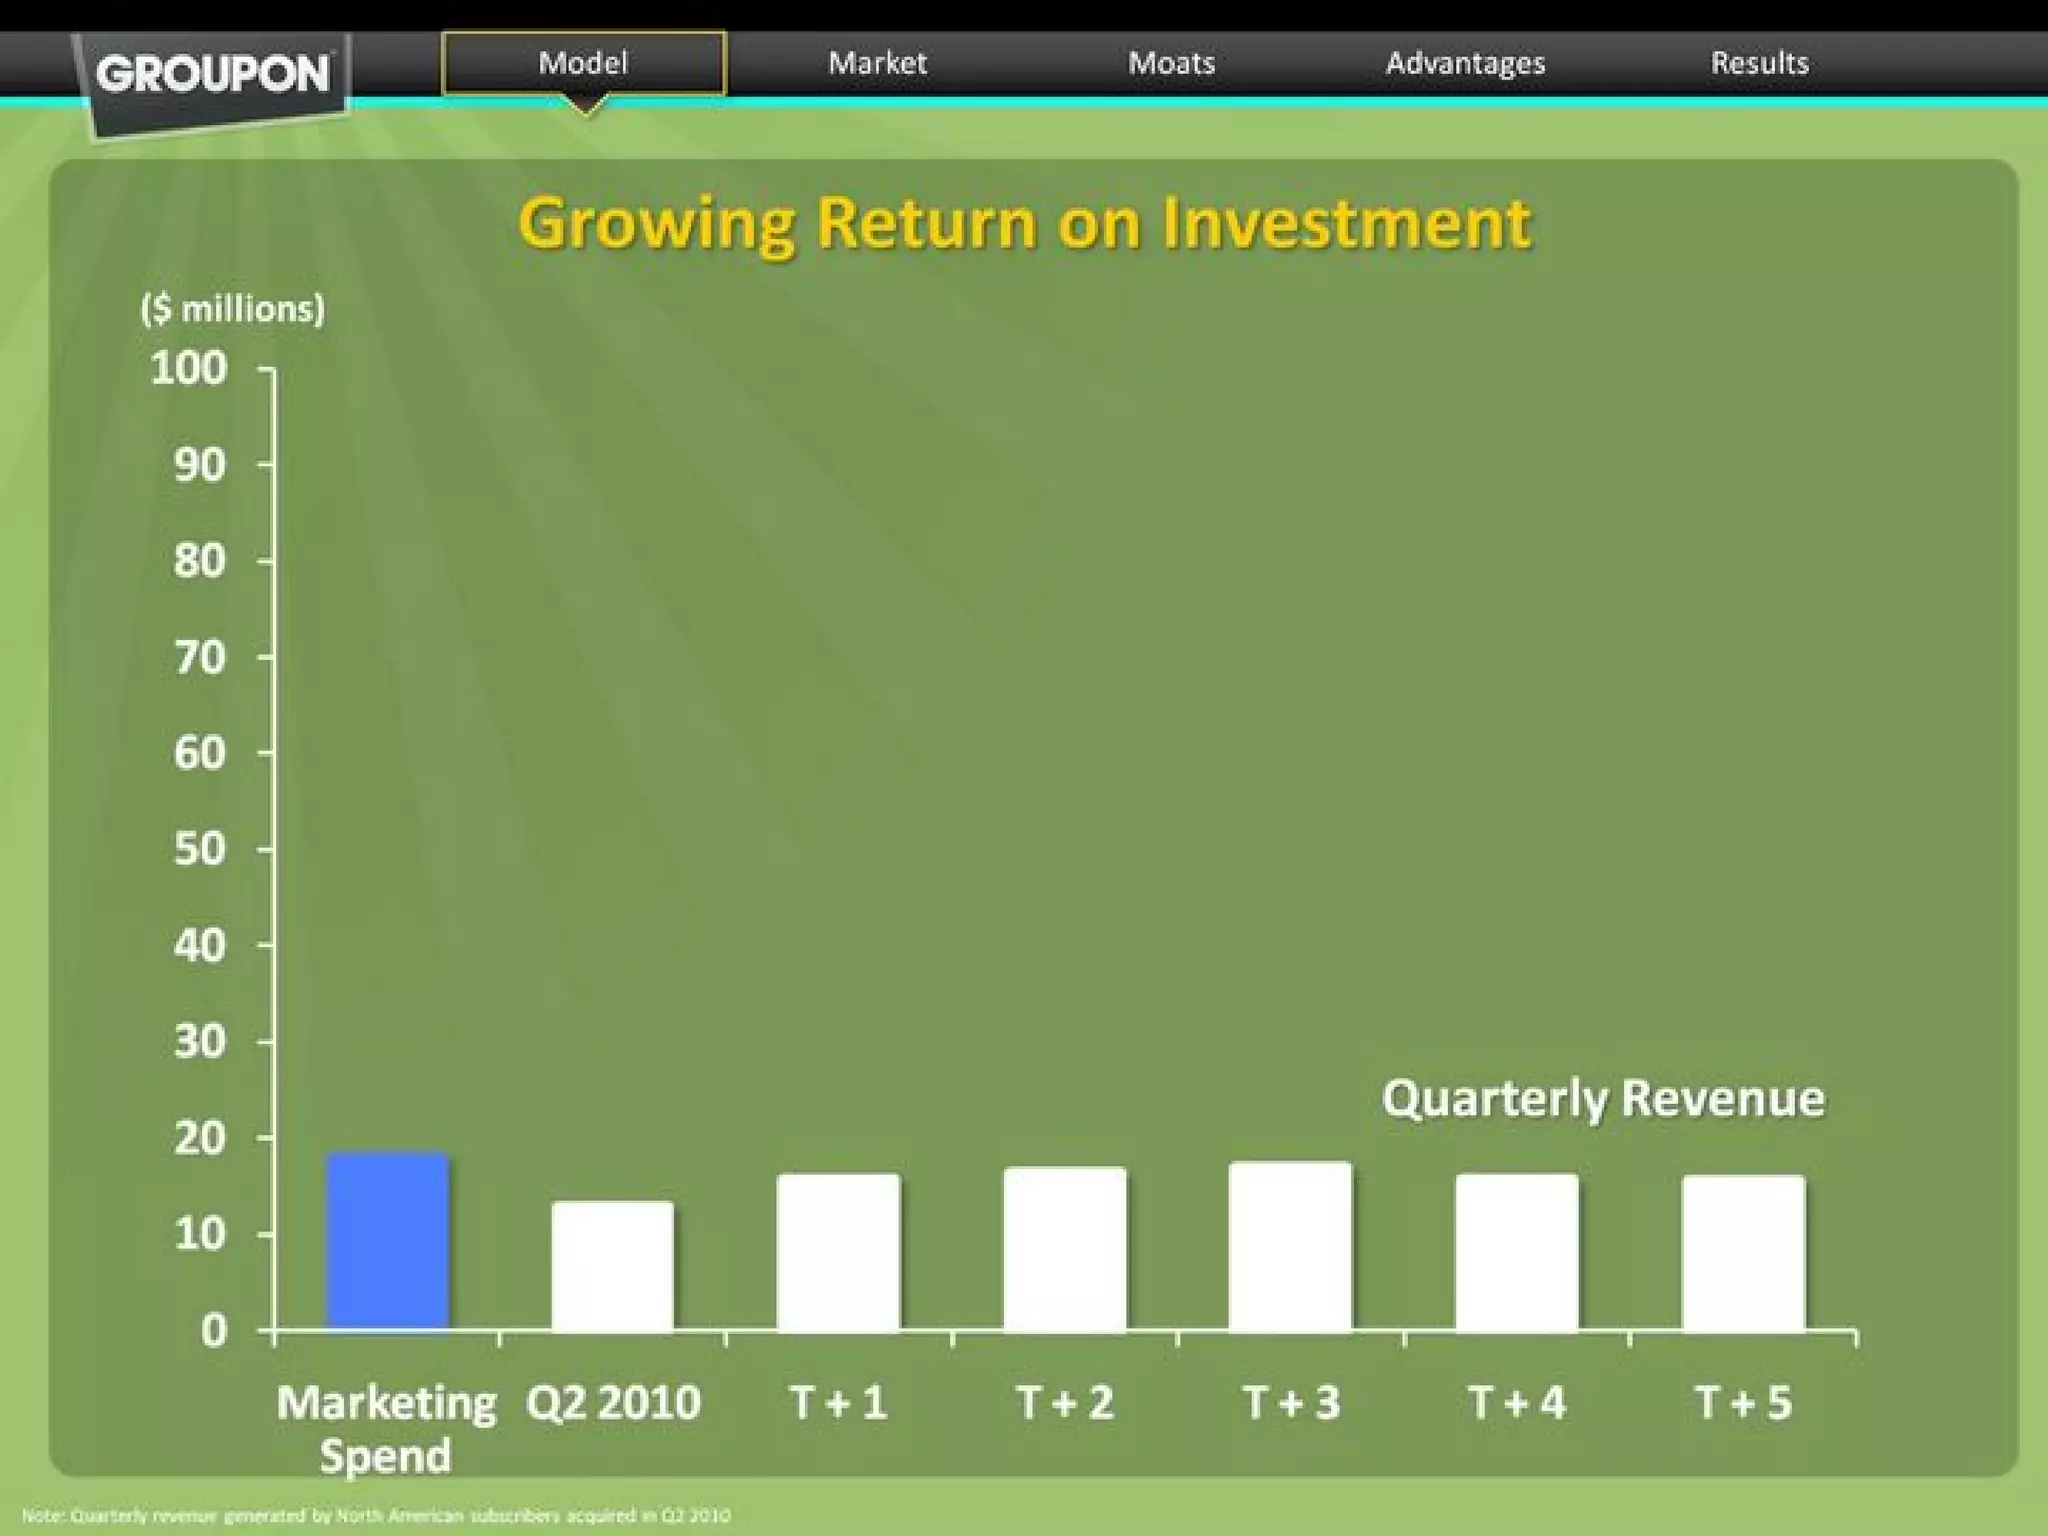
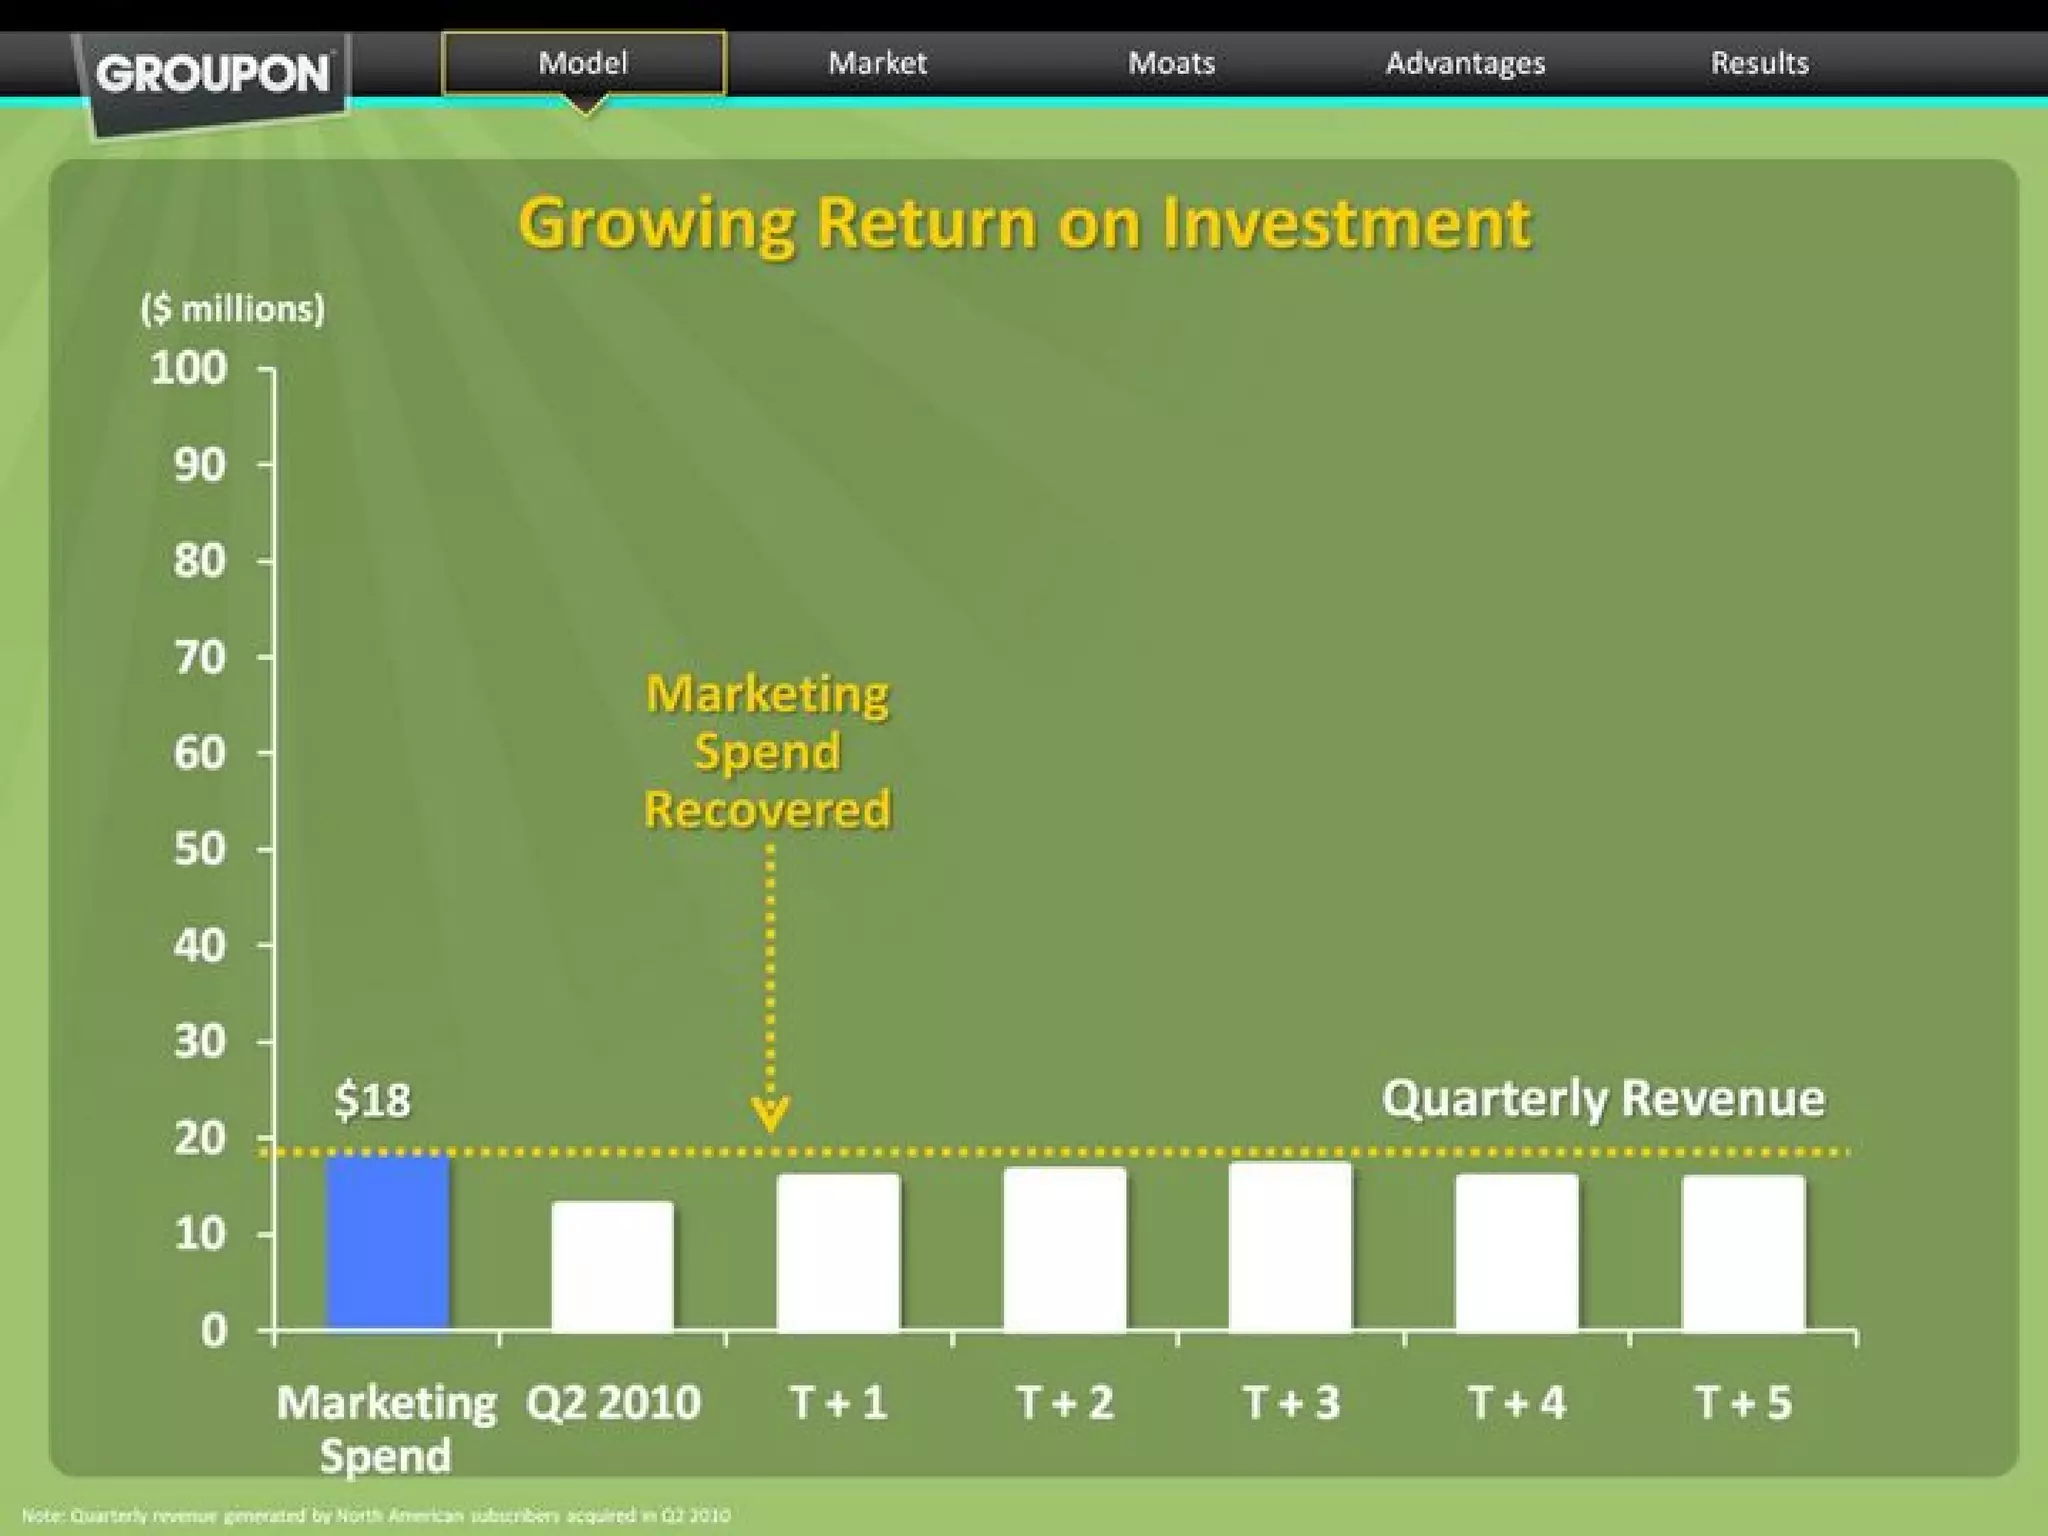
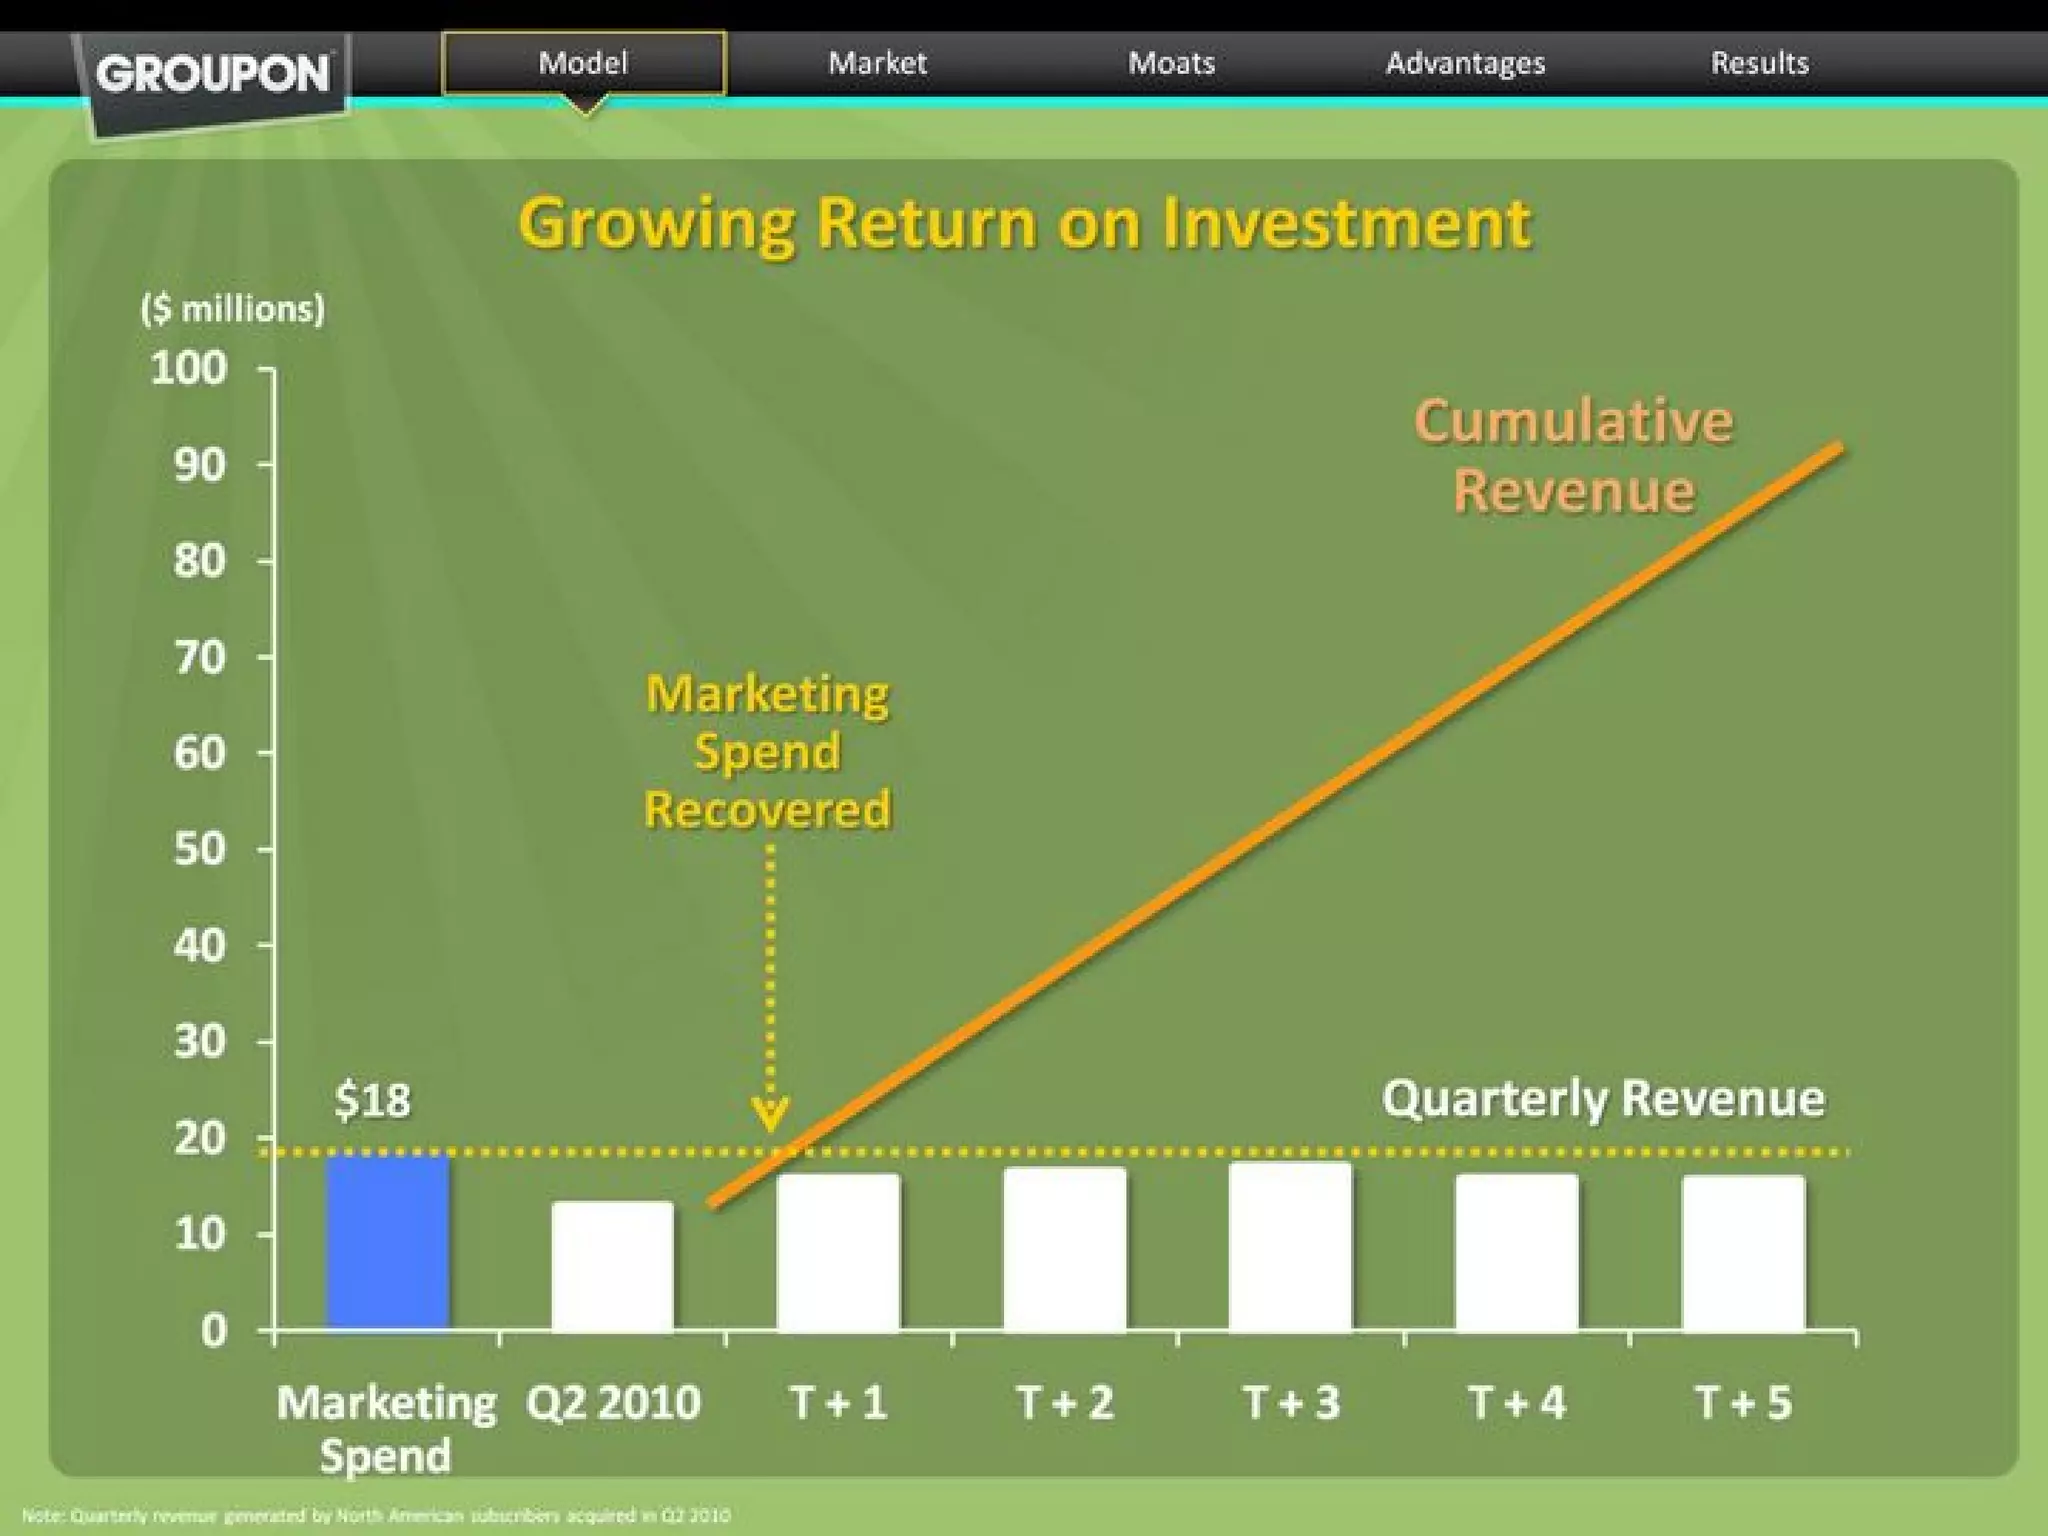
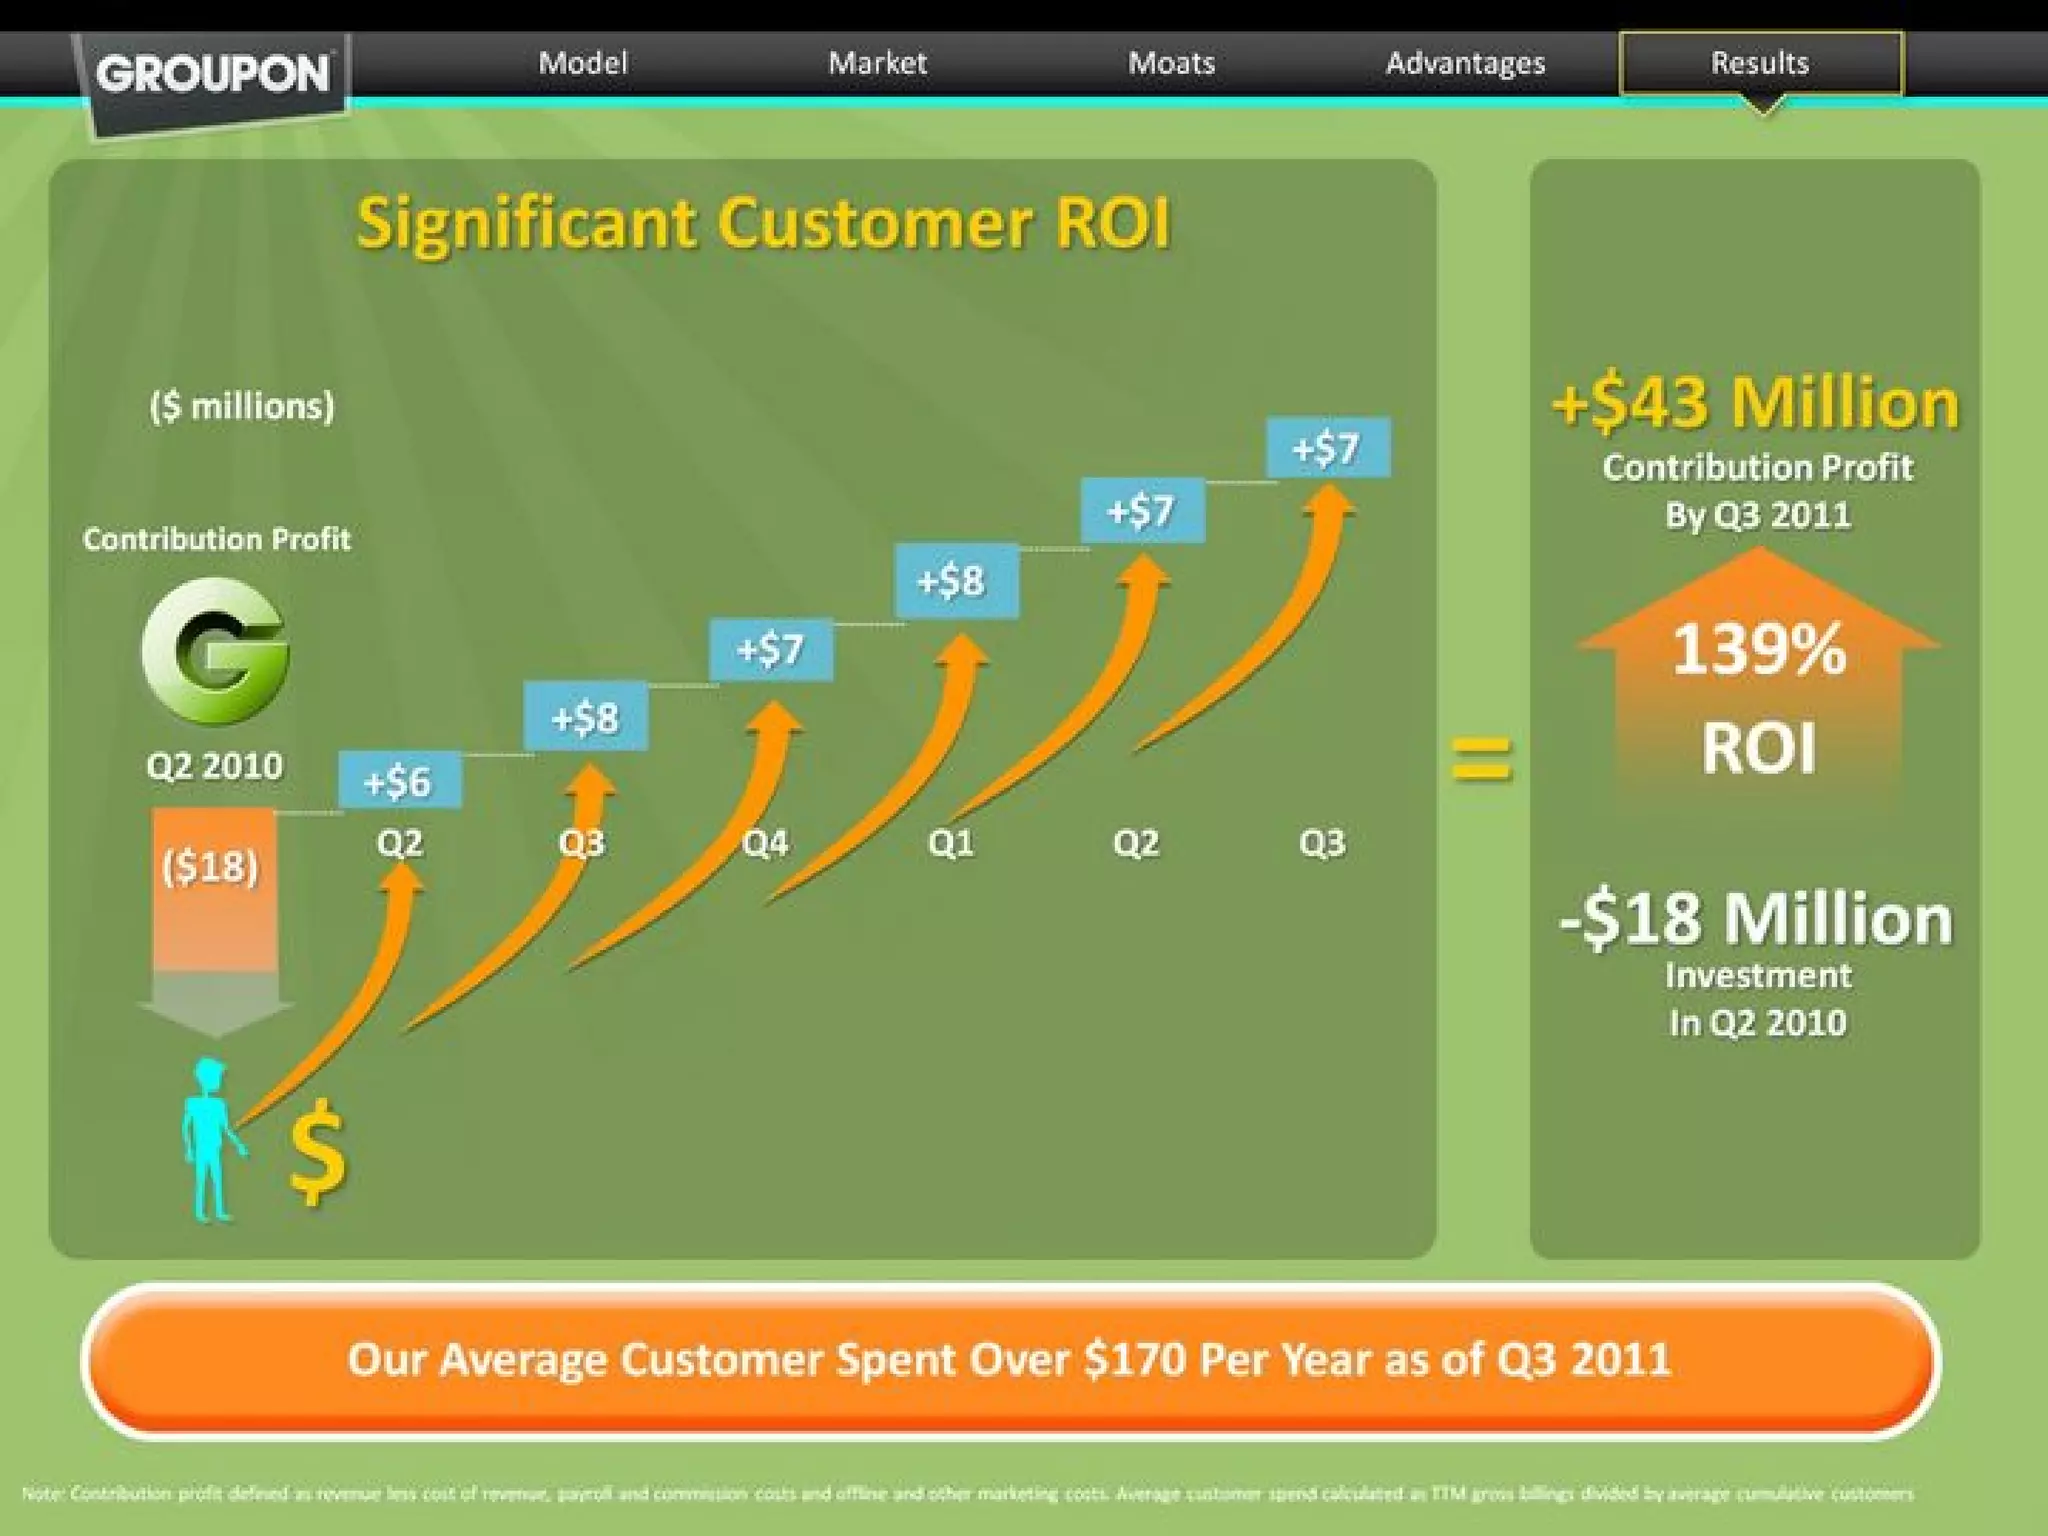
Slide 36 (Significant Customer ROI) lays out an accessible customer ROI narrative: initial marketing investment, subsequent quarterly contribution per cohort, and cumulative return leading to a net positive contribution by Q3 2011. It converts abstract growth into dollar-per-customer economics, quantifying how an $18M marketing investment produced sustained incremental contribution and an average customer spend of over $170 per year.

This is a standout part of the deck because investors need to believe growth is durable and profitable at scale. For founders, the lesson is to present unit economics (CAC, payback period, contribution margin) plainly and visually: show the investment, the ensuing per-customer cashflow, and the timeline to payback. This reduces risk perception and makes scaling assumptions credible.

Key Takeaway: Present unit economics clearly — show CAC, payback timeline, and per-customer contribution so investors can assess scalability and sustainability.

Conclusion: Key Lessons

Groupon’s IPO deck excels at combining simple, consistent branding with rigorous operational detail. Strengths include: a concise offering summary, a clear mapping of strategic drivers to measurable results, clean marketplace visuals, explicit TAM segmentation, transparent growth charts, and persuasive unit-economics analysis. Those elements together create a narrative that growth is not only fast but underpinned by repeatable economics and scale advantages.

Actionable advice for founders: (1) start with a focused opening and maintain consistent visual language, (2) state the ask and deal mechanics up-front for investor convenience, (3) link strategy to measurable outcomes, (4) use simple diagrams to explain marketplace mechanics and where value accrues, (5) quantify TAM credibly, and (6) make unit economics and payback visuals central — growth without credible economics is risky. Following this structure helps transform an aspirational product story into a investable, evidence-backed company case.

Full Deck Analysis

12 sections

Overview

Company: Groupon
Round: IPO Roadshow ($950M IPO)
Year: 2011
Outcome: IPO at $12.7B valuation, stock declined from $26.15 (opening) to $2-3 by 2012

Executive Summary

The Groupon IPO roadshow pitch deck presents a masterclass in persuasive but misleading financial presentation. The deck showcases extraordinary growth metrics (426% Y/Y revenue growth, 30M cumulative customers across 45 countries) and claims of path to profitability, but obscures fundamental business model weaknesses through non-GAAP metrics, misleading comparisons (gross billings vs. revenue), and omission of critical data. Most damaging: Slide 24 reveals only 9% customer repeat rate, implying 91% churn and undermining the entire unit economics narrative that the deck spends considerable effort building.

Problem Statement

The deck never explicitly articulates a problem statement. Instead, it positions Groupon as a solution to merchant customer acquisition challenges and consumer deal discovery. The implicit problem:
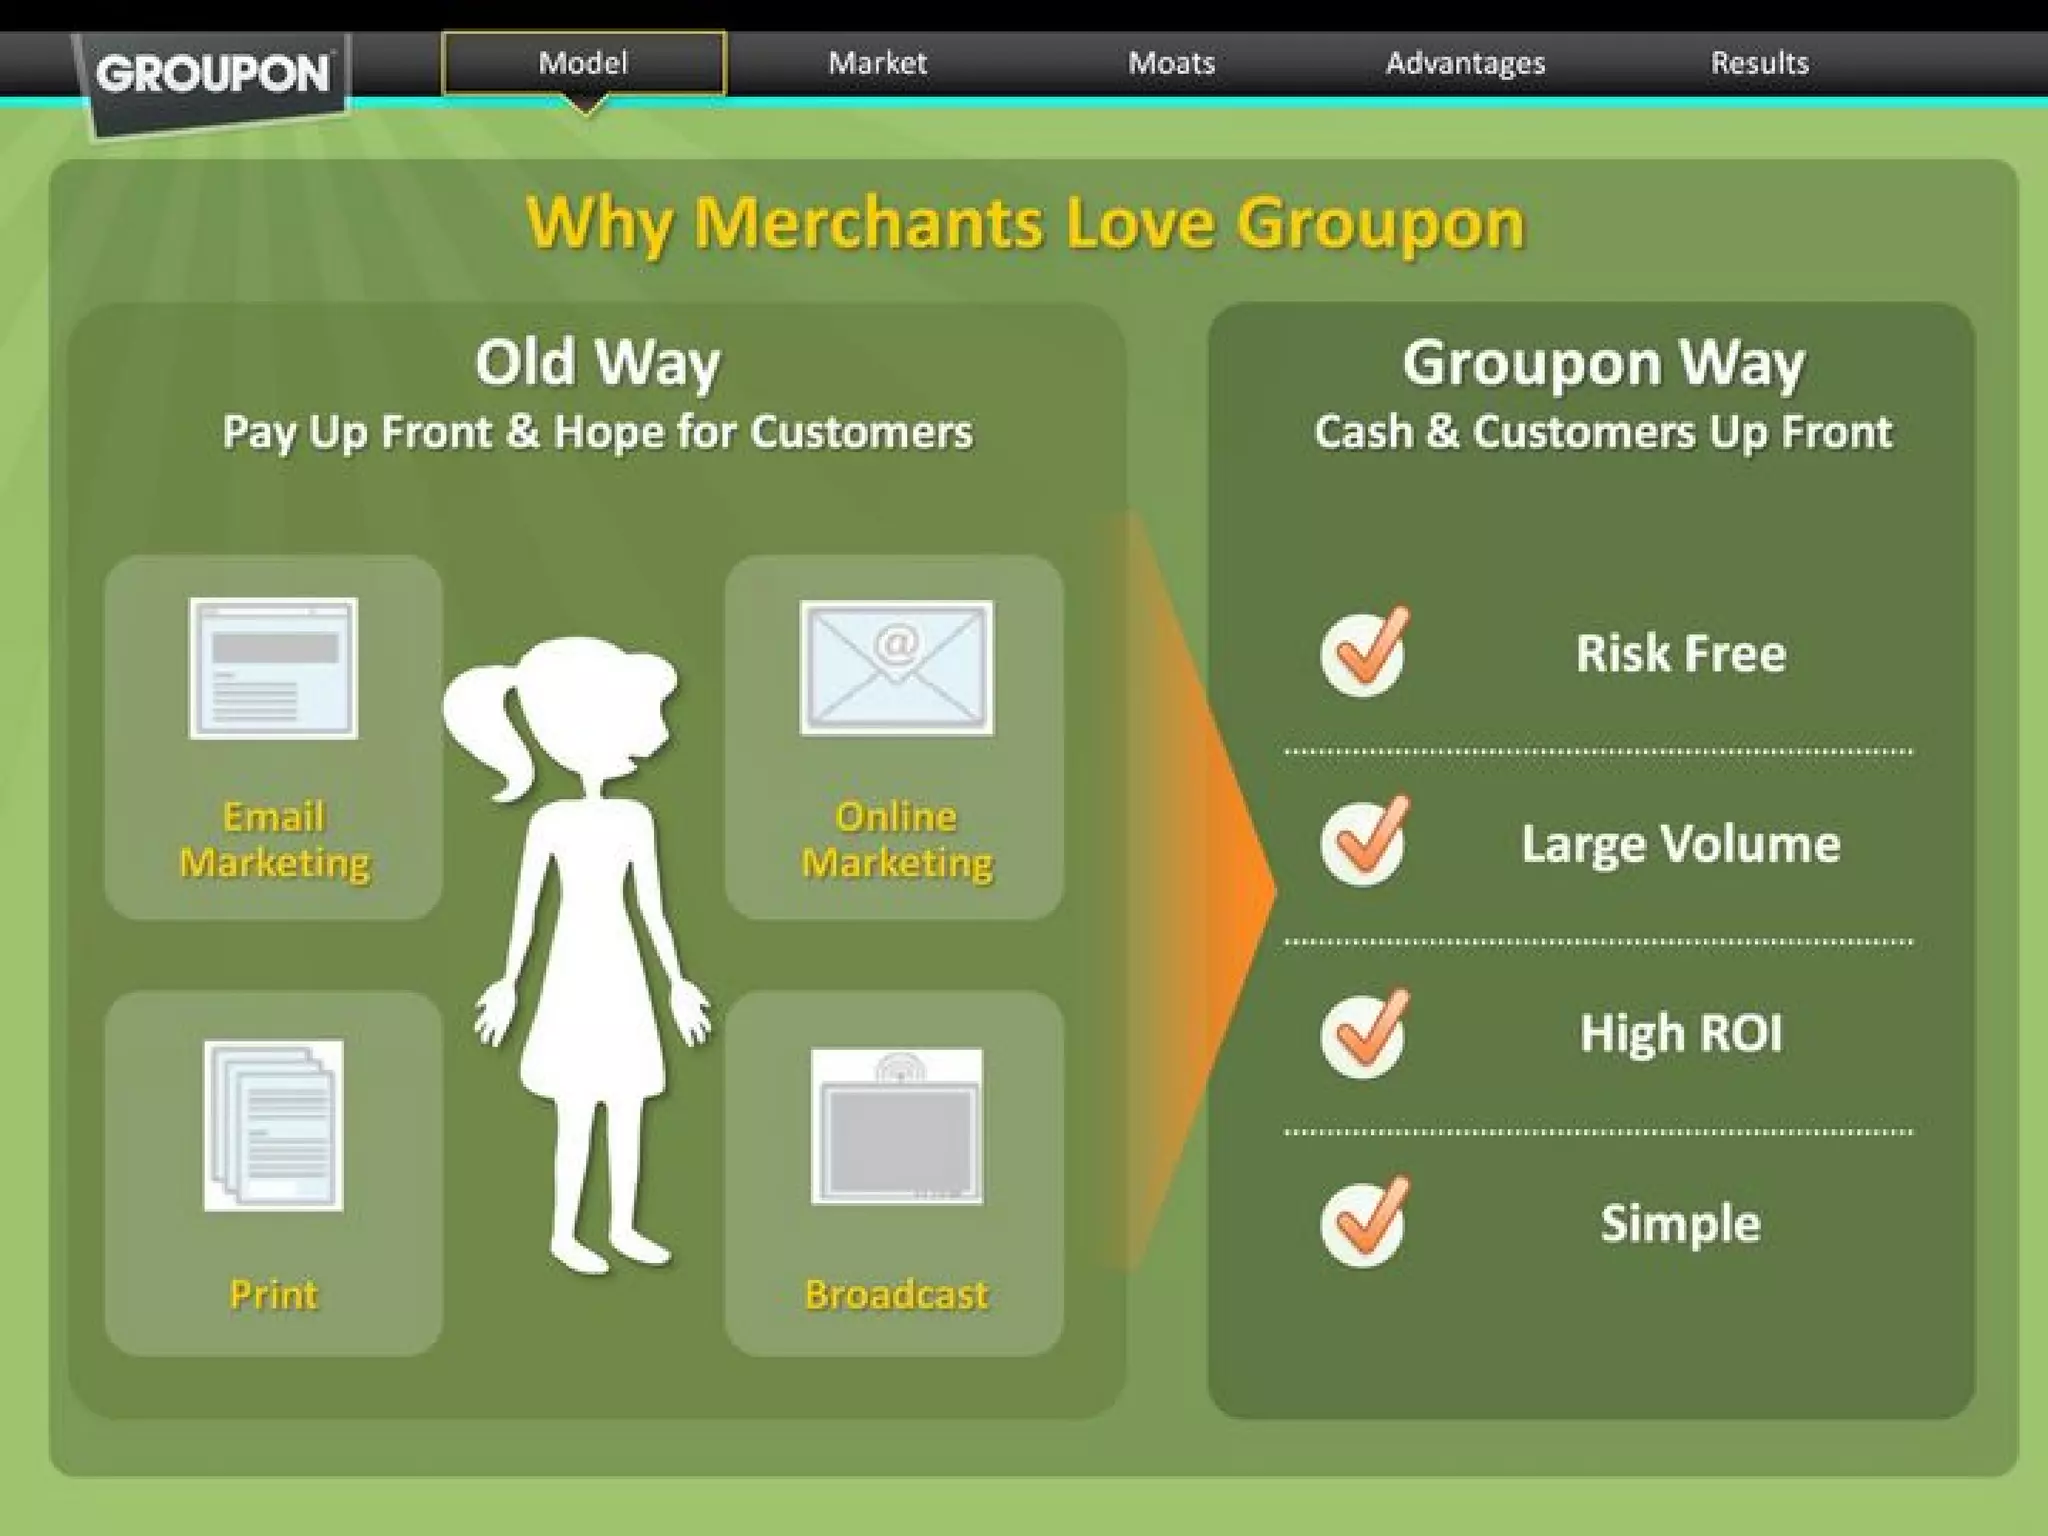
  • For Merchants (Slides 6-7): Traditional marketing (email, print, online, broadcast) requires upfront payment with uncertain customer acquisition results. Merchants lack efficient ways to reach local customers at scale.
  • For Consumers (Slide 11): Consumers lack efficient discovery mechanisms for local deals and experiences.

The deck frames this as an “Enormous Market Opportunity” (Slide 13) rather than a problem to solve, suggesting Groupon is creating a new category rather than solving an existing problem.

Solution

Groupon positions itself as a two-sided marketplace (Slide 11) that “marries supply and demand through price and discovery.” The solution has three components:

  1. For Merchants: Risk-free customer acquisition through Groupon’s curated deal platform. Merchants pay only for results (50% of deal value), not upfront marketing spend. Groupon handles customer acquisition, deal promotion, and fulfillment (Slides 6-7, 20).

  2. For Consumers: Curated daily deals delivered via email and mobile app, with quality assurance and customer service guarantees (Slide 21).

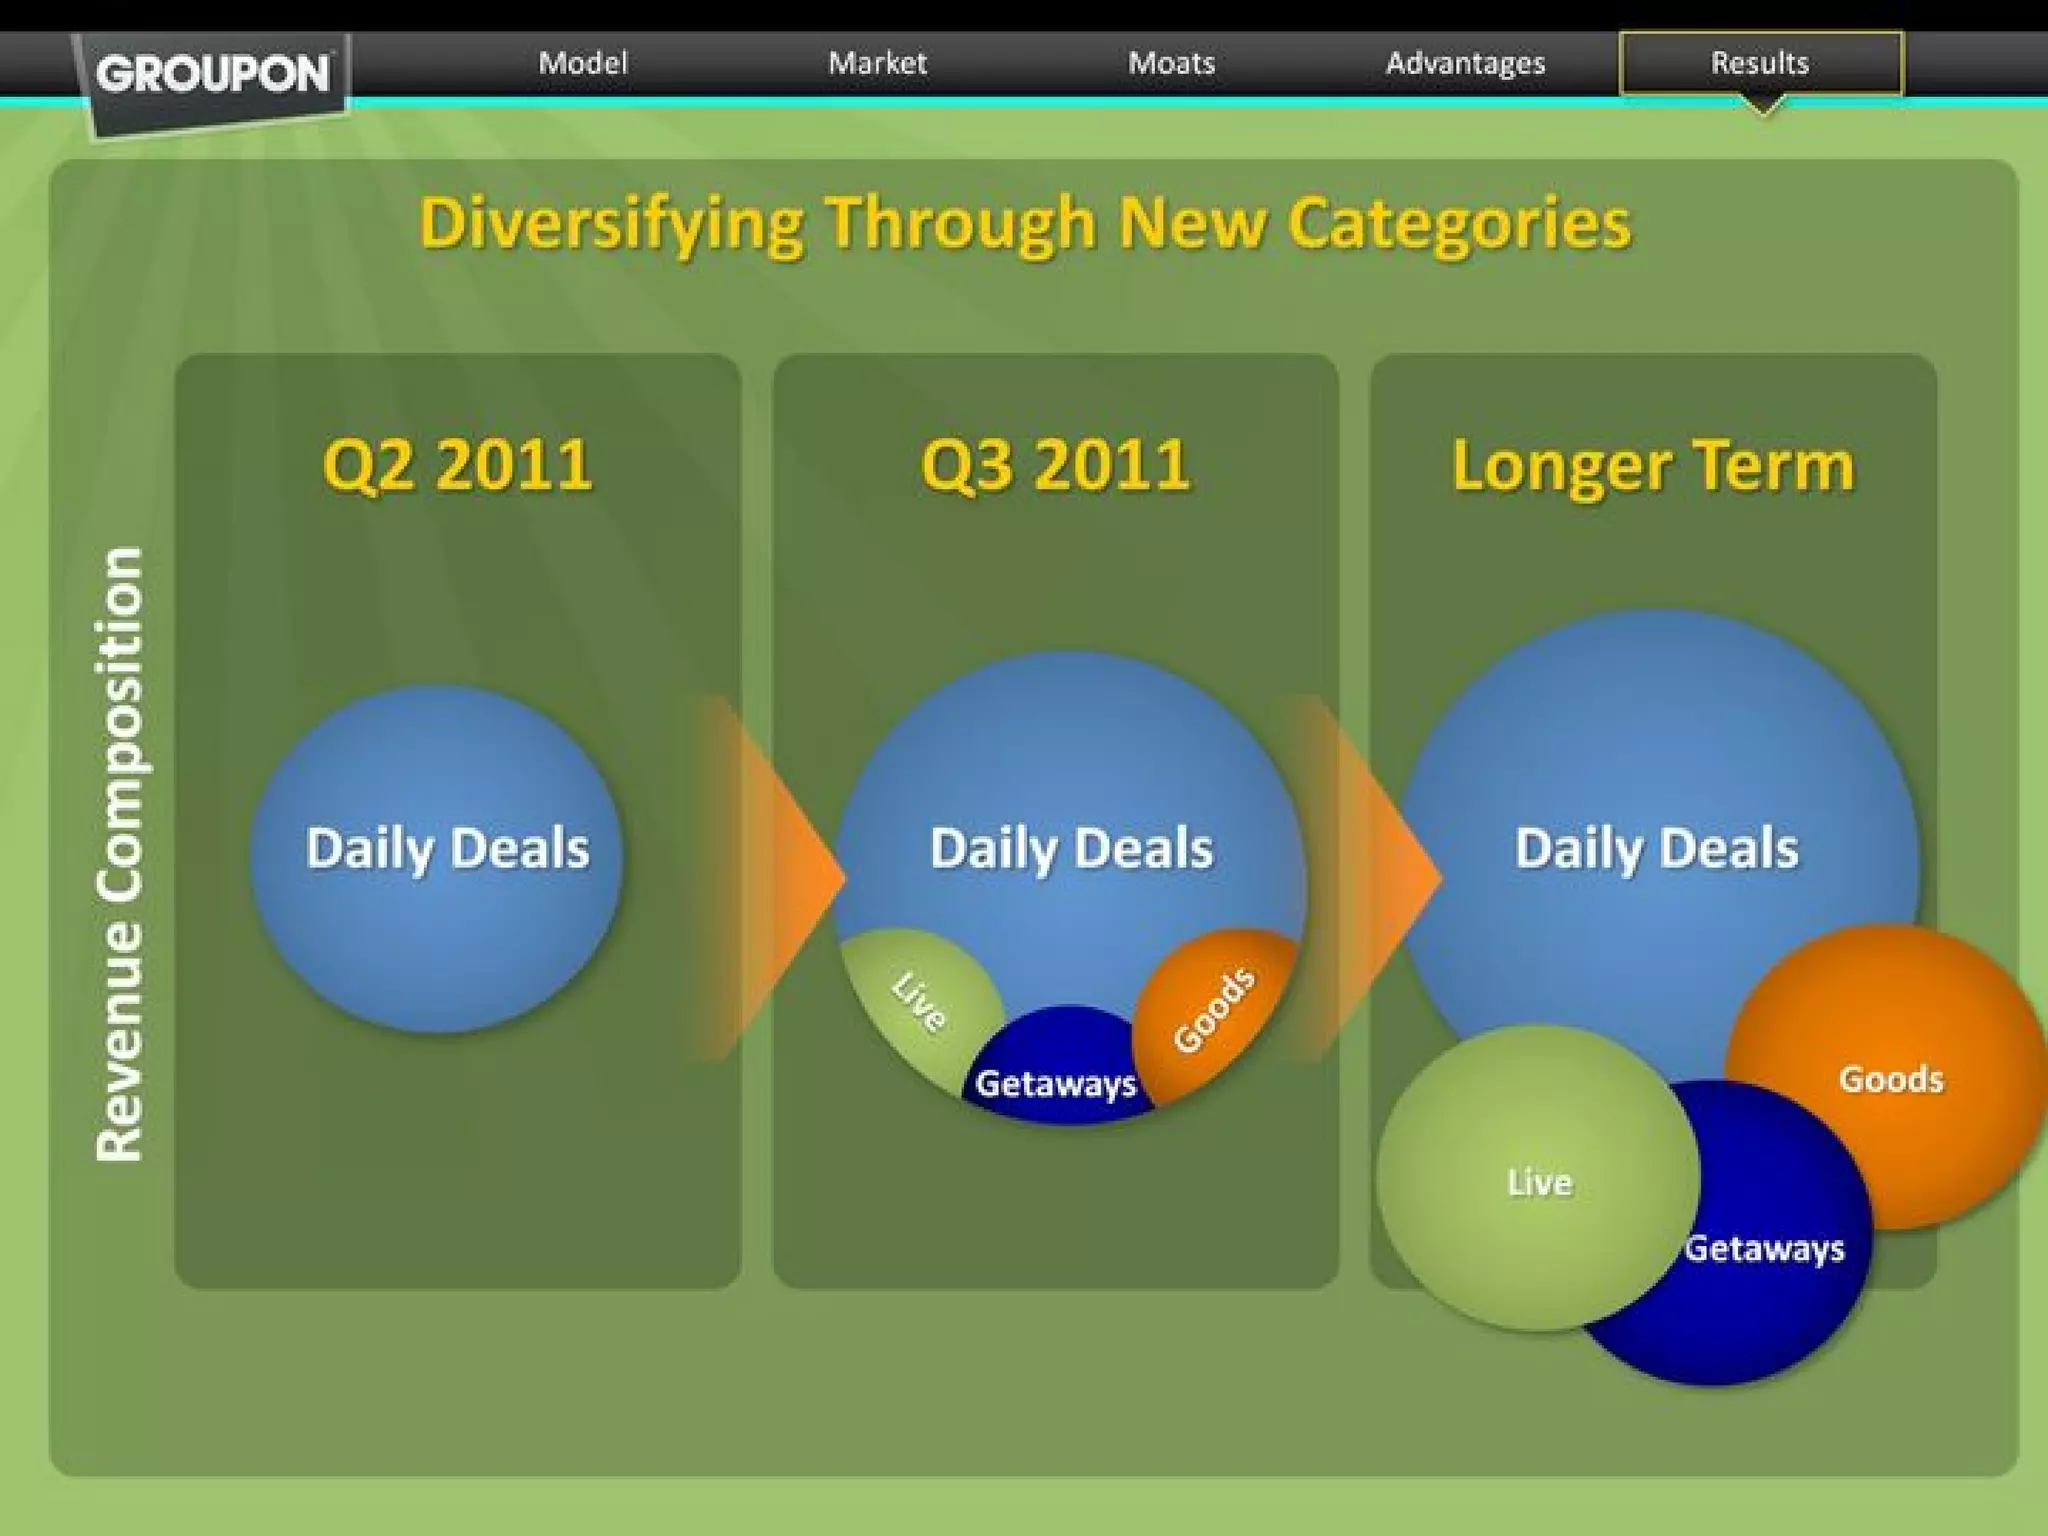
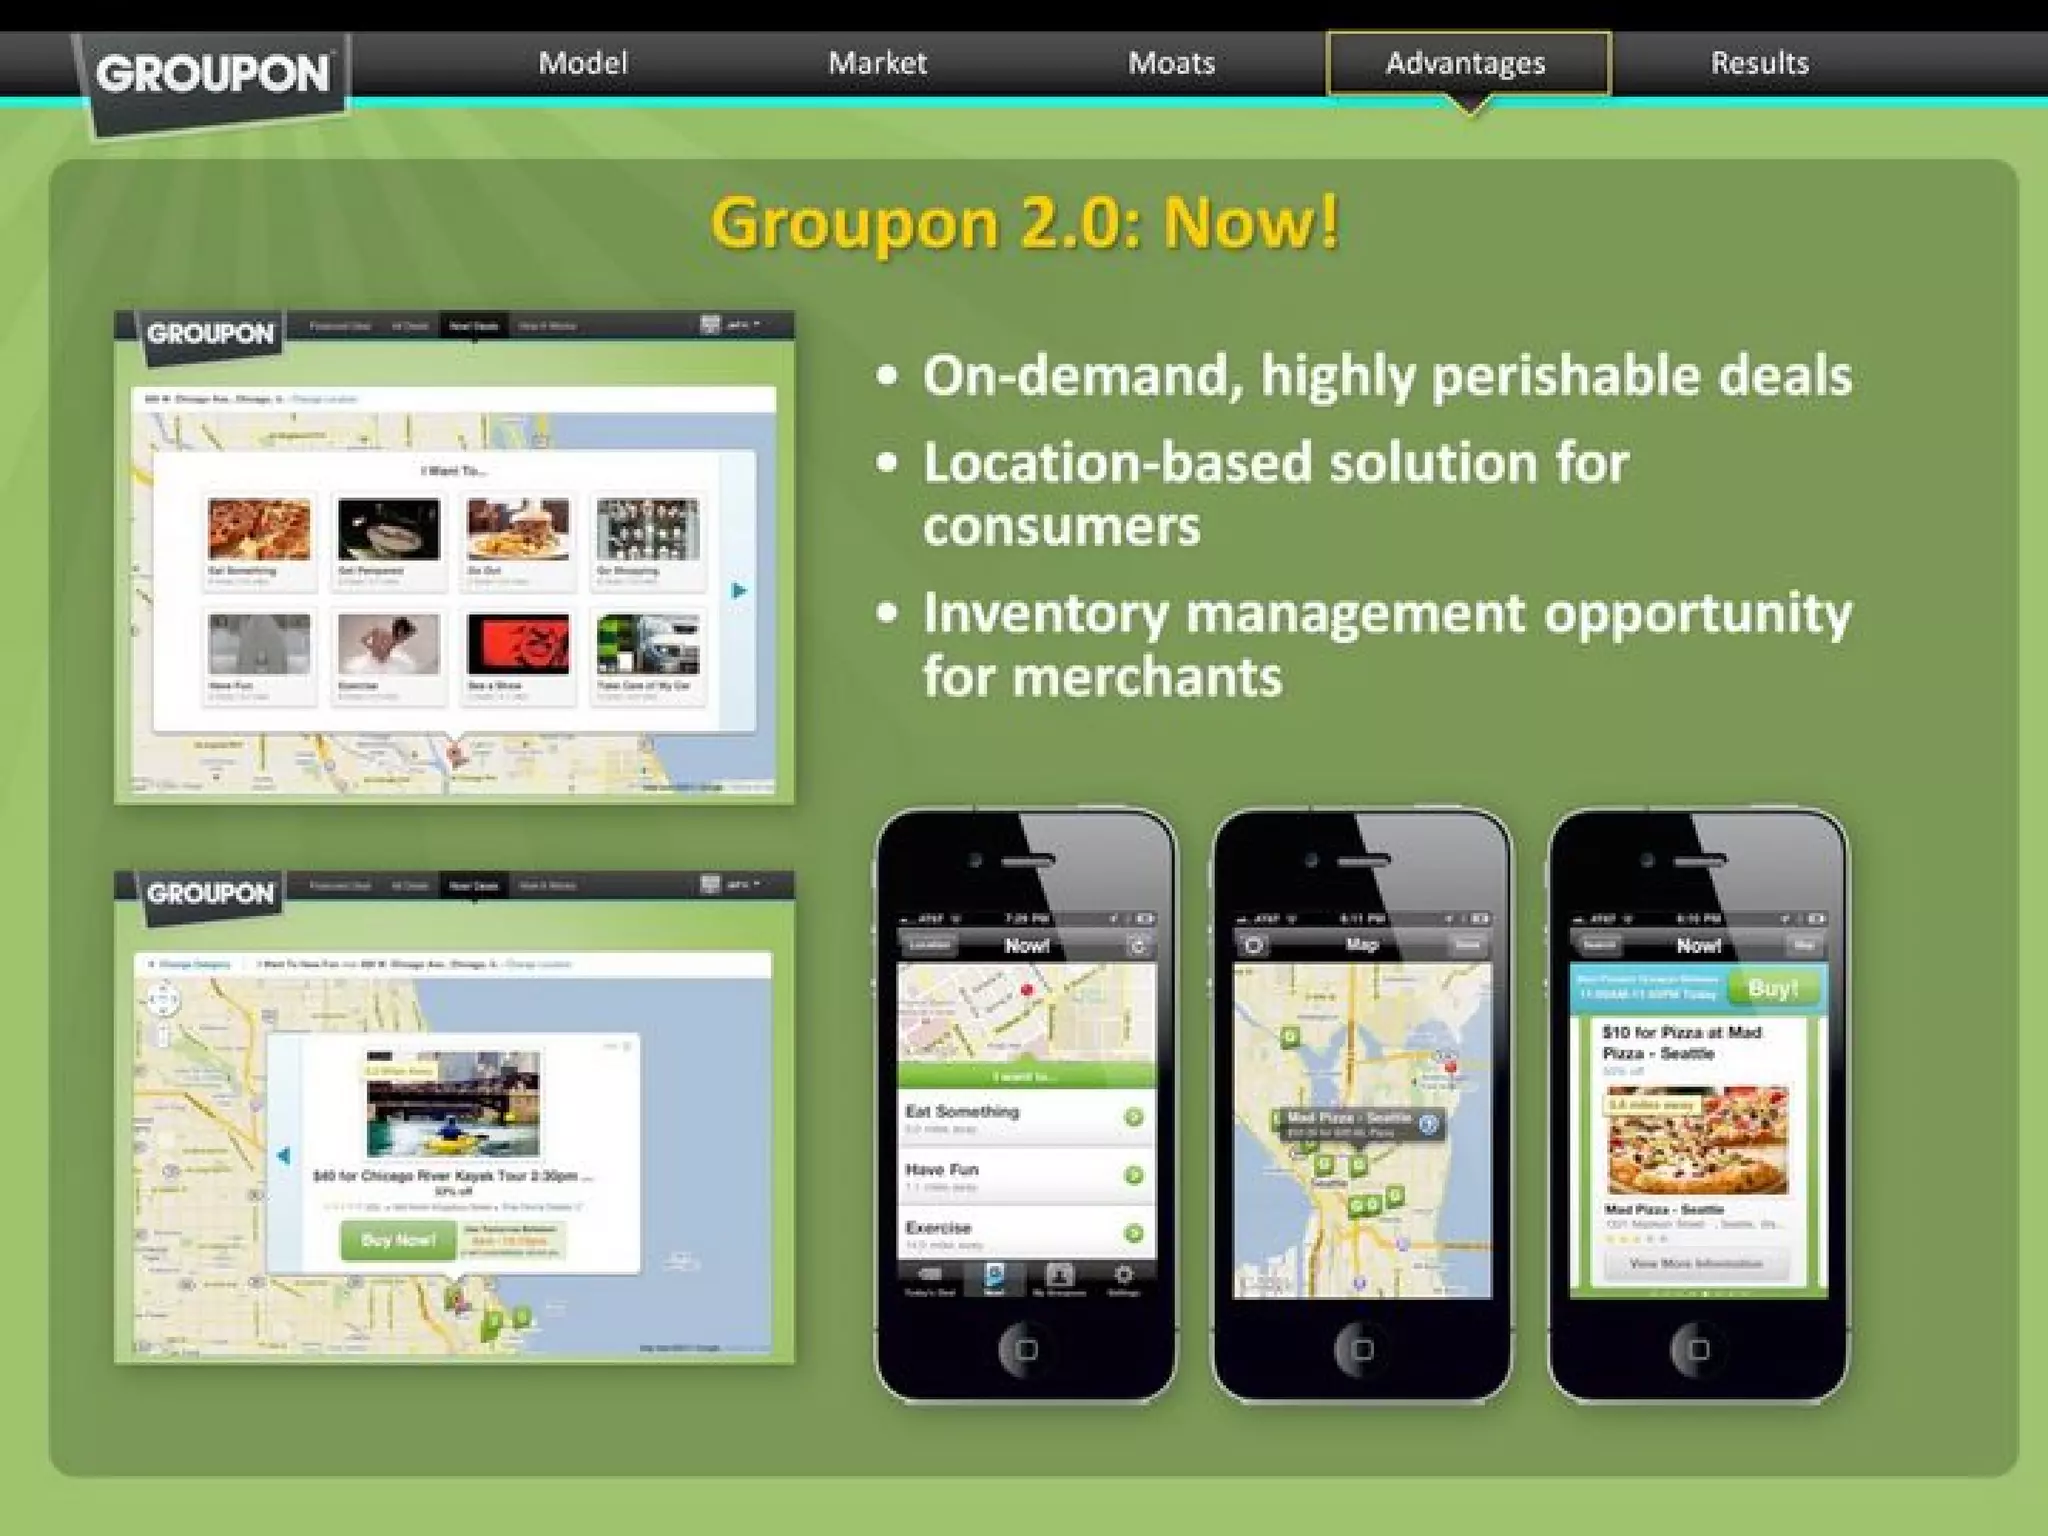
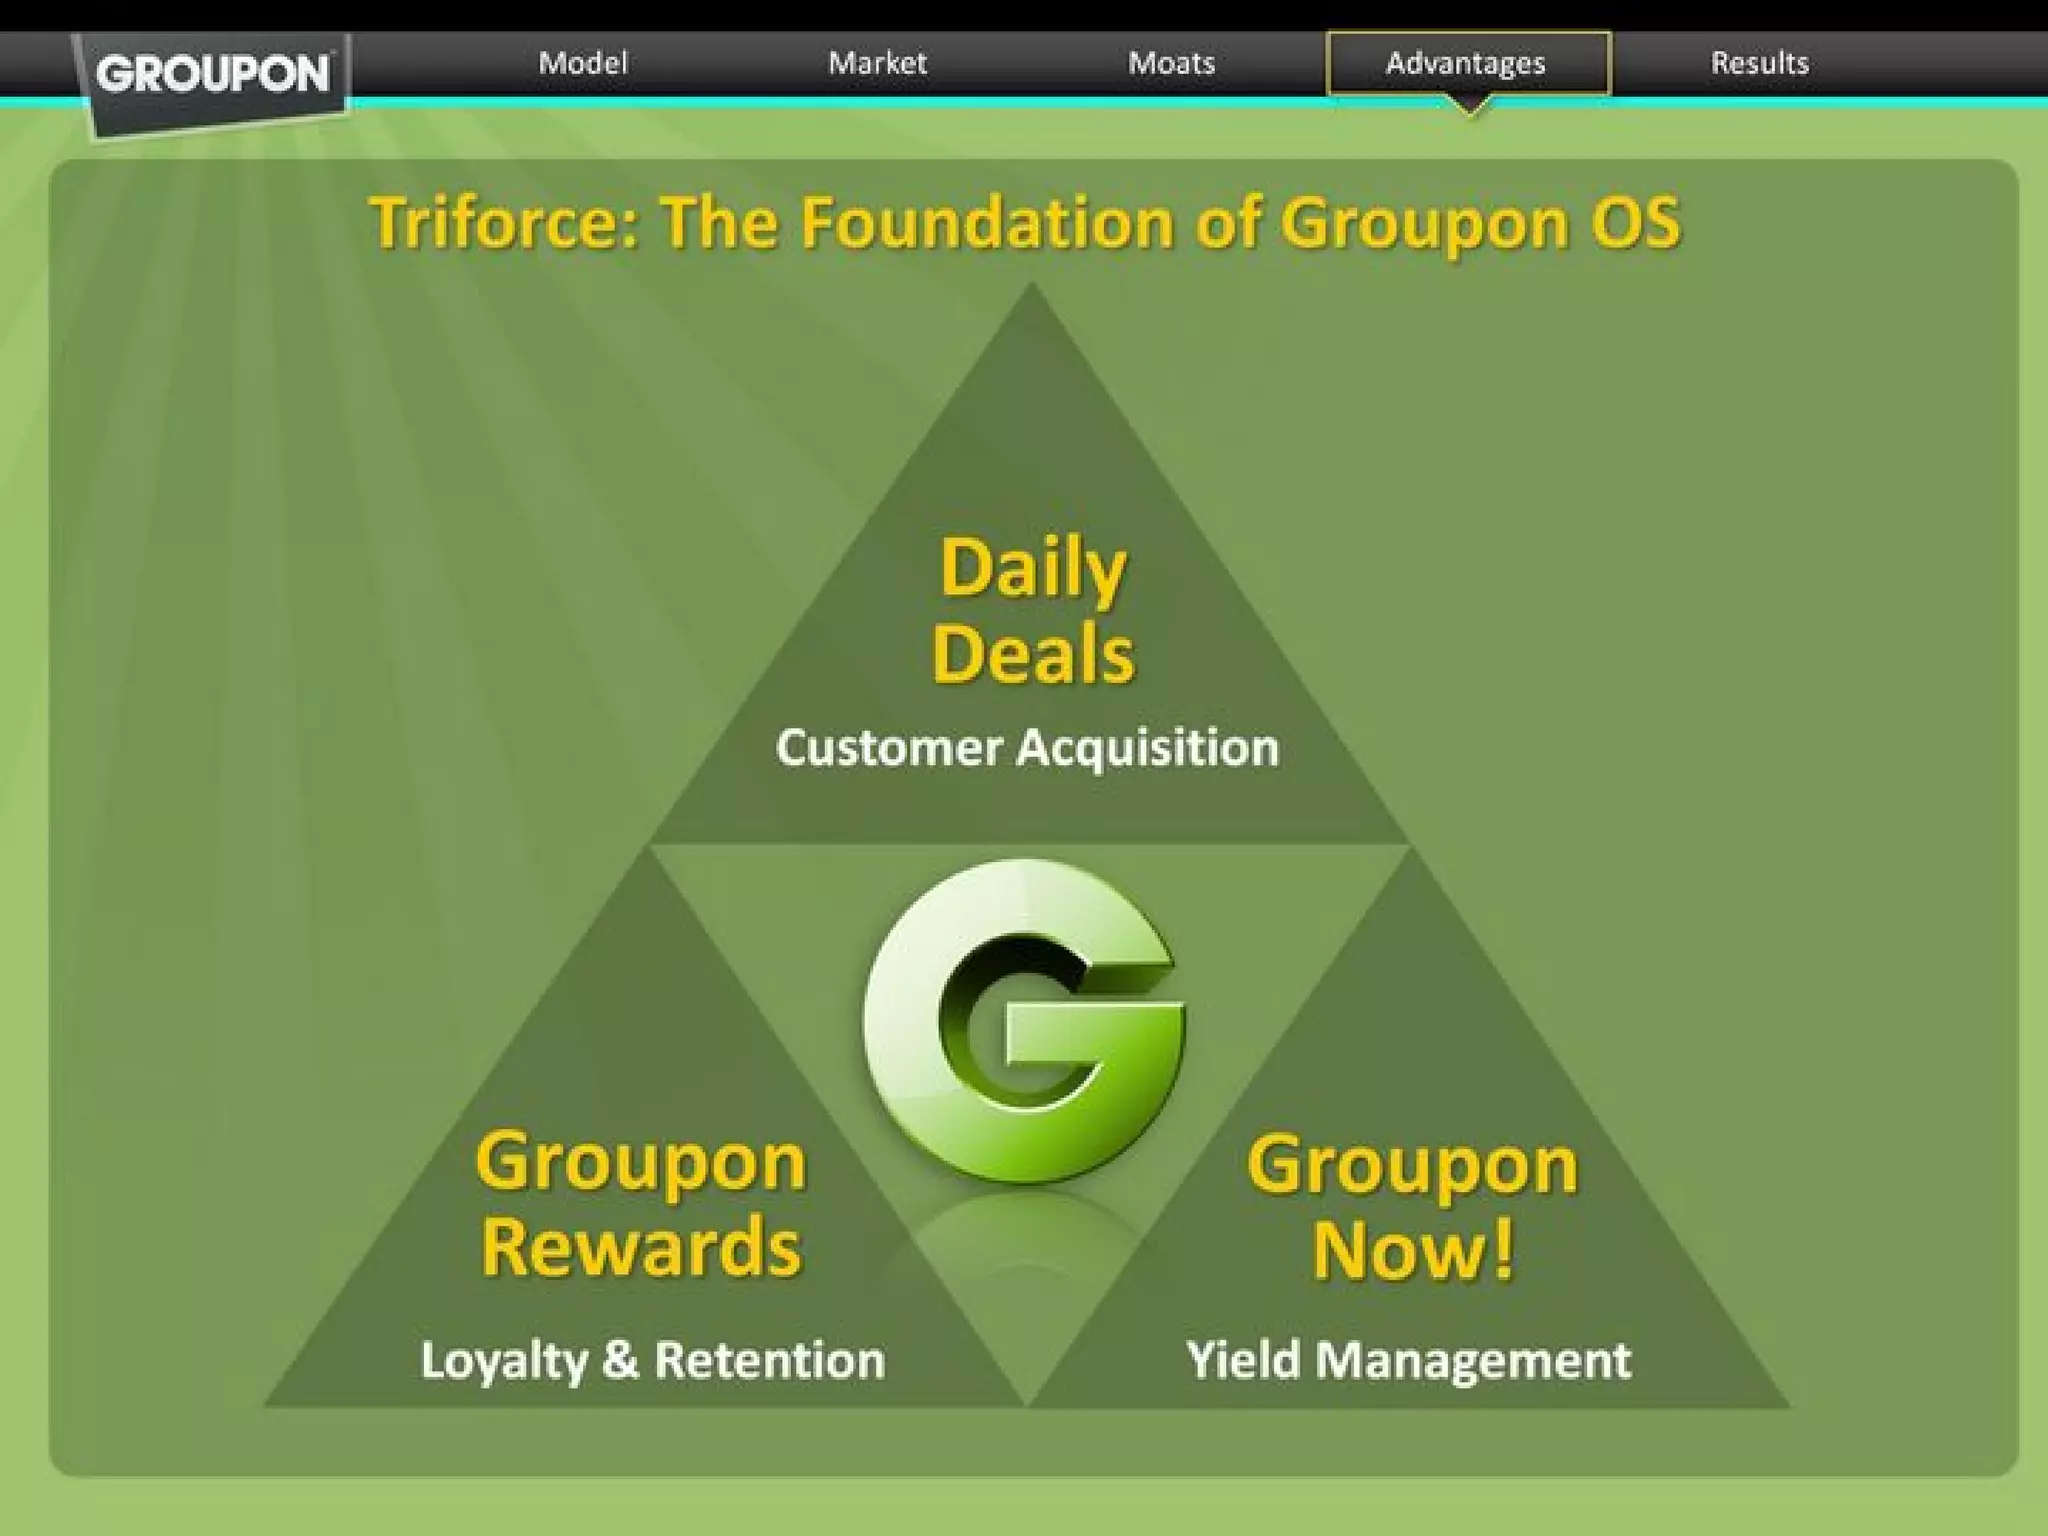
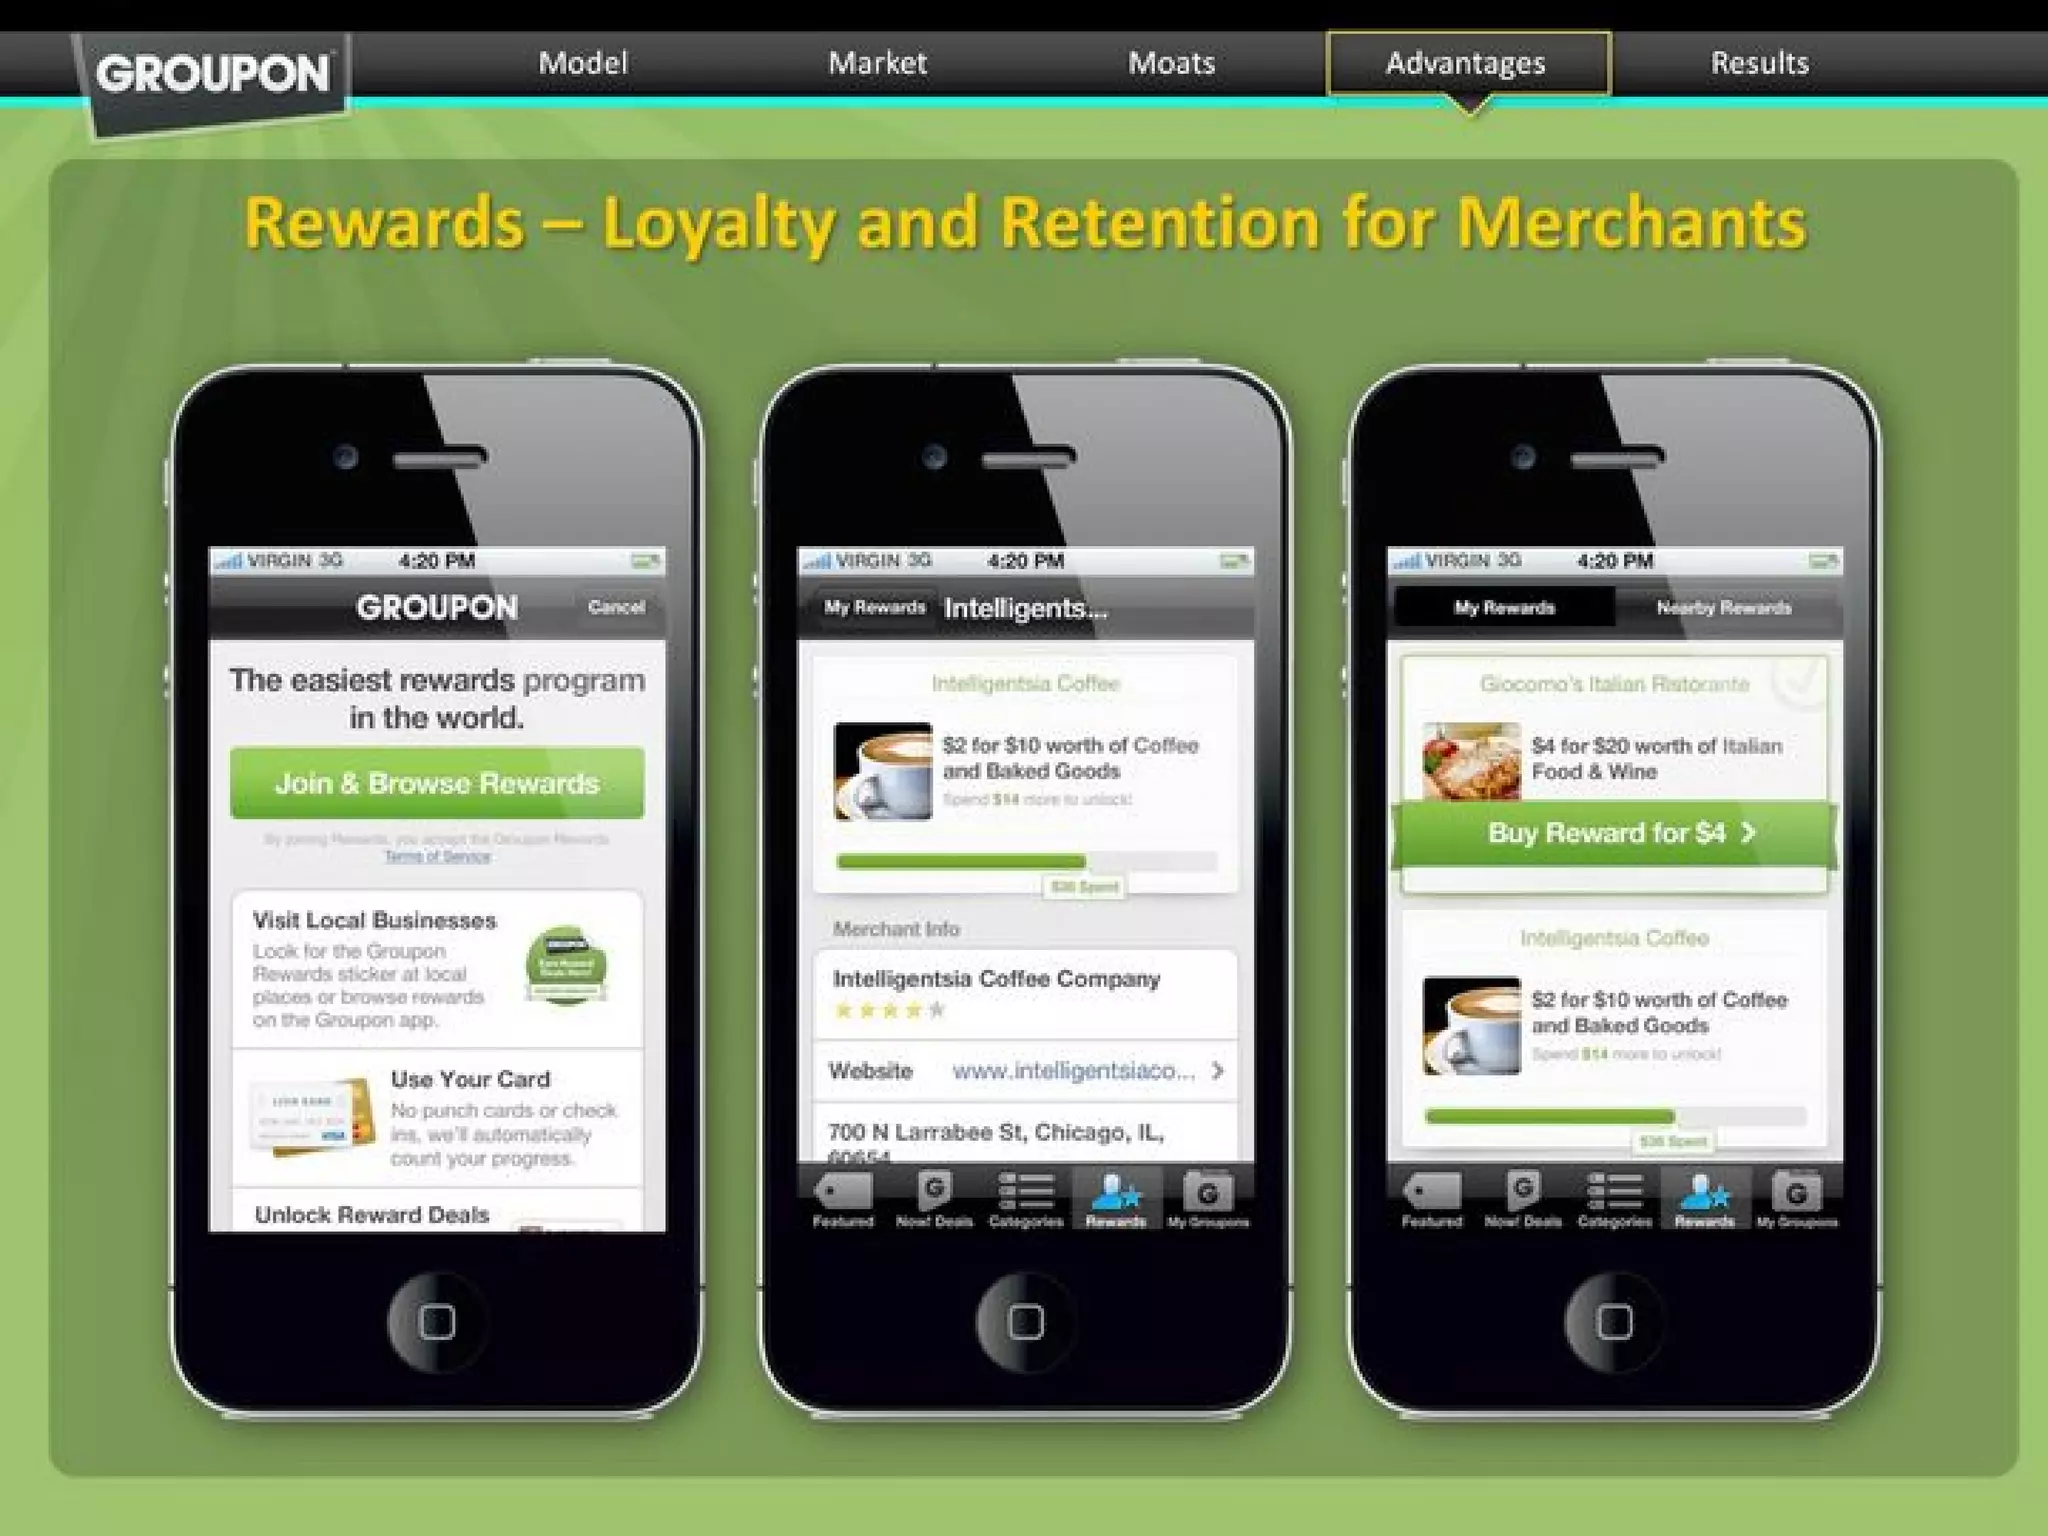
  3. Platform Expansion: Groupon 2.0 includes Rewards (loyalty/retention), Now! (flash deals), and expansion into new categories (Live events, Getaways travel, Goods products) (Slides 27-28, 33).

Market Opportunity

TAM Analysis (Slide 13):

  • Global Retail Market: $9.3T
  • US Retail Market: $2.9T
  • Global Online Advertising: $79B
  • US Leisure, Recreation & Food: $1.4T
  • Int’l Leisure, Recreation & Food: $3.9T
  • Total TAM Claimed: ~$17.5T

Critical Issue: This is TAM inflation. The deck conflates total retail market with addressable market. Groupon’s actual addressable market is much smaller:

  • Local deals market: ~$5-10B (estimated)
  • Groupon’s realistic market share potential: 5-10% of local deals market

Geographic Coverage (Slide 14):

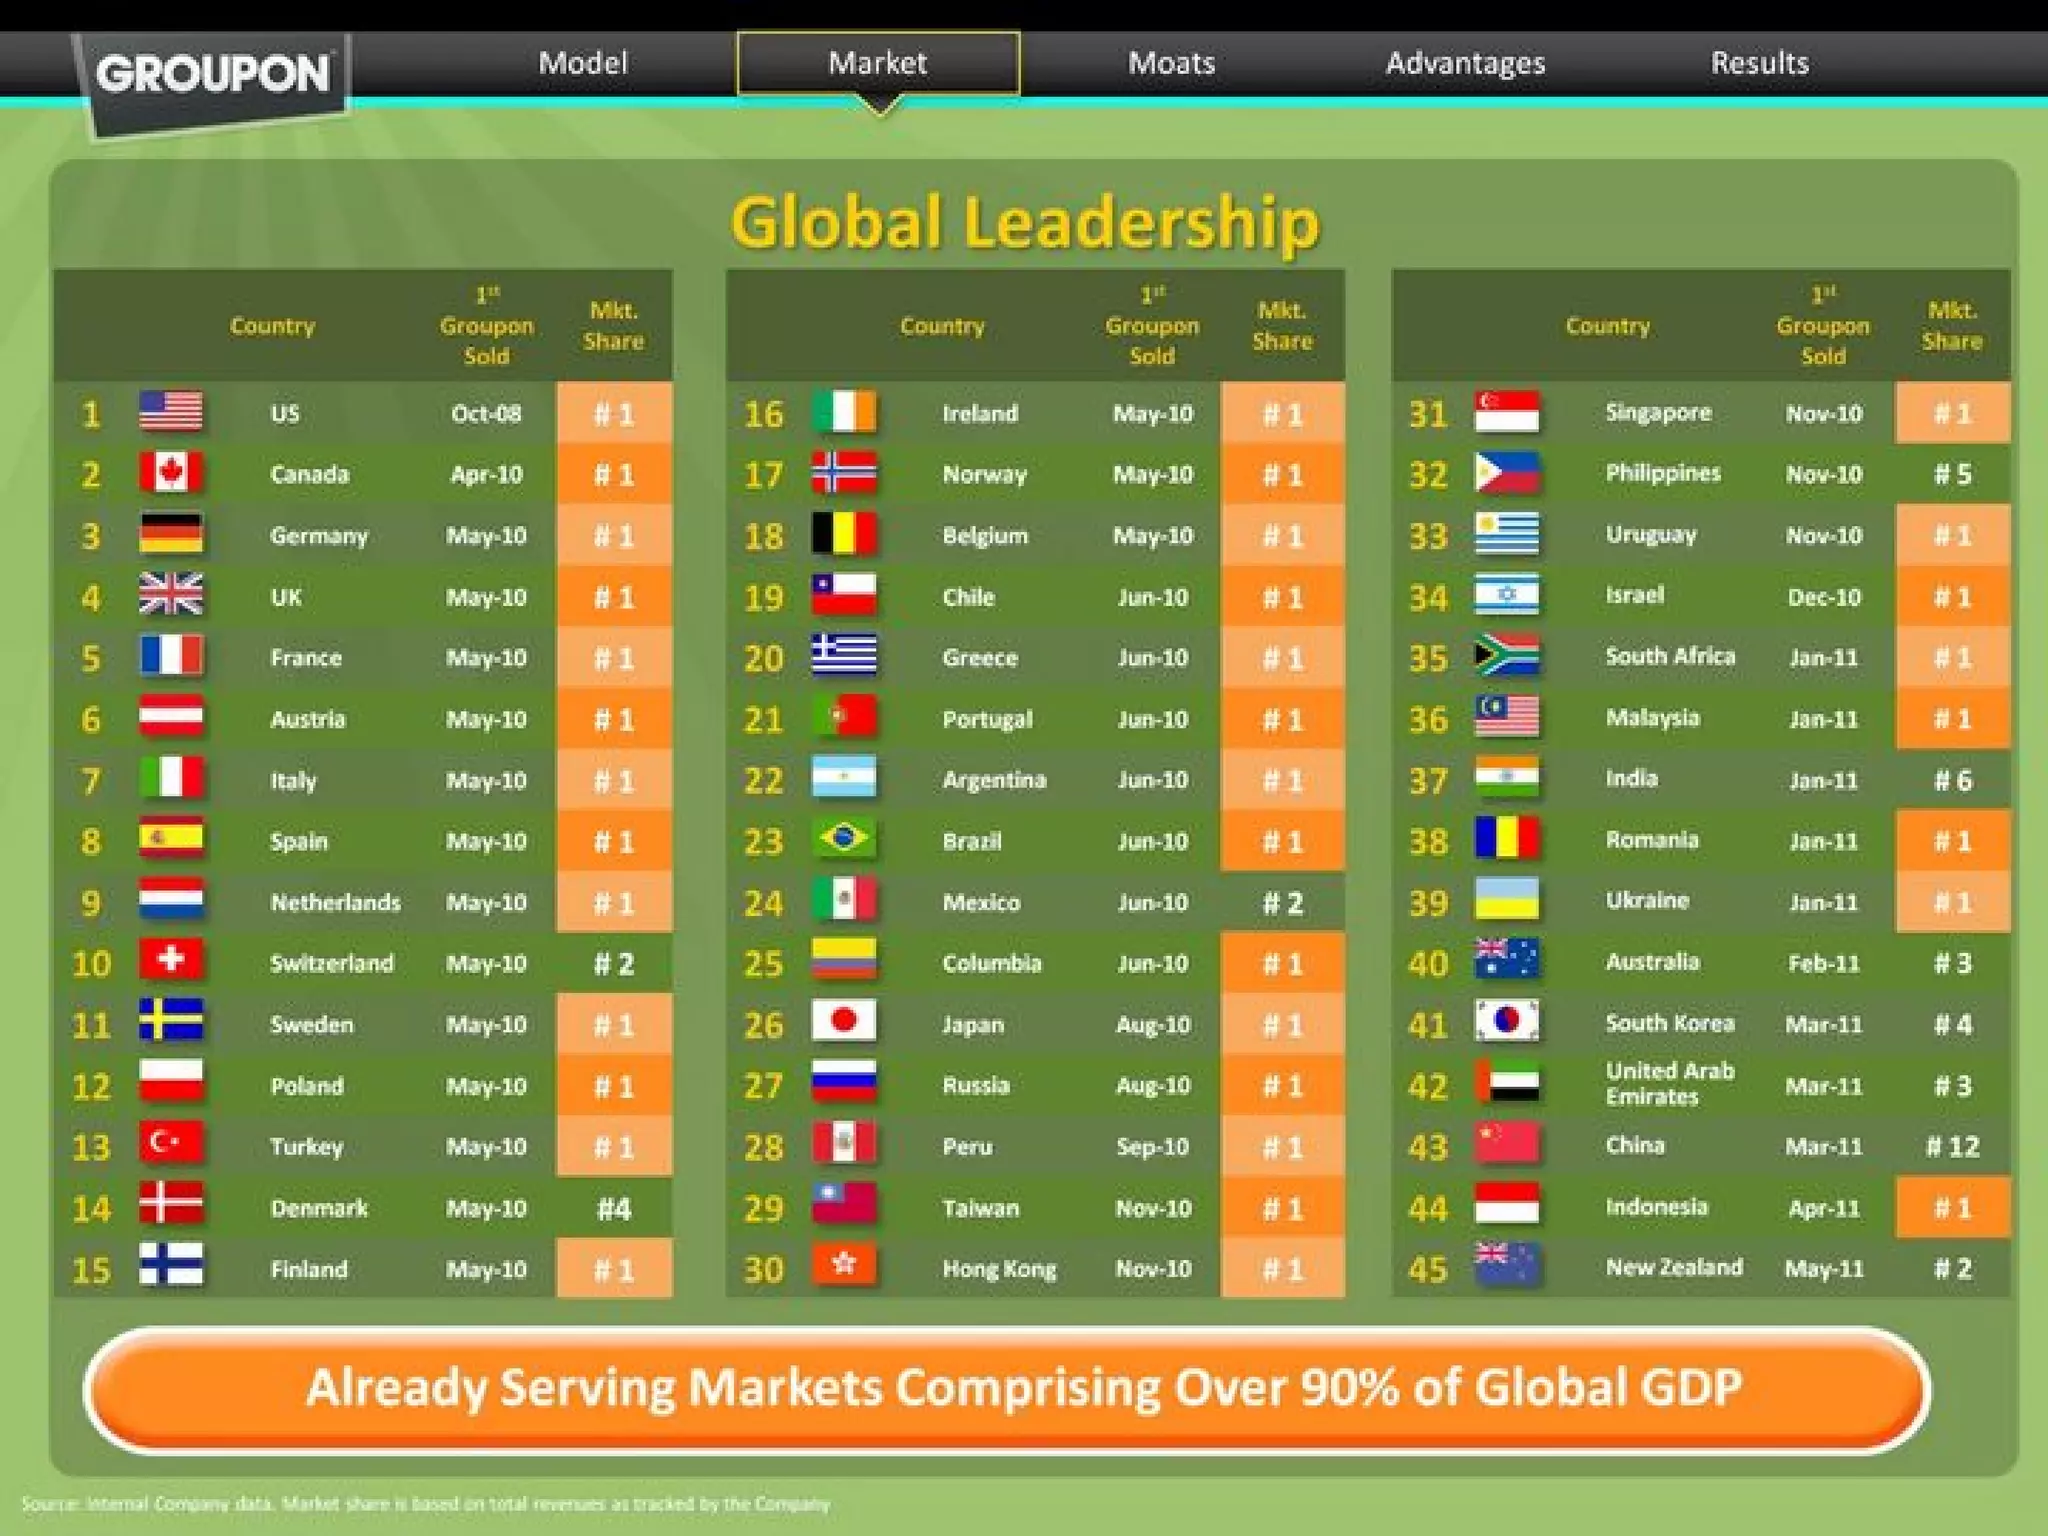
  • 45 countries served as of May 2011
  • Markets comprising >90% of global GDP
  • Claimed “#1” position in most markets (unverified)

Business Model

Revenue Model:

  • Groupon takes ~50% of deal value
  • Merchants receive ~50% of deal value
  • Example (Slide 6): $25 deal → Groupon receives $12.50, merchant receives $12.50

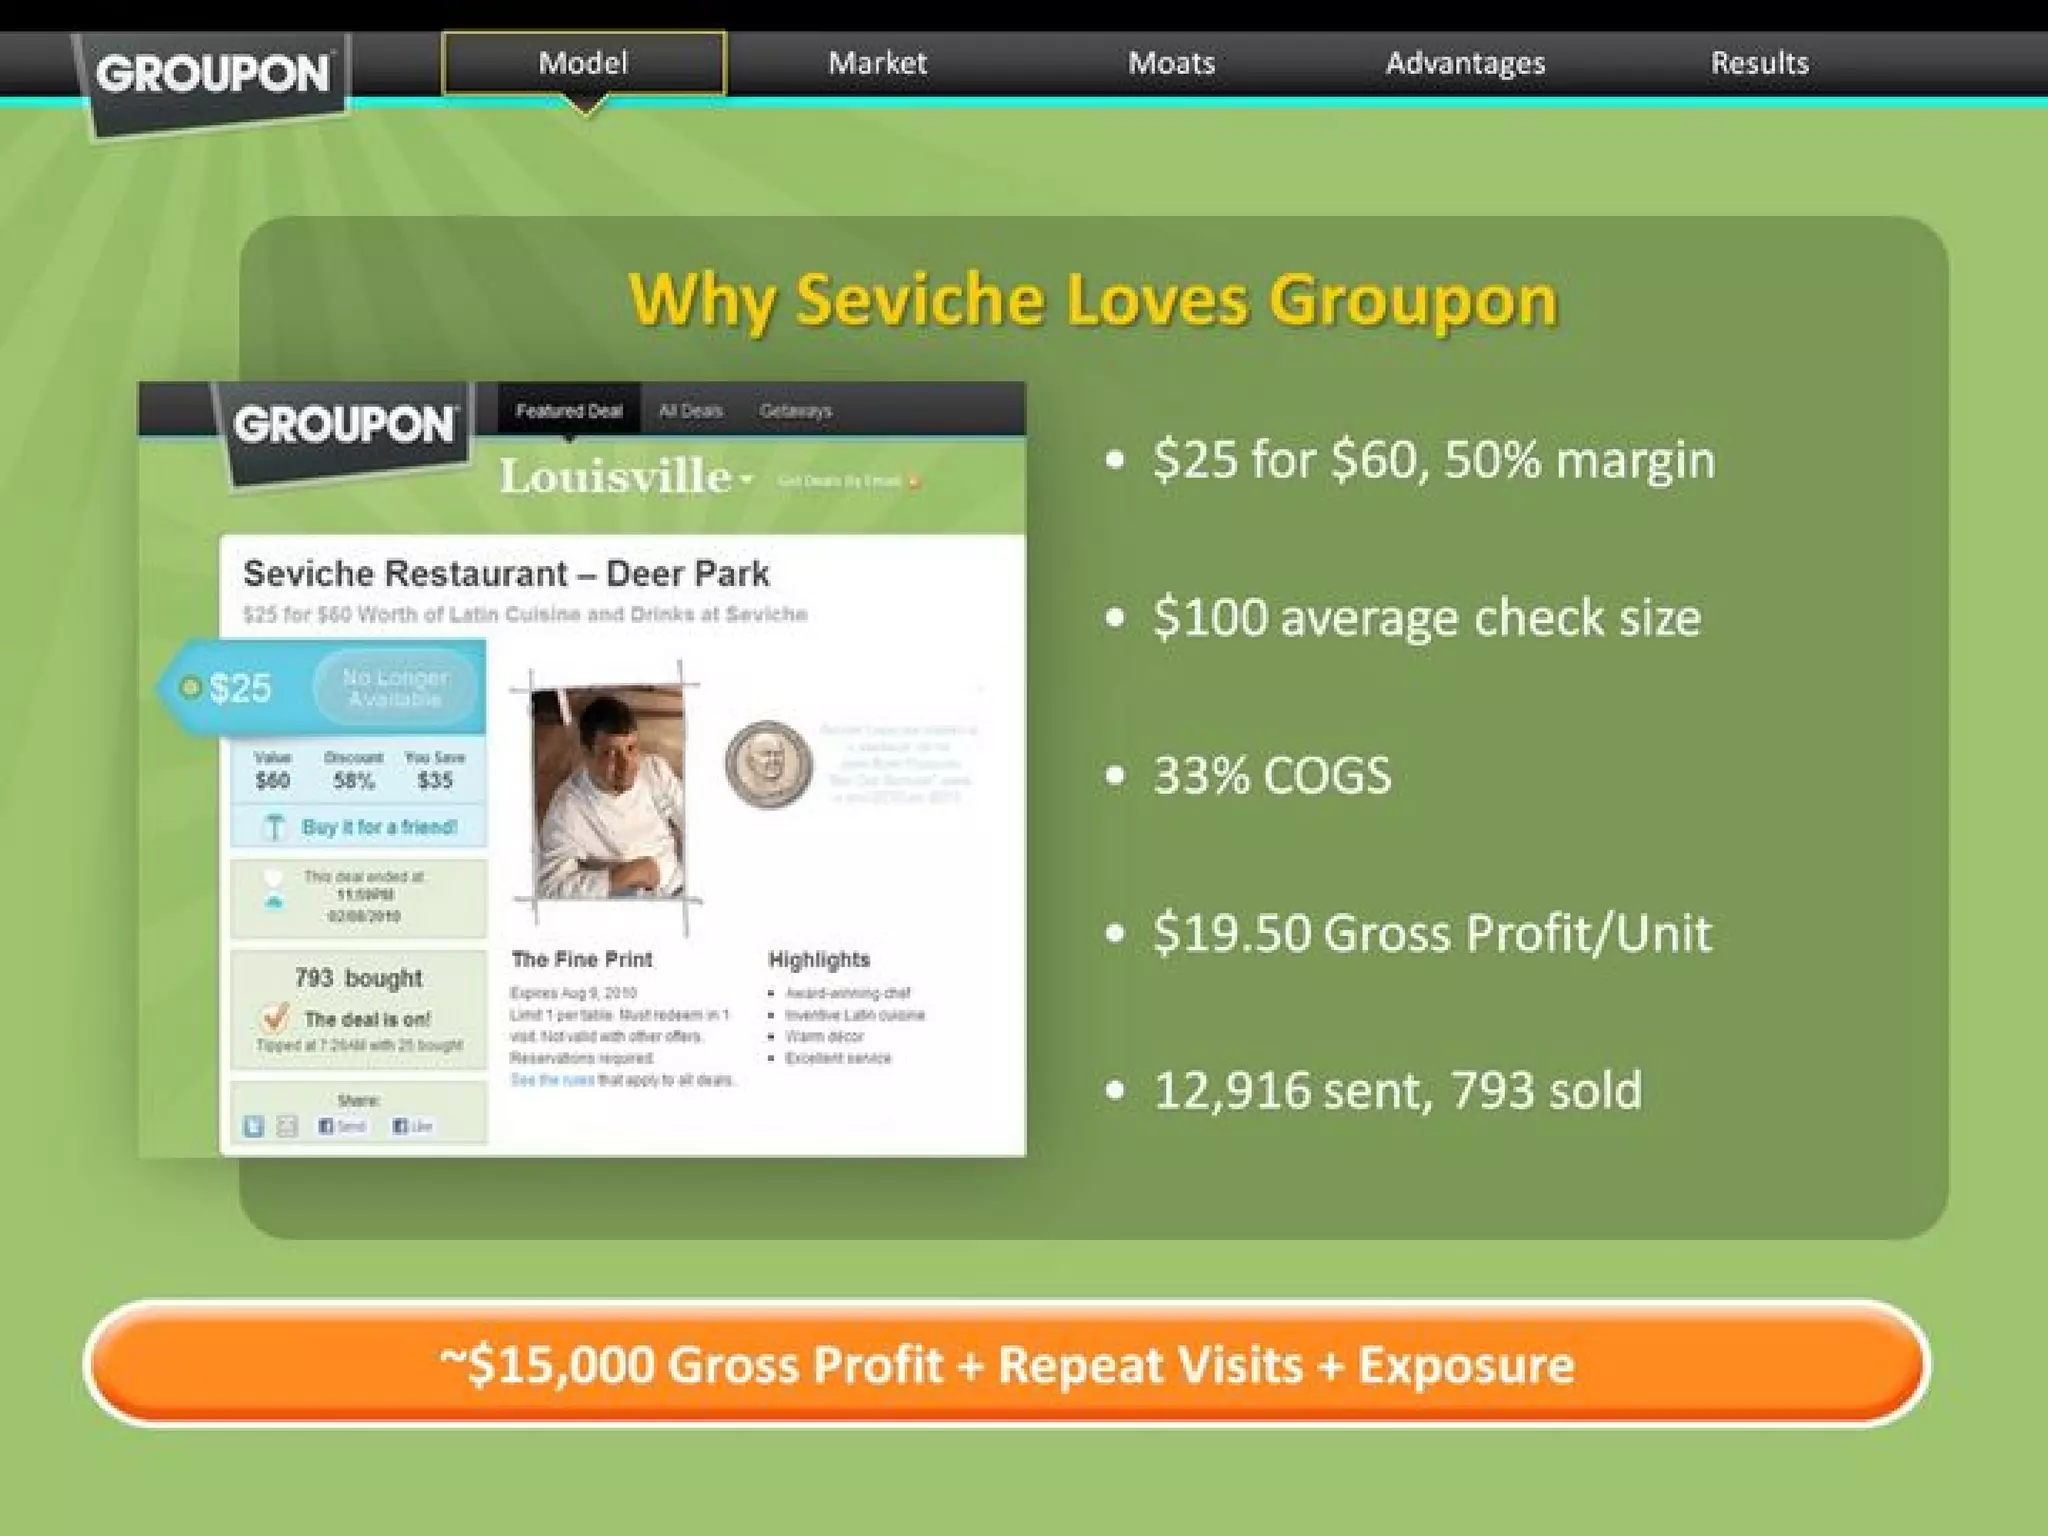
Unit Economics (Slide 6 - Seviche Restaurant Example):

  • Deal: $25 for $40 worth of food/drinks (50% discount)
  • Merchant margin on deal: 50%
  • Gross profit per unit: $19.50
  • Units sold: 793 of 12,916 sent (6.1% conversion)
  • Estimated merchant benefit: ~$15,000 gross profit per deal

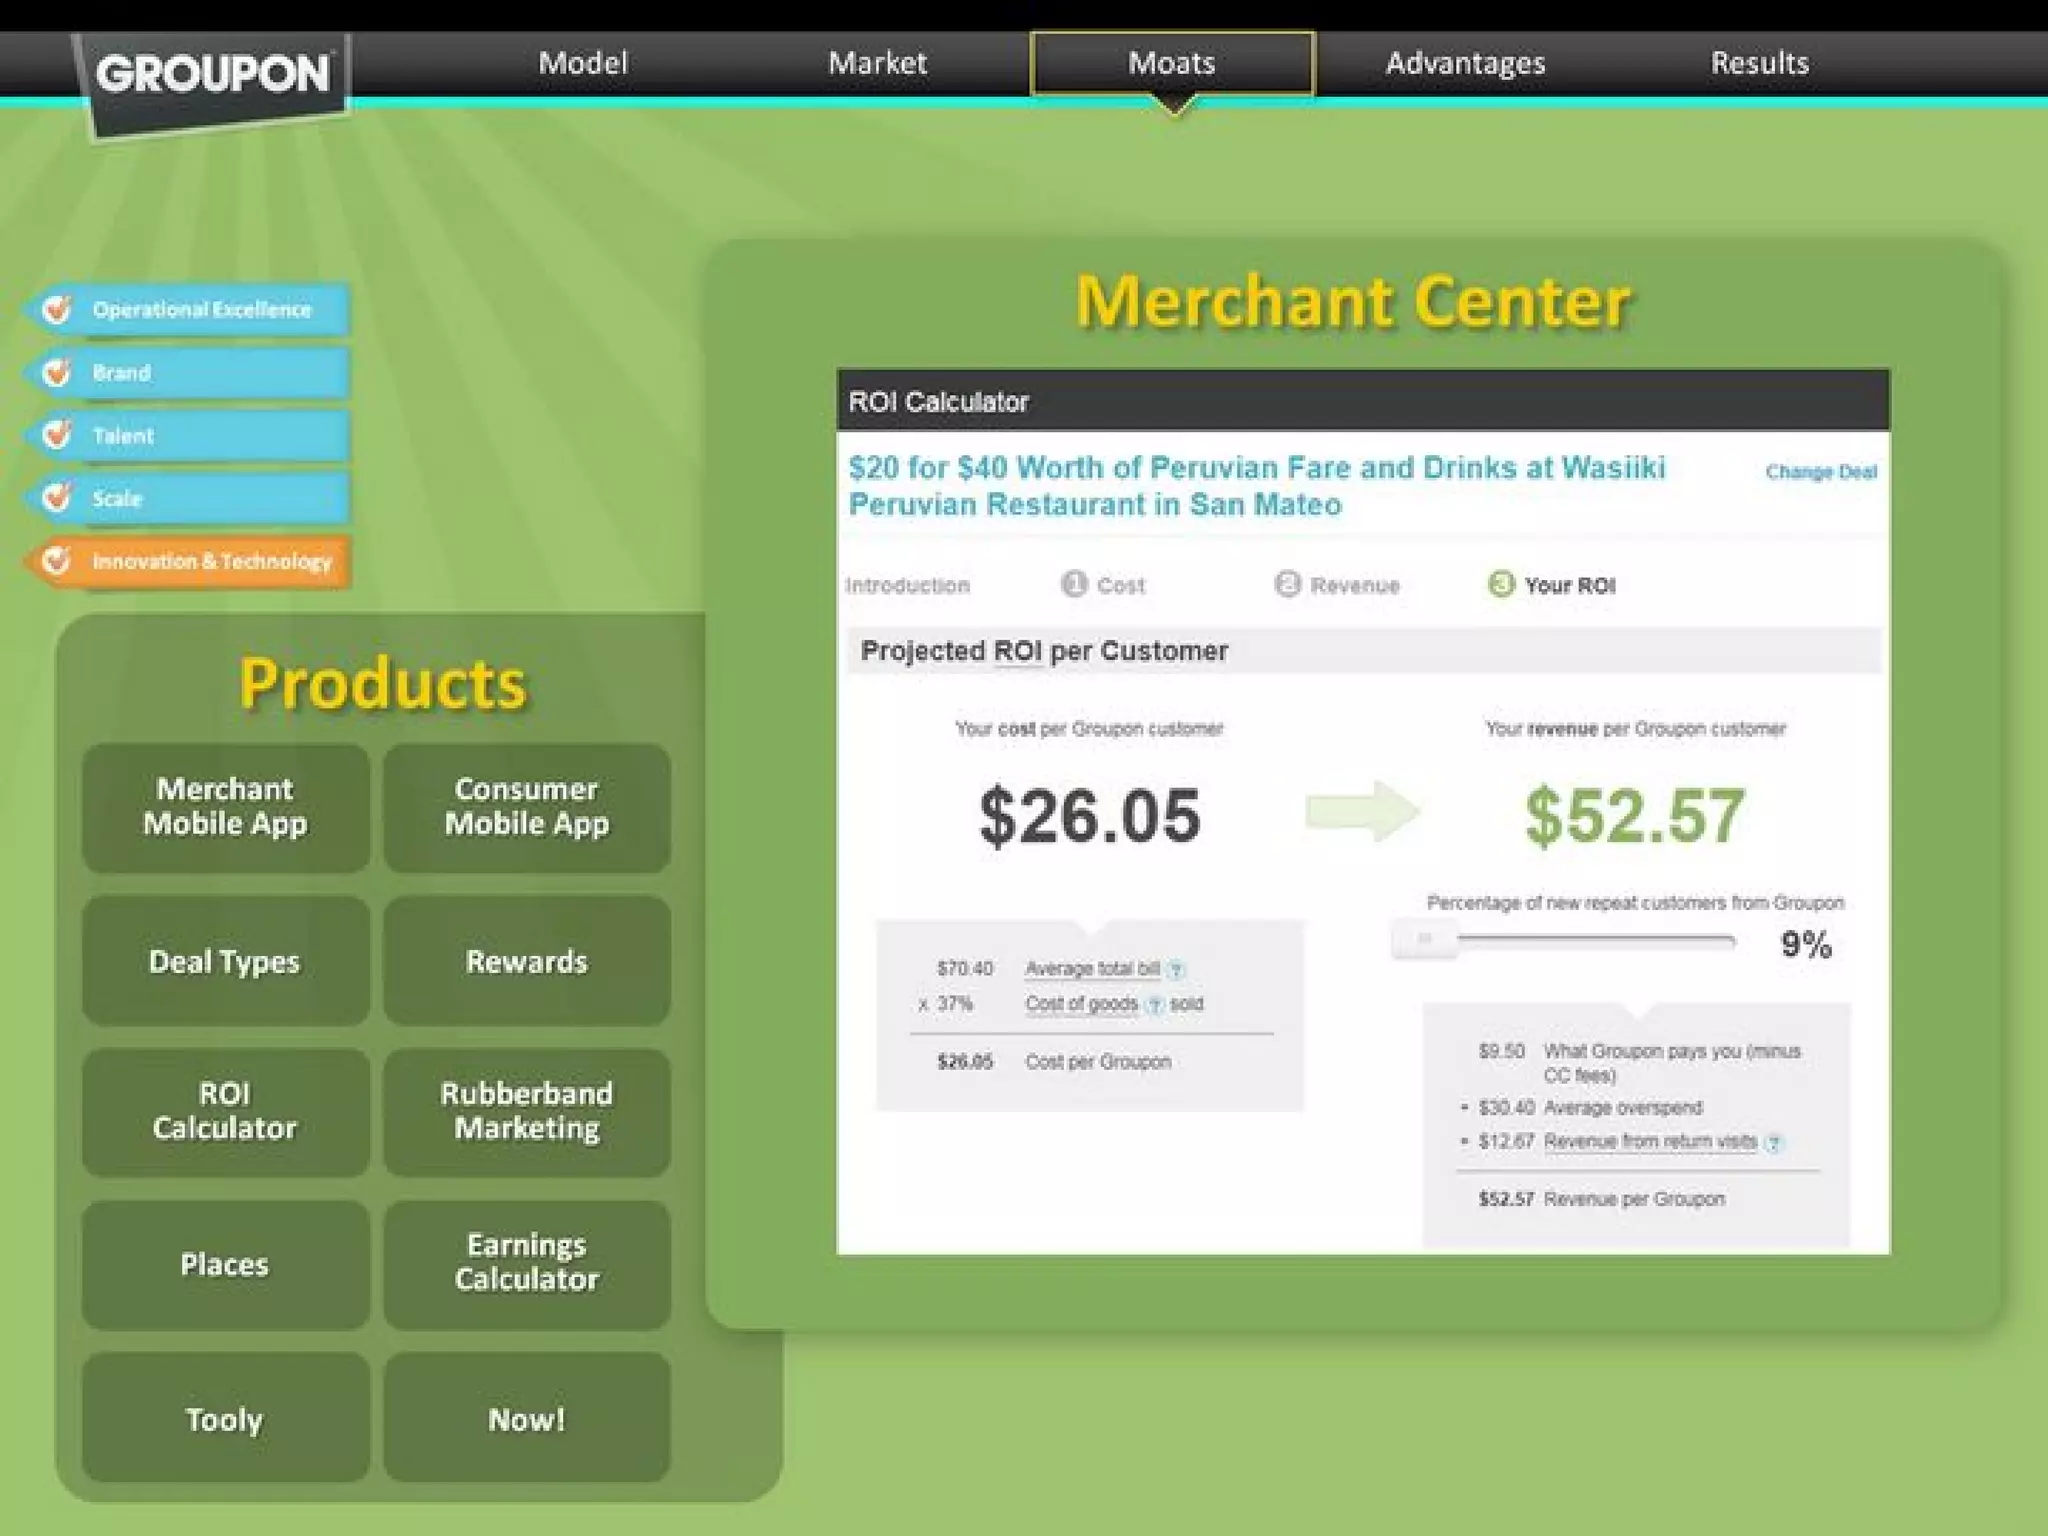
Critical Unit Economics Issue (Slide 24 - Wasiiki Restaurant Example):

  • Deal: $20 for $40 worth of food/drinks
  • Cost per Groupon customer: $26.05
  • Revenue per Groupon customer: $52.57
  • Repeat customer rate: 9% ← This is the smoking gun
  • Implied customer churn: 91%

Contribution Profit Analysis (Slide 35):

  • Q2 2010 investment: -$18M
  • Cumulative contribution profit (Q2 2010 - Q3 2011): +$43M
  • ROI claimed: 139%
  • Average customer spend: $170/year (TTM gross billings)
  • Critical Issue: Contribution profit excludes many costs; actual net profit is not disclosed

Traction & Metrics

Growth Metrics (Slide 32 - Q3 2011):

  • Gross Billings: $1,157M (Q3 2011)
  • Revenue: $430M (Q3 2011)
  • Y/Y Gross Billings Growth: 496%
  • Y/Y Revenue Growth: 426%
  • Quarterly progression shows consistent growth Q1 2010 - Q3 2011

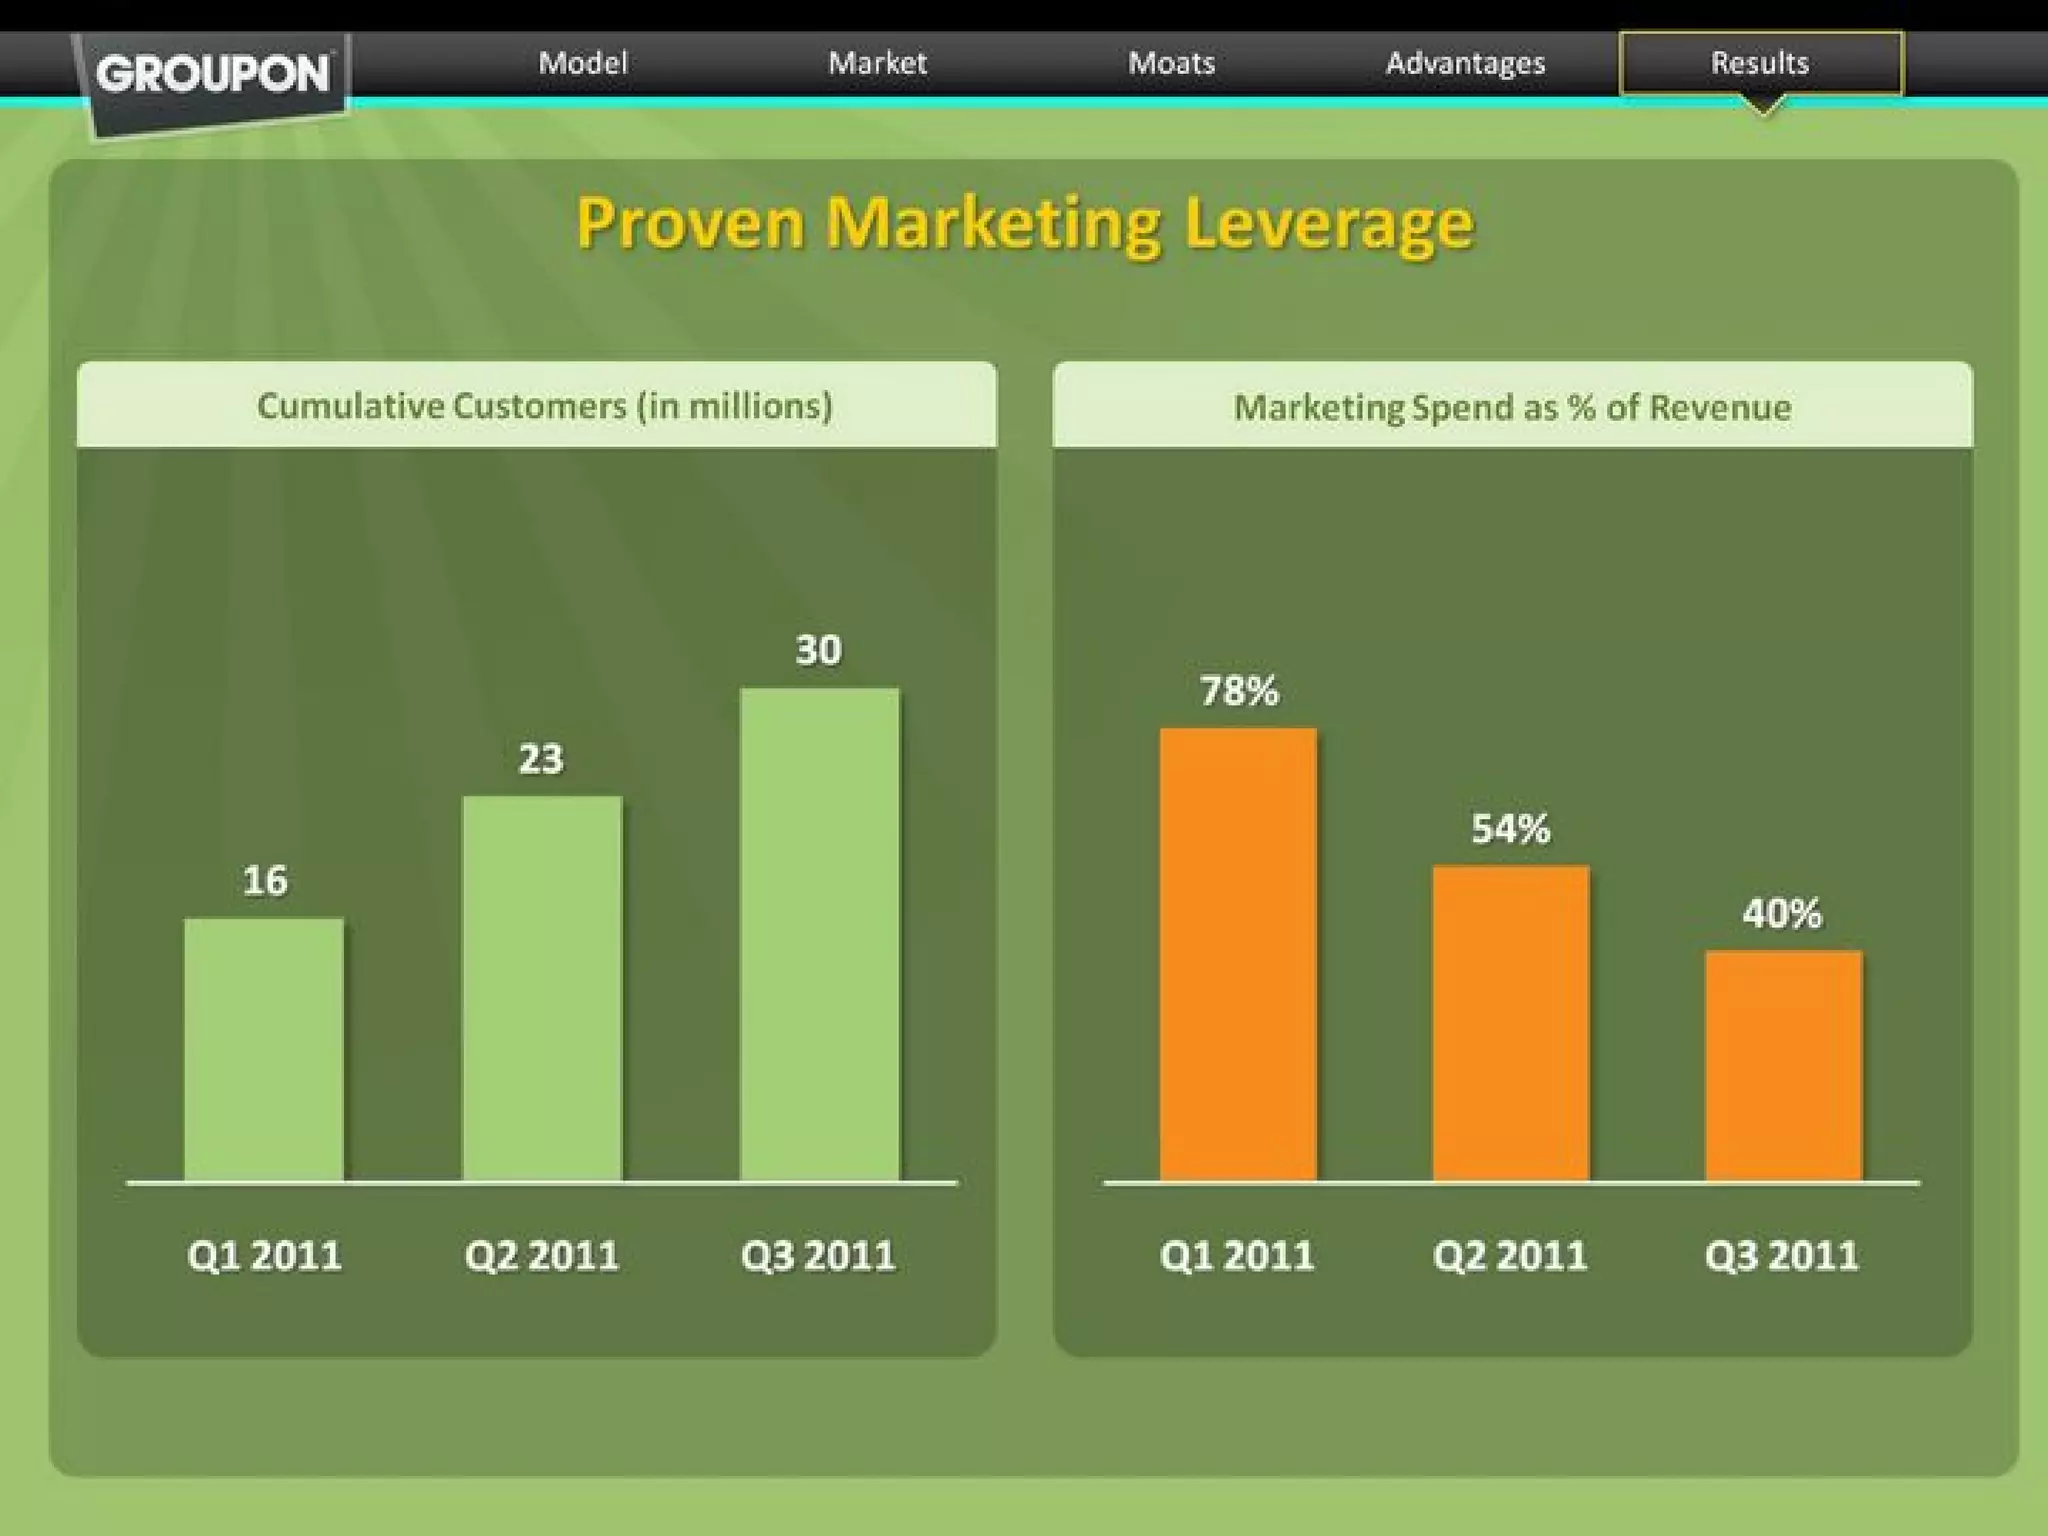
Customer Metrics (Slide 34):

  • Q1 2011: 16M cumulative customers
  • Q2 2011: 23M cumulative customers
  • Q3 2011: 30M cumulative customers
  • Q/Q growth: +7M customers (43% Q/Q)
  • Critical Issue: “Cumulative customers” includes inactive customers; actual active customer base unknown

Marketing Efficiency (Slide 34):

  • Q1 2011: Marketing spend 78% of revenue
  • Q2 2011: Marketing spend 54% of revenue
  • Q3 2011: Marketing spend 40% of revenue
  • Trend suggests improving marketing efficiency or cost-cutting

Geographic Reach (Slide 14):

  • 45 countries served
  • North America: #1 position claimed
  • International: Significant presence but profitability unclear

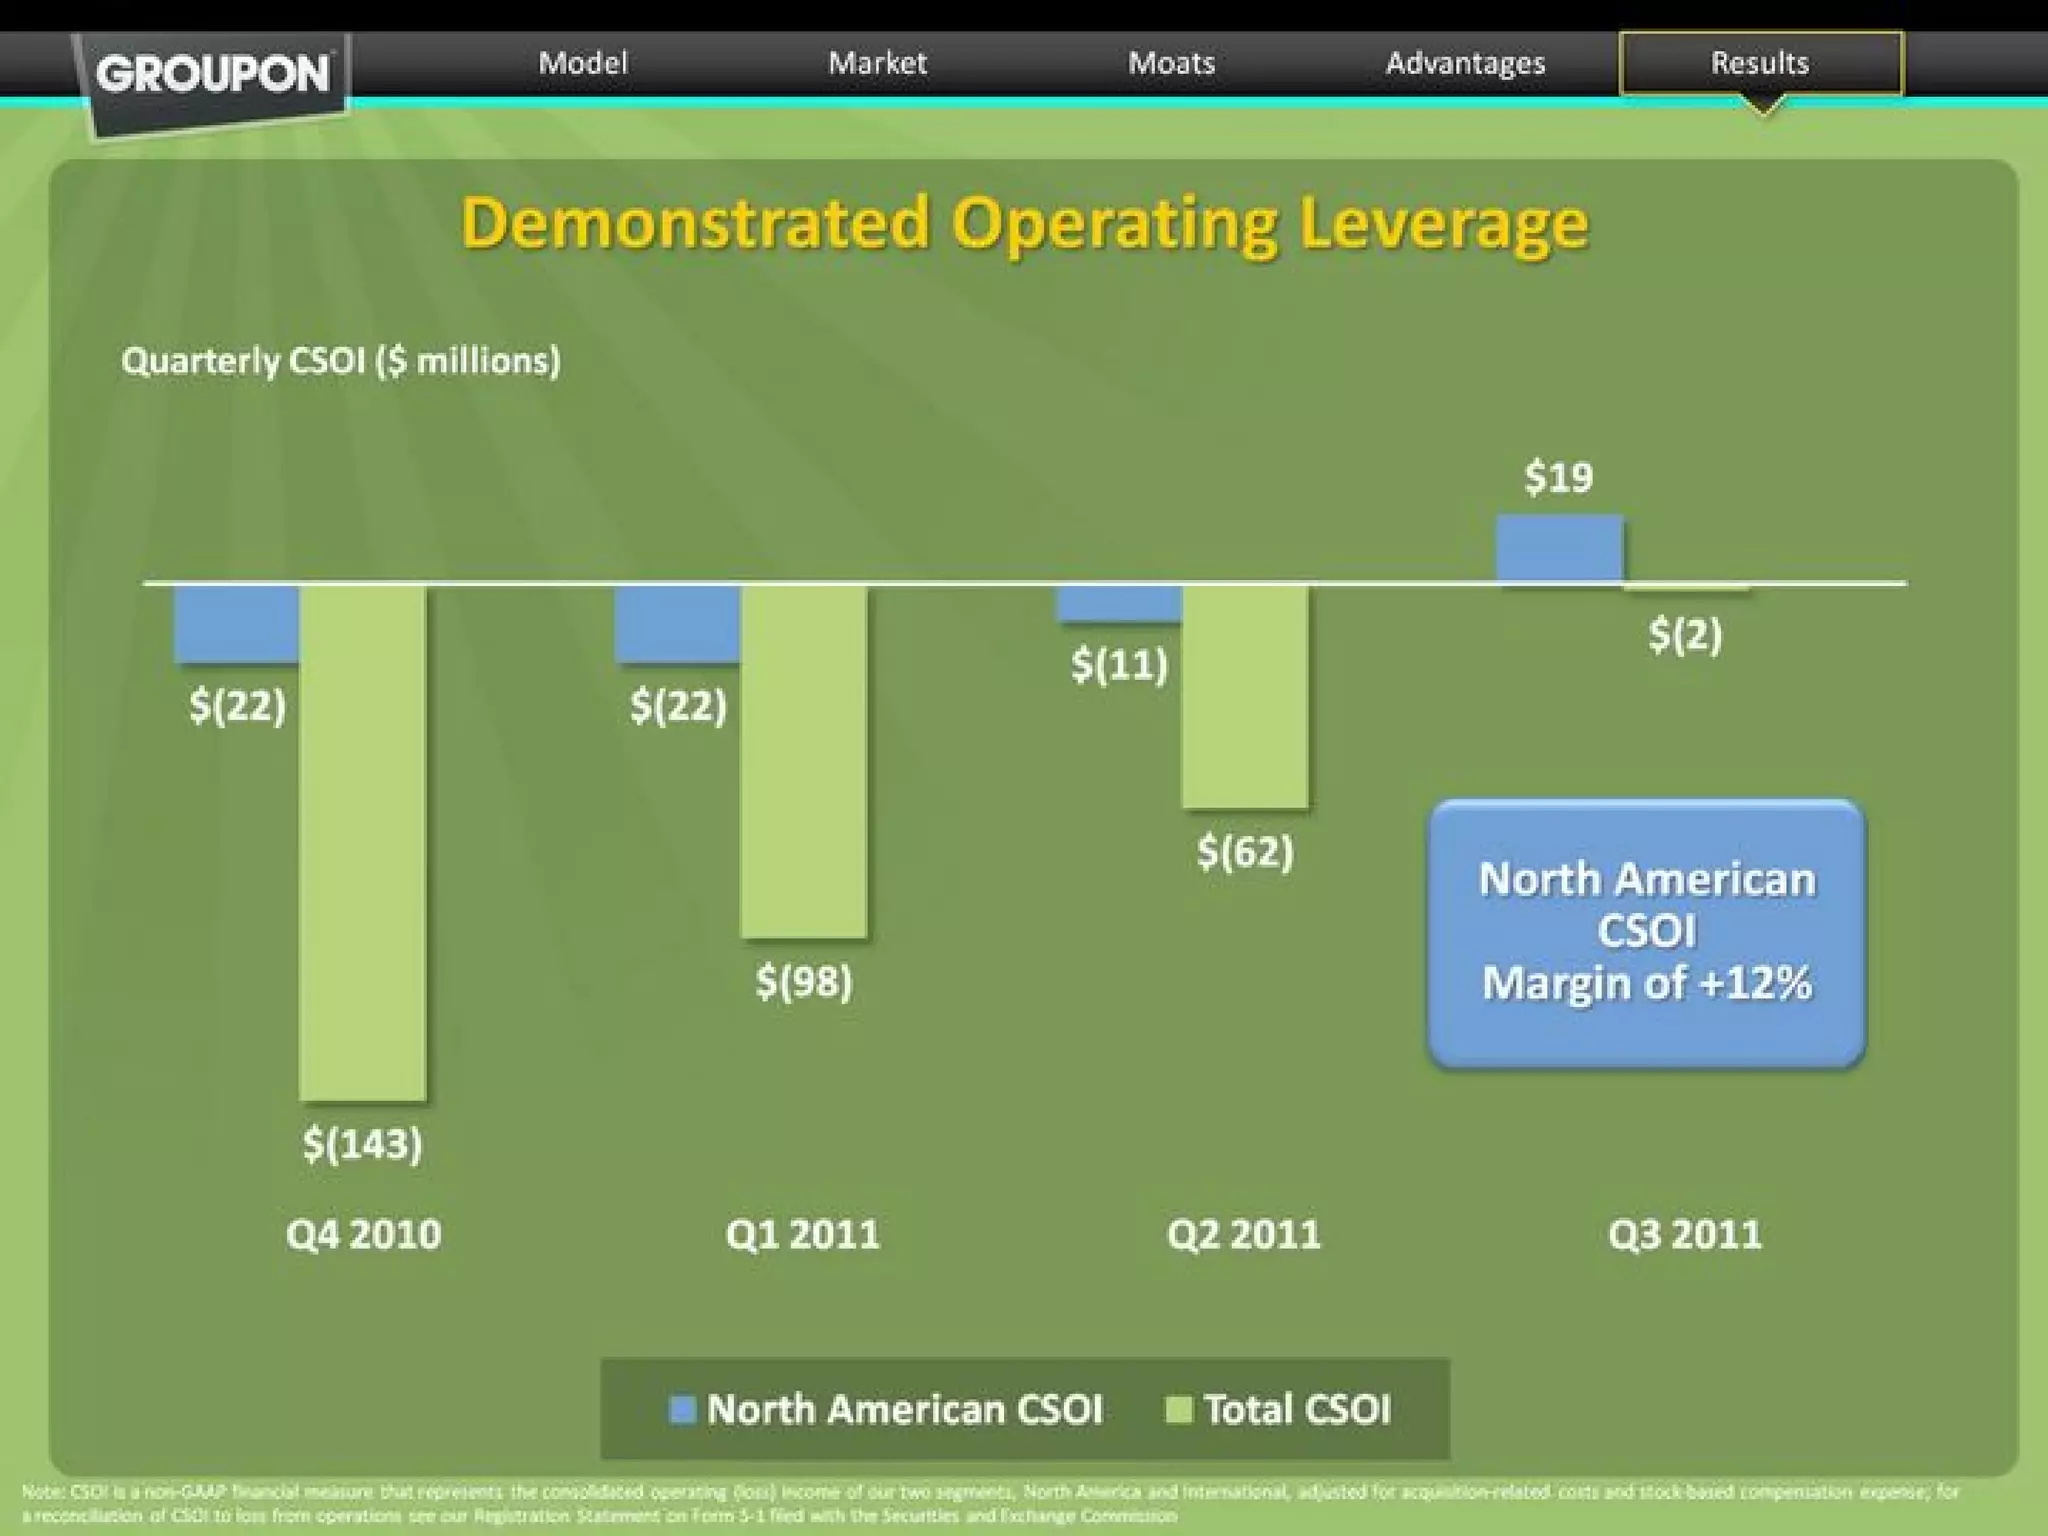
Profitability Metrics (Slide 36 - CSOI):

  • Q4 2010: North America $(22)M, Total $(143)M
  • Q1 2011: North America $(22)M, Total $(98)M
  • Q2 2011: North America $(11)M, Total $(62)M
  • Q3 2011: North America $19M, Total $(2)M
  • Critical Issue: CSOI is non-GAAP metric; actual GAAP net profit not disclosed

Competitive Positioning

Competitive Landscape (Slides 15-16):

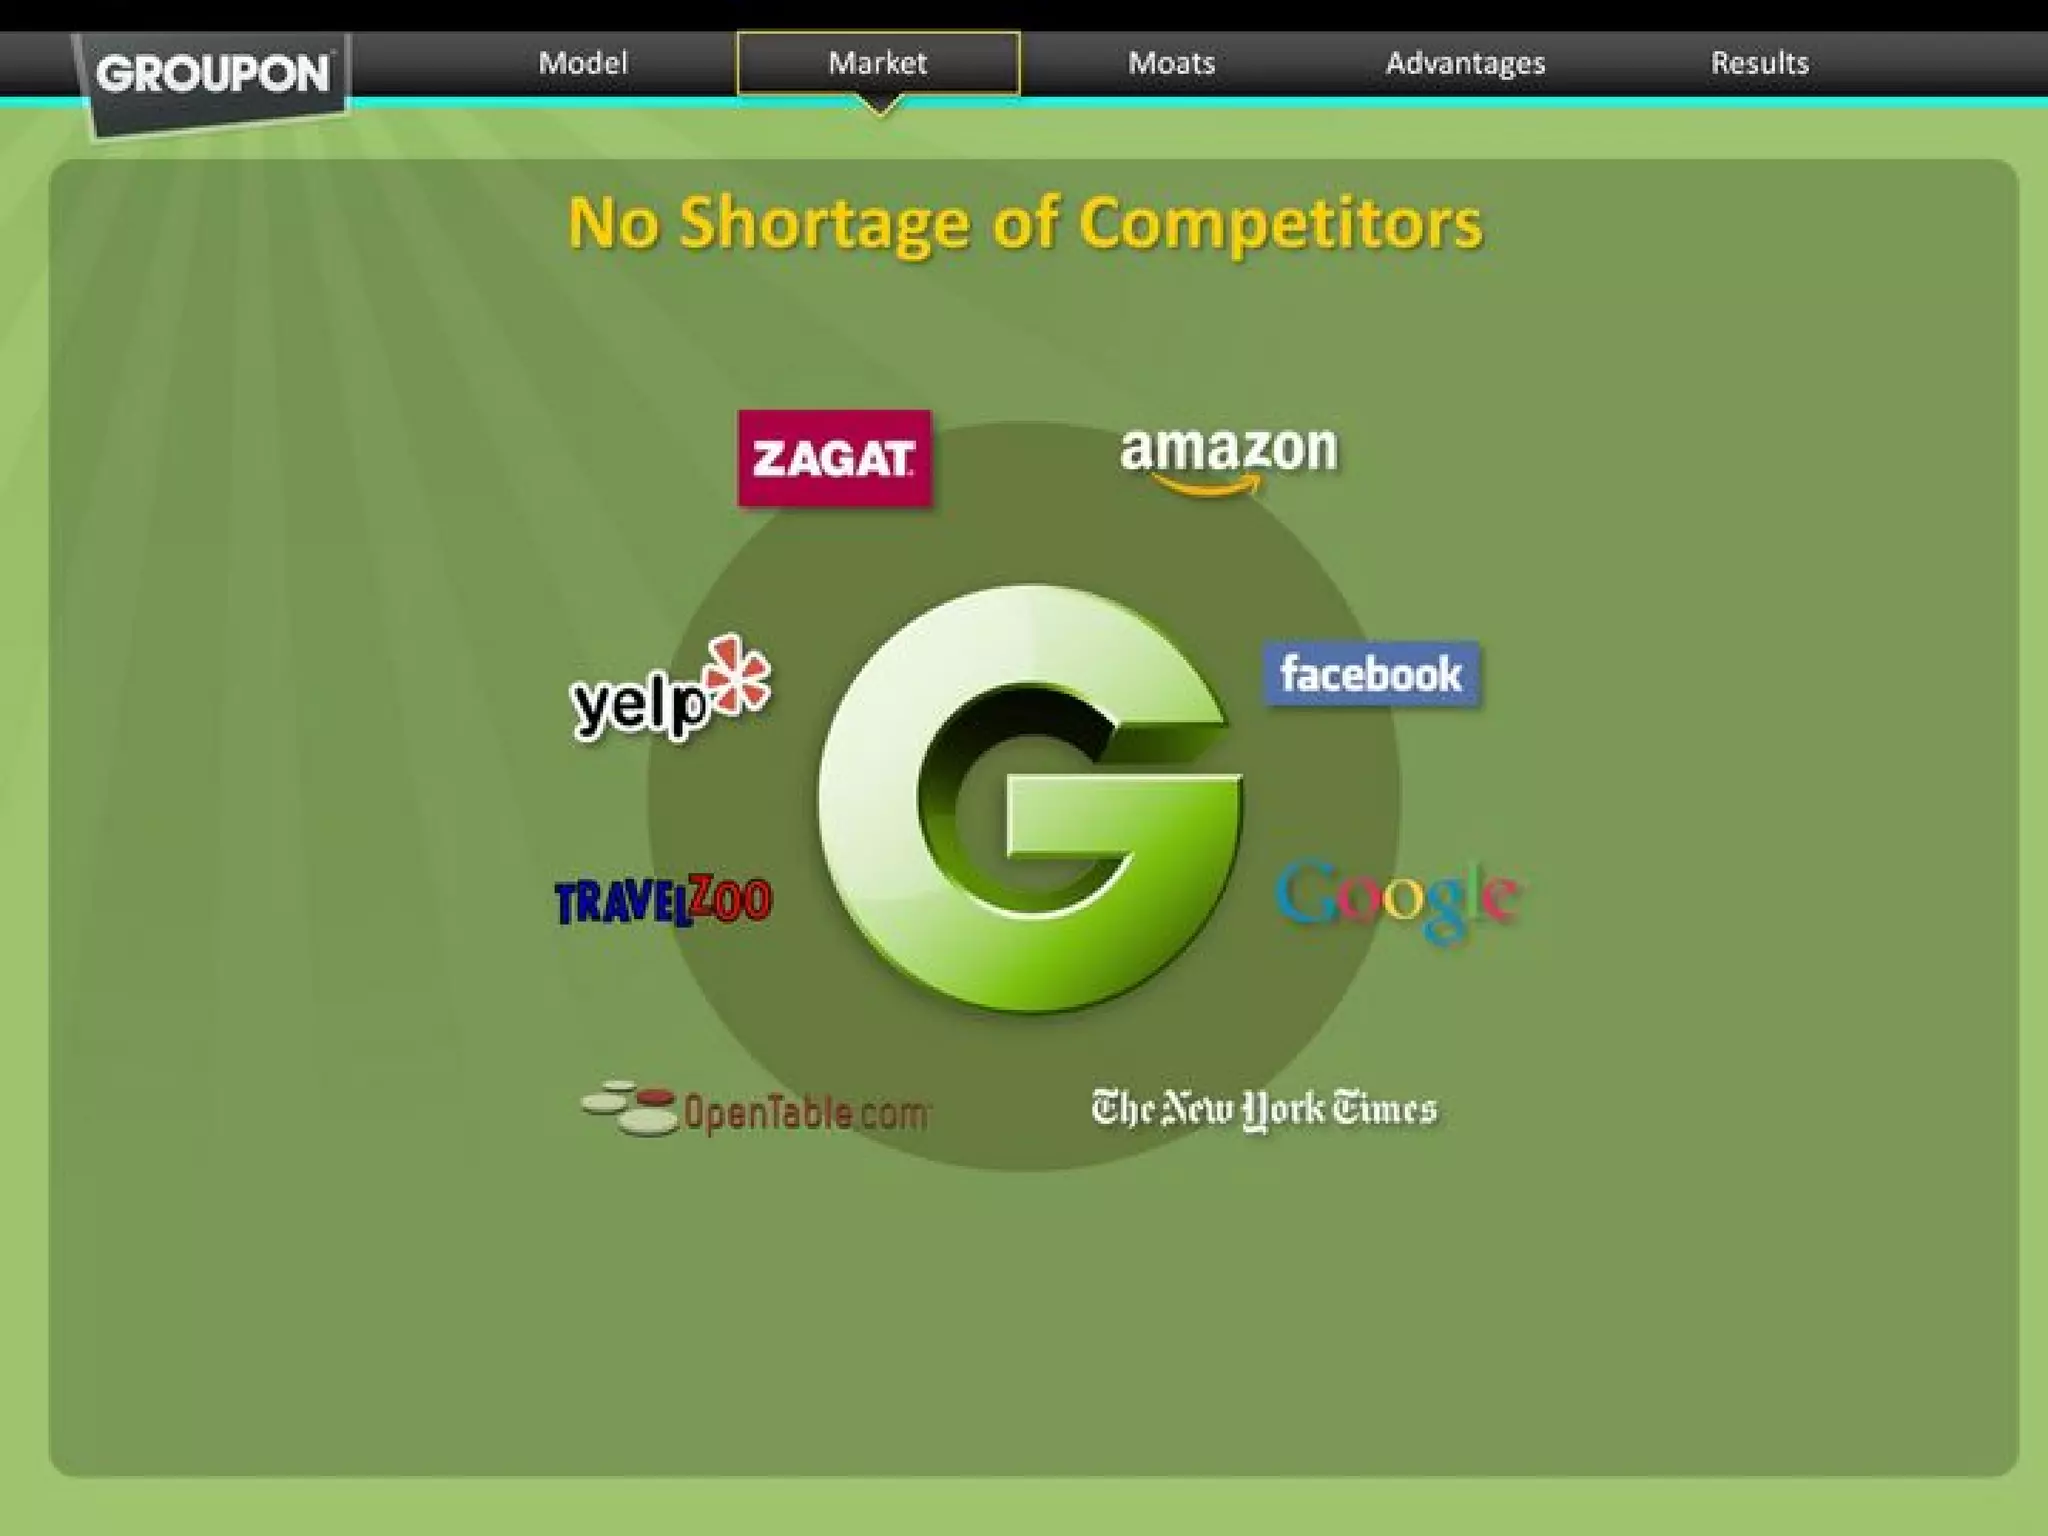
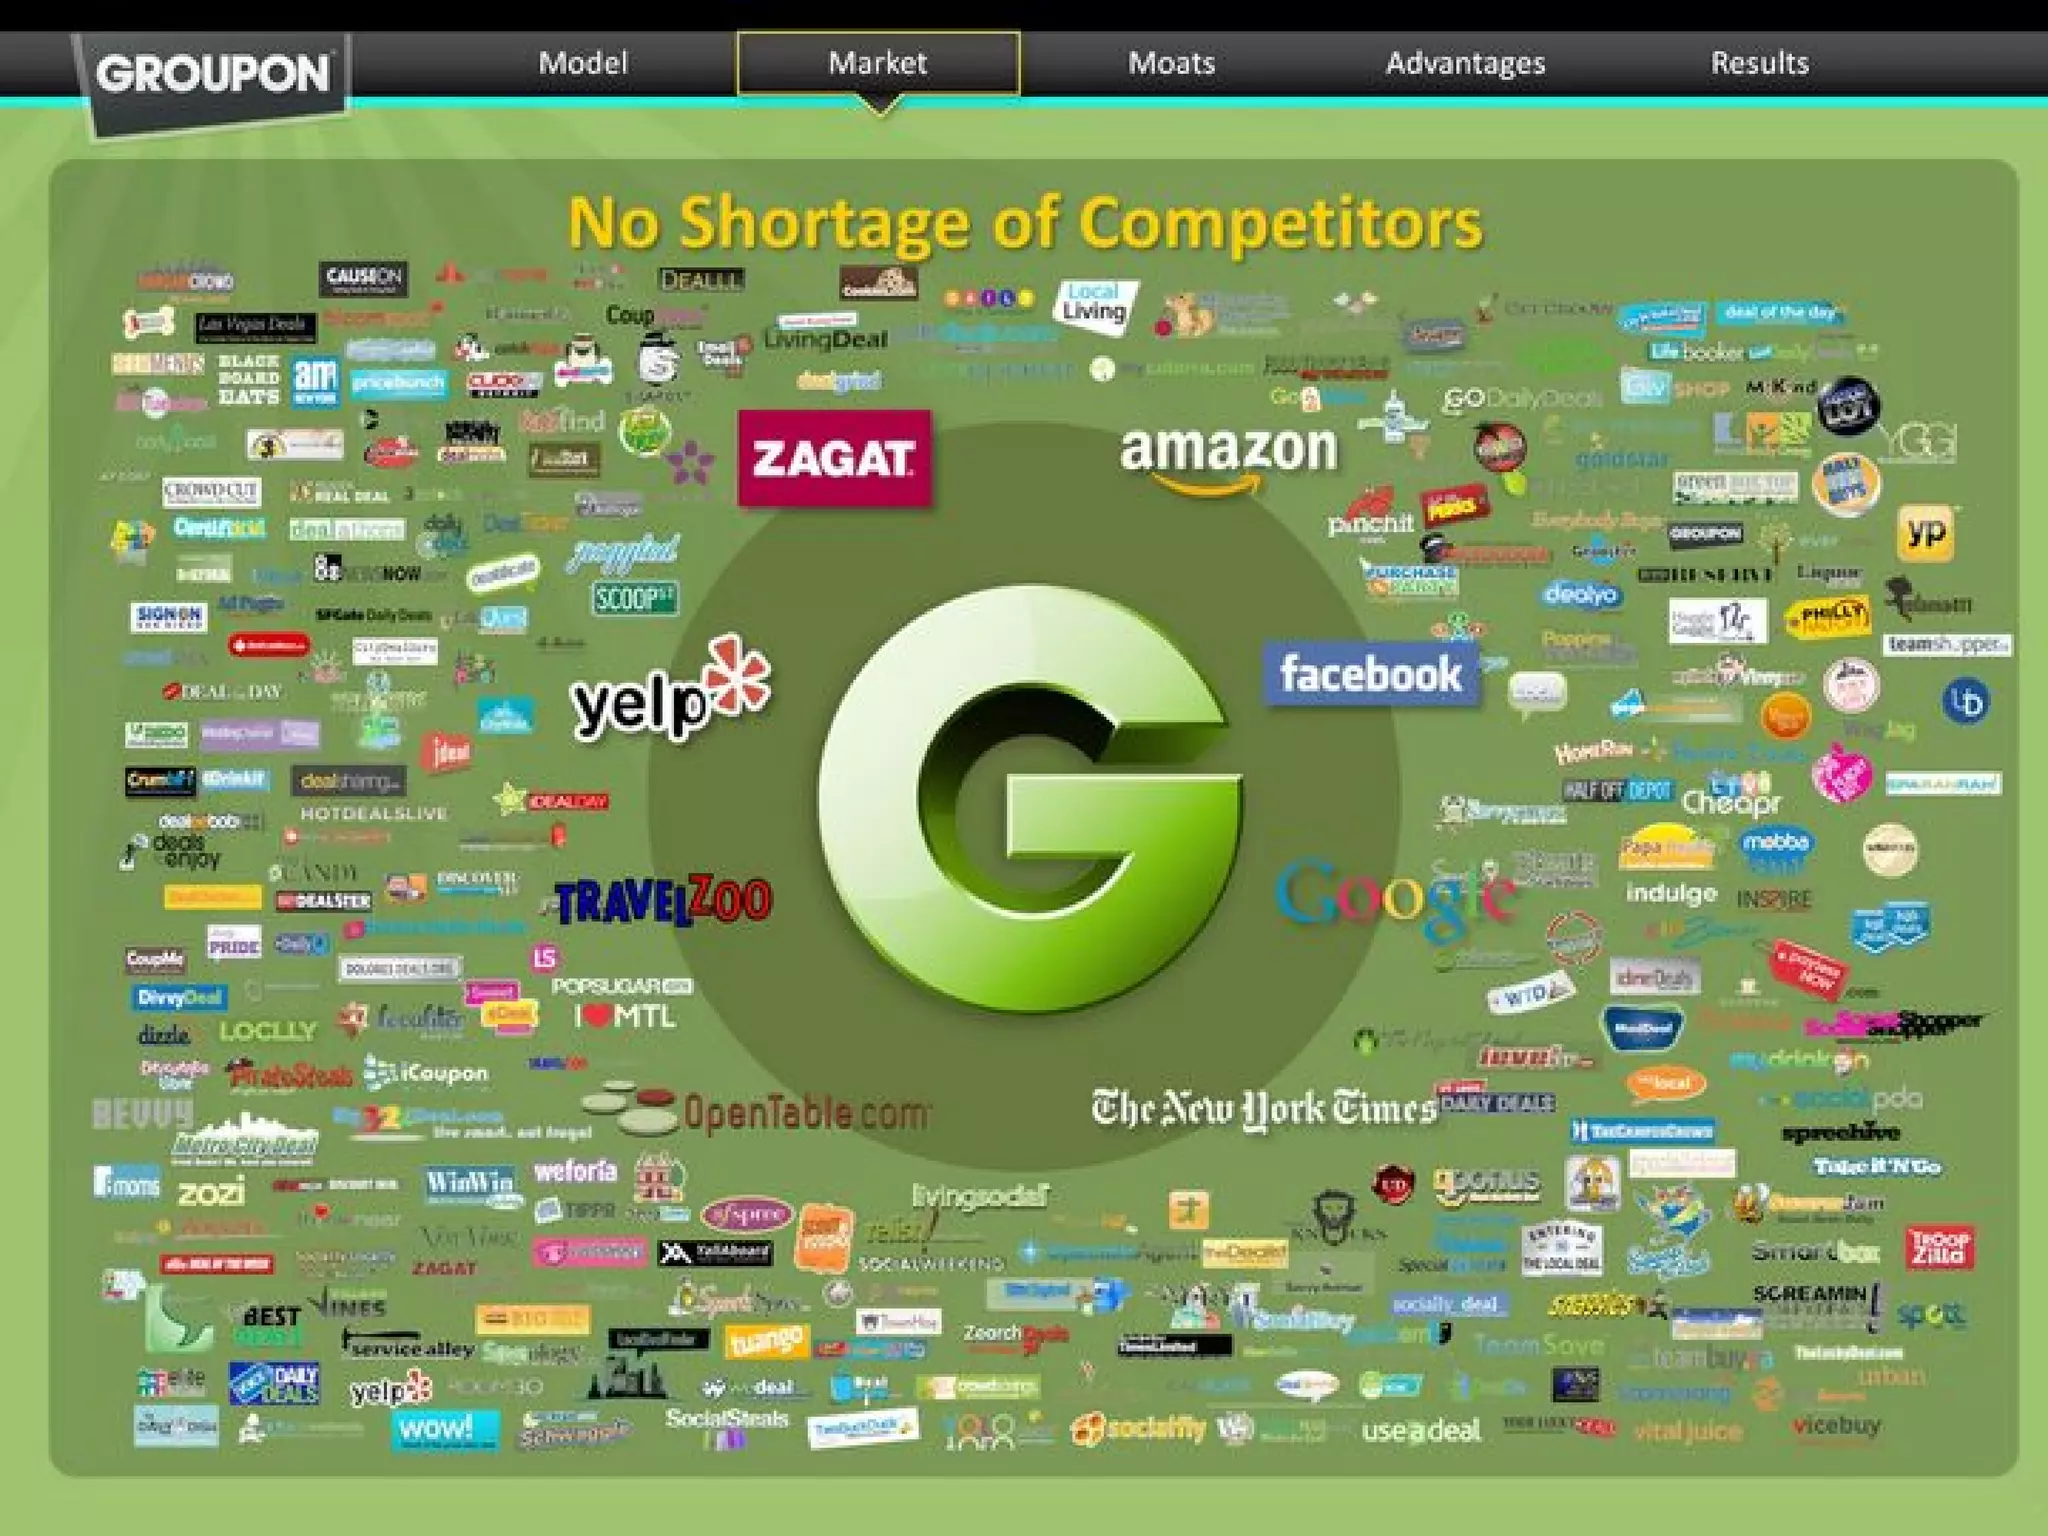
  • 100+ competitors identified
  • Major competitors: Zagat, Amazon, Yelp, Facebook, Google, Travelzoo, OpenTable, New York Times
  • Direct competitors: LivingSocial, Coup, DealFly, and many regional/niche players
  • Critical Issue: Low barriers to entry; easy for competitors to replicate model

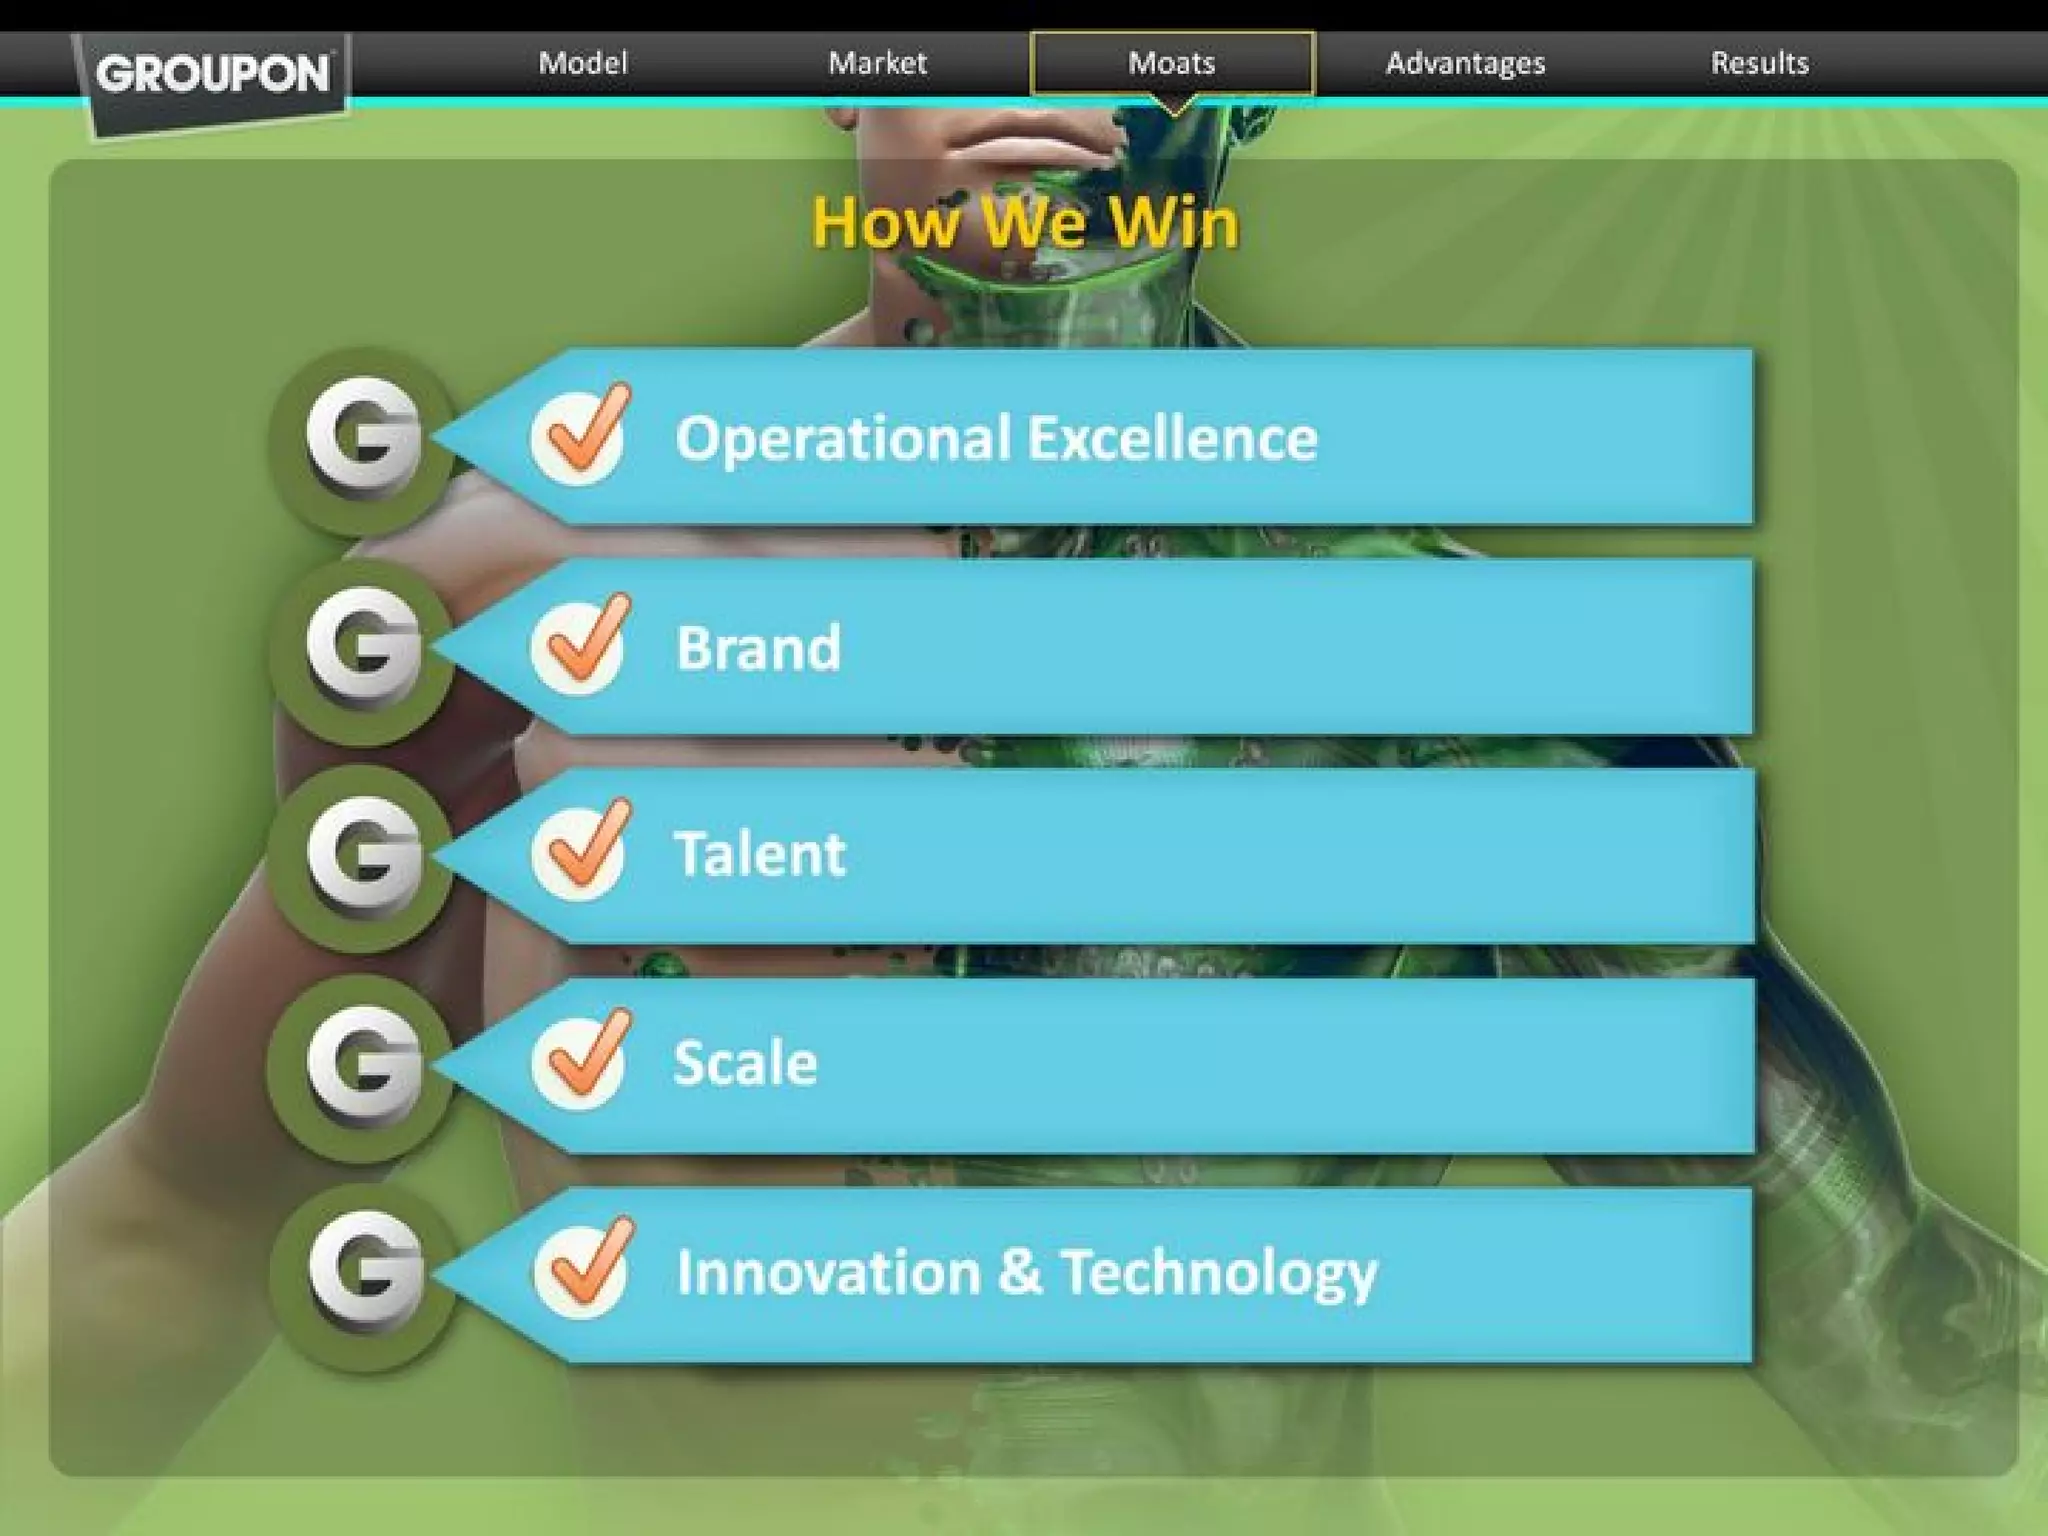
Claimed Competitive Advantages (Slides 19-24):

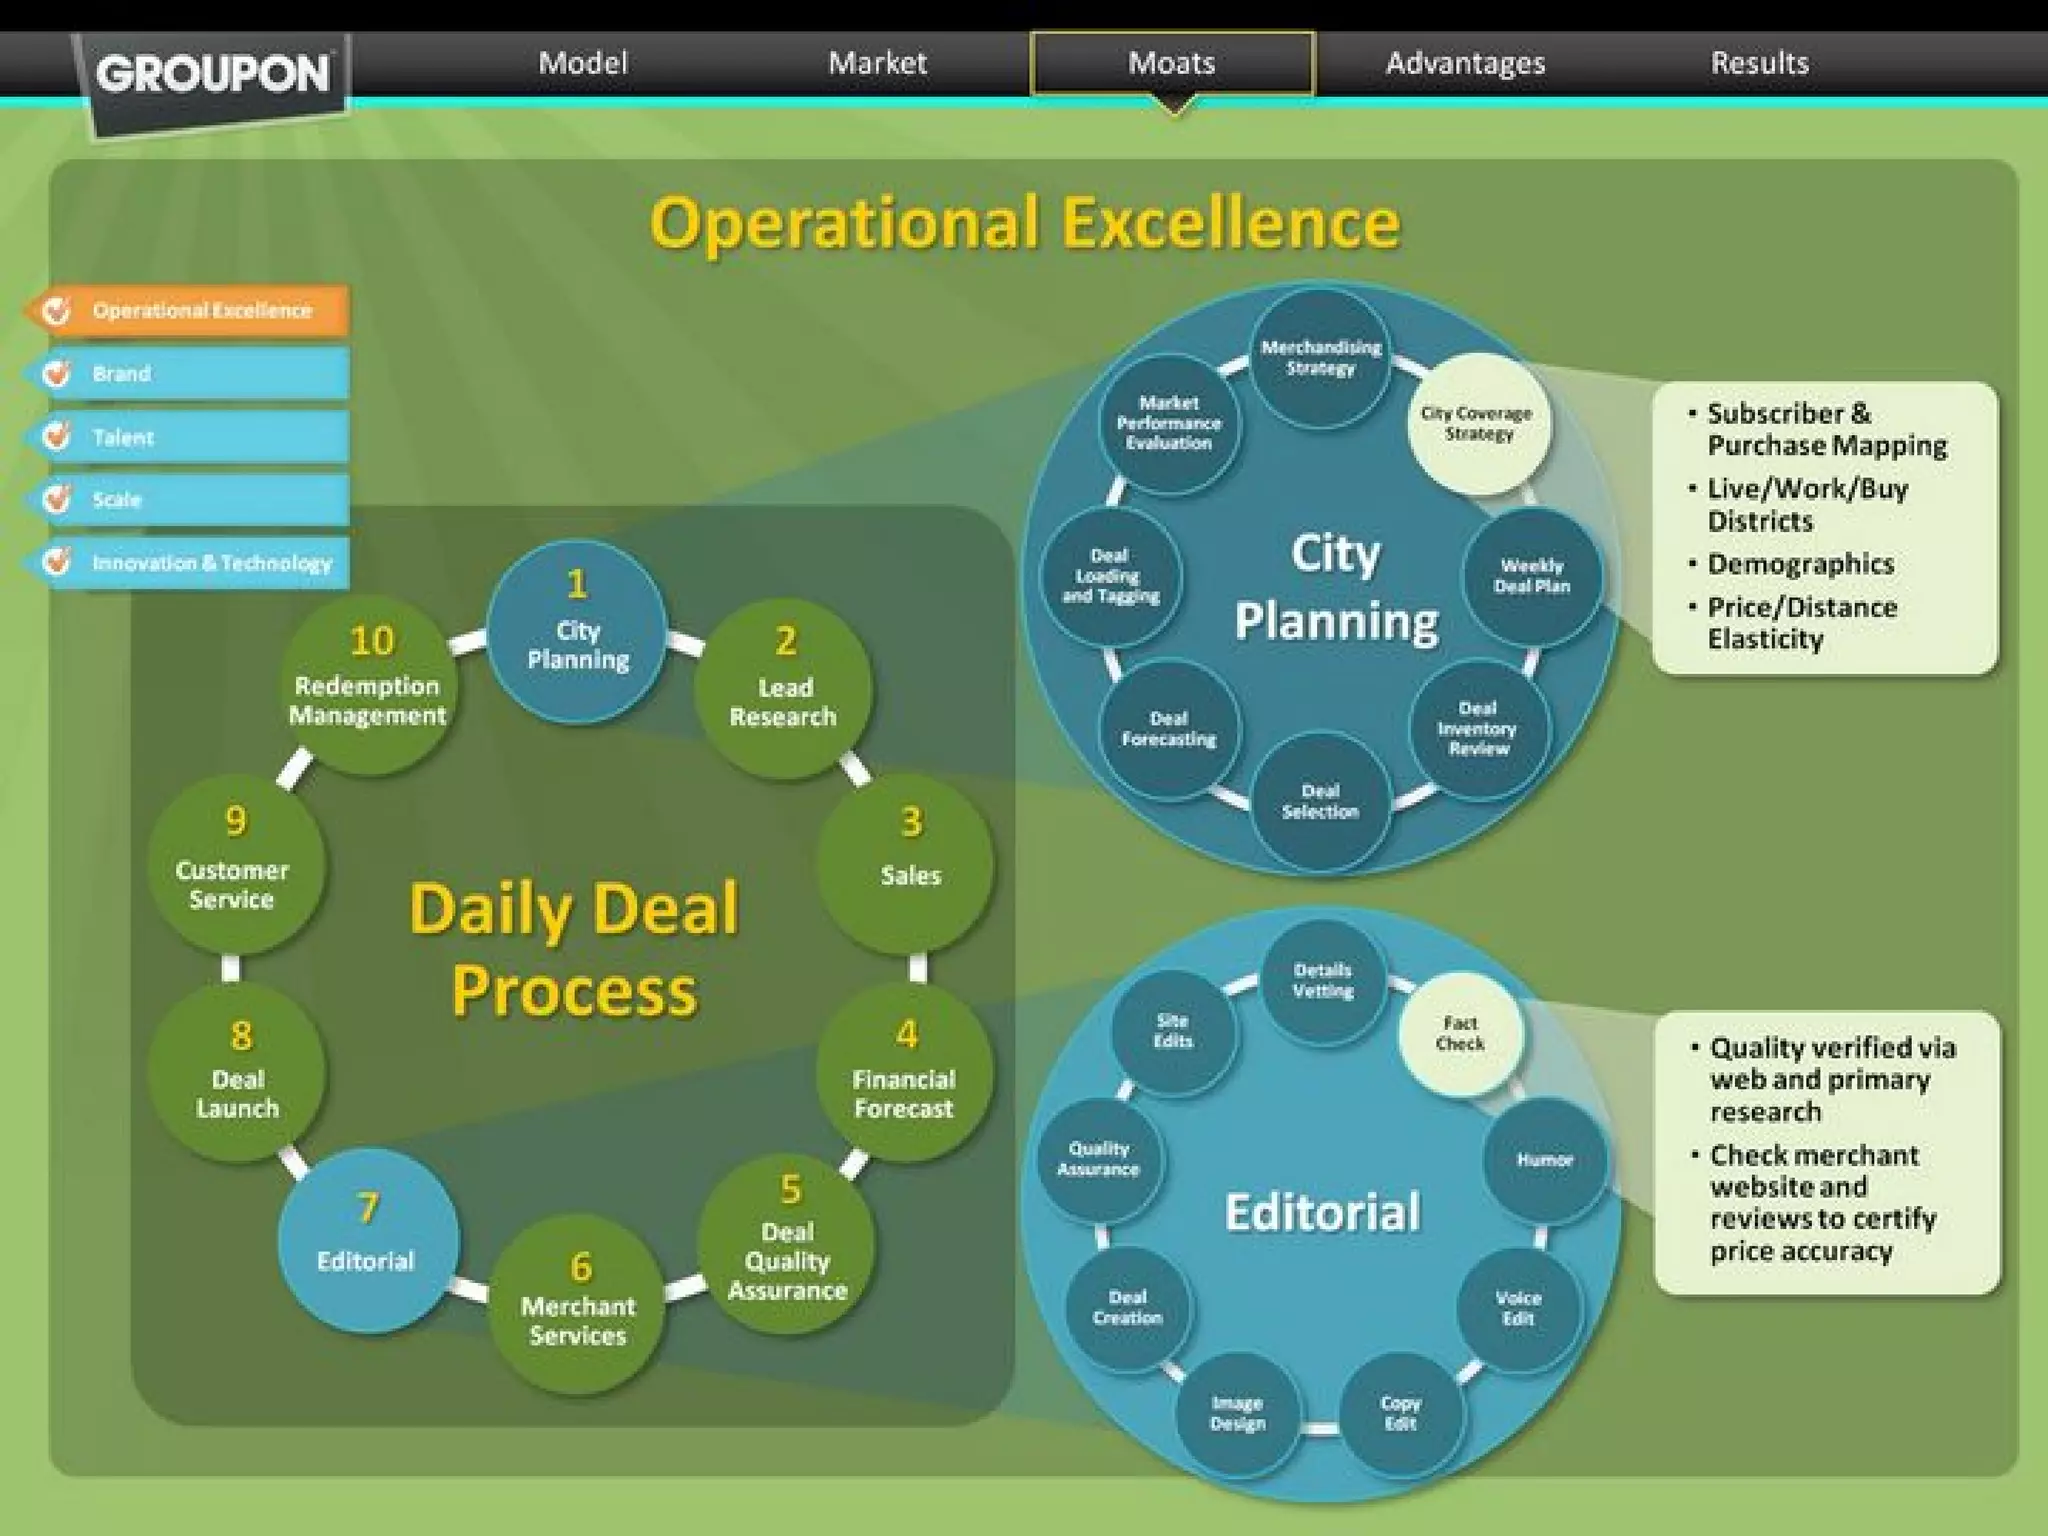
  1. Operational Excellence (Slide 20): 10-step daily deal process with city planning, lead research, sales, financial forecasting, quality assurance, merchant services, editorial, deal launch, customer service, redemption management
    • Assessment: Labor-intensive, not defensible; competitors can replicate
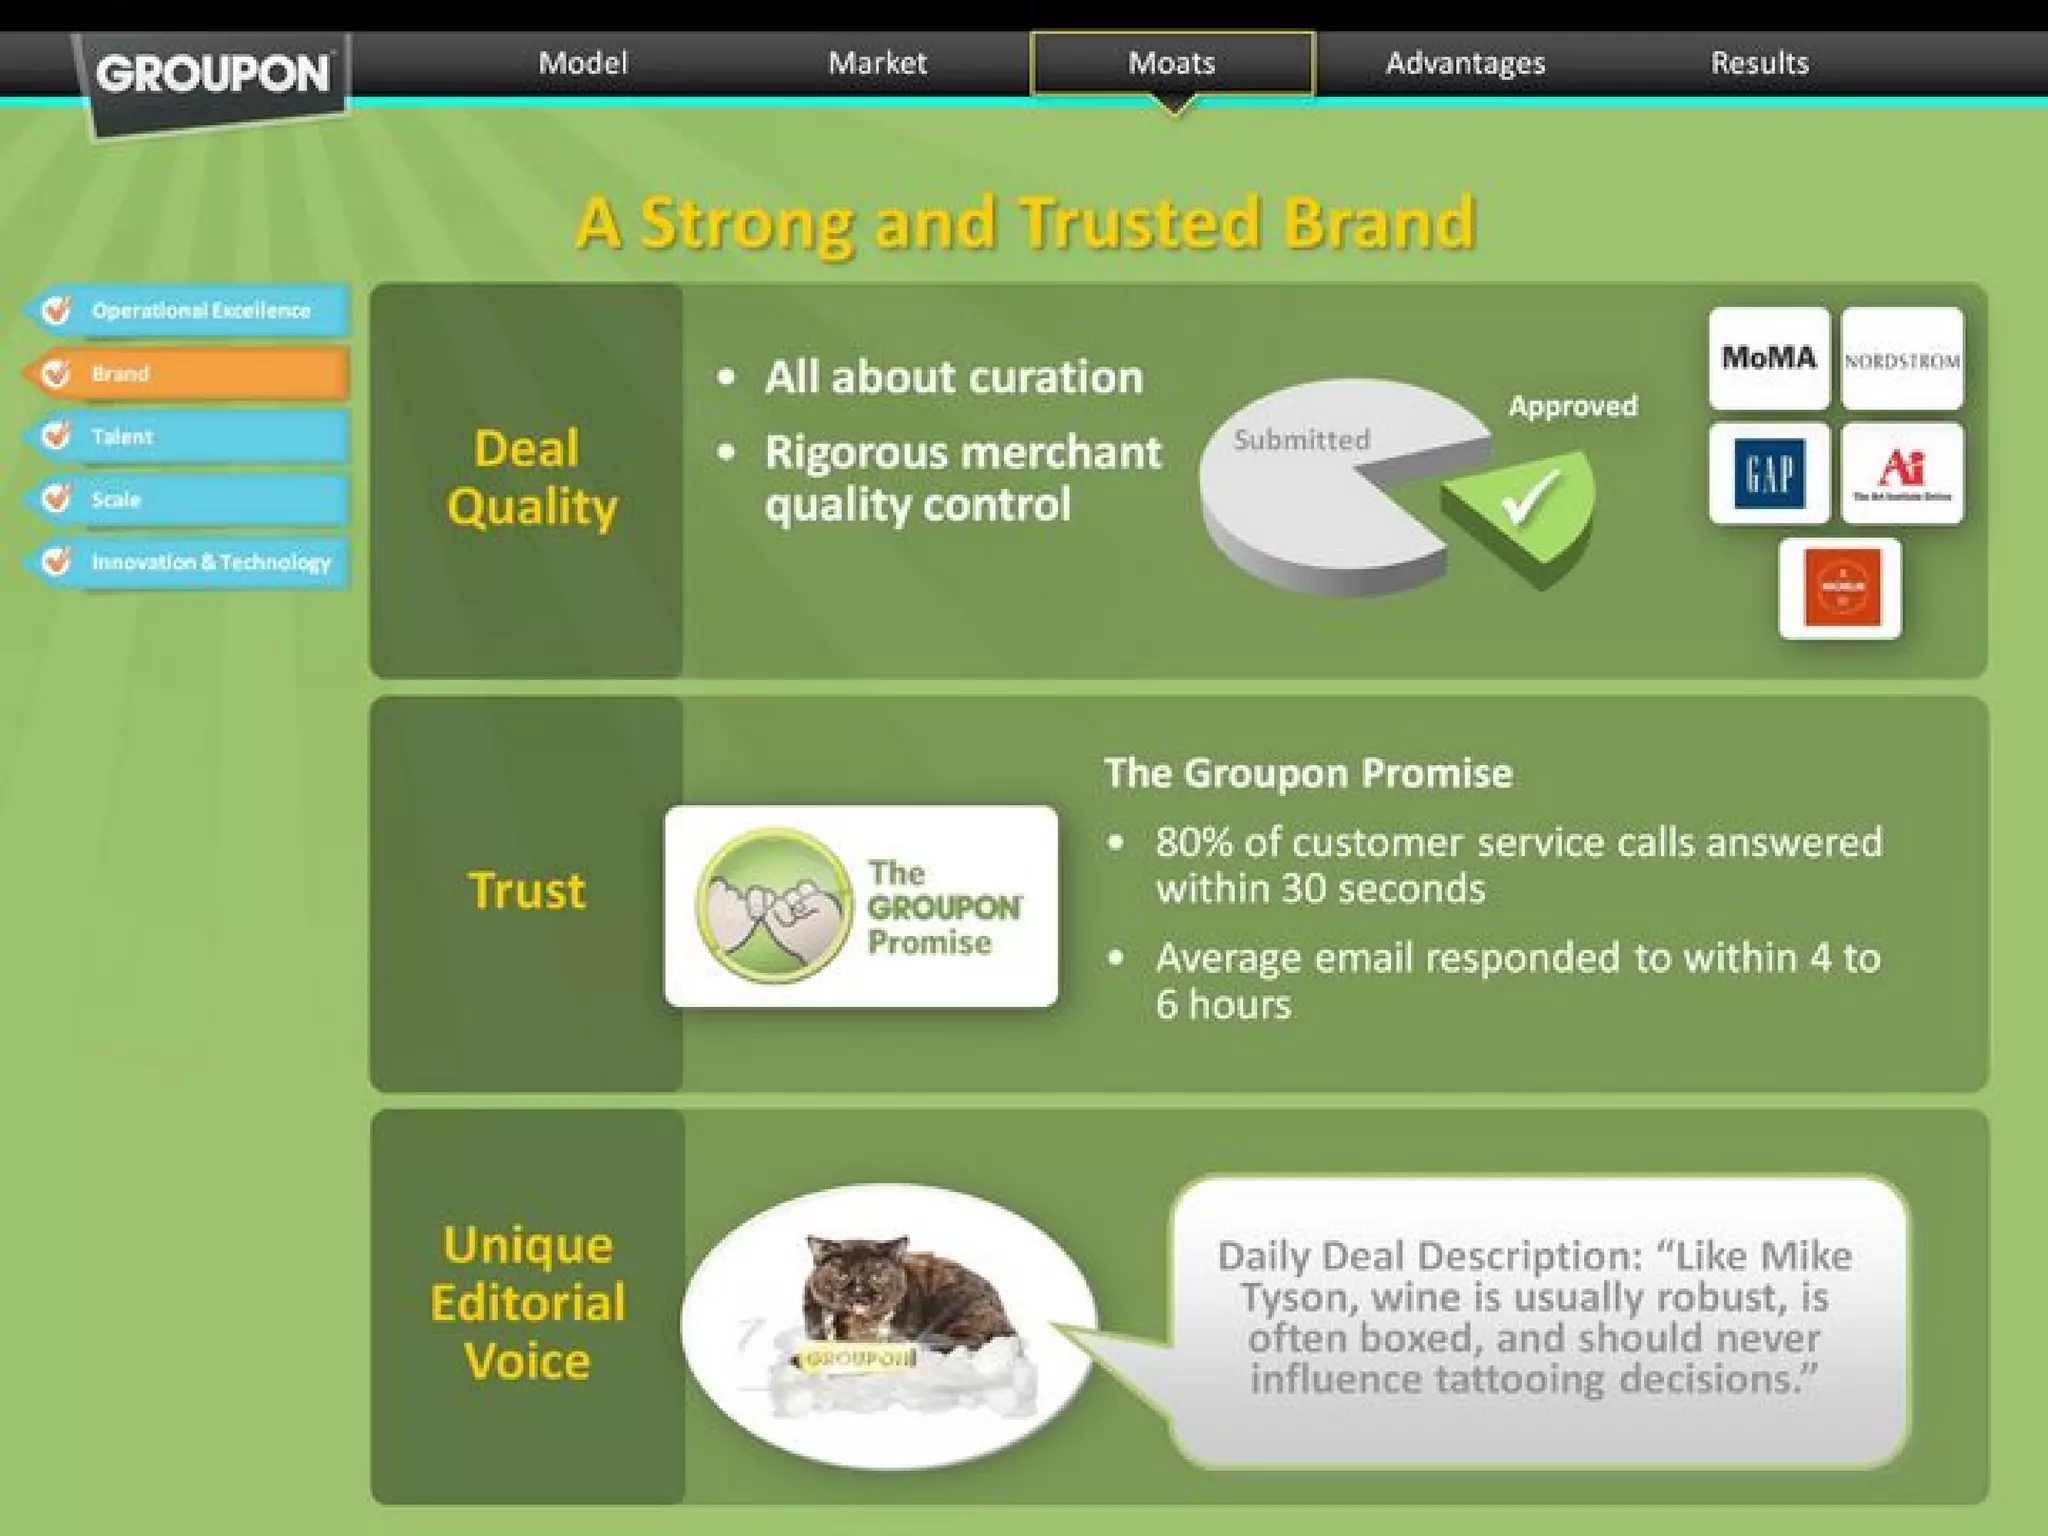
  2. Brand (Slide 21): “Strong and Trusted Brand” with deal quality curation, rigorous merchant QC, customer service (80% of calls answered within 30 seconds), unique editorial voice
    • Assessment: Brand is valuable but not defensible; competitors can build similar brands
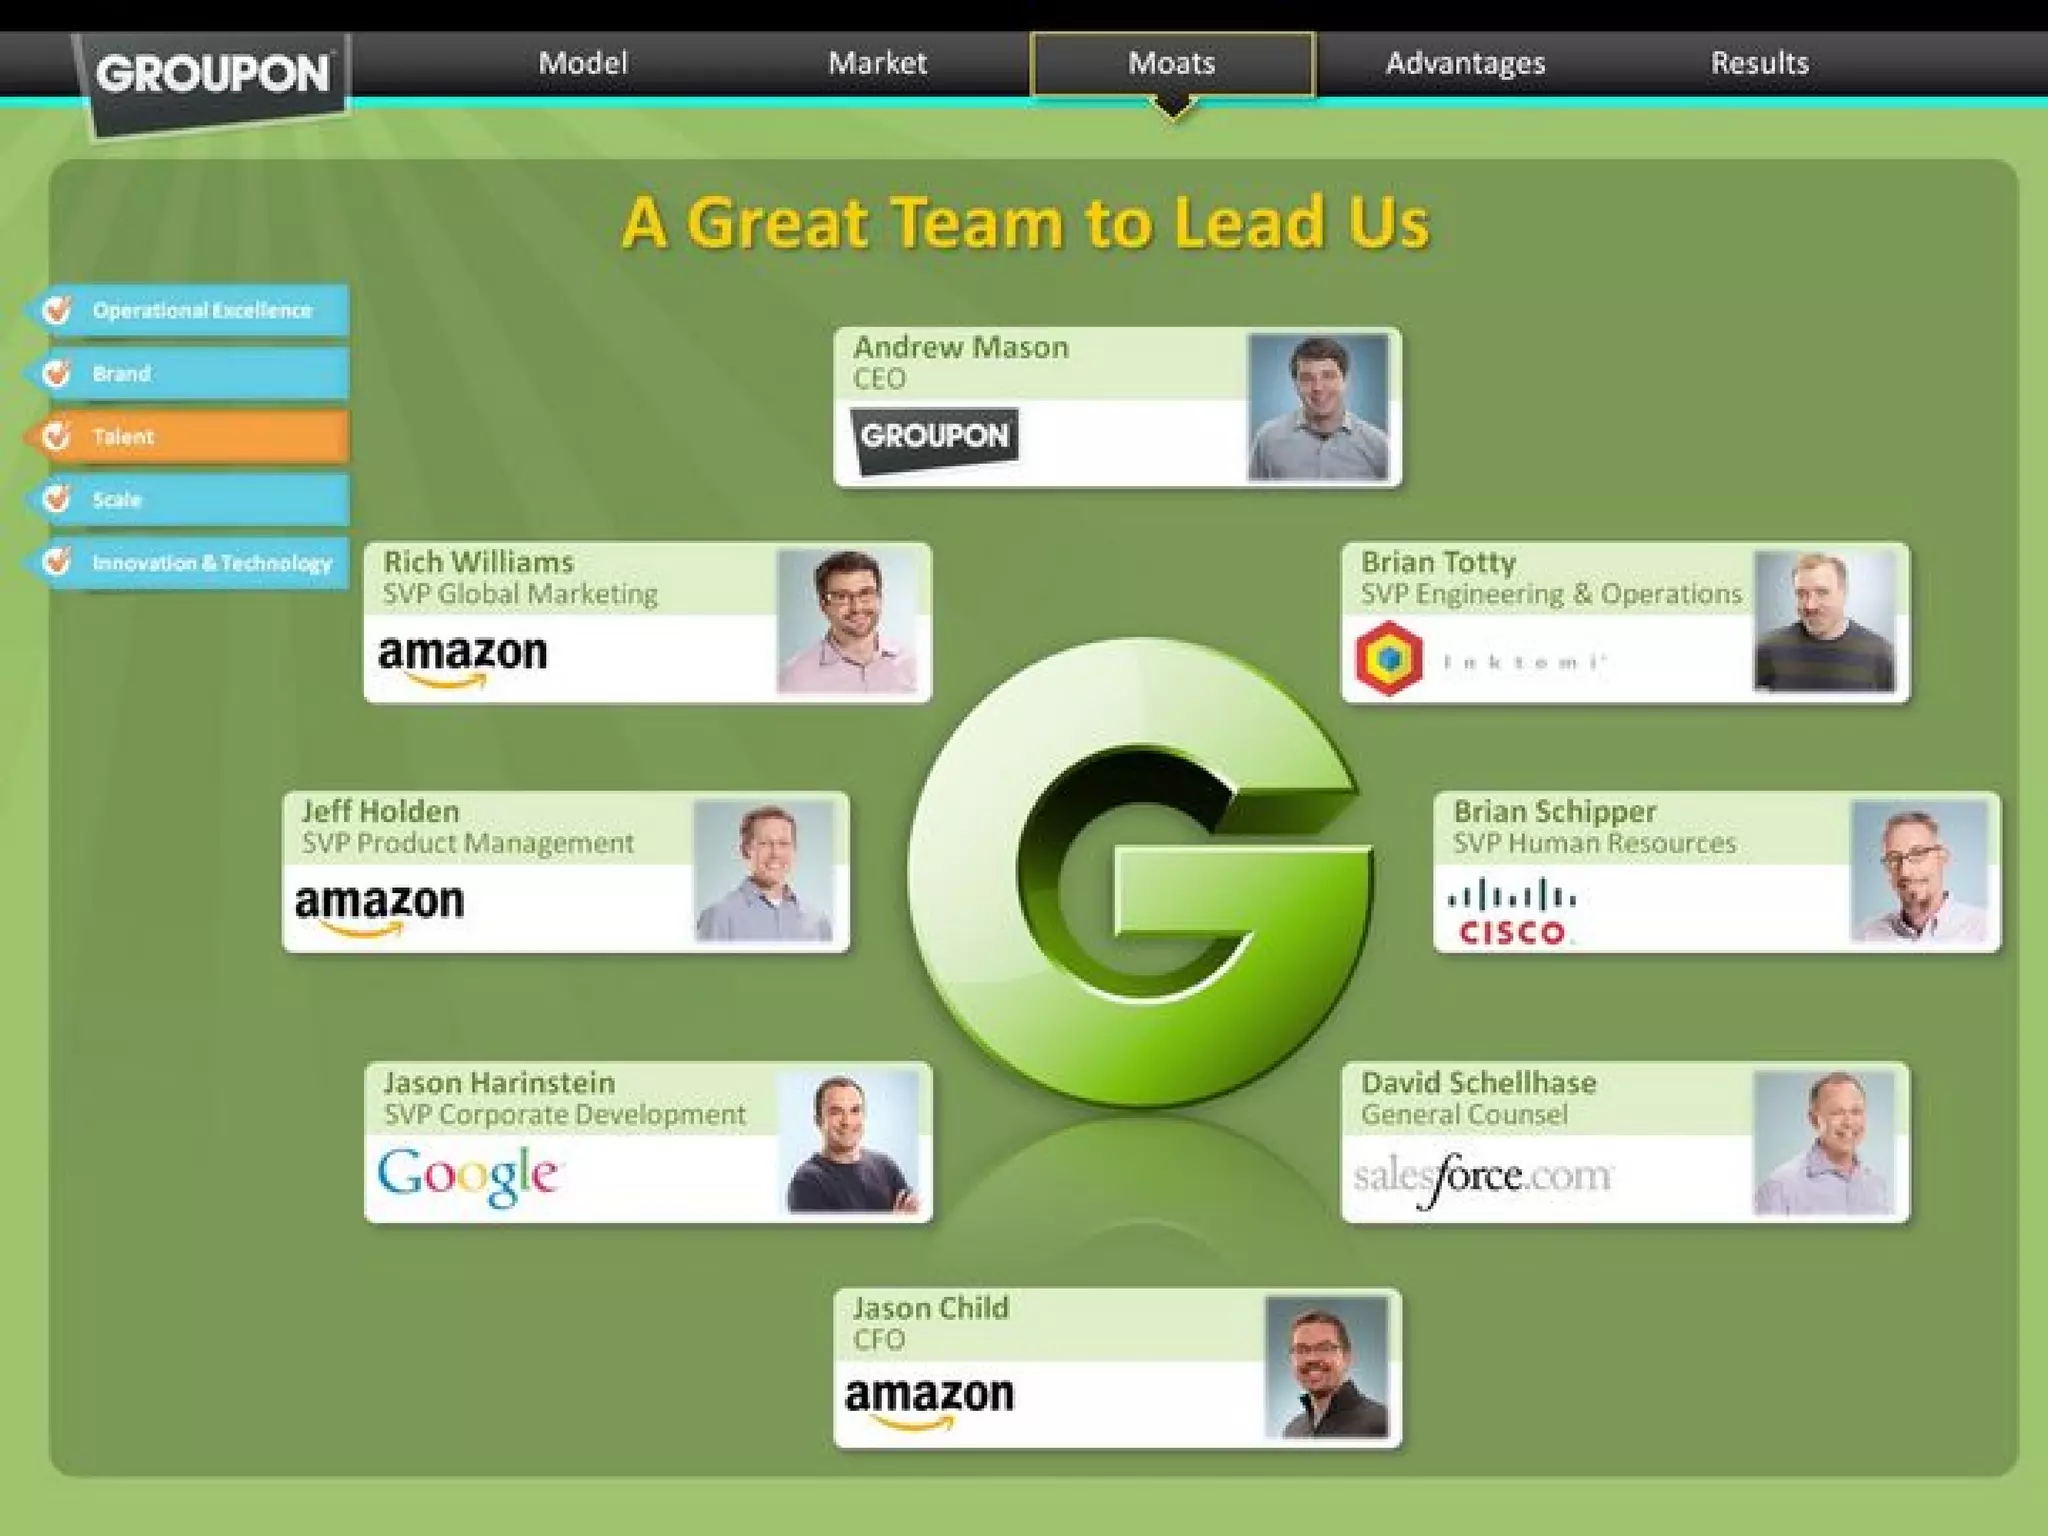
  3. Talent (Slide 22): Leadership team from Amazon (4), Google (1), Cisco (1), Inktomi (1), Salesforce (1)
    • Assessment: Talent is valuable but not defensible; competitors can hire similar talent
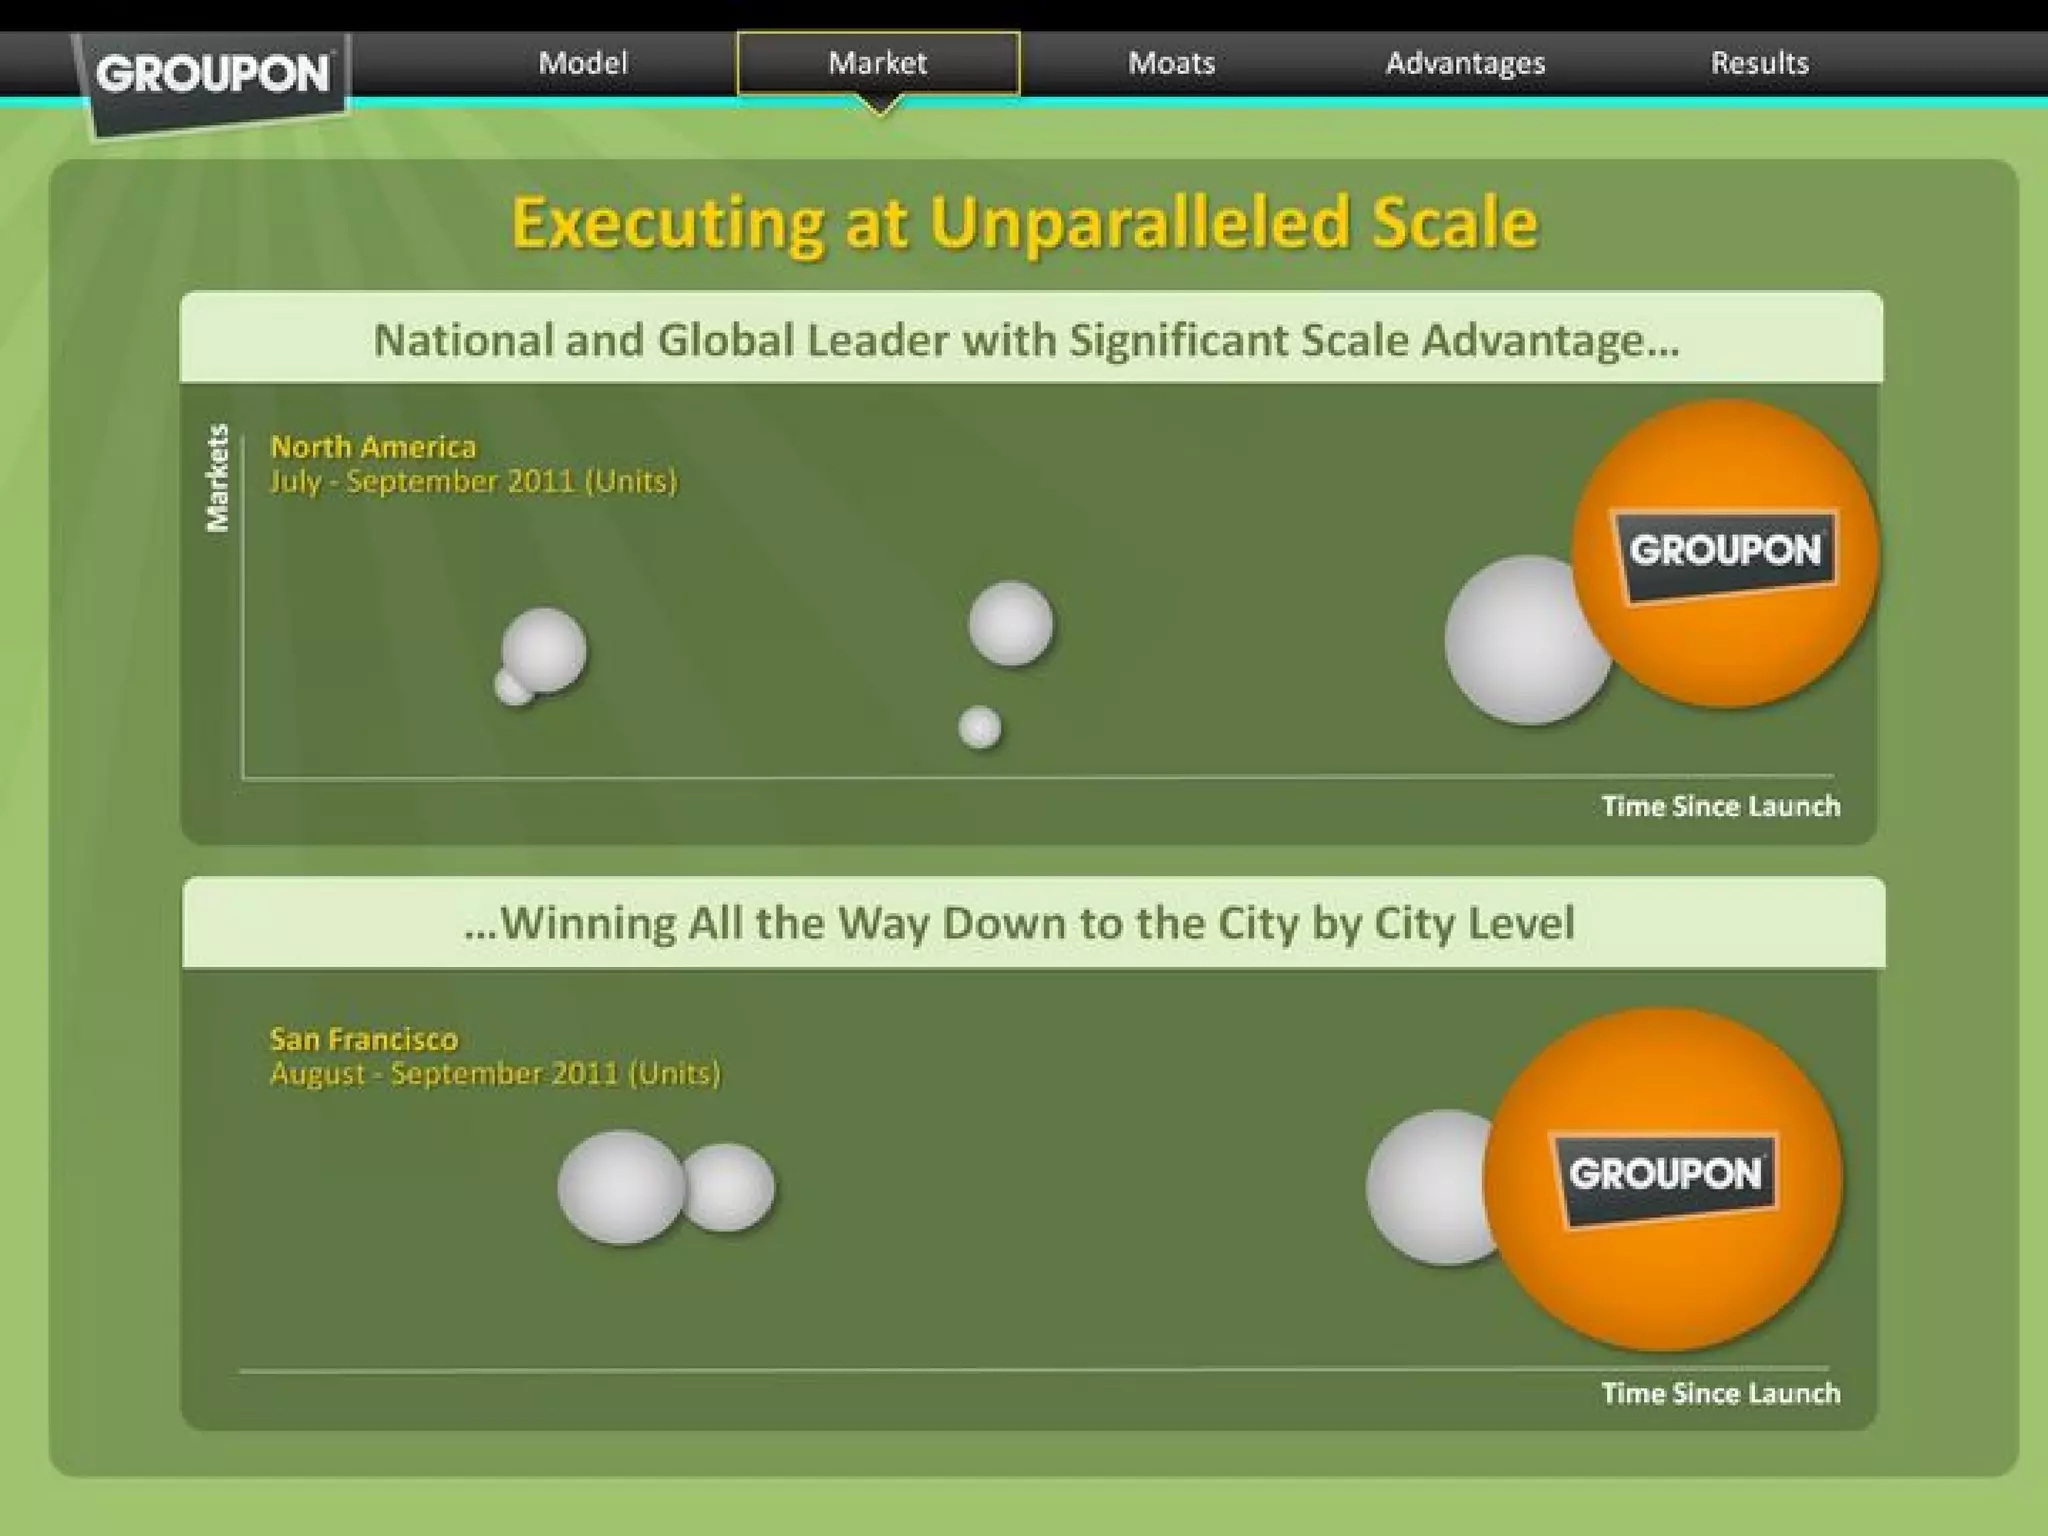
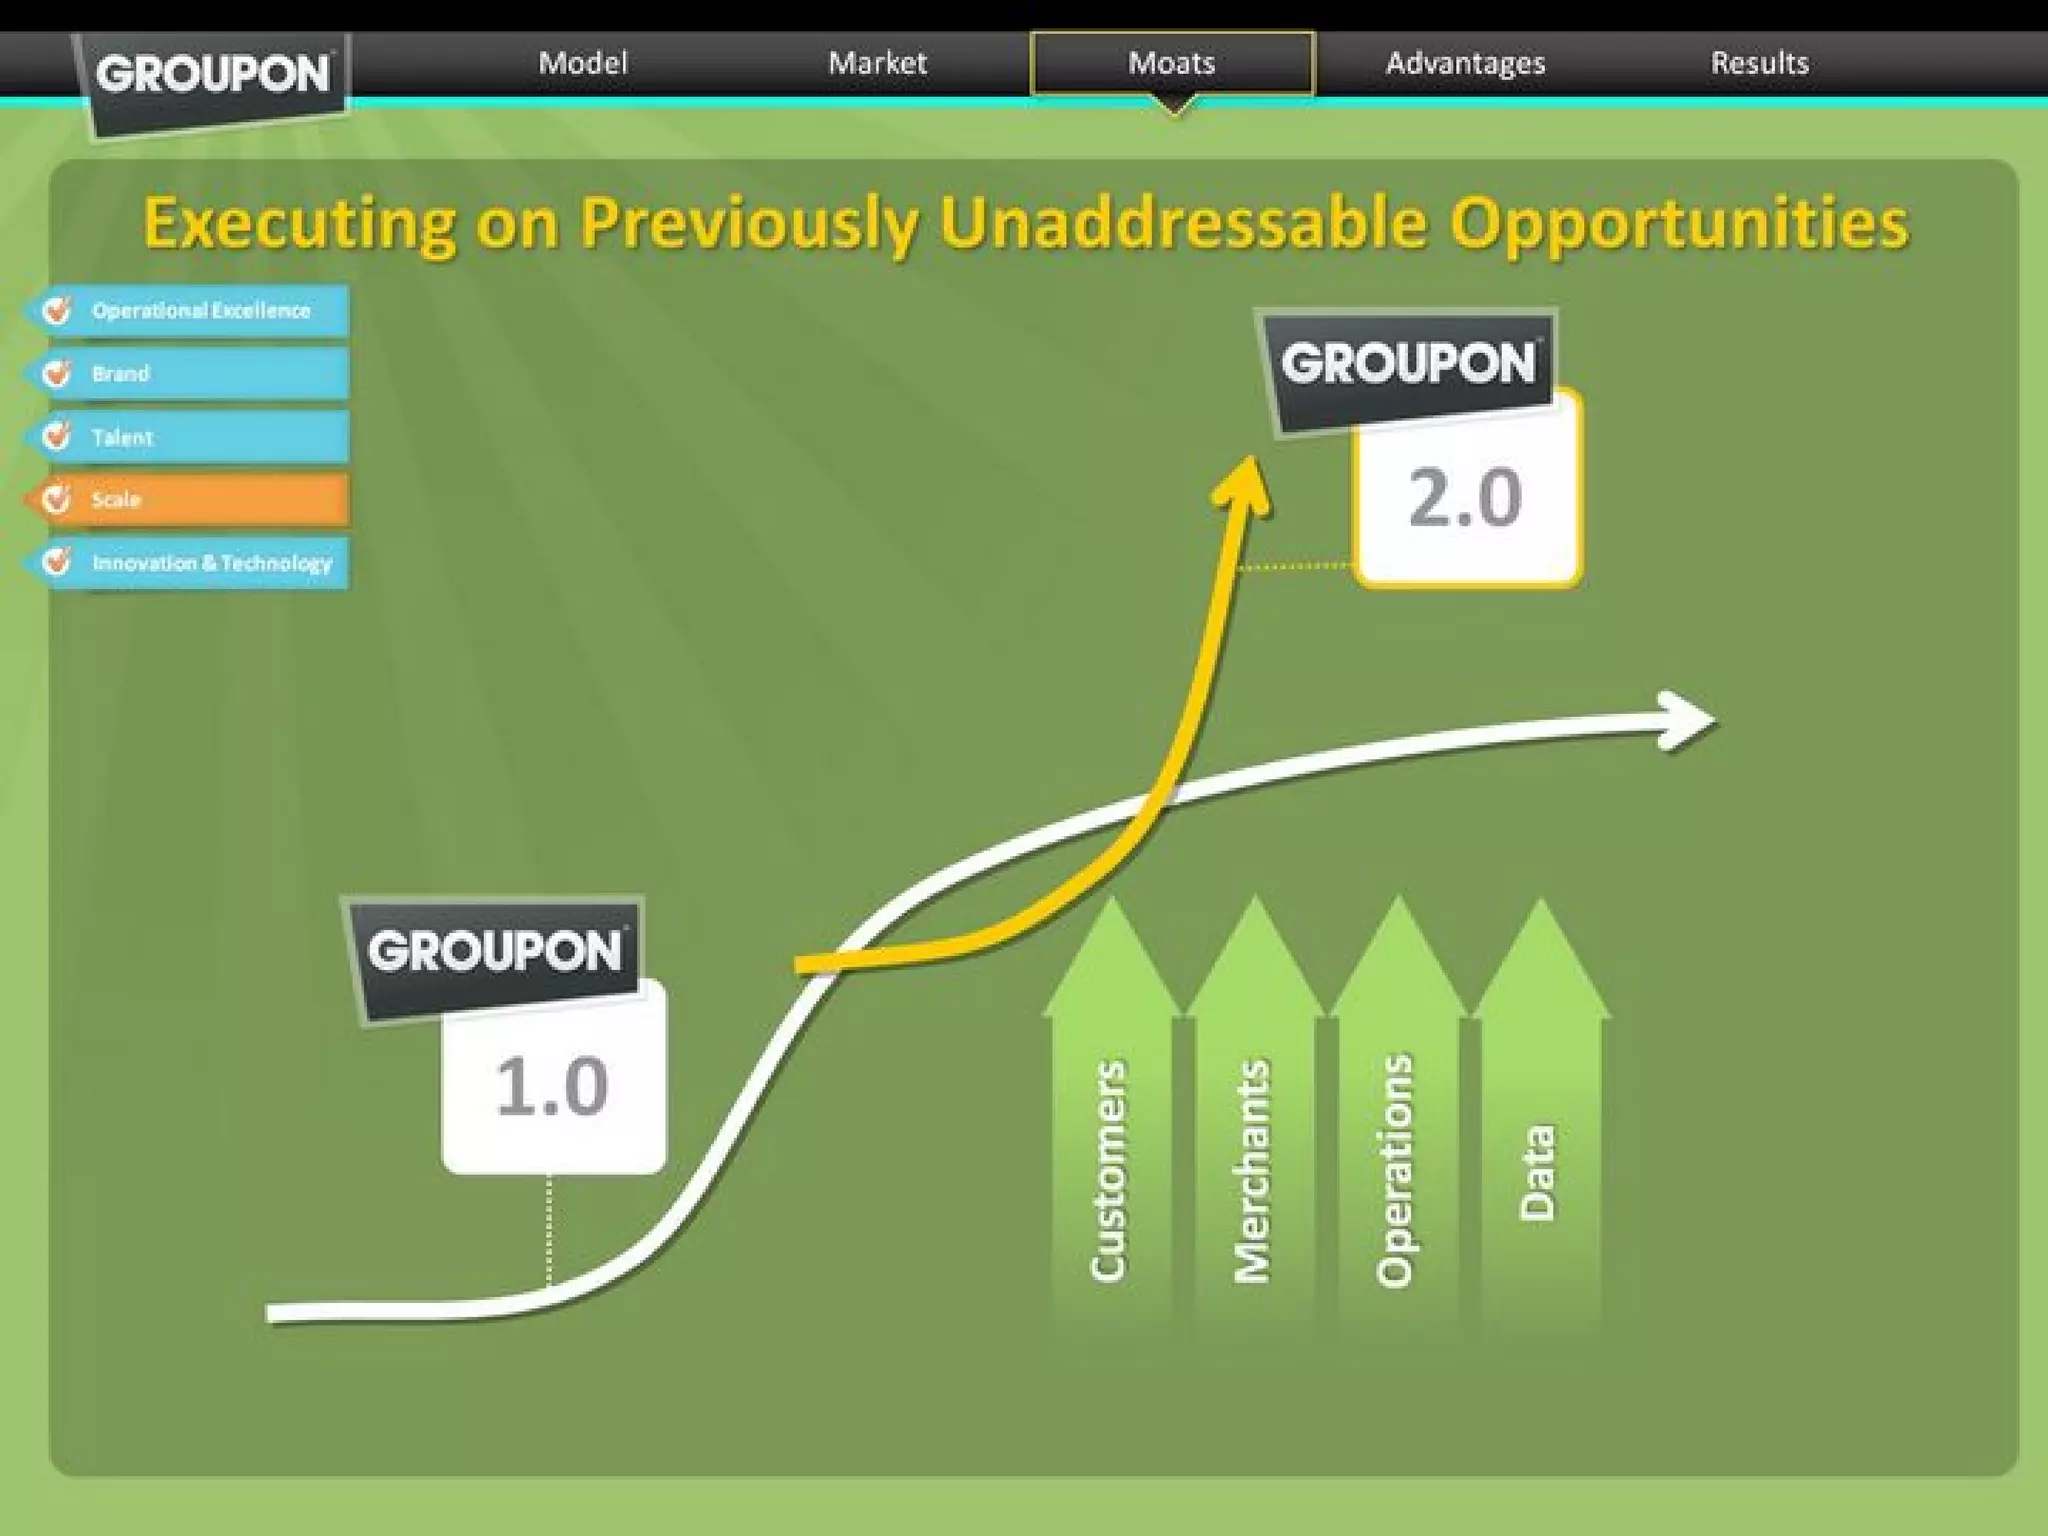
  4. Scale (Slide 23): “Executing on Previously Unaddressable Opportunities” with Groupon 2.0 roadmap
    • Assessment: Scale is result of competitive advantage, not a moat itself; vague and undefined
  5. Innovation & Technology (Slide 24): Merchant Center with ROI Calculator, mobile apps, deal management tools
    • Assessment: Tools are useful but not proprietary; competitors can build similar tools

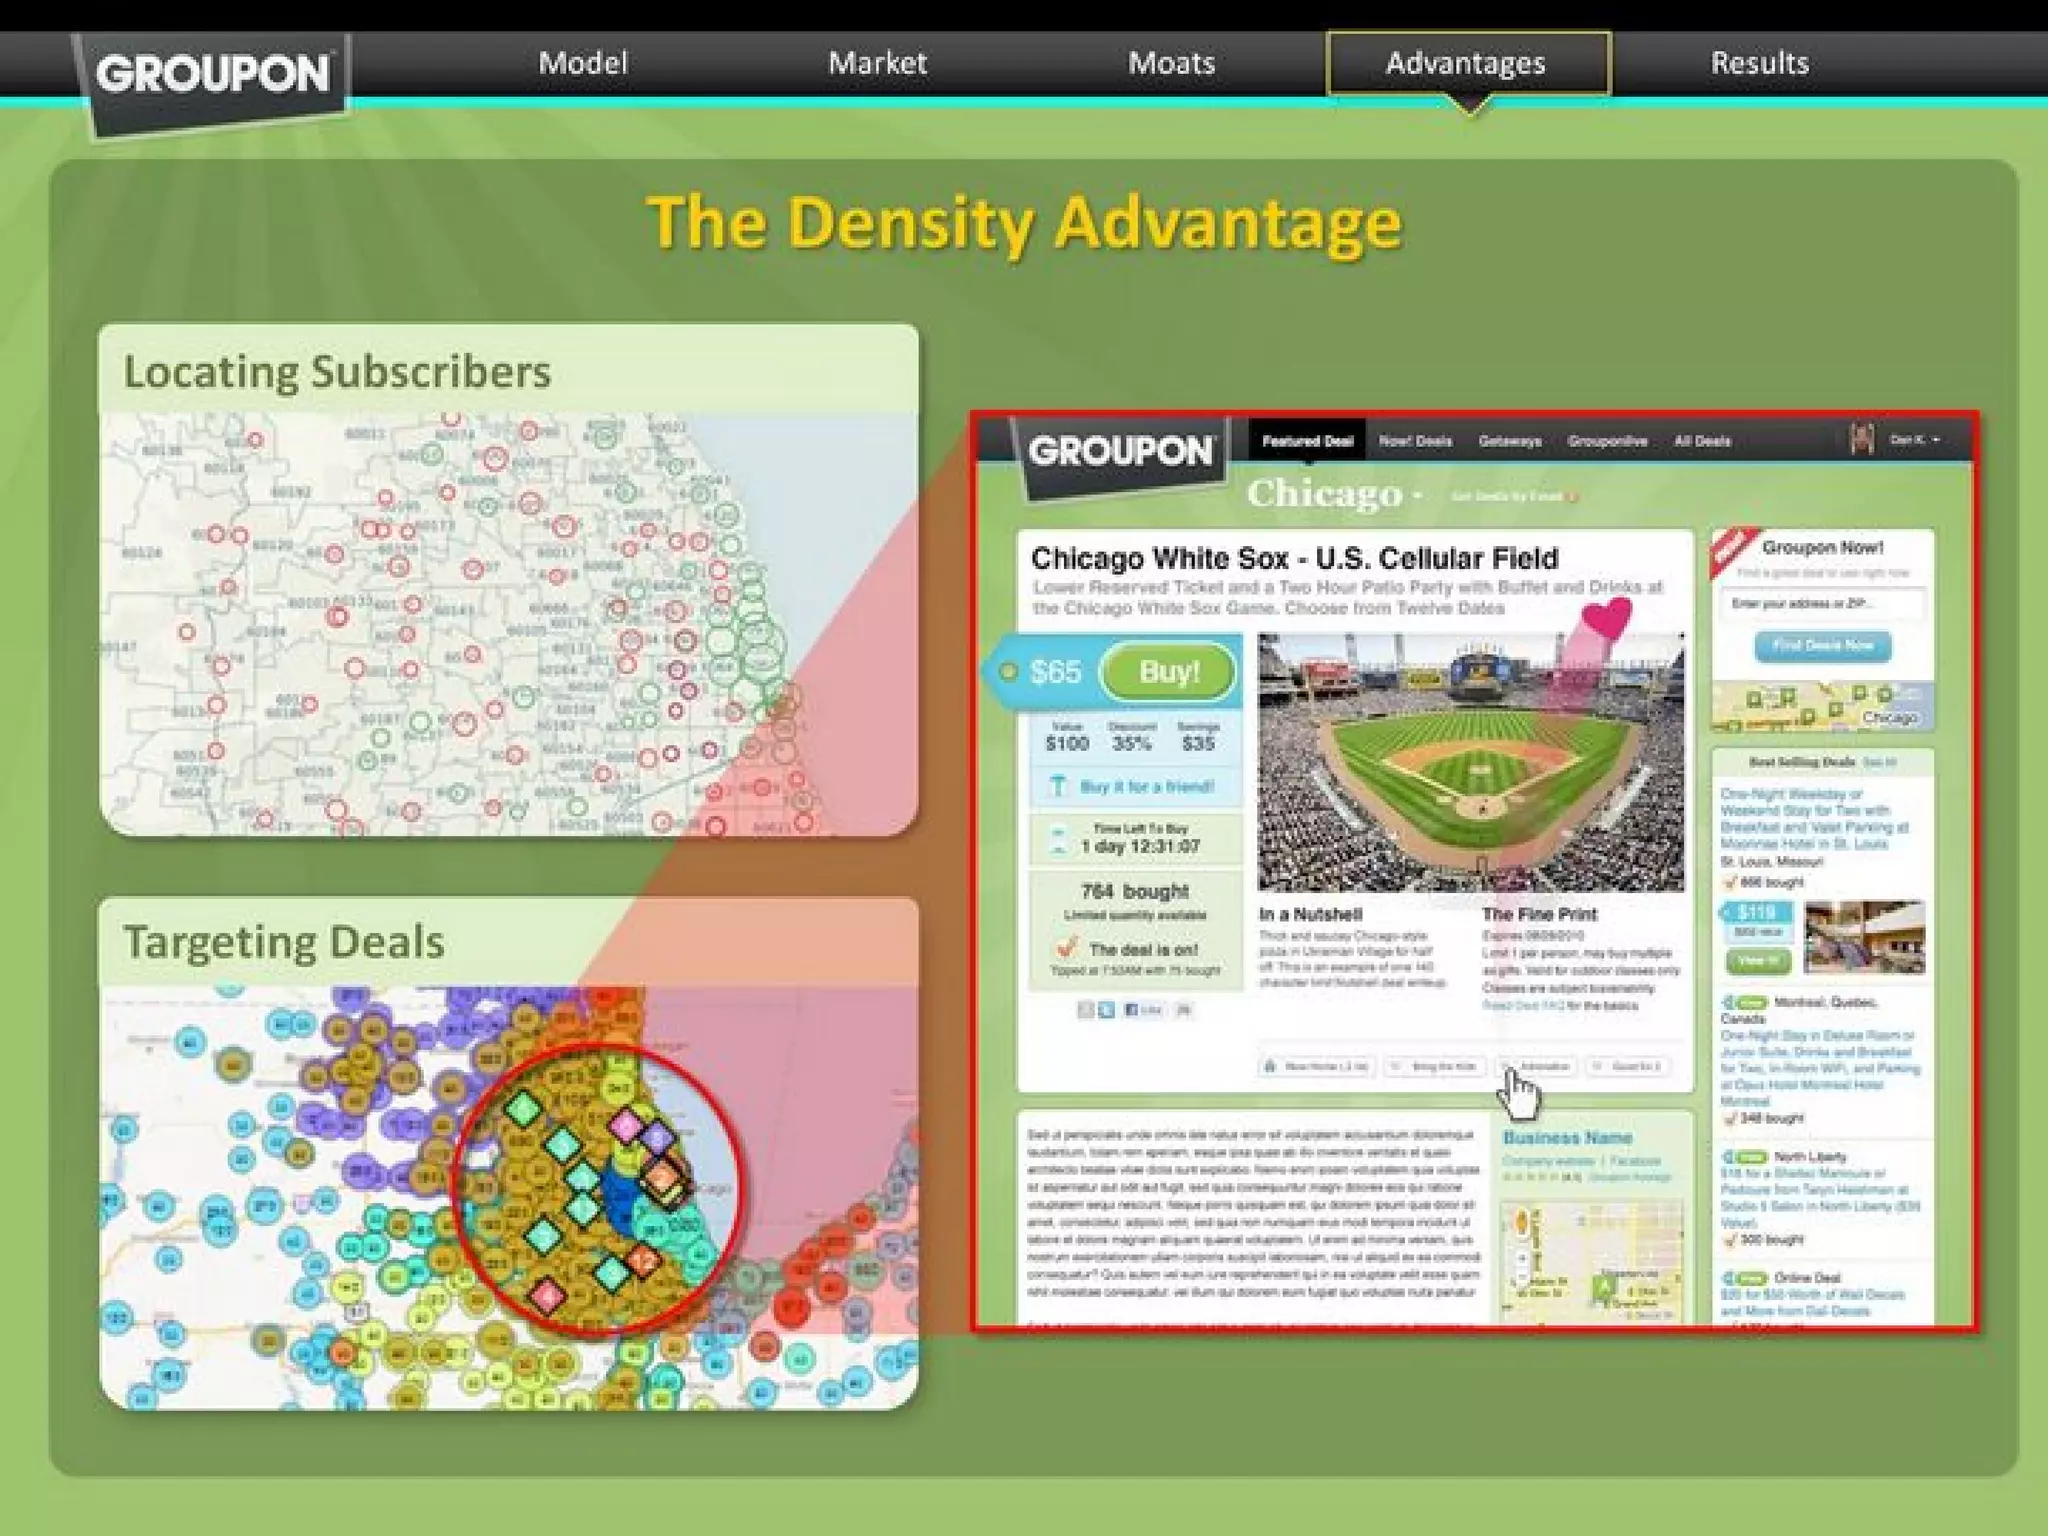
Density Advantage (Slide 26):

  • Groupon has geographic concentration of subscribers in major cities
  • Enables targeted deal selection and merchant targeting
  • Assessment: Temporary advantage; competitors can achieve similar density if they grow

Team

Leadership Team (Slide 22):

Name Title Previous Company
Andrew Mason CEO/Founder Groupon
Rich Williams SVP Global Marketing Amazon
Brian Totty SVP Engineering & Operations Inktomi
Jeff Holden SVP Product Management Amazon
Brian Schipper SVP Human Resources Cisco
Jason Harinstein SVP Corporate Development Google
David Schellhase General Counsel Salesforce.com
Jason Child CFO Amazon

Assessment:

  • Strong pedigree from top tech companies
  • Heavy Amazon representation (4 of 9) suggests copying Amazon’s model
  • No mention of founder Mason’s background or qualifications
  • No board member information provided

Go-to-Market Strategy

Customer Acquisition (Slides 20, 26, 34):

  • Email marketing to subscriber list
  • Mobile app (iPhone-first in 2011)
  • Geographic targeting based on subscriber density
  • City-by-city expansion strategy
  • Marketing spend: 40% of revenue in Q3 2011

Merchant Acquisition (Slides 6-7, 20):

  • Direct sales team
  • City planning process to identify high-potential merchants
  • Merchant services team to support deal creation
  • ROI calculator to demonstrate value

Product Expansion (Slides 12, 27-28, 33):

  • Daily Deals (core product)
  • Groupon Now! (flash deals, mobile-first)
  • Groupon Rewards (loyalty program)
  • Category expansion: Live (events), Getaways (travel), Goods (products)

The Ask

IPO Details (Slide 3):

  • Shares Offered: 30MM shares (100% primary)
  • Overallotment Option: 15% (4.5MM shares)
  • Price Range: $16-$18 per share
  • Expected Pricing Date: Week of October 31, 2011
  • Implied Valuation at Midpoint ($17): ~$480-540M (based on ~31.5MM fully diluted shares)
  • Actual IPO: $20/share, valuing company at $12.7B

Use of Proceeds (Slide 3):

  • Working capital
  • General corporate purposes
  • Acquisition of businesses, products, or technologies
  • Assessment: Vague; suggests management has flexibility to deploy capital broadly

Lock-Up Period: 180 days

Lead Underwriters: Morgan Stanley, Goldman Sachs, Credit Suisse

Key Takeaways

  1. Growth Metrics Alone Are Not Sufficient: Groupon shows 426% Y/Y revenue growth and 30M customers, but this masks fundamental issues (9% repeat rate, negative equity). Investors will dig deeper.

  2. Unit Economics Matter More Than Growth: The 9% repeat rate is more important than the 426% growth rate. It determines whether the business is sustainable.

  3. Use GAAP Metrics, Not Non-GAAP: Groupon’s use of CSOI and Contribution Profit to hide lack of GAAP profitability is a red flag. Investors prefer transparency.
  4. Avoid Misleading Metrics: Groupon’s use of “cumulative customers” instead of “active customers” and “gross billings” instead of “revenue” is misleading. Be specific and clear.
  5. Address Competitive Threats: Groupon acknowledges 100+ competitors but doesn’t explain why they’ll win. Better to be specific about defensible advantages.

  6. Show Path to Profitability: Groupon shows CSOI near breakeven but not GAAP profitability. Investors want to see clear path to profitability, not just near-term metrics.

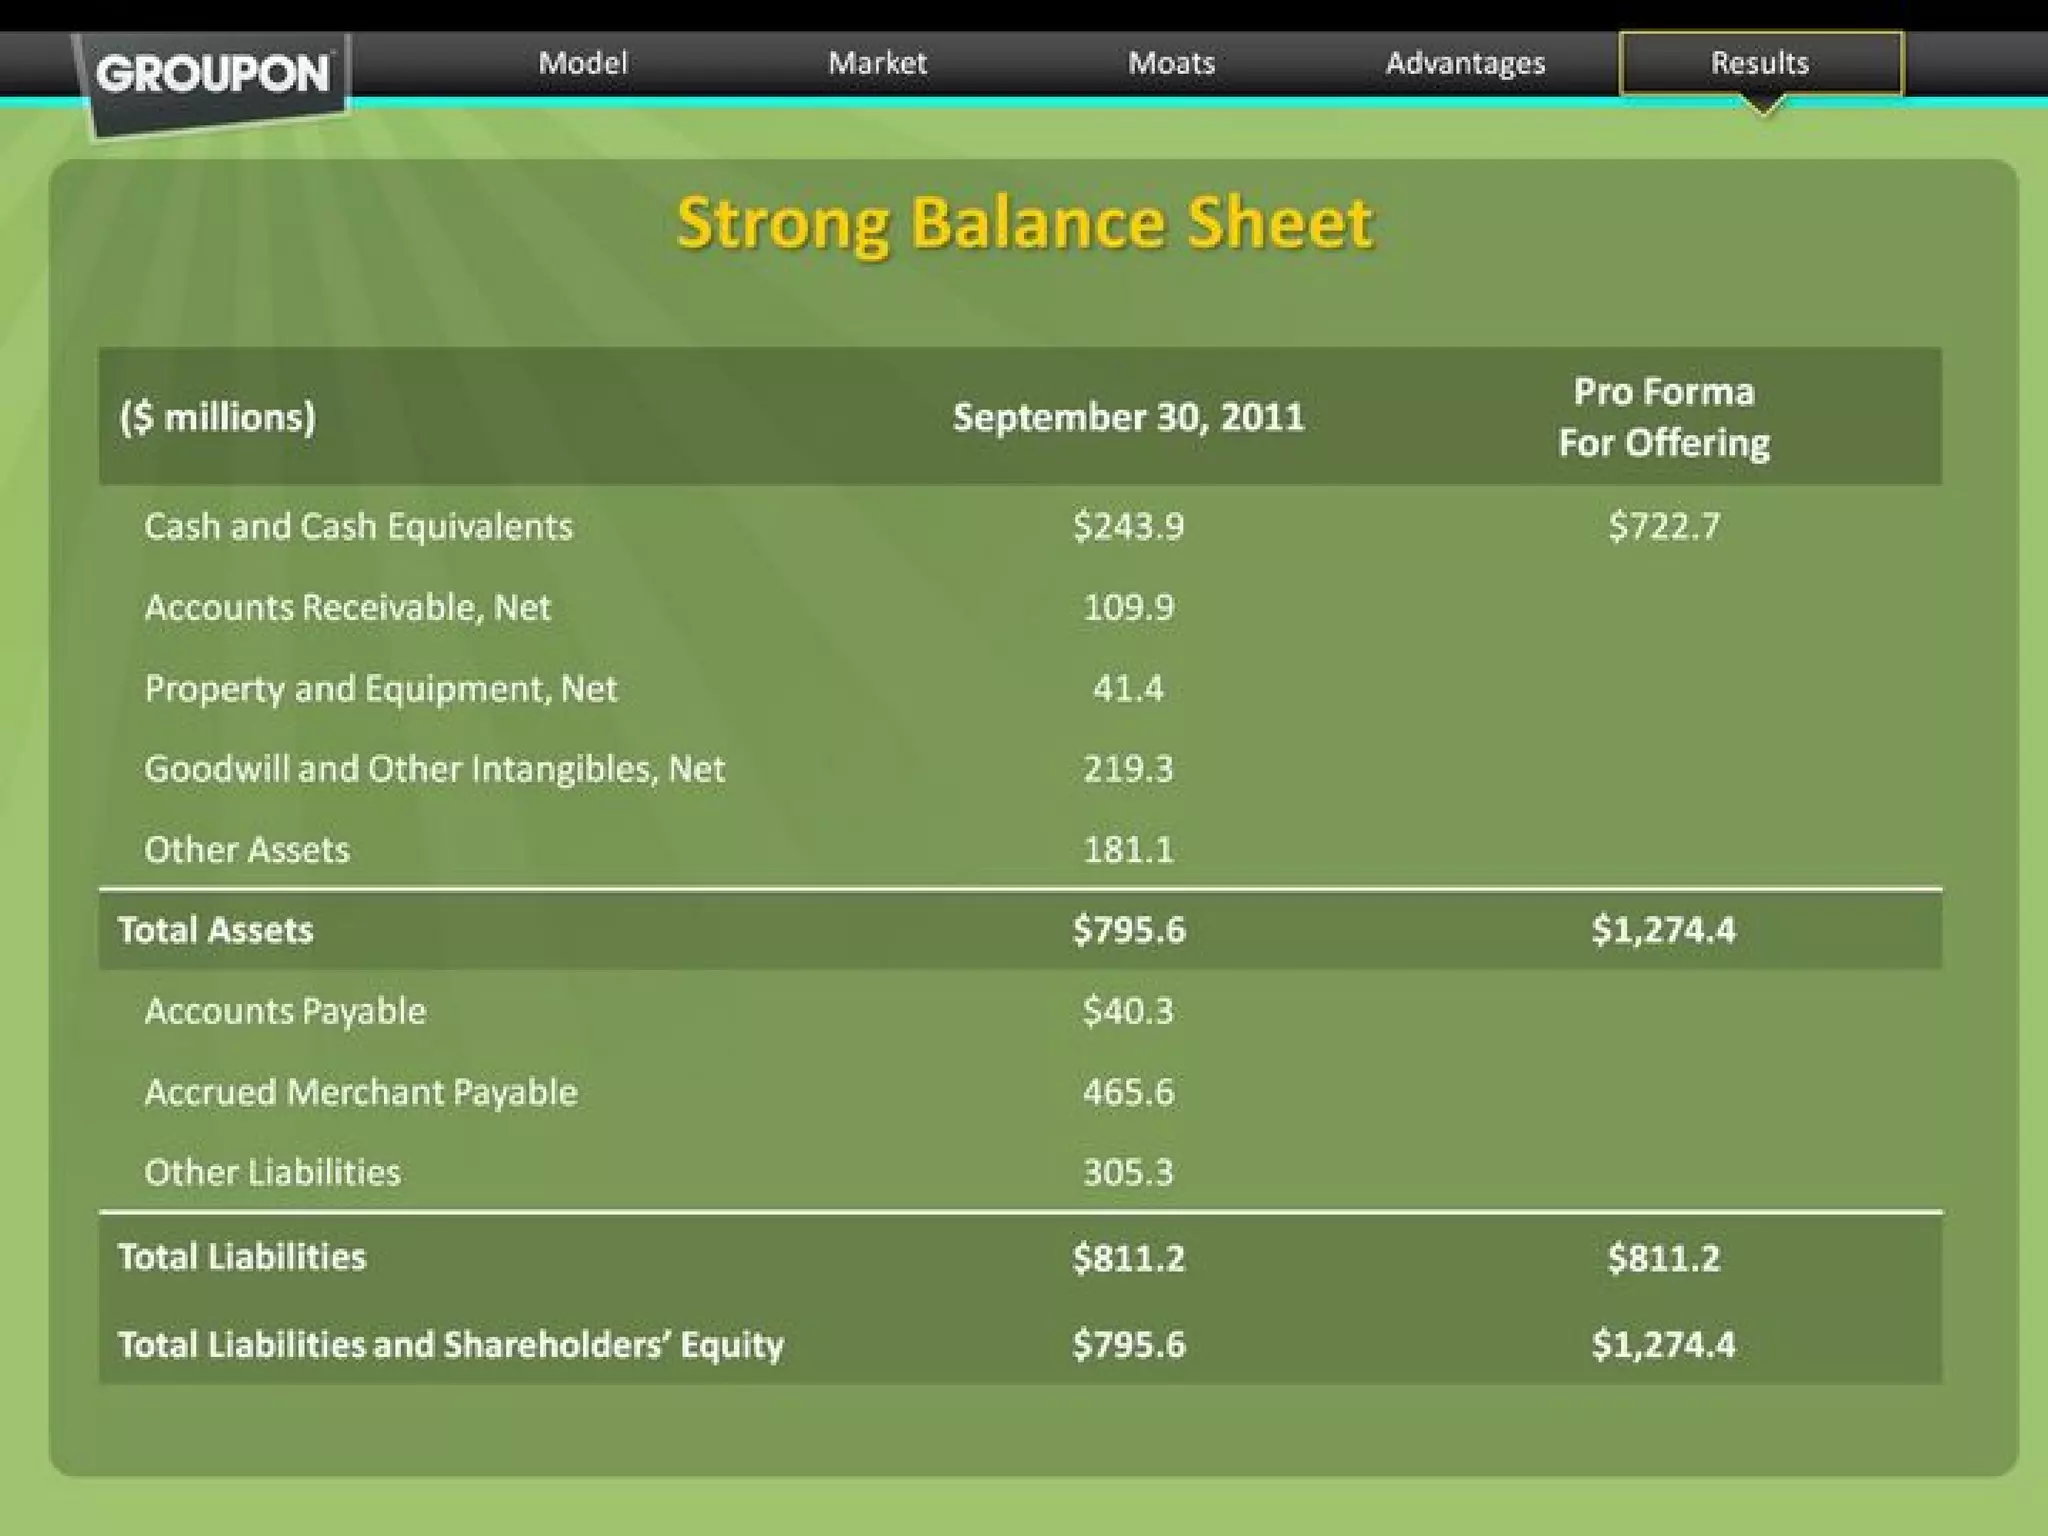
  7. Be Transparent About Weaknesses: Groupon’s negative shareholders’ equity before IPO is a major red flag. Proactively addressing weaknesses builds credibility.

  8. Avoid TAM Inflation: Groupon’s $17.5T TAM is not credible. Be specific about addressable market and realistic about market share.

  9. Focus on Defensible Advantages: Groupon’s five moats are generic. Better to focus on specific, defensible advantages (network effects, switching costs, data, exclusive partnerships).

  10. Repeat Key Messages, But Don’t Overdo It: Groupon repeats “Investment Highlights” three times (Slides 5, 31, 38). This is excessive and suggests lack of confidence in the message.

Investor Deep Dive

Executive summary, strengths & red flags

Executive Summary

The Groupon IPO roadshow pitch deck presents a masterclass in persuasive but misleading financial presentation. The deck showcases extraordinary growth metrics (426% Y/Y revenue growth, 30M cumulative customers across 45 countries) and claims of path to profitability, but obscures fundamental business model weaknesses through non-GAAP metrics, misleading comparisons (gross billings vs. revenue), and omission of critical data. Most damaging: Slide 24 reveals only 9% customer repeat rate, implying 91% churn and undermining the entire unit economics narrative that the deck spends considerable effort building.

More Pitch Decks To Study

Compare structure, fundraising context, and investor-facing story across similar startup decks.