Compare your deck to Foursquare

Compare Your Deck

Foursquare Pitch Deck (2009)

Social
Stage: Seed
Raised: $1.3M
Year: 2009
Slides: 15
Outcome: Pivoted to B2B, valued at $400M

Pitch Deck

1 / 15
Foursquare pitch deck slide 1
Click to expand

Deck Analysis

This seed deck from Foursquare (2009) presents a clear product-first pitch for a location-based social app that gamifies real-world exploration. It combines concise product descriptions, screenshots of the mobile UX, early traction use-cases (mayors, merchant tweets), and a credible monetization path focused on lead generation and sponsored badges. The deck is notable because it demonstrates how a simple, well-scoped consumer product combined with strong network effects and measurable local intent can appeal to investors and later evolve into substantial B2B opportunities.

The Opening: What Foursquare Is

The Opening: What Foursquare Is

Slide 2 (What is foursquare?) functions as a compact positioning statement that immediately establishes the product as a hybrid: friend-finder, social city guide, and social game. The language is simple and benefit-focused — it tells users what the app does and tells brands how it could serve them. For investors, this kind of clarity reduces cognitive load and frames every subsequent slide against a clear value proposition.

Founders can learn from the discipline here: open with a one-line synthesis that communicates who the product is for, what it does, and why it matters to two audiences (users and brands). This slide also hints at the multi-channel product strategy (website, iPhone app, SMS, API) which signals technical breadth without getting bogged down in engineering detail.
Key Takeaway: Start with a single, tight positioning sentence that states the product, core user value, and who else benefits (e.g., brands) to orient investors quickly.
Core UX: Friend Finder (Onboarding & Immediate Value)

Core UX: Friend Finder (Onboarding & Immediate Value)

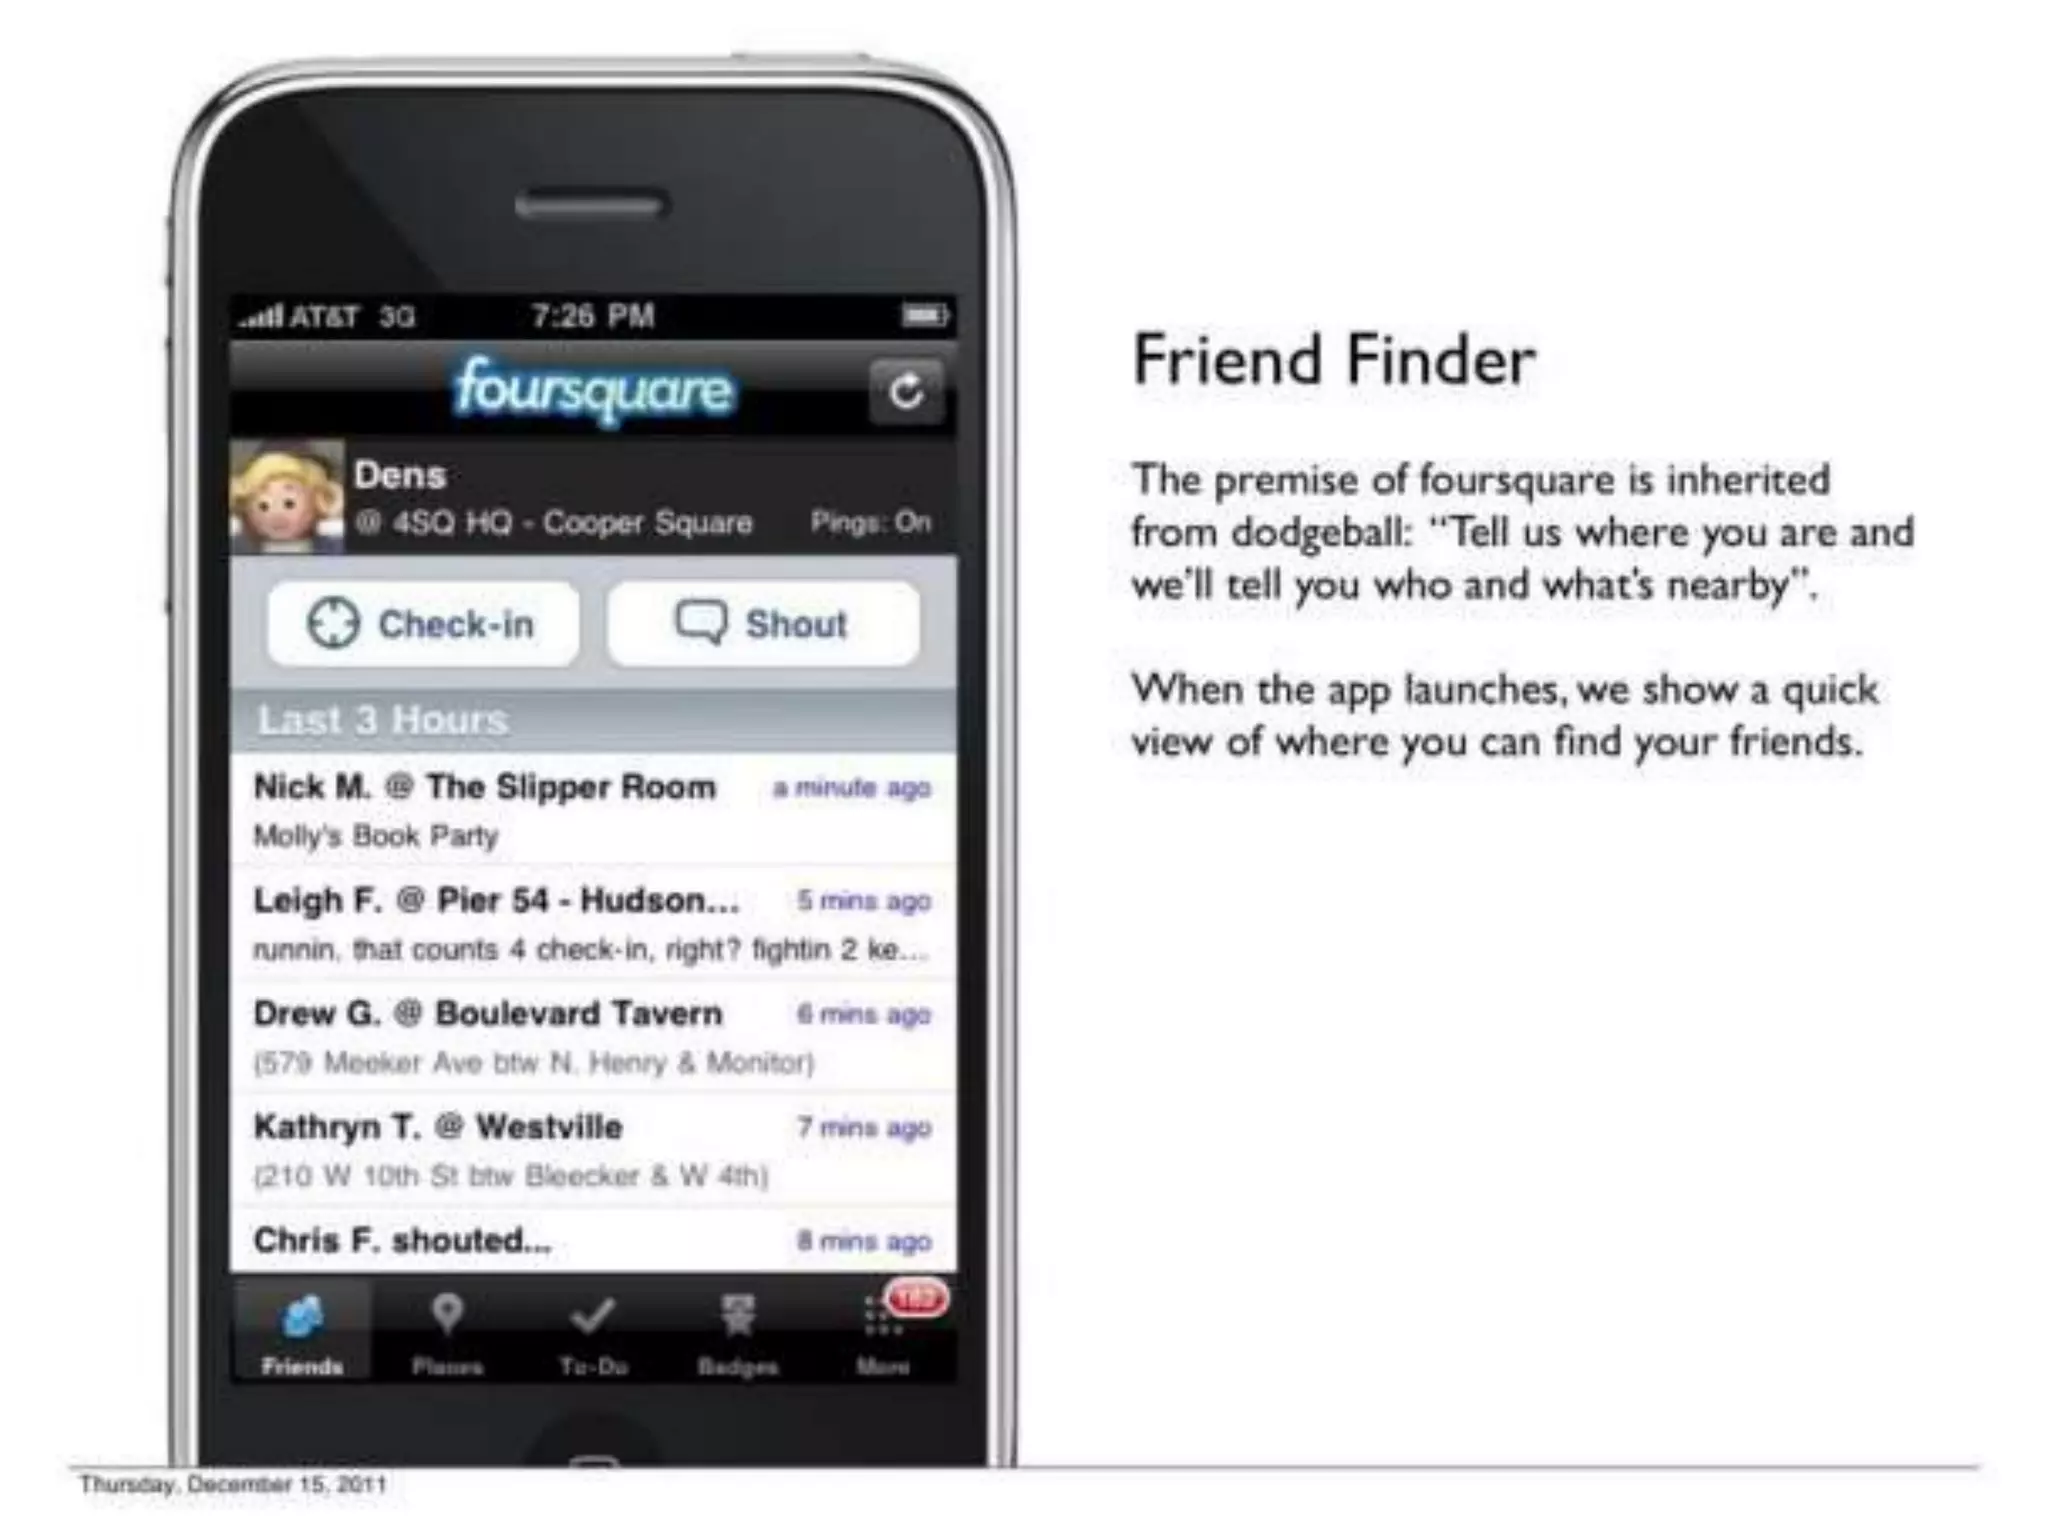
Slide 3 demonstrates the core interaction: check-ins and a near-real-time feed of where friends are. The screenshot plus a short paragraph showing the dodgeball-inspired premise ('tell us where you are and we'll tell you who's nearby') makes the immediate value palpable — users open the app and get actionable social information. Showing the live feed gives investors a feel for habitual usage and retention drivers (knowing where friends are creates recurring utility).

This slide is effective because it pairs product UI with a simple behavioral hook. Founders should mimic this: show a real UI screenshot that illustrates the simplest moment of value (what the user sees and does in the first 10 seconds) and explain the behavioral logic that drives repeat use.

Key Takeaway: Use a real product screenshot and one-line behavioral thesis to show how your app becomes habit-forming from the first interaction.
Product Differentiation: Social City Guide

Product Differentiation: Social City Guide

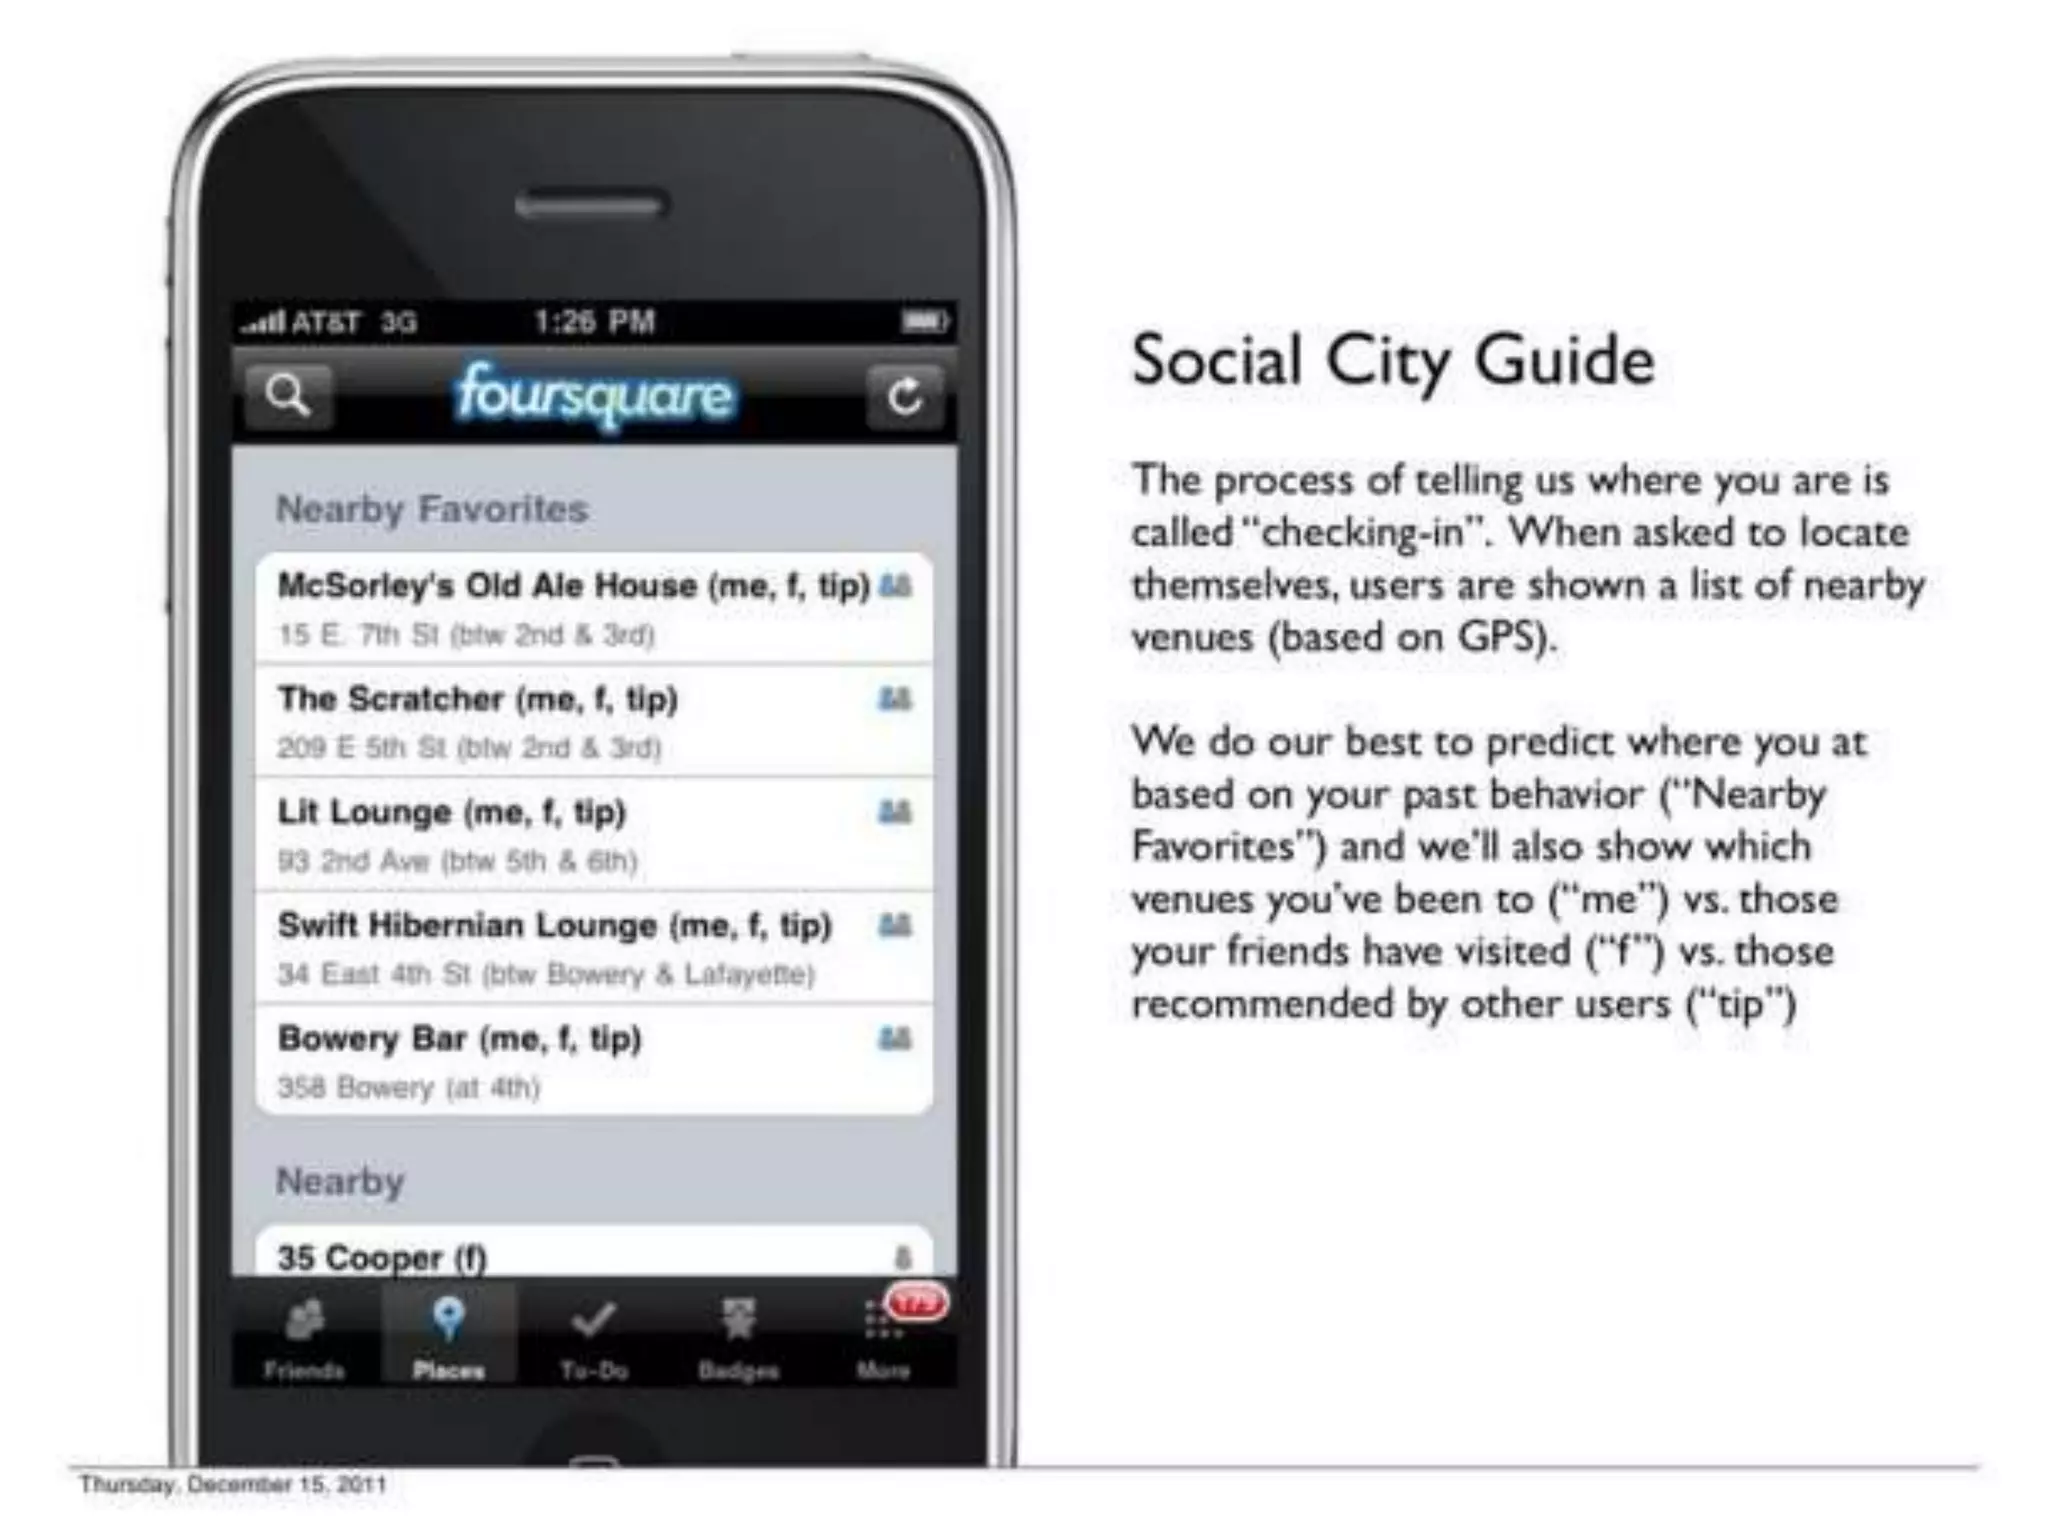
Slide 4 expands the narrative from friend-finding to discovery — how check-ins become context-aware venue suggestions and social signals ('me', 'f', 'tip'). This is where the product shifts from pure social utility to content and discovery, an important expansion of use cases that increases user engagement and session length. The slide explains predictive features (‘Nearby Favorites’) which hints at personalization and data-driven recommendations.

Founders should note how the deck layers features: after showing the core hook, it explains complementary features that broaden use and create defensibility (personalization, social proof). Explaining how signals are surfaced (past behavior, friends' visits, public tips) helps investors see pathways to differentiated product experiences.

Key Takeaway: After establishing the core hook, show adjacent features that increase engagement and build defensibility through personalization and social signals.
Game Mechanics: Check-ins, Points and Mayorships

Game Mechanics: Check-ins, Points and Mayorships

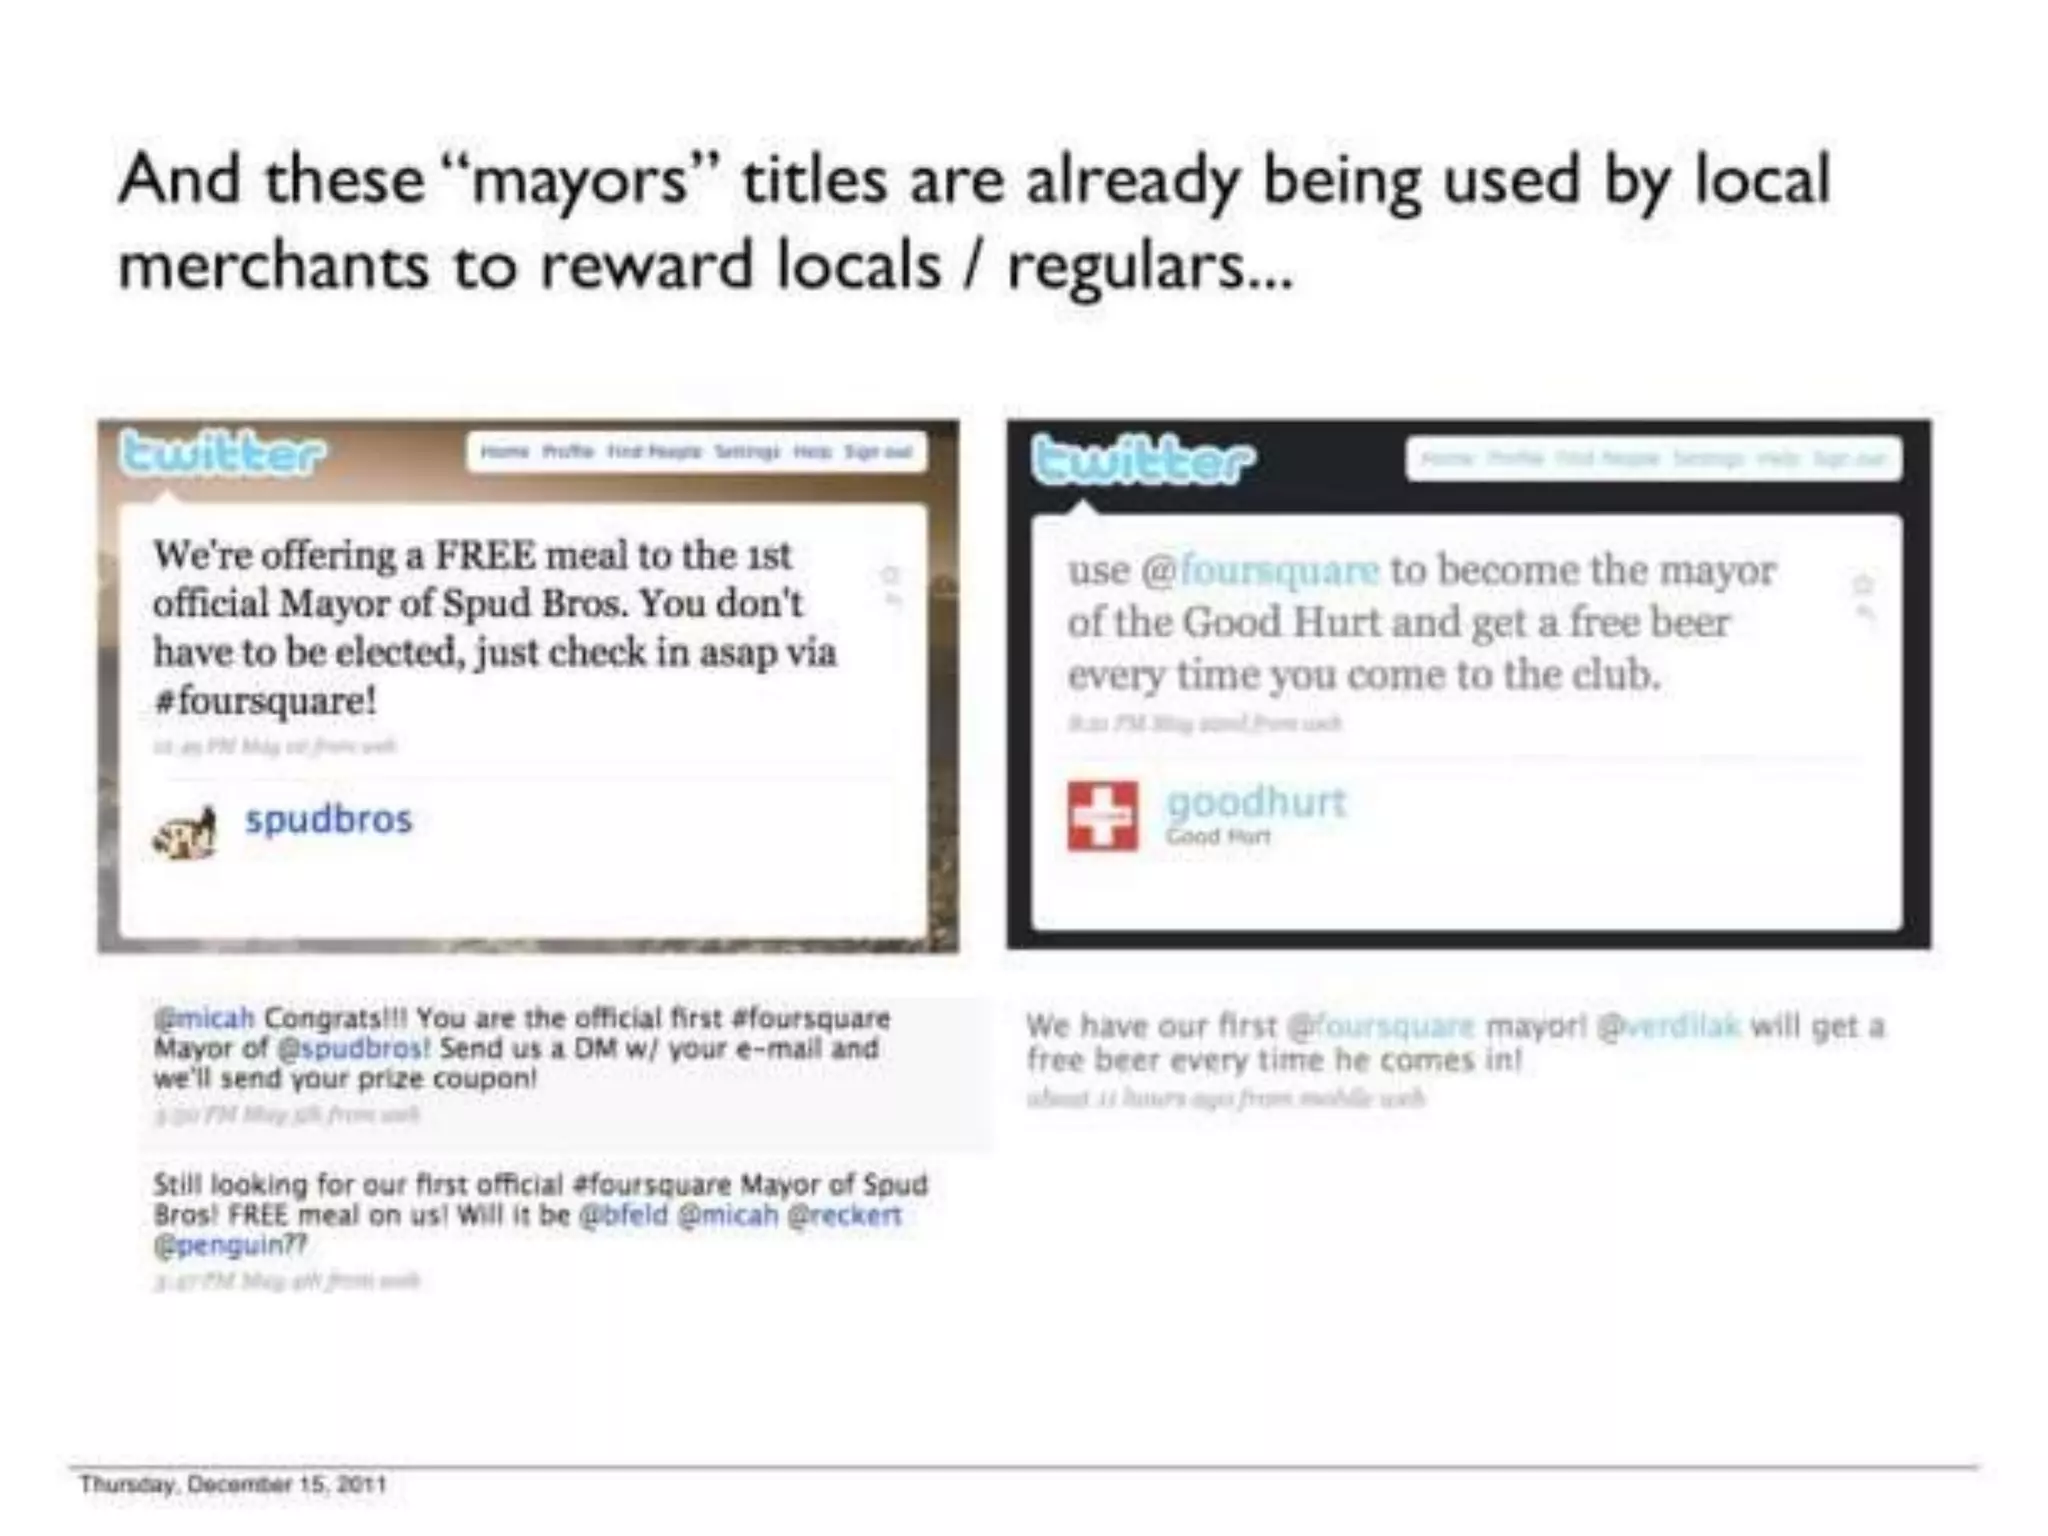
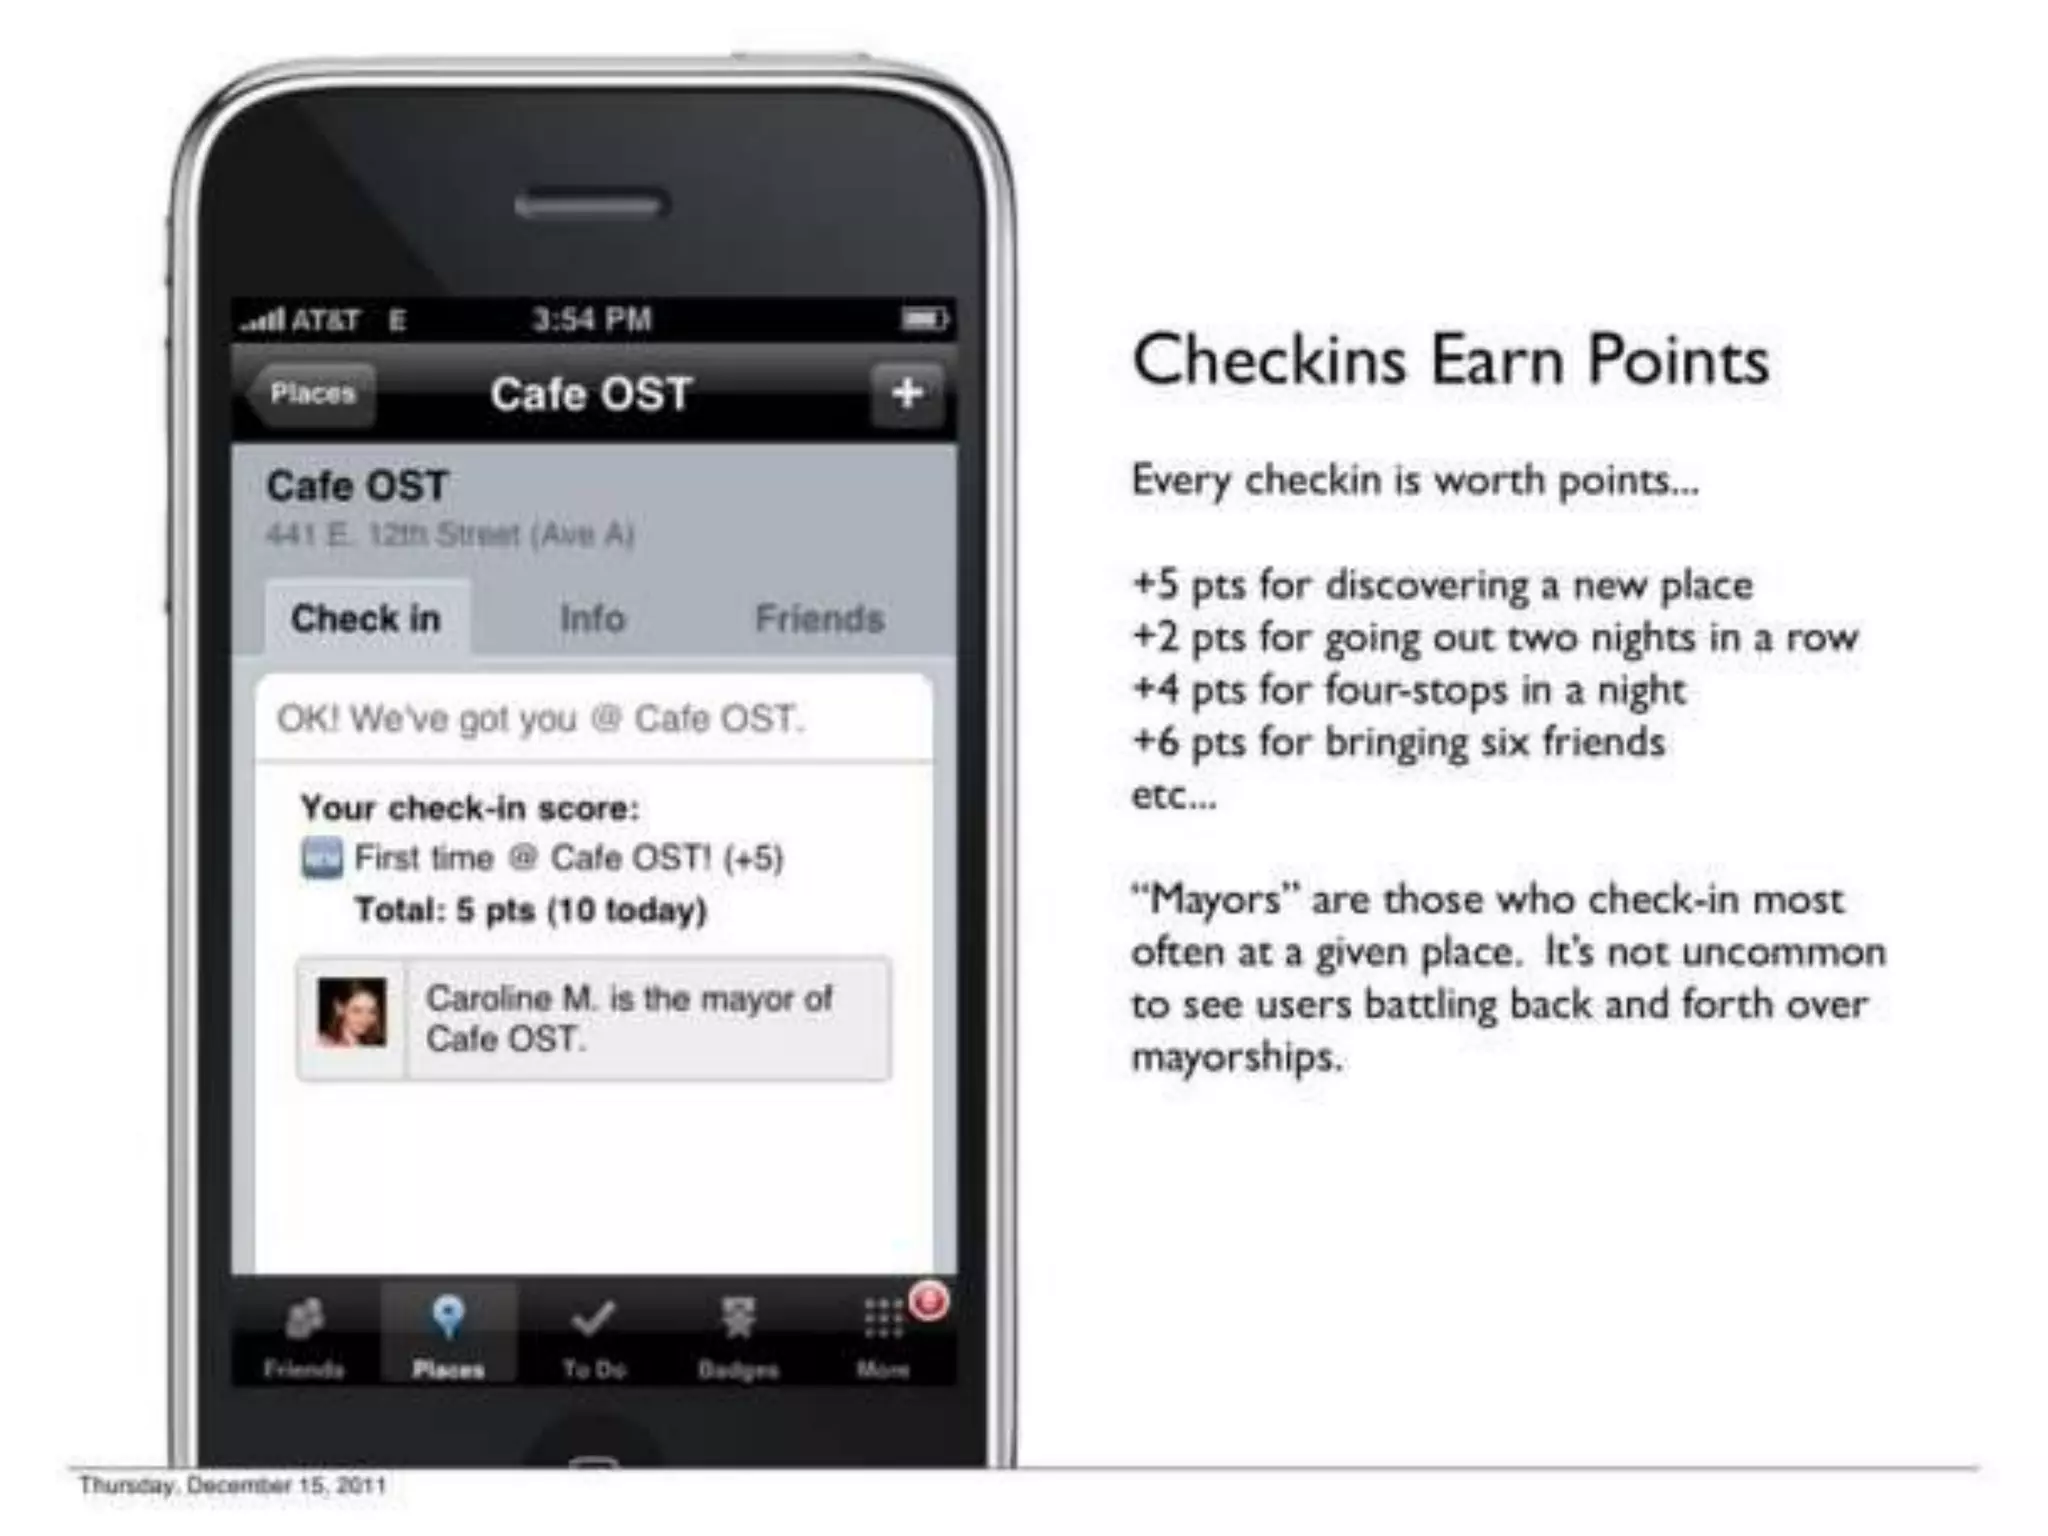
Slide 5 (Checkins Earn Points) and Slide 6 (merchant tweets about mayors) illustrate how gamification and social status drive behavior and create local incentives. The deck lists concrete point values for behaviors and describes the mayor mechanic — a simple, visible status that users compete for. Slide 6 provides immediate social proof that merchants were already rewarding mayors, turning a product mechanic into offline value for users.

These slides are compelling because they combine product mechanics with evidence of ecosystem adoption: merchants are already using mayorships as promotional hooks. Founders should emulate this by designing simple, measurable reward mechanics and showing any early third-party adoption that validates the mechanism beyond the app itself.

Key Takeaway: Design simple reward mechanics that are visible in-app and show any real-world adoption to prove the mechanic creates measurable offline value.
Retention & Social Proof: Leaderboards and Competition

Retention & Social Proof: Leaderboards and Competition

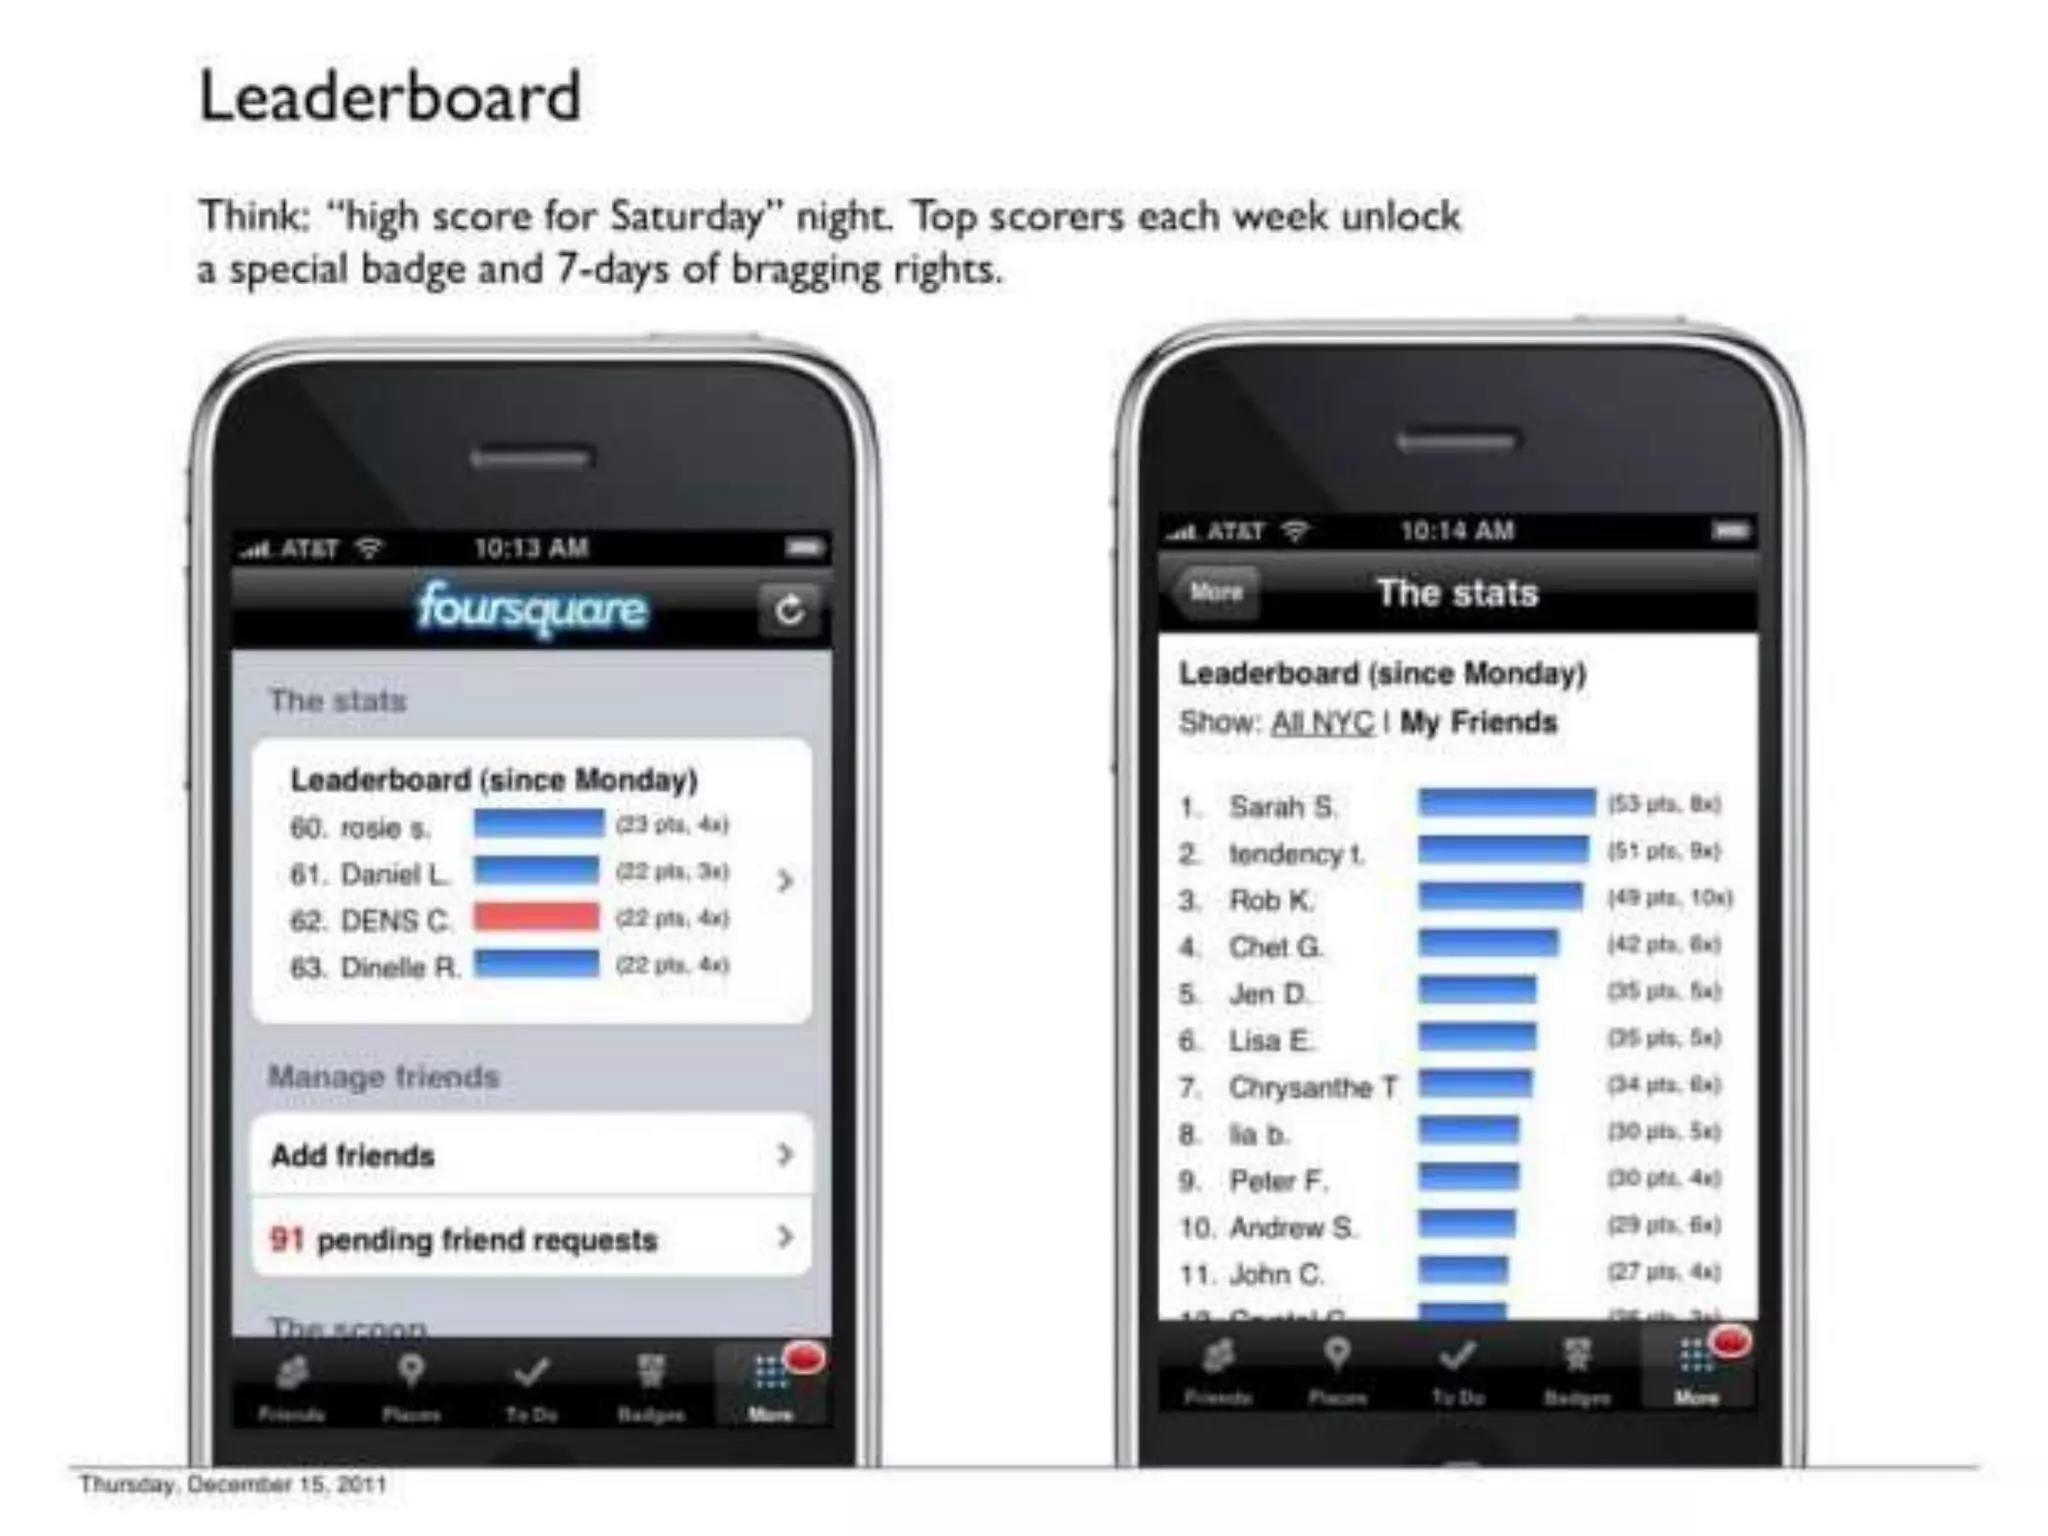
Slide 7 (Leaderboard) highlights competitive elements and social comparators — weekly leaderboards, badges, and top-scorer incentives. The slide shows both compact and full leaderboard UIs, which implies thoughtfulness about social visibility and virality (people share scores, brag, invite friends). Leaderboards and weekly competitions give users reasons to keep checking in and maintain activity rhythms.

For founders, this is a lesson in designing for social proof and repeat engagement: gamified leaderboards create recurring events (weekly competitions) and discrete goals that keep users returning. When possible, include UI examples that show how social comparisons are surfaced and how they encourage network-driven growth.

Key Takeaway: Use time-boxed competitions and visible leaderboards to create recurring engagement cycles that encourage social sharing and retention.
Monetization Strategy: Lead Generation & Sponsored Badges

Monetization Strategy: Lead Generation & Sponsored Badges

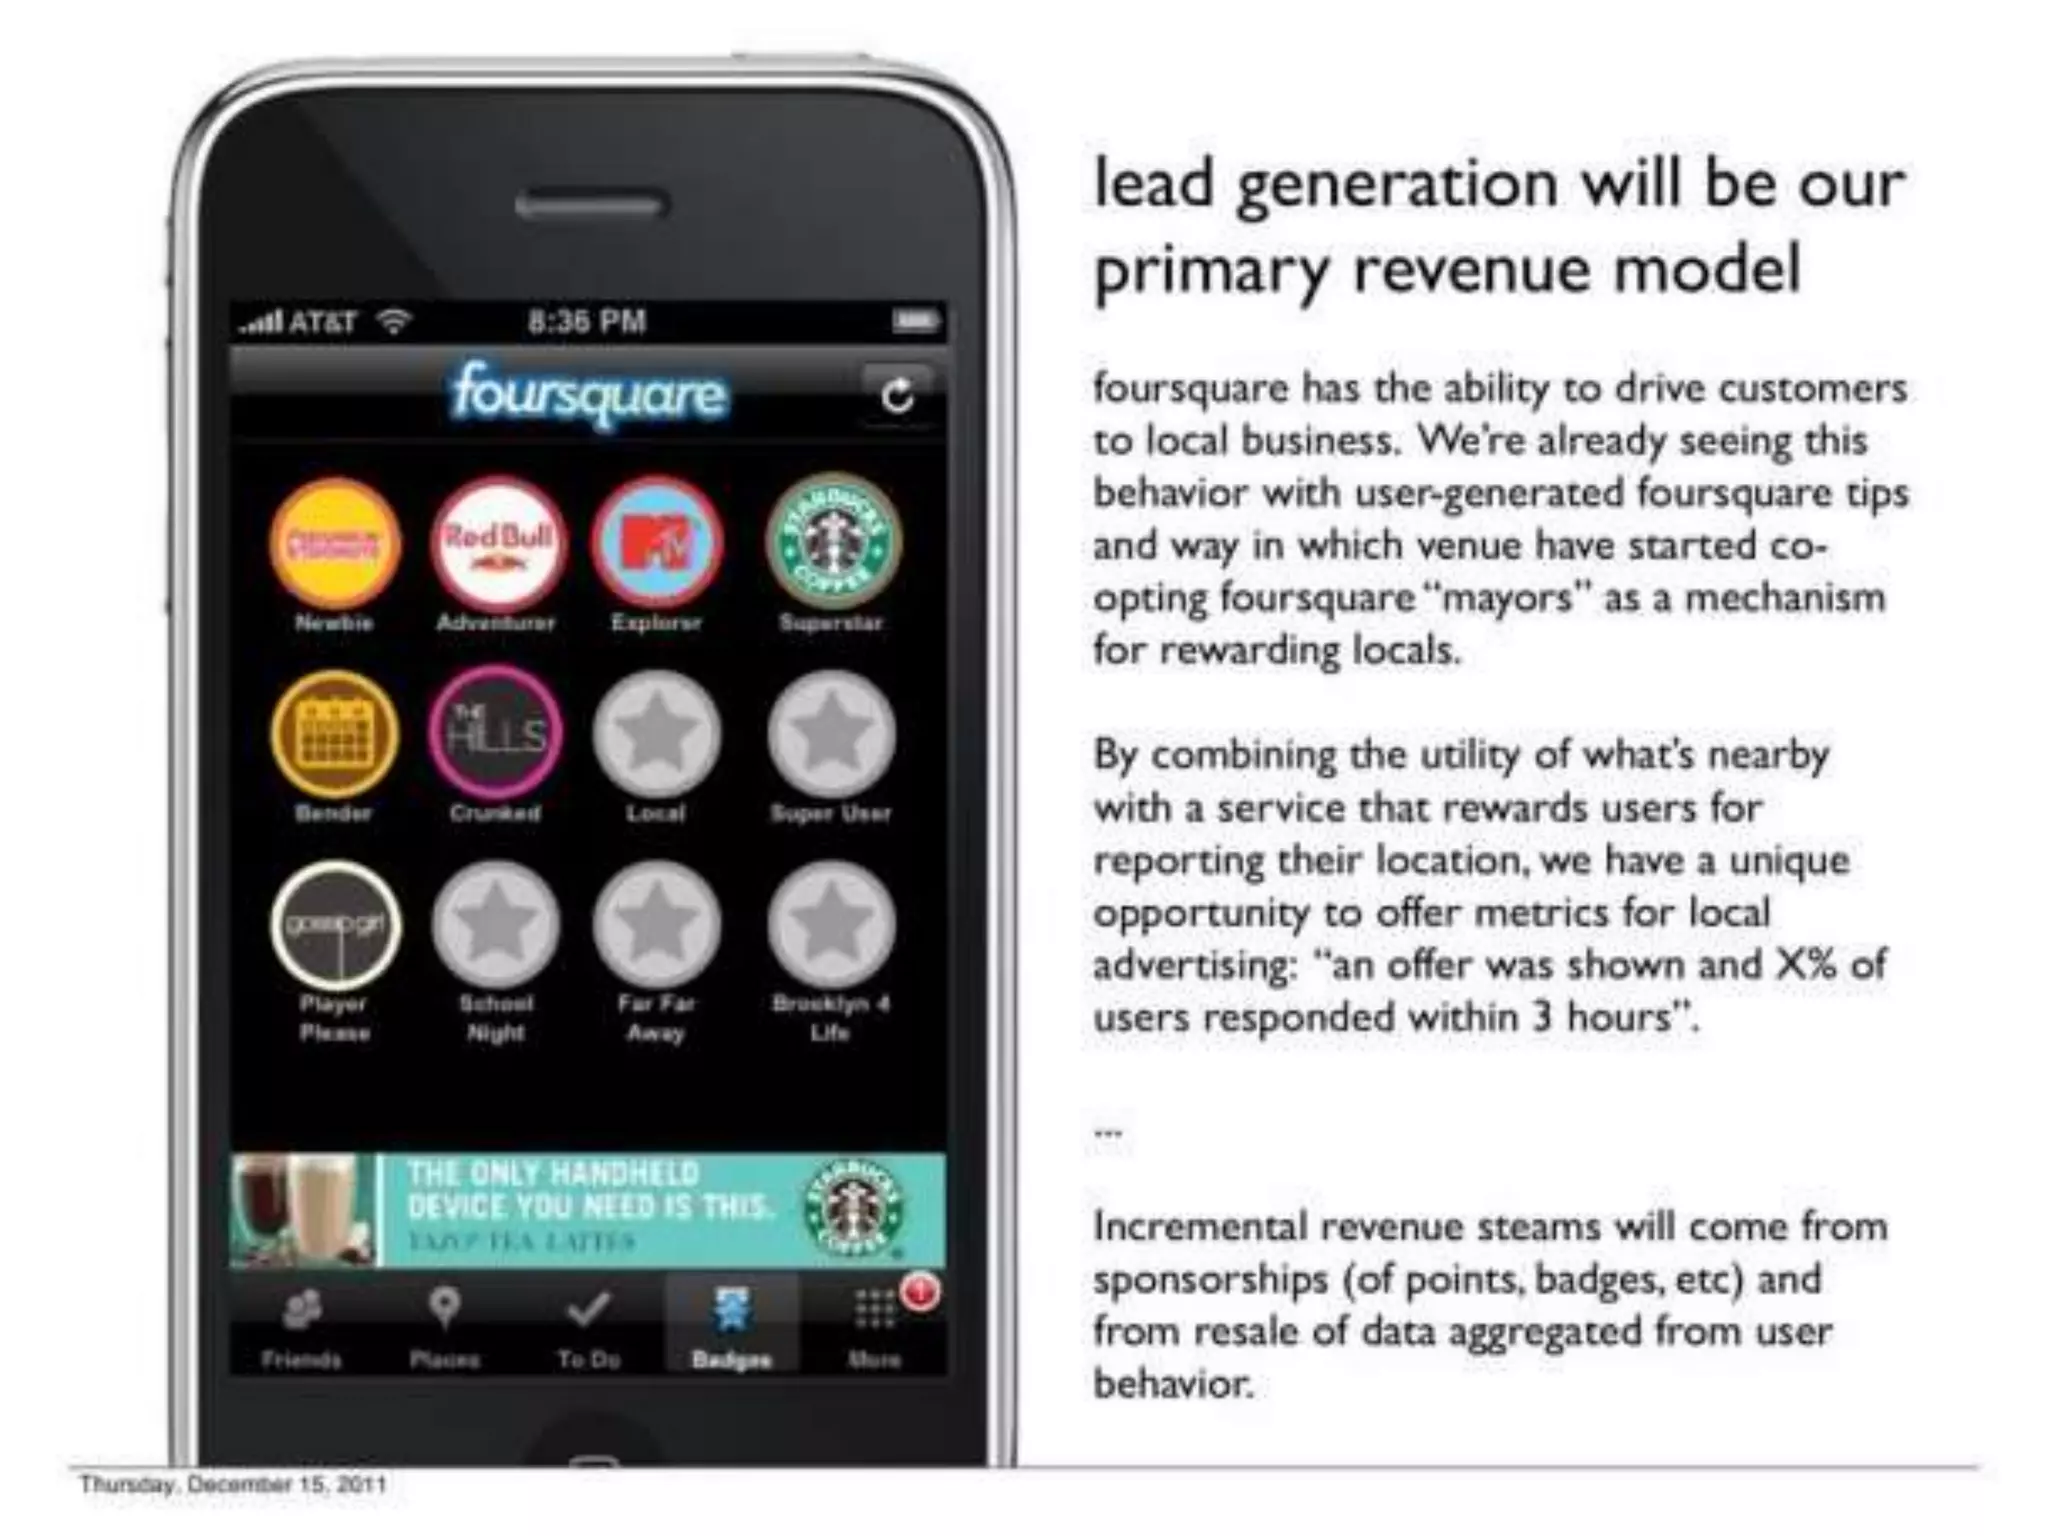
Slide 11 lays out the primary revenue hypothesis: converting ephemeral check-in intent into measurable leads for local businesses. It argues that by combining 'what's nearby' utility with reward mechanics, Foursquare can offer advertisers tight response metrics (e.g., shown an offer and X% responded). This positions the product as an advertising and local-commerce channel rather than a pure social network ad play.

This is a strong example of aligning monetization with core product behavior. Founders should align revenue with an action that users already take (in this case, check-ins) and propose measurable KPIs that matter to advertisers (impressions => responses within a timeframe). That alignment makes the revenue path credible rather than speculative.

Key Takeaway: Tie monetization directly to a core user action and present clear, measurable KPIs that demonstrate value for advertisers or partners.
Incremental Revenue: Sponsored Badges, Redeemable Points, Banners

Incremental Revenue: Sponsored Badges, Redeemable Points, Banners

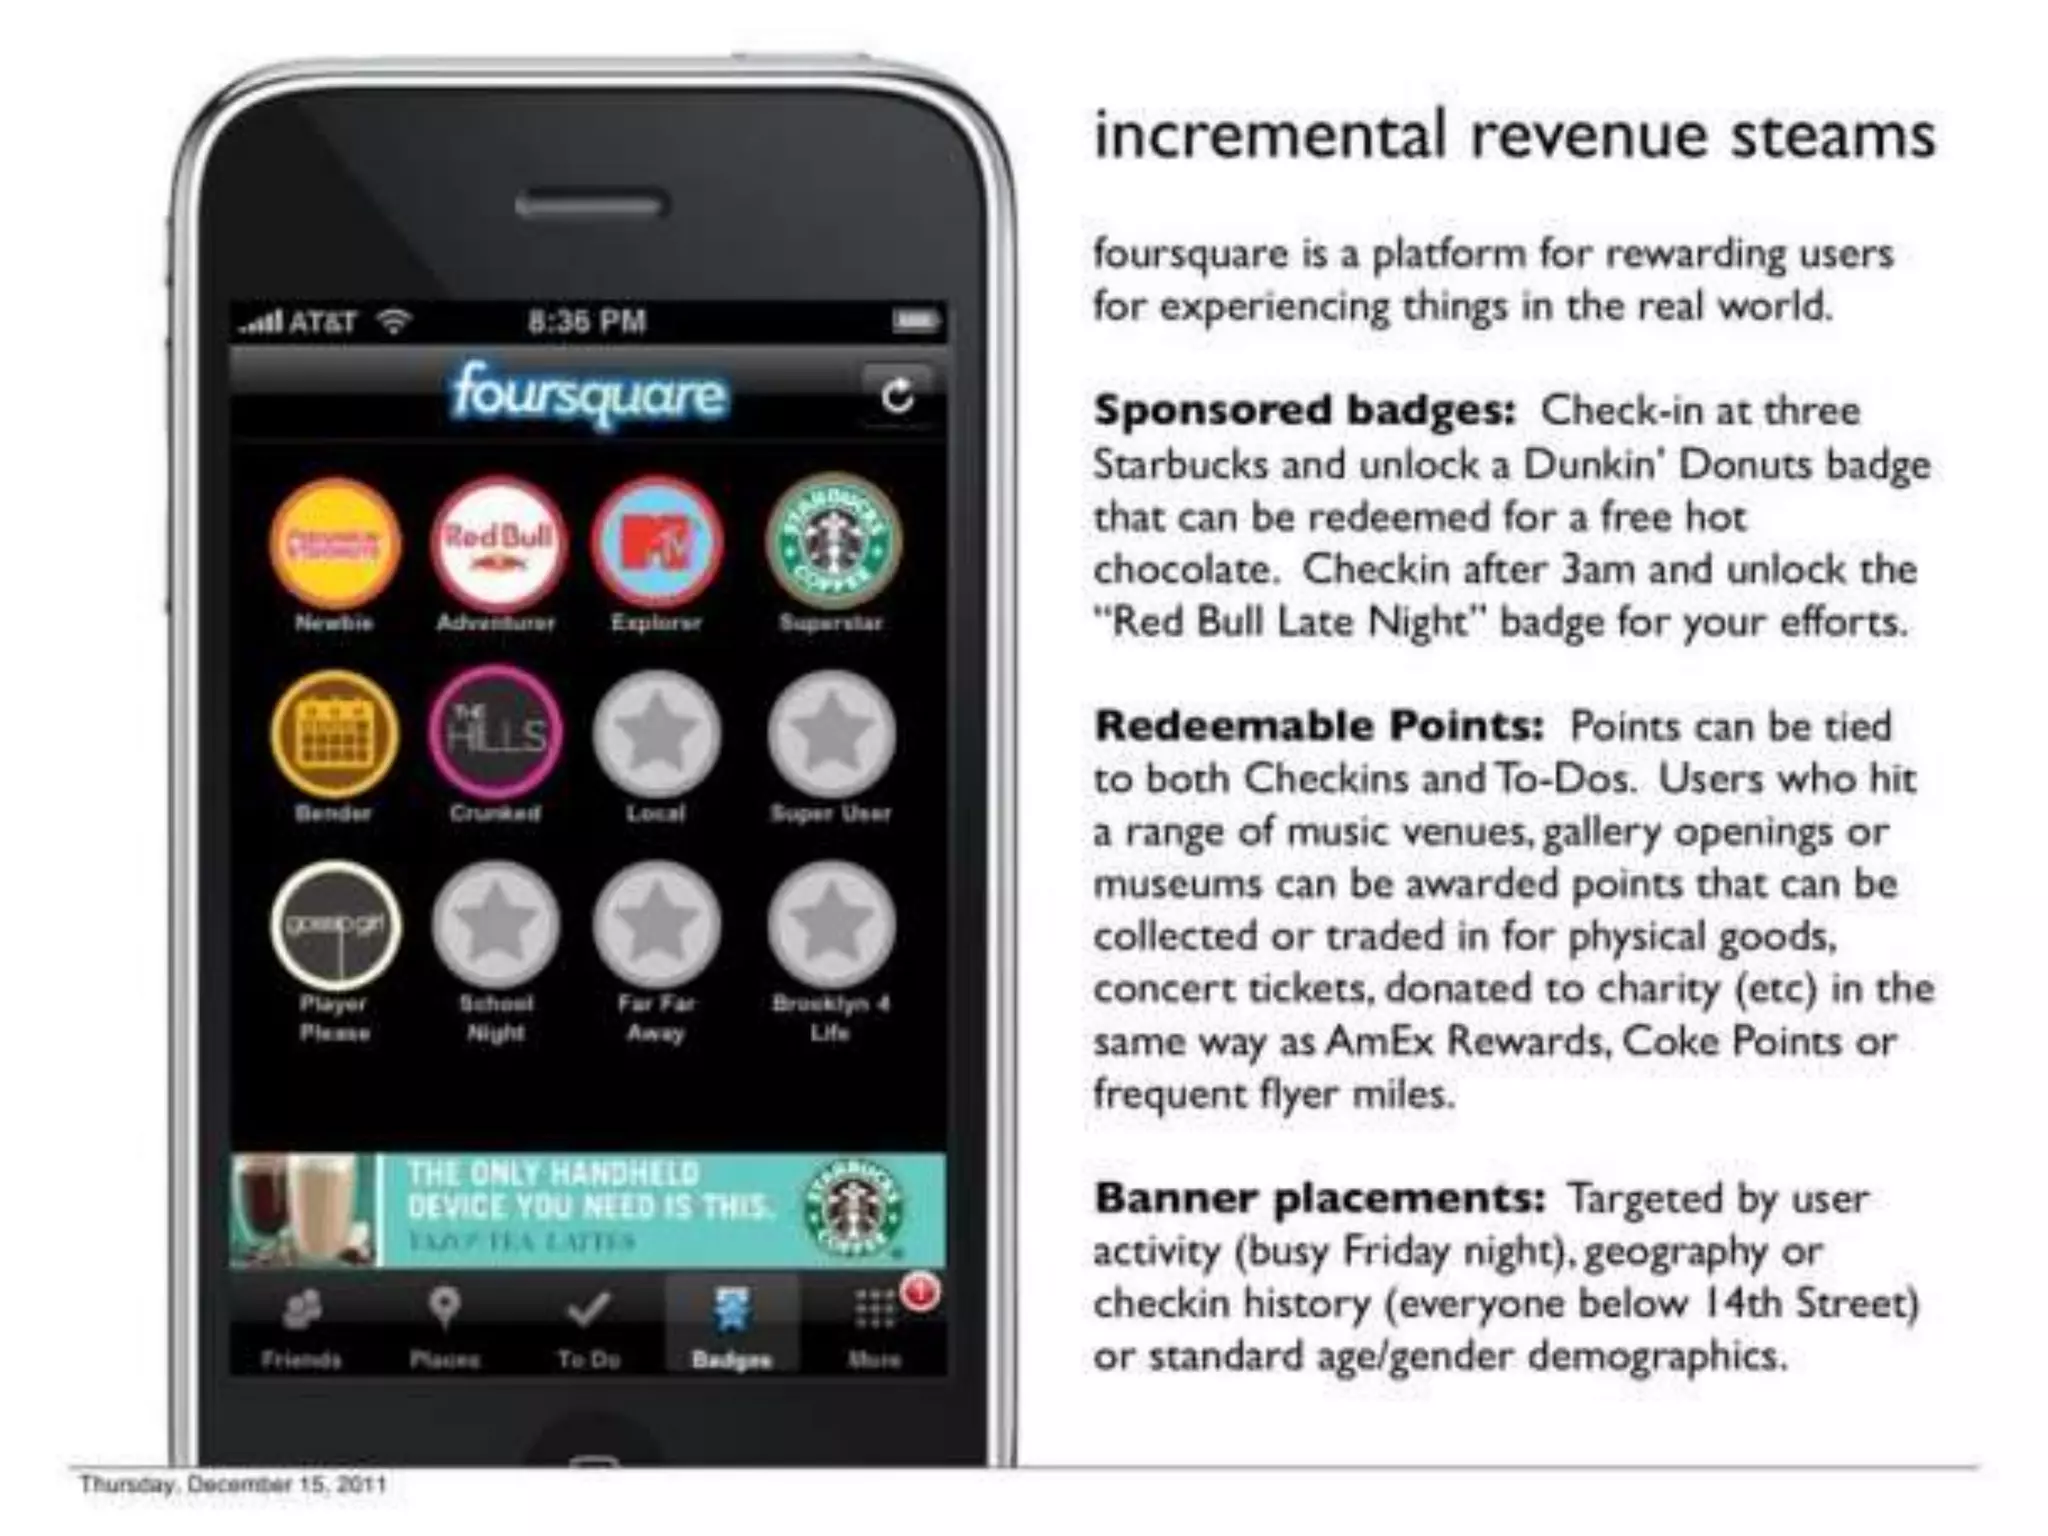
Slide 13 drills into incremental revenue streams: sponsored badges, redeemable points, and targeted banner placements. Each concept maps to product behaviors — badges for visits, points for collections, banners for targeted times/locations — and suggests potential sponsor relationships (brands, local businesses). The slide shows an early understanding of productized ad units that respect user behavior while offering measurable outcomes for sponsors.

Founders should take from this the importance of multiple, complementary monetization experiments that fit naturally into the product experience. Present several non-invasive, testable revenue ideas with examples of how they'd be tied to product events and measurement. This reduces risk and gives a roadmap for early partnerships and A/B tests.

Key Takeaway: Propose multiple monetization experiments that align with natural product events and are easy to measure and test with partners.

Conclusion: Key Lessons

Foursquare's seed deck is an exemplar of product-led storytelling: it opens with crisp positioning, shows the simplest user moment of value with real UI, layers gamification and social mechanics to drive retention, and ties monetization directly to the core behavior (check-ins). The deck balances user-focused narrative with credible business models and early evidence of third-party adoption (merchants rewarding mayors), which together reduce investor risk.

Actionable advice for founders: lead with clear positioning and a screenshot that shows the 'a-ha' moment; design and present product mechanics that create habitual behavior; show any third-party validation early; and propose monetization that maps directly to user actions with measurable KPIs. Finally, include a few incremental, low-friction revenue experiments — sponsors, redeemable points, targeted placements — so investors can see both immediate and scalable paths to revenue.

Full Deck Analysis

11 sections

Overview

Company: Foursquare
Round: Seed ($1.3M)
Year: 2009
Outcome: Pivoted to B2B, valued at $400M
Pitch Date: July 6, 2009

Executive Summary

Foursquare’s 2009 seed pitch presents a location-based social platform that combines friend-finding, city discovery, and gamification to drive user engagement and merchant foot traffic. The deck is notable for its sophisticated multi-stakeholder positioning (users, merchants, brands), concrete product demonstrations with real user data, and early proof of merchant adoption—all from a 2-person team. While the pitch lacks quantified user metrics and financial projections, it effectively demonstrates product-market fit through organic merchant participation and establishes a clear lead-generation revenue model that would later evolve into the B2B analytics business that drove the company’s $400M valuation.

Problem Statement

The deck doesn’t explicitly articulate a problem statement but implies several interconnected challenges:

  1. Friend Coordination (Slide 3): Users struggle to find friends in real-time while out in the city
  2. Venue Discovery (Slide 4): Existing solutions (Google Maps, Yelp) don’t provide personalized, social recommendations for nearby venues
  3. Merchant Customer Acquisition (Slide 6): Local businesses lack efficient mechanisms to identify and reward loyal customers
  4. Location Data Monetization (Slide 11): Brands have no way to reach users actively seeking experiences in specific locations with measurable ROI

The pitch assumes a mobile-first audience (iPhone era, 2009) and NYC-centric early adopters who value social experiences and exploration.

Solution

Foursquare is positioned as a multi-faceted platform serving three distinct user groups:

For End Users (Slides 3-10):

  • Friend Finder: Real-time location sharing shows where friends are and what they’re doing nearby
  • Social City Guide: GPS-based venue discovery with personalized recommendations (me/f/tip categorization)
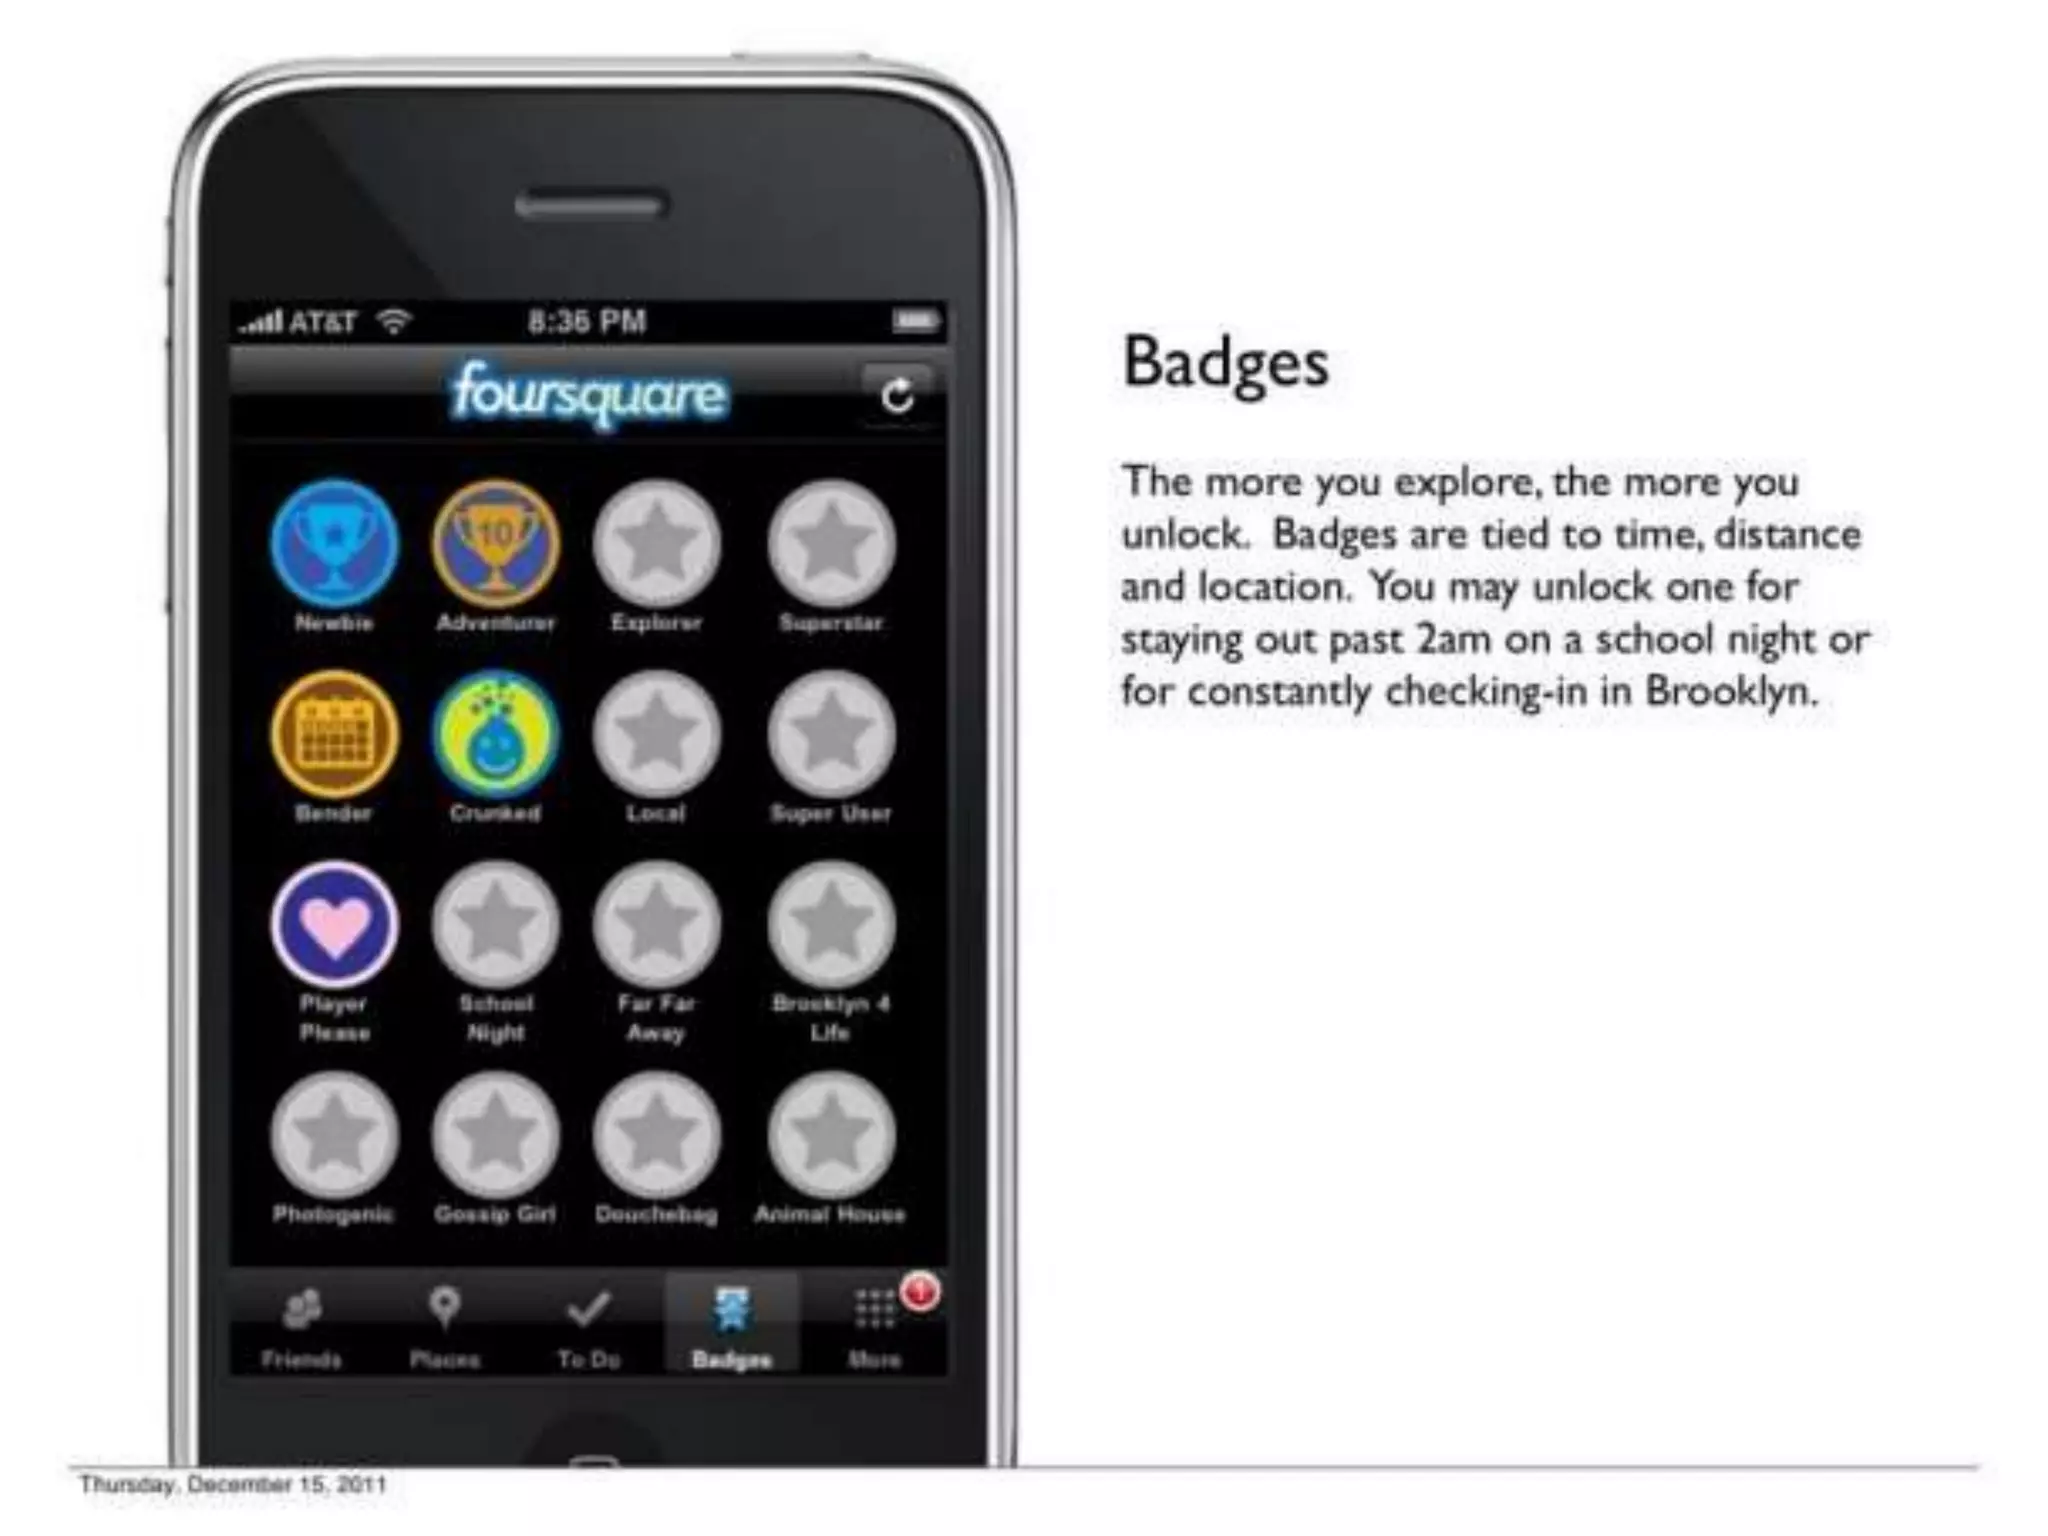
  • Gamification System: Points, badges, and mayoralty titles incentivize exploration and repeat visits
  • Social Leaderboards: Weekly competitions drive engagement and viral sharing
  • User-Generated Tips: Twitter-style recommendations from friends and nearby users

For Merchants (Slide 6):

  • Mayoralty system creates natural loyalty program mechanics
  • Ability to offer rewards tied to check-in behavior
  • Early examples show merchants independently creating offers (Spud Bros, Good Hurt)

For Brands/Advertisers (Slides 11-12):

  • Lead generation platform driving foot traffic to venues
  • Sponsored badges and points tied to brand experiences
  • Targeted banner placements based on user behavior, geography, and demographics
  • Measurable ROI metrics (“offer shown, X% response in 3 hours”)

Technical Implementation (Slide 2):

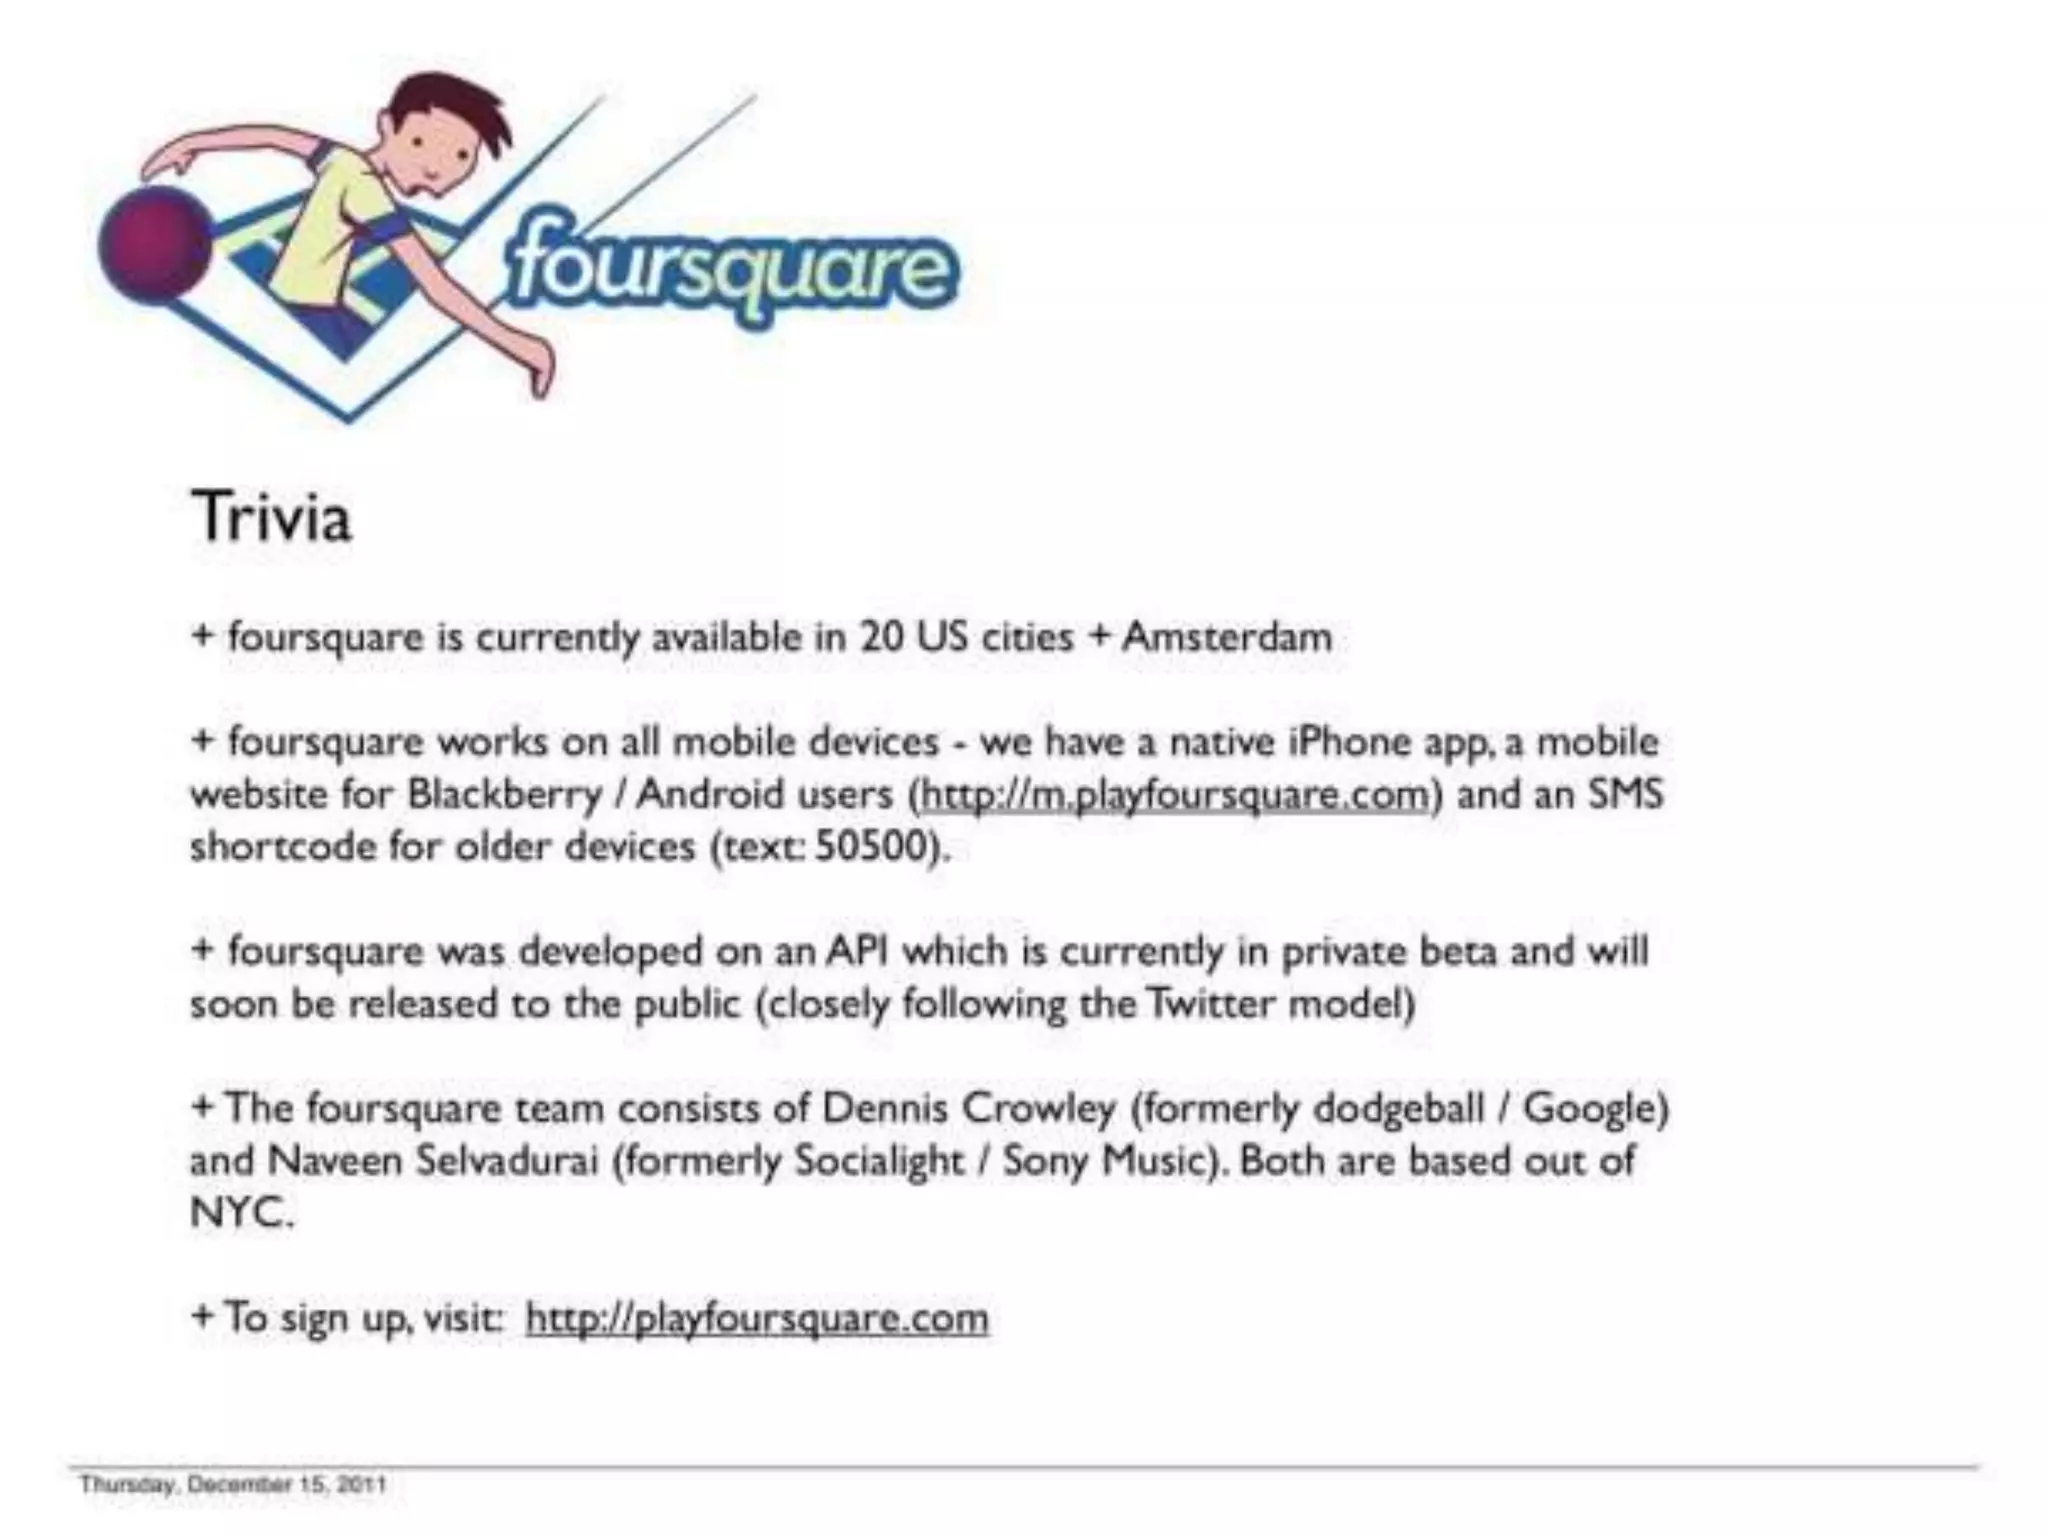
  • iPhone native app (primary)
  • Website (profile/stats)
  • SMS service (text 50500)
  • API (private beta, Twitter-model release planned)

Market Opportunity

The deck does not provide explicit TAM/SAM/SOM analysis, which is a notable gap. However, implicit market signals include:

Geographic Reach (Slide 15):

  • Currently live in 20 US cities + Amsterdam
  • Suggests expansion strategy beyond NYC launch

Platform Addressability (Slide 15):

  • iPhone app (premium segment)
  • Mobile web (BlackBerry/Android)
  • SMS (feature phone users)
  • Indicates broad addressable market across device types

Merchant Opportunity (Slide 6):

  • Early organic adoption by local venues (Spud Bros, Good Hurt, etc.)
  • Suggests significant TAM in local business marketing/loyalty
  • No quantification of total addressable merchants provided

Brand Advertising Market (Slides 11-12):

  • References comparable loyalty programs (AmEx Rewards, Coke Points, frequent flyer miles)
  • Implies multi-billion dollar loyalty/rewards market
  • No specific market sizing provided

Critical Gap: The deck lacks any quantified market opportunity analysis, which would be expected in a modern seed pitch. This suggests either: (a) market size was assumed obvious to investors in 2009, or (b) the team prioritized product demonstration over market analysis.

Business Model

Primary Revenue Stream: Lead Generation (Slide 11)

  • Foursquare drives users to local businesses
  • Merchants pay for customer acquisition/foot traffic
  • Pricing model not specified (CPC, CPA, flat fee unclear)
  • Proof of concept: Merchants already using mayoralty for rewards (Spud Bros, Good Hurt)

Secondary Revenue Streams (Slide 12):

  1. Sponsored Badges & Points
    • Brands sponsor achievement unlocks
    • Example: Check-in 3x at Starbucks → unlock Dunkin’ Donuts badge → redeem for free hot chocolate
    • Example: Check-in after 3am → unlock Red Bull Late Night badge
    • Brands pay for user engagement and brand association
  2. Redeemable Points
    • Points tied to check-ins and to-do completions
    • Users redeem for physical goods, concert tickets, or charity donations
    • Model comparable to AmEx Rewards, Coke Points, frequent flyer miles
    • Foursquare likely takes margin on redemptions
  3. Data Monetization (Slide 11)
    • “Resale of data aggregated from user behavior”
    • Enables targeting by: activity patterns, geography, demographics, check-in history
    • Specific pricing/volume not disclosed

Unit Economics: Not provided. No data on:

  • Customer acquisition cost (CAC)
  • Lifetime value (LTV)
  • Average revenue per user (ARPU)
  • Merchant/brand pricing
  • Redemption rates or margins

Monetization Timing: Unclear when each revenue stream would activate. Deck focuses on user engagement first, monetization second.

Traction & Metrics

User Engagement Data (Slides 7, 14):

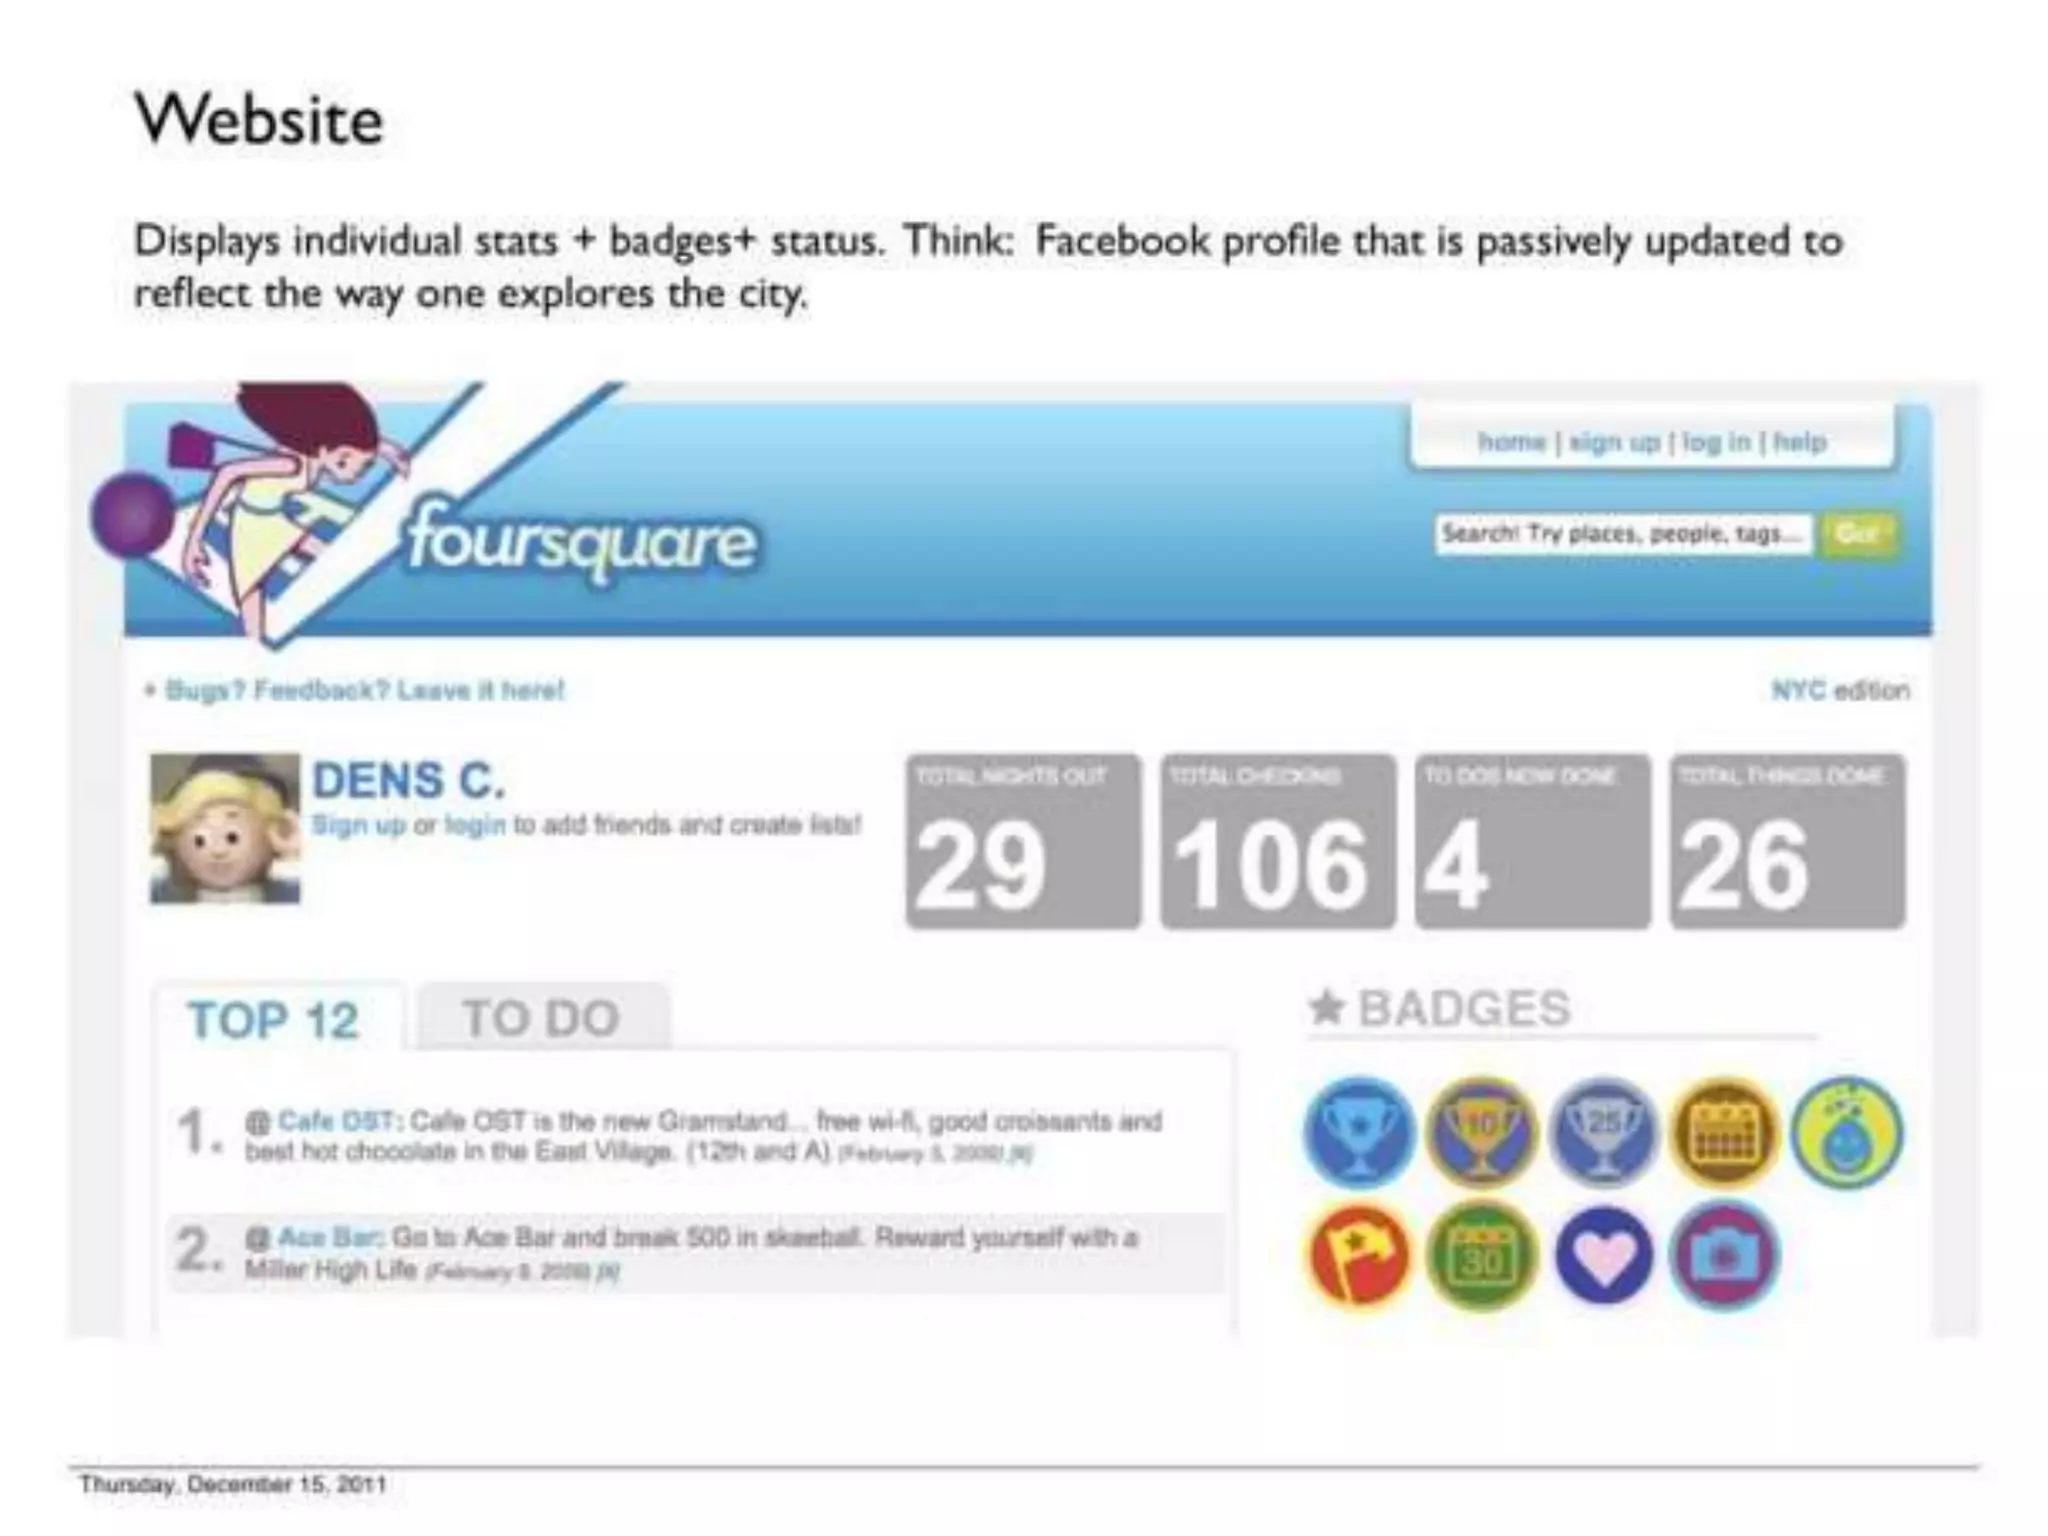
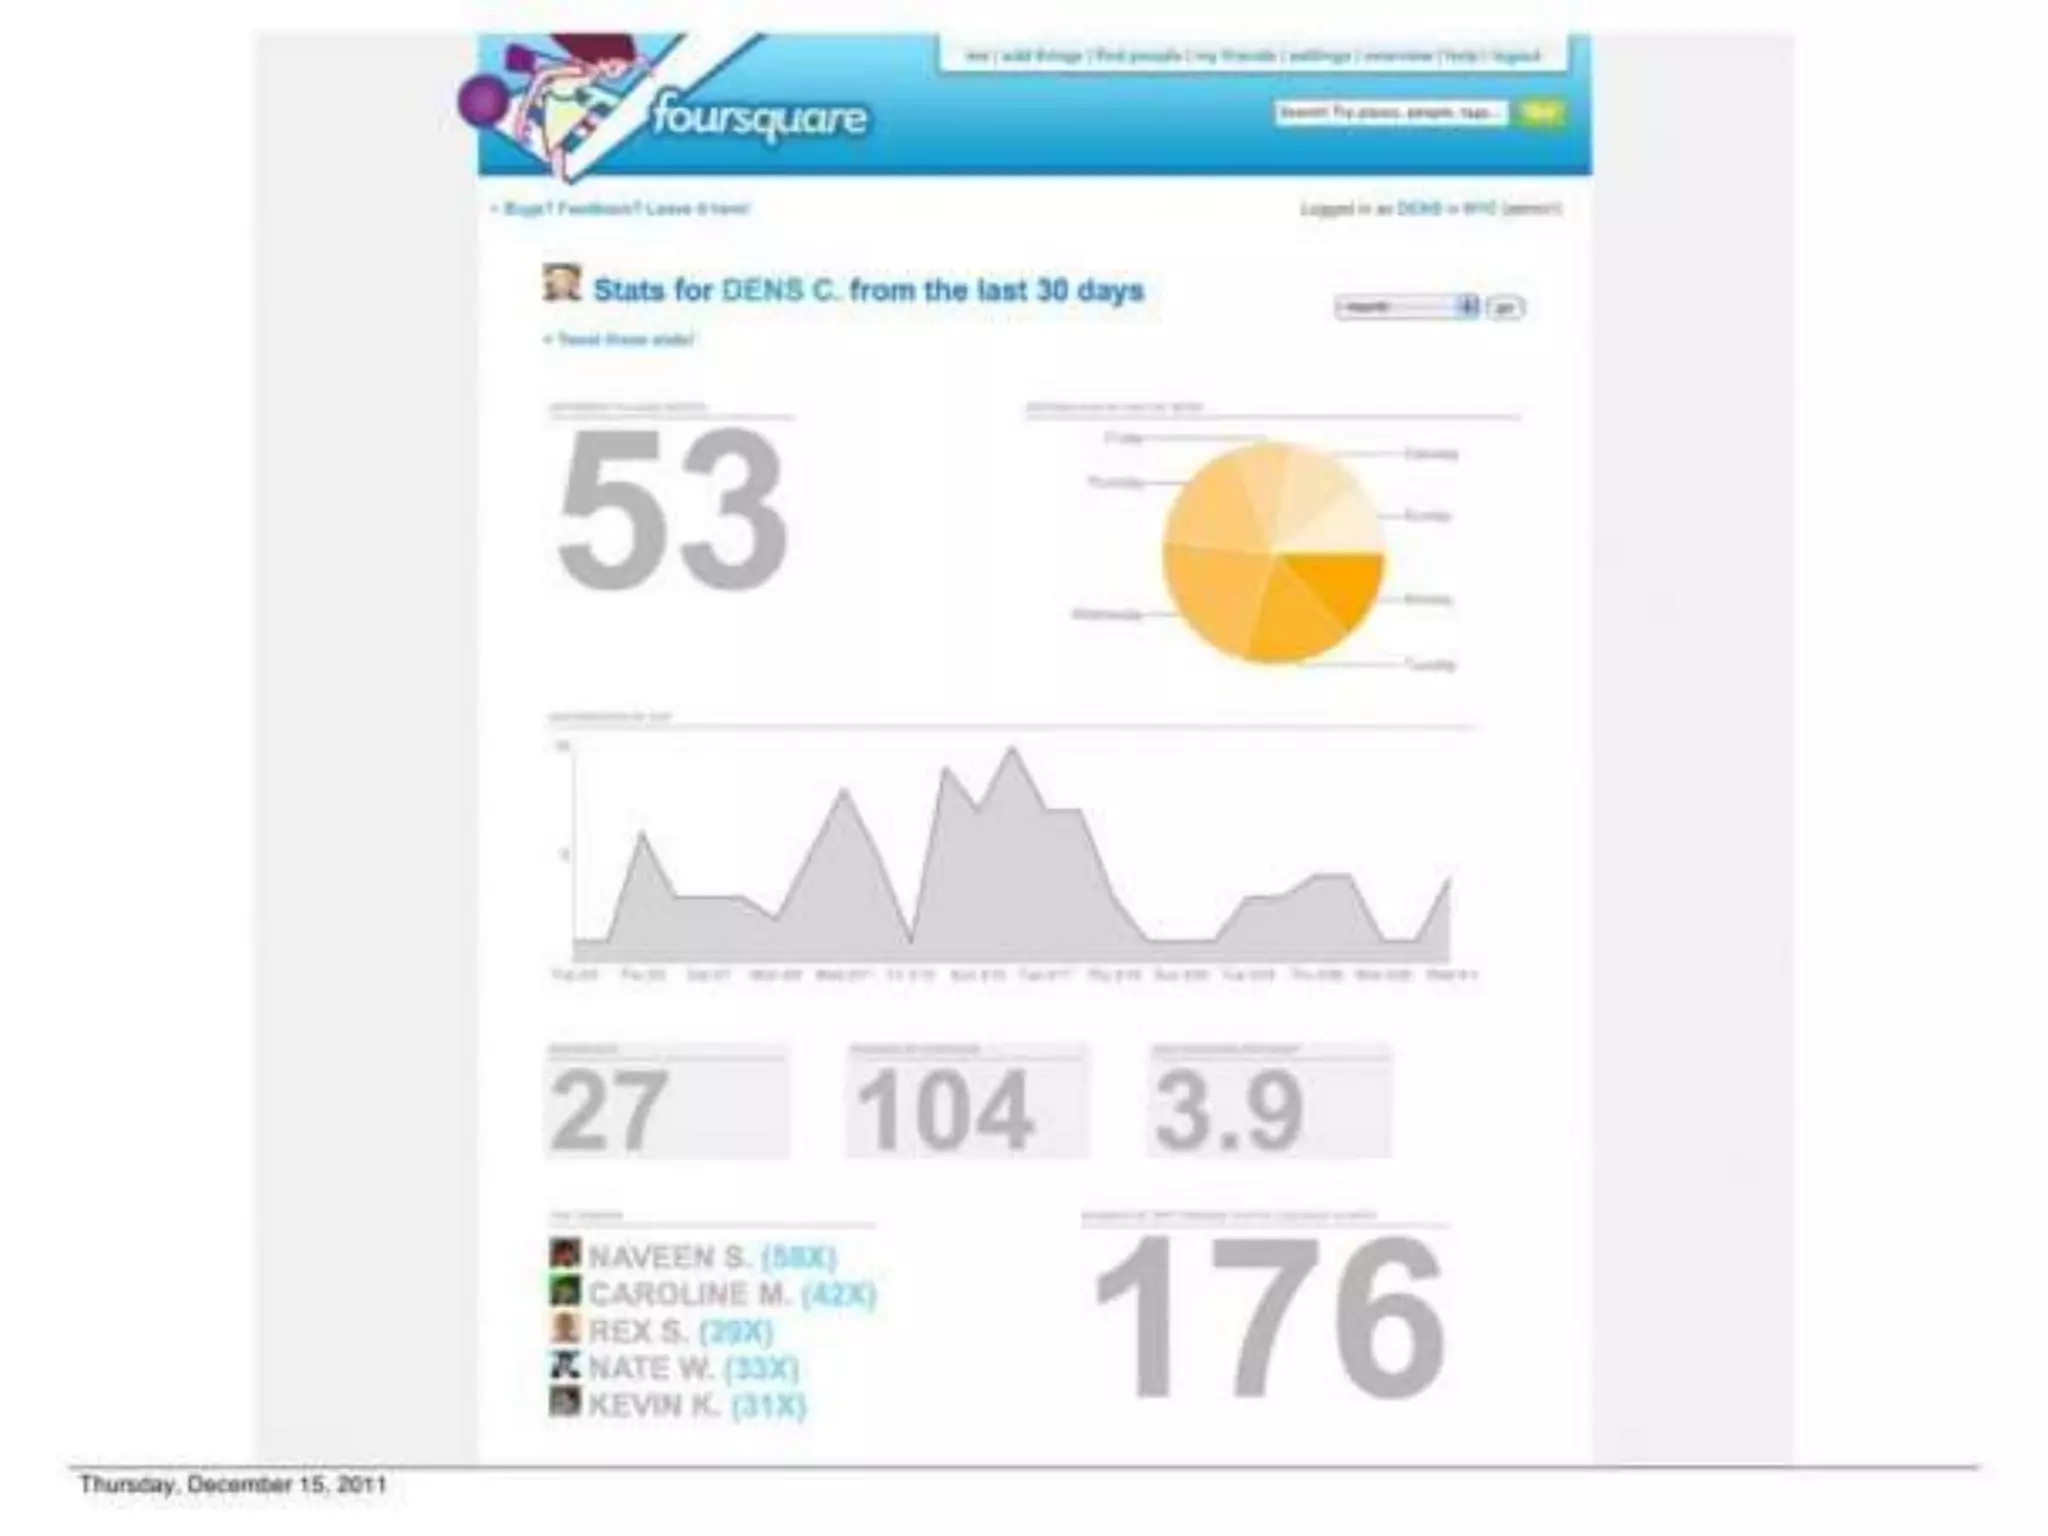
  • Founder (DENS C.) stats from 30-day period:
    • 53 check-ins (30 days)
    • 27 unique venues
    • 104 total check-ins (all-time)
    • 3.9 average check-ins per day
    • 176 total points
  • Top friend (Naveen S.) with 43 check-ins in period
  • 91 pending friend requests (strong network growth signal)

Leaderboard Activity (Slide 7):

  • Weekly leaderboard with 60+ ranked users
  • Top scorer (Sarah S.) with 53 points in week
  • Indicates active user base competing for status

Merchant Adoption (Slide 6):

  • Multiple merchants independently creating Foursquare-tied offers:
    • Spud Bros: Free meal to 1st official Mayor
    • Good Hurt: Free beer to Mayor
  • Merchants promoting via Twitter (#foursquare hashtag)
  • Indicates organic product-market fit with merchants

Geographic Expansion (Slide 15):

  • Live in 20 US cities + Amsterdam (from NYC launch)
  • Suggests successful expansion beyond initial market

Critical Gaps:

  • No total user count provided (major red flag for seed pitch)
  • No growth rate (daily/weekly/monthly active users)
  • No retention metrics (churn, DAU/MAU ratio)
  • No acquisition metrics (CAC, viral coefficient)
  • No revenue data (even early traction)
  • No cohort analysis (retention by signup date)

The deck relies heavily on qualitative proof points (real user examples, merchant adoption) rather than quantitative metrics. This suggests either: (a) user base was still very small in July 2009, or (b) the team prioritized product quality over growth metrics.

Competitive Positioning

The deck does not explicitly address competitors, which is a notable omission. However, implicit competitive positioning includes:

Vs. Yelp/Google Maps (Slide 8):

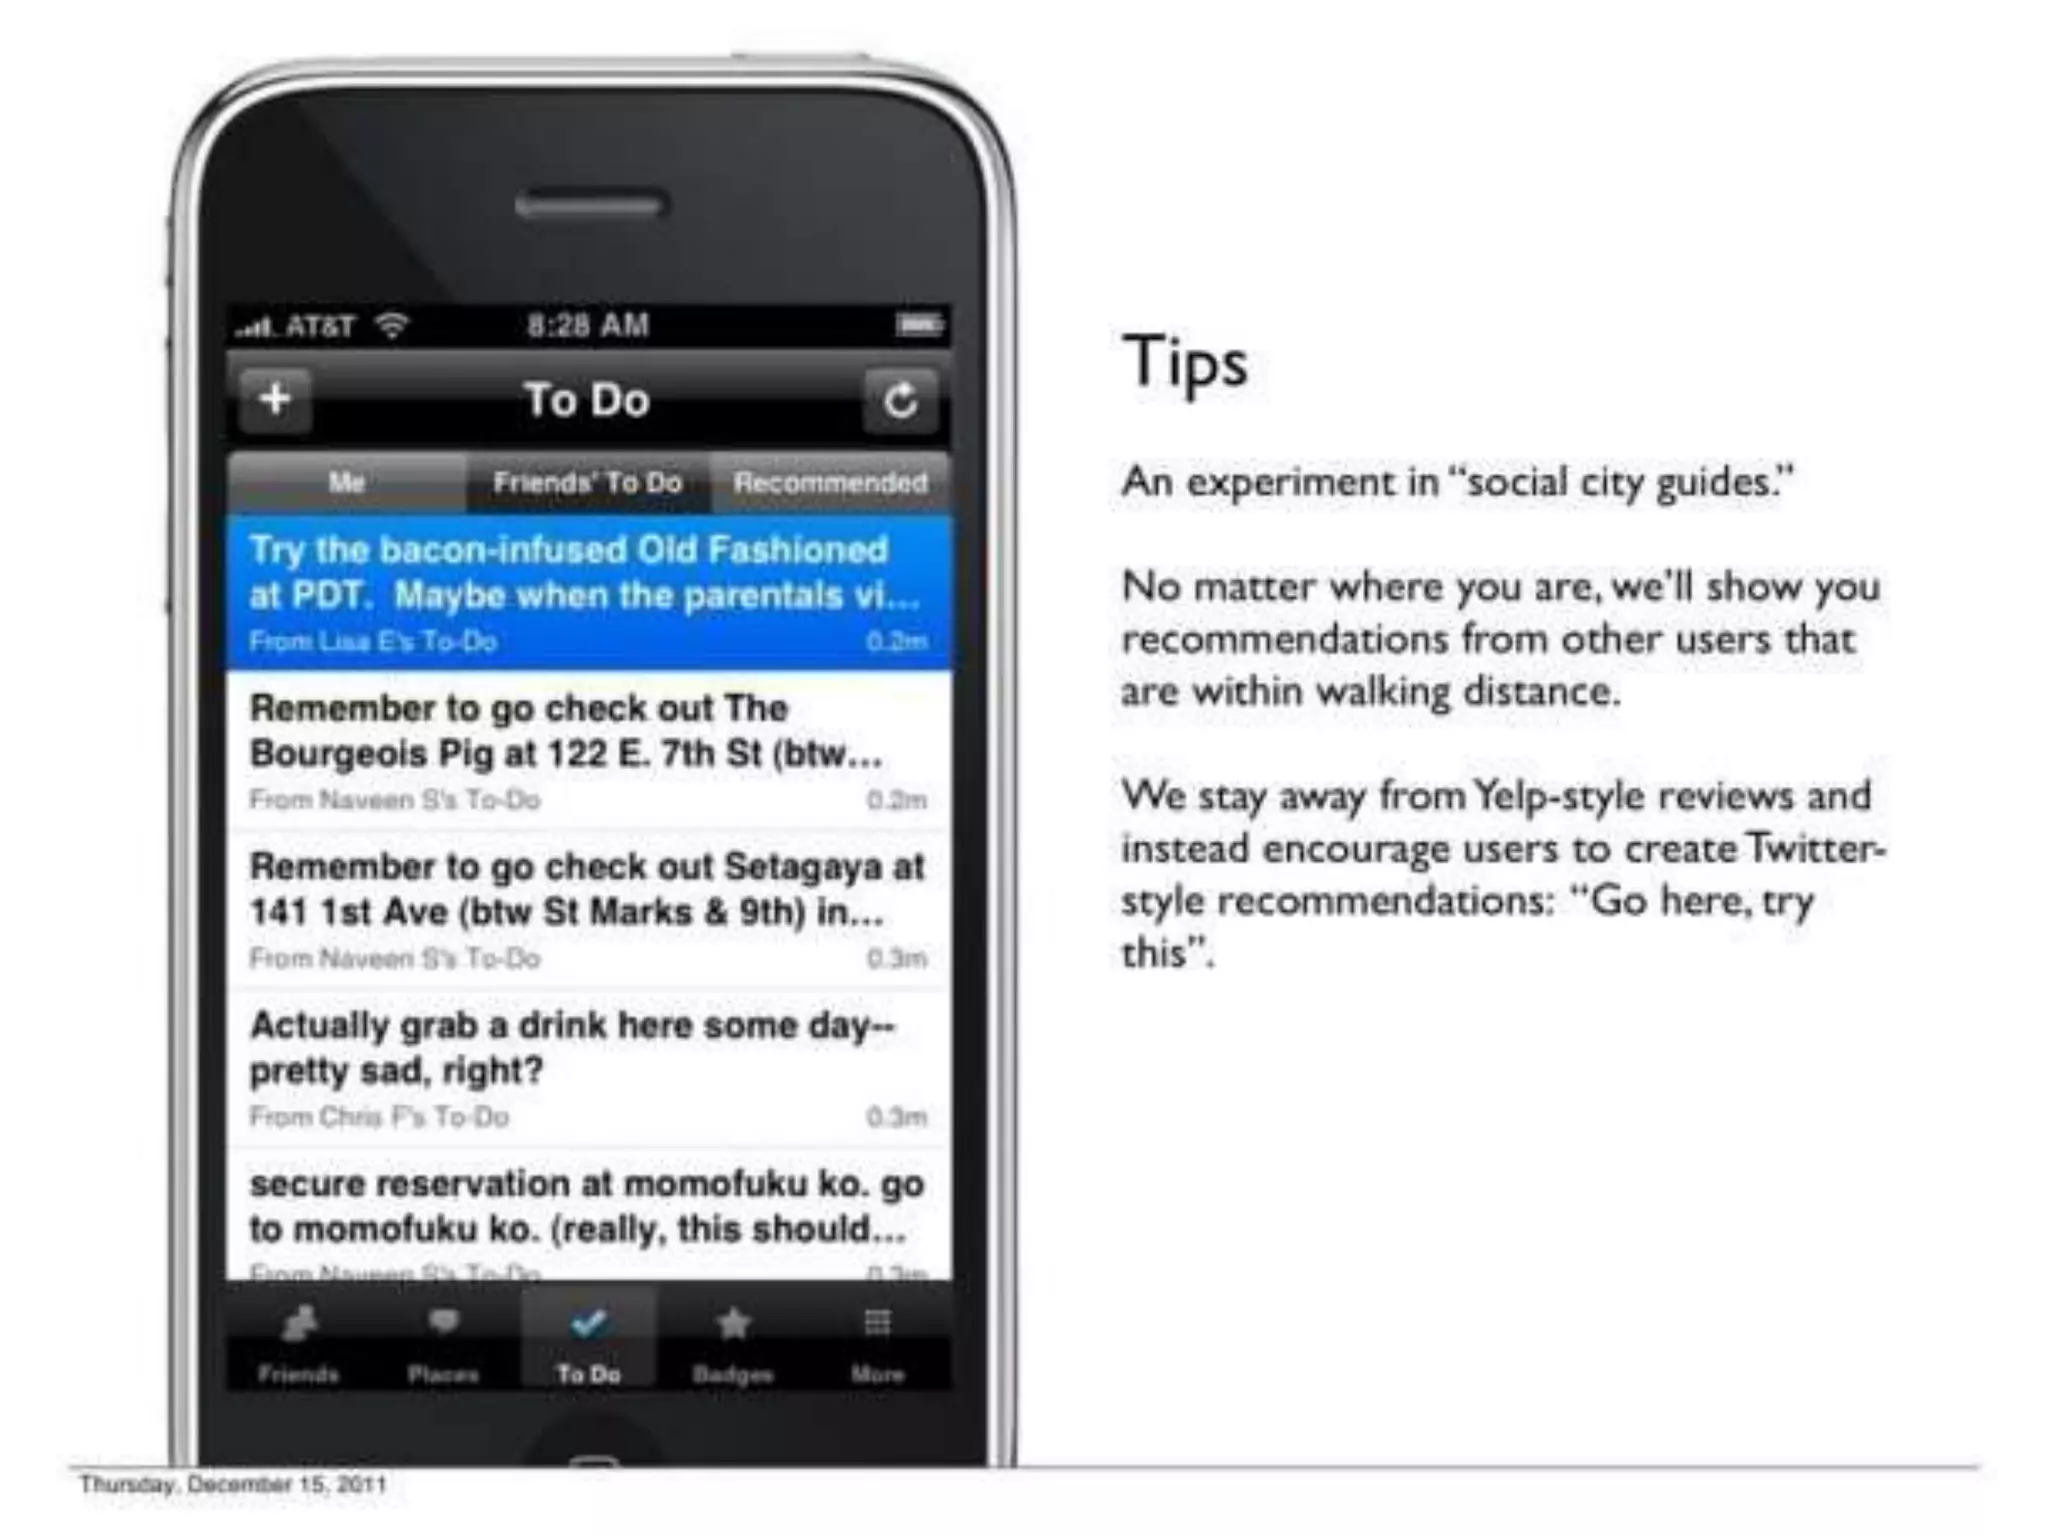
  • “We stay away from Yelp-style reviews and instead encourage users to create Twitter-style recommendations: ‘Go here, try this’”
  • Positions as social/casual vs. formal/comprehensive
  • Emphasizes friend recommendations over crowd-sourced reviews

Vs. Facebook (Slide 13):

  • “Think: Facebook profile that is passively updated to reflect the way one explores the city”
  • Positions as location-specific social graph vs. general social network
  • Implies complementary rather than competitive relationship

Implicit Competitors (not mentioned):

  • Gowalla (location check-in app, launched 2009)
  • Brightkite (location check-in app, launched 2007)
  • Google Latitude (location sharing, launched 2009)
  • Dodgeball (Dennis Crowley’s previous company, acquired by Google 2005)

Differentiation Claims:

  1. Gamification: Points, badges, mayoralty (not standard in 2009)
  2. Merchant Integration: Built-in loyalty/rewards mechanism
  3. Multi-platform: iPhone + web + SMS (broader reach than competitors)
  4. API-first: Twitter-model extensibility (forward-looking)
  5. Founder Credibility: Dennis Crowley created Dodgeball (acquired by Google)

Competitive Vulnerability:

  • Google (with Latitude + Maps + Android) could easily replicate
  • Facebook (with 300M+ users) could add location features
  • No defensible moat articulated (network effects, data, or IP)

Team

Dennis Crowley (Co-founder)

  • Background: Created Dodgeball (location check-in service acquired by Google in 2005)
  • Experience: Worked at Google post-Dodgeball acquisition
  • Credibility: Proven founder with successful exit; deep domain expertise in location services
  • Role: Implied CEO/product lead (email: [email protected])

Naveen Selvadurai (Co-founder)

  • Background: Socialight (social location service), Sony Music
  • Experience: Music/entertainment industry background
  • Credibility: Product/design expertise; understanding of entertainment/lifestyle market
  • Role: Implied CTO/engineering lead

Team Size: 2 people (Slide 2, 15)

  • Location: NYC-based
  • Advisors/Board: Not mentioned (potential gap)

Assessment:

  • Strengths: Both founders have relevant domain experience; successful exit (Crowley); complementary skills (product + engineering)
  • Weaknesses: Very small team for execution; no mention of advisors or board support; limited operational/business experience shown; no CFO or business development lead mentioned

Go-to-Market Strategy

The deck does not explicitly outline a GTM strategy, but implicit approach includes:

User Acquisition (Implied):

  • NYC-centric launch (Slides 3-14 show NYC venues exclusively)
  • Early adopter focus (tech-savvy, iPhone users, nightlife/dining scene)
  • Viral mechanics (leaderboards, badges, mayoralty encourage sharing)
  • Multi-platform accessibility (iPhone + web + SMS reduces friction)
  • 91 pending friend requests (Slide 7) suggests word-of-mouth growth

Merchant Acquisition (Slide 6):

  • Organic adoption (merchants discovering Foursquare independently)
  • Twitter promotion (#foursquare hashtag)
  • No paid merchant acquisition mentioned
  • Suggests grassroots, community-driven approach

Brand/Advertiser Acquisition (Slides 11-12):

  • Not addressed in deck
  • Likely requires direct sales team (not mentioned)
  • Sponsorship model suggests partnership/business development approach

Expansion Strategy (Slide 15):

  • Launched in NYC, expanded to 20 US cities + Amsterdam
  • Suggests city-by-city rollout (vs. national launch)
  • No specific expansion timeline or criteria provided

Critical Gaps:

  • No paid acquisition strategy mentioned
  • No partnership strategy articulated
  • No PR/marketing plan shown
  • No sales team structure for merchant/brand sales
  • No customer success/support plan

The Ask

Funding Amount: $1.3M seed round (stated in overview)

Use of Funds: Not explicitly detailed in deck

Implied Use of Funds (based on context):

  • Engineering (API development, multi-platform support)
  • Product (feature development, content/venue database)
  • Operations (team expansion, office)
  • Merchant/brand sales (if pursuing B2B revenue)
  • Marketing/user acquisition (if pursuing growth)

Valuation: Not stated in deck (typical seed rounds in 2009 were $500K-$2M at $3-10M post-money valuations)

Critical Gap: The deck does not include a “The Ask” slide specifying funding amount, use of funds, or valuation. This is a notable omission from a modern pitch deck perspective, though may have been standard practice in 2009.

Investor Deep Dive

Executive summary, strengths & red flags

Executive Summary

Foursquare's 2009 seed pitch presents a location-based social platform that combines friend-finding, city discovery, and gamification to drive user engagement and merchant foot traffic. The deck is notable for its sophisticated multi-stakeholder positioning (users, merchants, brands), concrete product demonstrations with real user data, and early proof of merchant adoption—all from a 2-person team. While the pitch lacks quantified user metrics and financial projections, it effectively demonstrates product-market fit through organic merchant participation and establishes a clear lead-generation revenue model that would later evolve into the B2B analytics business that drove the company's $400M valuation.

Key Strengths

6 identified

1

Exceptional Product Demonstration with Real User Data

- Slides 3-10 show actual working product with real user names, venues, and engagement metrics (not wireframes or mockups)

2

Organic Merchant Adoption Proof Point

- Slide 6 shows merchants independently discovering Foursquare and creating offers without company prompting

3

Sophisticated Multi-Stakeholder Positioning

- Slide 2 articulates distinct value propositions for users, merchants, and brands

4

Founder Credibility with Domain Expertise

- Dennis Crowley created Dodgeball (acquired by Google); Naveen Selvadurai from Socialight/Sony Music

5

Clear Monetization Path with Multiple Revenue Streams

- Slides 11-12 articulate three distinct revenue models (lead generation, sponsorships, data)

6

Gamification as Engagement Multiplier

- Slides 5, 7, 10 demonstrate sophisticated game mechanics (points, badges, mayoralty, leaderboards)

More Pitch Decks To Study

Compare structure, fundraising context, and investor-facing story across similar startup decks.