Compare your deck to Fnatic

Compare Your Deck

Fnatic Pitch Deck (2019)

Gaming
Stage: Series A
Raised: $19M
Year: 2019
Slides: 13
Outcome: Leading esports brand; raised $72M total

Pitch Deck

1 / 13
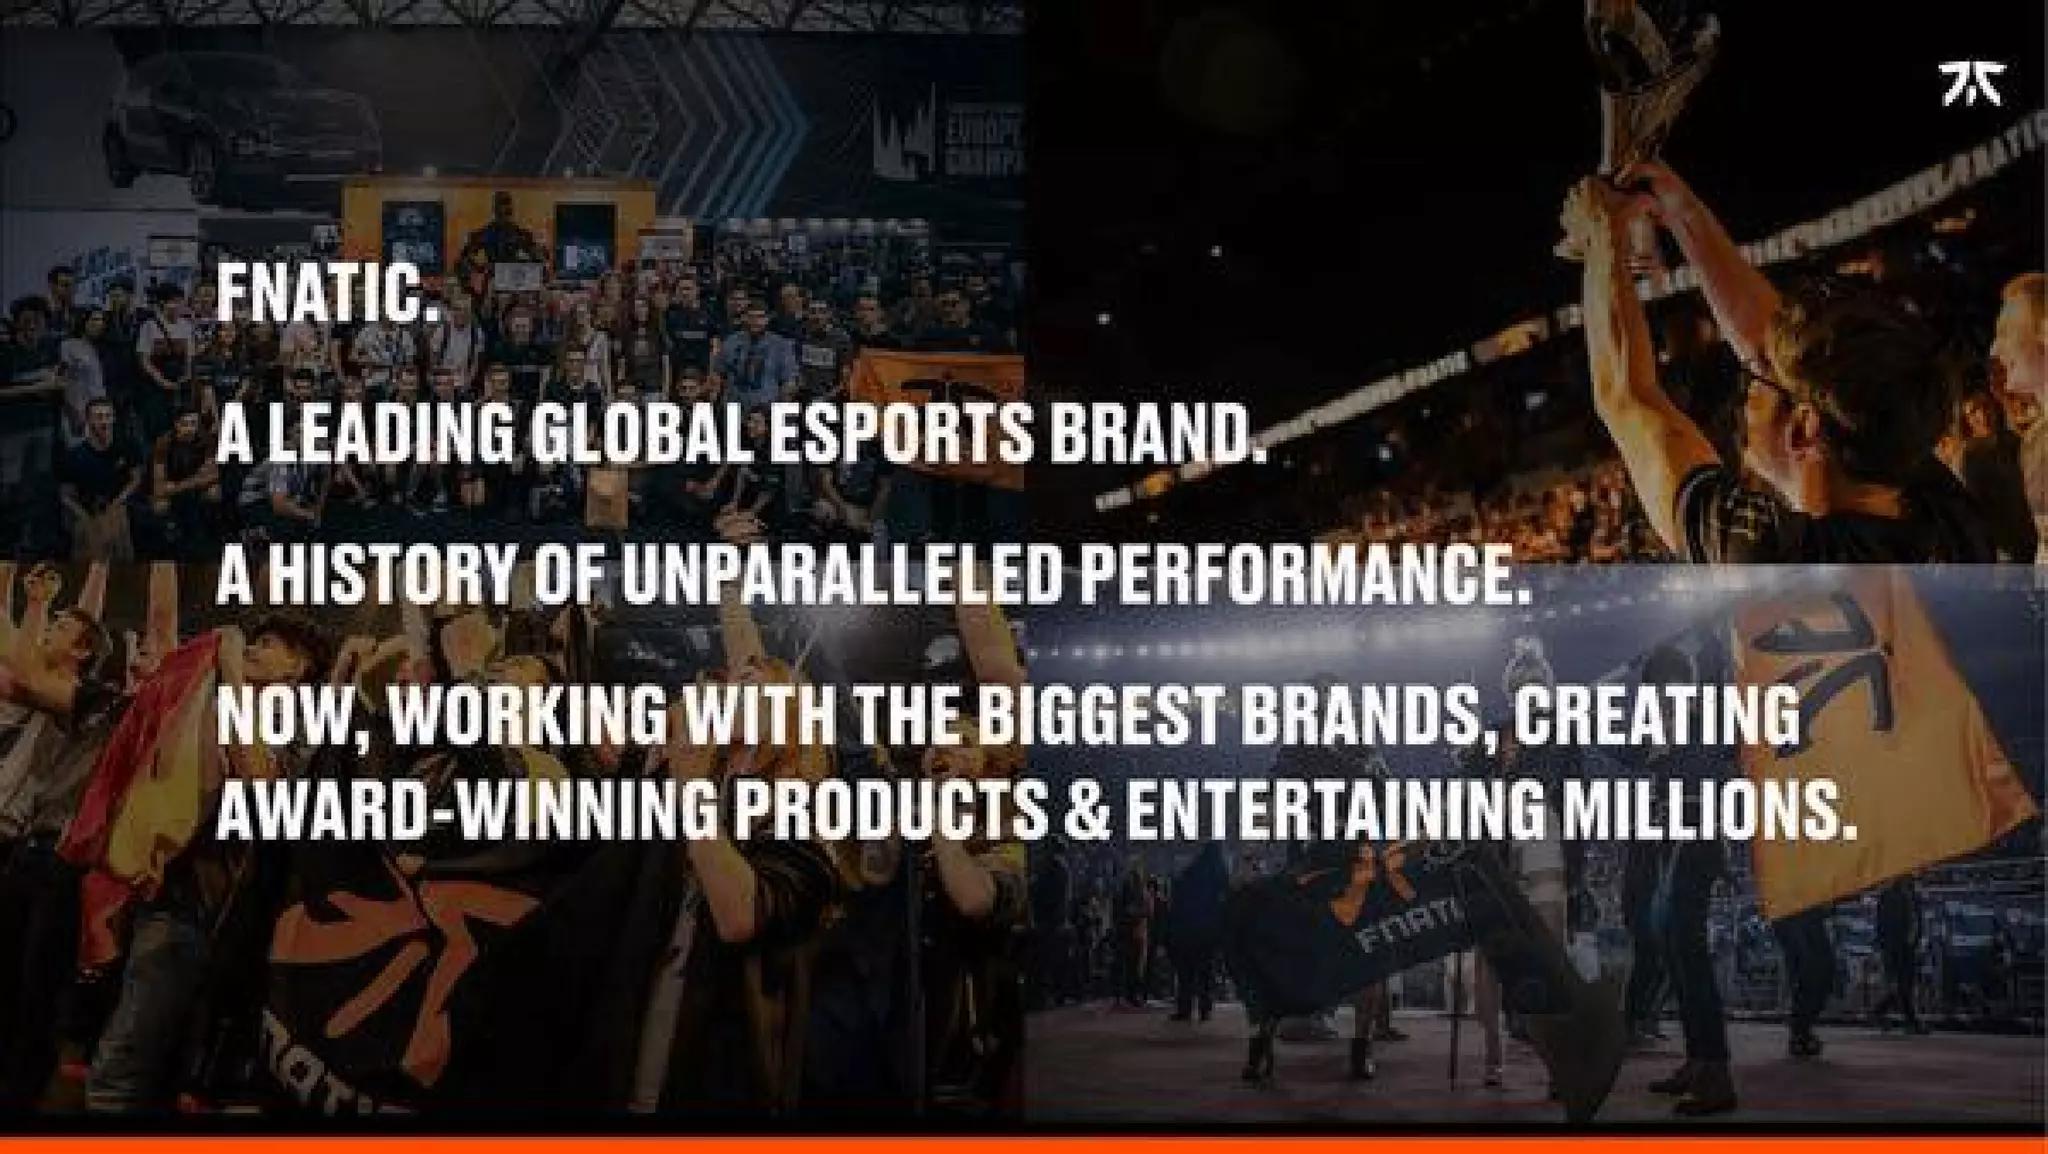
Fnatic pitch deck - Opening: Bold Brand Positioning
Click to expand

Deck Analysis

This pitch deck from Fnatic (Series A, 2019) positions the organization as a market-leading esports brand with deep competitive heritage, substantial audience reach and multiple monetization channels. The deck combines bold visual branding with data-driven market context, team and viewership metrics, product offerings and a clear use-of-funds plan. It’s notable for showing how an esports org can bridge cultural credibility (championship history, creator relationships) with commercial opportunities (sponsorships, owned gear, digital products) to attract institutional capital.

Opening: Bold Brand Positioning

Opening: Bold Brand Positioning

The first slide (cover) uses a single, high-contrast visual treatment (orange background, large FNATIC logotype and tagline) to establish instant brand recognition and tone. It communicates confidence and differentiates the deck from typical investor slides that lead with problem/solution — Fnatic leads with identity and culture, signaling that the brand itself is the core asset.

For founders this approach works when the brand or team is a primary part of the value proposition; by front-loading brand equity they prime investors to view subsequent metrics through the lens of an already valuable identity. The risk is lack of early context, so pairing a bold cover with immediate follow-up slides that quantify the market (which Fnatic does) is a best practice.
Key Takeaway: If brand equity is a core asset, lead with it to set tone — but follow quickly with concrete market/context slides so investor attention converts to credibility.
Market Context: Gaming as the Dominant Entertainment Medium

Market Context: Gaming as the Dominant Entertainment Medium

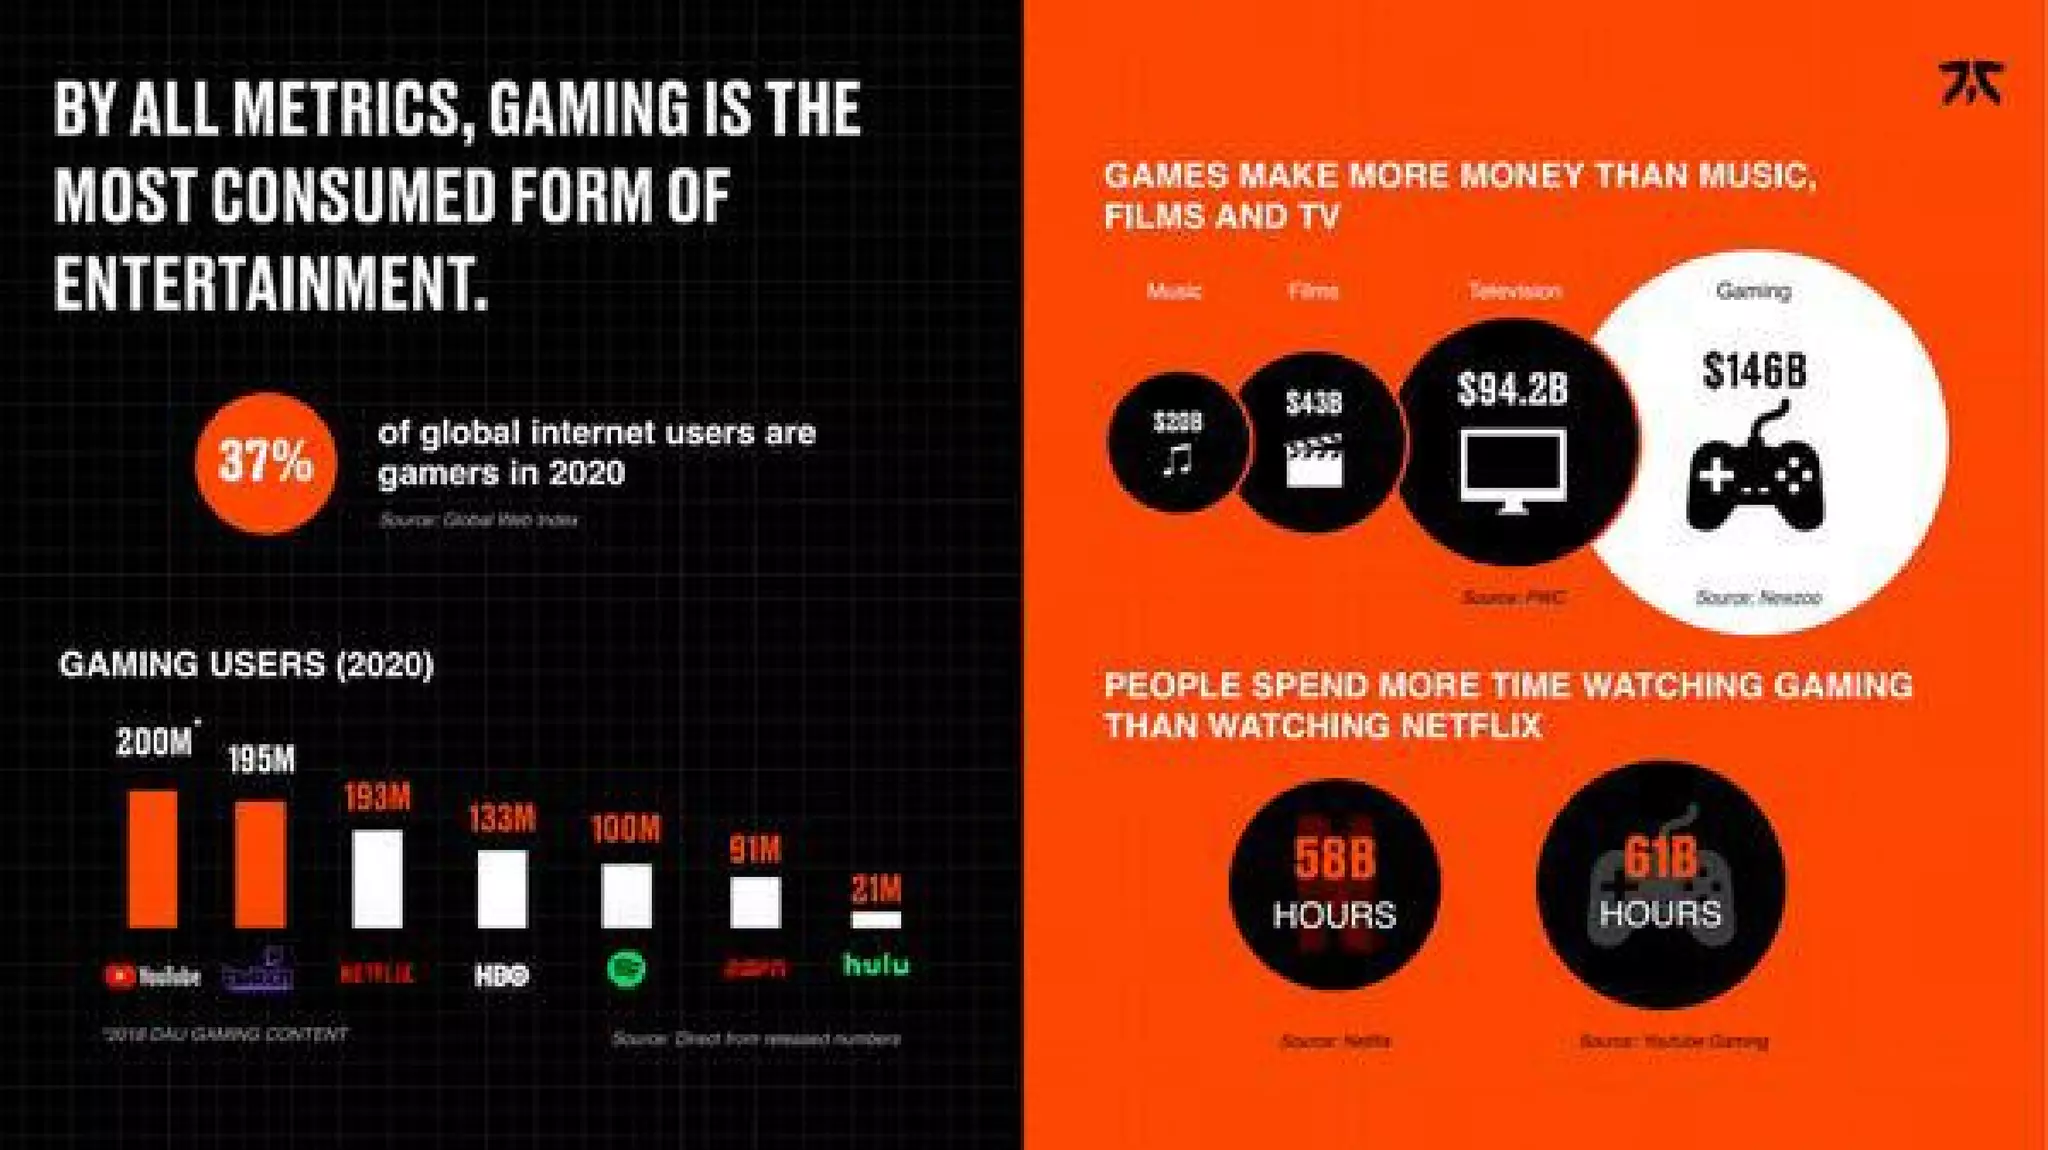
Slide 2 lays out the macro opportunity: gaming out-earns music, film and TV and captures massive global attention (37% of internet users in 2020 cited as gamers). The slide uses a two-column layout — left for headline and viewer comparisons, right for revenue and time-spent visuals — which makes the argument both emotional and economic. The use of familiar comparators (Netflix hours, industry revenue bubbles) helps translate gaming’s scale for investors who may be more familiar with traditional media economics.

Founders should note the effective blend of quantitative and visual storytelling: show market size, consumer behavior (time spent), and why that creates durable monetization channels. The slide also demonstrates that presenting multiple, reinforcing metrics (users, time, revenue) strengthens the market thesis more than a single stat would.

Key Takeaway: Present market opportunity with layered evidence — scale, engagement, and revenue comparisons — to make the case comprehensible to both media and finance-minded investors.
Proof Points: Competitive Track Record and Brand Credibility

Proof Points: Competitive Track Record and Brand Credibility

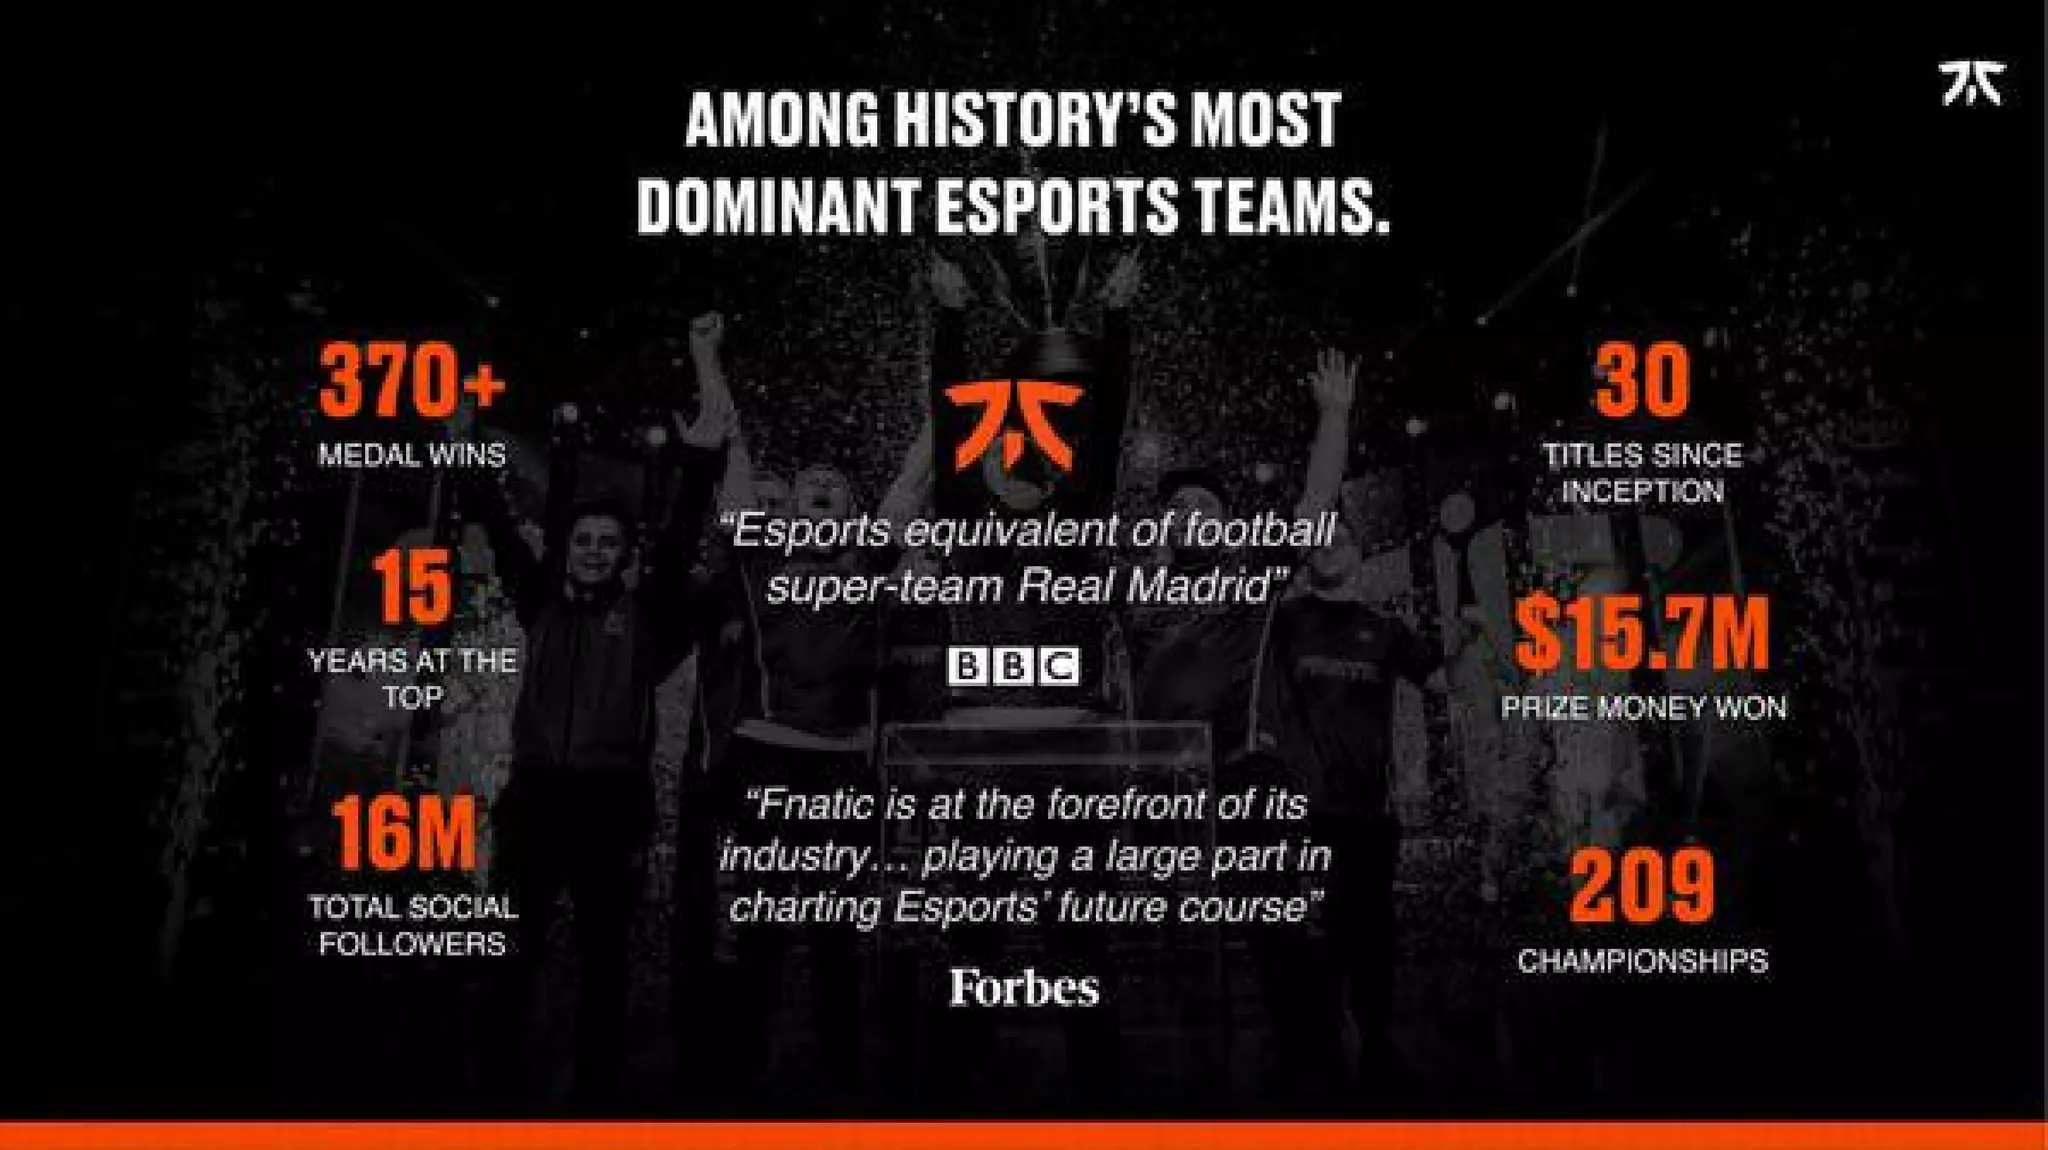
Slide 4 aggregates Fnatic’s historical achievements: medal wins, years at the top, social reach, prize money, titles and championships. It mixes hard KPI callouts with third-party endorsements (BBC, Forbes) to validate the narrative that Fnatic is among the most dominant esports teams historically. The layout — numeric pillars on left and right with quotes and logo in center — makes the metrics scannable while the press quotes add independent credibility.

For founders building consumer brands, this slide is a template for combining owned metrics (followers, revenues, wins) with earned credibility (press, partners). It’s especially effective when those metrics are unique to your business and hard for competitors to replicate quickly (championship history, deep community).

Key Takeaway: Combine proprietary performance metrics with independent third-party endorsements to turn subjective brand claims into verifiable competitive moats.
Audience and Engagement: Viewership Leadership

Audience and Engagement: Viewership Leadership

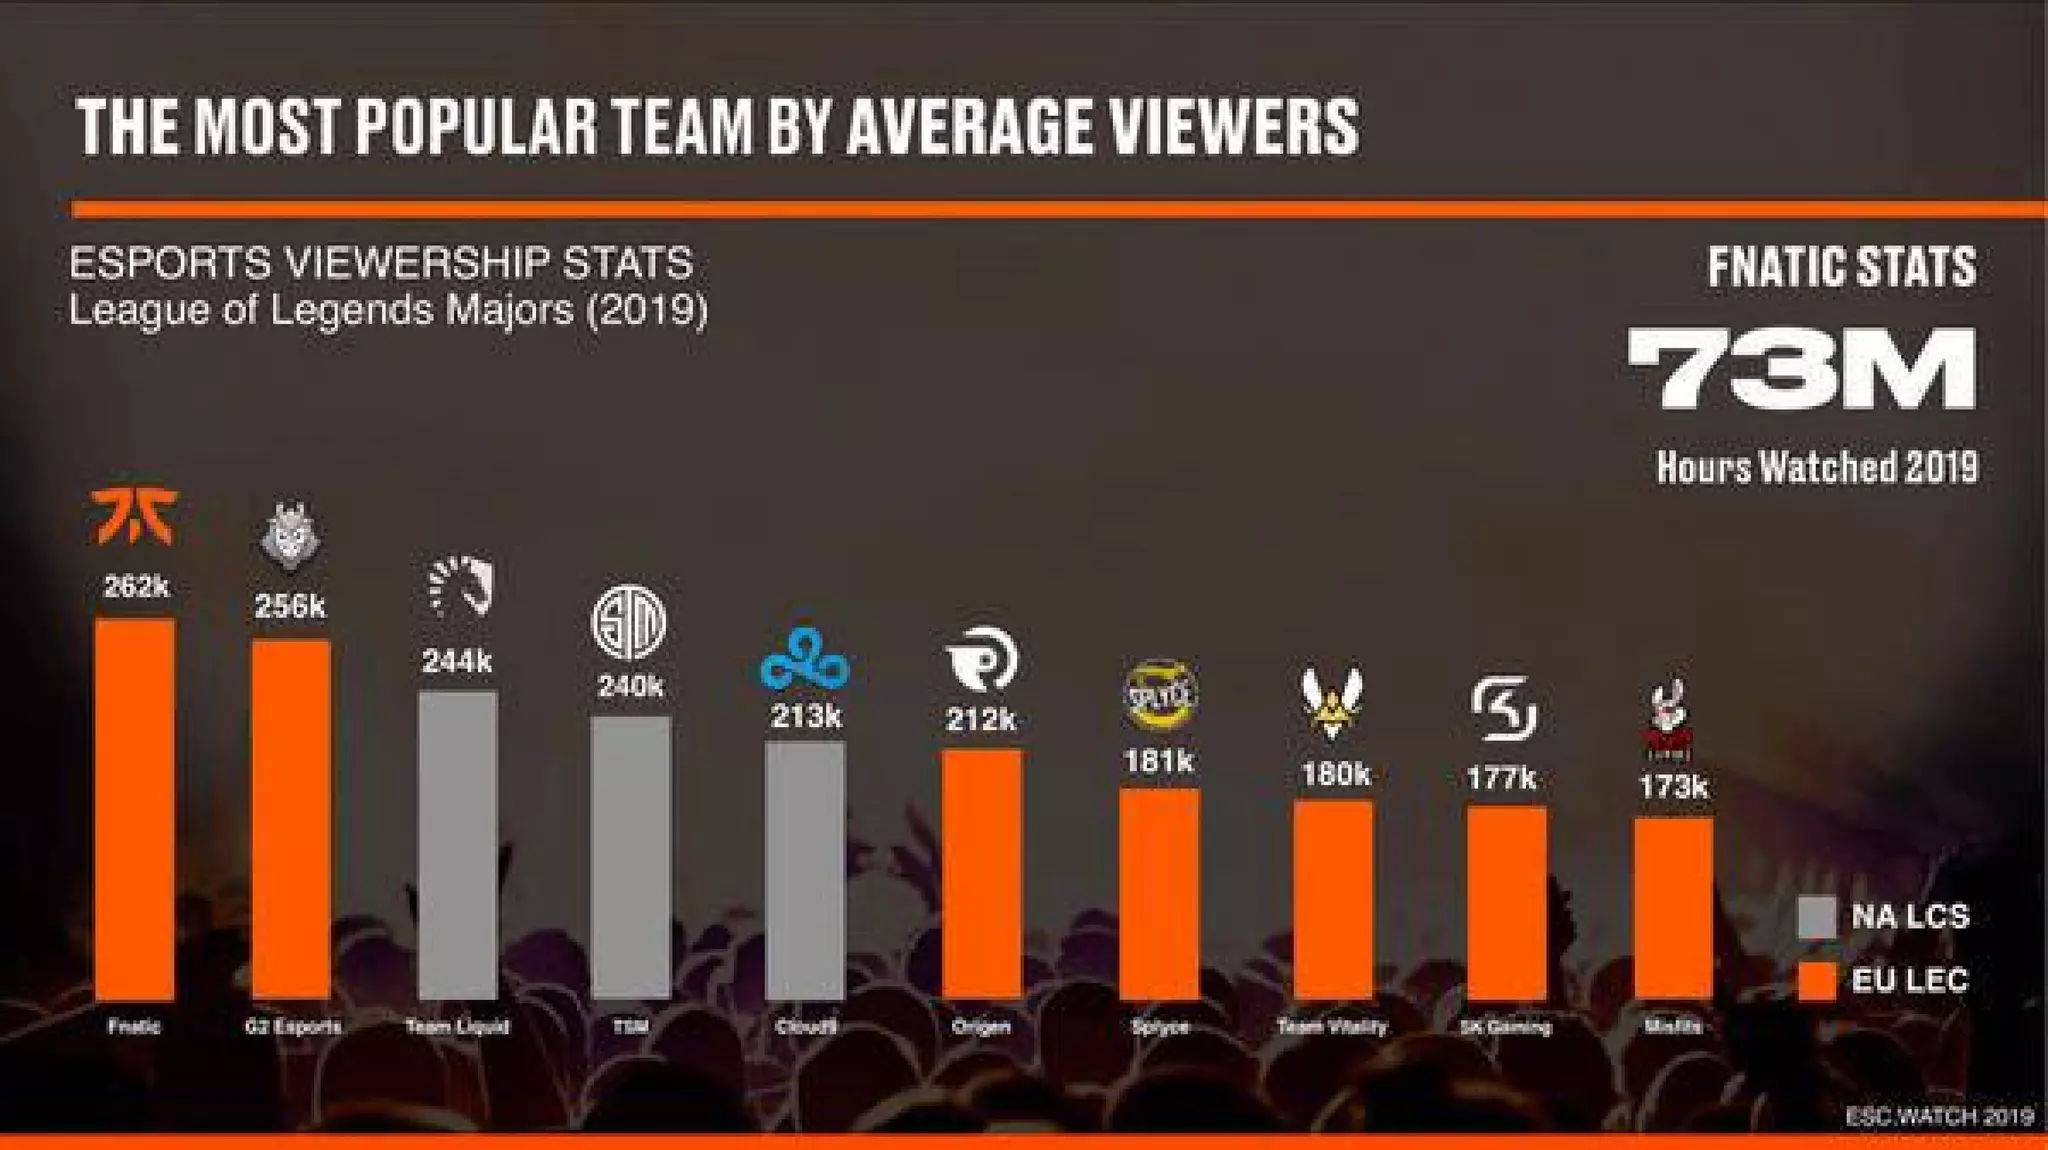
Slide 5 demonstrates Fnatic’s live viewership leadership in League of Legends majors (2019) by comparing average viewers across top teams and showing aggregate hours watched (73M hours for Fnatic). The use of ranked bars with both EU/NA color coding clarifies regional strength and competitive position. Presenting both team-level averages and aggregate watched hours gives investors a sense of both peak and sustained engagement.

Founders should learn from the clarity here: pick the single engagement metric that matters most to your business model (hours watched, MAUs, DAUs) and present it alongside competitor or category context. Visual comparisons (ranked bars, color-coded regions) speed investor comprehension and highlight where you dominate.

Key Takeaway: Lead with the most business-relevant engagement metric and immediately show competitive context — dominance is more convincing when juxtaposed against peers.
Monetization Strategy: Four Revenue Pillars

Monetization Strategy: Four Revenue Pillars

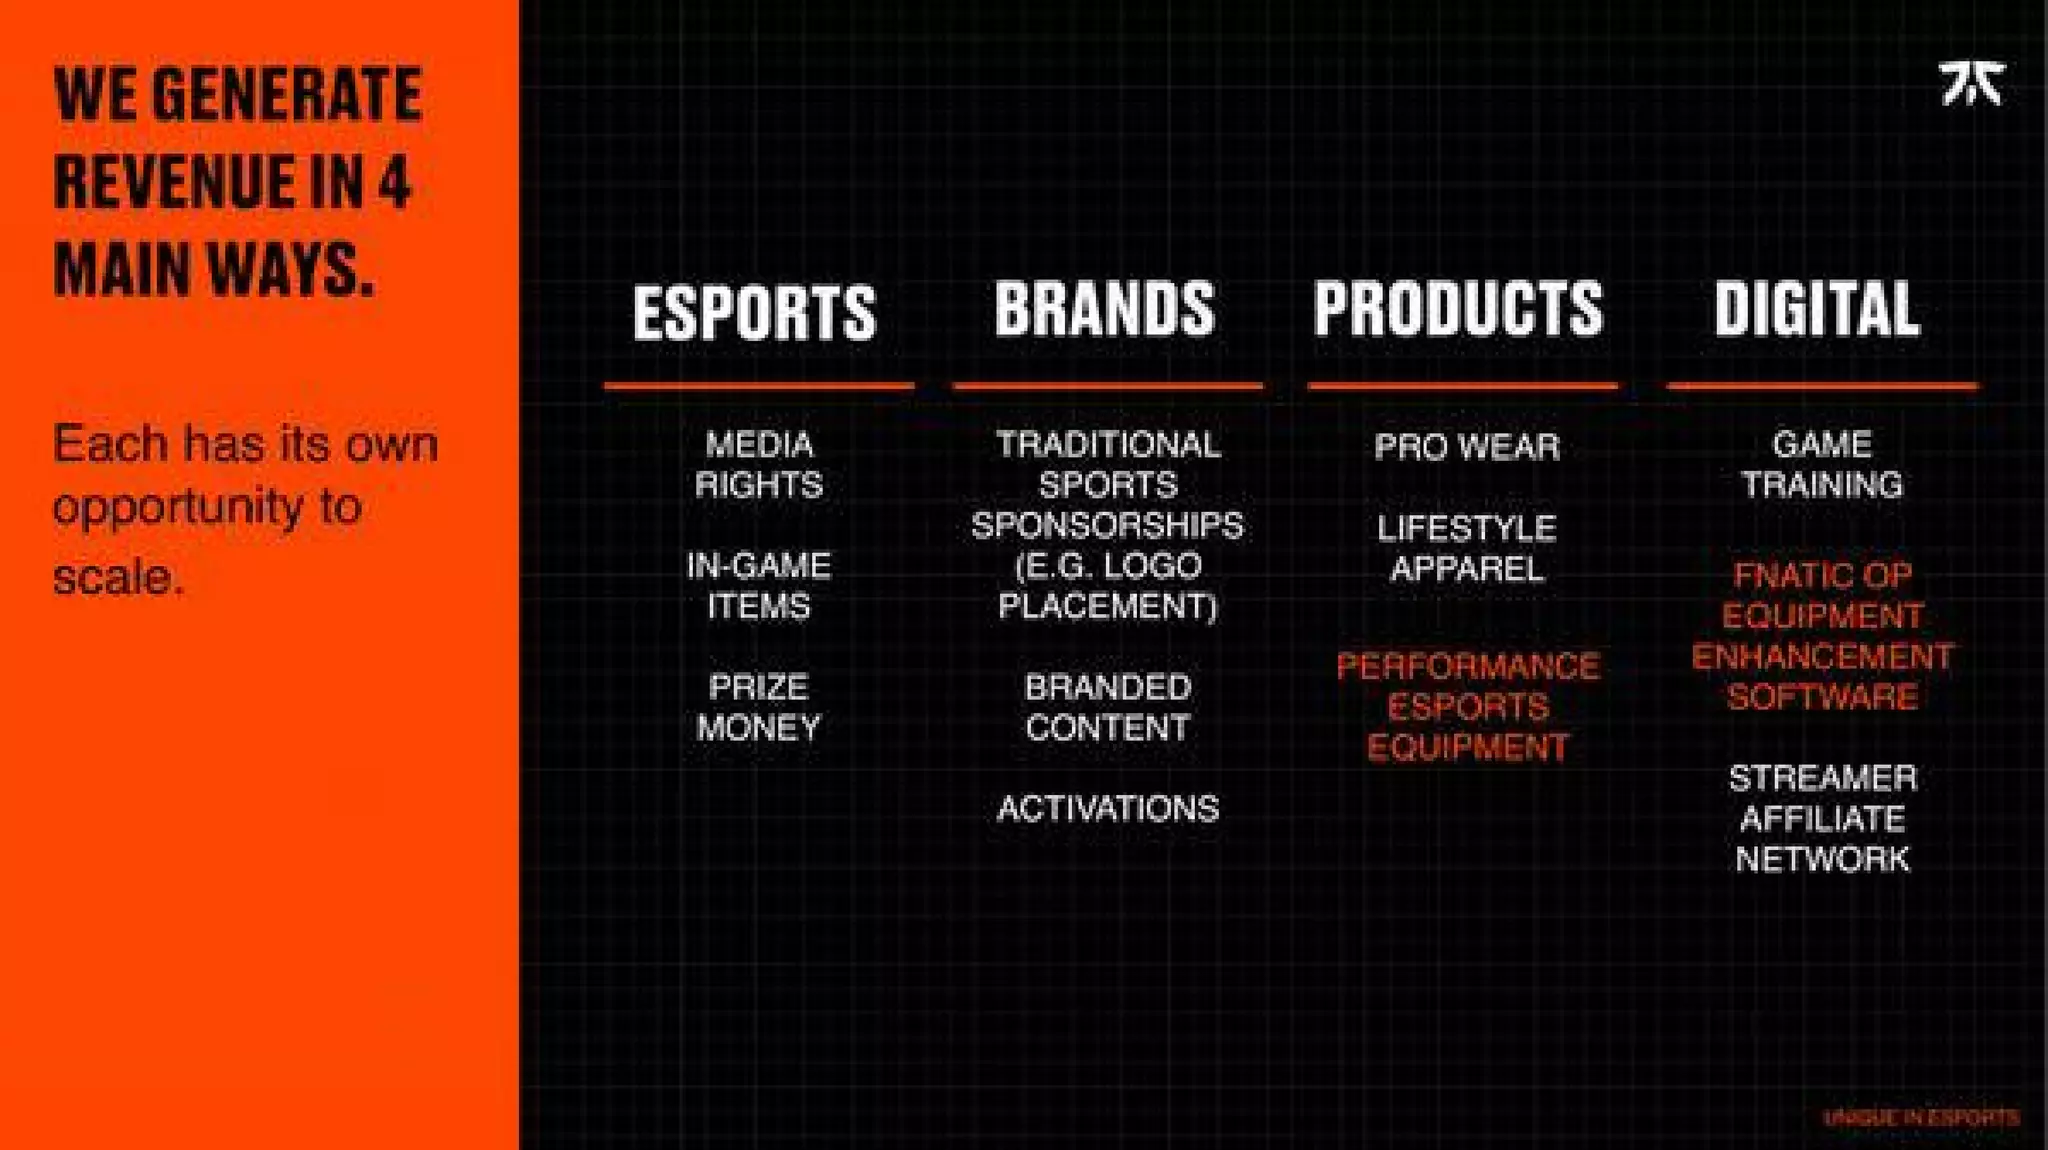
Slide 8 lays out four distinct revenue streams — Esports, Brands, Products and Digital — with examples under each. This communicates diversification and multiple scaling levers: prize/mediaring revenue and in-game items (Esports), sponsorships and activations (Brands), pro/lifestyle gear (Products), and software/training/affiliate networks (Digital). Structuring revenue into clear buckets makes it easier for investors to model upside and understand margin differences between channels.

This section teaches founders to map monetization to operational capabilities: who creates the content, who sells and who builds the product. Fnatic’s approach reduces investor risk perception by showing the organization isn’t dependent on a single revenue type and that each stream links back to core assets (teams, audience, brand).

Key Takeaway: Show diversified, clearly-labeled revenue streams tied to your core assets so investors can model growth, margins and risk by channel.
Product-Led Growth: Owned Gear and Creator-Led Productization

Product-Led Growth: Owned Gear and Creator-Led Productization

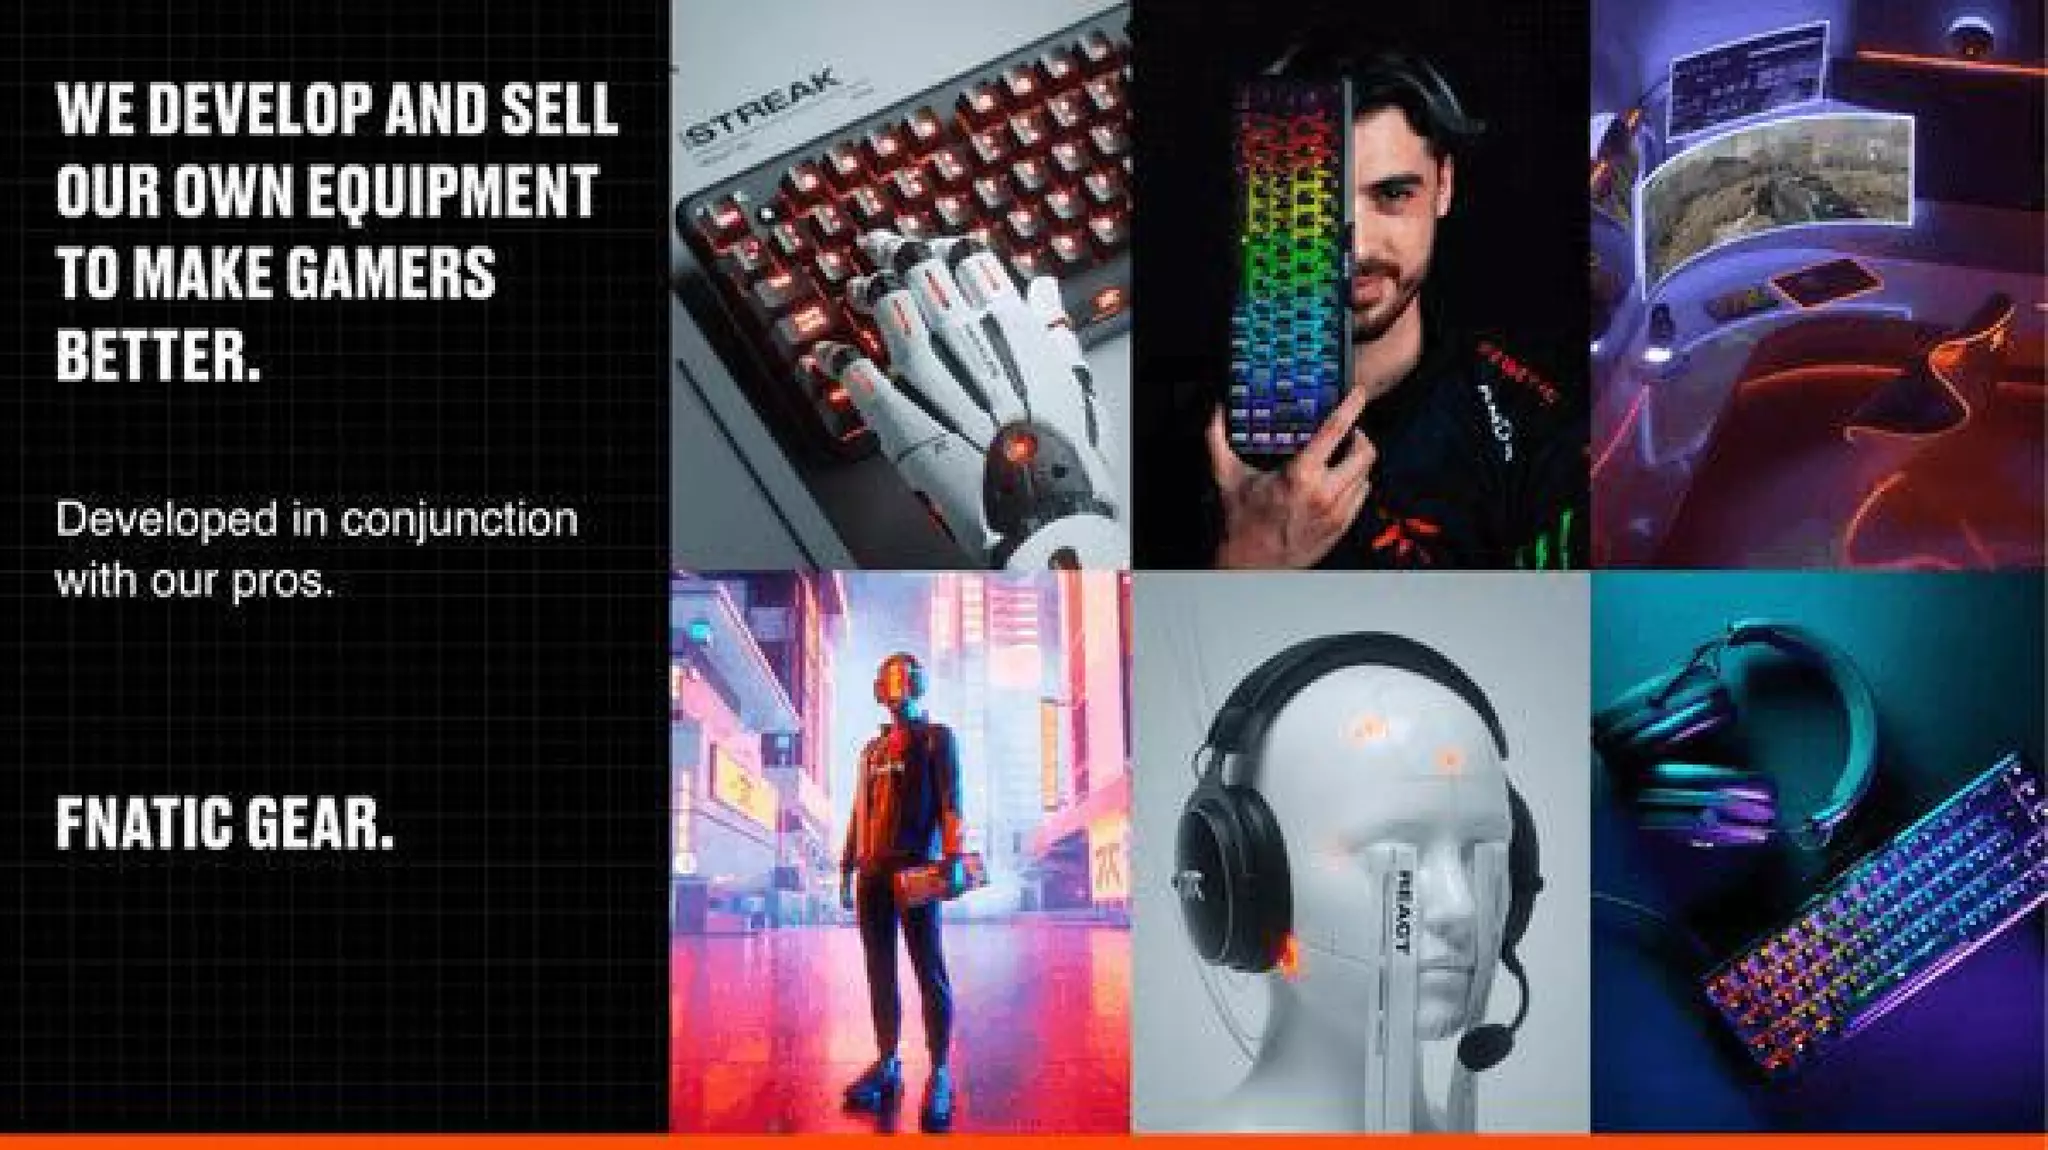
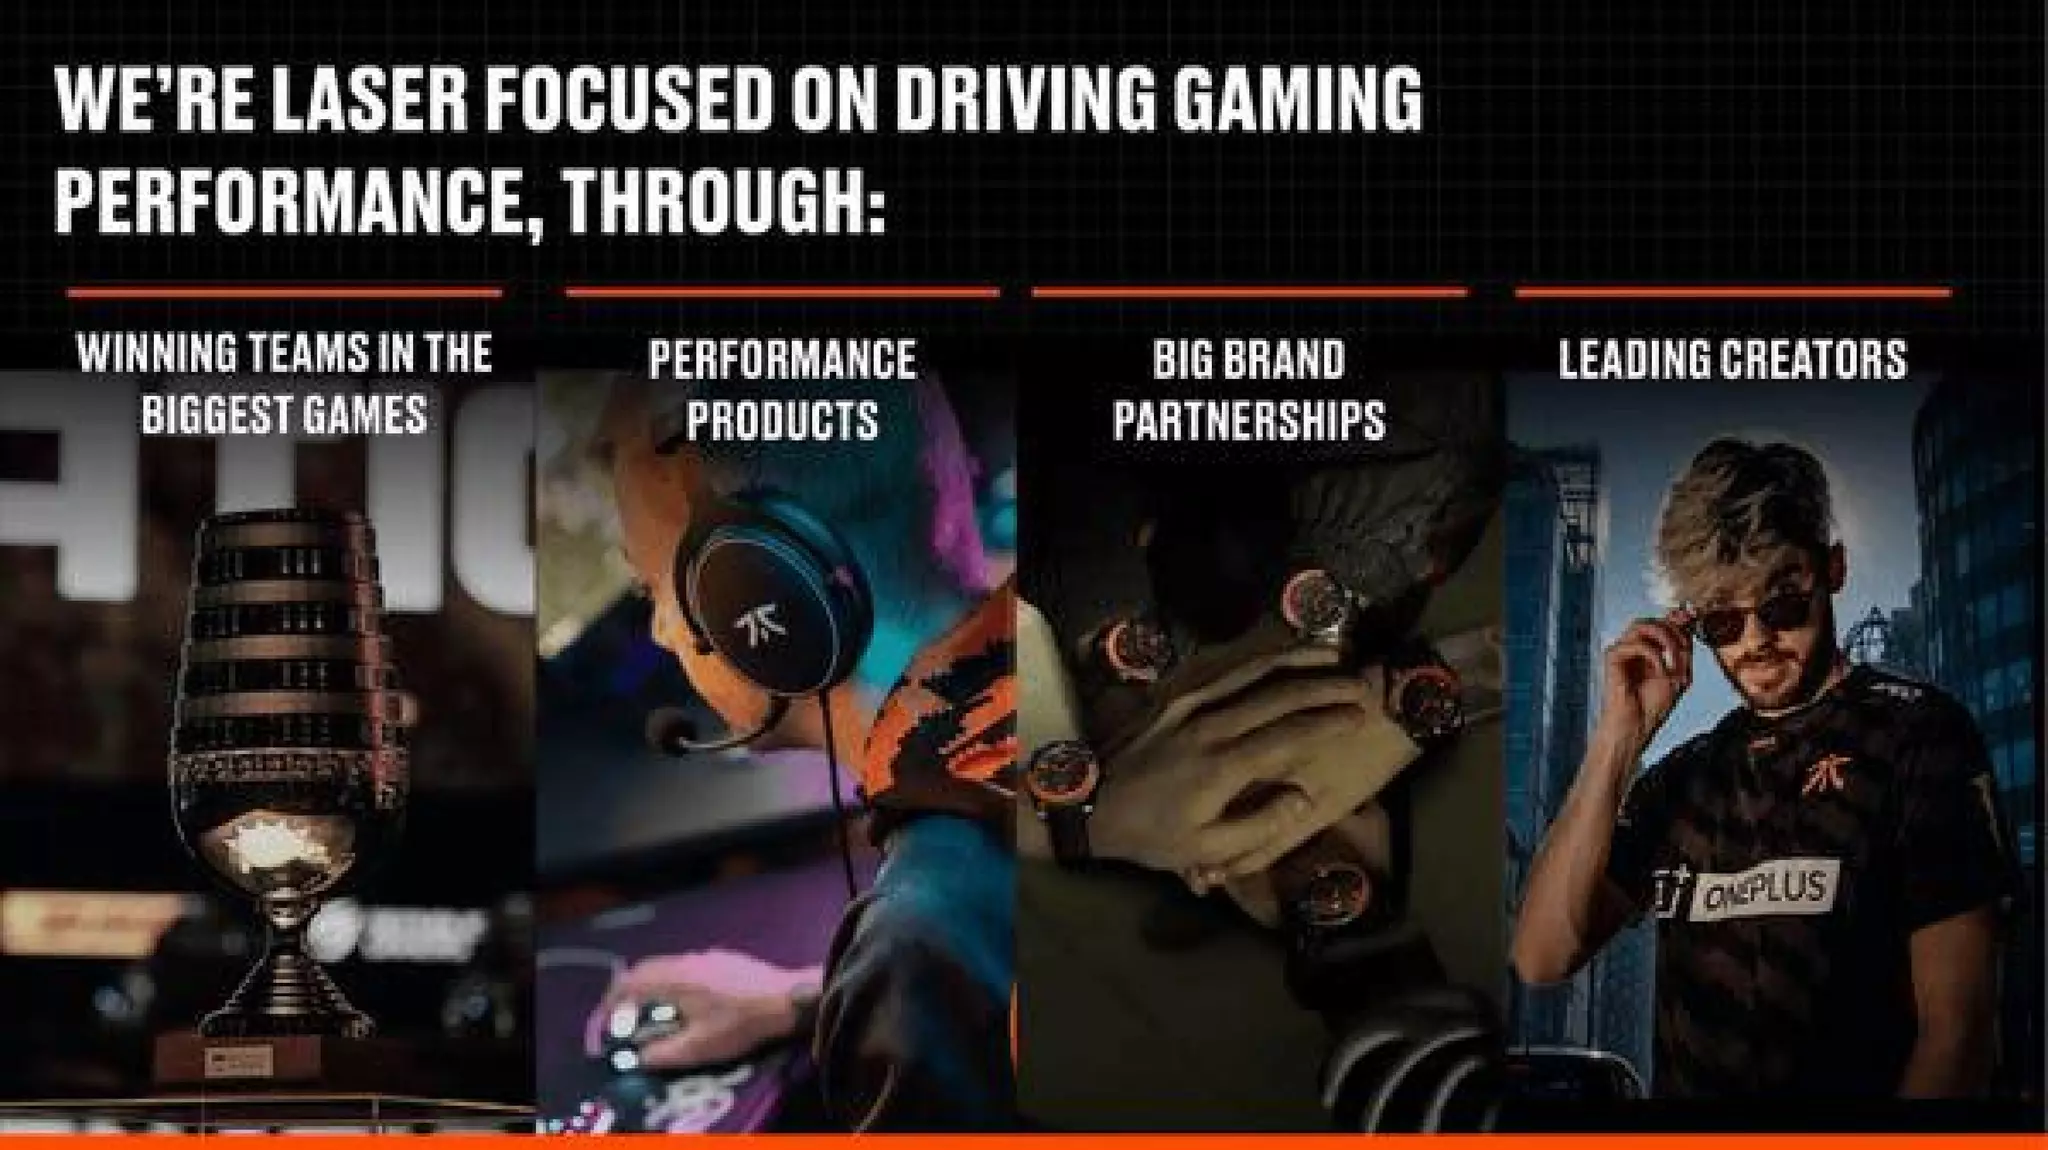
Slides 10 and 11 (merged thematically) highlight Fnatic’s product strategy: developing and selling proprietary gaming equipment and leveraging pro input to design gear. The visuals mix lifestyle and product shots to demonstrate both design quality and aspirational positioning. Owning hardware and peripherals creates higher-margin commerce opportunities and a physical touchpoint for loyal fans — a strong complement to sponsorship revenue.

For founders, this illustrates how brand-driven product lines can deepen loyalty and build recurring revenue outside of media/sponsorship cycles. The key is credibility: products should be co-developed with experts or lead users (Fnatic’s pro players) to avoid the pitfall of branded, low-quality merch that dilutes the brand.

Key Takeaway: If you launch products, ensure they’re co-created with expert users and positioned to amplify brand loyalty and margin expansion, not just logo placement.
Use of Funds & Strategic Priorities

Use of Funds & Strategic Priorities

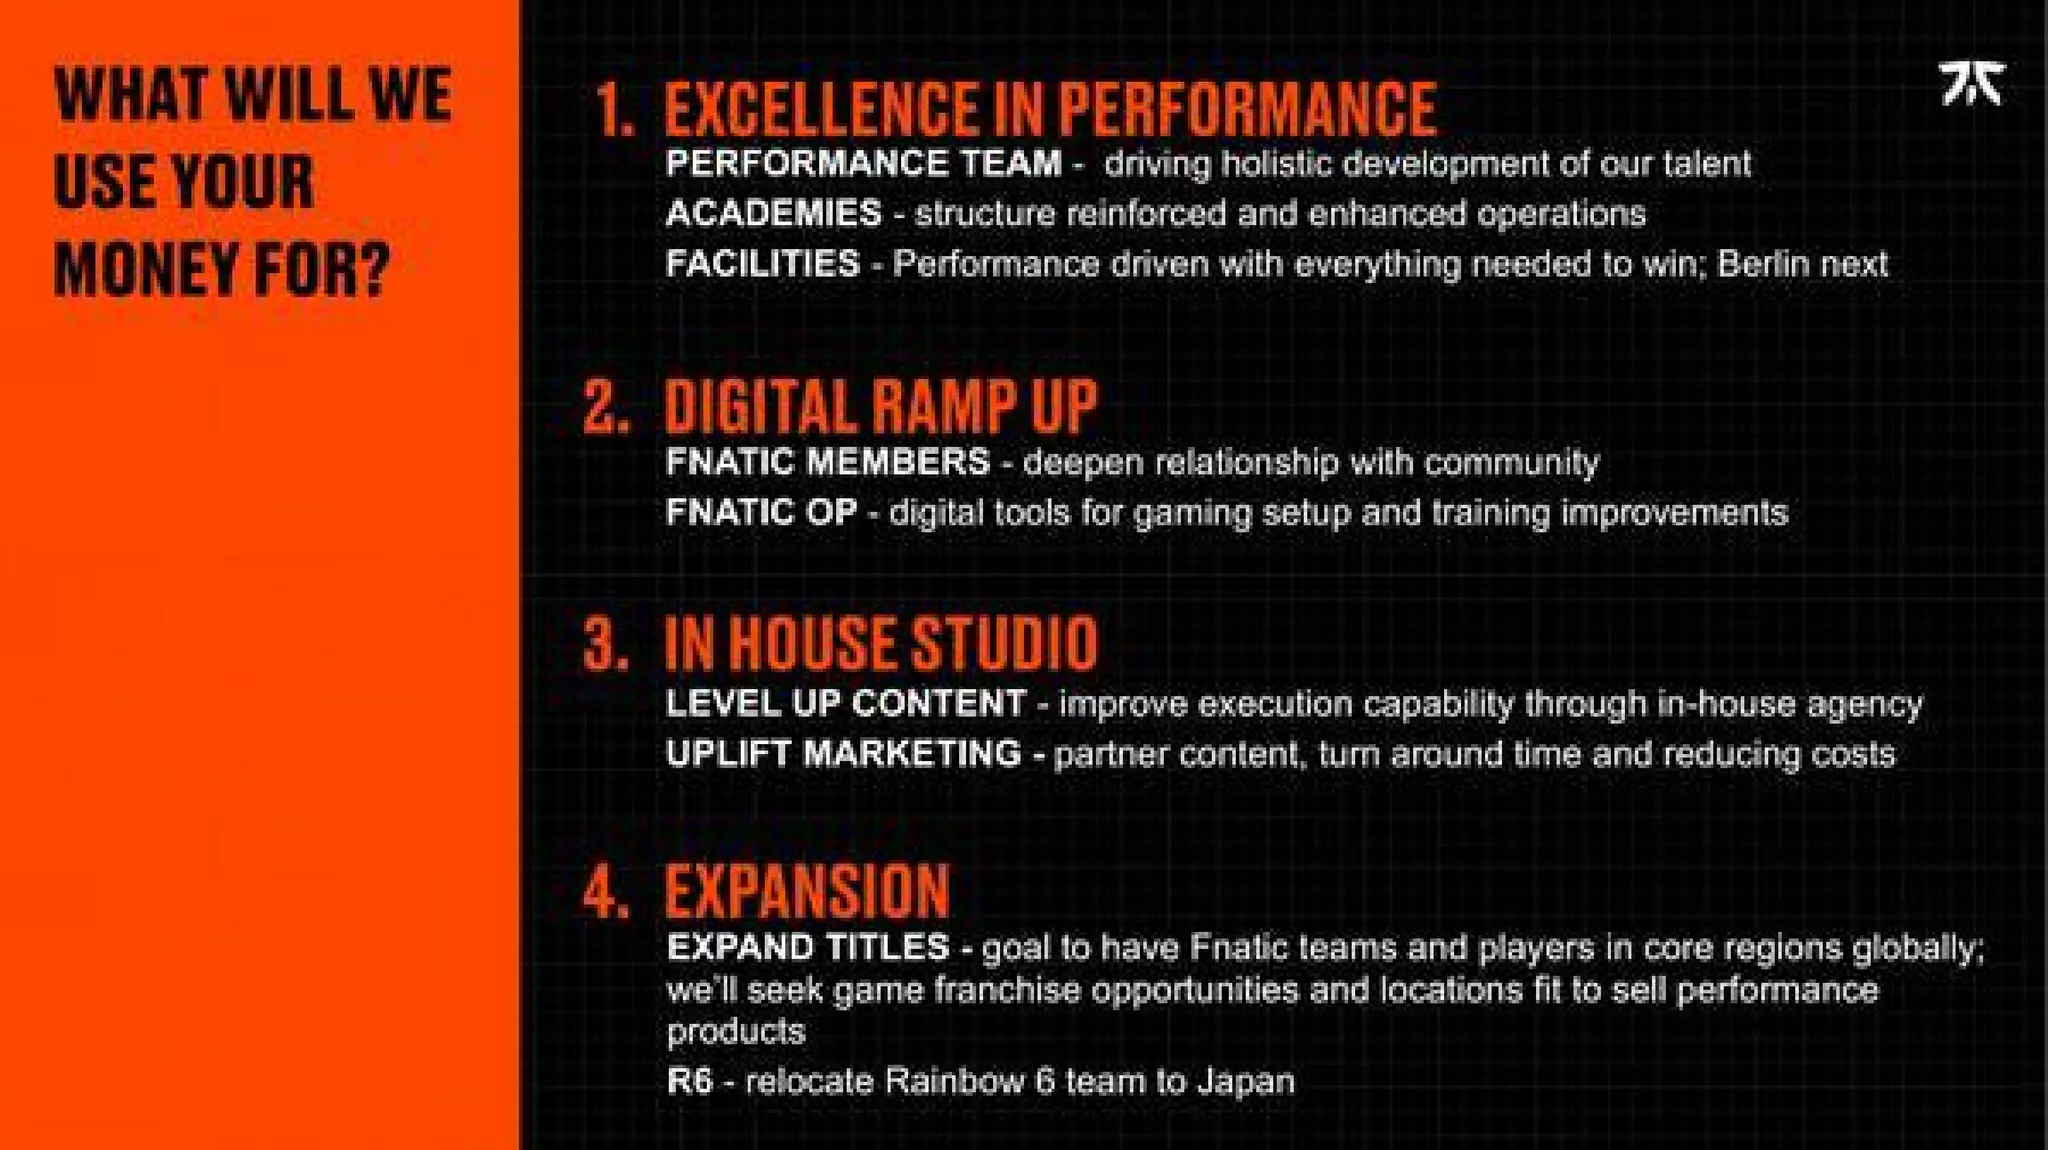
Slide 12 (What will we use your money for?) clearly lists four investment priorities: excellence in performance (teams, academies, facilities), digital ramp-up (members, tools), in-house studio (content capability), and expansion (new titles, regional moves). This layout ties the ask to both growth and defensibility — improving performance strengthens competitive results and audience, digital tools scale engagement, a studio lowers partner costs and expansion grows market footprint.

Founders should emulate this by mapping capital needs to outcomes and KPIs: link each spend area to a measurable business result (e.g., hours watched, revenue per user, sponsorship CPM uplift). The slide’s specificity (e.g., relocating Rainbow Six to Japan) and hierarchy of priorities helps investors understand the execution plan and future milestones.

Key Takeaway: Break down capital needs into prioritized initiatives and connect each to measurable outcomes so investors can see how funding de-risks growth.

Conclusion: Key Lessons

Fnatic’s deck succeeds by combining iconic brand positioning with hard metrics, diversified monetization, and a focused use-of-funds plan. Strengths include clear market context, proof of competitive advantage (performance + press), concrete engagement statistics, and a product strategy that complements media and sponsorship revenue. The visual design reinforces brand identity consistently across slides, which helps the narrative feel coherent and owned.

Actionable advice for founders: lead with your strongest proprietary asset (brand, tech, audience) but rapidly support it with market data; present engagement and competitive metrics in comparative formats so dominance is visible; map revenue streams to core assets and show how capital converts to measurable milestones. Finally, if you sell products, ensure product credibility via expert co-creation — it’s a powerful way to deepen monetization and fan loyalty. Keep slides scannable, metrics verifiable, and every spend tied to a business outcome.

Full Deck Analysis

11 sections

Overview

Company: Fnatic
Round: Series A ($19M)
Year: 2019
Outcome: Leading esports brand; raised $72M total

Executive Summary

Fnatic’s Series A deck positions a legacy esports team as a consumer entertainment brand with multiple monetization engines: competitive teams, branded partnerships, consumer products (gear/apparel) and digital products. The deck leans on category-scale statistics, strong viewership / social traction, marquee partners and product ambitions to justify expansion and further investment in performance, digital products, content and geographic/title expansion.

Problem Statement

How the deck articulates the problem:

  • The deck frames the core opportunity as the mismatch between the enormous and fast-growing gaming audience and the limited number of truly global, performance-driven entertainment brands serving that audience (Slide 2). It shows that gaming is the largest entertainment vertical (Slide 2: Gaming $146B vs TV $94.2B / Film $43B / Music ~$20B) and that people spend more time consuming gaming content than traditional streaming (Slide 2: 61B hours gaming vs 58B hours Netflix).
  • Implicit problem: big consumer brands lack credible routes into esports and gamers lack performance-first products and training tools. Fnatic positions itself as the bridge (Slides 7, 9, 10, 11).

Solution

How the deck positions the solution:

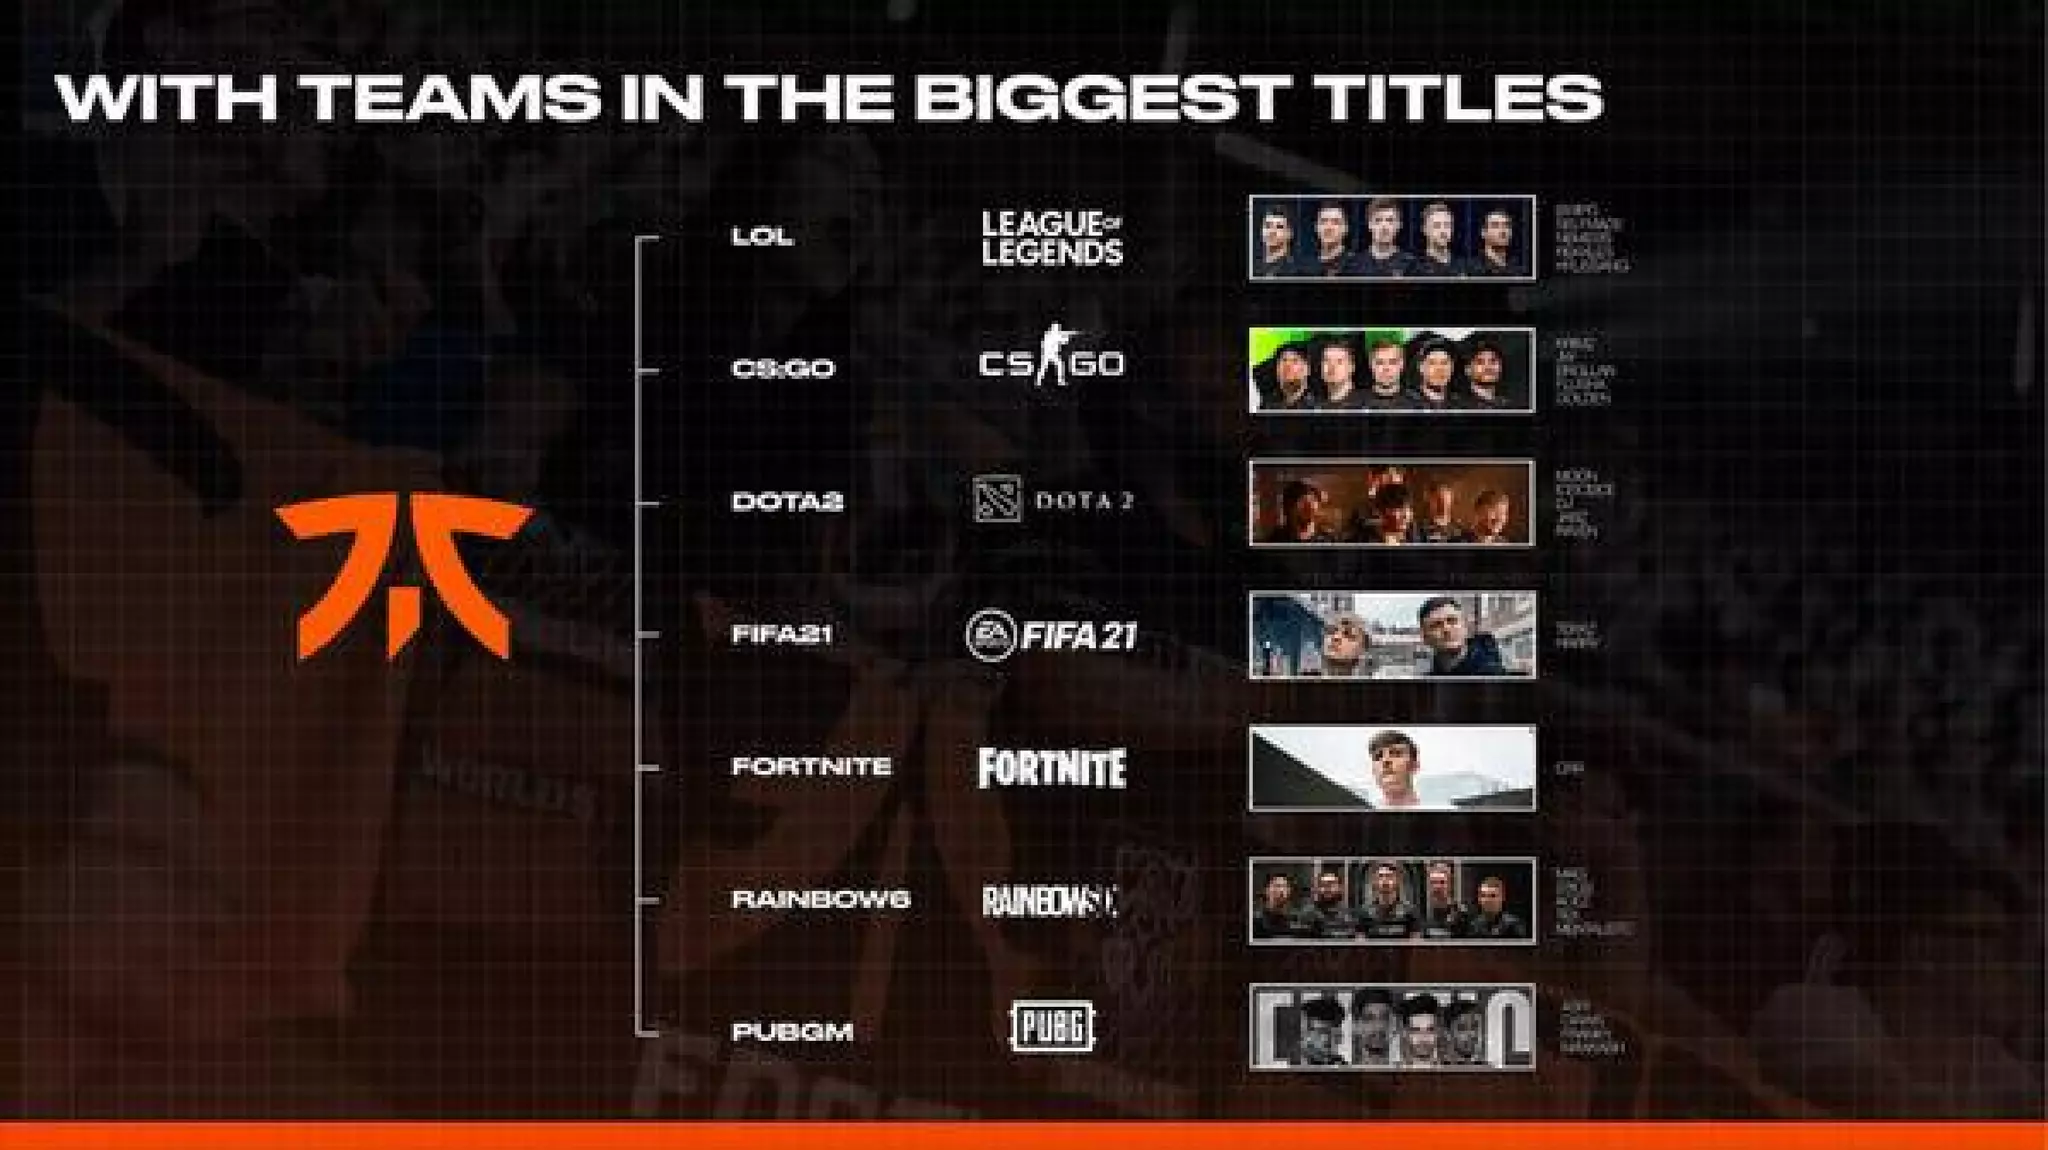
  • Fnatic presents itself as a vertically integrated esports brand: world-class competitive teams (Slide 4), a premium consumer product line (hardware, apparel — Slides 10–11), branded partnerships to monetize attention (Slide 11), and digital tools/services (game training / “Fnatic OP” software / streamer network — Slide 9).
  • They combine brand, talent, content and product to monetize user attention across sponsorship, direct-to-consumer product sales, digital services and IP/licensing.

Market Opportunity

TAM / SAM / SOM analysis (what the deck shows and what’s missing):

  • Displayed category TAM: Gaming market cited at $146B (Slide 2, source Newzoo). Comparison categories shown: Television $94.2B (PwC), Film $43B, Music ~$20B.
  • Audience metrics supporting scale: 37% of global internet users are gamers in 2020 (Slide 2). Platform audiences in 2019: YouTube 200M gaming viewers, Twitch 195M, Netflix 193M, etc. (Slide 2).
  • What’s missing: the deck does not present an explicit SAM or SOM or clearly segmented addressable market for Fnatic’s specific products (gear, branded activation, digital subscriptions). There is no breakout of revenue opportunity by segment (e.g., expected market for pro gear vs. digital training tools).

Business Model

Revenue model and unit economics (from deck):

  • Four primary revenue streams are explicitly listed (Slide 9):
    • Esports: media rights, in-game items, prize money.
    • Brands: sponsorships, logo placement, branded content, activations.
    • Products: pro wear, lifestyle apparel, performance esports equipment (Fnatic Gear).
    • Digital: game training, Fnatic OP equipment enhancement software, streamer affiliate network.
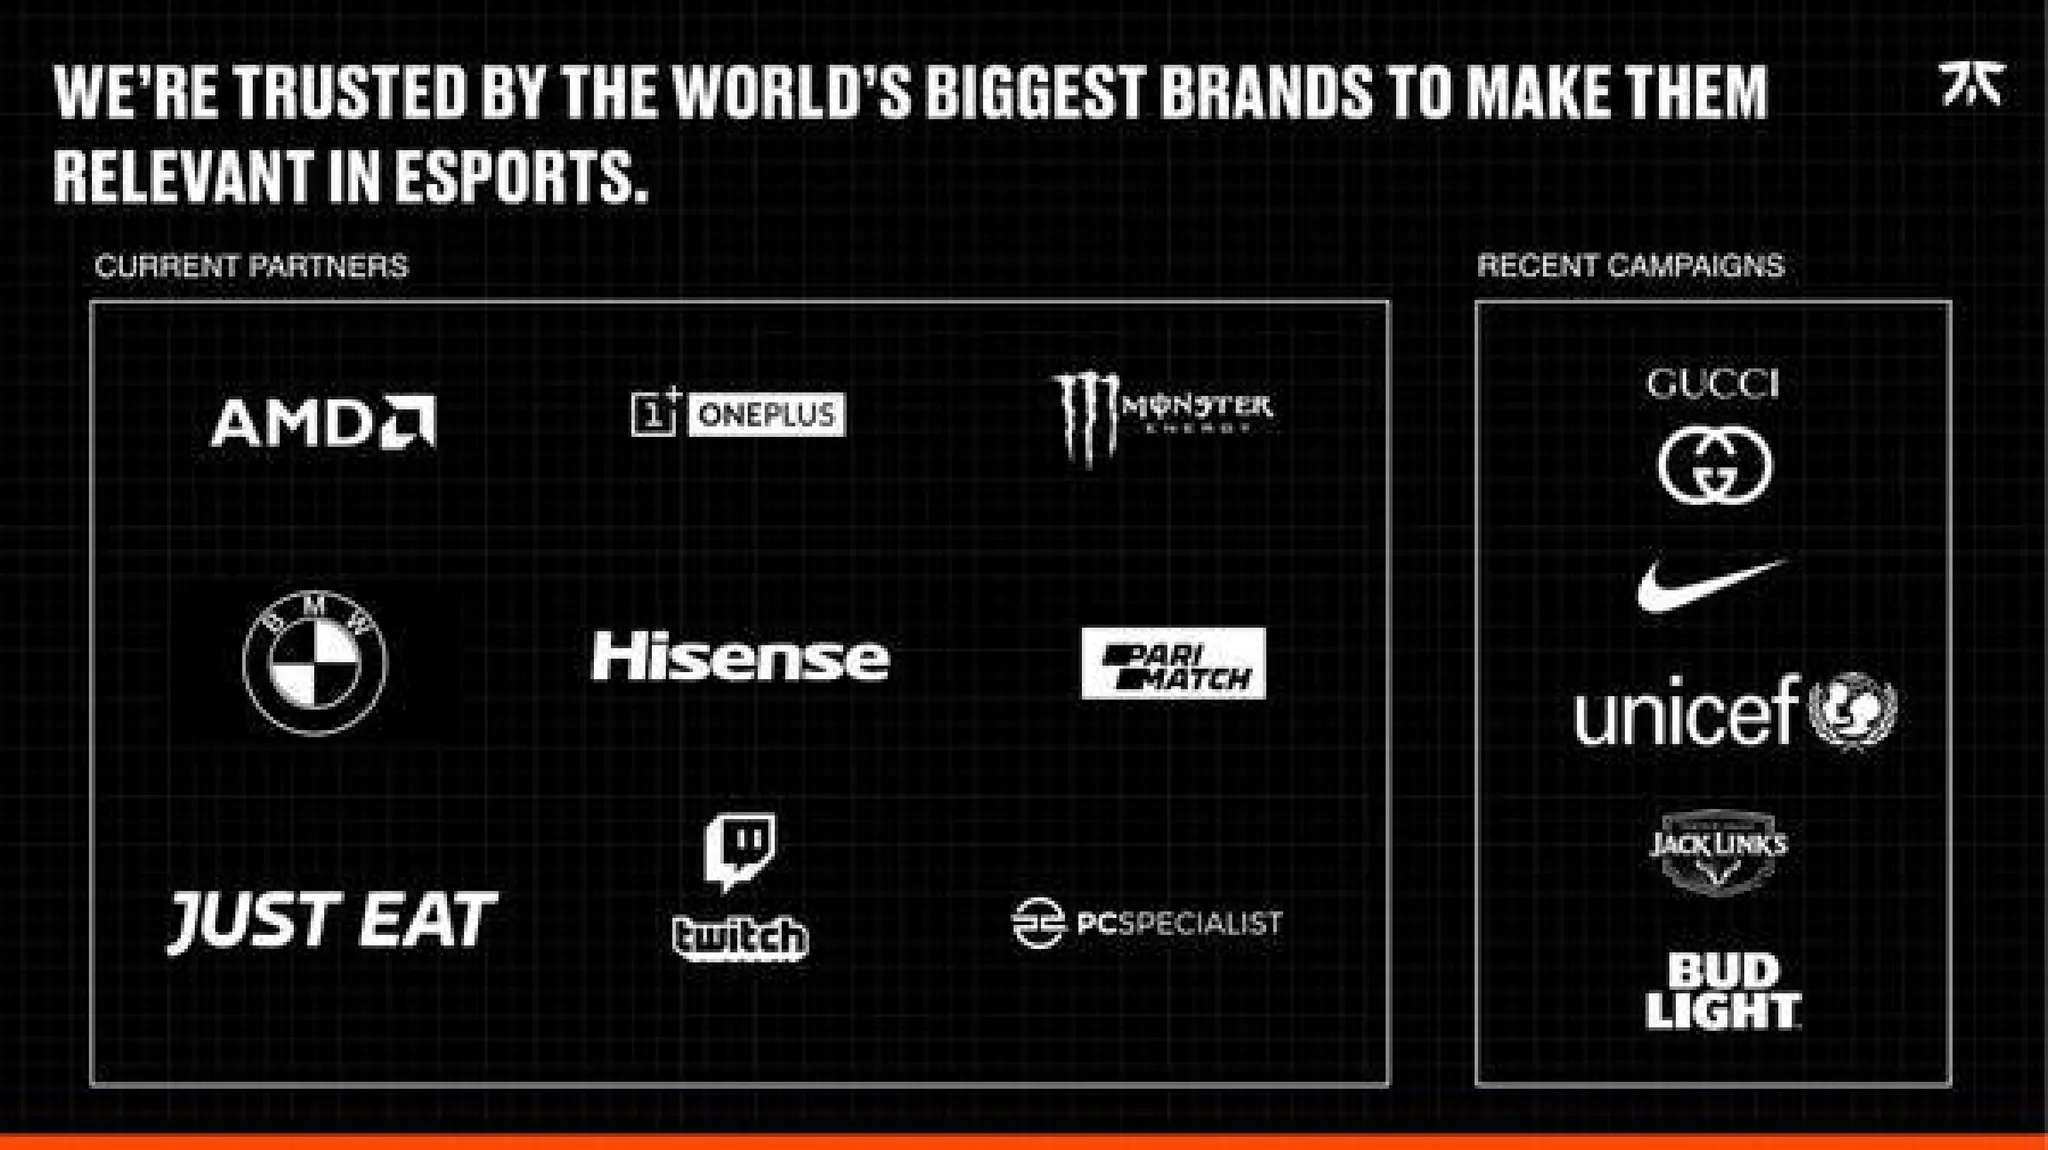
  • Additional monetization evidence: large brand partnerships (AMD, OnePlus, BMW, Monster, Just Eat, Twitch, etc.) (Slide 11) and recent campaigns with Gucci, Nike, UNICEF (Slide 11) that imply sponsorship revenue and activation business.
  • Unit economics: not shown. No ARR/GM/COGS/LTV/CAC detail is provided in the deck.

Traction & Metrics

Growth metrics and proof points (explicit numbers from slides):

  • Competitive / brand traction (Slide 4):
    • 370+ medal wins
    • 15 years at the top (longevity)
    • 16M total social followers
    • 30 titles since inception
    • $15.7M prize money won
    • 209 championships
  • Audience / viewership (Slide 5 and Slide 2):
    • Fnatic average viewership (League of Legends majors 2019): 262k (highest in chart) vs G2 256k, Team Liquid 244k (Slide 5)
    • 73M hours watched in 2019 (Fnatic stat on Slide 5)
  • Category metrics validating demand (Slide 2):
    • 37% of global internet users are gamers in 2020
    • Platform audience numbers: YouTube 200M, Twitch 195M, Netflix 193M (2019 viewing comparison)
    • People watch more gaming content than Netflix (61B vs 58B hours shown)
  • Partnerships (Slide 11): long list of blue-chip partners (AMD, OnePlus, Monster, BMW, Hisense, Parimatch, Just Eat, Twitch, PCSpecialist).

Competitive Positioning

How they differentiate:

  • Historical dominance and credibility: long track record of wins, championships and prize money (Slide 4) — positions Fnatic as an established top-tier competitive brand.
  • Brand-first + product + digital integration: they combine performance teams with consumer hardware, apparel, branded content and digital training tools (Slides 7, 9, 10).
  • Blue-chip partners and creative campaigns: partnerships with mainstream brands (BMW, Gucci, Nike, etc.) give them cross-industry legitimacy (Slide 11).
  • Narrative positioning: quoted coverage from BBC and Forbes in Slide 4 supports the “global, mainstream sports-like brand” positioning.

Team

Team credentials:

  • The deck highlights organizational capabilities and history (15+ years, championships) but does not present a clear, slide-level leadership team roster or individual bios in the set provided. This is a notable omission for investor evaluation — the deck emphasizes brand and traction over shown managerial bios or operating team details.

Go-to-Market Strategy

Distribution approach if shown:

  • Sponsorships and brand partnerships for reach and revenue (Slide 11).
  • Direct-to-consumer product sales (Fnatic Gear) and pro equipment distribution (Slides 10–11).
  • Content and owned-channel distribution (in-house studio ambition on Slide 12) to drive engagement and partner activations.
  • Digital product rollout (Fnatic OP, training tools, streamer network) to engage and monetize the community (Slide 9 & Slide 12).
  • esports team performance and academy programs to maintain competitive success and feeder talent (Slide 12).

The Ask

What they were raising and use of funds:

  • Raise: Series A $19M (deck reflects this ask).
  • Use of proceeds (Slide 12: “What will we use your money for?”):
    1. Excellence in Performance — expand performance team, academies, facilities (Berlin referenced).
    2. Digital ramp-up — Fnatic members, Fnatic OP tools and digital product development.
    3. In-house studio — content production and marketing uplift, partner content.
    4. Expansion — expand titles and global presence (explicit example: relocate Rainbow6 team to Japan).
  • The deck does not present a detailed line-item budget or timetable for the $19M.

Investor Deep Dive

Executive summary, strengths & red flags

Executive Summary

Fnatic’s Series A deck positions a legacy esports team as a consumer entertainment brand with multiple monetization engines: competitive teams, branded partnerships, consumer products (gear/apparel) and digital products. The deck leans on category-scale statistics, strong viewership / social traction, marquee partners and product ambitions to justify expansion and further investment in performance, digital products, content and geographic/title expansion.

Key Strengths

3 identified

1

Clear category narrative and big TAM signal — Slide 2 presents stark category numbers ($146B gaming) and time-spent comparisons that justify betting on gaming as the dominant entertainment vertical. This is a strong macro storytelling anchor.

2

Strong, measurable traction — slides offer concrete audience and performance metrics (73M hours watched in 2019, 16M social followers, 262k average viewers, 370+ medals, $15.7M prize money) that validate Fnatic’s market leadership and fanbase.

3

Diverse monetization strategy and blue-chip partners — the deck presents multiple revenue engines (sponsorships, products, digital, esports rights) plus partnerships with major brands (AMD, OnePlus, BMW, Gucci, Nike), which reduces single-channel risk and demonstrates commercial traction.

Red Flags & Weaknesses

3 identified

1

Lack of financials and unit economics — no revenue figures, margins, CAC, LTV, ARR, or growth rates are presented. Investors cannot assess current monetization effectiveness or runway impact from the deck alone.

2

No explicit SAM / SOM or financial modeling — market sizing is high-level (TAM) but there is no clear, defensible financial projection or revenue-by-segment analysis showing how Fnatic will capture a share of the market.

3

Team and operational detail missing — there are no leadership bios, org charts or evidence of operational depth / background on scaling consumer hardware/digital products. For a capital raise focused on product and digital expansion, investors typically want named execs with track records.

More Pitch Decks To Study

Compare structure, fundraising context, and investor-facing story across similar startup decks.