Compare your deck to Facebook

Compare Your Deck

Facebook Pitch Deck (2004)

Social
Stage: Ads Pitch
Raised: N/A
Year: 2004
Slides: 10
Outcome: IPO, now Meta valued at $1T+

Pitch Deck

1 / 10
Facebook pitch deck - The Opening: Strong, focused branding and frame
Click to expand

Deck Analysis

This is an analysis of Facebook's original 2004 pitch materials (the early media/pitch deck labeled thefacebook.com). The deck is notable for communicating a simple product idea — a college social directory — with strong visual branding, early social proof, and a clear explanation of product features that create network effects. What makes it remarkable is how the founders prioritized product clarity, audience targeting (campus-by-campus rollout), and evidence of traction rather than overblown financial projections — a template many successful consumer startups have since followed.

The Opening: Strong, focused branding and frame

The Opening: Strong, focused branding and frame

The title slide (SLIDE 1) uses a single, bold brand treatment and a compact subtitle (“Media Kit”), immediately signaling professionalism and clarity. The simple blue background with the recognizable mark centers attention and sets a consistent visual tone for the rest of the deck. By treating the pitch as a 'media kit' rather than an investor-only document, the founders position the product as public-facing and press-ready, which amplifies credibility.

Founders can learn from this economy of design — open with a recognizable identity and a one-line descriptor that frames how the audience should read the rest of the slides. The visual consistency also helps; a tight color palette and a single type hierarchy reduce cognitive load and let the content speak for itself. This approach builds immediate trust and reduces friction when the deck transitions into product details and metrics.

Key Takeaway: Open with a bold, simple brand frame and a concise descriptor that defines the narrative lens for the entire deck.
Using press to create social proof and urgency

Using press to create social proof and urgency

The press quote slide (SLIDE 3) leads with an external endorsement — a dramatic headline from The Stanford Daily about students skipping class and being ‘utterly fascinated.’ This is an early example of using third‑party validation to demonstrate demand and cultural relevance. The large, pull-quote style combined with a background image of students using a phone ties product usage to social behavior, making the claim both emotional and concrete.

For founders, leveraging real press or user testimonials is an effective way to show traction without relying solely on raw numbers. A well-placed quote can communicate virality and urgency, especially when it comes from a respected source in the product’s target community. The visual treatment matters: make the quote readable, attribute it clearly, and pair it with imagery that reinforces the message.

Key Takeaway: Include an early, prominent third‑party quote or testimonial to convert product interest into credible social proof.
Clear product definition: what the product actually is

Clear product definition: what the product actually is

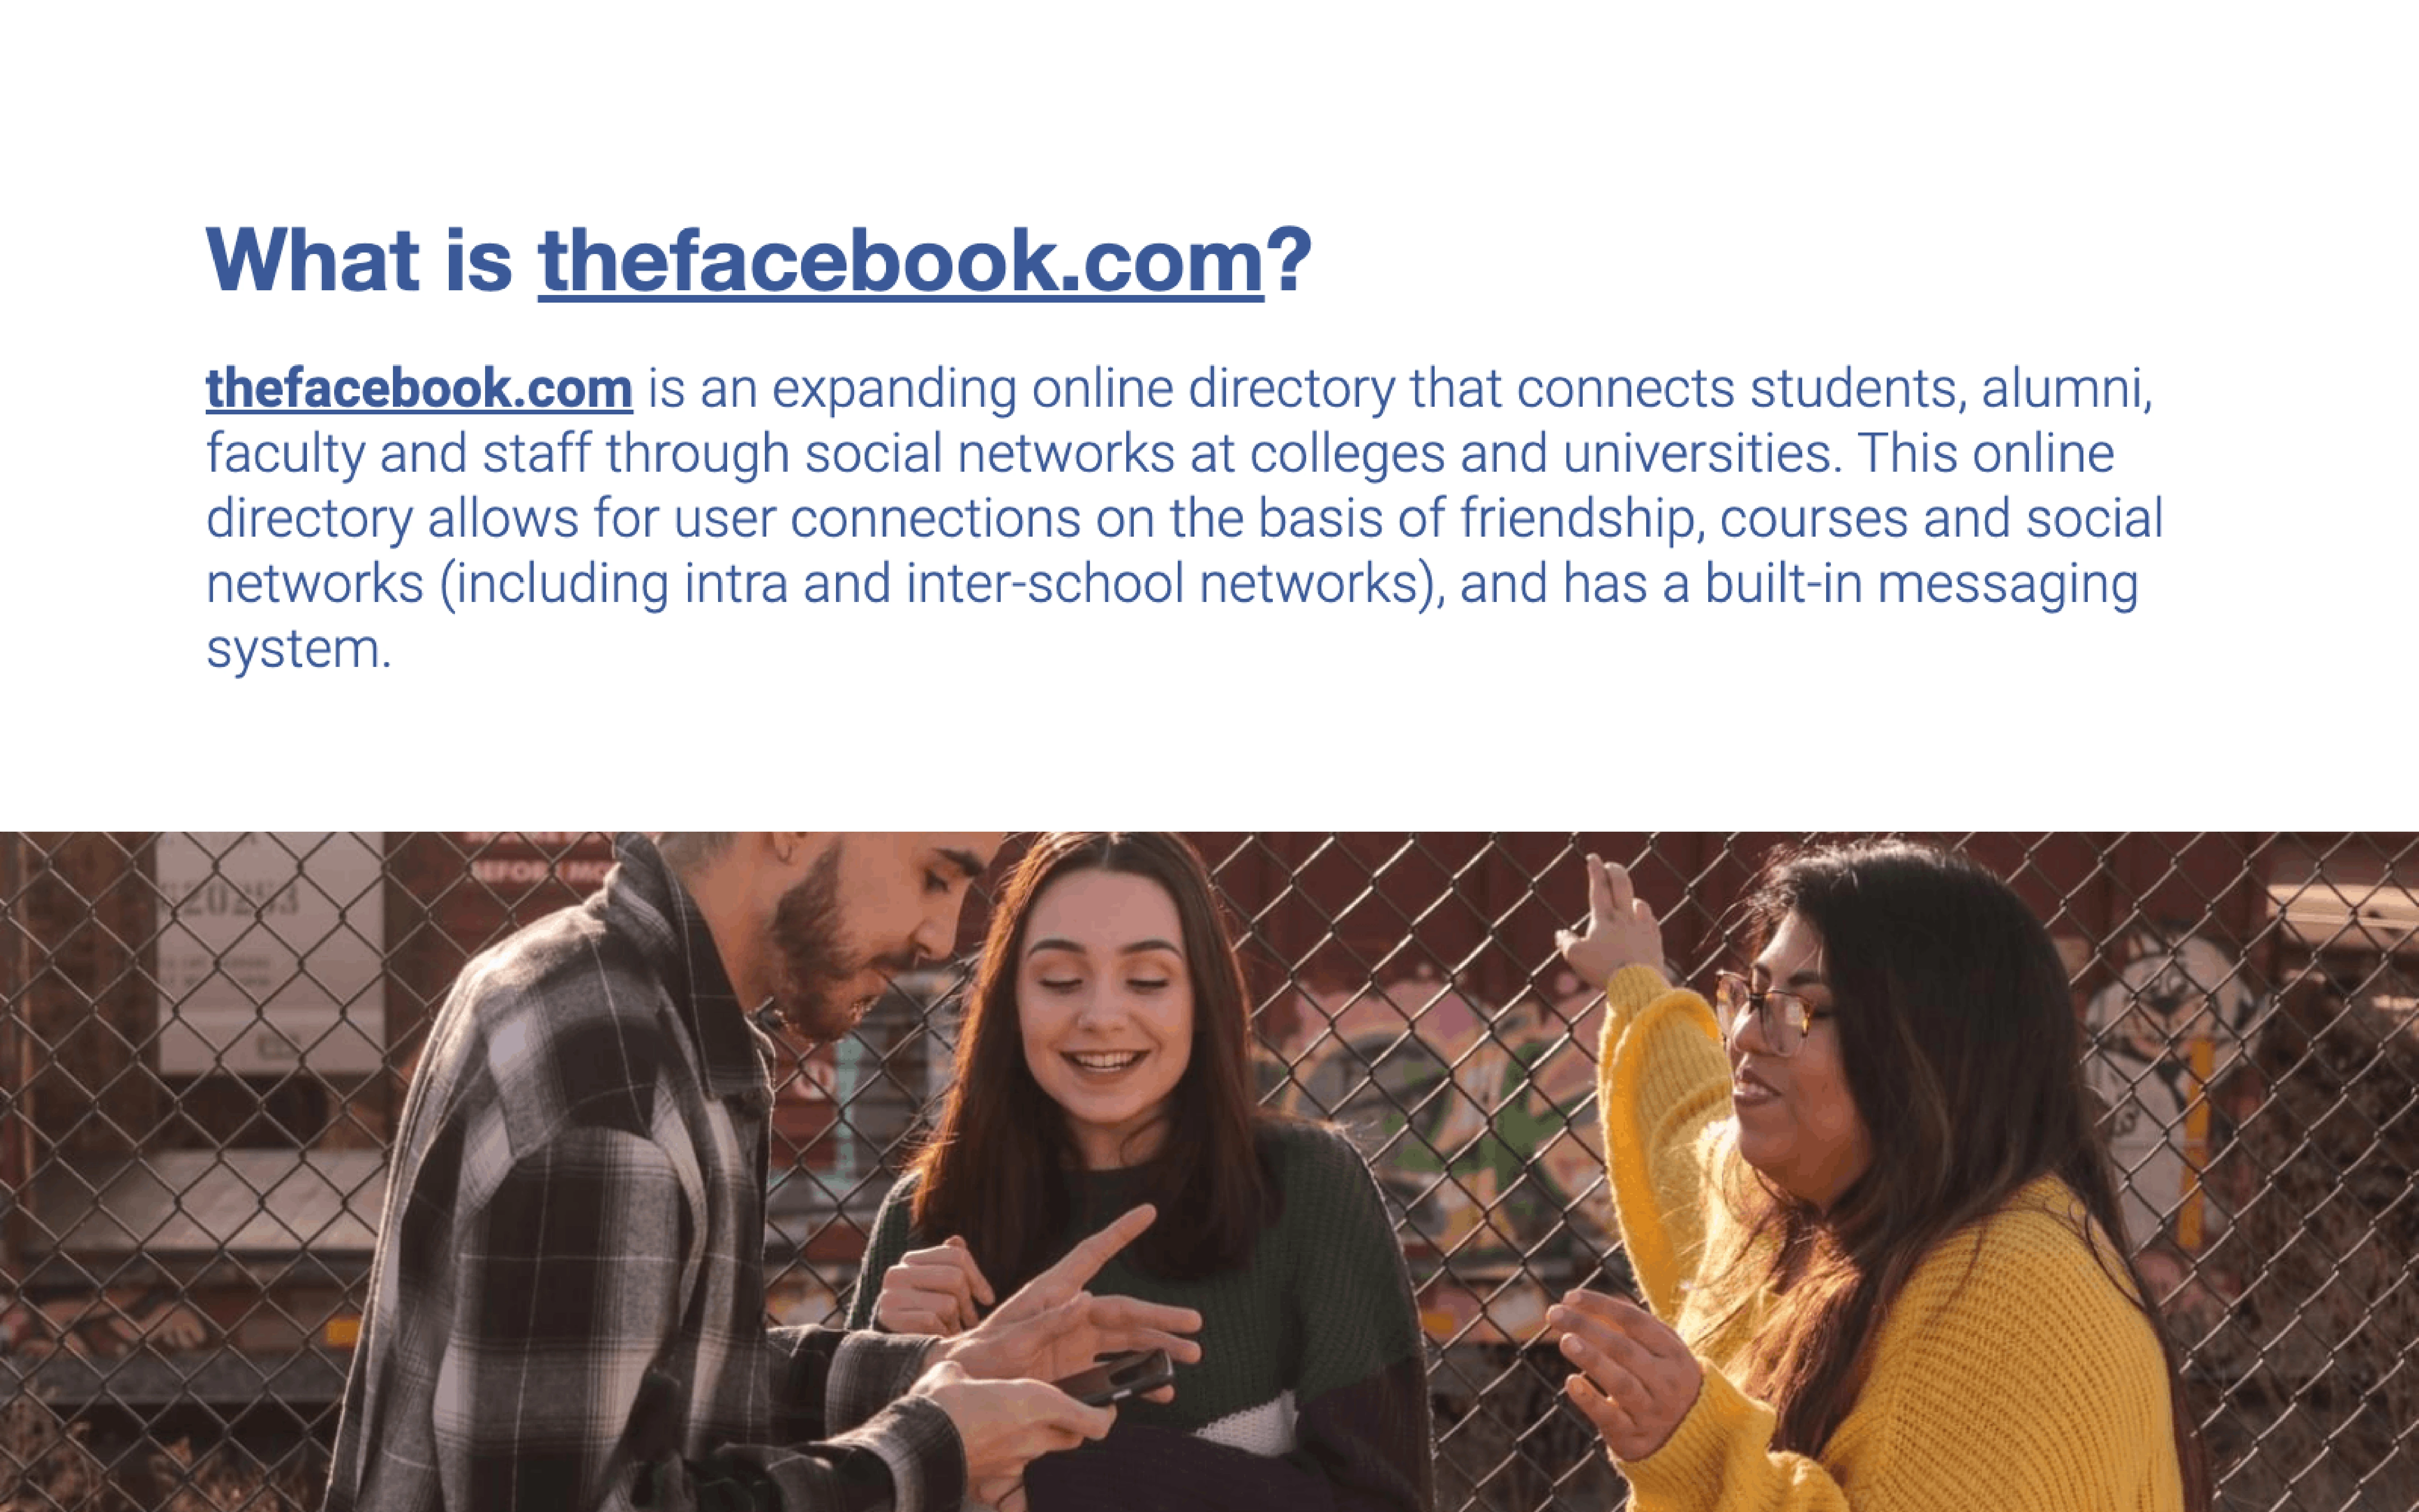
The 'What is thefacebook.com?' slide (SLIDE 4) provides a concise definition that explains who the product serves, what it does, and how it connects users. It describes the site as an 'expanding online directory' with social networking features and a messaging system — all in plain language without technical jargon. This kind of upfront product definition is crucial to bring any audience to the same baseline understanding before introducing features or metrics.

Founders should emulate this clarity: define the core value proposition in one or two sentences and explain the primary user flows. Doing so prevents confusion and allows the rest of the deck to focus on traction, monetization, or competitive advantage. The slide also hints at multi-dimensional connections (friendship, courses, social networks), which foreshadows the network effects that the product exploits.

Key Takeaway: Start with a plain-language one-paragraph product definition that explains who it’s for and the core value it delivers.
Product detail: user profile as the atomic unit

Product detail: user profile as the atomic unit

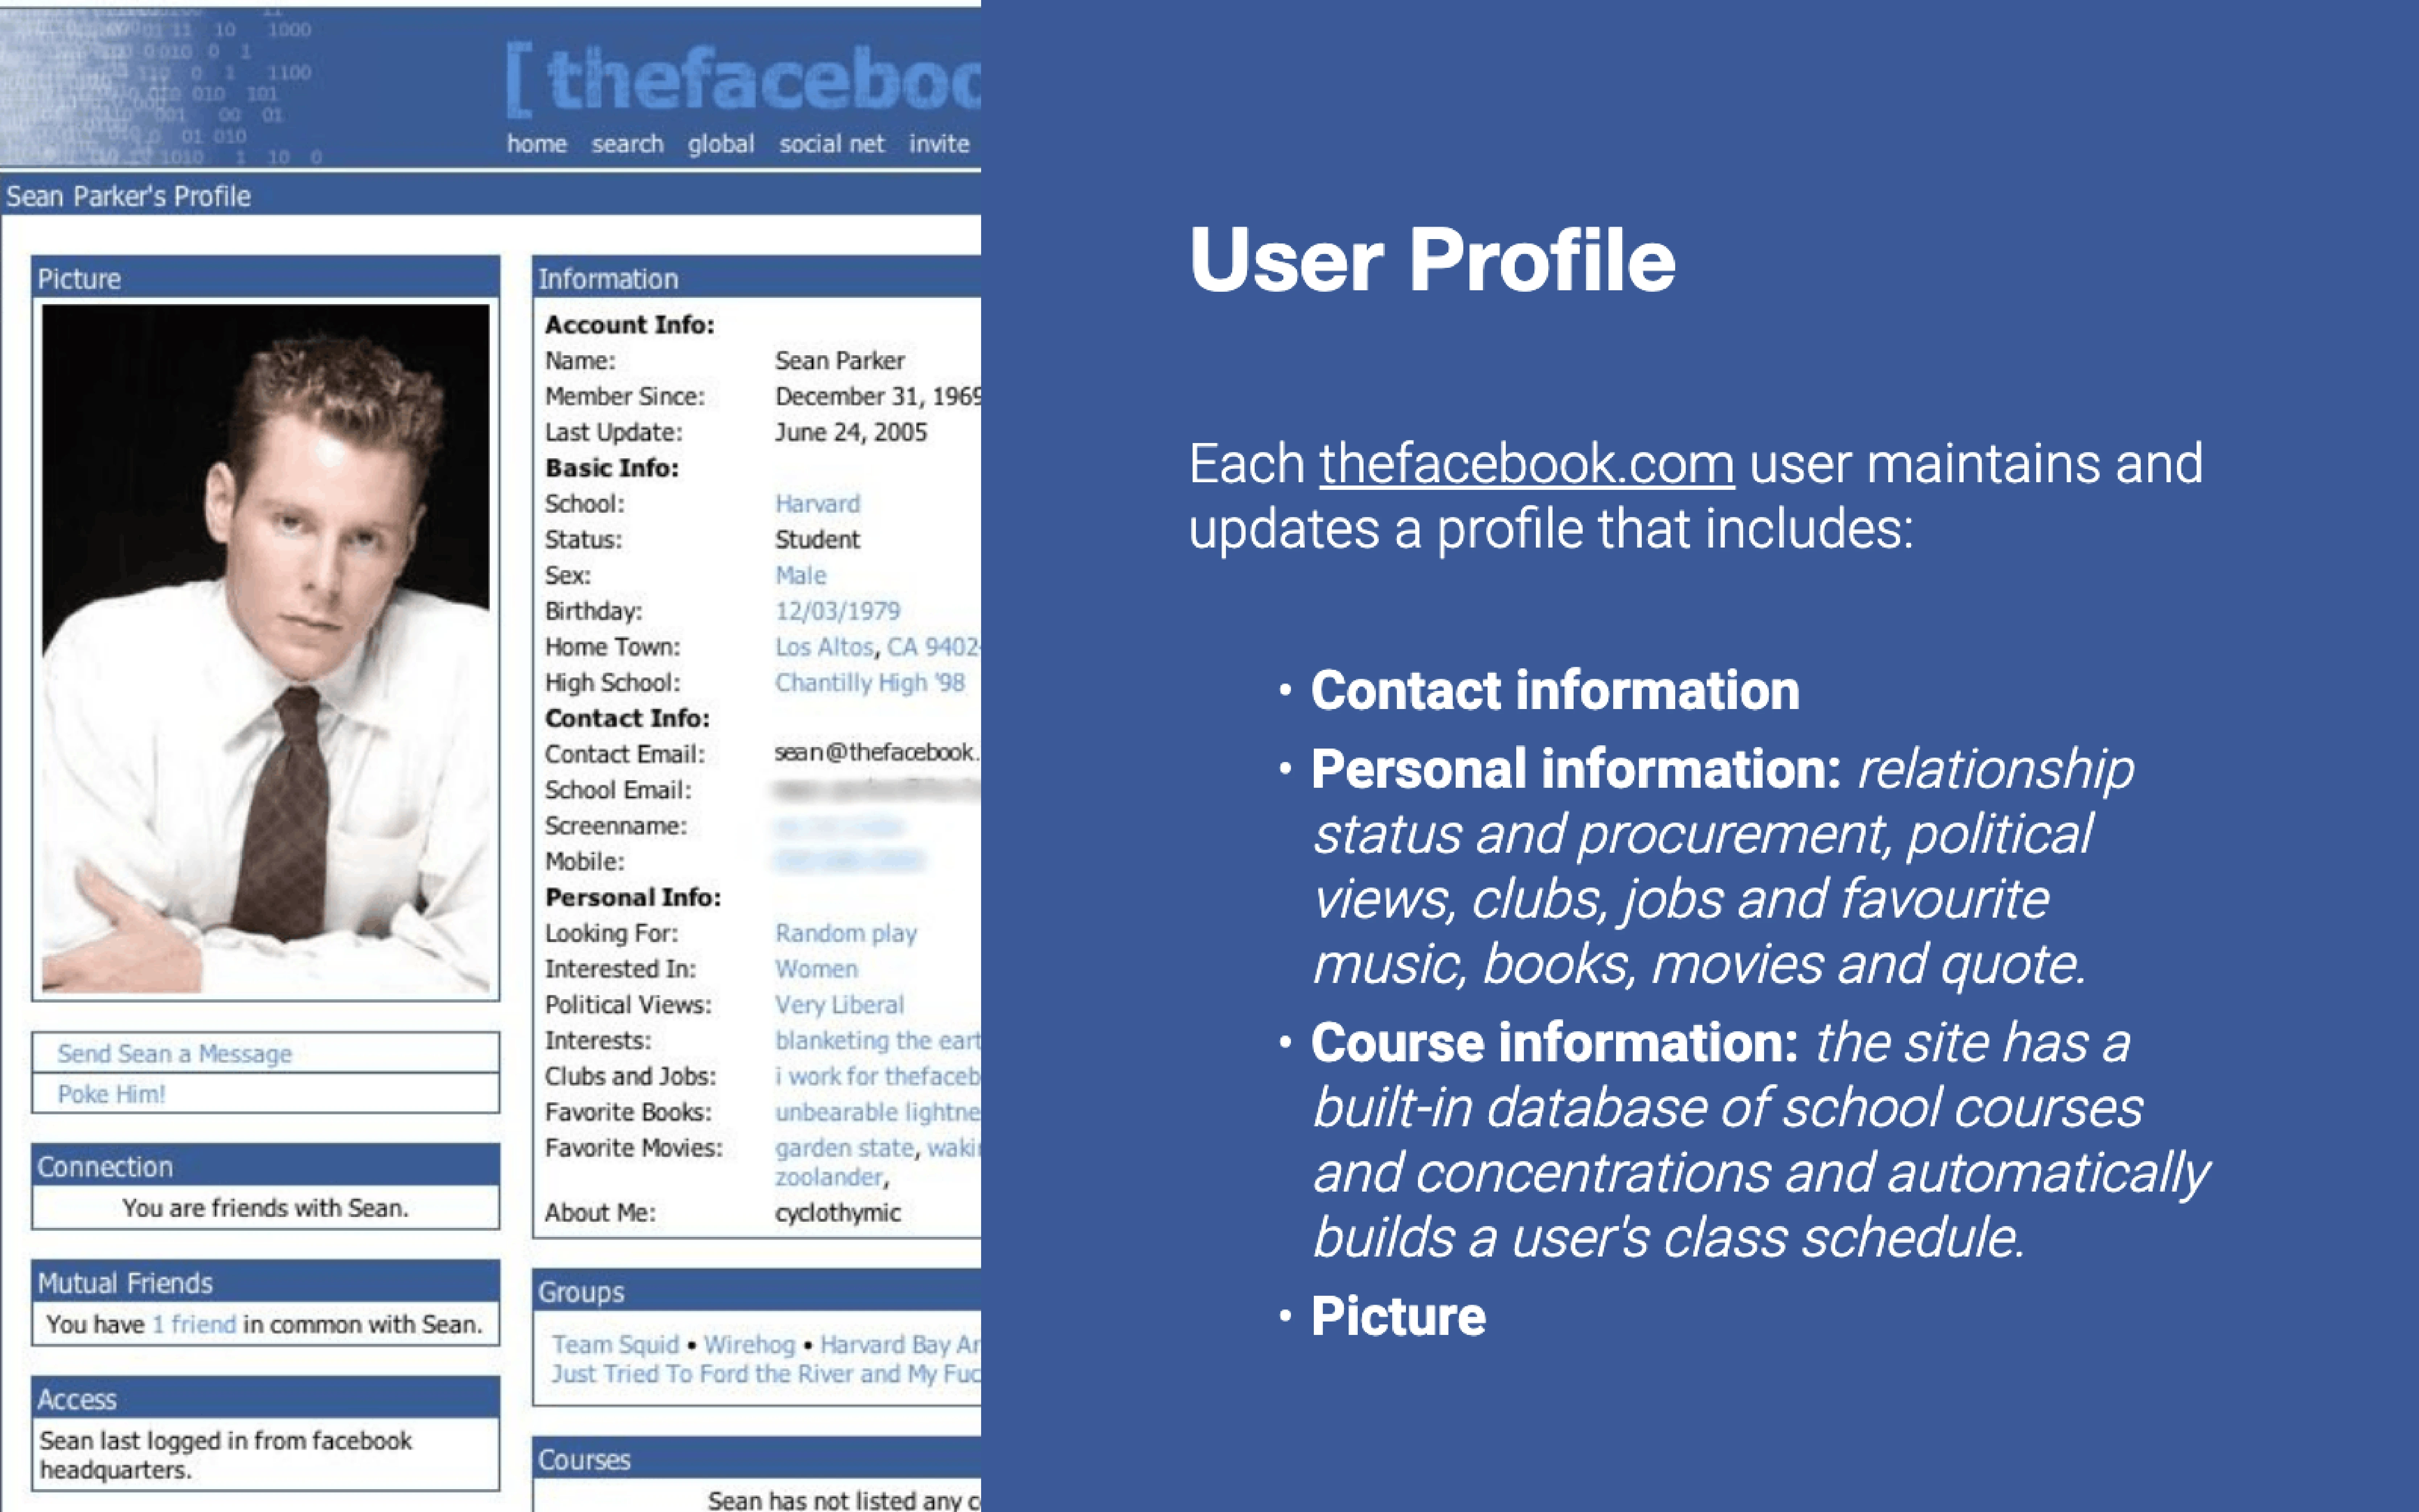
The user profile slide (SLIDE 5) breaks down the individual profile into clear components — contact info, personal details, course information, and a picture — and pairs a screenshot of an actual profile. Presenting an example profile makes the product tangible and demonstrates how data points enable discovery and connection. The slide emphasizes that profiles are both self-updated and structured, showing how the founders designed for both personal expression and searchable attributes.

For founders building consumer products, this is a useful pattern: show the atomic unit of the product (a profile, a listing, a playlist) and explain how it drives engagement and discoverability. Use real screenshots or mockups and annotate them to show the functional intent. This builds confidence that product features are thought through and usable from day one.

Key Takeaway: Expose the atomic unit of your product with a real or believable mockup and explain how its fields drive user value and searchability.
Feature-driven network effects: intra-school discovery

Feature-driven network effects: intra-school discovery

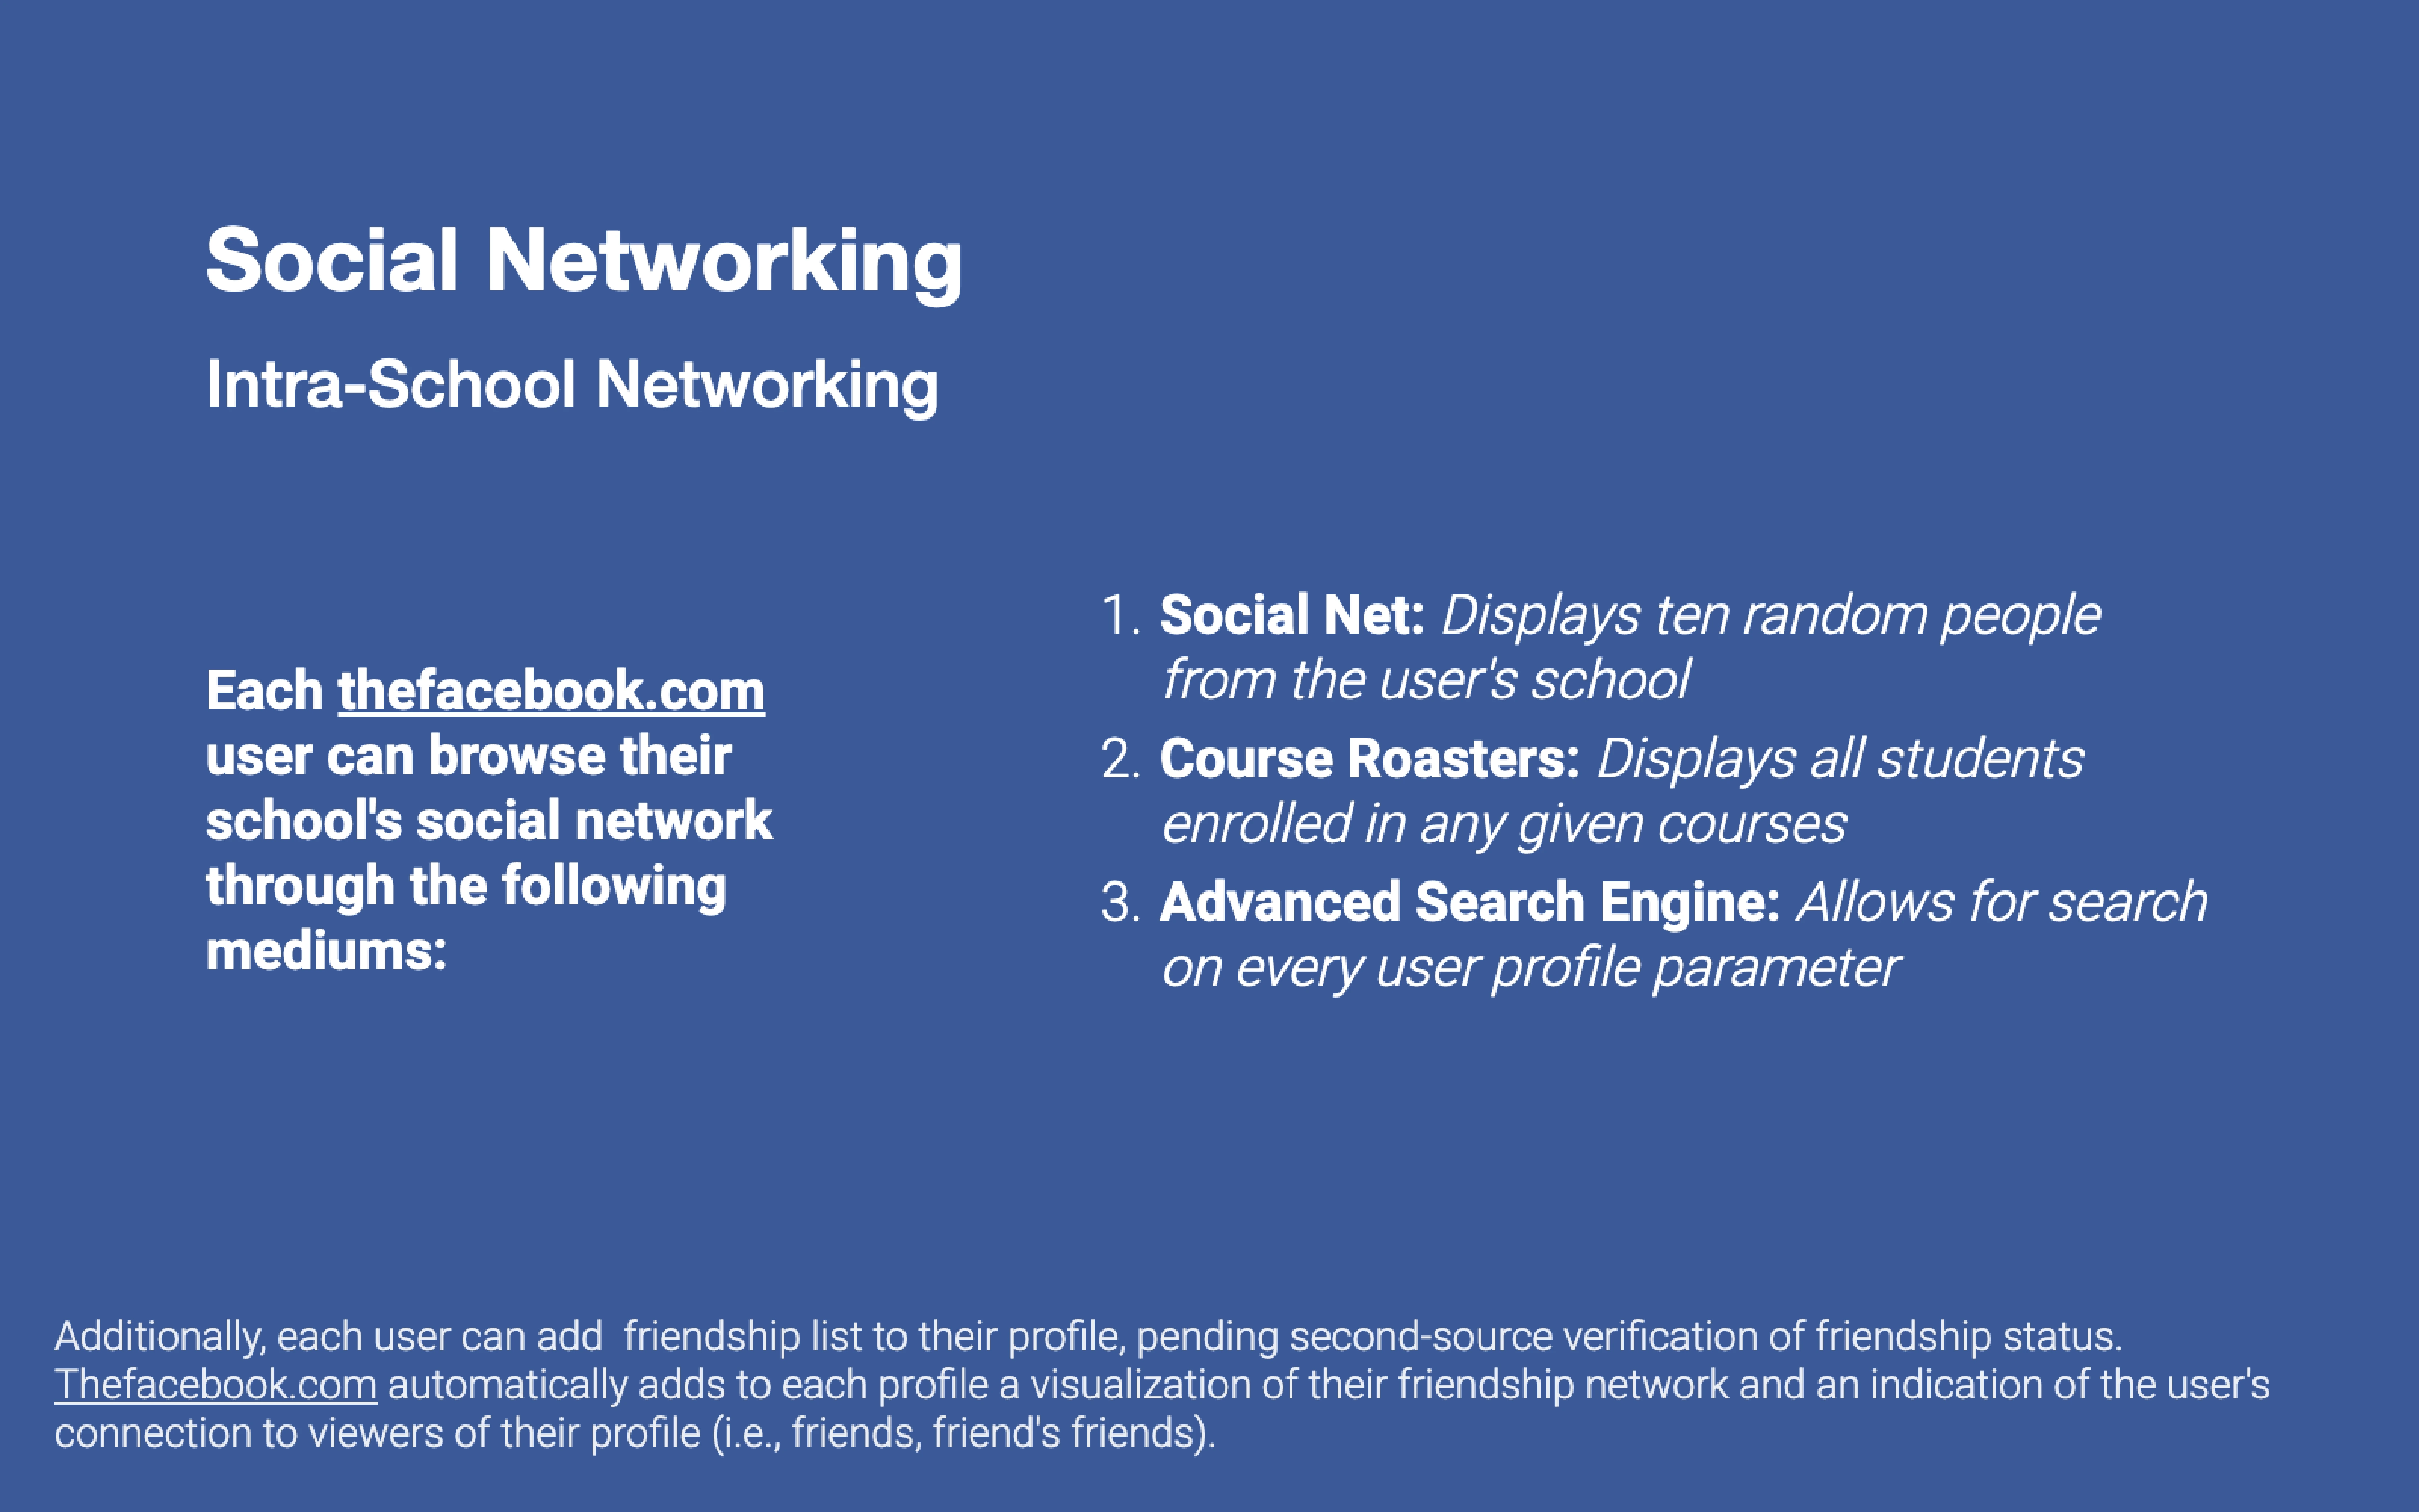
The Social Networking slide (SLIDE 7) outlines concrete mechanisms for discovery (Social Net, Course Roasters, Advanced Search). Each item is specific and tied to how users find one another, which articulates the sources of network effects. Importantly, the slide mixes short feature names with brief explanations, making it easy for readers to see how each feature contributes to the product’s viral loop and engagement.

Founders should be explicit about the levers they’ll use to generate network effects. Rather than vague claims, list precise features and how they translate into user interactions and growth. This helps investors evaluate defensibility and the uphill cost of copying the product. The slide’s minimalist format — headline plus concise description — is an effective way to present product mechanics without overwhelming the audience.

Key Takeaway: List specific discovery features and explain how each contributes to network effects and user acquisition.
The rollout playbook: targeted expansion and traction data

The rollout playbook: targeted expansion and traction data

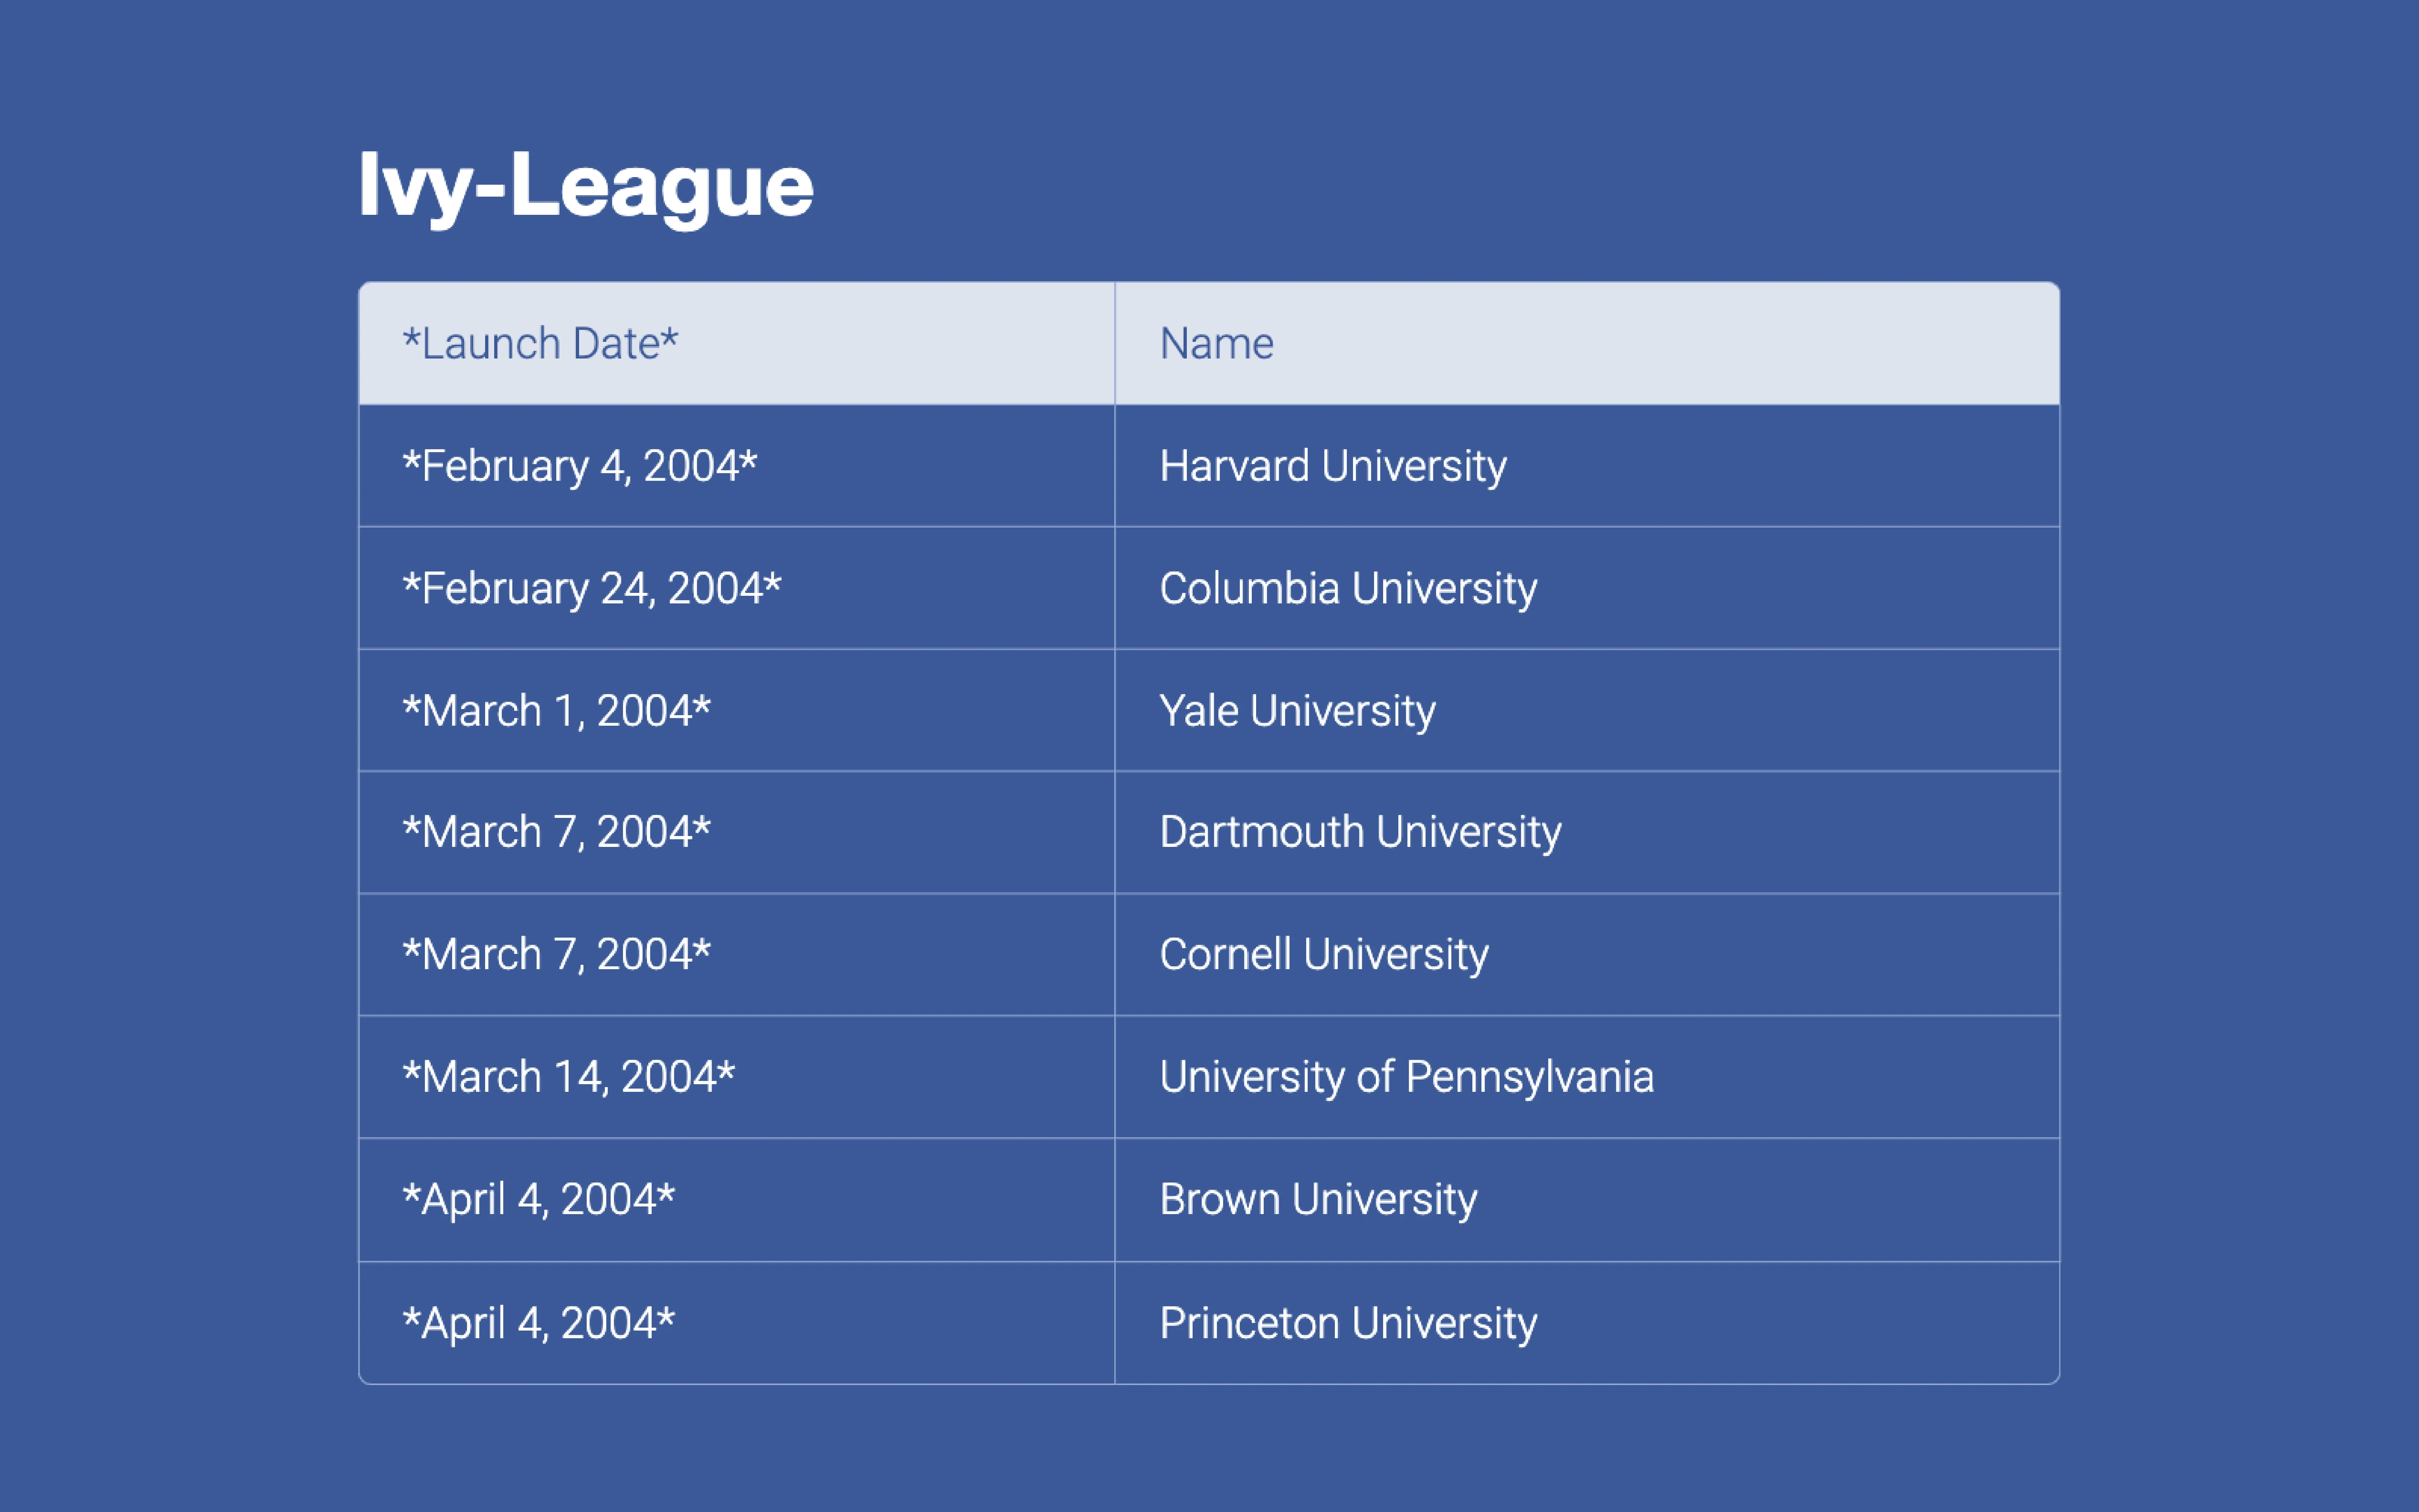
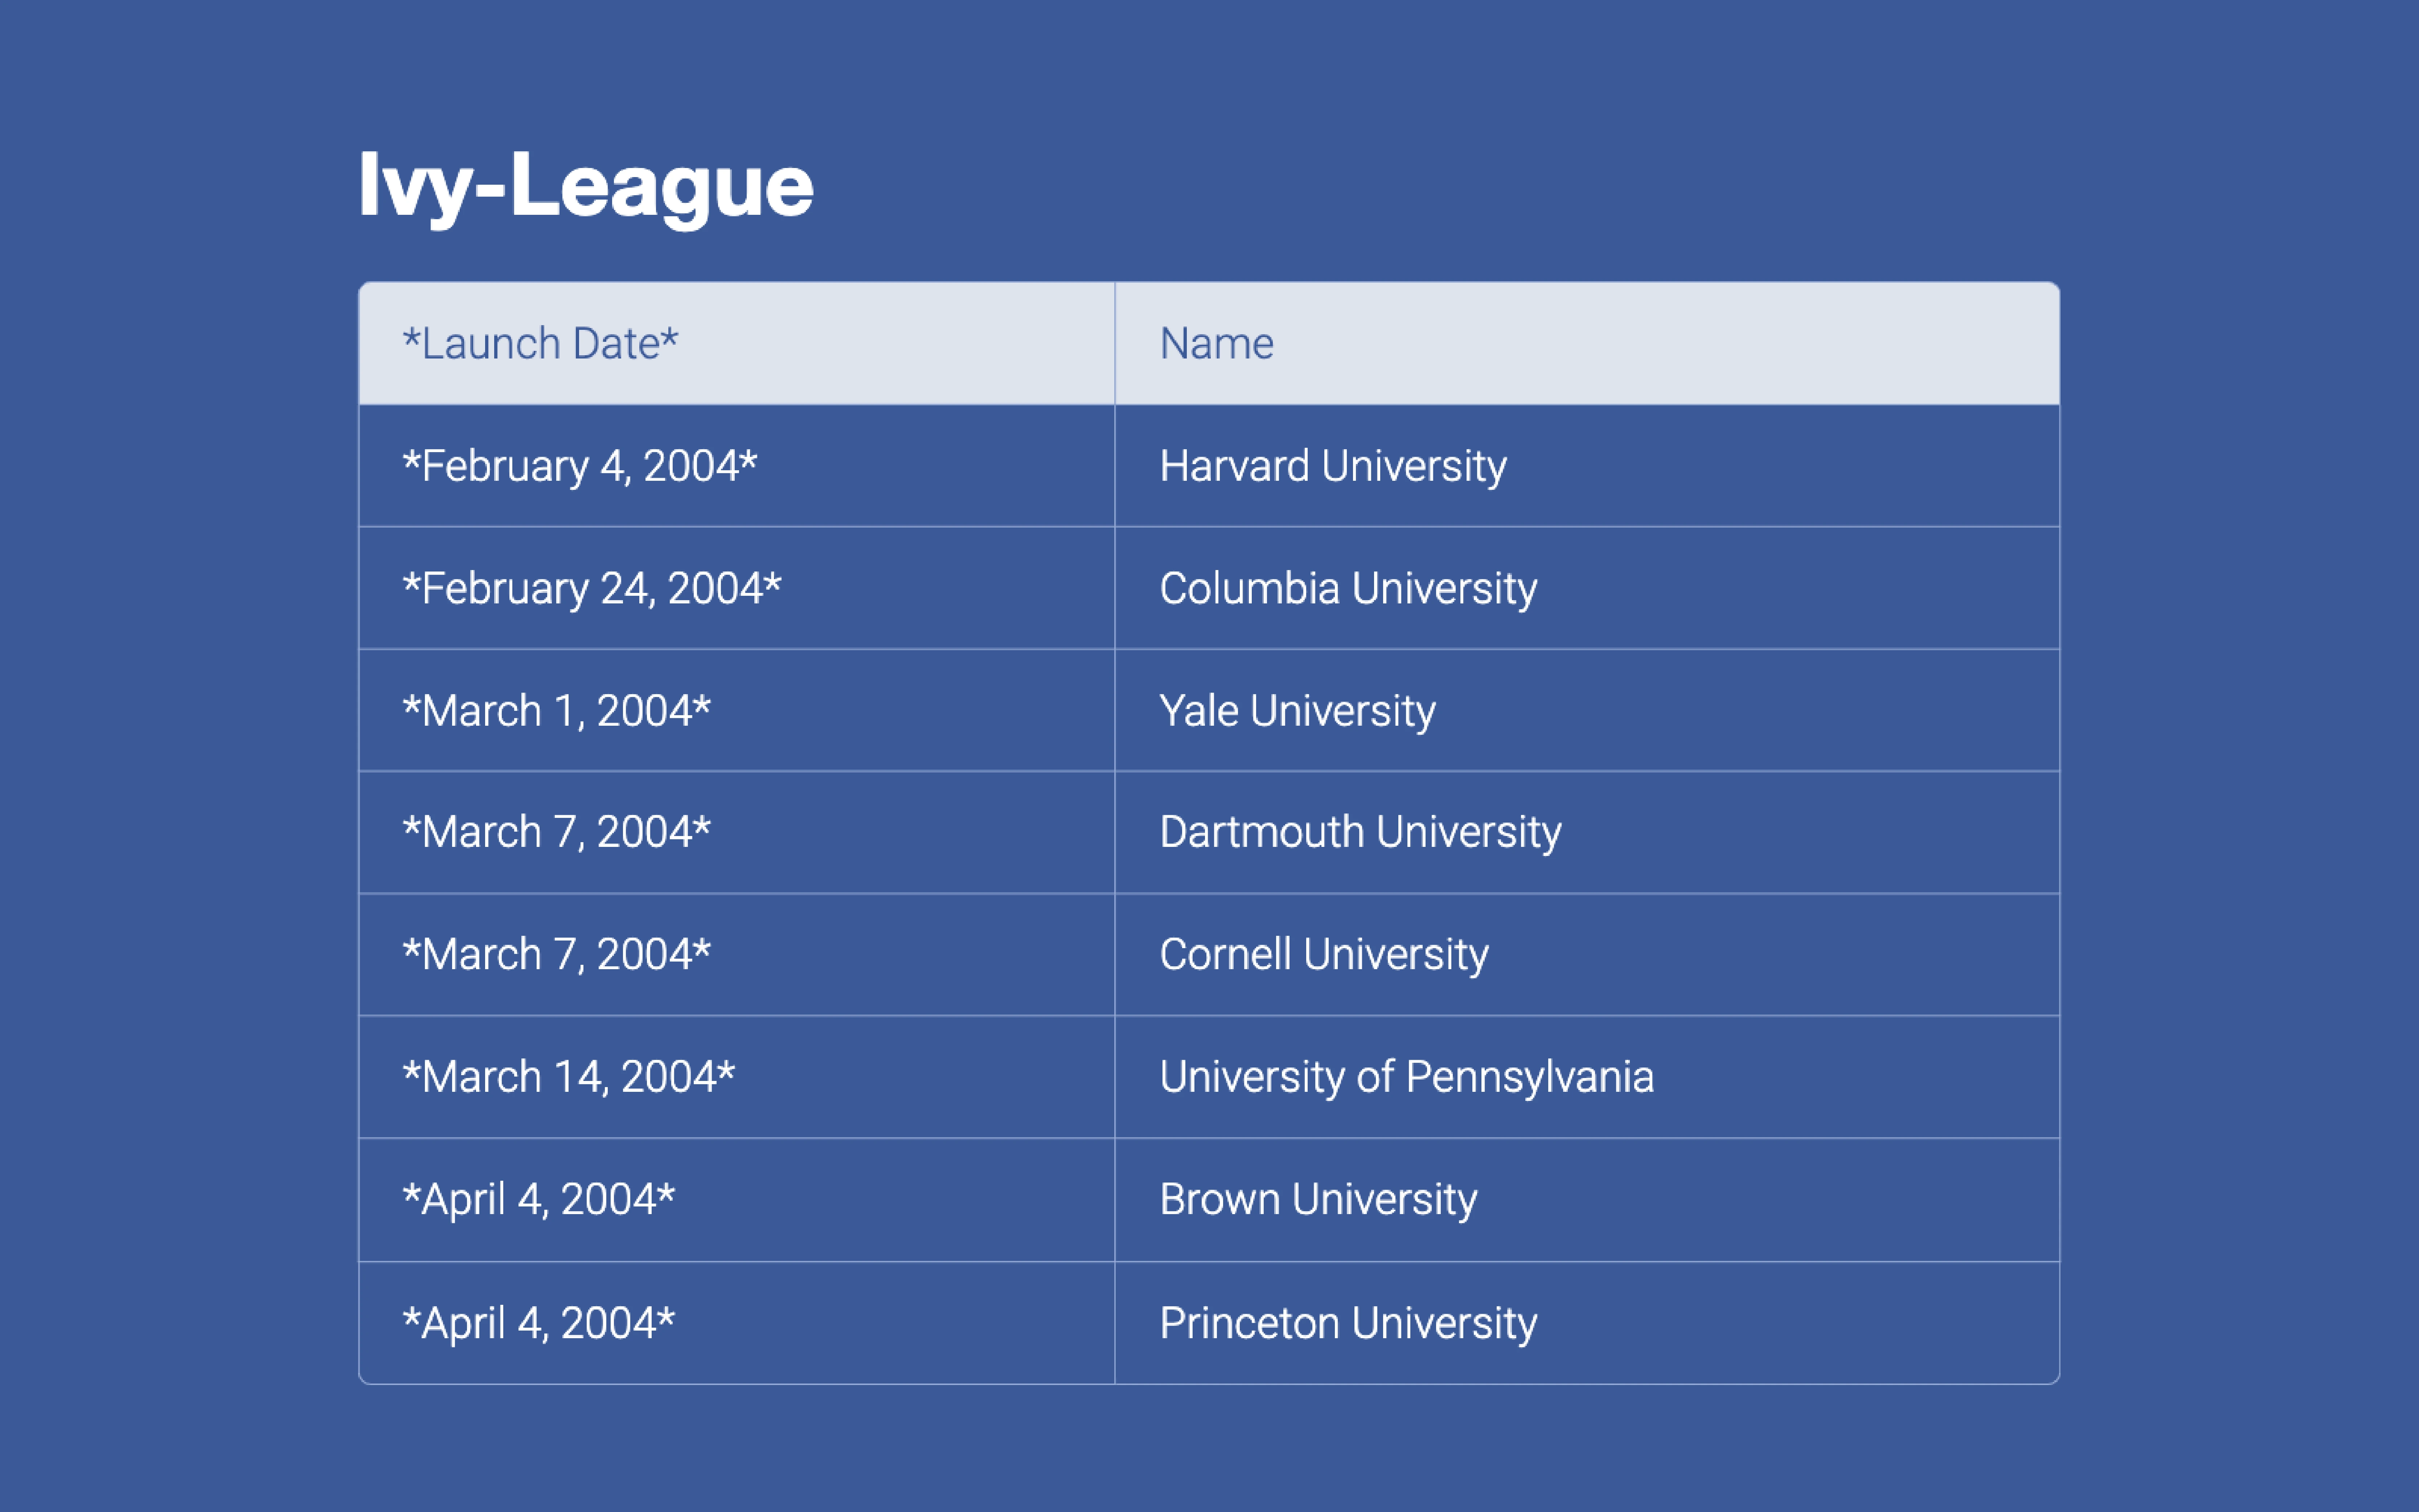
The Ivy‑League table (SLIDE 9) presents a simple, verifiable rollout timeline — dates paired with each college launch. This level of granularity communicates traction and a deliberate expansion strategy (college-by-college) rather than a scattershot national launch. The table format makes it easy to scan progress and reinforces that growth was planned, measured, and replicable across similar communities.

Founders can borrow this approach by showing concrete milestones and the playbook for geographic or segment expansion. Investors want to see not only that you have growth but how you’ll replicate it. A short timeline or table that ties openings to lift in users or activation rates is a clear, credible way to show repeatability.

Key Takeaway: Show a clear, repeatable rollout plan with verifiable milestones to demonstrate traction and repeatability.

Conclusion: Key Lessons

Facebook’s original deck excels at clarity, social proof, and a product-first narrative. It starts with strong branding, uses press and screenshots to prove demand, defines the product in plain terms, describes the atomic unit (the profile) and the features that create network effects, and closes with a practical expansion timeline. The deck focused on demonstrating real user engagement and replicable distribution rather than speculative financials — a strategy that matched the company’s early priorities.

Actionable advice for founders: lead with a simple product definition and strong branding, use third-party validation and real screenshots to make claims credible, explain the specific features that generate network effects, and present a clear, repeatable rollout plan with verifiable milestones. Keep slides visual, concise, and framed so each element reinforces why the product will scale.

Full Deck Analysis

11 sections

Overview

Company: Facebook
Round: Ads Pitch / Media Kit (N/A - Pre-revenue pitch)
Year: 2004
Launch Date: February 4, 2004
Pitch Date: April 10, 2004 (implied)
Outcome: IPO (May 2012), now Meta valued at $1T+


Executive Summary

This is a product-focused media kit, not a traditional advertising pitch deck. Created just 2 months after Facebook’s launch at Harvard, it demonstrates the company’s early confidence in monetization through advertising. The deck establishes Facebook as a rapidly expanding social network with rich user data, elite institutional prestige, and precise targeting capabilities—the foundational elements of what would become a $114B+ annual ad business. Notably, the deck emphasizes product features and traction over explicit advertiser benefits, suggesting it was designed to educate potential advertisers about the platform’s value rather than close ad deals.


Problem Statement

The deck does not explicitly articulate a problem. Instead, it implicitly addresses:

  1. Fragmented college social networks (Slide 4): Students were scattered across disconnected platforms; Facebook unified them within institutional networks
  2. Lack of targeted audience access (Slides 5-7): Advertisers had no way to reach specific college demographics with precision
  3. Untapped high-value demographic (Slide 9): College students, particularly at elite institutions, were underserved by existing advertising channels

The social proof quote (Slide 3) frames the problem as opportunity: “Classes are being skipped. Work is ignored. Students are spending hours in front of the computer in utter fascination.” This positions Facebook as capturing user attention at unprecedented scale.


Solution

Facebook positions itself as a comprehensive social directory with built-in advertising infrastructure.

Core Solution Components (Slides 4-7):

  1. Online Directory (Slide 4): “An expanding online directory that connects students, alumni, faculty and staff through social networks at colleges and universities”

  2. Rich User Profiles (Slide 5): Each user maintains a profile including:
    • Contact information
    • Personal information (relationship status, political views, interests, music, books, movies)
    • Course information (auto-built class schedule)
    • Photo
  3. Advanced Data Integration (Slide 6): Automatically aggregates:
    • School news articles mentioning the user
    • Last AIM away message
    • Last access location (with built-in dorm database)
  4. Networking Features (Slide 7):
    • Social Net (10 random users from school)
    • Course Rosters (all students in given courses)
    • Advanced Search (search on every profile parameter)
    • Friendship network visualization

The implicit advertising solution: All this data enables precise, granular targeting of engaged users.


Market Opportunity

TAM/SAM/SOM Analysis:

The deck does not explicitly quantify market opportunity. However, we can extract implied scope:

Addressable Market (Implied):

  • Primary: College students at elite institutions
  • Secondary: Alumni, faculty, staff at those institutions
  • Geographic: Northeast corridor (8 Ivy League schools as of April 2004)

Expansion Potential (Implied but not quantified):

  • Slide 8 mentions “expansion” but doesn’t project total addressable schools
  • No data on total college population or advertising spend in college market
  • No competitive market sizing

What’s Missing:

  • Total addressable market (TAM) in dollars
  • Number of college students nationally
  • Existing college advertising spend
  • Projected user growth
  • Revenue projections

Inference from Traction:

  • 8 schools in 60 days suggests ~1 school per 7.5 days
  • If this velocity continued: ~48 schools per year
  • But no projection is made

Business Model

The deck does not explicitly state a business model.

Implicit Revenue Model (Inferred from product features):

  1. Targeting-based advertising (implied by Slides 5-7):
    • Rich user data enables precise demographic targeting
    • Course-based targeting (by major/academic interest)
    • Behavioral targeting (interests, political views, relationship status)
    • Social targeting (friends, friend’s friends)
    • Location targeting (dorm/campus location)
  2. Likely pricing model (not stated):
    • CPM (Cost Per Mille) - traditional display advertising
    • CPC (Cost Per Click) - performance-based
    • Sponsored content/branded pages (implied by “course rosters” and “groups”)
  3. Advertiser types (implied):
    • Consumer brands targeting college demographic
    • Financial services (credit cards, banks)
    • Retail (clothing, electronics)
    • Entertainment (movies, music)
    • Recruiting (employers targeting specific majors)

Unit Economics:

  • Not provided
  • No data on cost per acquisition, lifetime value, or margins

What’s Missing:

  • Explicit pricing model
  • Revenue per user
  • Customer acquisition cost
  • Lifetime value calculations
  • Margin targets
  • Monetization timeline

Traction & Metrics

Growth Metrics (Specific Numbers):

Metric Value Source
Launch Date February 4, 2004 Slide 8
Launch Location Harvard University Slide 8
Pitch Date April 10, 2004 Slide 8
Time to Expansion 2 months Calculated
Schools Launched 8 (all Ivy League) Slide 9
Expansion Velocity 1 school per 7.5 days Calculated

School Expansion Timeline (Slide 9):

  • Feb 4: Harvard University
  • Feb 24: Columbia University (+20 days)
  • Mar 1: Yale University (+5 days)
  • Mar 7: Dartmouth University & Cornell University (+6 days, simultaneous)
  • Mar 14: University of Pennsylvania (+7 days)
  • Apr 4: Brown University & Princeton University (+21 days, simultaneous)

Proof Points:

  1. Viral Adoption (Slide 3):
    • Source: The Stanford Daily, 03/05/2004
    • Quote: “Classes are being skipped. Work is ignored. Students are spending hours in front of the computer in utter fascination. Thefacebook.com craze has swept through campus.”
    • Implication: Organic, grassroots adoption without marketing
  2. Prestigious Institutions (Slide 9):
    • All 8 Ivy League schools + peer institutions
    • Suggests network effects and inter-school connectivity
  3. Engagement Signals (Slide 3):
    • “Hours in front of the computer” suggests high daily active usage
    • “Craze has swept through campus” suggests viral coefficient > 1

What’s Missing:

  • Total registered users
  • Daily/monthly active users
  • Engagement metrics (time spent, posts per user, etc.)
  • Retention rates
  • Churn rates
  • Network growth rate (users per day)
  • Geographic expansion rate

Competitive Positioning

The deck does not mention competitors.

Implied Competitive Advantages:

  1. Institutional Focus (Slides 4, 9):
    • Exclusive focus on colleges/universities
    • vs. Friendster (broader social network)
    • vs. Orkut (international focus)
  2. Real Identity (Slide 5):
    • Verified profiles with real names, photos, contact info
    • vs. Anonymous/pseudonymous competitors
  3. Rich Data (Slides 5-7):
    • Course information, dorm location, AIM integration
    • vs. Competitors with basic profile data
  4. Network Effects (Slide 7):
    • Inter-school networking (friends, friend’s friends)
    • vs. Single-school networks
  5. Prestige (Slide 9):
    • Ivy League + elite institutions only
    • vs. Open-to-all competitors

What’s Missing:

  • Explicit competitive analysis
  • Market share data
  • Competitor feature comparison
  • Defensibility/moat explanation
  • Why Facebook will win

Team

The deck does not mention the team.

Inferred Team Member:

  • Sean Parker (Slide 5): Profile used as example; co-founder
    • Member Since: December 31, 1969 (joke date)
    • School: Harvard
    • Status: Student

What’s Missing:

  • Founder bios
  • CEO/leadership credentials
  • Prior experience
  • Advisory board
  • Key hires
  • Organizational structure

Go-to-Market Strategy

The deck does not explicitly outline GTM strategy.

Implied GTM Approach:

  1. Institutional Expansion (Slide 8):
    • Launch at prestigious institution (Harvard)
    • Expand to peer institutions (other Ivies)
    • Strategy: Build prestige, then expand
  2. Organic Growth (Slide 3):
    • Viral adoption (“craze has swept through campus”)
    • Word-of-mouth from students
    • No paid marketing mentioned
  3. Network Effects (Slide 7):
    • Inter-school networking drives adoption
    • Each new school adds value to existing schools
    • Flywheel effect
  4. Advertiser Acquisition (Implied):
    • This media kit is the GTM tool
    • Direct outreach to brands targeting college demographic
    • Likely: Sales team reaching out to advertisers

What’s Missing:

  • Advertising sales strategy
  • Advertiser onboarding process
  • Sales team size/structure
  • Customer acquisition timeline
  • Partnership strategy
  • International expansion plan

The Ask

The deck does not state what Facebook is raising or seeking.

Inferred Context:

This appears to be a media kit for advertisers, not a fundraising pitch. Therefore:

  • Not seeking: Venture capital (at this stage)
  • Seeking: Advertiser commitments and ad spend
  • Use of funds: Implied to be product development and expansion to more schools

Historical Context:

  • Facebook raised $500K seed round from Peter Thiel (May 2004) - after this pitch
  • Series A ($12.7M) came later in 2005

What’s Stated:

  • Nothing explicit about fundraising

Investor Deep Dive

Executive summary, strengths & red flags

Executive Summary

This is a **product-focused media kit**, not a traditional advertising pitch deck. Created just 2 months after Facebook's launch at Harvard, it demonstrates the company's early confidence in monetization through advertising. The deck establishes Facebook as a rapidly expanding social network with rich user data, elite institutional prestige, and precise targeting capabilities—the foundational elements of what would become a $114B+ annual ad business. Notably, the deck emphasizes product features and traction over explicit advertiser benefits, suggesting it was designed to educate potential advertisers about the platform's value rather than close ad deals.

Key Strengths

6 identified

1

Rapid Traction in Prestigious Institutions

- 8 Ivy League schools in 60 days (Slide 9)

2

Rich, Verified User Data

- Comprehensive profile data (Slides 5-6)

3

Organic, Viral Adoption

- Stanford Daily quote about "craze" (Slide 3)

4

Network Effects & Inter-School Connectivity

- Expansion across multiple schools with course rosters and friend networks (Slides 7-9)

5

Prestige Positioning

- Exclusive focus on Ivy League (Slide 9)

6

Real Identity & Verification

- Real names, photos, contact info (Slide 5)

More Pitch Decks To Study

Compare structure, fundraising context, and investor-facing story across similar startup decks.