Compare your deck to Wayflyer

Compare Your Deck

Wayflyer Pitch Deck (2020)

Fintech
Stage: Series B
Raised: $10.2M
Year: 2020
Slides: 21
Outcome: Valued at $1.6B after Series B (2022)

Pitch Deck

1 / 21
Wayflyer pitch deck - Cover & Executive Framing
Click to expand

Deck Analysis

This deck from Wayflyer (Series B / 2020) is a concise fintech growth-stage pitch that frames a clear working-capital problem for eCommerce merchants and positions Wayflyer as a data-driven, fast underwriting solution. The slides emphasize problem → product → traction → partnerships, using simple visuals, logos and a few compelling KPI charts to build credibility. What makes it notable is the combination of a focused narrative (working capital pain), operational detail (onboarding flow and daily payback mechanics) and early evidence of commercial traction and enterprise partnerships, which together make a persuasive case for investors looking for capital-efficient fintech models.

Cover & Executive Framing

Cover & Executive Framing

The opening slide (cover) is minimal and brand-forward: large company name, a short subline and consistent color palette. This brevity sets expectations — the deck will be direct and product-focused rather than a long narrative. For investors, that signal (clean brand + one-line positioning) helps them immediately place the business in the fintech/eCommerce intersection.

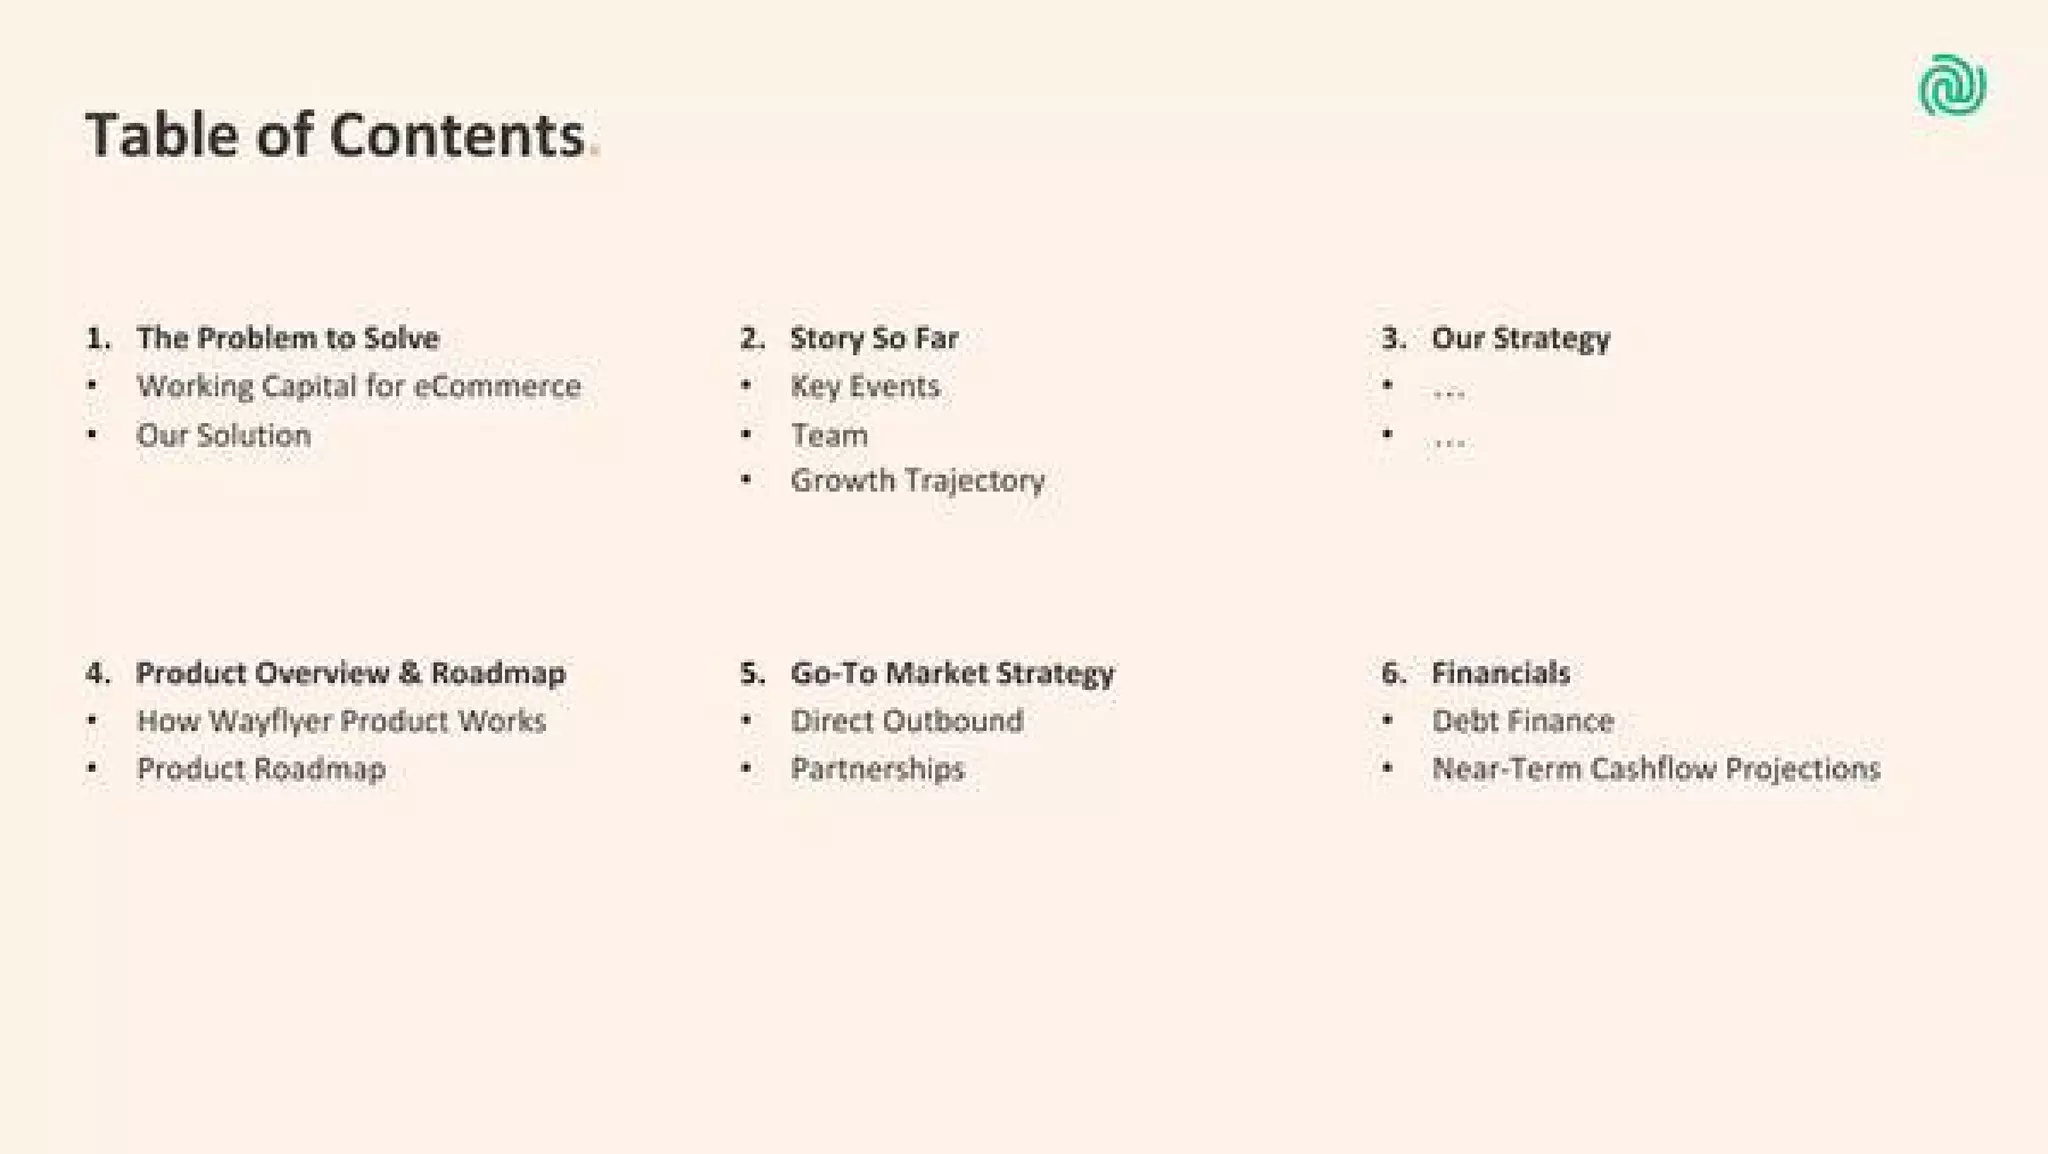
Following the cover the Table of Contents slide maps to the investor mental model: problem, team, product, go-to-market and financials. Presenting the structure up front is effective because it lets listeners know the trajectory of the pitch and where quantifiable evidence (traction, partnerships, KPIs) will appear. Founders learn that a clear roadmap slide reduces friction in meetings and helps steer Q&A to the prepared evidence points.
Key Takeaway: Open with a bold, single-line positioning and a clear agenda so investors quickly understand your thesis and know where to find traction and metrics.
The Problem: Working Capital Gaps for eCommerce

The Problem: Working Capital Gaps for eCommerce

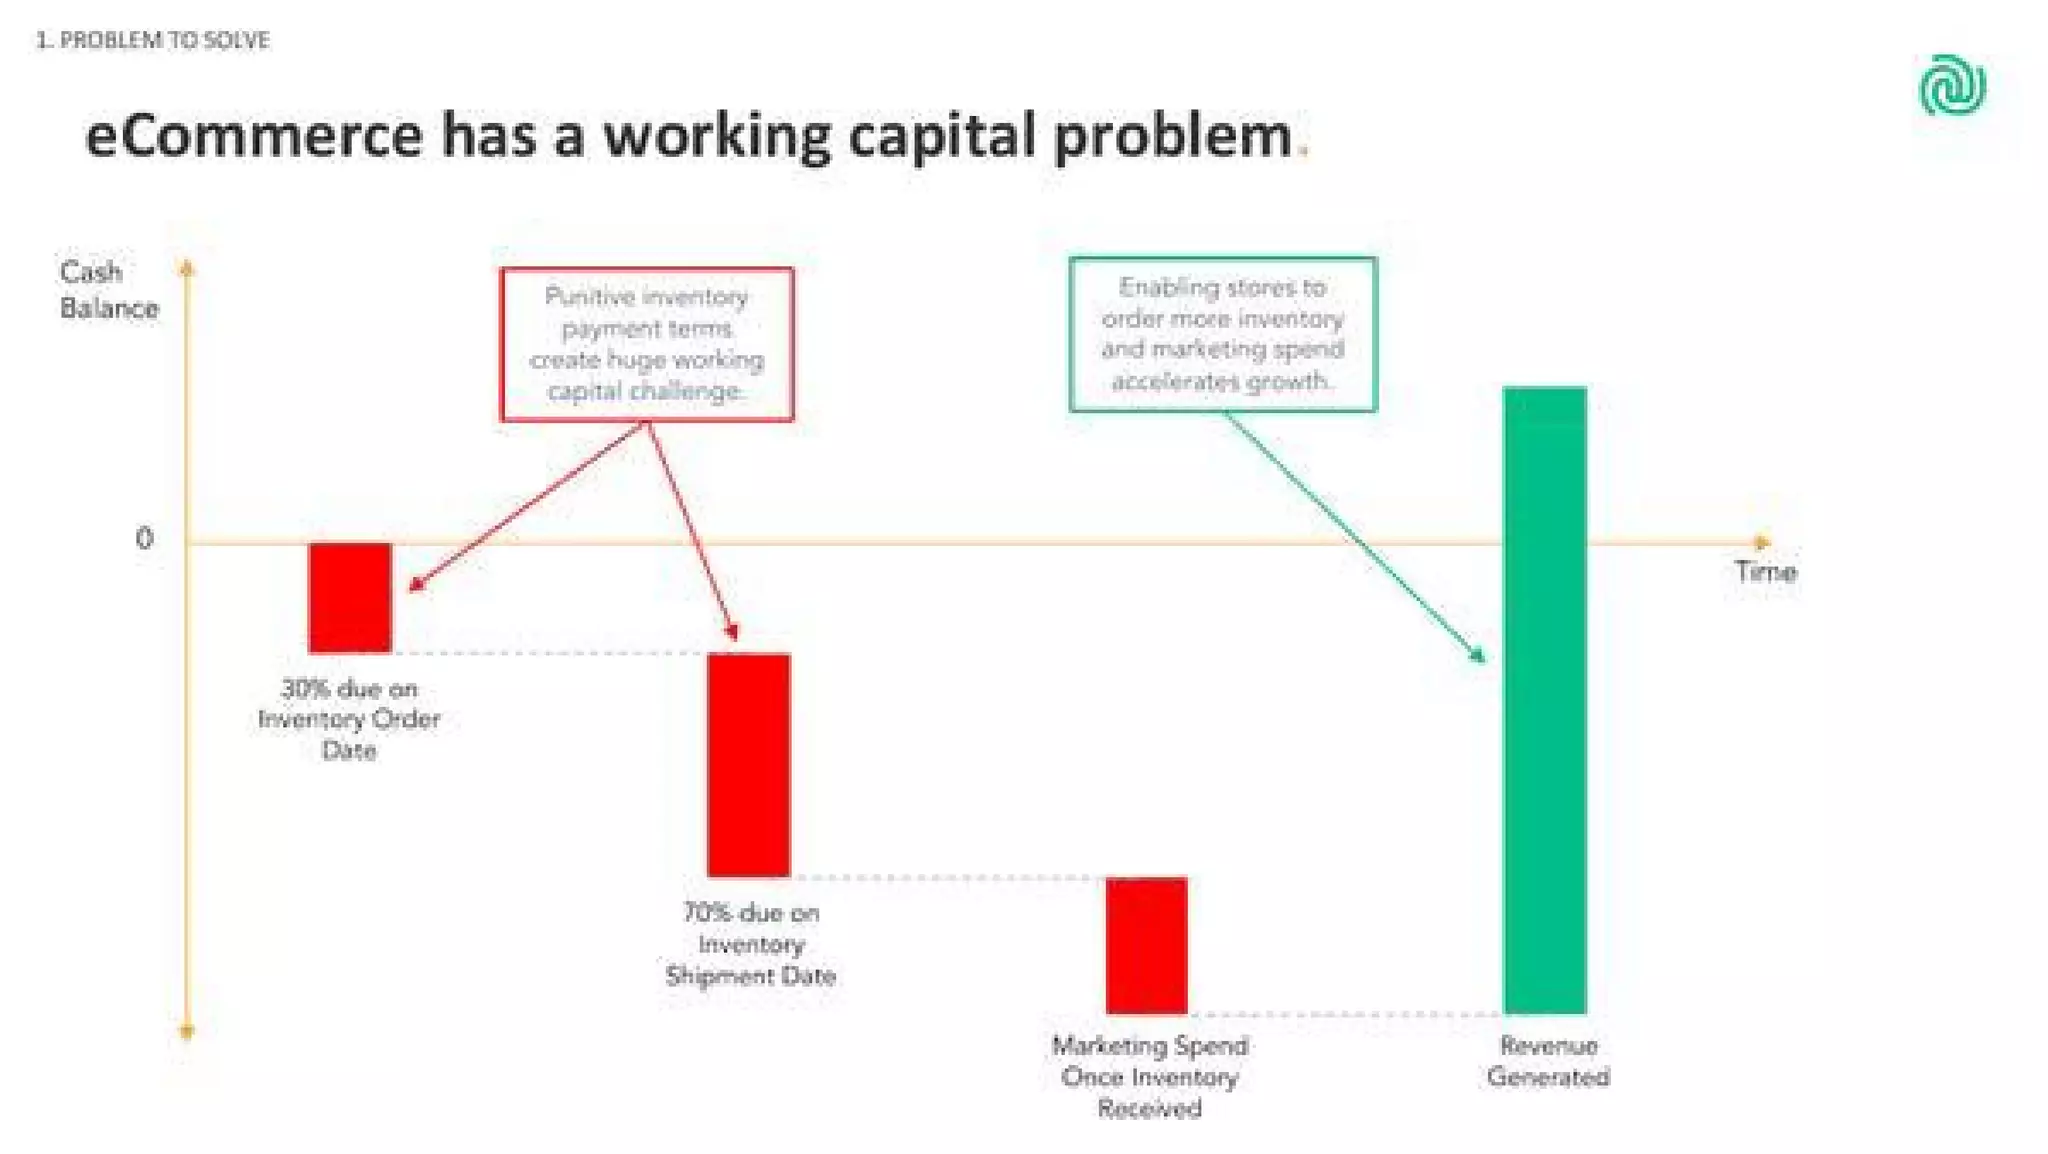
The deck uses a simple timeline/graphic to illustrate a common cash conversion problem for eCommerce merchants: upfront inventory payments, later shipments, marketing spend and finally revenue — creating stretched working capital cycles. Visualizing the cash drain with red bars followed by green revenue makes the pain tangible without heavy text. This approach helps investors empathize with the customer and see a large, addressable problem.

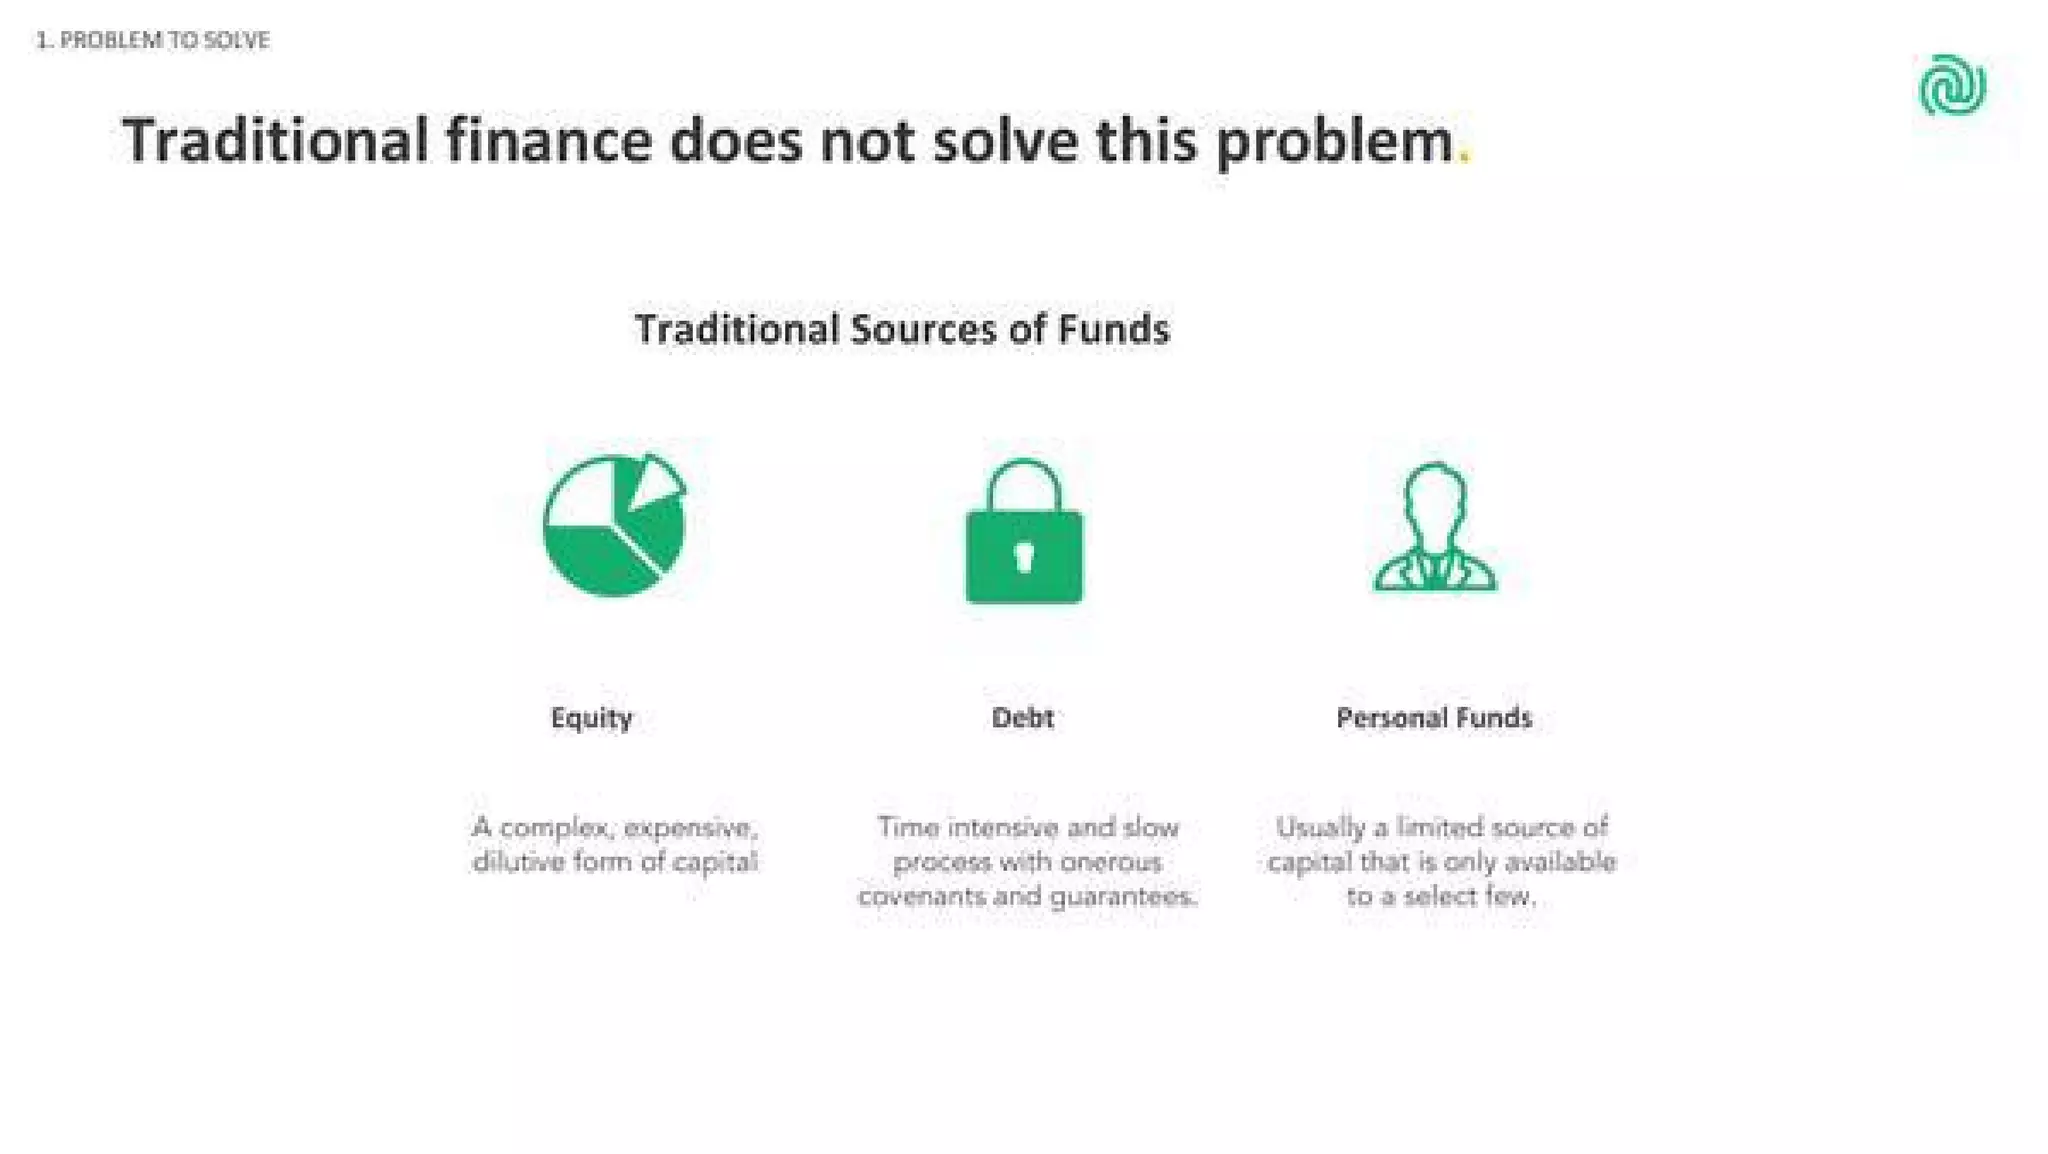
A follow-up slide contrasts traditional finance (equity, debt, personal funds) with the merchant problem, underscoring why incumbent solutions are poorly suited (slow, dilutive, or unavailable). This establishes strategic fit for an alternative product and primes the audience to accept a novel fintech solution. Founders should note the power of pairing a short visual problem statement with one slide showing why existing alternatives fail — it makes the need for your product immediate and unavoidable.

Key Takeaway: Use a single, well-labeled visual to show the customer's pain and then immediately show why existing solutions fail — that creates urgency and product-market fit in one flow.
Solution & Product Mechanics

Solution & Product Mechanics

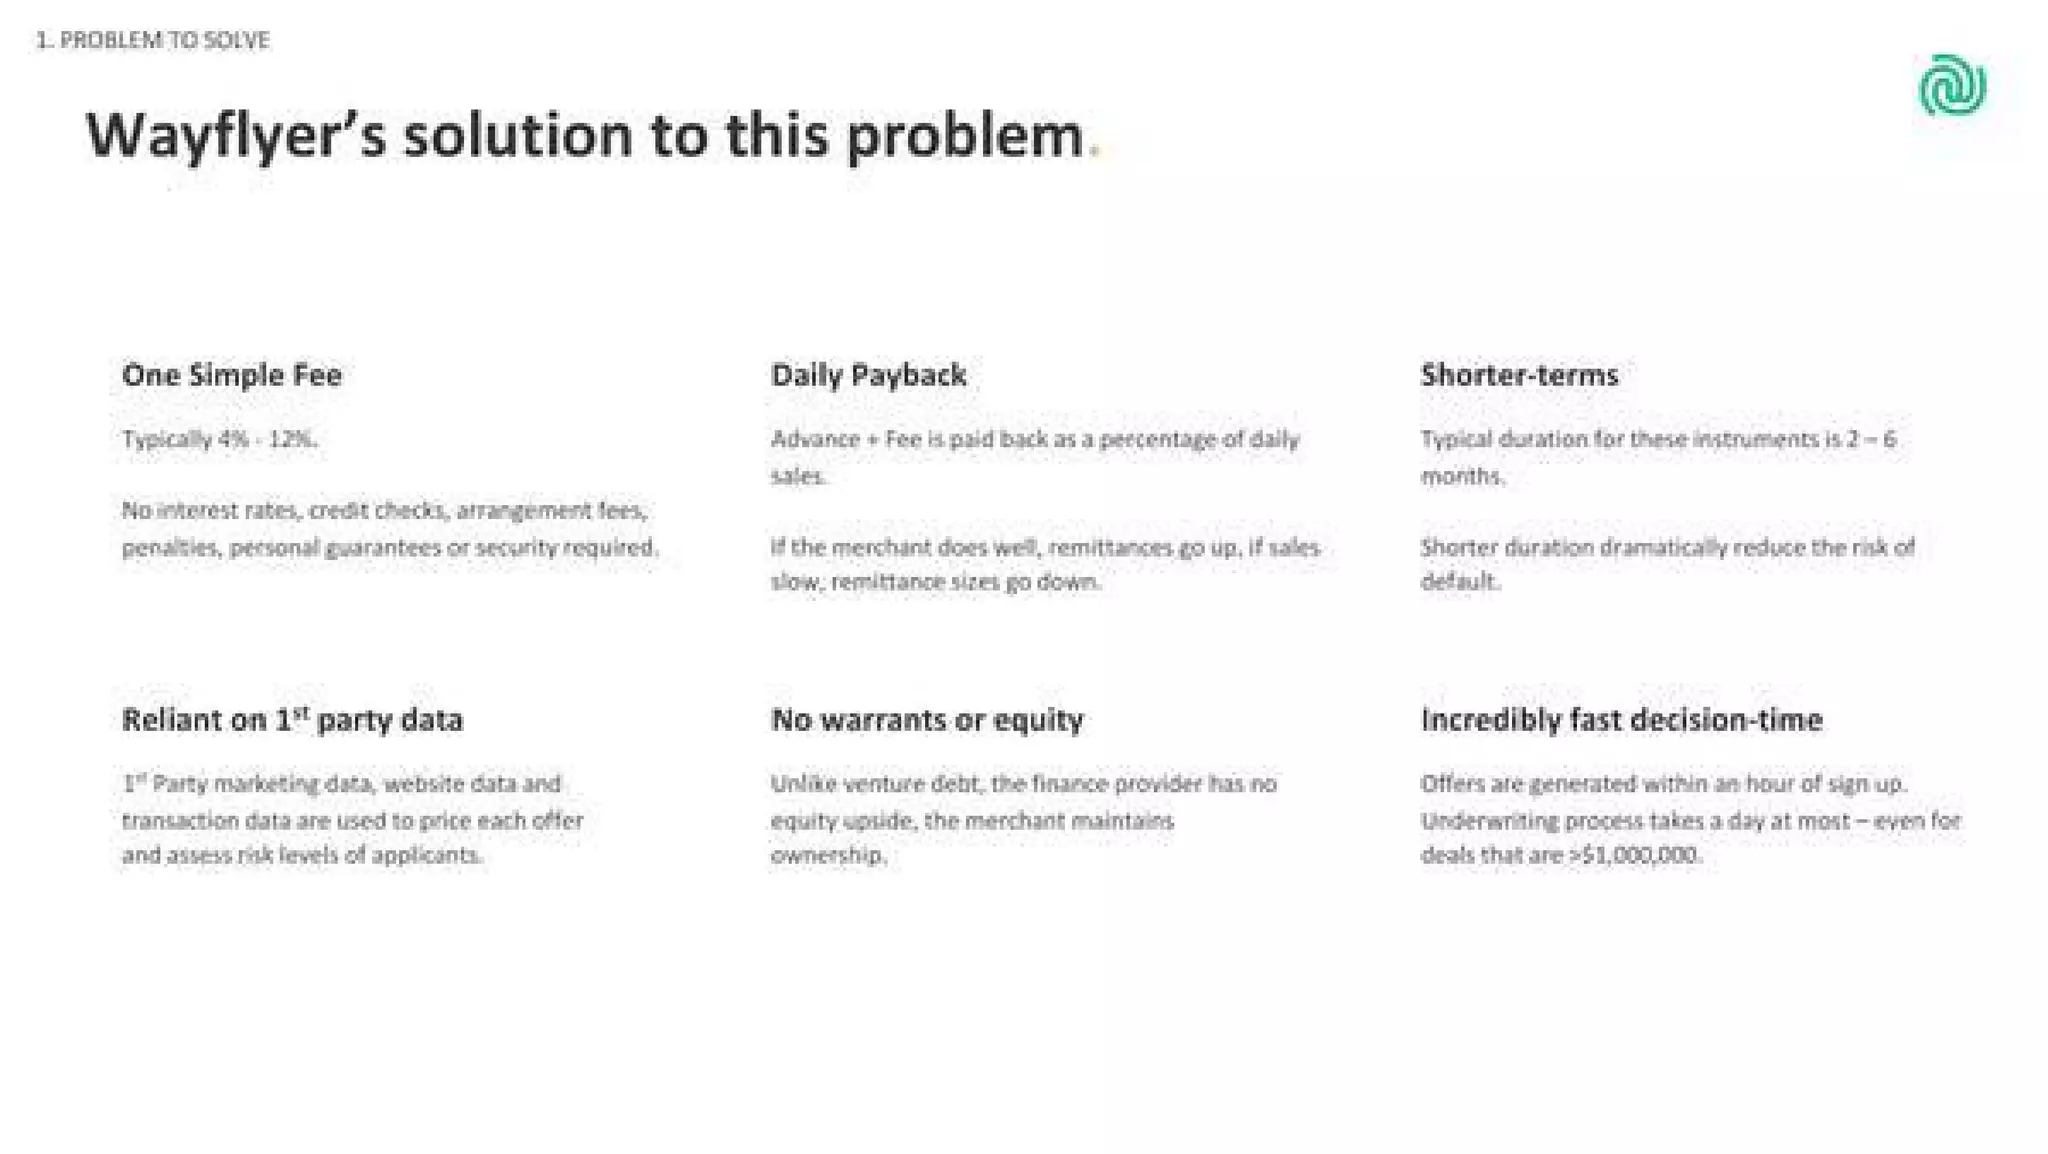
Wayflyer's solution slide succinctly lists the product attributes: one simple fee, daily payback tied to sales, shorter terms, reliance on first-party data, no equity or warrants, and fast decisioning. These bullets address typical investor concerns (pricing, alignment, underwriting quality, speed) and show product-market fit in operational terms — not just marketing claims.

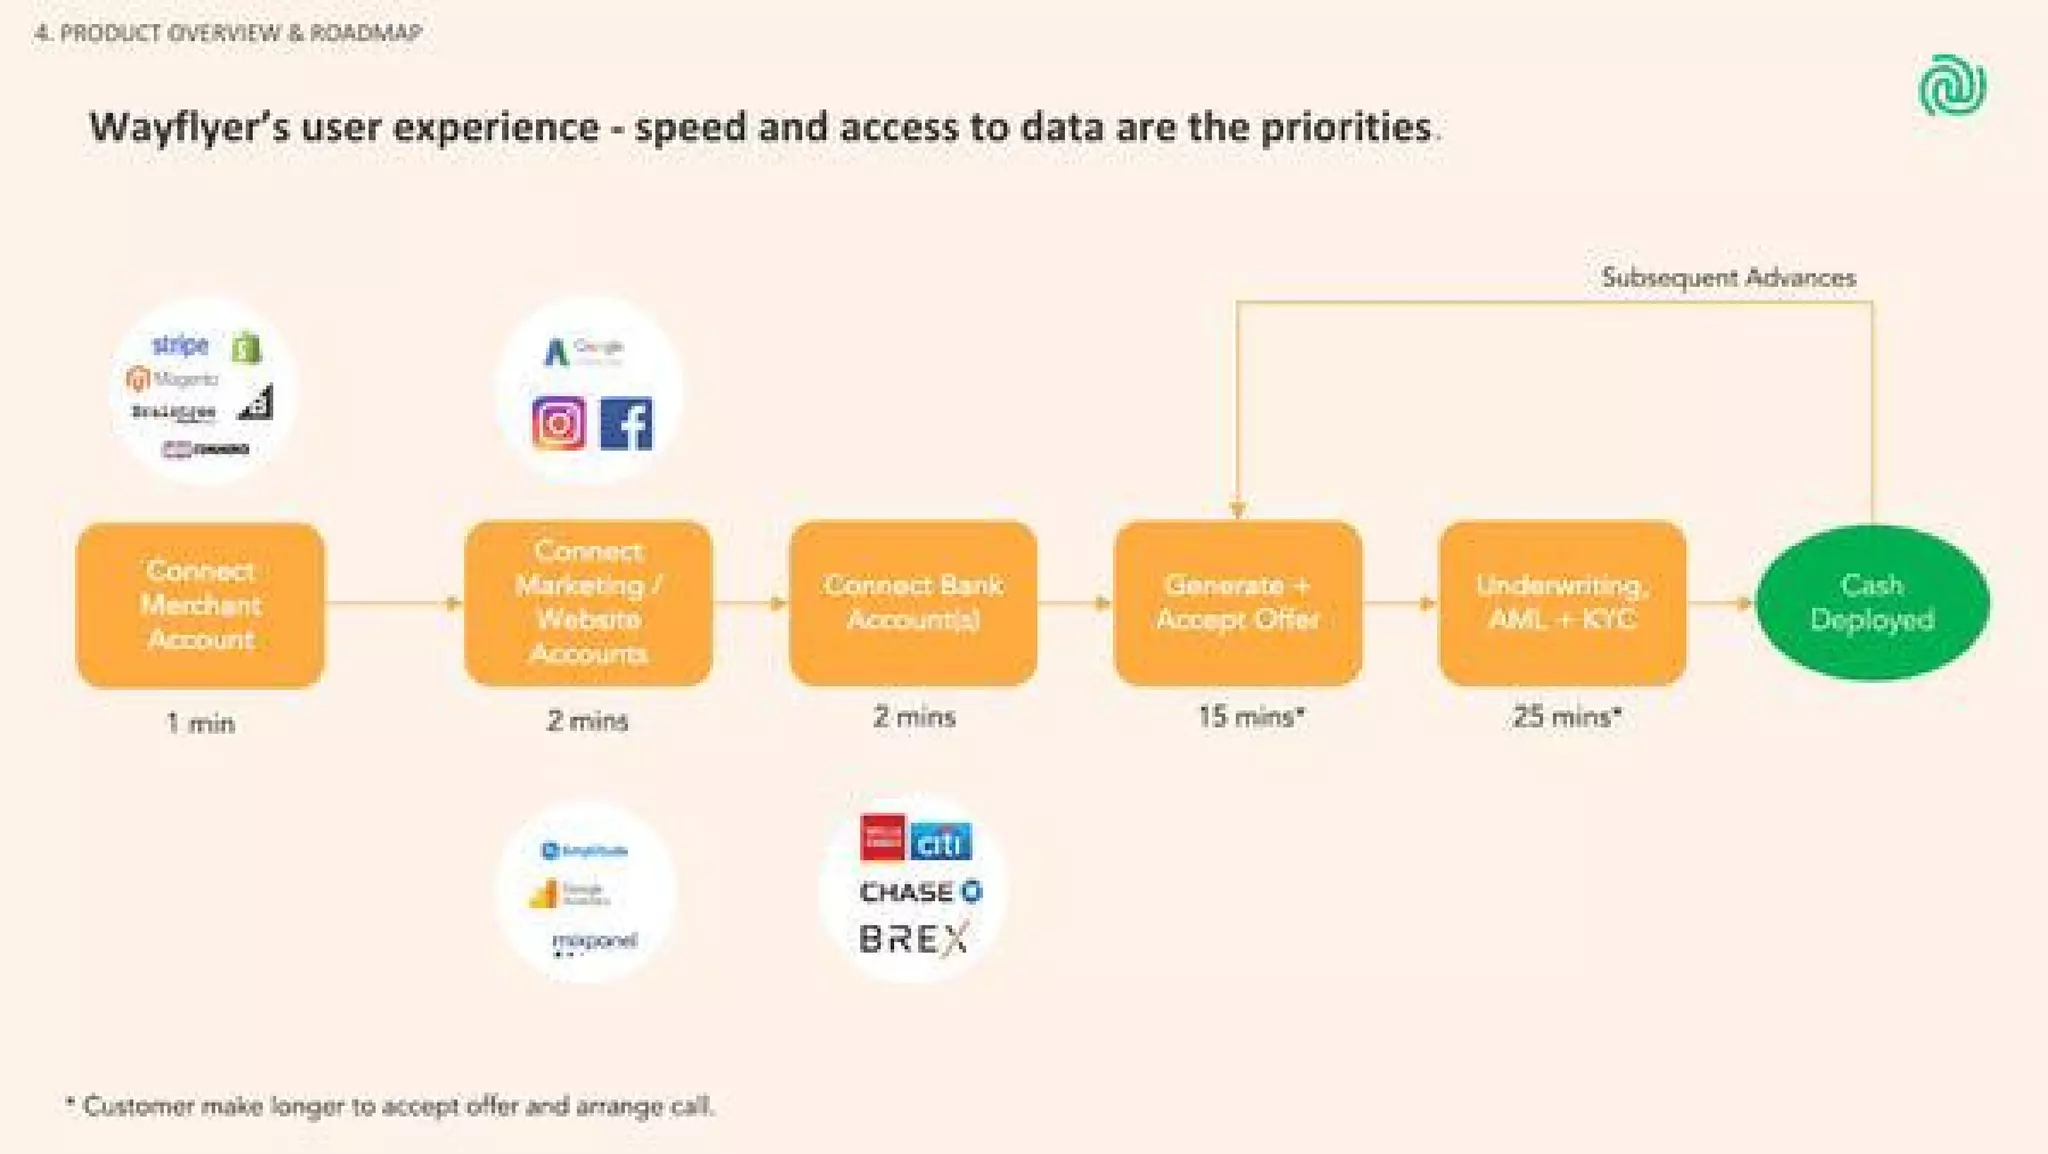
A complementary onboarding flow slide (user experience timeline) shows how fast merchants can connect accounts and receive cash — building confidence in conversion and scale potential. For founders, this demonstrates that describing the mechanics of how your product actually works (not just benefits) reduces investor friction, especially for finance products where risk and operational detail are paramount.

Key Takeaway: Be explicit about the mechanics that align incentives (pricing, payback structure, data inputs) and show the real onboarding path to prove scaleability and conversion velocity.
Traction: Monthly Sales KPIs and Customer Outcomes

Traction: Monthly Sales KPIs and Customer Outcomes

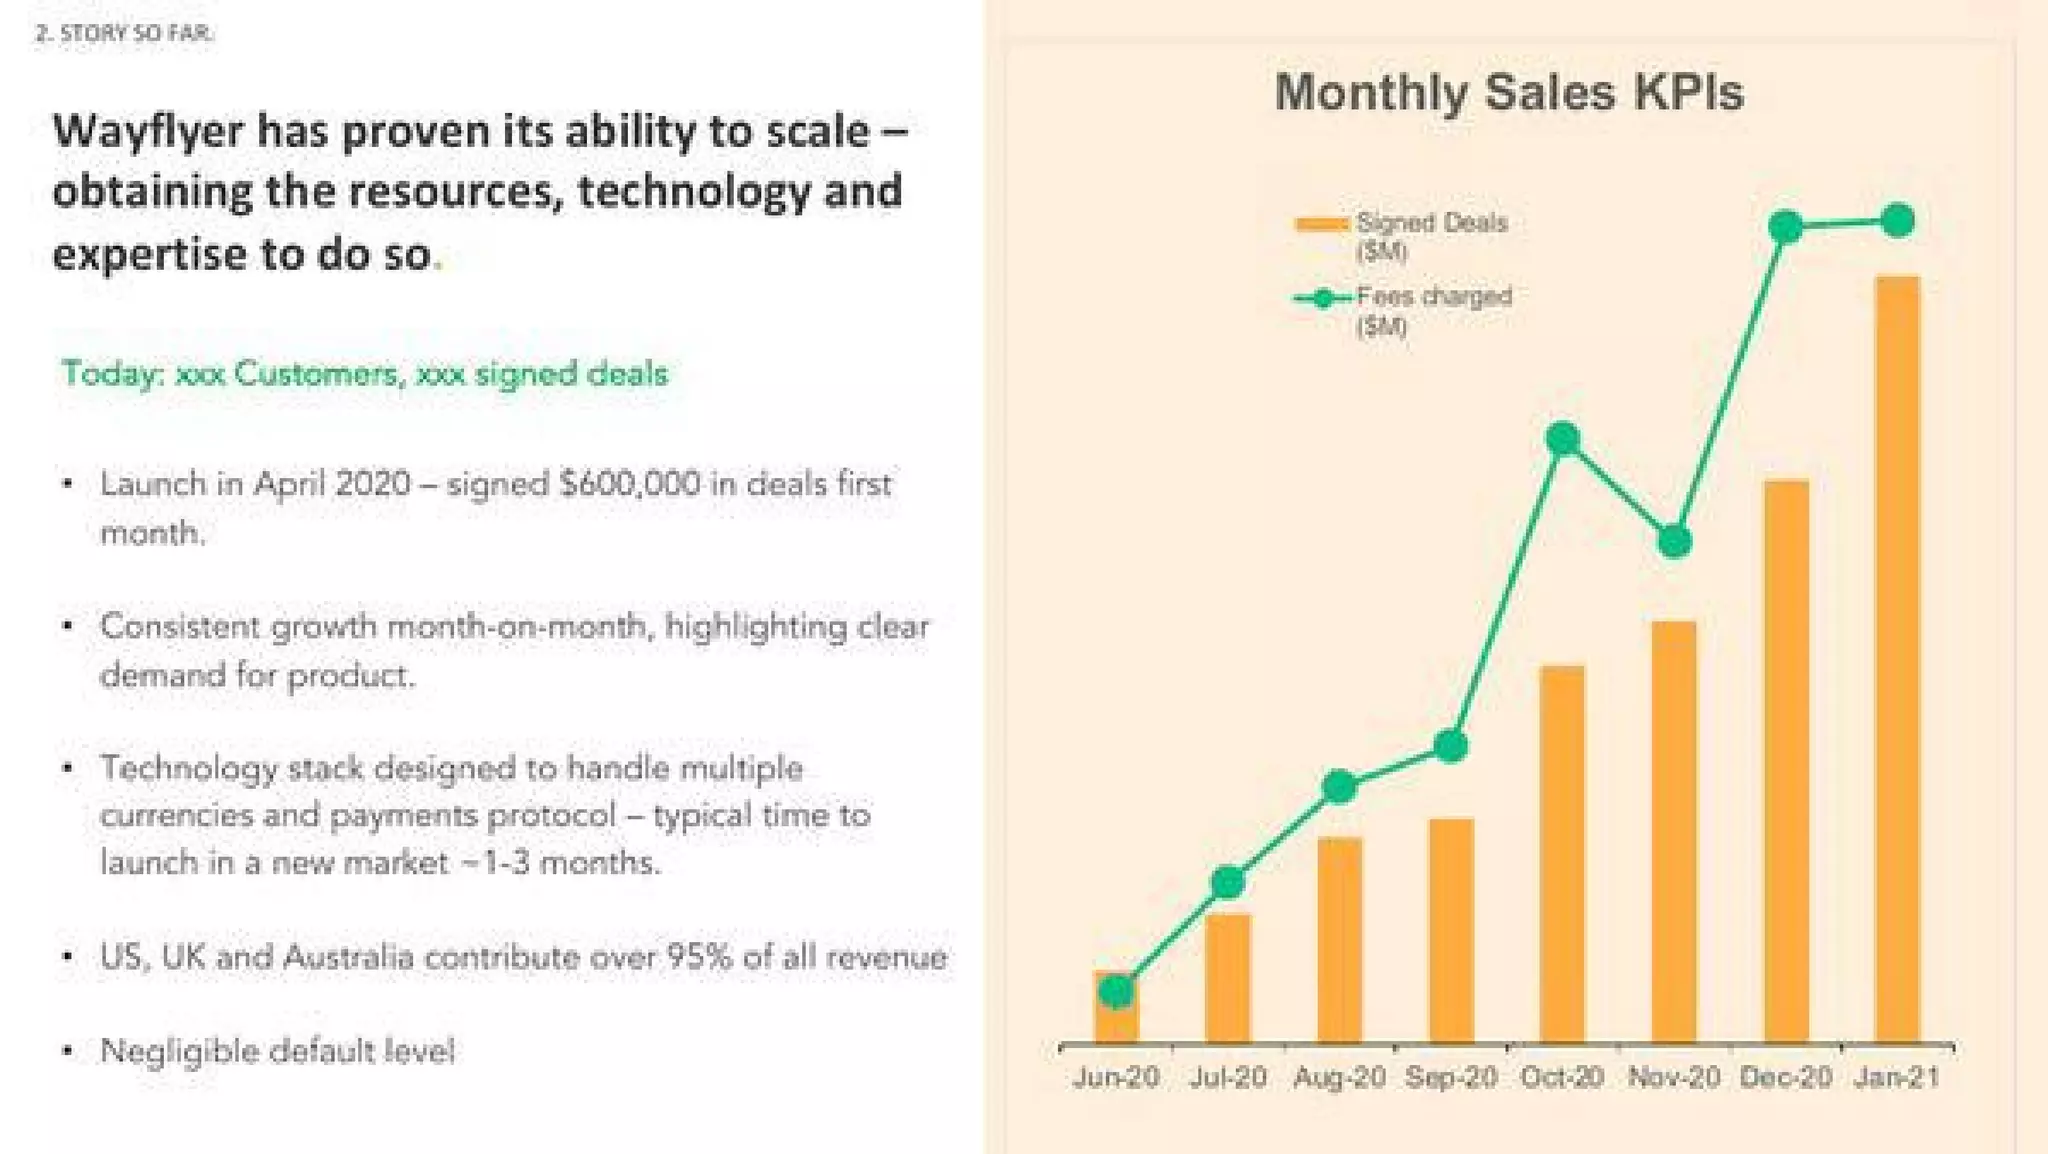
The deck pairs a monthly sales KPI chart with a slide explaining launch timing and growth narrative. The visual trend line and bar chart (signed deals vs fees charged) give a quick quantitative read of momentum — month-over-month growth and increasing fees provide evidence of both demand and a revenue engine. This is critical for fintech investors who need to see that underwriting volume and fee revenue are scaling together.

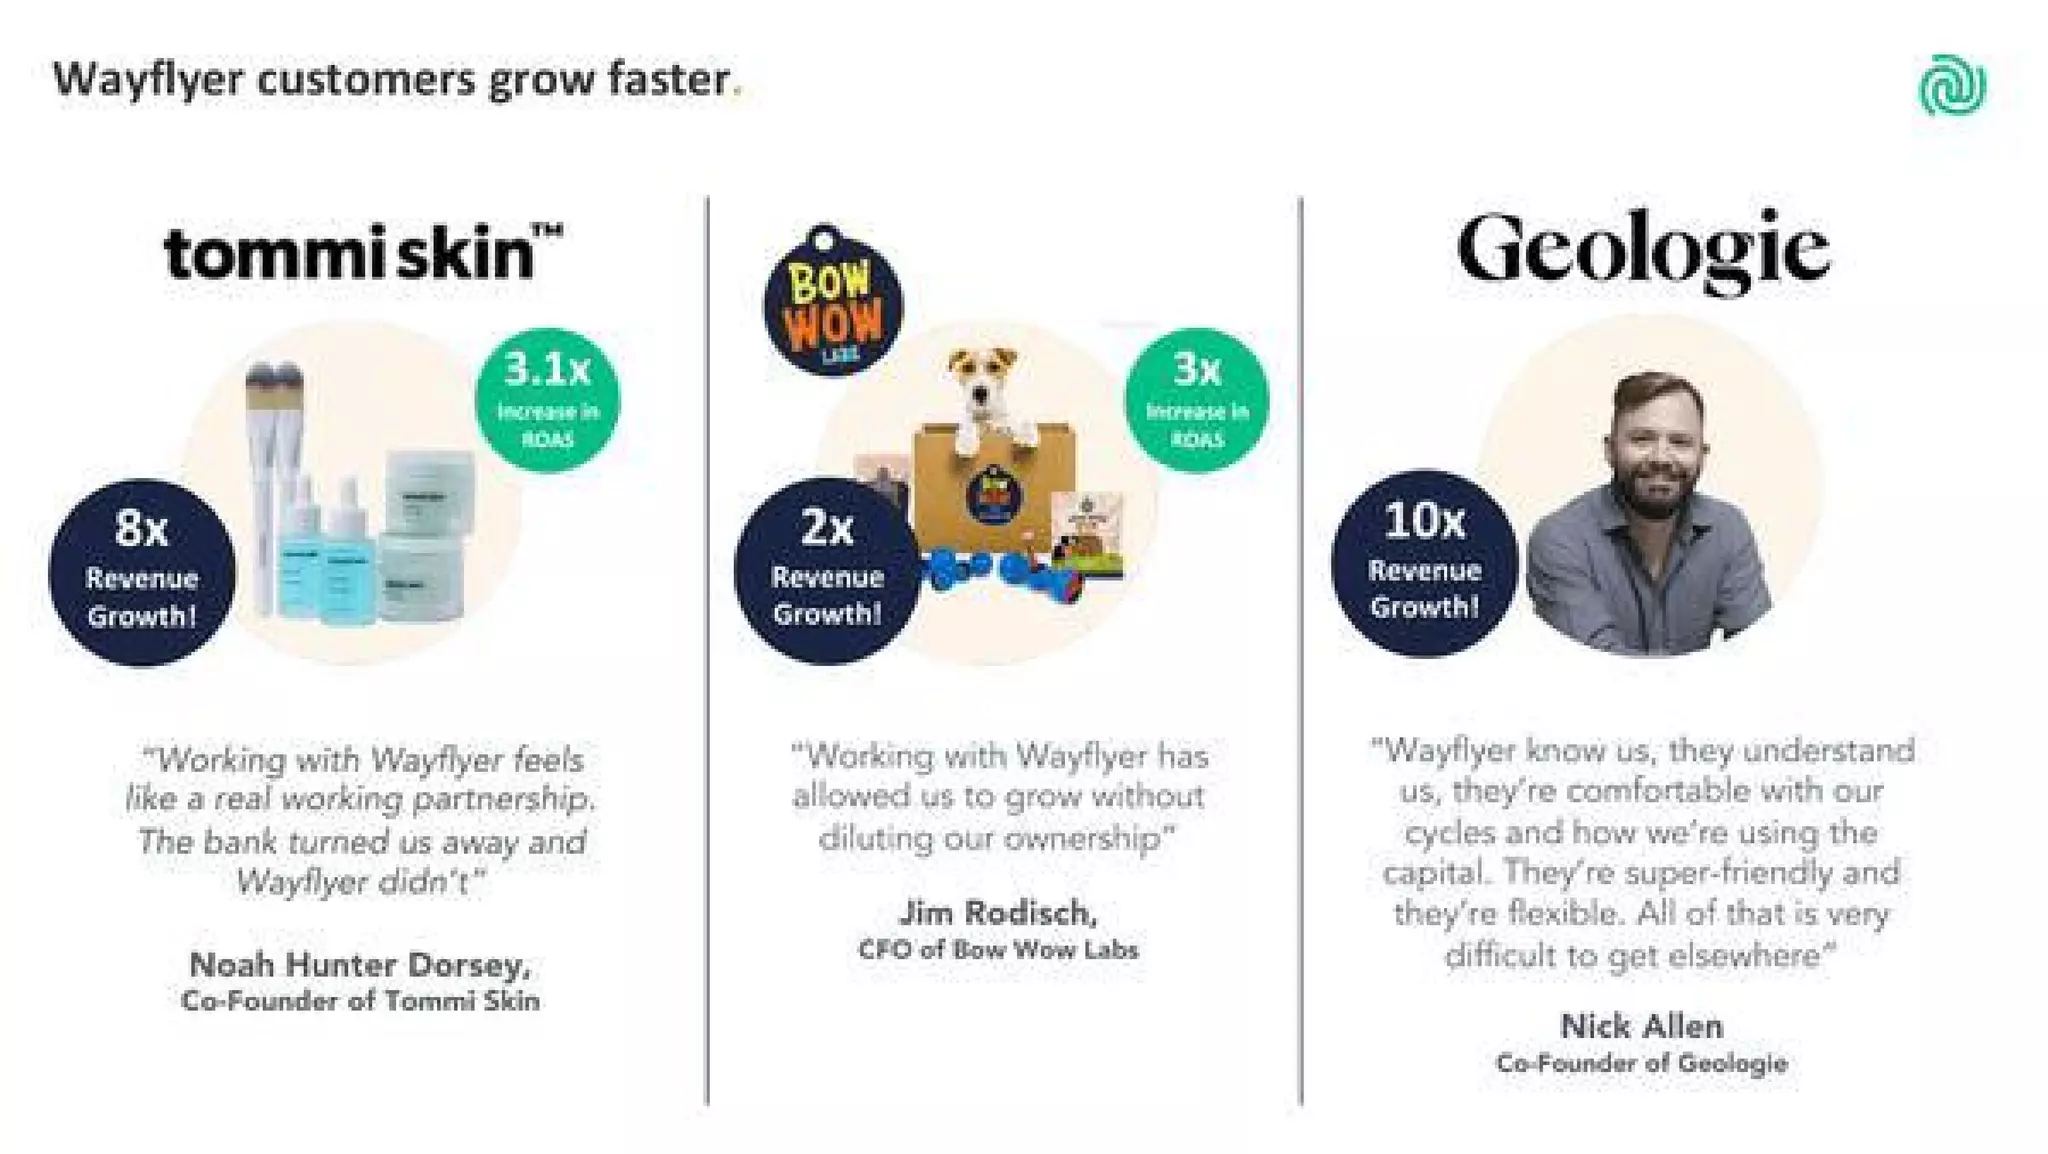
Customer case studies and logos (growth multiples, testimonials) are used to humanize traction and demonstrate outcome-based results (e.g., 8x revenue growth, 10x for certain customers). Combining high-level metrics with concrete customer stories is a persuasive pattern: charts answer “Is there market demand?” while testimonials answer “Does it actually help customers grow?”. Founders should replicate this two-pronged approach — show both aggregated KPIs and a few short customer outcomes to prove impact.

Key Takeaway: Show month-over-month quantitative traction alongside 2–3 short customer outcome stories to prove both demand and product effectiveness.
Team, Investors and Credibility Signals

Team, Investors and Credibility Signals

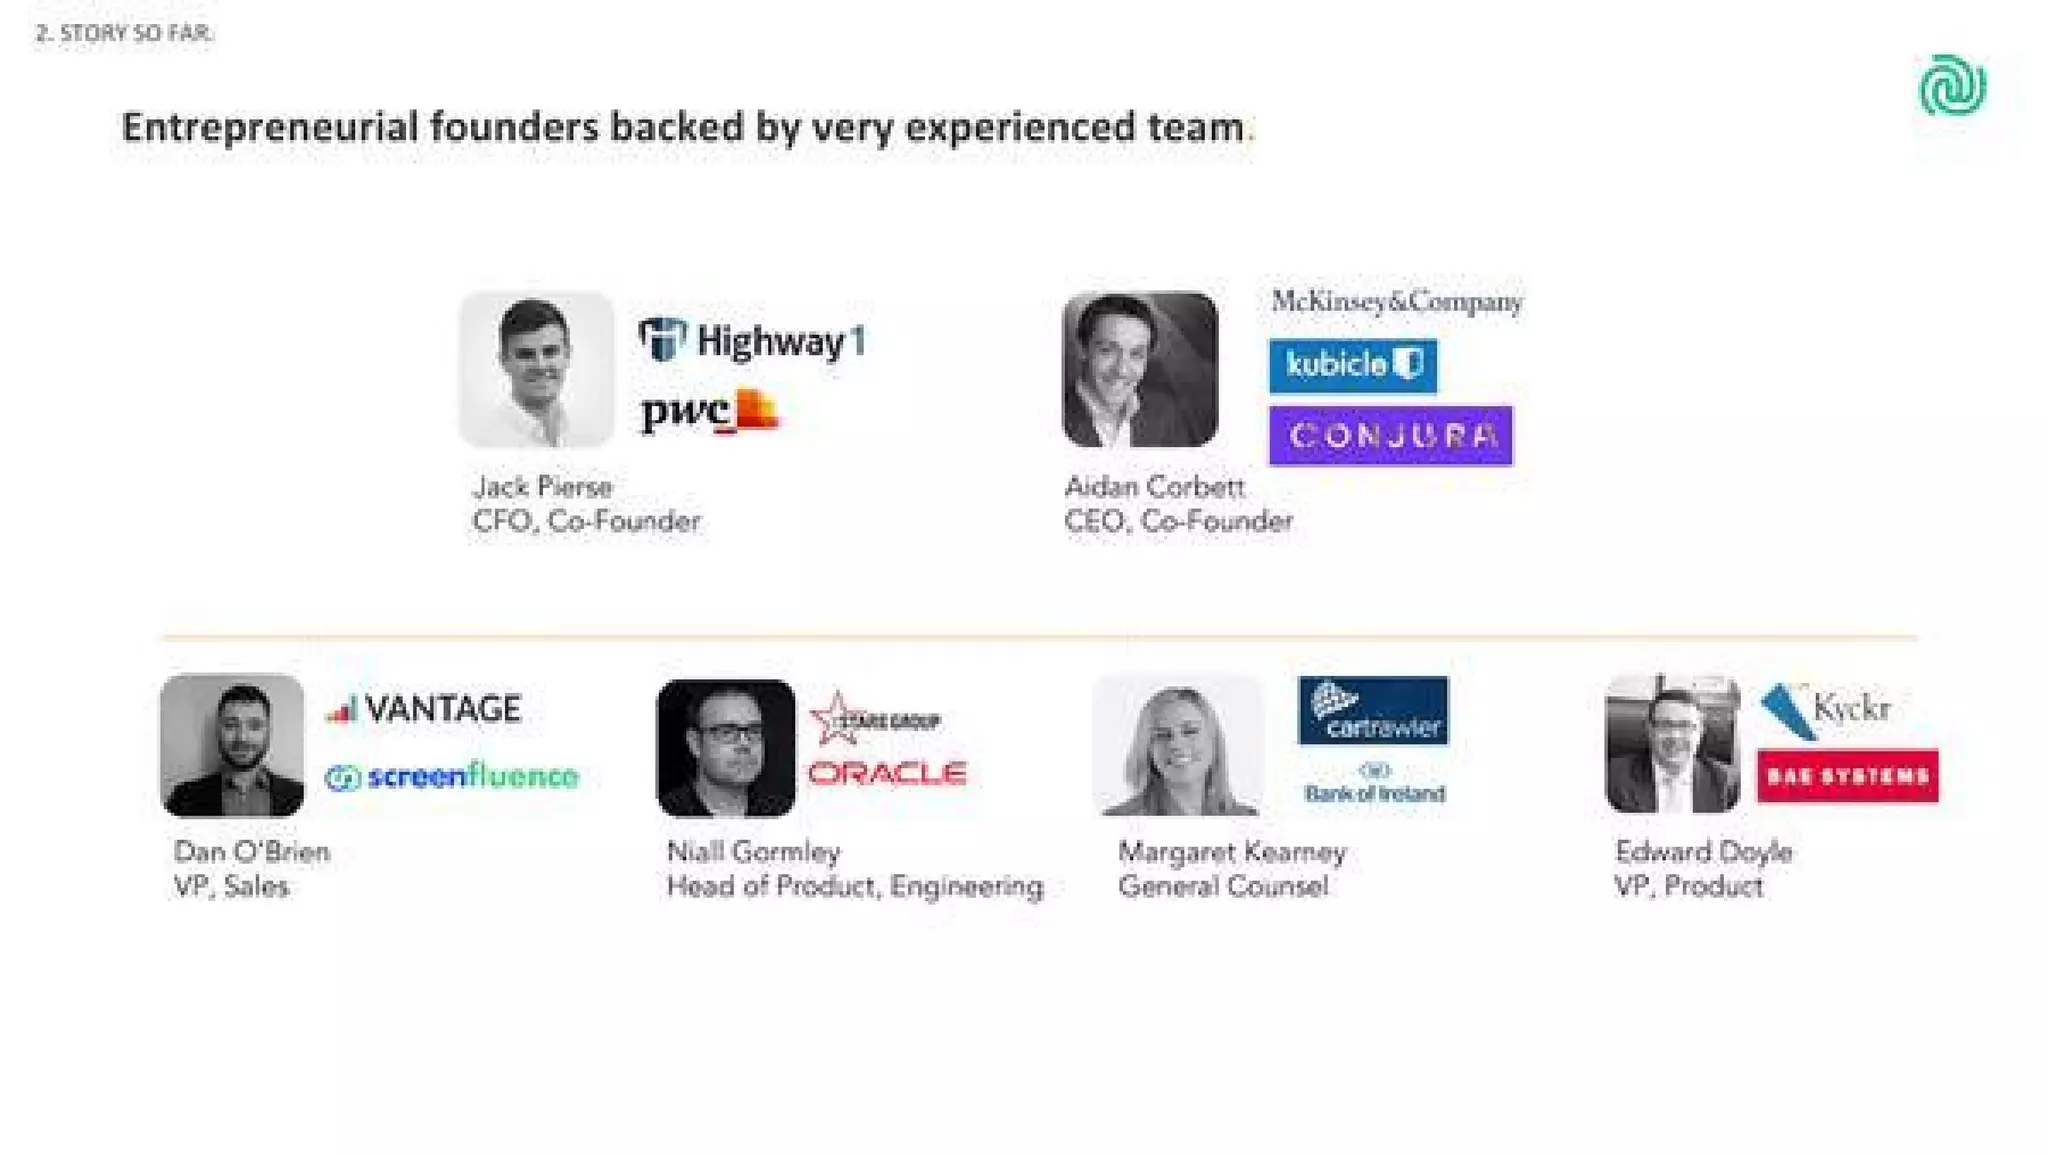
Wayflyer's deck highlights founders, key hires and an investor roster with well-known fintech/backing logos. Displaying prior experience and recognizable investors builds credibility quickly and reduces perceived execution risk. The team slide pairs names and short role labels with logos of prior employers, signaling relevant domain experience (payments, finance, product) which is especially important for regulated, capital-intensive fintechs.

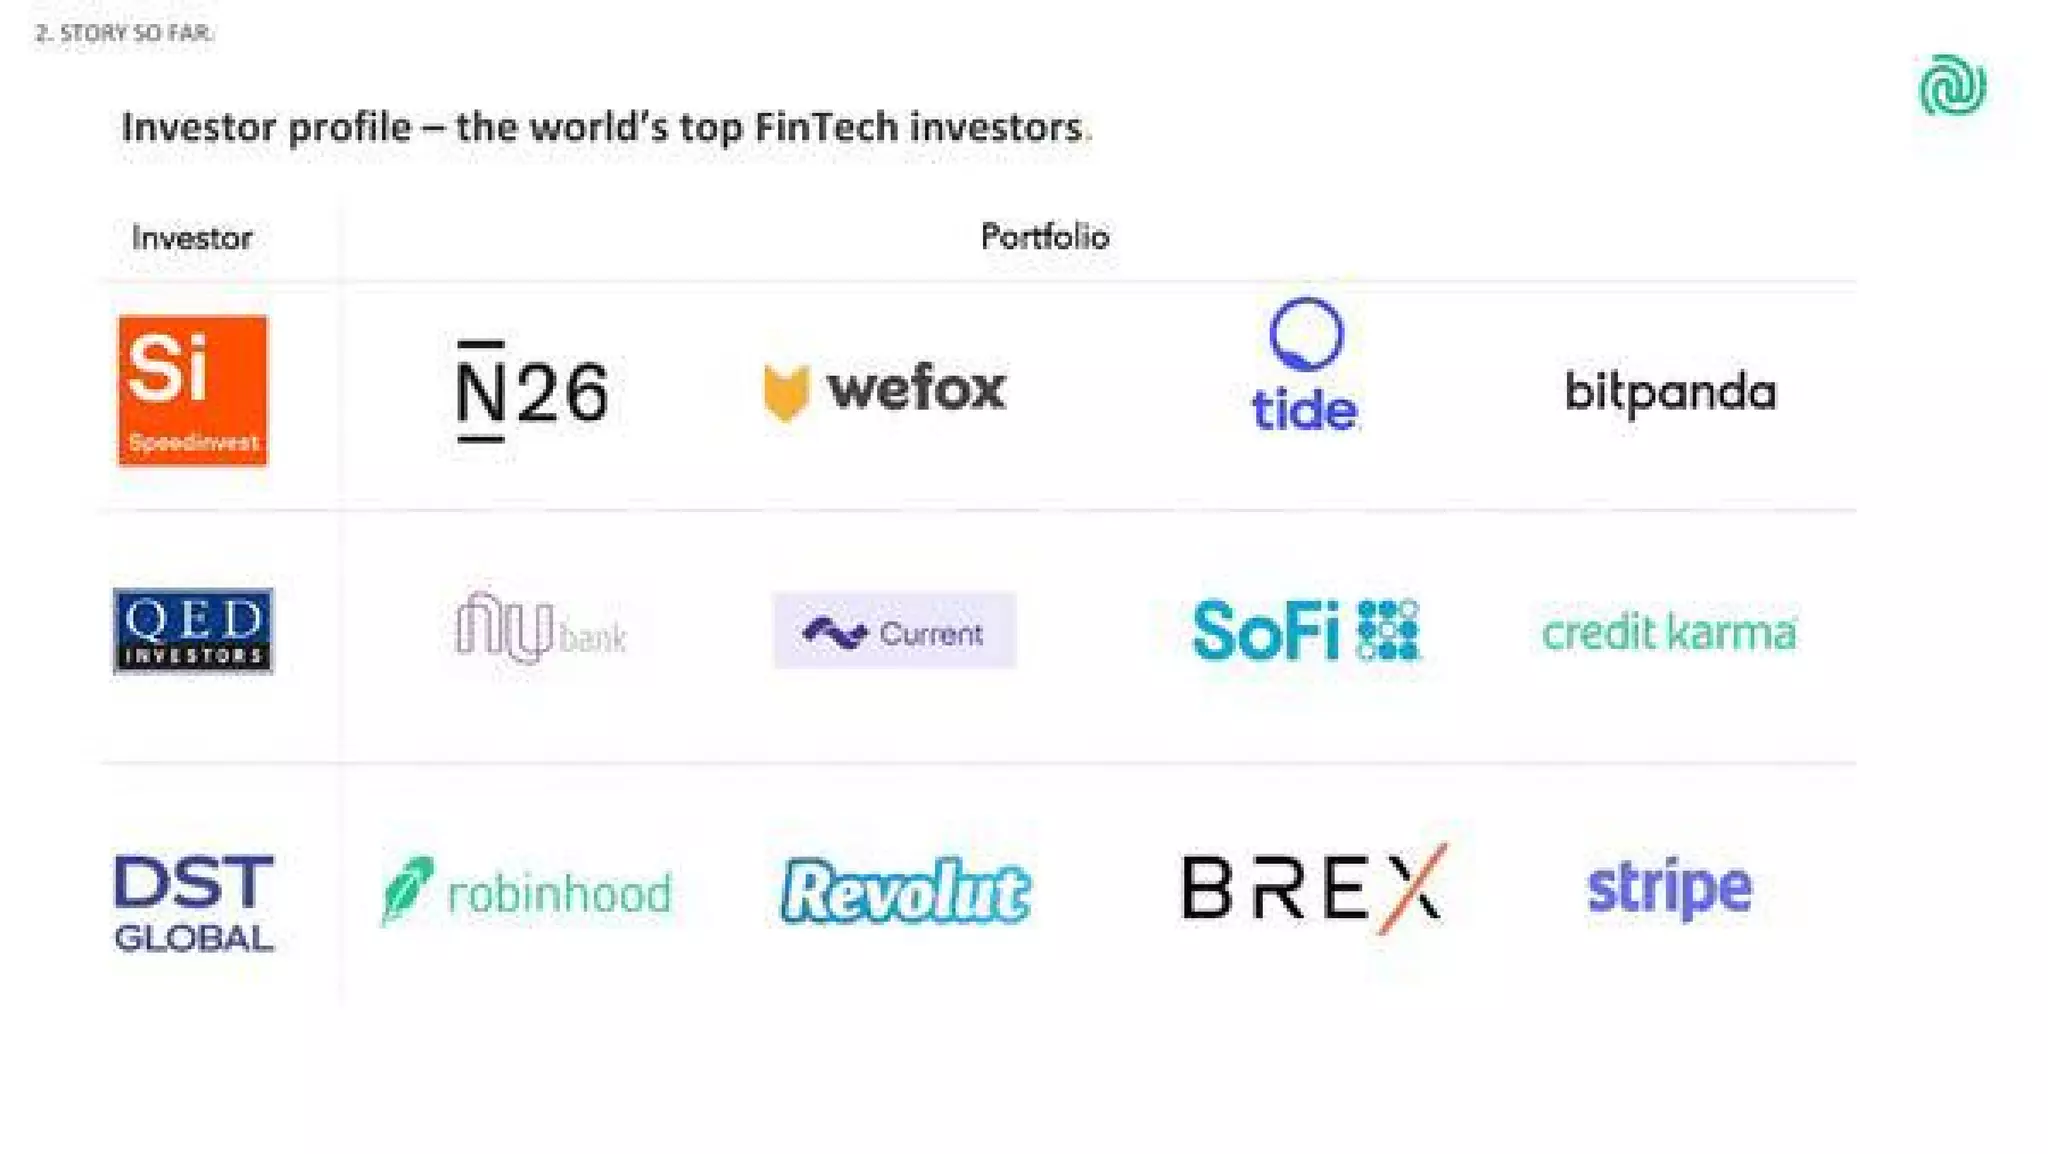
An investor portfolio slide shows firms and their portfolio companies (e.g., other fintech winners), which signals that those backers understand the space and have repeatable diligence playbooks. For founders, this reinforces the value of showcasing relevant team backgrounds and the signal provided by quality investors — it often shortens investor conversations because experienced VCs recognize credible patterns.

Key Takeaway: Use concise team bios with prior-role logos and show reputable investor logos/portfolios to signal relevant experience and de-risk execution in investor minds.
Go-To-Market Partnerships & Channel Strategy

Go-To-Market Partnerships & Channel Strategy

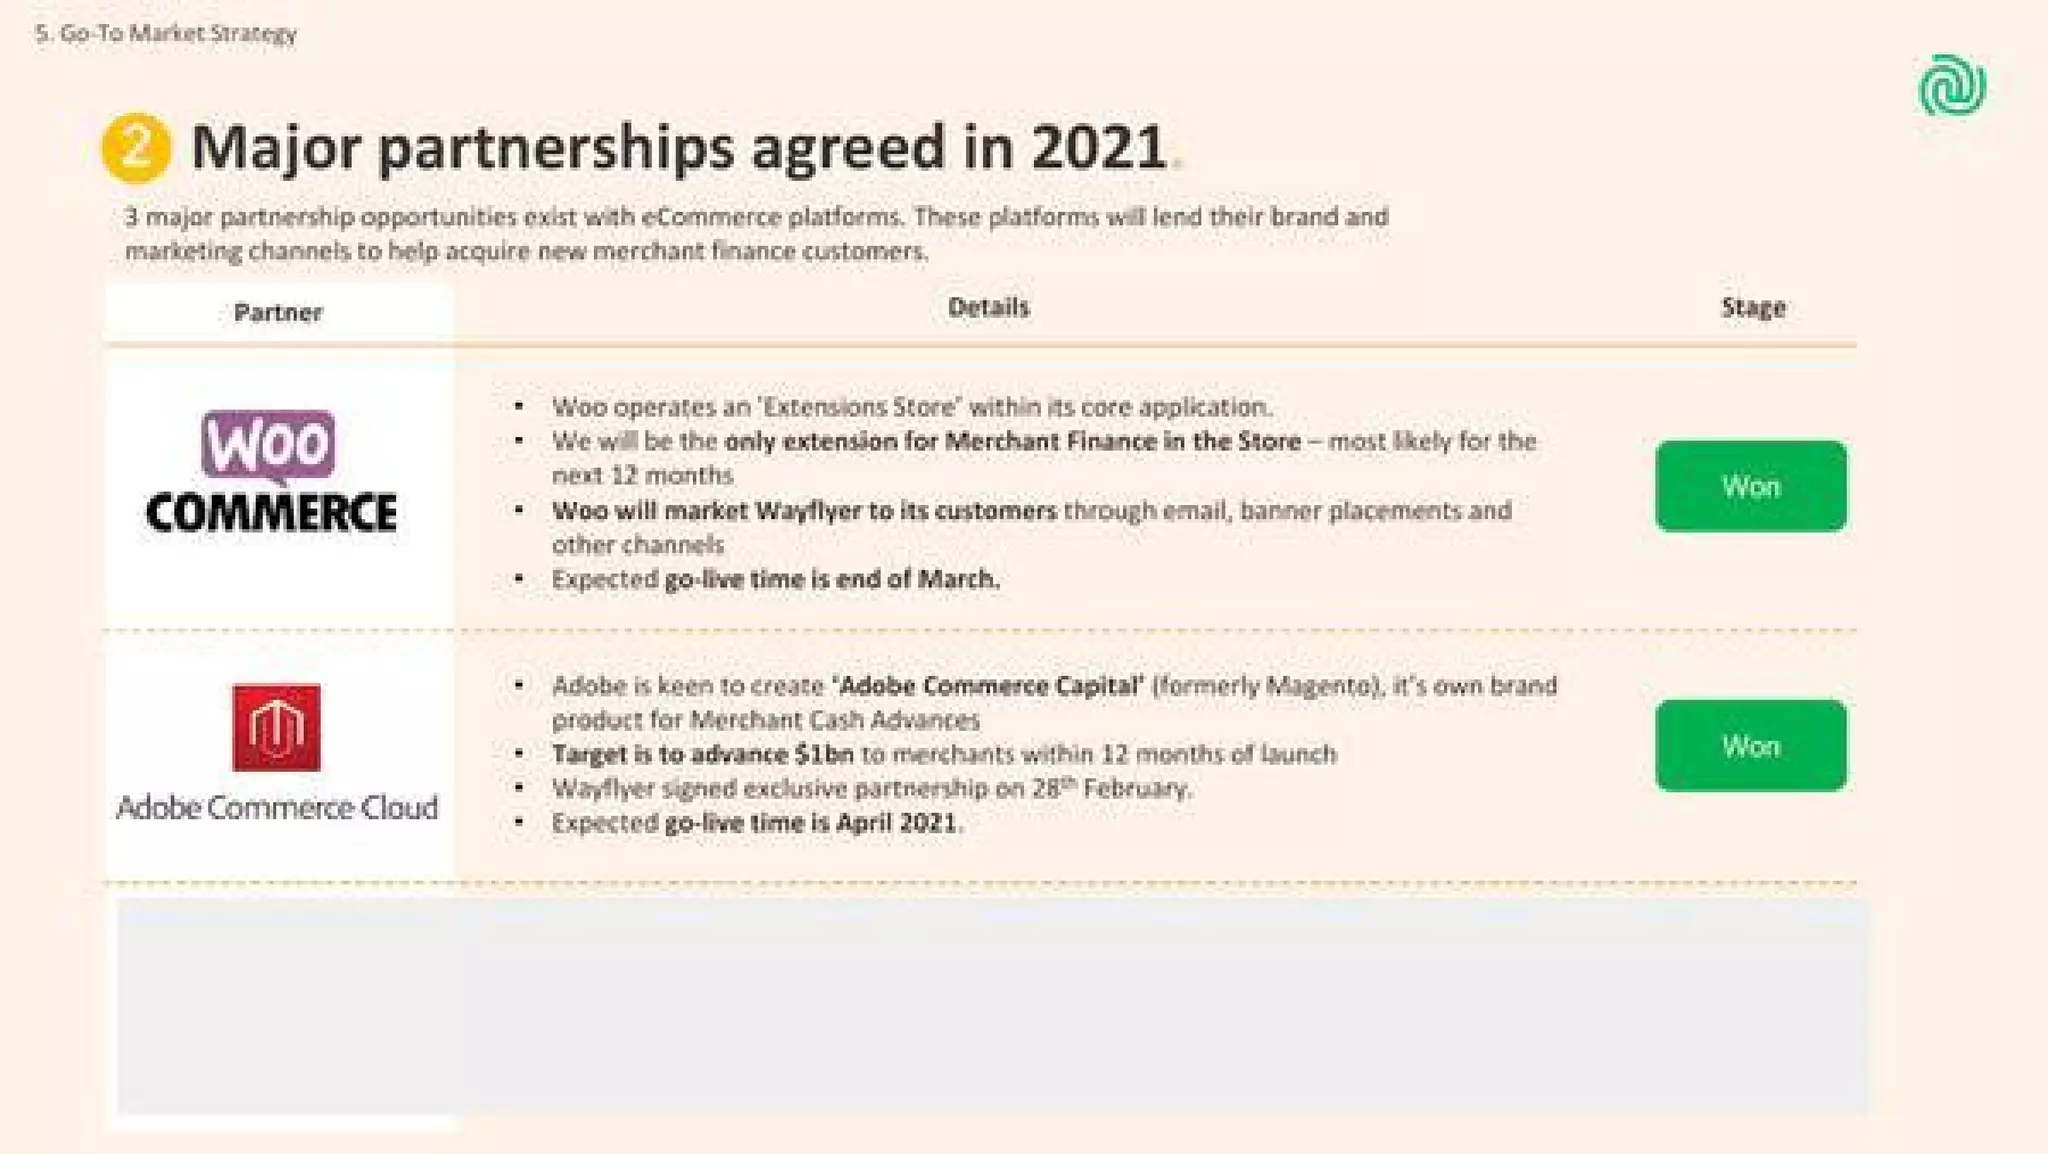
The partnerships slide lists major platform integrations (WooCommerce, Adobe Commerce) and marks them as 'Won' with expected go-live dates and distribution details. This communicates a scalable acquisition channel beyond direct sales and demonstrates commercial distribution that can rapidly expand customer reach. Highlighting platform exclusivity or preferred placement (e.g., being the only extension) is a powerful growth lever for financial products serving eCommerce.

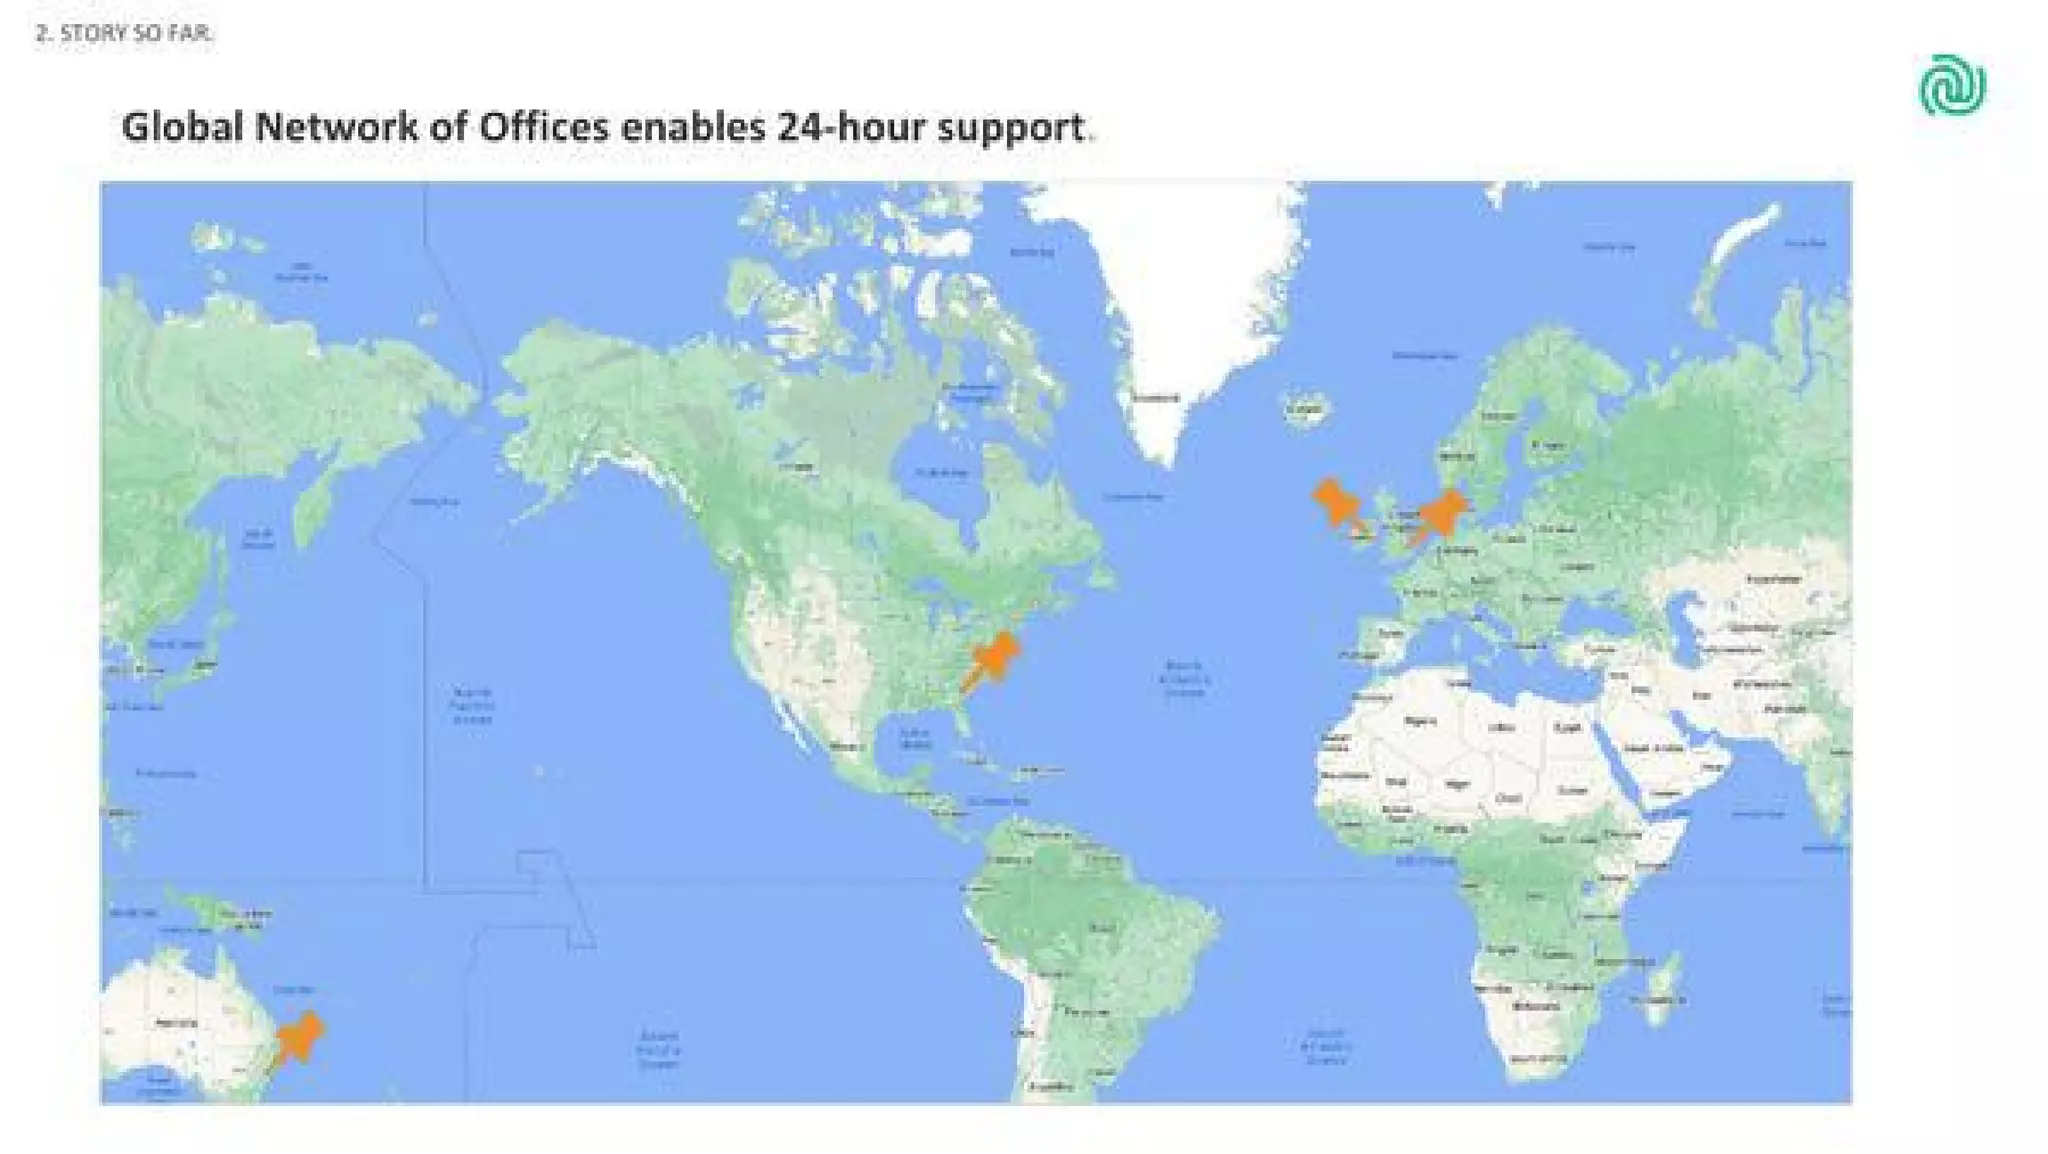
The deck also shows a global office map to underscore 24/7 operational capability, which matters for underwriting across time zones and for servicing merchants quickly. Founders should note that showing concrete, signed partnerships (with expected outcomes and timing) is far more persuasive than aspirational partnership claims; it gives investors a clear line of sight into future customer acquisition and revenue ramps.

Key Takeaway: Prove GTM scalability by showcasing signed platform partnerships and concrete go-live timing — signed distribution beats hypothetical channels every time.

Conclusion: Key Lessons

Wayflyer's Series B deck is strong because it follows a focused narrative: a crisp problem statement, a clear non-dilutive product with aligned economics, proof of early traction, a credible team and scalable distribution via partnerships. The visual language is simple and investor-friendly — charts where numbers matter, logos where credibility matters, and short bullets to explain risk controls and mechanics.

Actionable advice for founders: lead with the customer pain and why incumbents fail, explain the product mechanics (pricing, underwriting signals, payback), quantify traction with month-on-month KPIs plus a few customer outcomes, and prove distribution with signed partnerships or integrations. Finally, keep slides uncluttered and put the most defensible claims (contracts, investor names, KPIs) front-and-center — investors will remember a clear, data-backed story long after a long-winded deck is forgotten.

Full Deck Analysis

11 sections

Overview

Company: Wayflyer
Round: Series B ($10.2M)
Year: 2020
Outcome: Valued at $1.6B after Series B (2022)

Executive Summary

This deck presents Wayflyer’s merchant-finance product that plugs a recurring working-capital gap for eCommerce merchants. It is tightly focused: (1) clearly defines the cash-timing problem for merchants, (2) describes a fast, data-driven merchant cash-advance product, and (3) provides early traction, marquee investors and strategic partnerships (WooCommerce, Adobe Commerce). Notable strengths are the crisp problem framing, fast onboarding flow and clear GTM partnerships; weaknesses include limited unit-economics detail and sparse hard financials in the deck.

Problem Statement

How the deck articulates the problem (slides referenced)

  • Framing: eCommerce has a working capital timing problem — merchants must pay suppliers and inventory earlier than they receive revenue from customers (Slide 4).
  • Specific cash-flow steps noted: “30% due on inventory order date” and “70% due on inventory shipment date,” then additional marketing spend before revenue is generated — visually showing negative cash positions before revenue (Slide 4).
  • Why existing finance fails: Traditional equity, debt and personal funds are described as expensive, dilutive, slow, covenant-heavy or inaccessible (Slide 5).

Solution

How the deck positions the solution

  • Product: A merchant cash advance / cash-advance product tailored to eCommerce that uses first-party data to underwrite (connects merchant account, marketing data, bank accounts). Onboarding is fast and automated (connect/2–3 minutes; offer within ~15 minutes; underwriting ~25 minutes) (Slide 16).
  • Terms: “One simple fee” typically 4%–12% (Slide 6); payback is daily as a percentage of sales (daily payback scales with merchant sales), short durations (typical 2–6 months) and no equity dilution or warrants (Slide 6).
  • Underwriting: Reliant on 1st-party marketing & transaction data, KYC/AML checks; offers are quick (within an hour) and underwriting is designed to be rapid (Slide 6, Slide 16).
  • Outcome promised: Enables merchants to order inventory and spend on marketing sooner to accelerate growth (Slide 4).

Market Opportunity

TAM/SAM/SOM analysis — numbers shown or inferable

  • The deck does not present explicit TAM / SAM / SOM numeric estimates. It references the eCommerce context and highlights channel partners (WooCommerce, Adobe Commerce) that imply a large addressable market but no slide gives a quantified market size. (Table of contents indicates Product, GTM, Financials sections but there is no explicit TAM number shown in images.)

Business Model

Revenue model and unit economics

  • Revenue: Fees charged on advances (stated range 4%–12%) and daily remittance as percent of daily sales — essentially a merchant cash advance priced as a simple fee (Slide 6).
  • Repayment / risk alignment: Payback is percentage-of-revenue (daily), so remittances scale with merchant performance (Slide 6).
  • Unit economics: The deck claims shorter durations reduce default risk and states “negligible default level,” but no numeric default rates, customer LTV, APR-equivalent, average advance size or CAC/LTV metrics are given in the visible slides. (Investor diligence would require these.)

Traction & Metrics

Growth metrics and proof points with specific numbers

  • Launch & early traction: Launched in April 2020 and “signed $600,000 in deals first month” (Slide 11).
  • Monthly growth chart: Slide 12 shows signed deals and fees charged trending up from Jun-20 to Jan-21 with a substantial acceleration in late 2020 (visual only). Precise monthly dollar values are not legible in the slide images but trend is strong (steady month-on-month growth).
  • Customer success: Case studies highlight revenue growth multiples: Tommi Skin — 8x revenue growth and 3.1x increase in ROAS (Slide 13–14); Bow Wow Labs — 2x revenue growth and 3x increase in ROAS; Geologie — 10x revenue growth (Slide 14).
  • Geographic concentration: US, UK and Australia contribute >95% of revenue (Slide 11).
  • Partnerships & distribution traction: Major platform agreements signed/won (WooCommerce and Adobe Commerce Cloud — Slide 19).
  • Investors: Deck shows top fintech/backer logos (Speedinvest, QED-related logos, DST-related logos, OED) indicating strong investor validation (Slide 9–10).

Competitive Positioning

How they differentiate

  • Speed and simplicity: Automated, API-driven onboarding (minutes) vs. slow debt processes (Slides 6 & 16).
  • Product fit: Underwrites using merchant first-party data and ties repayments to actual revenue — lower friction and less dilution than equity, more merchant-aligned than traditional debt (Slide 6).
  • Partnerships: Integration into commerce platforms (WooCommerce, Adobe Commerce) gives distribution advantage and embedded onboarding (Slide 19).
  • Risk model & product structure: Shorter duration (2–6 months), daily paybacks, and reliance on granular merchant data to price offers create a differentiated risk/return profile vs. traditional merchant lenders.

Team

Team credentials (from slides)

  • Founders: Aidan Corbett (CEO, Co-Founder) — background includes McKinsey & Company, Kubicle, Conjura (Slide 8). Jack Pierce (CFO, Co-Founder) — background includes Highway 1, PwC (Slide 8).
  • Senior hires: VP Sales Dan O’Brien (Vantage / screenfluence), Niall Gormley (Head of Product, Engineering — ex-Oracle/StarGroup), Margaret Kearney (General Counsel — ex-Bank of Ireland/Cartreview?), Edward Doyle (VP Product — ex-BAE/Kyckr) (Slide 8).
  • Investors / advisors: Logos include Speedinvest, QED, DST, OED and portfolio comparisons (Slide 9–10). This provides signal of experienced investor syndicate.

Go-to-Market Strategy

Distribution approach if shown

  • Direct outbound sales (Table of contents).
  • Platform partnerships / integrations: Key bet on commerce platforms as distribution — WooCommerce extension and exclusive Adobe Commerce relationship (Slide 19). These partnerships are shown as “Won” with expected go-live timing (end of March / April 2021) and are positioned as channels to market Wayflyer to merchants.
  • Speed & product virality: Fast onboarding, white-labeled / embedded extensions to capture merchants in-platform (Slide 16 & 19).

The Ask

What they were raising and use of funds

  • The provided company context states the round was $10.2M. The slides emphasize “Financials” and “Debt Finance / Near-Term Cashflow Projections” in the table of contents (Slide 2), and include a cashflow-tracking slide (Slides 20–21), but the deck images shown do not include a clear use-of-funds breakdown. From slide labels the raise intent likely covered debt financing capacity and near-term liquidity for deployment, but explicit allocation (e.g., X% for capital deployment vs. ops) is not shown in the visible slides.

Investor Deep Dive

Executive summary, strengths & red flags

Executive Summary

This deck presents Wayflyer’s merchant-finance product that plugs a recurring working-capital gap for eCommerce merchants. It is tightly focused: (1) clearly defines the cash-timing problem for merchants, (2) describes a fast, data-driven merchant cash-advance product, and (3) provides early traction, marquee investors and strategic partnerships (WooCommerce, Adobe Commerce). Notable strengths are the crisp problem framing, fast onboarding flow and clear GTM partnerships; weaknesses include limited unit-economics detail and sparse hard financials in the deck.

Key Strengths

3 identified

1

Clear problem-to-solution narrative — The deck uses a simple, visual cash-timing chart (30%/70% + marketing lag) to make the problem tangible and intuitive (Slide 4).

2

Fast, productized onboarding and underwriting story — The step-by-step UX flow with minute-level steps (connect accounts 1–2 mins, offer in 15 mins, underwriting 25 mins) and daily payback model make product benefits concrete (Slide 16).

3

Credible traction & partnerships — Early revenue ($600k first month), customer growth case studies (2x–10x), and platform wins (WooCommerce, Adobe Commerce) plus top-tier fintech investor logos provide strong momentum and distribution validation (Slides 11, 13–14, 19).

Red Flags & Weaknesses

3 identified

1

Lack of unit-economics detail — No clear metrics shown for CAC, LTV, average advance size, repayment speed distribution, or actual default/loss rates despite claims of “negligible default level” (Slides 6 & 12). This is critical for a capital-intensive merchant-finance business.

2

No quantified market sizing (TAM/SAM/SOM) — Deck omits explicit market size numbers and penetration assumptions (Table of contents indicates market section but no TAM figures are visible). Investors will want a quantified market model.

3

Concentration & capital sensitivity — >95% revenue from US/UK/Australia (Slide 11) and dependence on continuing access to capital (debt finance implied) represent concentration and execution risk; the deck lacks a detailed plan for funding the lending pools and stress-testing defaults/scenarios (Slides 2 & 20).

More Pitch Decks To Study

Compare structure, fundraising context, and investor-facing story across similar startup decks.