Compare your deck to Tesla

Compare Your Deck

Tesla Pitch Deck (2018)

Deep Tech
Stage: Growth
Raised: $40M (early stage)
Year: 2018
Slides: 16
Outcome: Public company, $800B+ market cap

Pitch Deck

1 / 16
Tesla pitch deck - Cover & Framing: Clear, brand-forward opening
Click to expand

Deck Analysis

This deck is an early-growth investor presentation from Tesla that combines product vision, team credibility, traction metrics and manufacturing plans to persuade investors to fund scale-up. It’s notable for pairing glossy product imagery (Model S) with concrete engineering and manufacturing milestones, plus strong partner validation; together these elements show how a deep-technology company can bridge from prototype to volume production. Founders can learn how to balance aspirational storytelling with quantifiable proof points — team pedigree, reservation numbers, partner deals and facility investments — to de-risk a capital-intensive roadmap for investors.

Cover & Framing: Clear, brand-forward opening

Cover & Framing: Clear, brand-forward opening

The cover slide (clean Tesla wordmark and ‘Investor Presentation’ label) sets a confident, brand-first tone without noise. It signals this deck is formal and investor-facing while using minimal text so the audience focuses on the speaker and the narrative rather than dense on-slide copy. This restrained design choice establishes credibility from the first frame and primes the audience for a professional presentation.

Founders should note the power of a simple, well-branded opener: it communicates seriousness and product focus immediately. Avoid clutter on the first slide; use it to declare who you are, and let subsequent slides carry the substance.

Key Takeaway: Start strong with a minimal, brand-focused cover that signals professionalism and lets the presenter own the narrative.
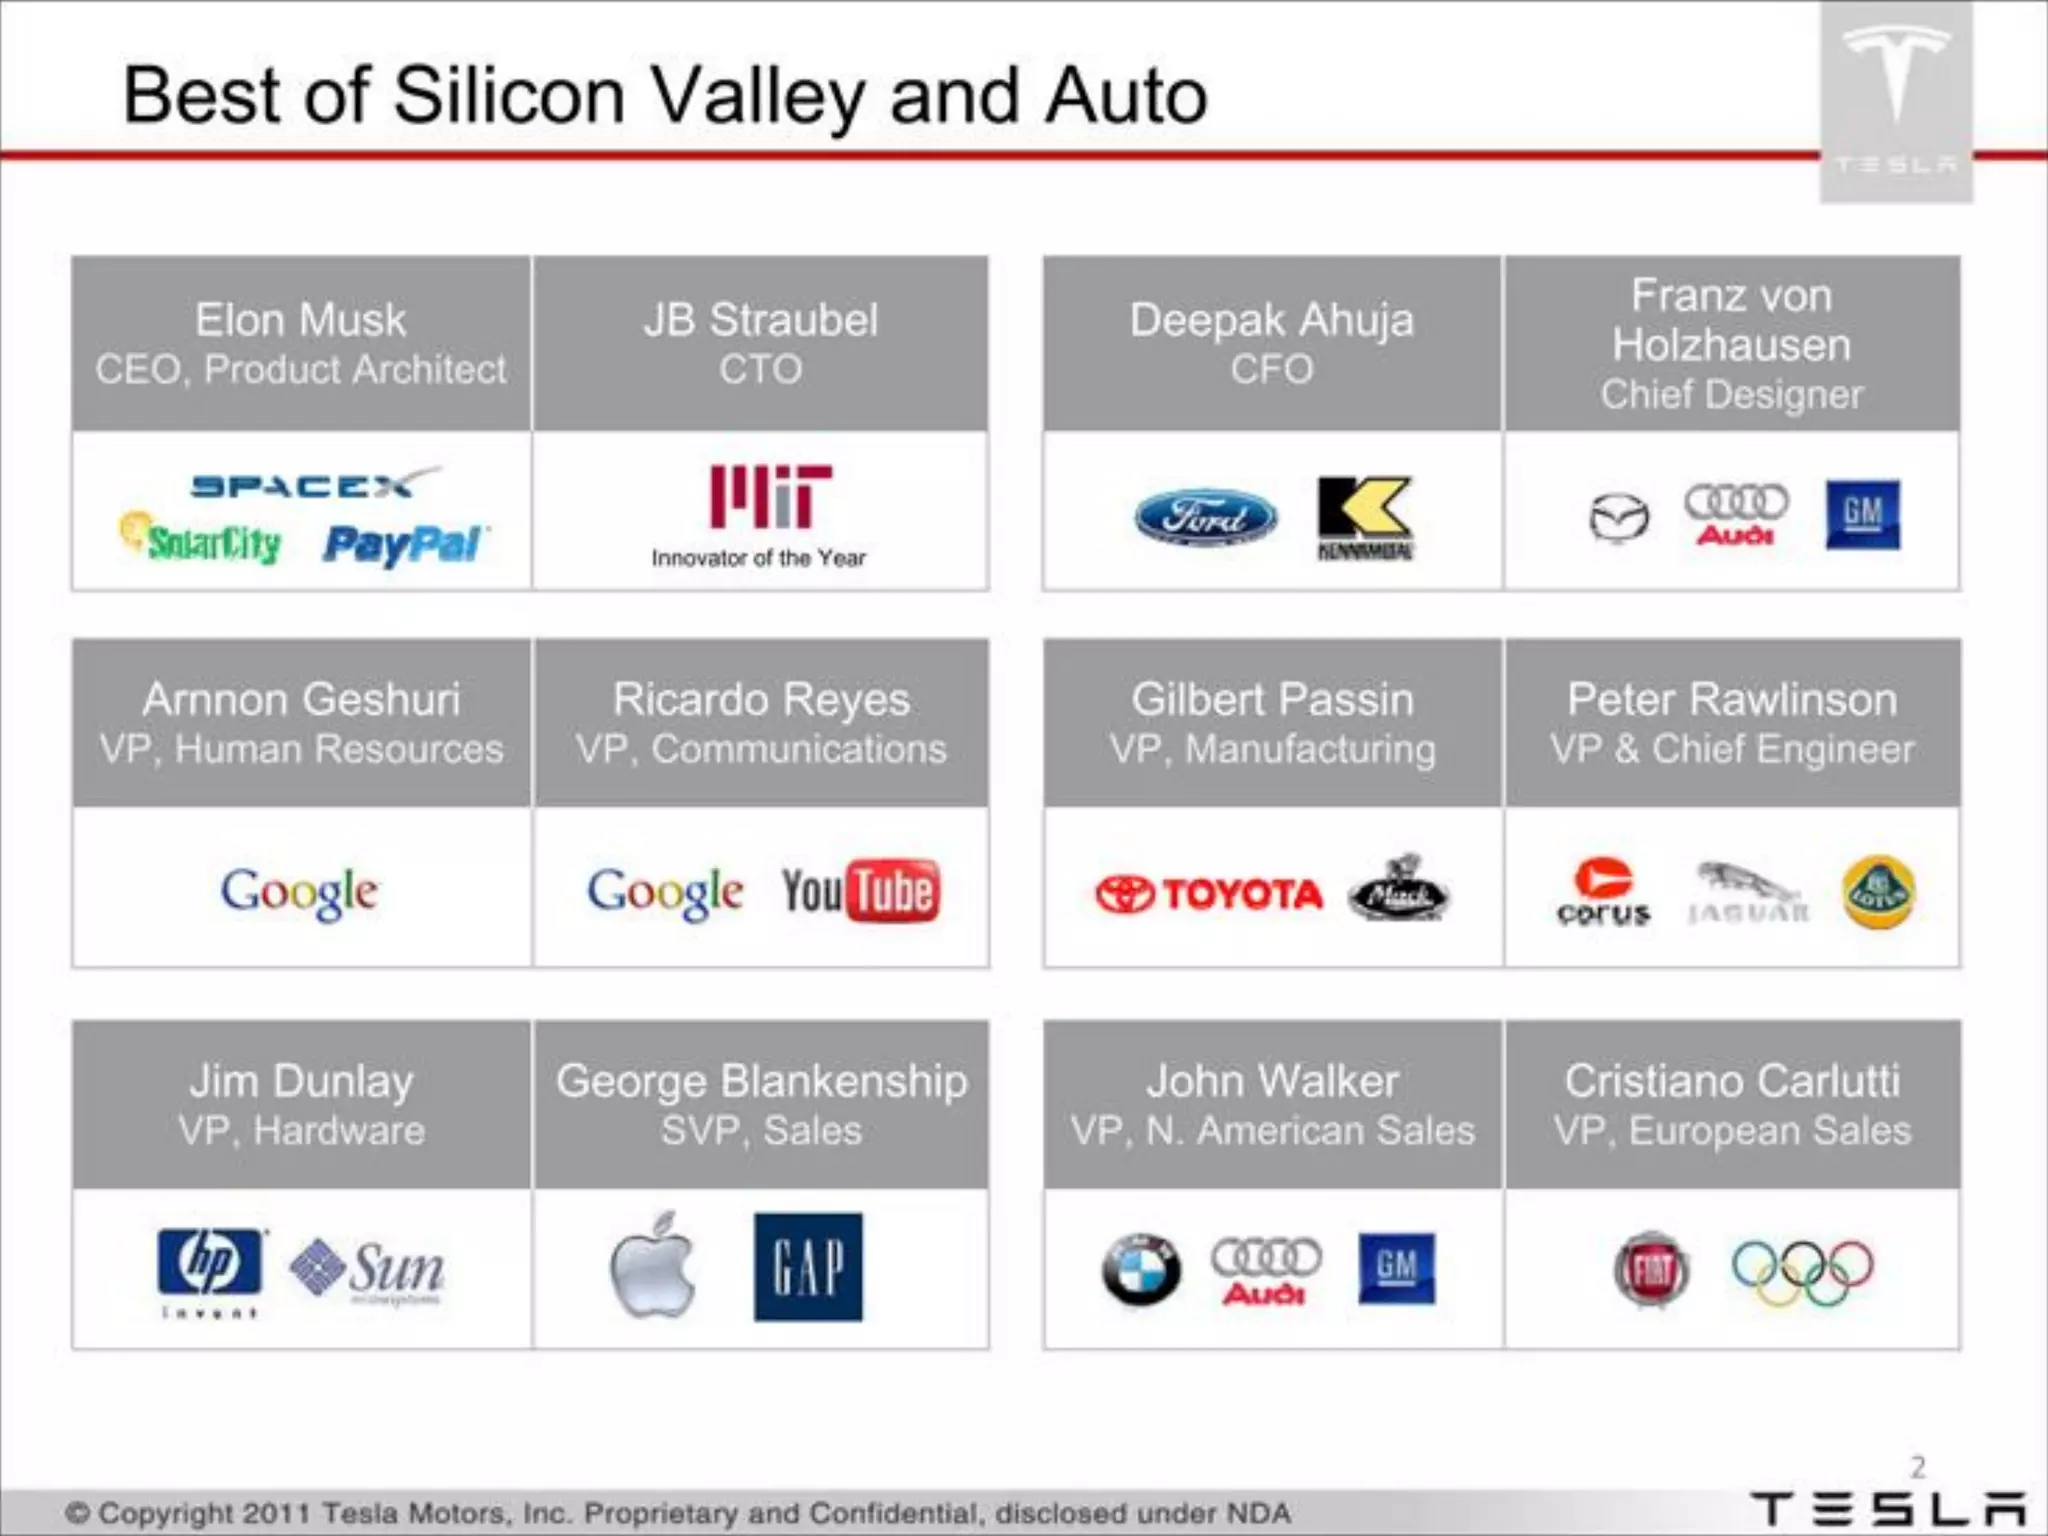
Team Slide: Leverage credibility and recognizable experience

Team Slide: Leverage credibility and recognizable experience

Slide 2 catalogs Tesla’s leadership with names, titles and the logos of prior employers (SpaceX, PayPal, MIT, Toyota, Google, etc.). This visual shorthand communicates deep technical, product and auto-industry experience without long bios. Displaying well-known logos immediately conveys pedigree and reduces the storytelling burden for the presenter: investors instantly infer capability, network and track record.

The lesson for founders is to highlight complementary strengths (CEO/product, CTO, CFO, manufacturing/sales leads) and previous institutional affiliations that matter for execution risk. When capital raises hinge on operational capability — especially for hardtech or hardware companies — a concise team slide with recognizable anchor points is essential.

Key Takeaway: Showcase a balanced leadership team and recognizable prior employers to convert credibility into investor confidence quickly.
Engineering Team Growth: Quantify capability expansion

Engineering Team Growth: Quantify capability expansion

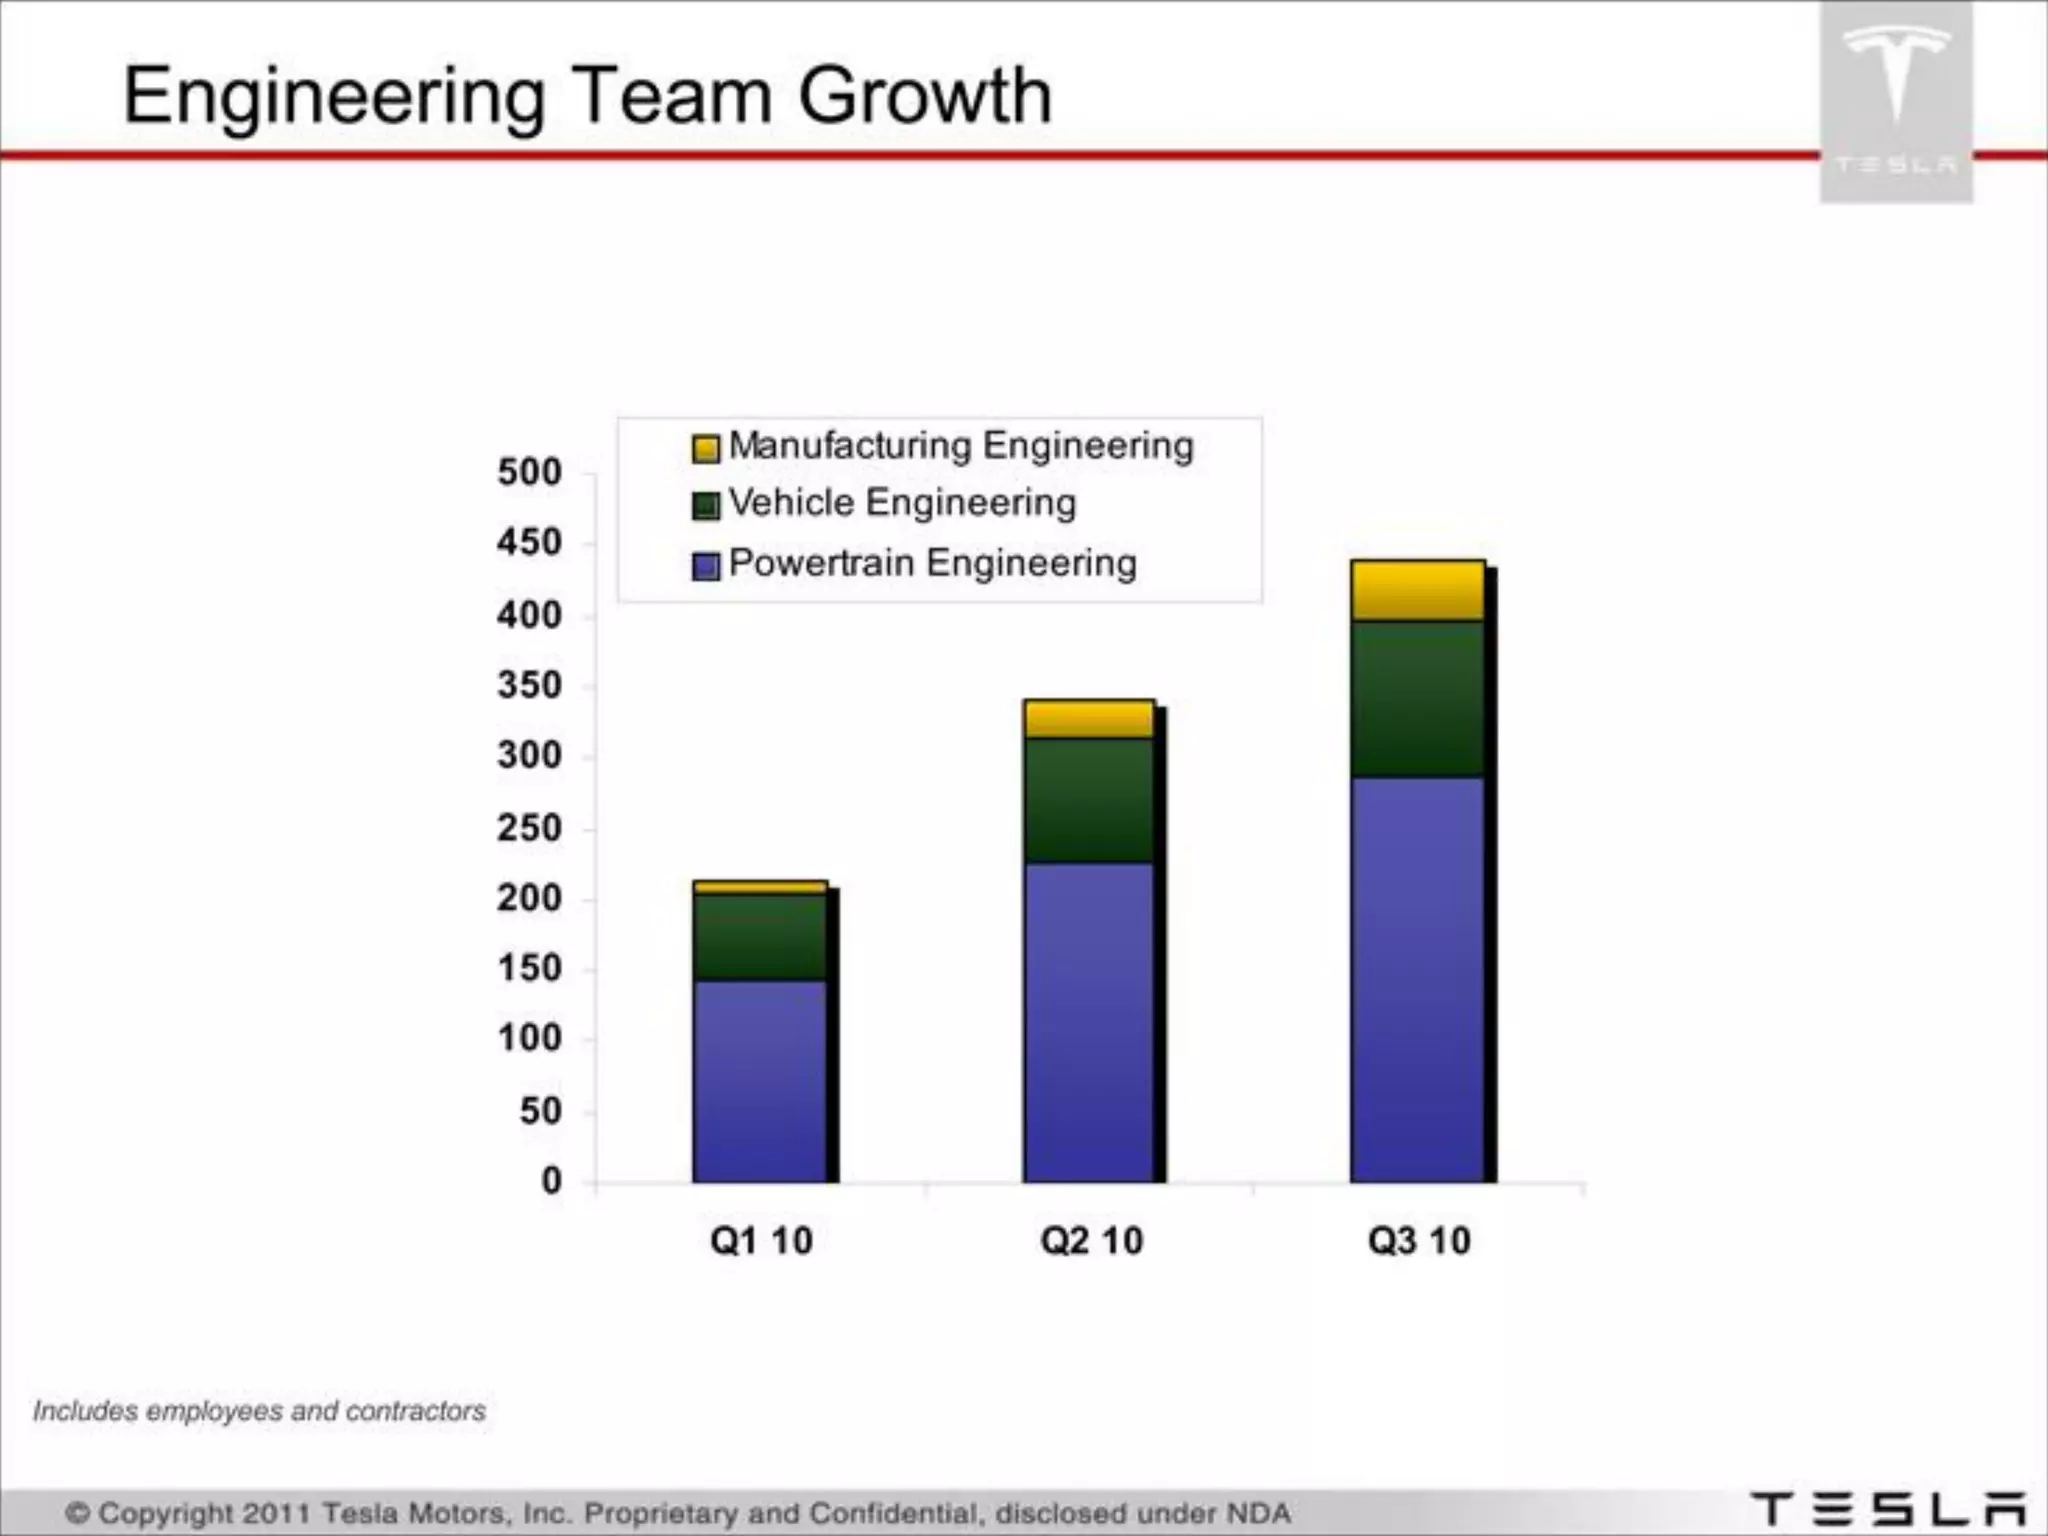
Slide 3 uses a stacked-bar chart to show rapid growth in engineering headcount across powertrain, vehicle and manufacturing engineering over quarters. This slide does three things: it proves Tesla is scaling technical capacity, it signals where hiring focus lies (powertrain-heavy) and it ties headcount growth to a timeline supporting product development and manufacturing ramp. The visual is simple and interpretable, letting investors judge whether hiring matches the stated roadmap.

For founders, metrics about team growth (hiring pace by function) are persuasive because they map resource allocation to milestones. When raising capital for hardware scaling, demonstrate that hiring is purposeful — not just growth for growth’s sake — and link it to concrete deliverables (e.g., prototype builds, validation, production readiness).

Key Takeaway: Use simple charts to show how hiring maps to product milestones so investors can see you’ve resourced the right capabilities at the right time.
Product Showcase: Make the vision tangible with strong imagery

Product Showcase: Make the vision tangible with strong imagery

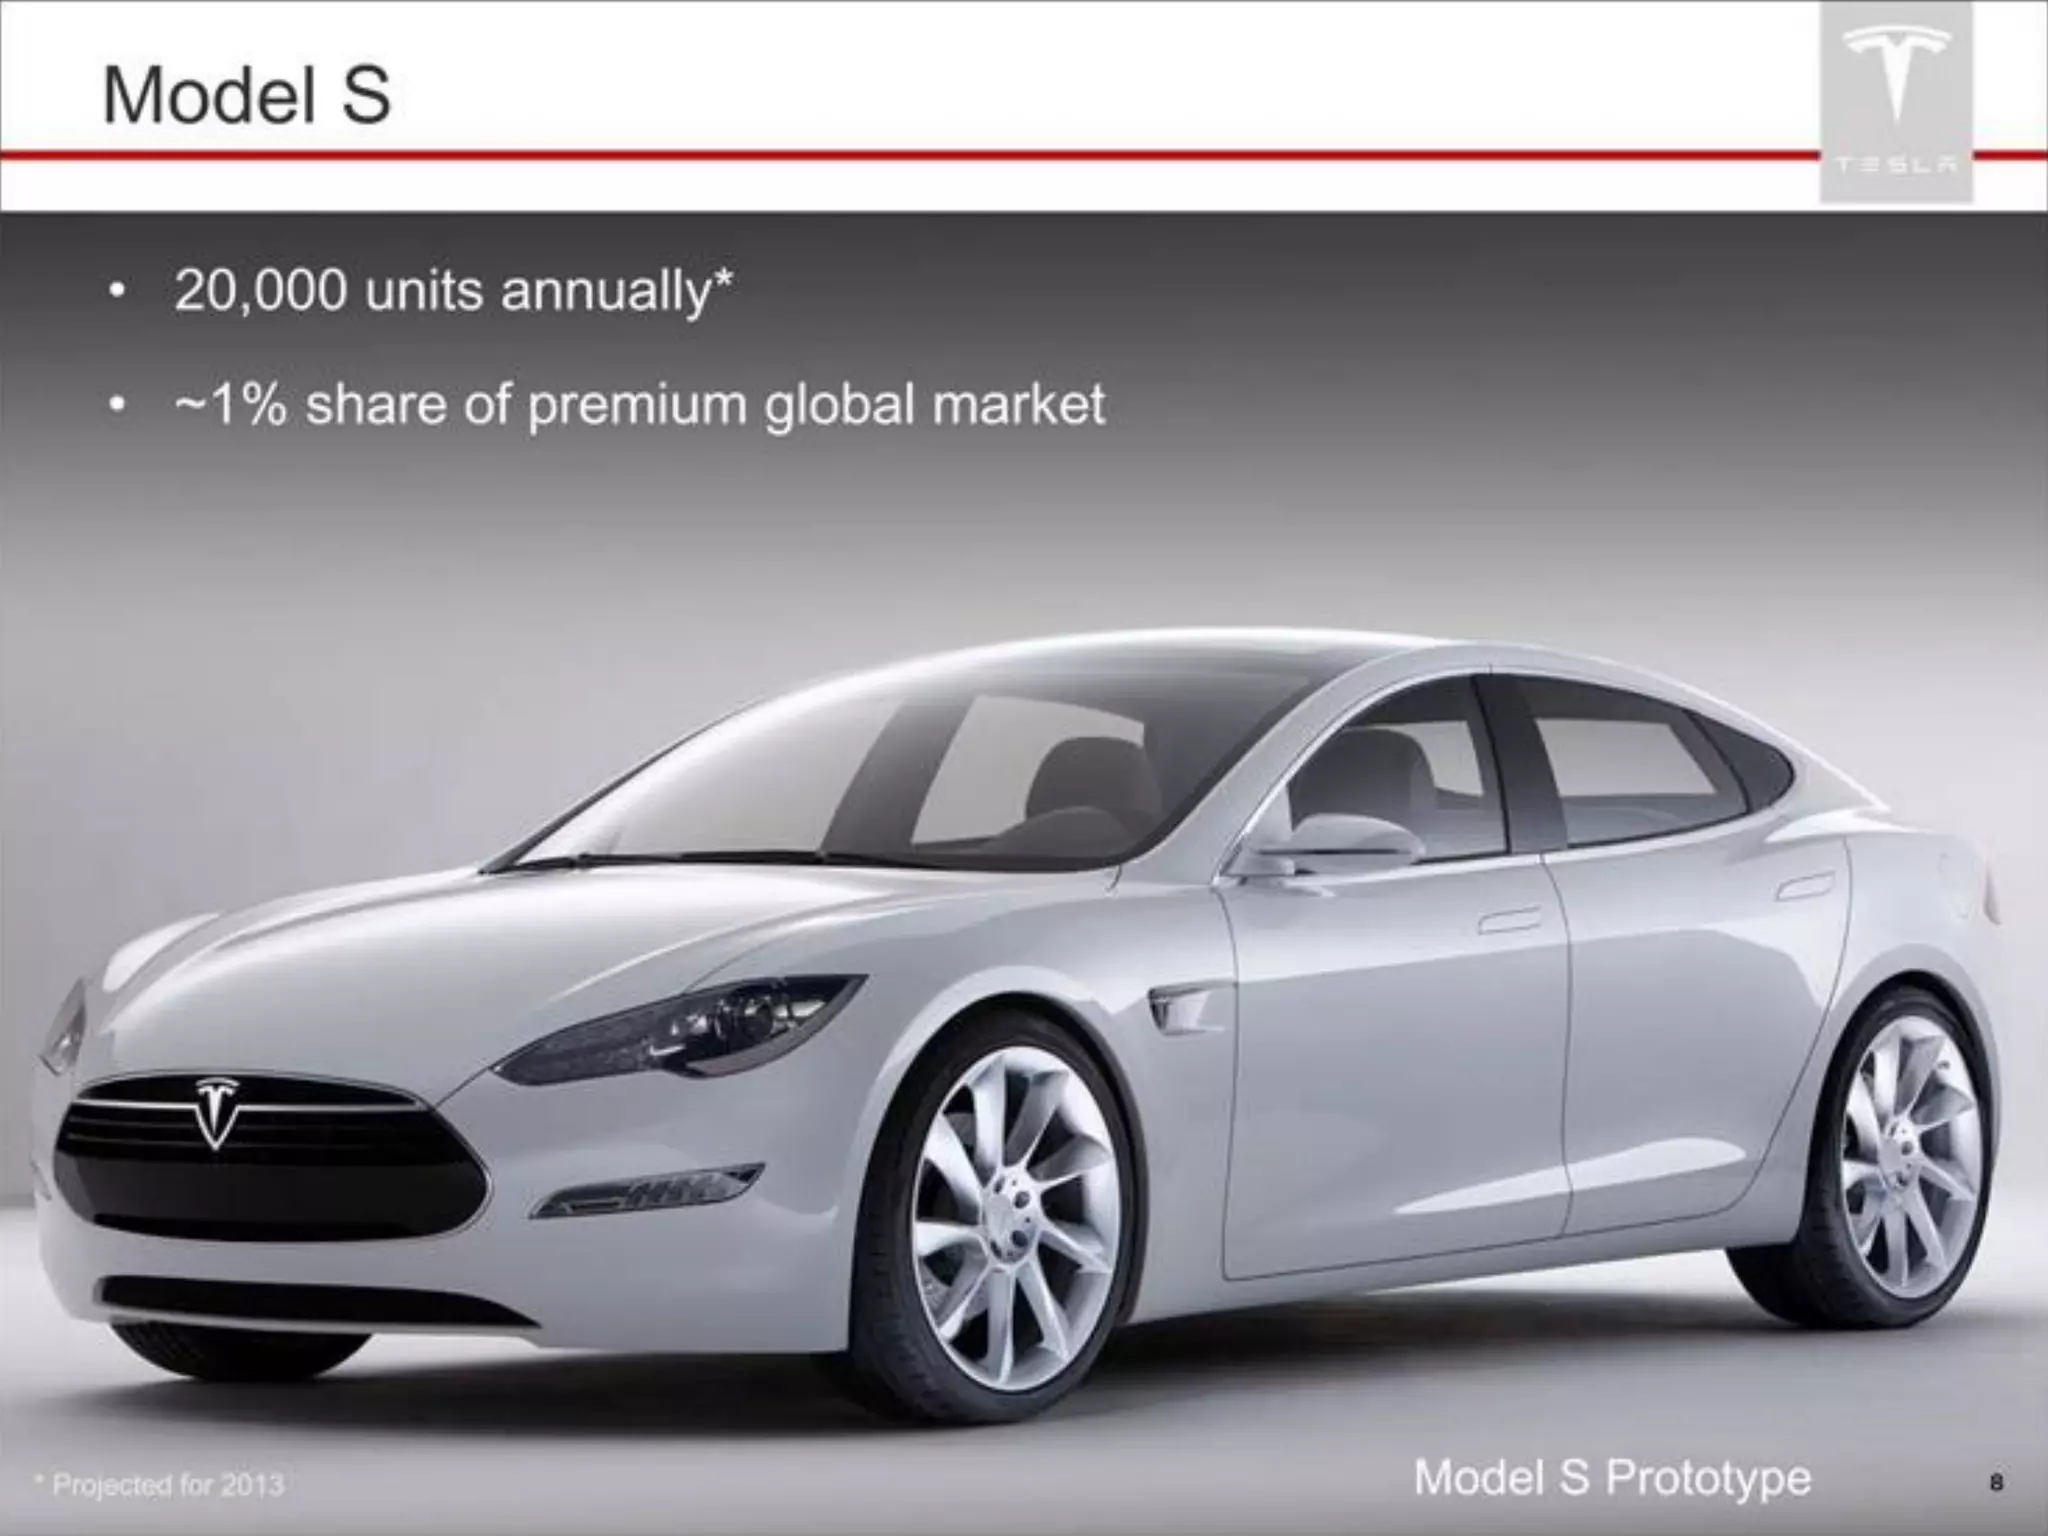
Slide 9 (Model S prototype photo with target unit volumes) pairs aspirational imagery with a short, specific production goal (“20,000 units annually, ~1% share of premium global market”). The large, high-quality product image communicates what the company is building; the bullet points quantify the scale and market ambition. This combination keeps the slide emotional and rational at once: investors see the product and also understand the business scale sought.

Founders should present product visuals at a large scale in investor decks, but always attach at least one clear, quantitative target—units, market share or timelines—so the vision has a measurable endpoint. Avoid vague claims; couple aspirational design with specific production or market metrics.

Key Takeaway: Pair high-quality product visuals with one or two clear, measurable targets to make the vision both compelling and investible.
Competitive & Product Differentiation: Feature and performance framing

Competitive & Product Differentiation: Feature and performance framing

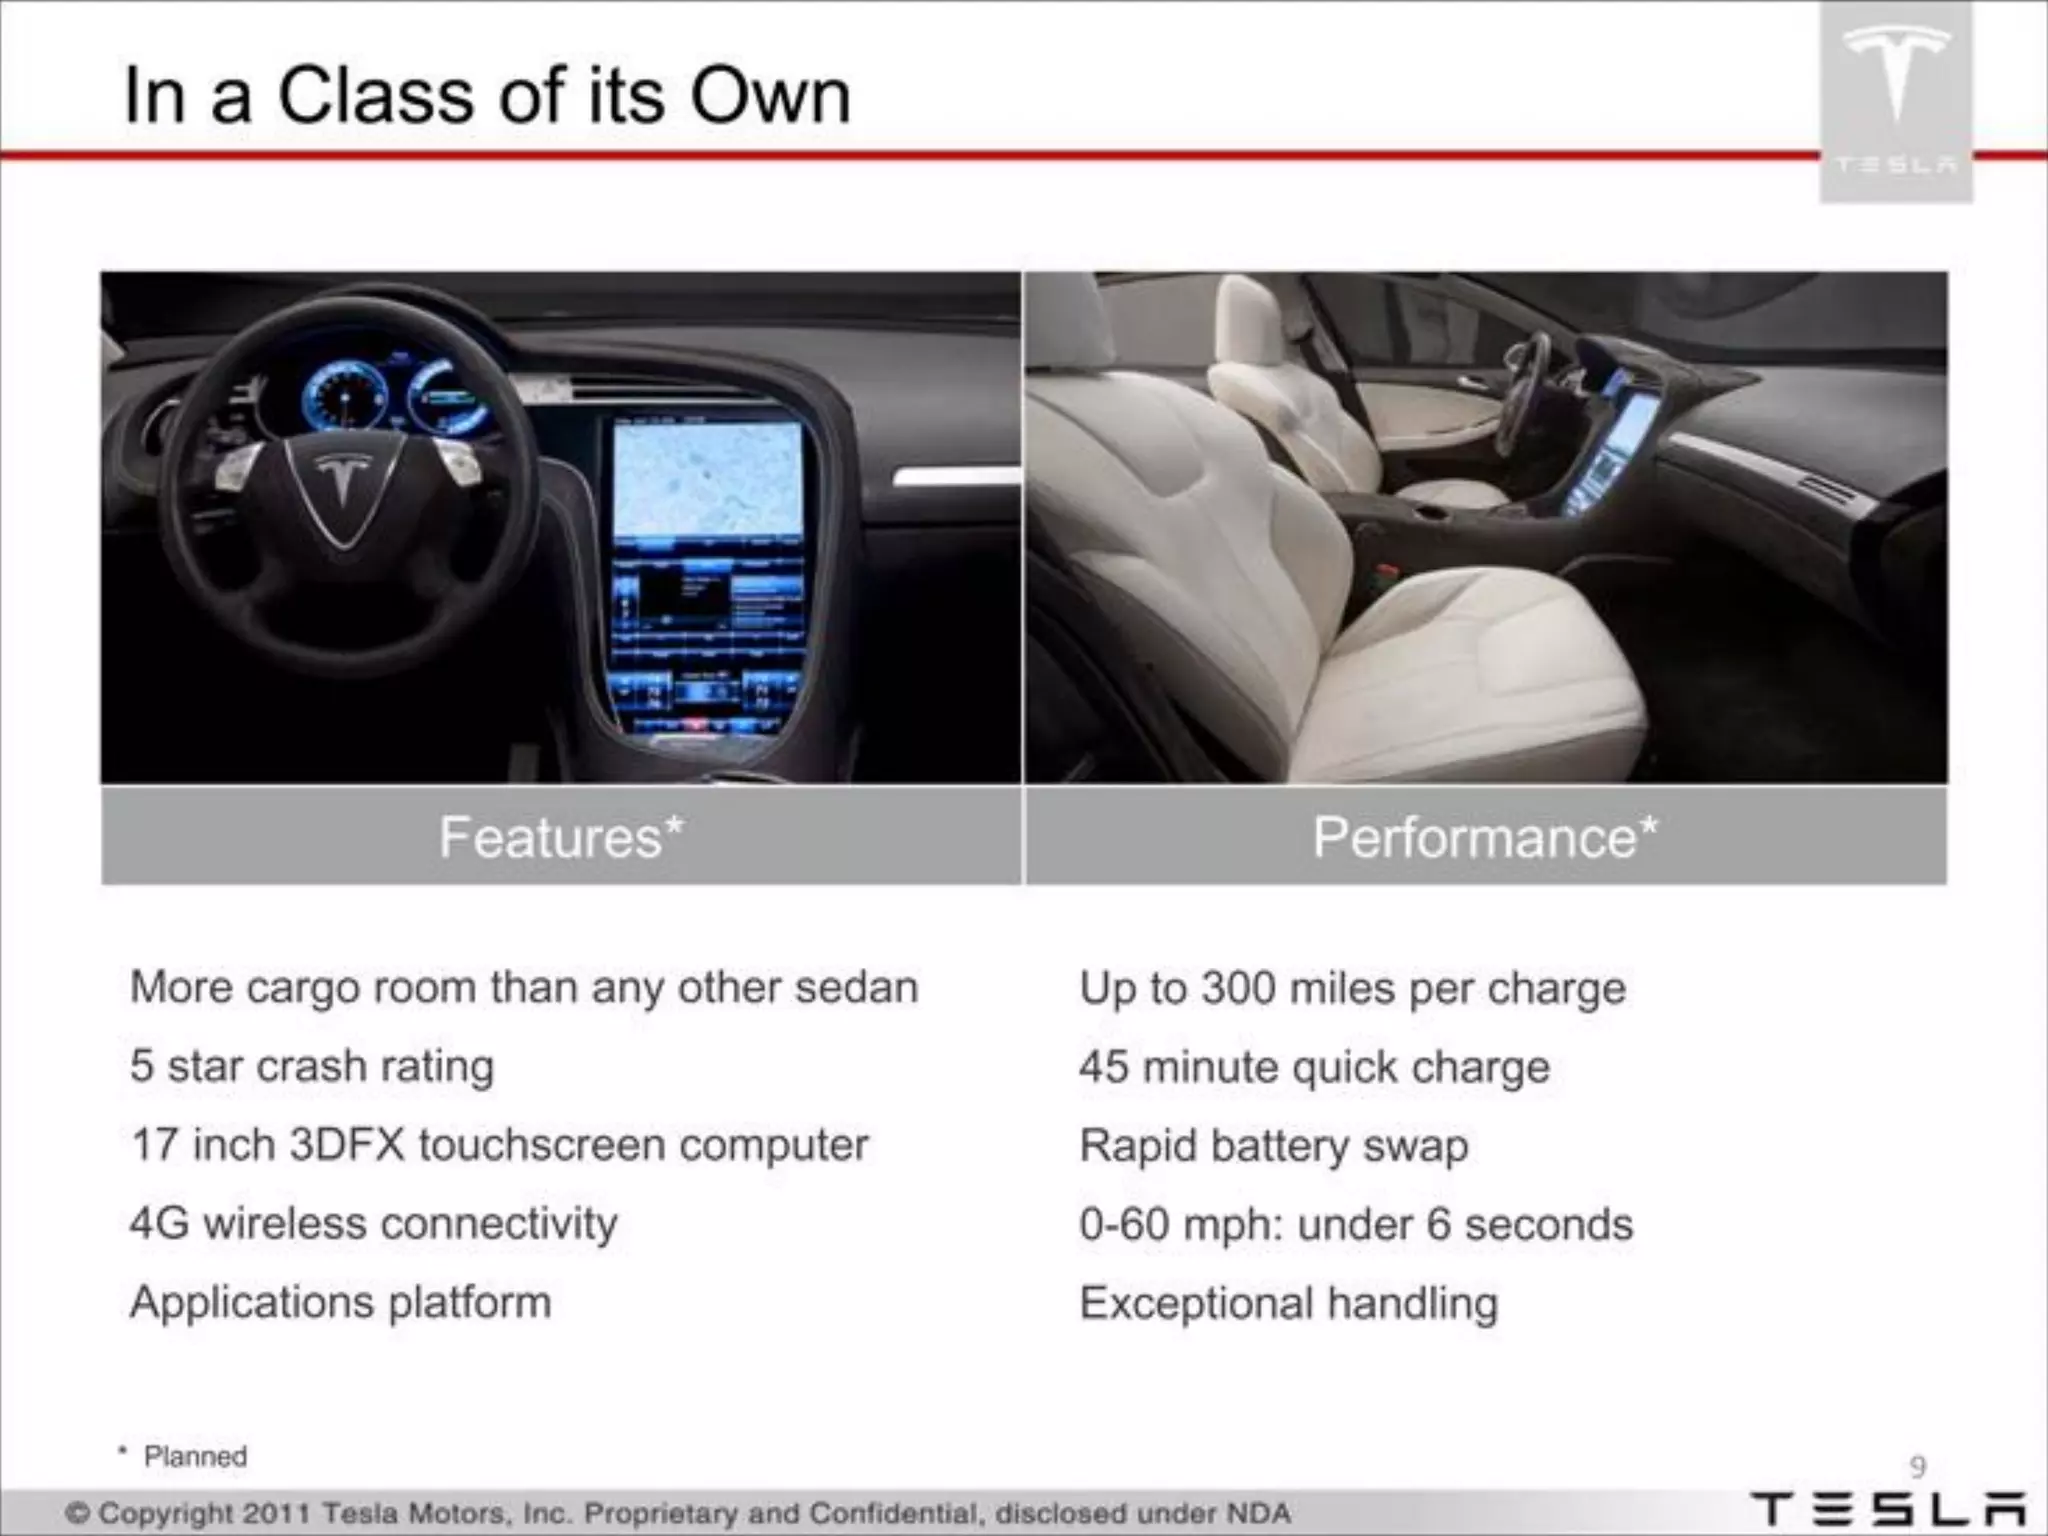
Slide 10 (‘In a Class of its Own’) contrasts features and performance with short bullet lists and interior photos, emphasizing unique selling points like cargo space, touchscreen, 4G connectivity, 300-mile range, quick charge and sub-6 second 0-60. The dual-column layout helps investors quickly see product advantages vs. incumbents, and the mix of customer-facing features with performance metrics appeals to both consumer and technical investors.

Founders can learn to present differentiation across two dimensions (customer features and technical performance) so investors understand both market appeal and engineering superiority. Keep lists concise and prioritized: lead with the few features most likely to drive purchase decisions or justify premium pricing.

Key Takeaway: Frame differentiation on both user-facing features and hard performance metrics to appeal to product and finance-focused investors alike.
Traction: Reservations chart to quantify demand and de-risk revenue

Traction: Reservations chart to quantify demand and de-risk revenue

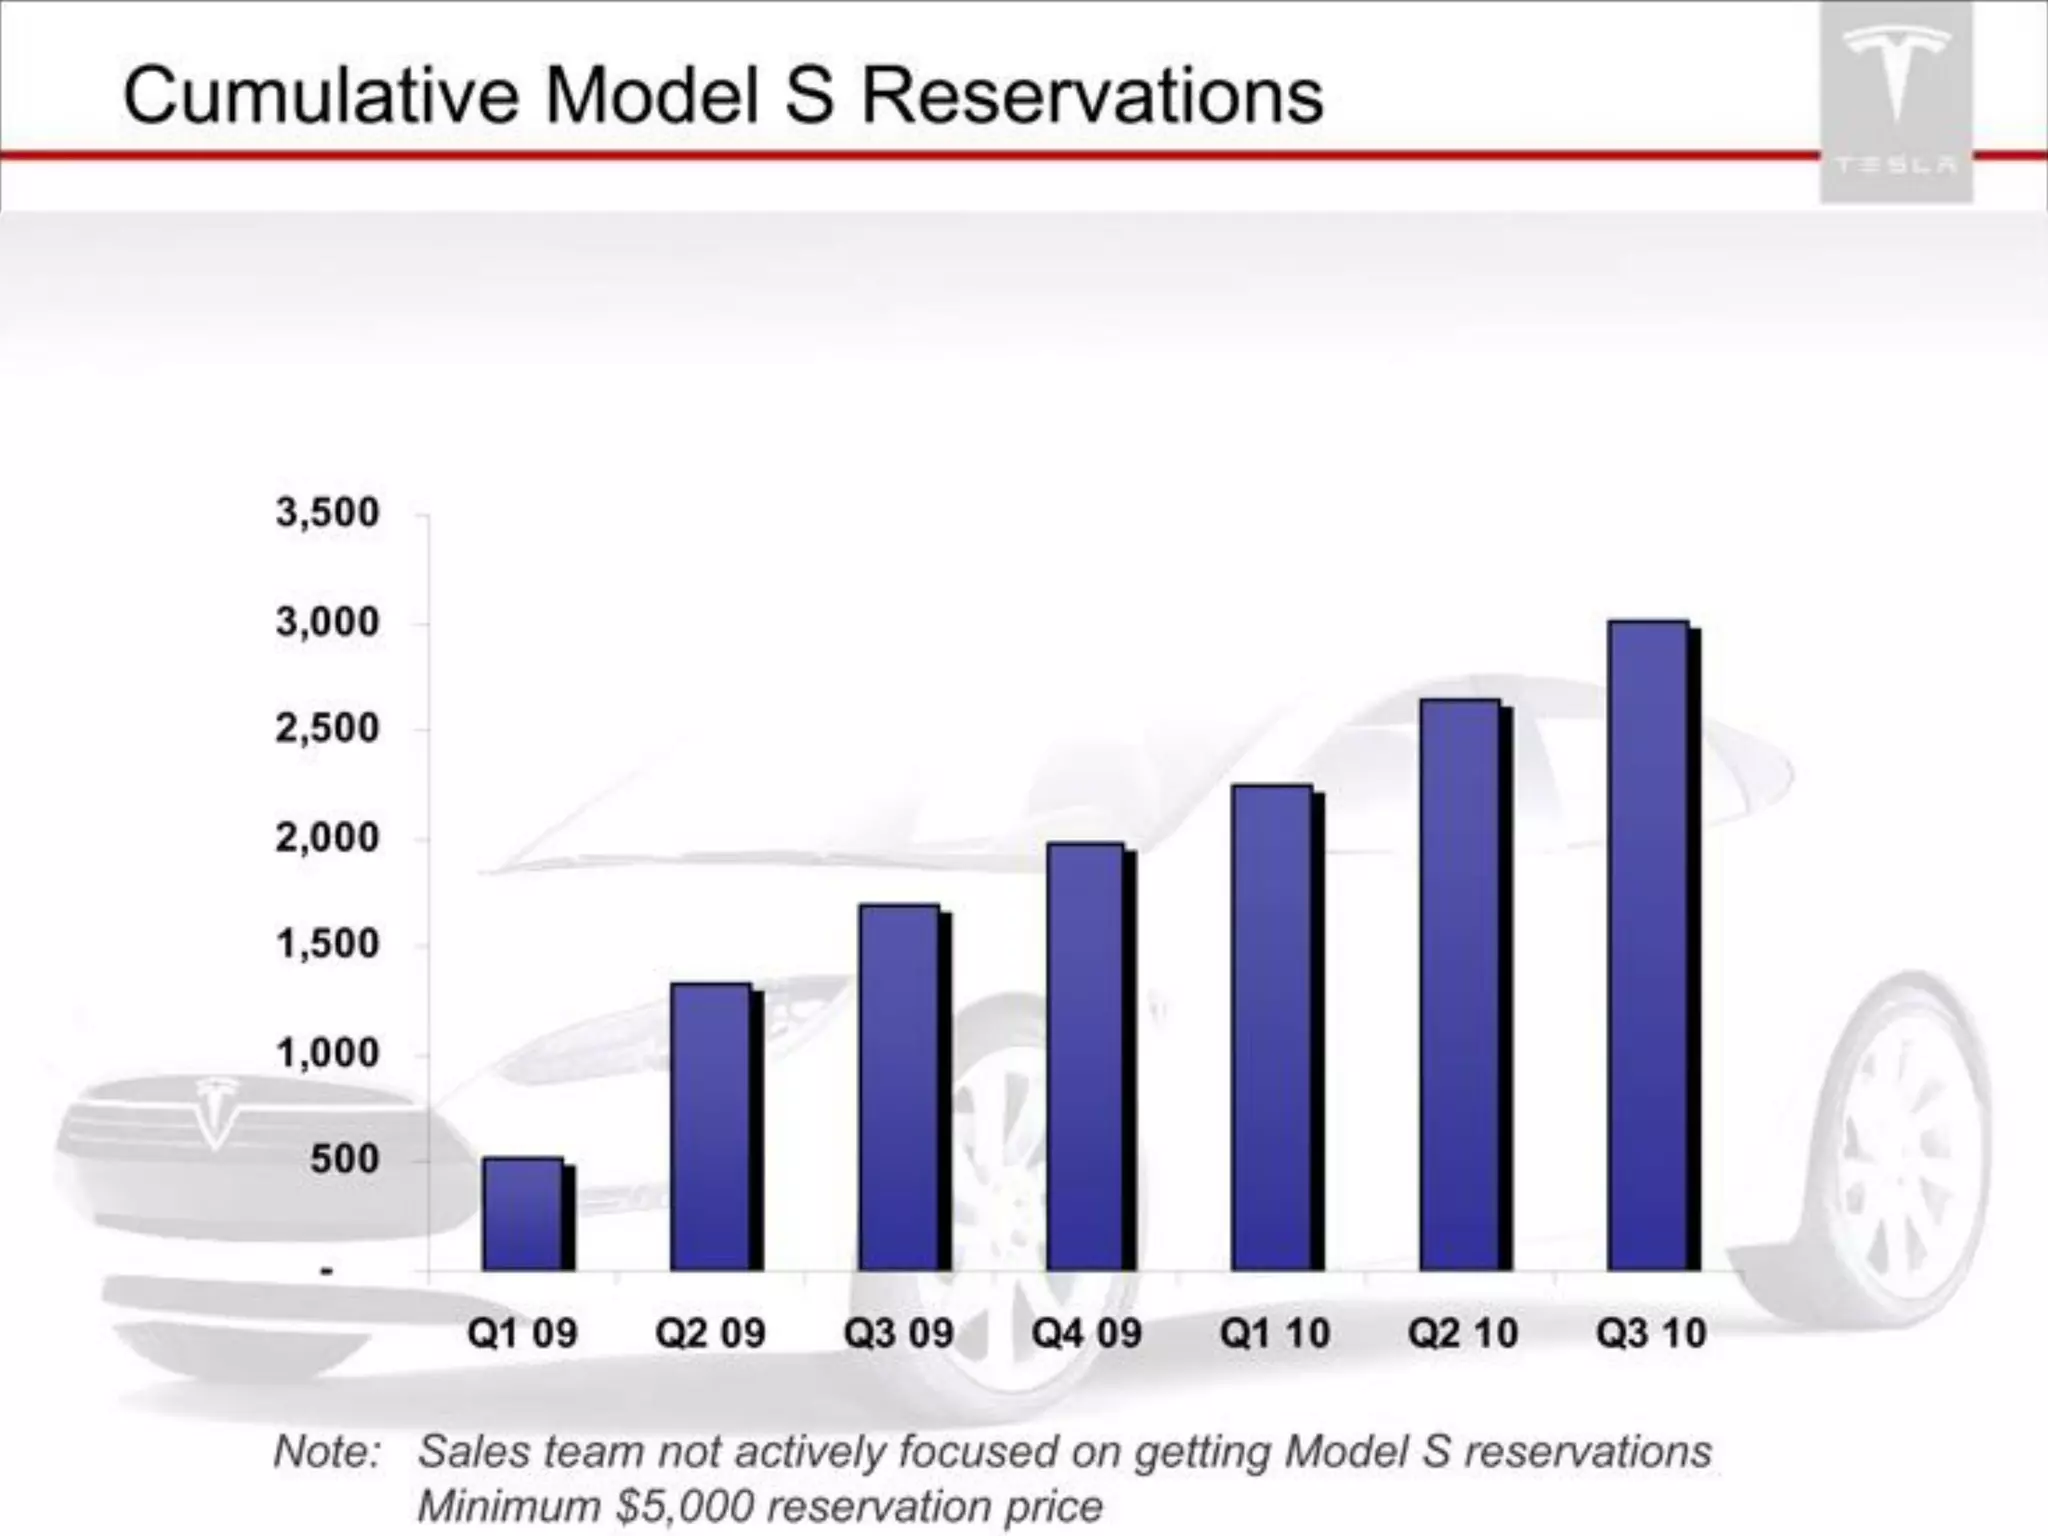
Slide 11 (Cumulative Model S reservations) uses a simple growing-bar chart to show reservation momentum across quarters, with a note about reservation pricing. Reservations are a compelling traction metric for a pre-revenue hardware company because they represent committed demand and visible cash flow (or refundable deposits). The slide subtly emphasizes that sales weren’t the primary focus yet customers were already committing money, which materially de-risks future revenue estimates.

Founders should surface binding or semi-binding customer commitments early in a deck. When deposits or pre-orders exist, quantify them and show trendlines — it’s one of the strongest signals for investor conviction in capital-intensive businesses because it directly evidences market willingness to pay.

Key Takeaway: Use reservation or pre-order data as a tangible traction metric to materially reduce perceived revenue risk for investors.
Roadmap & Milestones: Timeline for engineering and manufacturing

Roadmap & Milestones: Timeline for engineering and manufacturing

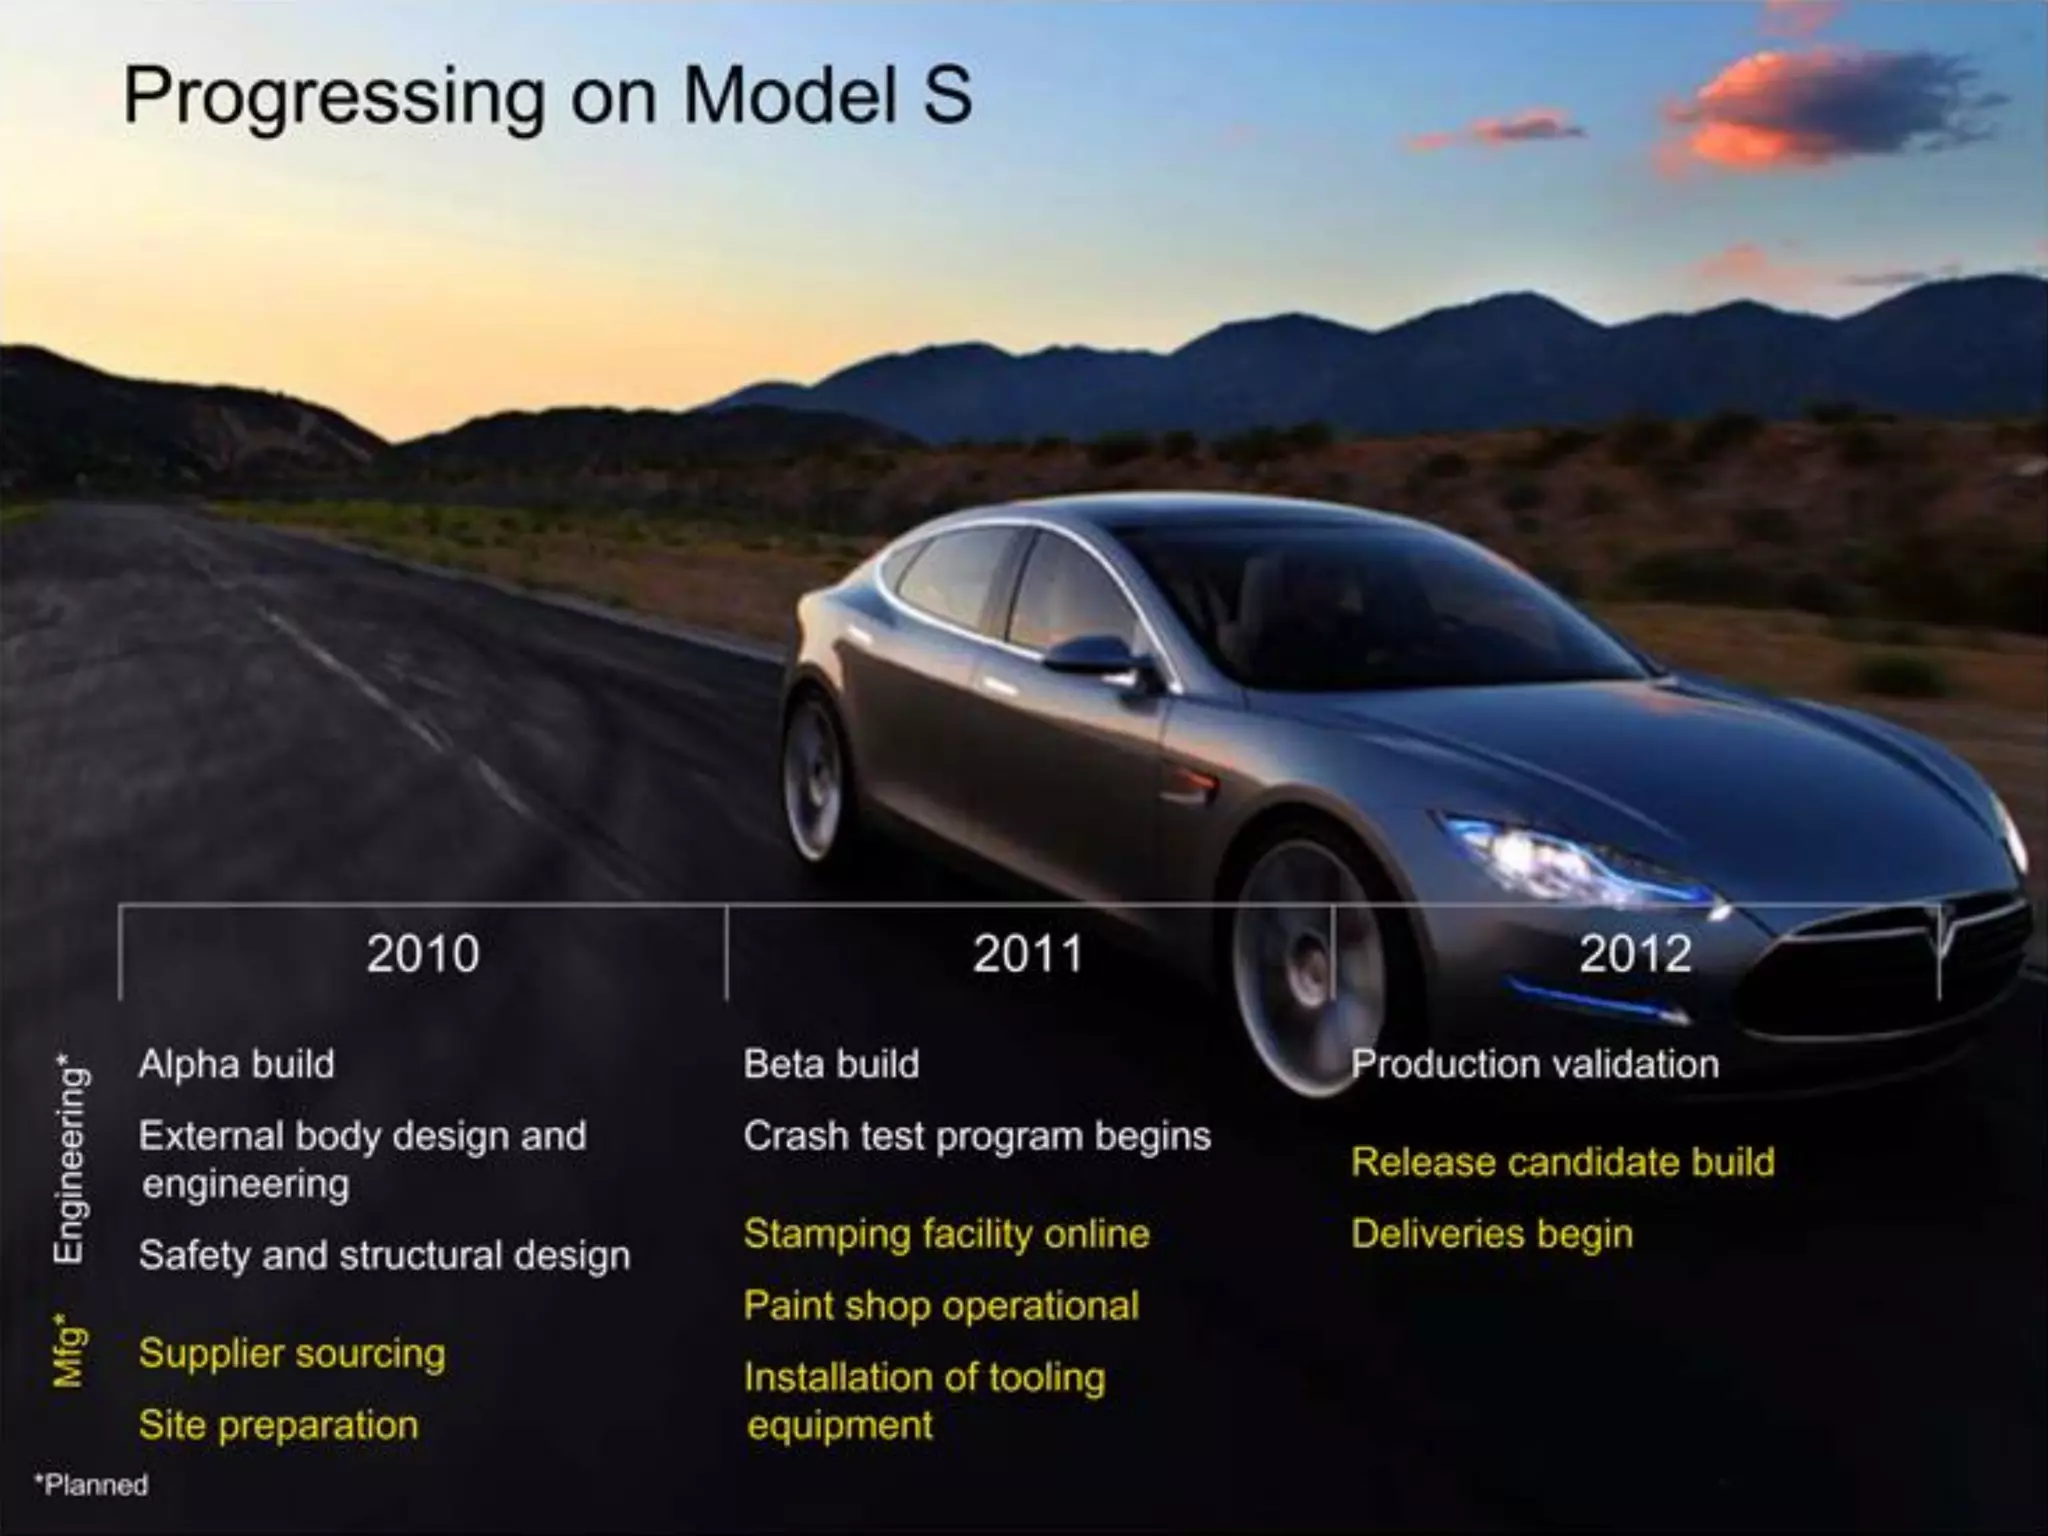
Slide 13 (Progressing on Model S) presents a multi-year timeline with clear engineering and manufacturing milestones (alpha/beta builds, crash tests, stamping/paint shop operational, production validation and deliveries). The slide integrates product development with factory readiness, which is essential for hardware companies; investors need to see both design progress and the manufacturing enablers in parallel. Highlighting specific operational milestones (paint shop online, tooling installation) shows an execution plan rather than aspirational goals.

Founders should create roadmaps that tie engineering deliverables to factory readiness and market launch, and call out dependencies and expected dates. Demonstrating that you understand the operational steps (supplier sourcing, site prep, tooling) reassures investors that the team has practical plans for scaling production.

Key Takeaway: Present a dual-track roadmap that aligns product engineering with manufacturing milestones to show how design translates into production-ready reality.
Manufacturing Footprint: Facility and asset-level evidence of manufacturing readiness

Manufacturing Footprint: Facility and asset-level evidence of manufacturing readiness

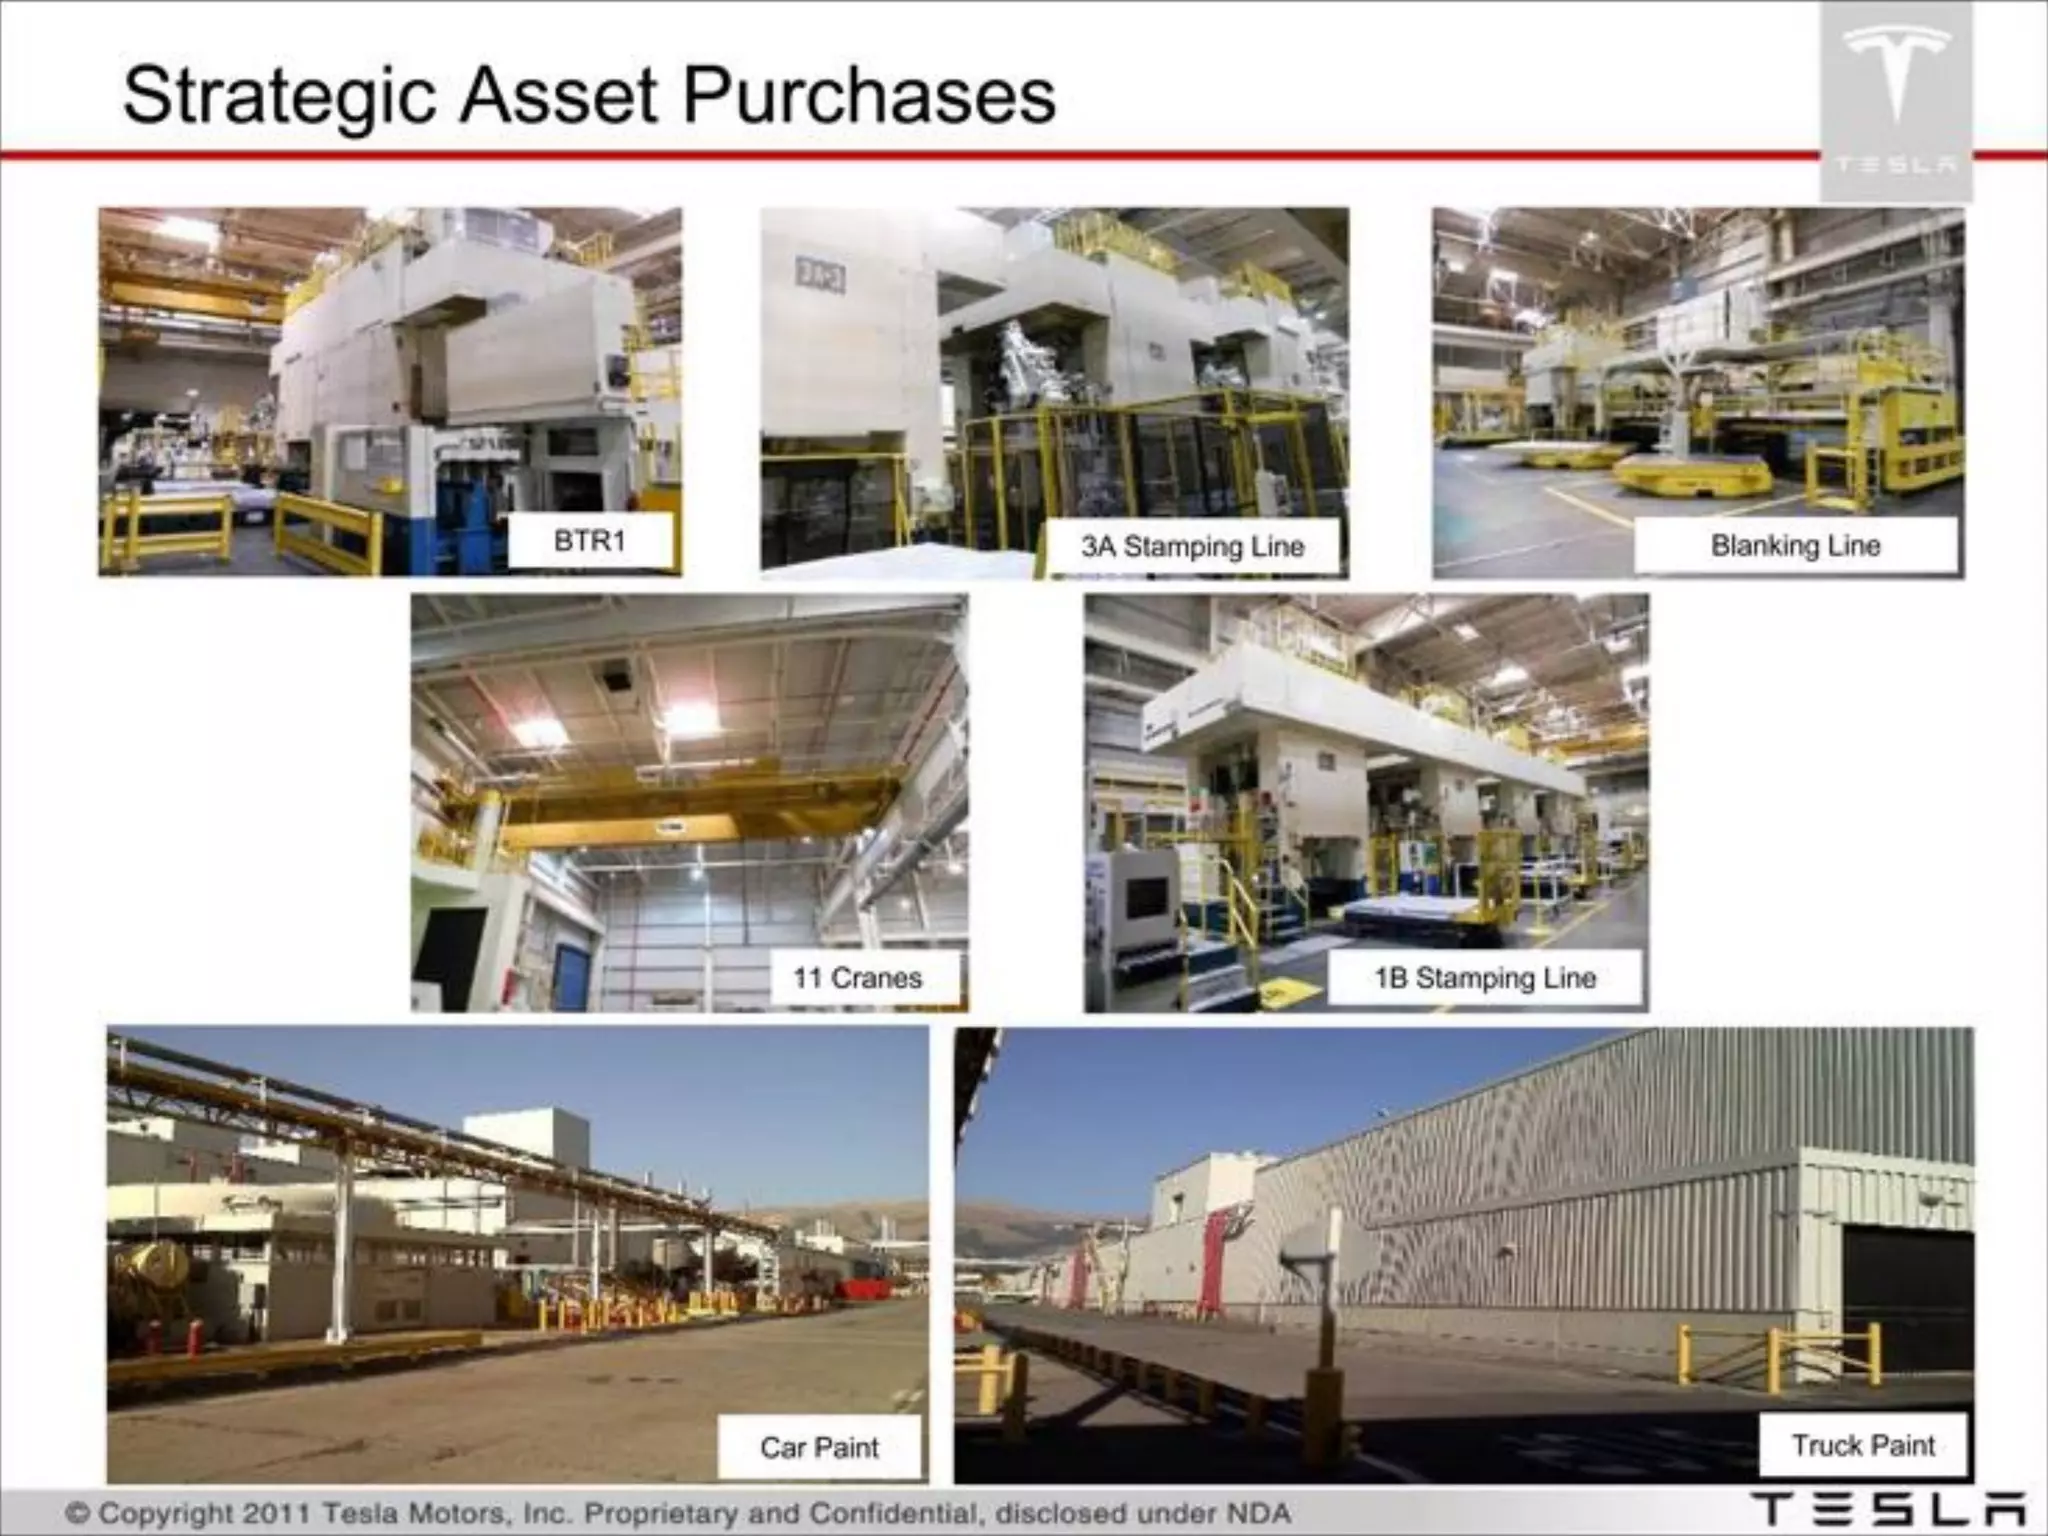
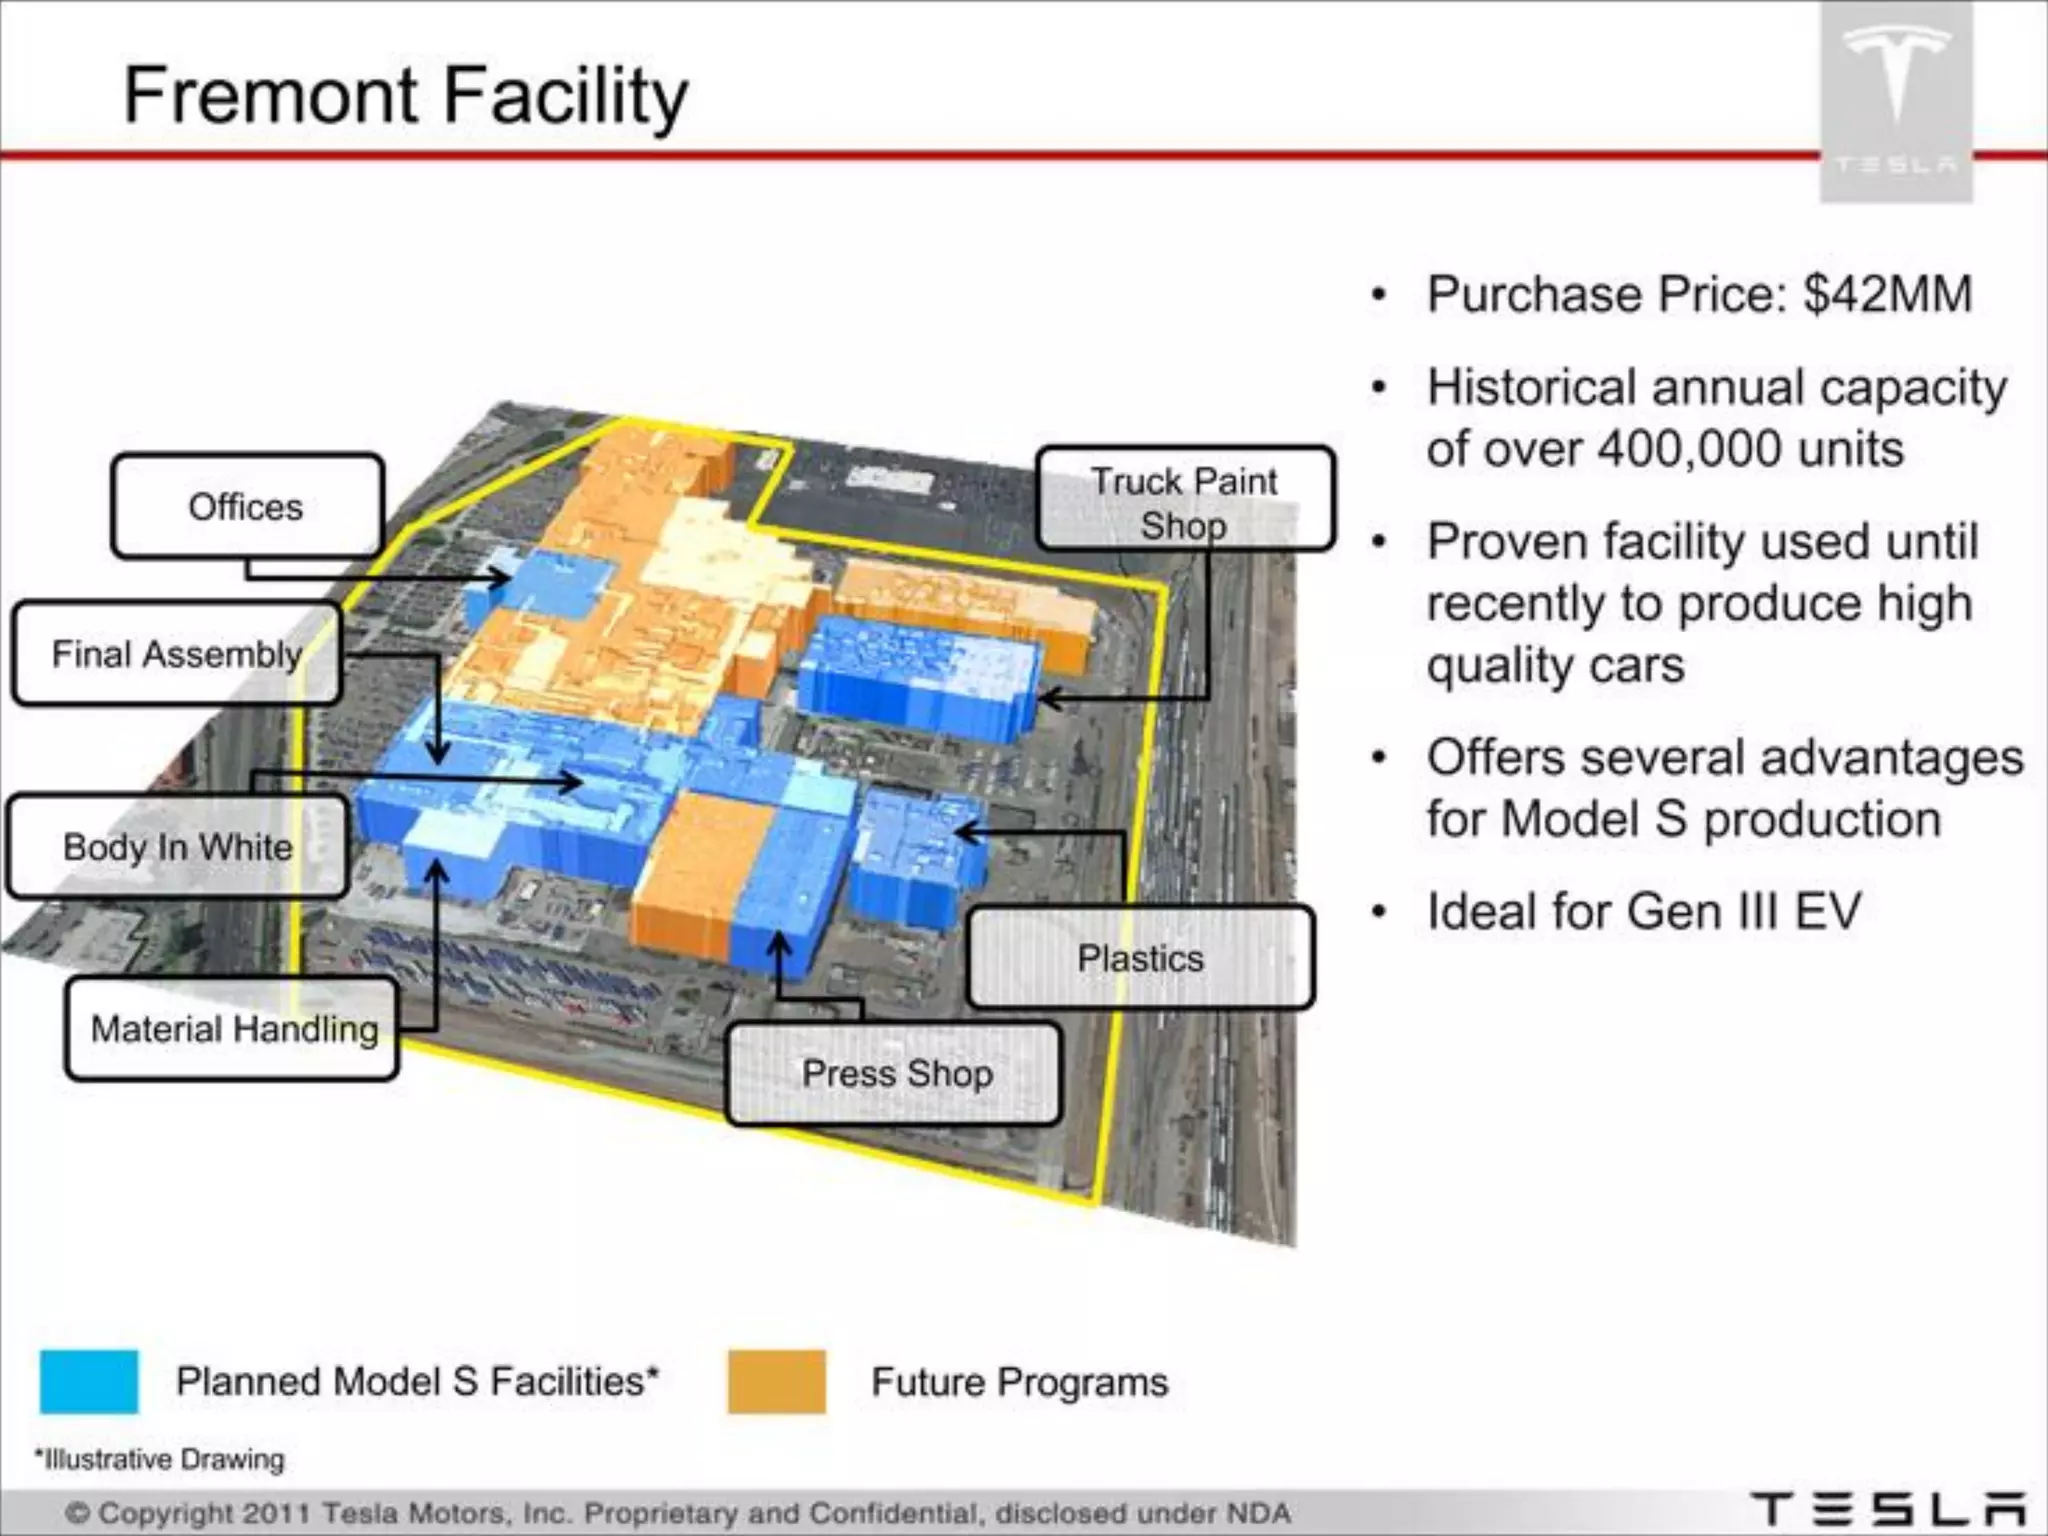
Slide 15 (Fremont Facility illustrative layout and bullet points) shows a map of the acquired factory, labeled shops, purchase price and capacity history. This slide converts a strategic asset purchase into tangible production capability: historical capacity, existing infrastructure (stamping, paint, press shop) and lower-cost acquisition ($42MM) are all used to argue for faster, cheaper ramp. Visual callouts on the layout make it easy to digest how the facility supports Model S production.

For founders in hardware, showing physical assets, facility readiness and strategic asset purchases is crucial — it signals that you aren’t starting from scratch and that production scale is realistic. Use photos, labeled diagrams and cost/capacity metrics to make the manufacturing story concrete.

Key Takeaway: Demonstrate manufacturing readiness with labeled facility plans, historical capacity and purchase terms to reduce investor concerns about scale and execution.

Conclusion: Key Lessons

This Tesla deck balances emotional product storytelling with rigorous operational proof — strong branding and imagery are anchored by team pedigree, partner deals, reservation traction, headcount growth and factory plans. Its strength lies in connecting vision to verifiable evidence across people, product, demand and manufacturing. Founders should emulate its structure: open with a clear brand and product vision, immediately back it with team credibility, show measurable traction, and then detail the operational plan and manufacturing reality.

Actionable advice: keep slides visually clean, prioritize one key metric per slide (reservations, hiring, milestones), and use recognizable third-party logos or partner terms to shortcut credibility. For capital-intensive startups, explicitly tie fundraising asks to concrete milestones (tooling, facility upgrades, production validation) so investors can evaluate the use of funds and the path to de-risking their investment.

Full Deck Analysis

11 sections

Overview

Company: Tesla
Round: Growth ($40M (early stage))
Year: 2018
Outcome: Public company, $800B+ market cap

Executive Summary

This investor deck presents Tesla as a growth-stage electric-vehicle manufacturer transitioning from low-volume Roadster production to commercial-scale sedan manufacturing (Model S). The presentation emphasizes strong vehicle performance/specs, strategic OEM & supplier partnerships, meaningful early demand (reservations), and major manufacturing investments (Fremont facility and stamping/paint equipment) to de-risk production scale-up.

Problem Statement

How the deck articulates the problem:

  • Automobiles are still dominated by internal combustion engines; premium customers expect performance, range and features typical of ICE premium cars but without emissions. The deck frames the gap between incumbent auto offerings and a high-performance EV with broad appeal (Slides 9–11 show product positioning and specs).
  • Implicit manufacturing problem: scaling a high-quality automotive production process from prototype to volume—deck highlights the need for experienced teams, equipment and a dedicated facility to solve this (Slides 3, 14–16).

Referenced slides:

  • Slides 9–11 (Model S specs, class-leading features) — articulate the product gap for premium customers.
  • Slides 13–16 (Progressing on Model S, Fremont Facility, Strategic Asset Purchases & facility status) — articulate manufacturing/scale problem and solution needs.

Solution

How the deck positions the solution:

  • A premium electric sedan (Model S) designed to meet/exceed premium ICE expectations: up to 300 miles per charge, 45-minute quick charge, 0–60 < 6s, large touchscreen, 5-star safety, best-in-class cargo (Slides 9–11).
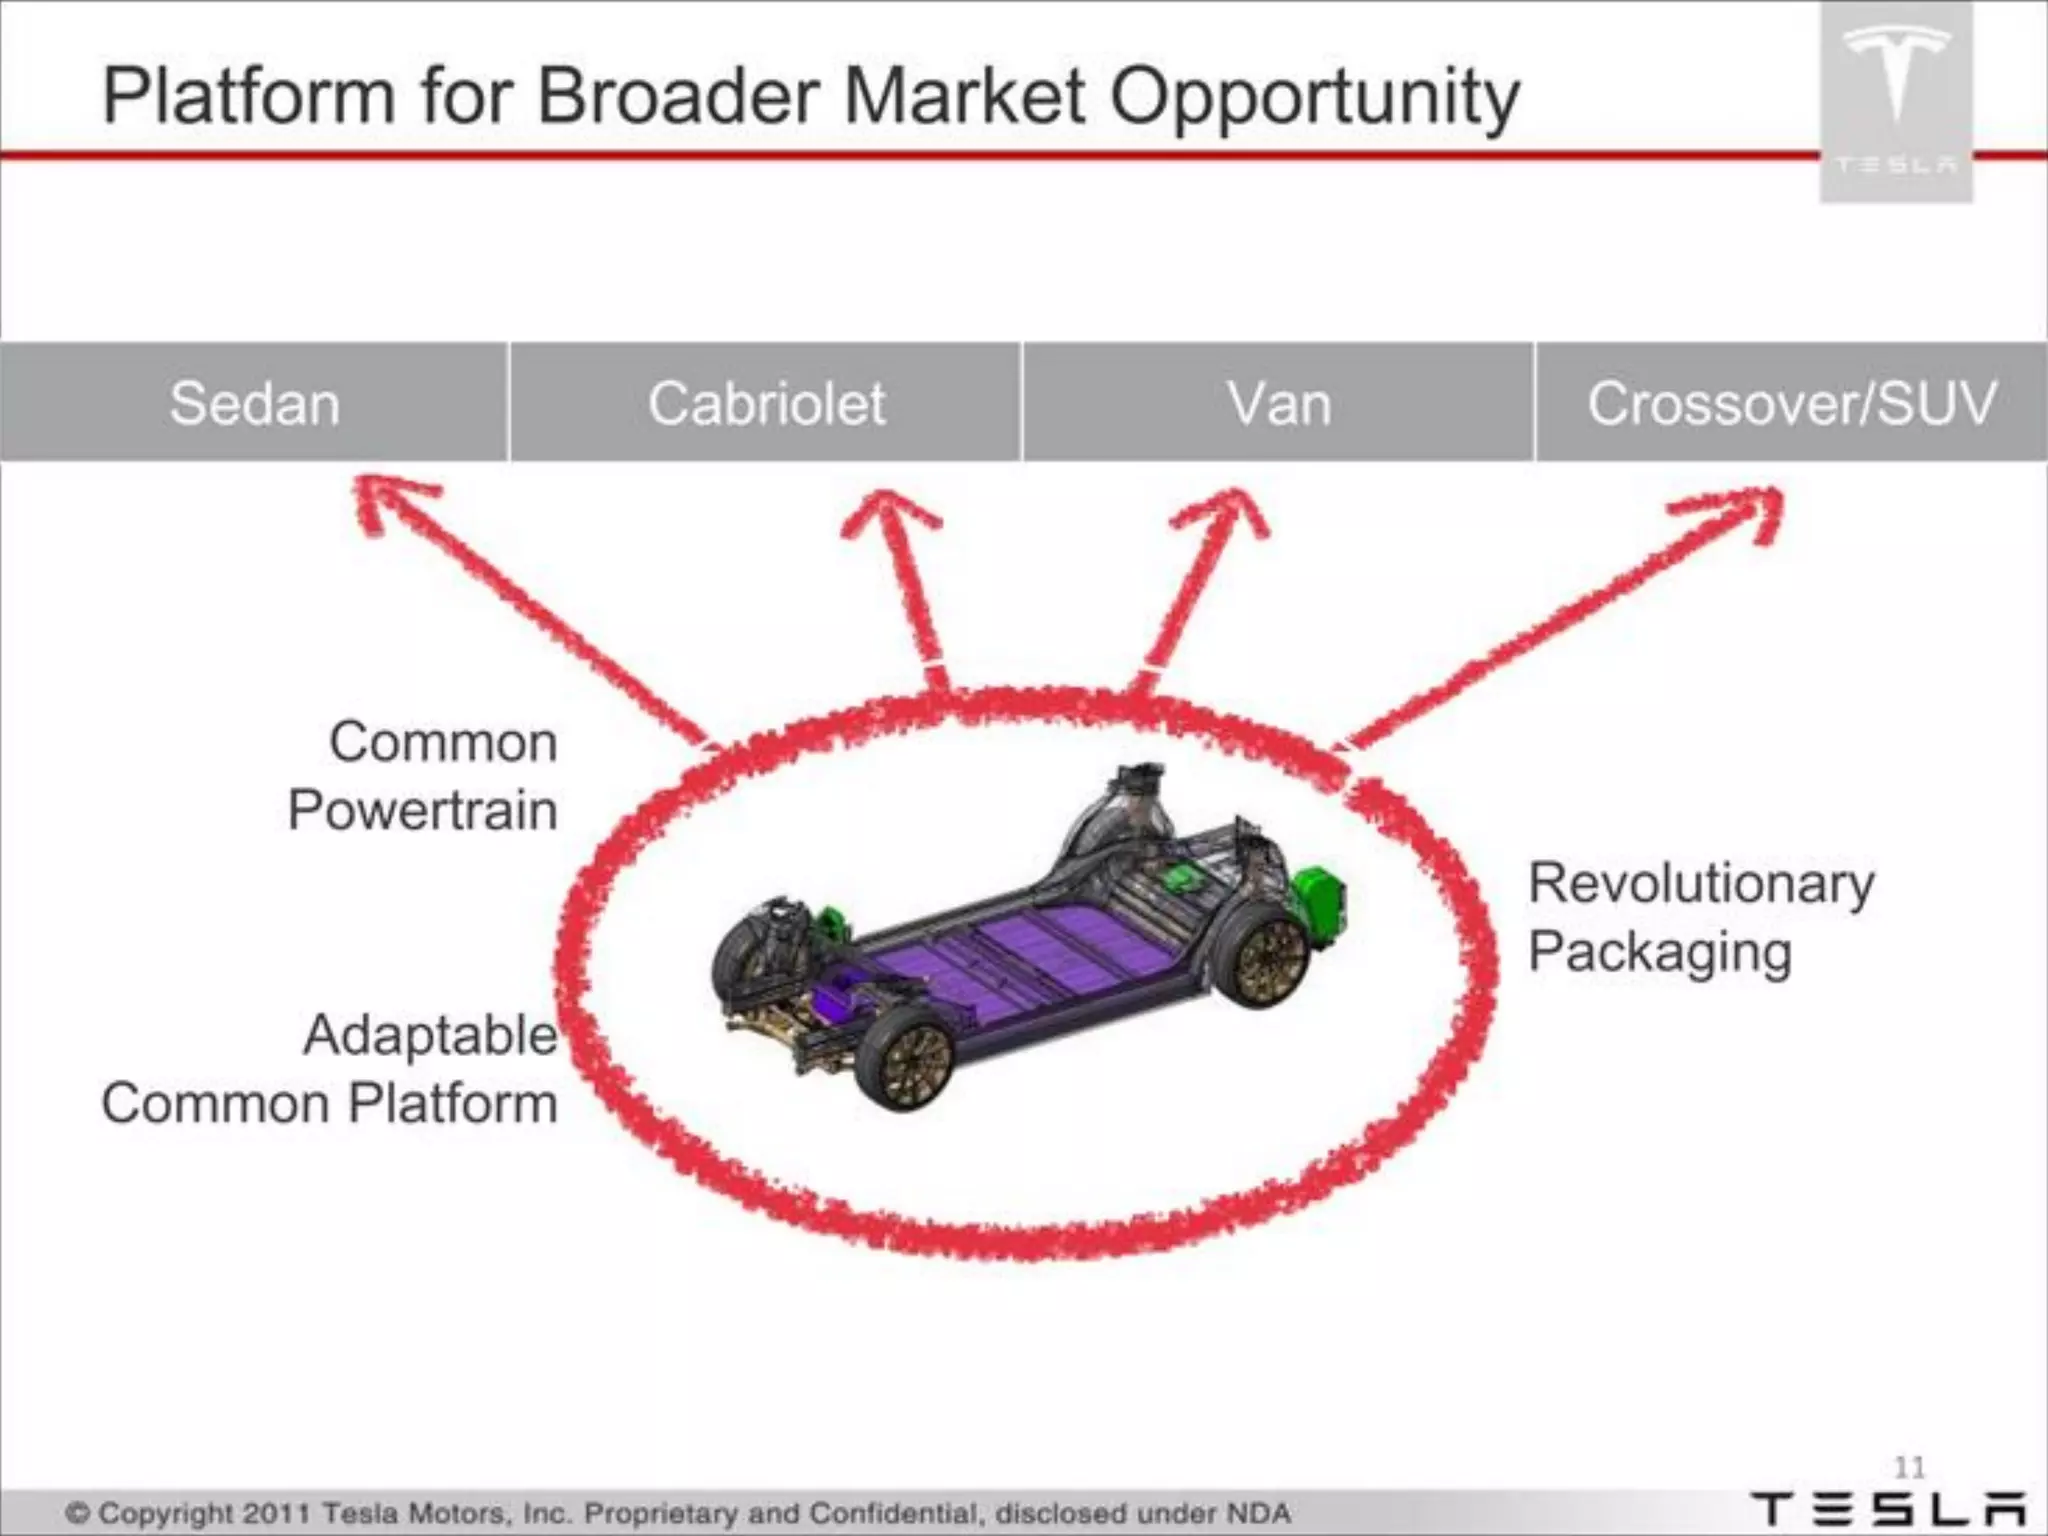
  • A common, adaptable EV platform to enable multiple vehicle derivatives (sedan, cabriolet, van, SUV) to increase market reach and manufacturing leverage (Slide 12).
  • Vertical integration & strategic partnerships (battery cell development with Panasonic, OEM development contracts with Toyota and Daimler, supply to Mercedes/Smart) to secure key components and early revenues (Slides 5–8).

Market Opportunity

TAM / SAM / SOM analysis (extracted from slides and implicit estimates):

  • Model S target: approximately 20,000 units annually (Slide 9). The deck states this is roughly ~1% share of the premium global market — implying a premium segment in the millions of cars per year (exact TAM number is not shown).
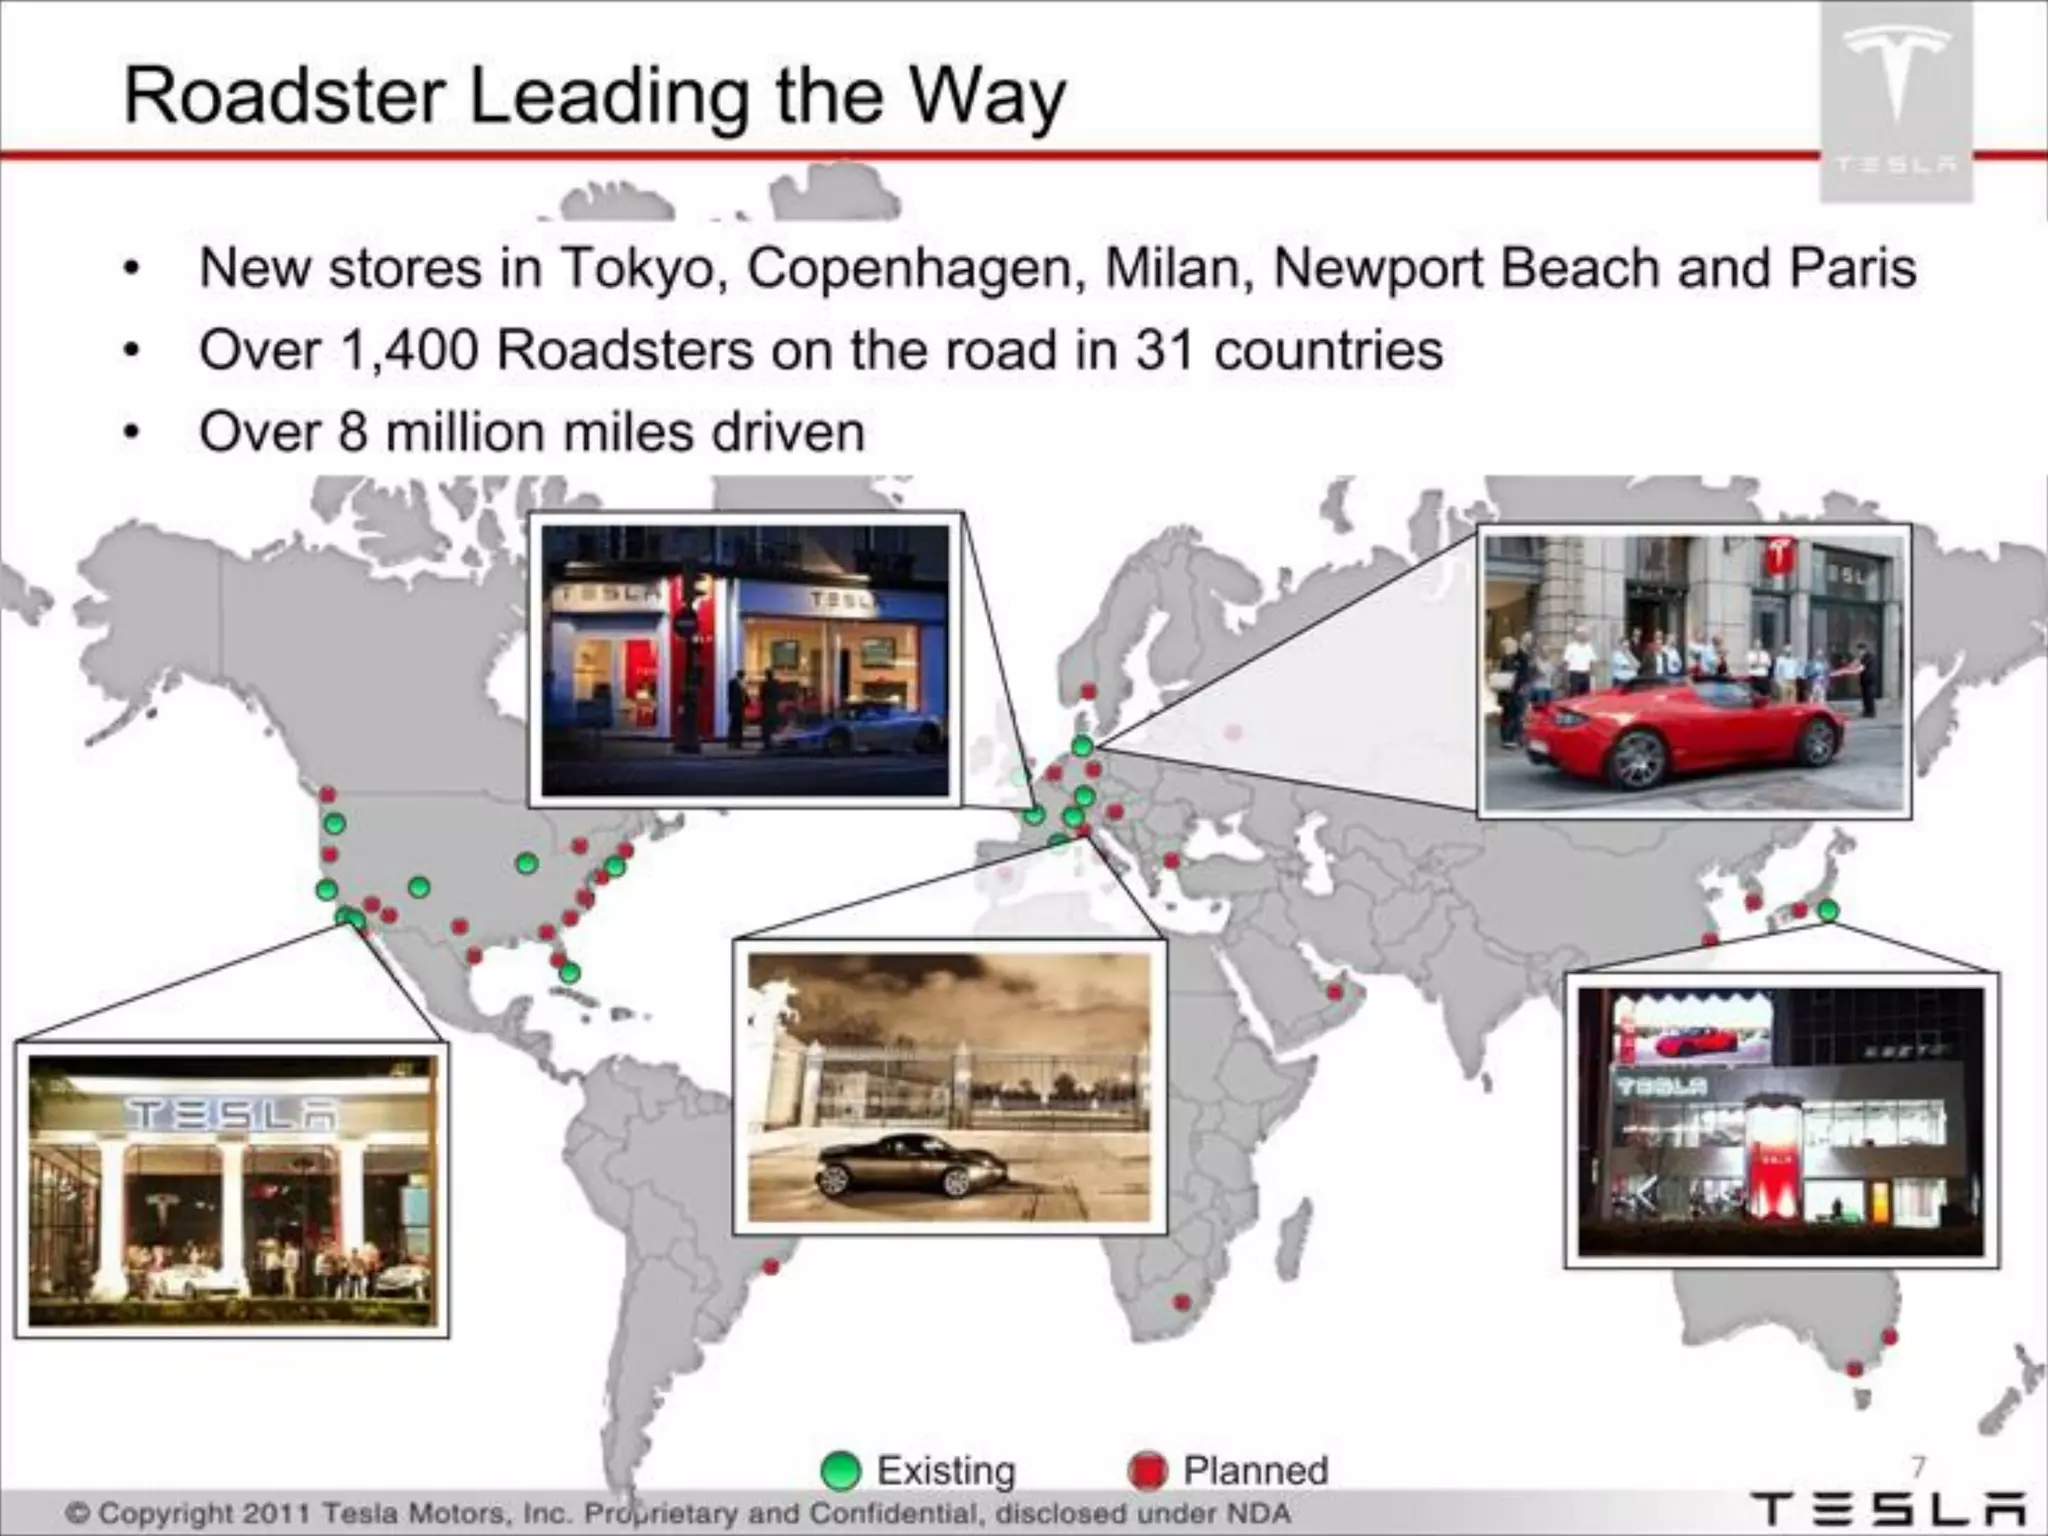
  • Roadster global footprint and usage: >1,400 Roadsters in 31 countries, >8 million miles driven (Slide 8) — used as proof of early market adoption and global interest.
  • No explicit dollar TAM / SAM / SOM breakout is given in the deck. The slides rely on unit targets and share percentage (~1%) to imply market opportunity rather than presenting hard TAM figures.

Business Model

Revenue model and unit economics (as shown/implied):

  • Vehicle sales (Model S, later derivatives) are the primary revenue stream — target 20,000 units/year for Model S (Slide 9).
  • Contract & development revenue from OEM partners (Toyota: prototype & development contracts; Daimler: orders for Smart/Mercedes A-Class battery packs) — shown as concrete development & prototype revenue lines (Slides 5–7).
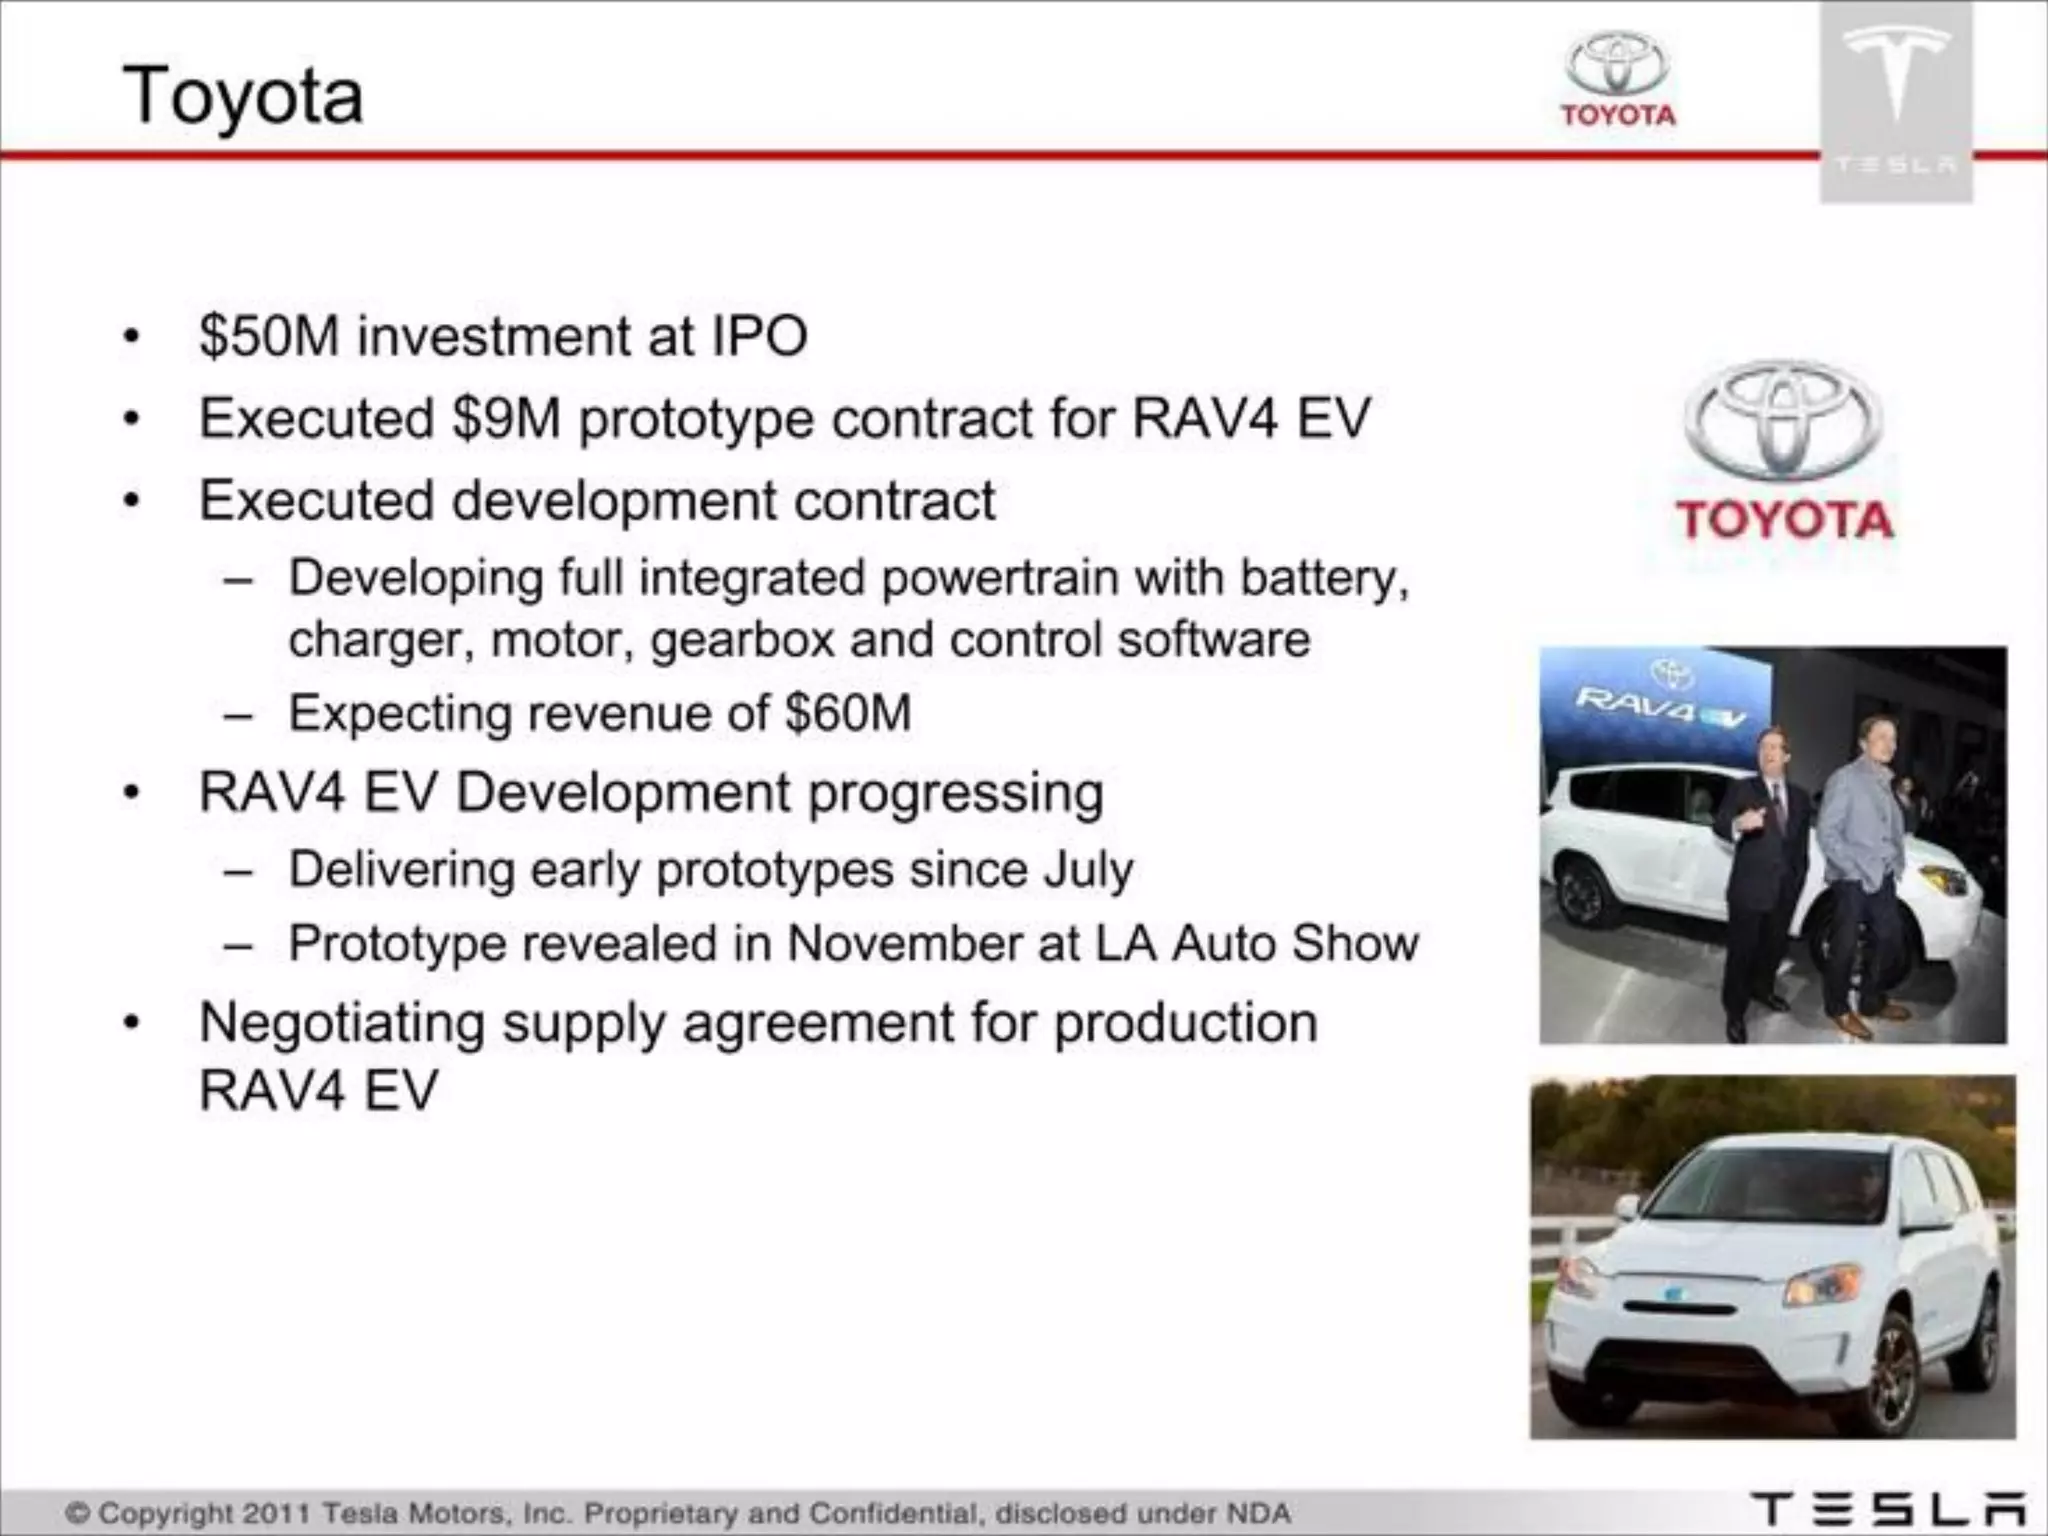
    • Toyota: $50M investment at IPO, $9M prototype contract for RAV4 EV, expecting $60M revenue from development (Slide 5).
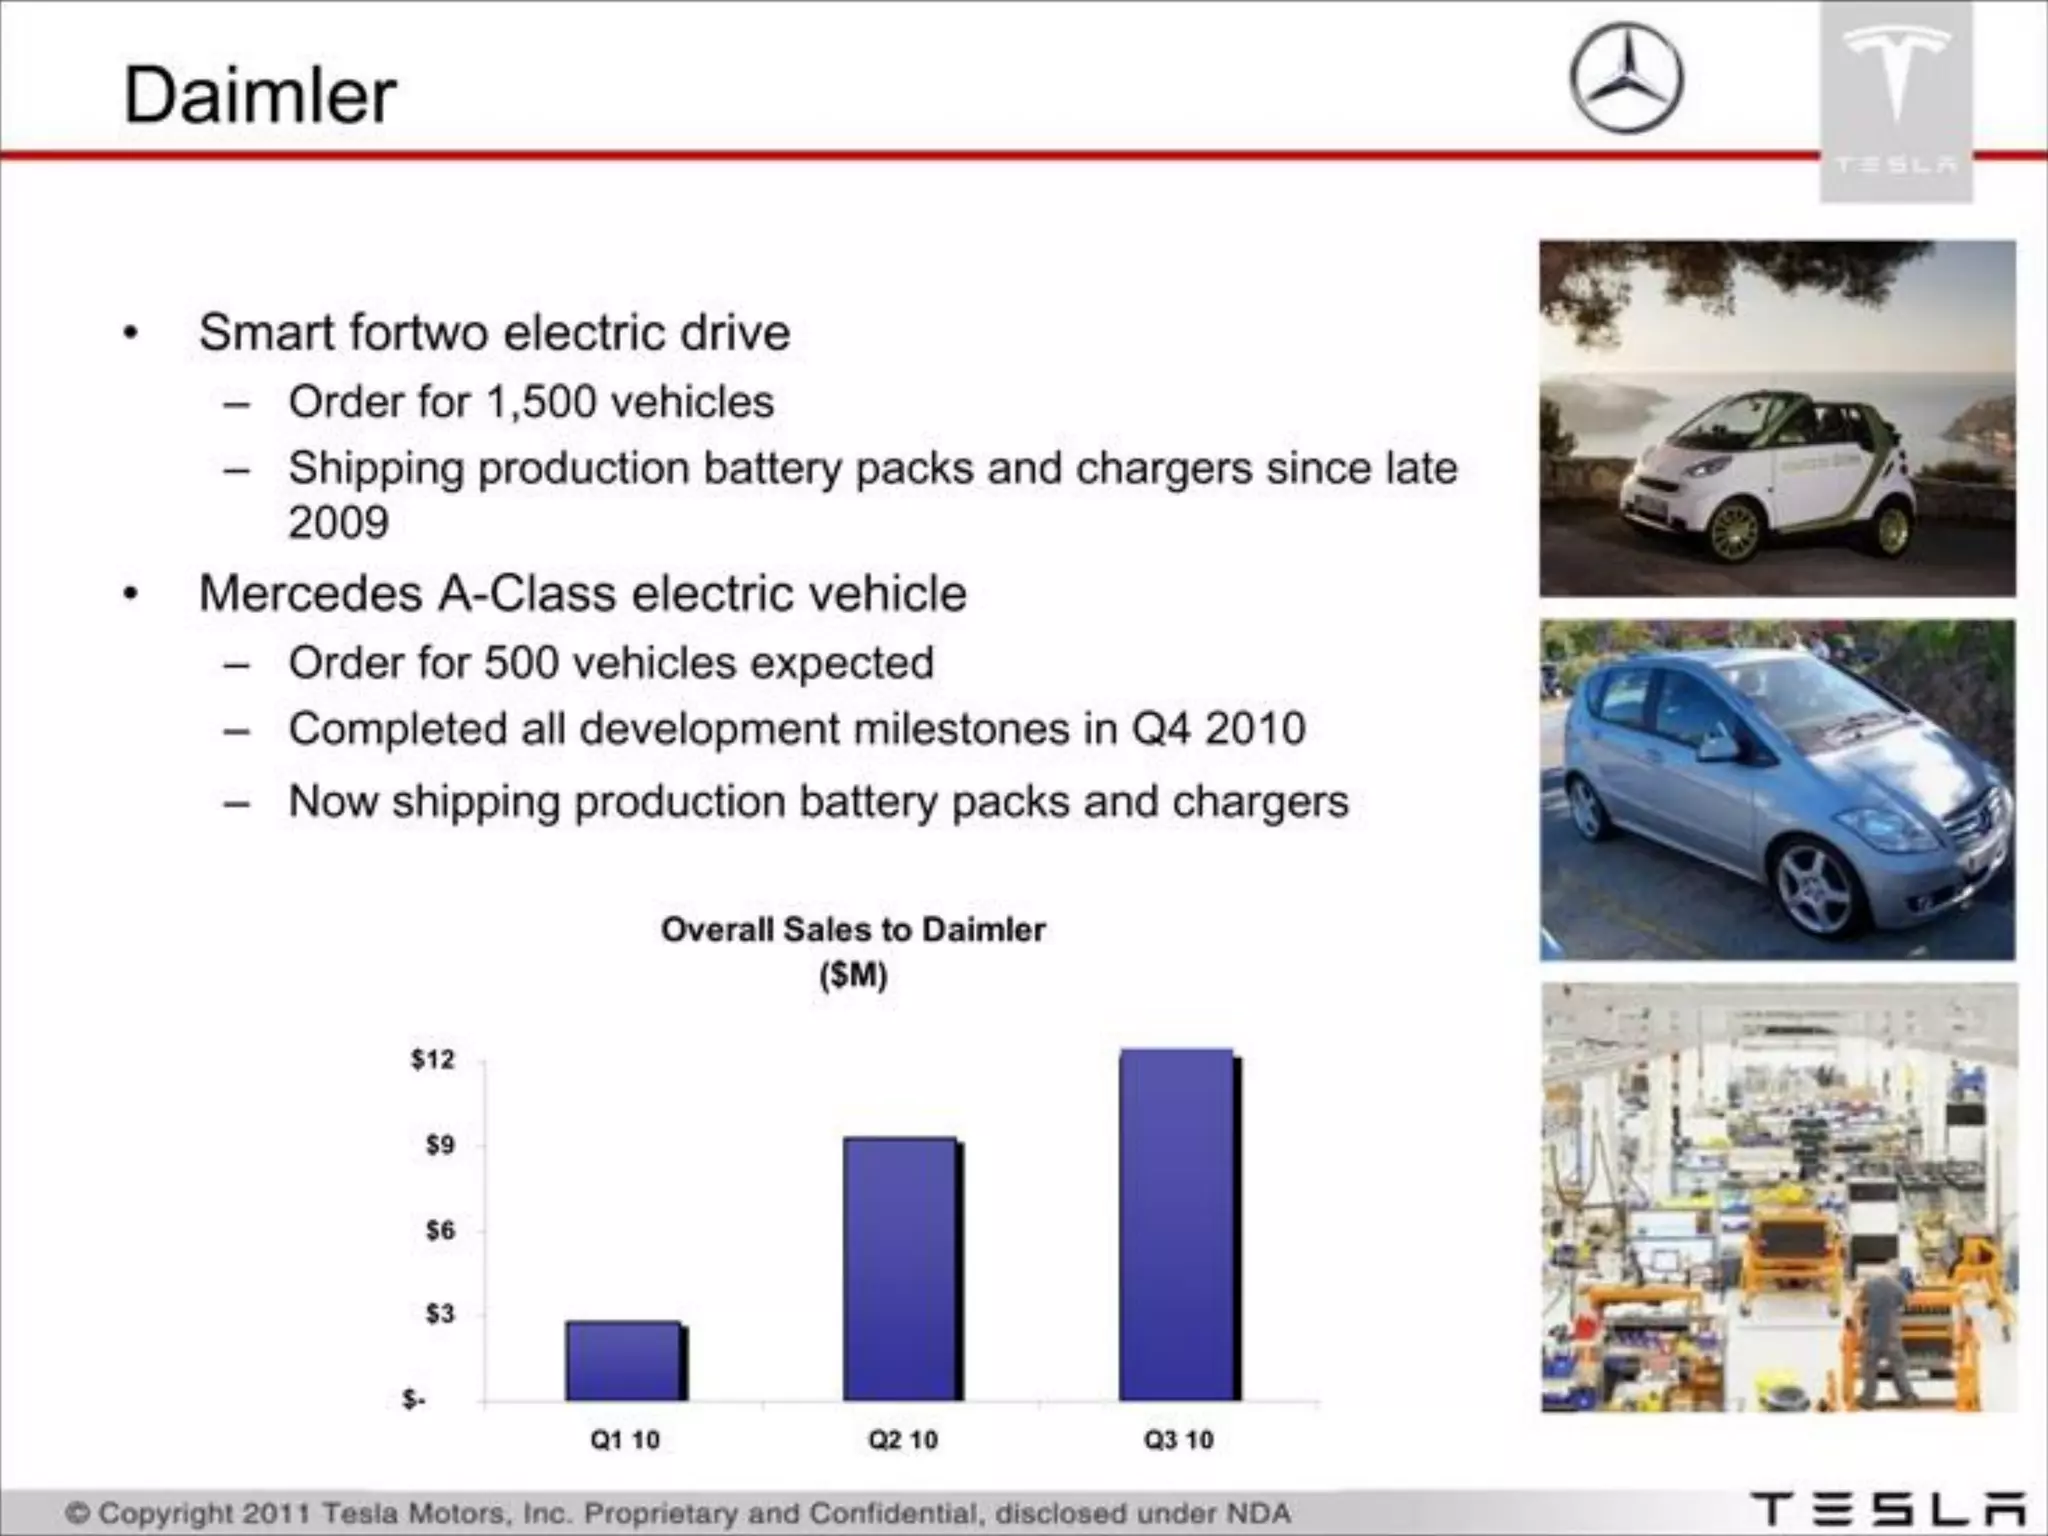
    • Daimler: orders for 1,500 Smart vehicles and expected 500 for A-Class; charted sales to Daimler grow from Q1 to Q3 2010 (Slide 7).
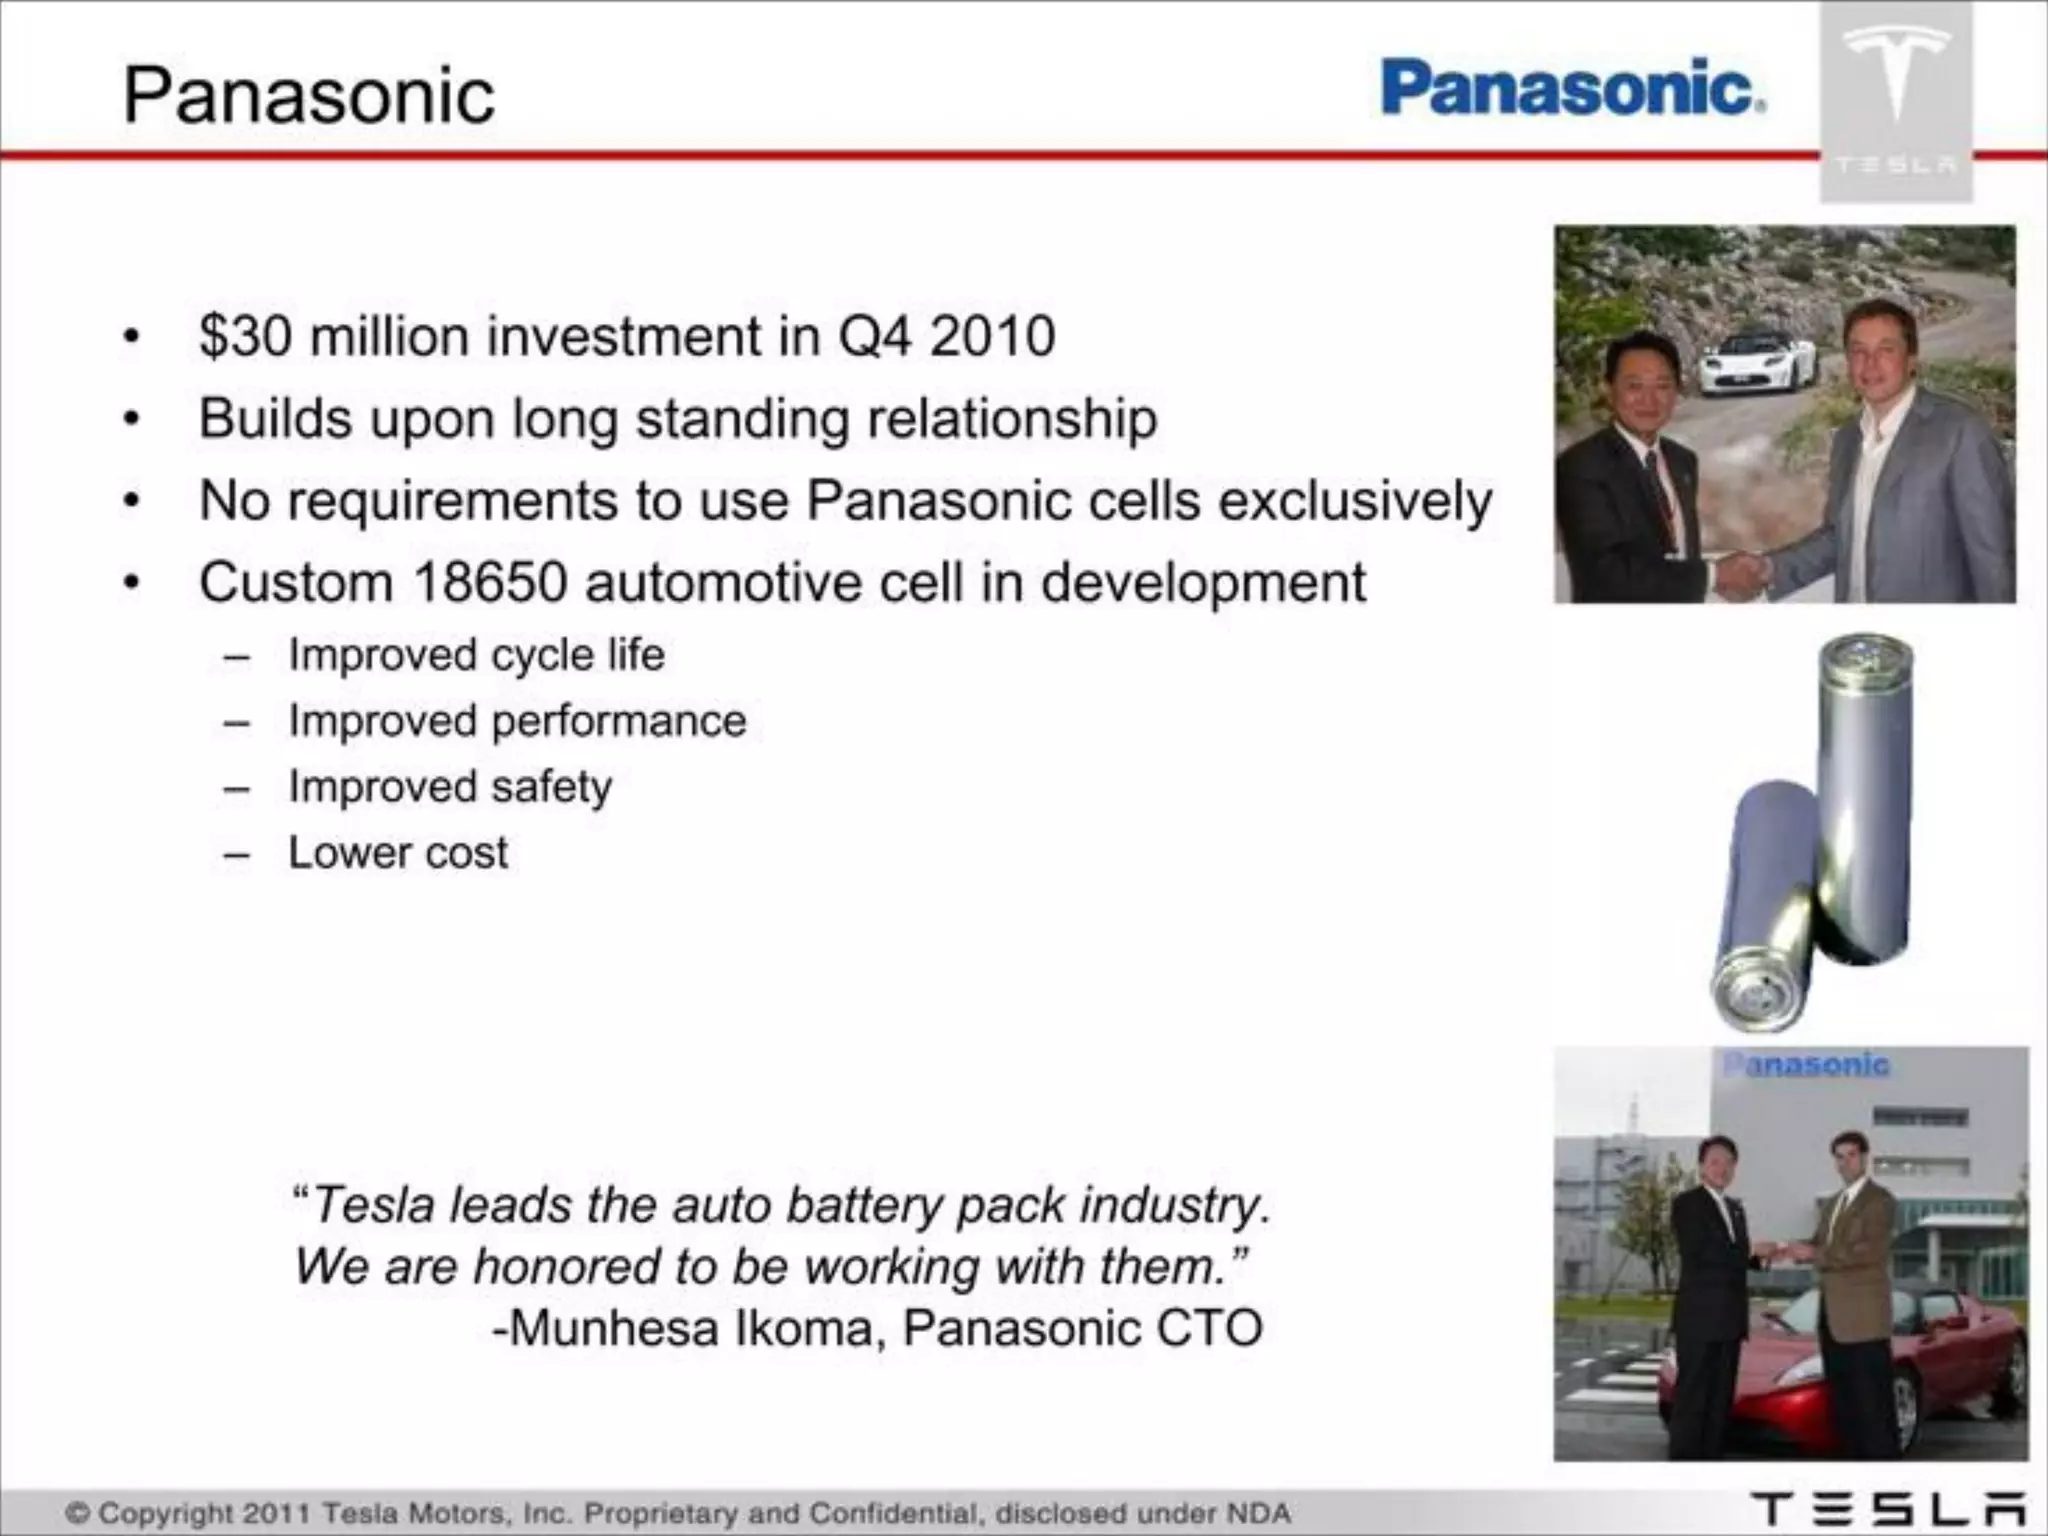
  • Battery supply partnership with Panasonic includes a $30M investment (Q4 2010) and joint development of custom 18650 automotive cells — strategic for lowering pack cost and improving performance (Slide 6).
  • No explicit per-vehicle gross margin, ASP, or detailed unit economics shown in the deck — investors would need more detail on cost per vehicle, battery pack cost, and margin assumptions.

Traction & Metrics

Key traction and proof points from slides:

  • Reservations: Cumulative Model S reservations grow over time — Q1 09 ≈ 500, Q2 09 ≈ 1,300, Q3 09 ≈ 1,700, Q4 09 ≈ 2,000, Q1 10 ≈ 2,200, Q2 10 ≈ 2,600, Q3 10 ≈ 3,000 (Slide 11). This shows growing early demand (minimum reservation fee noted in slide footnote).
  • Engineering headcount growth (includes contractors): Q1 2010 ~200, Q2 2010 ~330, Q3 2010 ~420–450 — indicating rapid team scaling to support product development and production (Slide 3).
  • Strategic commercial partnerships and investments:
    • Toyota: $50M IPO investment; $9M prototype; expecting $60M in revenue from development (Slide 5).
    • Panasonic: $30M investment; custom cell development (Slide 6).
    • Daimler: production battery pack orders (Slide 7).
  • Sales to Daimler chart (Slide 7): shows revenue progression by quarter (approx. $3M → $9M → $12M across Q1–Q3 2010 as shown).
  • Facility & capex traction: Fremont facility purchase price listed as $42M and historical capacity >400k units; strategic asset images and equipment purchases documented (Slides 14–15).

Competitive Positioning

How Tesla differentiates:

  • Product-led differentiation: long single-charge range (up to 300 miles), fast charging, rapid acceleration, integrated touchscreen and apps platform (Slides 9–11).
  • Vertical integration: in-house powertrain and battery pack engineering, plus a bespoke battery cell developed with a strategic partner to improve cycle life, performance and cost (Slides 6, 12).
  • OEM-level credibility: revenue-generating development and supply contracts with incumbent automakers (Toyota, Daimler) provide validation and near-term revenue (Slides 5–7).
  • Platform strategy: common adaptable platform enabling multiple vehicle types to expand addressable market while spreading development cost (Slide 12).

Team

Credentials highlighted in the deck (roles and prior company backgrounds shown — names omitted here):

  • Executive team composed of product and engineering leaders with deep experience from Tier-1 tech & auto companies and startups (Slide 2).
  • Backgrounds/companies shown include rocket/space & fintech startups, major automakers (Toyota, Daimler, Audi, GM, Jaguar), technology companies (Google, Apple, HP), and other well-known OEM / supplier logos — signaling combined auto/manufacturing + Silicon Valley product/software expertise (Slide 2).
  • Rapidly growing engineering & manufacturing leadership supporting scale-up (Slide 3).

Note: the slide emphasizes cross-domain expertise (auto OEMs + Silicon Valley tech) rather than listing individual biographies in detail.

Go-to-Market Strategy

Distribution and GTM approach shown:

  • Direct-to-consumer brand and retail presence: map of existing and planned retail/service locations supporting Roadster distribution globally (Slide 8).
  • OEM development & supply relationships (Toyota, Daimler) used both as revenue streams and as channels to validate components / production capability (Slides 5–7).
  • Reservation model for Model S to capture demand and validate sales pipeline (Slide 11; $5,000 minimum reservation price noted).
  • Platform strategy (Slide 12) implies future product line expansion enabling broader market coverage without duplicative R&D.

The Ask

  • Round / ask shown in user context: $40M growth-stage raise (early-stage). The deck itself documents capital needs across:
    • Manufacturing and facility acquisition/upgrade (Fremont purchase $42M shown on Slide 14).
    • Strategic asset purchases and stamping/paint lines (Slides 14–15).
    • Production validation and tooling installation in 2011–2012 (Slide 13 timeline).
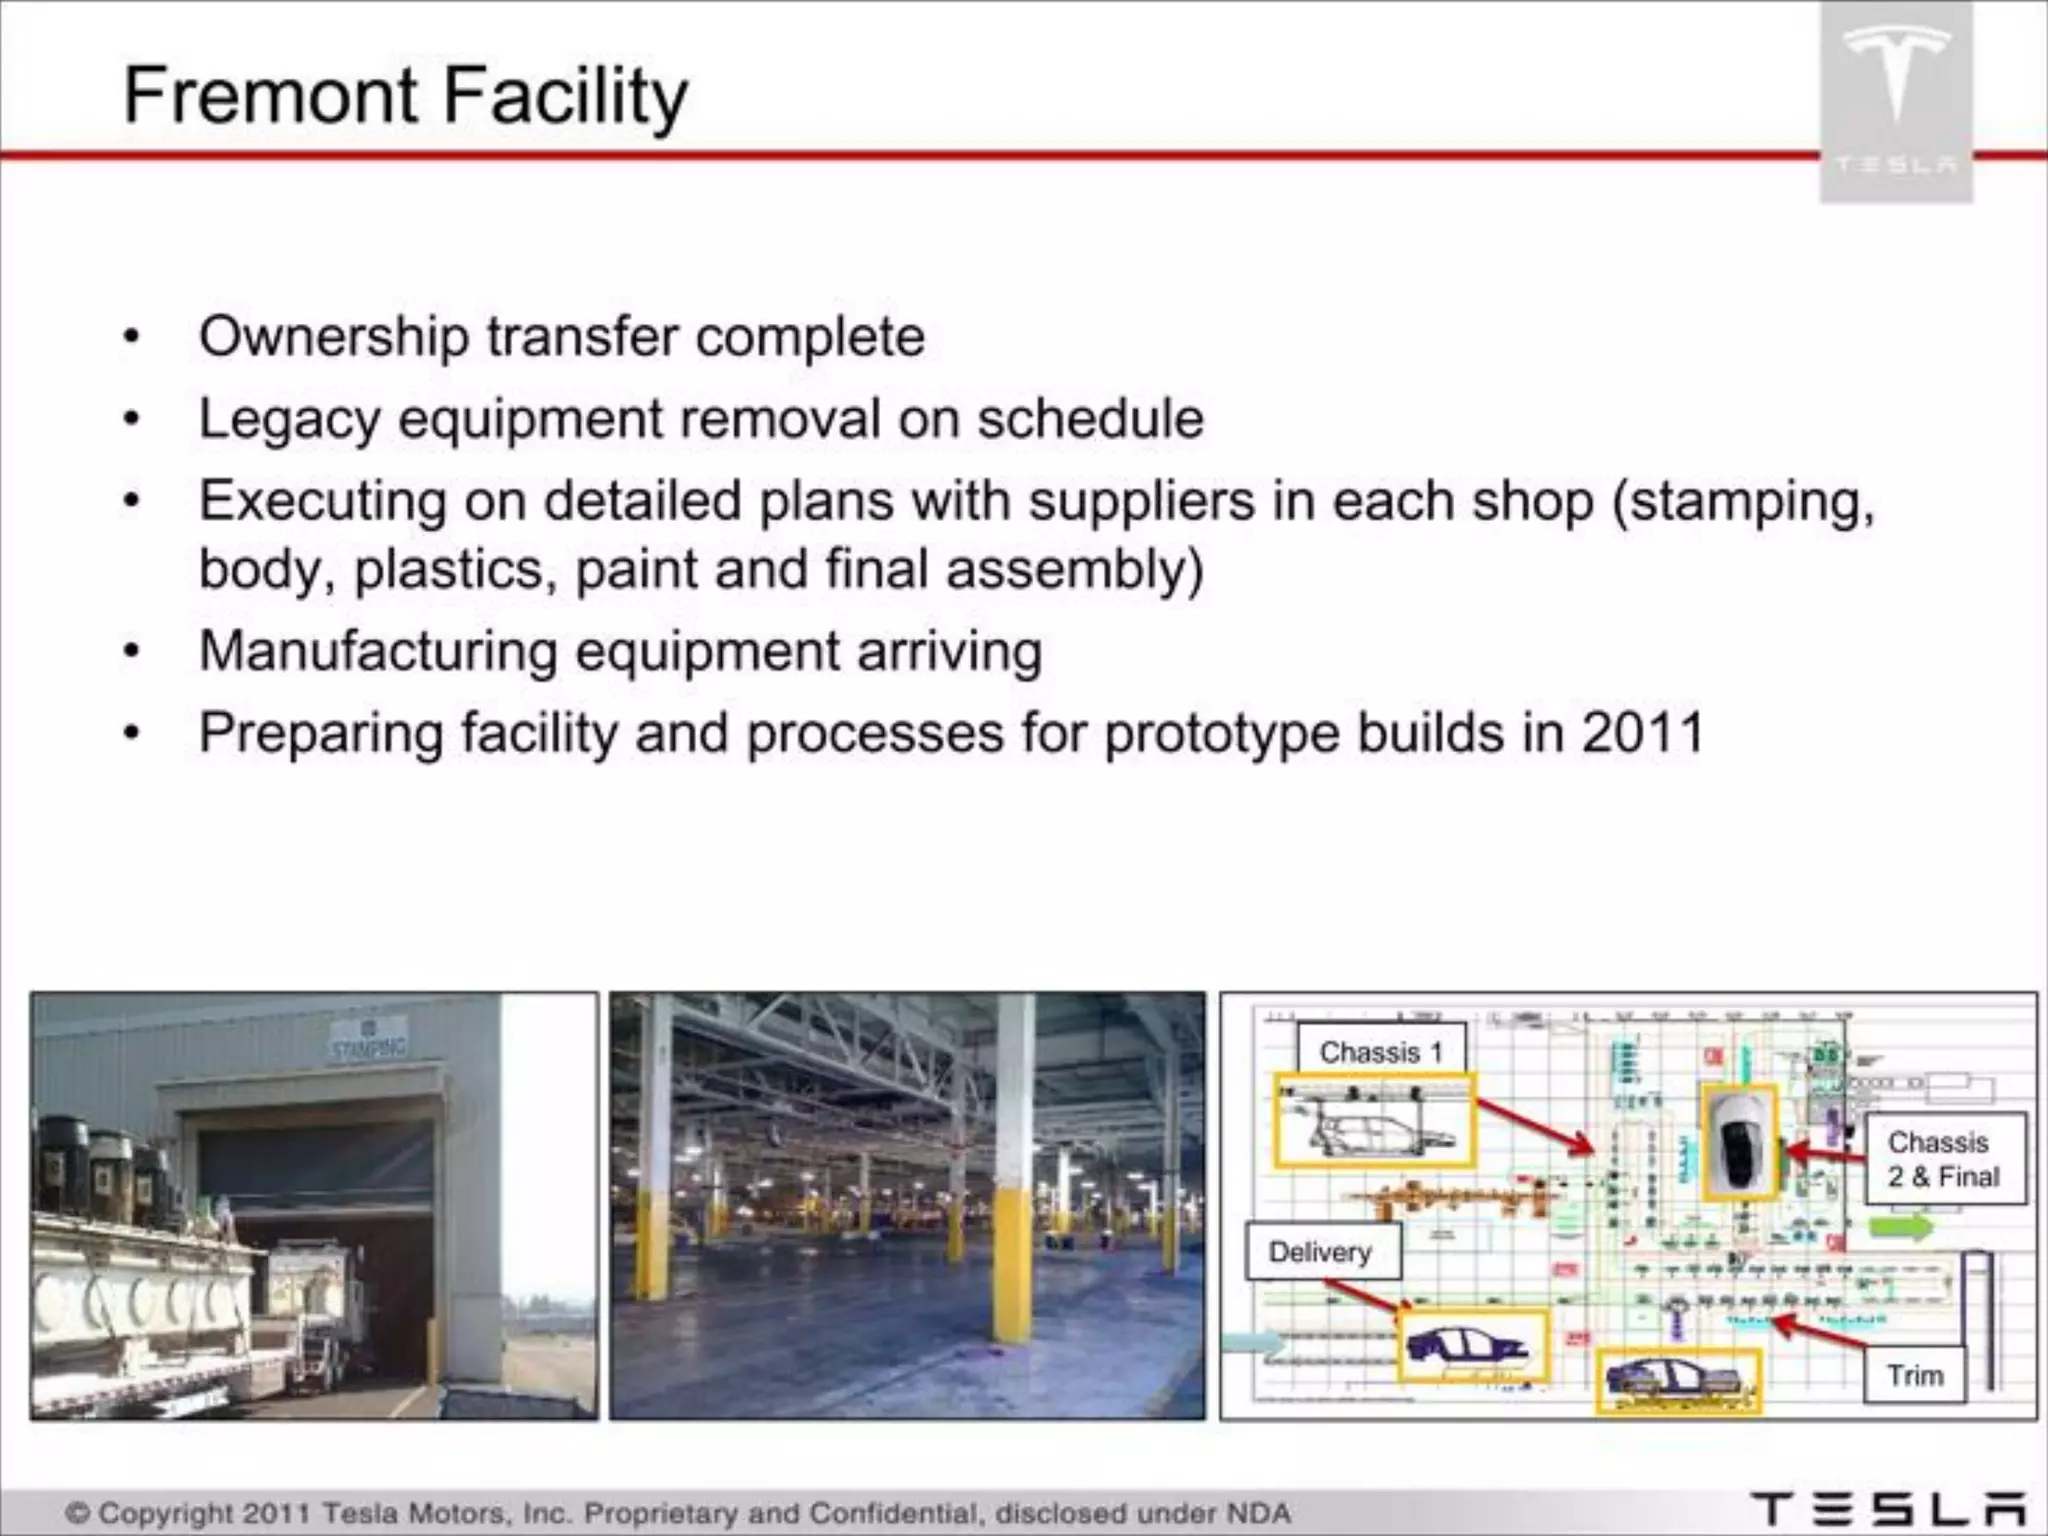
  • Use of funds implied: finish Model S engineering validation, install and commission stamping/paint/final assembly lines, purchase and commission manufacturing equipment, supplier sourcing and site preparation (Slides 13–16).

Investor Deep Dive

Executive summary, strengths & red flags

Executive Summary

This investor deck presents Tesla as a growth-stage electric-vehicle manufacturer transitioning from low-volume Roadster production to commercial-scale sedan manufacturing (Model S). The presentation emphasizes strong vehicle performance/specs, strategic OEM & supplier partnerships, meaningful early demand (reservations), and major manufacturing investments (Fremont facility and stamping/paint equipment) to de-risk production scale-up.

Key Strengths

3 identified

1

Strong OEM & supplier validation — concrete commercial relationships and investments (Toyota investment, Panasonic investment, Daimler orders) provide technical and financial validation and near-term revenues (Slides 5–7).

2

Clear product differentiation — Model S specs (300-mile range, 45-minute quick charge, rapid acceleration, touchscreen apps) are compelling against premium ICE competition (Slides 9–11).

3

Tangible manufacturing progress & assets — acquisition of Fremont facility, purchase of stamping/paint equipment and detailed production timeline materially de-risks scale-up (Slides 13–16).

Red Flags & Weaknesses

3 identified

1

Sparse unit economics and margins — the deck lacks concrete per-vehicle cost breakdowns, ASPs, gross margin assumptions or break-even timelines. Investors would need these to evaluate capital efficiency and valuation (no slides show detailed P&L / cost structure).

2

Capital intensity and timing risks — the company is making large fixed-cost bets (facility purchase, stamping lines) but the deck does not fully quantify ramp schedule risk or contingency plans if production delays occur (Slides 13–16 show timelines but limited risk mitigation detail).

3

Limited explicit TAM dollars — the deck uses a relative market share target (~1% of premium market) and an annual unit target (20,000 units) but does not present a full TAM / SAM / SOM dollar analysis to justify scale and valuation assumptions (Slide 9 only).

More Pitch Decks To Study

Compare structure, fundraising context, and investor-facing story across similar startup decks.