Compare your deck to Klarna

Compare Your Deck

Klarna Pitch Deck (2012)

Fintech
Stage: Growth
Raised: Multiple
Year: 2012
Slides: 11
Outcome: Valued at $6.7B (down from $45B)

Pitch Deck

1 / 11
Klarna pitch deck - The Opening: Clean brand and one-line value prop
Click to expand

Deck Analysis

This deck from Klarna (2012, growth stage) presents a concise investor-facing story: a clear brand, a well-defined problem in online payments, a simple but defensible product solution (separating buying from paying), and evidence of traction and growth. It’s notable for combining strong visual branding with operational metrics (revenue, payment volume) and an easy-to-understand product flow that ties to consumer preference data — all of which helped Klarna scale in Europe and later become a global fintech leader. The presentation balances emotional appeal (simple buying) with hard numbers and merchant benefits, a model founders can emulate for fintech and payments businesses.

The Opening: Clean brand and one-line value prop

The Opening: Clean brand and one-line value prop

Slide 1 is a classic cover slide: bold logo, strong color, and a single clear value proposition — "Safe and Simple payments online." It establishes brand identity instantly and positions Klarna in the customer’s mind before any details are presented. The slide also lists the founder and role, which subtly signals credibility without distracting from the main message.

This minimal approach is effective because it focuses attention and sets expectations for the deck’s tone: simple, consumer-focused, and trustworthy. Founders should note how a clean opening reinforces brand recall and primes the audience for a product-centric narrative rather than a feature dump.

Key Takeaway: Start with a single, memorable positioning line and strong branding to create immediate clarity and credibility.
Problem: Checkout is fragmented and painful

Problem: Checkout is fragmented and painful

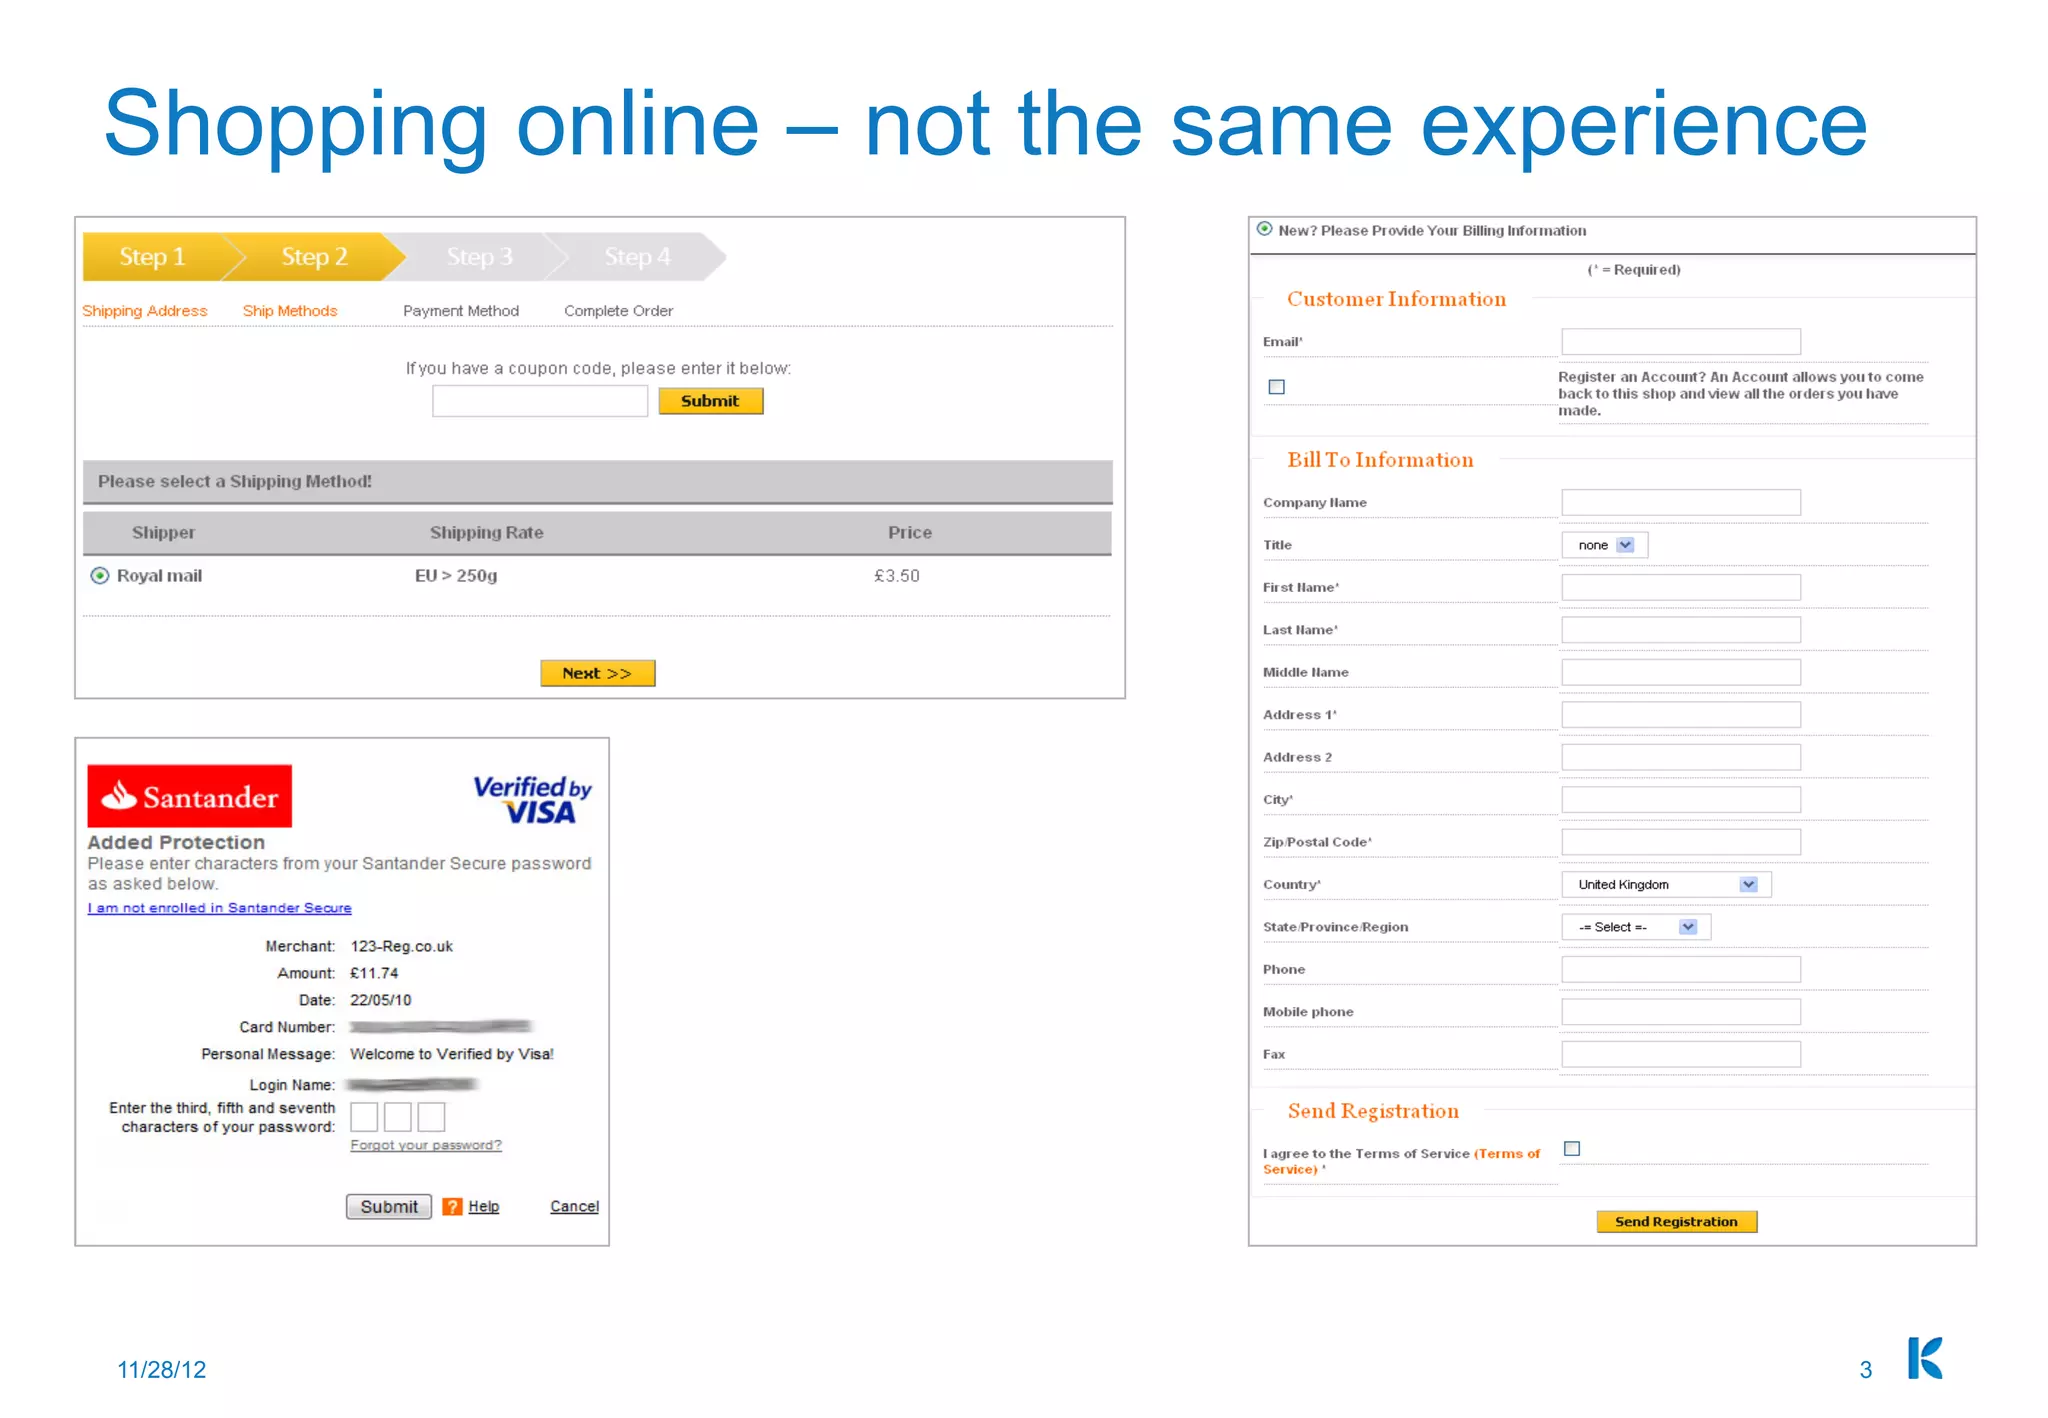
Slide 3 lays out the pain of online shopping with screenshots of long forms, multi-step checkouts, and confusing third-party security flows. The slide communicates the friction points that cause cart abandonment: too many fields, redirects, unfamiliar verifications, and broken user experience across merchants. By using real examples, Klarna makes the problem tangible and relatable to both merchants and investors.

This slide is effective because it doesn’t rely on abstract statements — it shows what customers see. For founders, the lesson is to demonstrate the problem visually and empathetically: investors need to feel the pain users experience to understand why a solution is necessary and valuable.

Key Takeaway: Use concrete, visual examples of user friction to make the problem undeniable and motivate your solution.
Market signal: What customers actually prefer

Market signal: What customers actually prefer

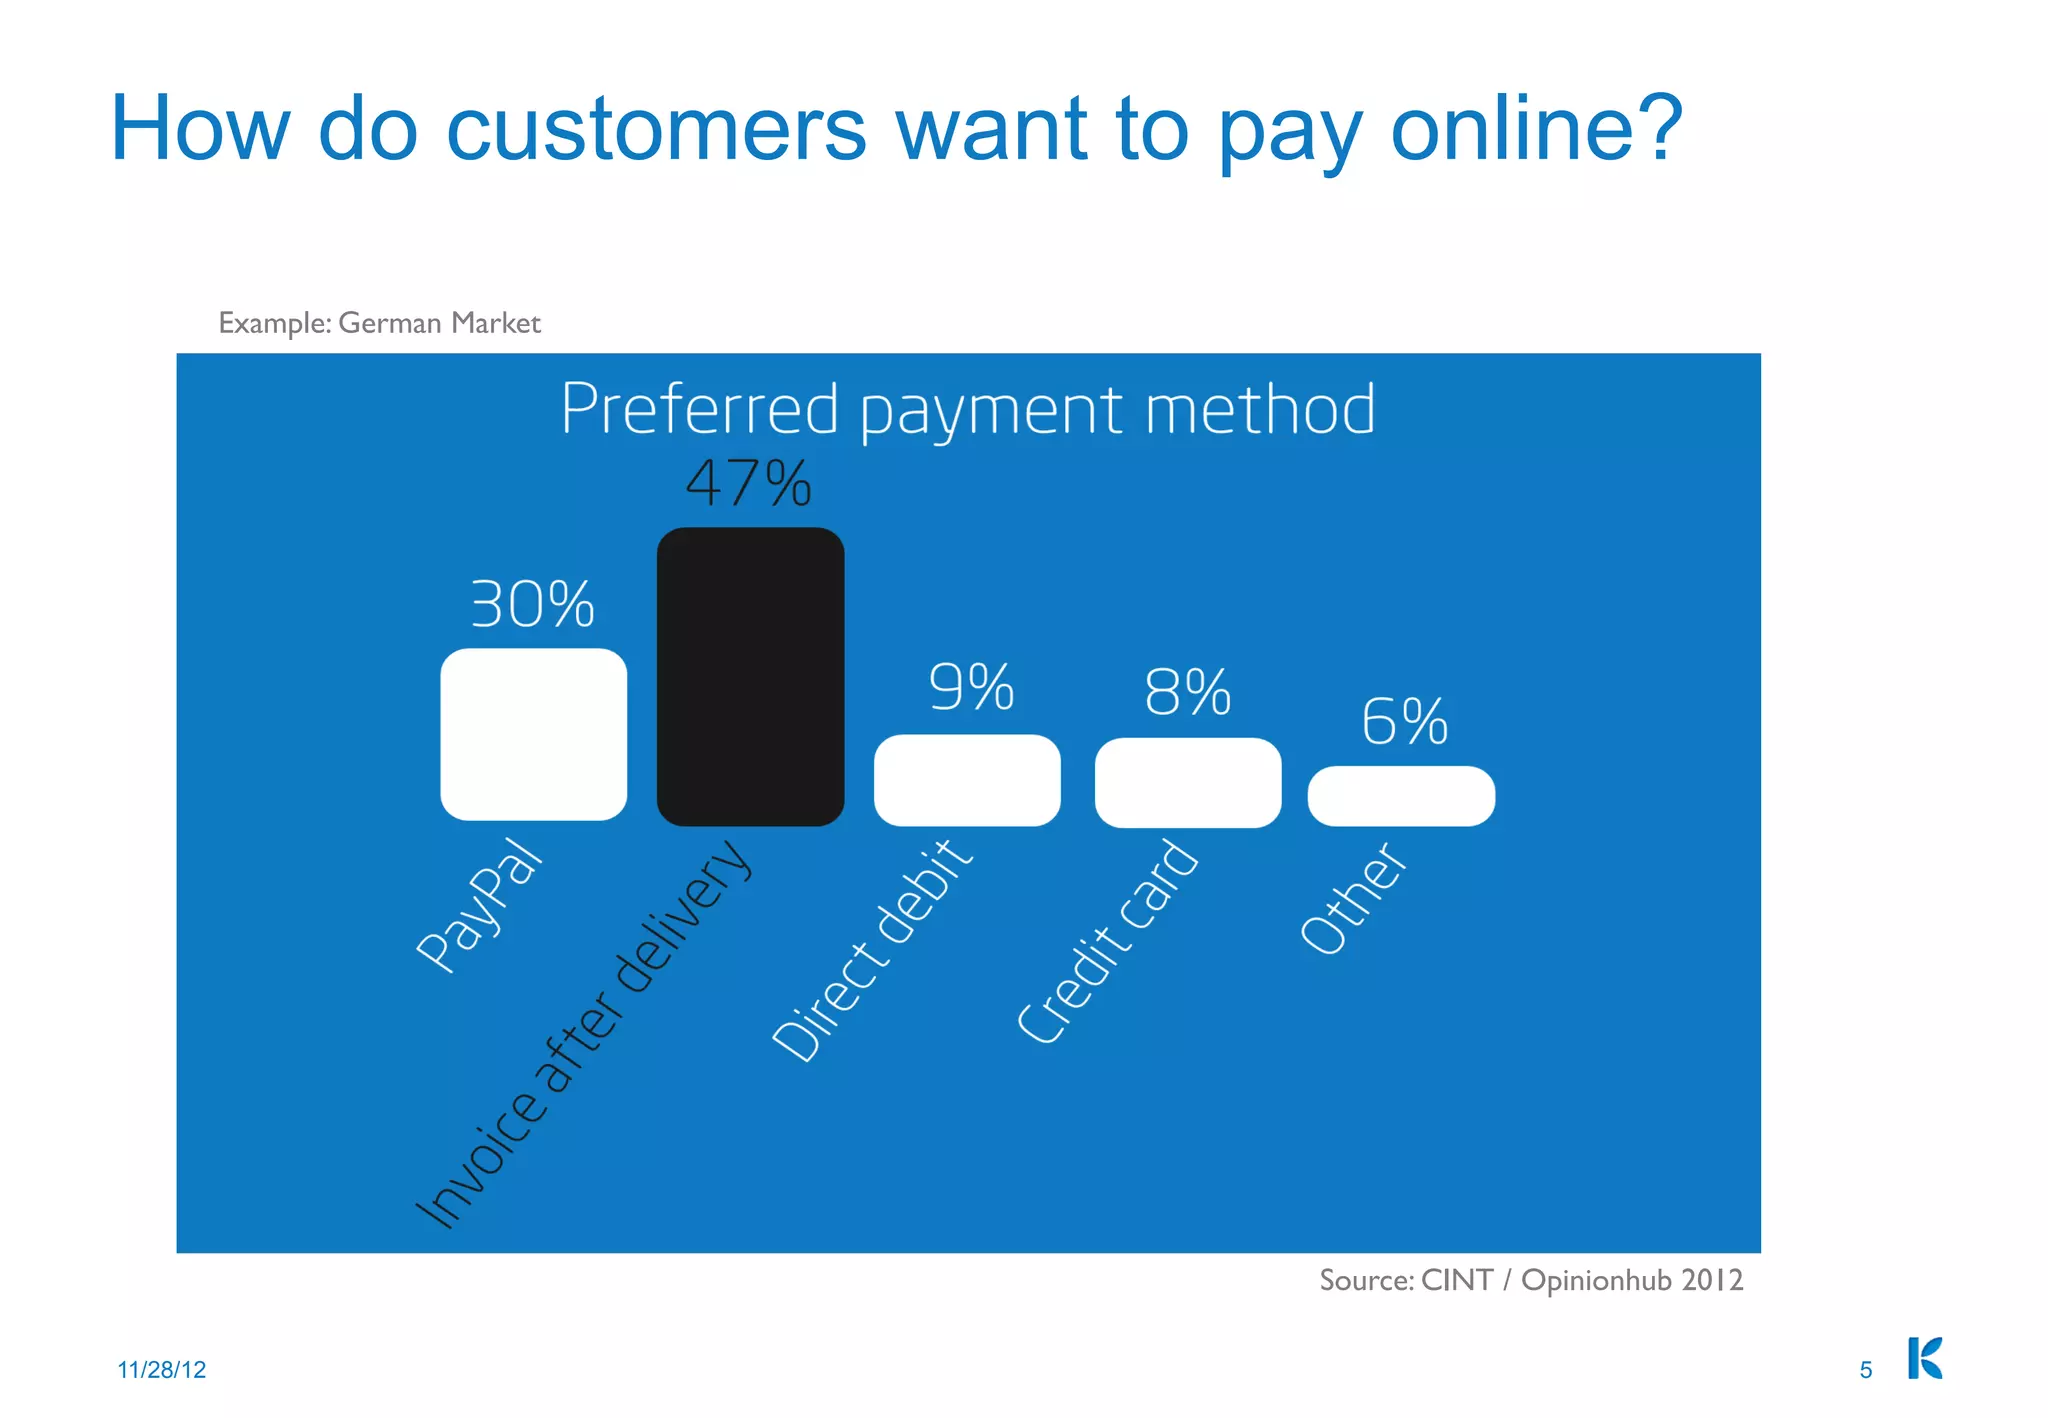
Slide 5 provides market validation via a simple chart (example: German market) showing preferred payment methods. The standout insight — "invoice after delivery" at 47% — demonstrates a strong consumer preference for trust-first payment options over credit cards or e-wallets. This data supports Klarna’s product choice (post-purchase invoicing) and helps justify its go-to-market focus in markets where that behavior is prevalent.

Including third‑party survey data (CINT / Opinionhub) gives the claim credibility and connects product design to measurable user demand. Founders should include regional preference data when their product depends on cultural or market-specific behavior, and be explicit about how those preferences drive product-market fit.

Key Takeaway: Back your product decision with credible, market-specific data showing user preference — it strengthens both product rationale and go-to-market strategy.
The Solution: Separate buying and paying

The Solution: Separate buying and paying

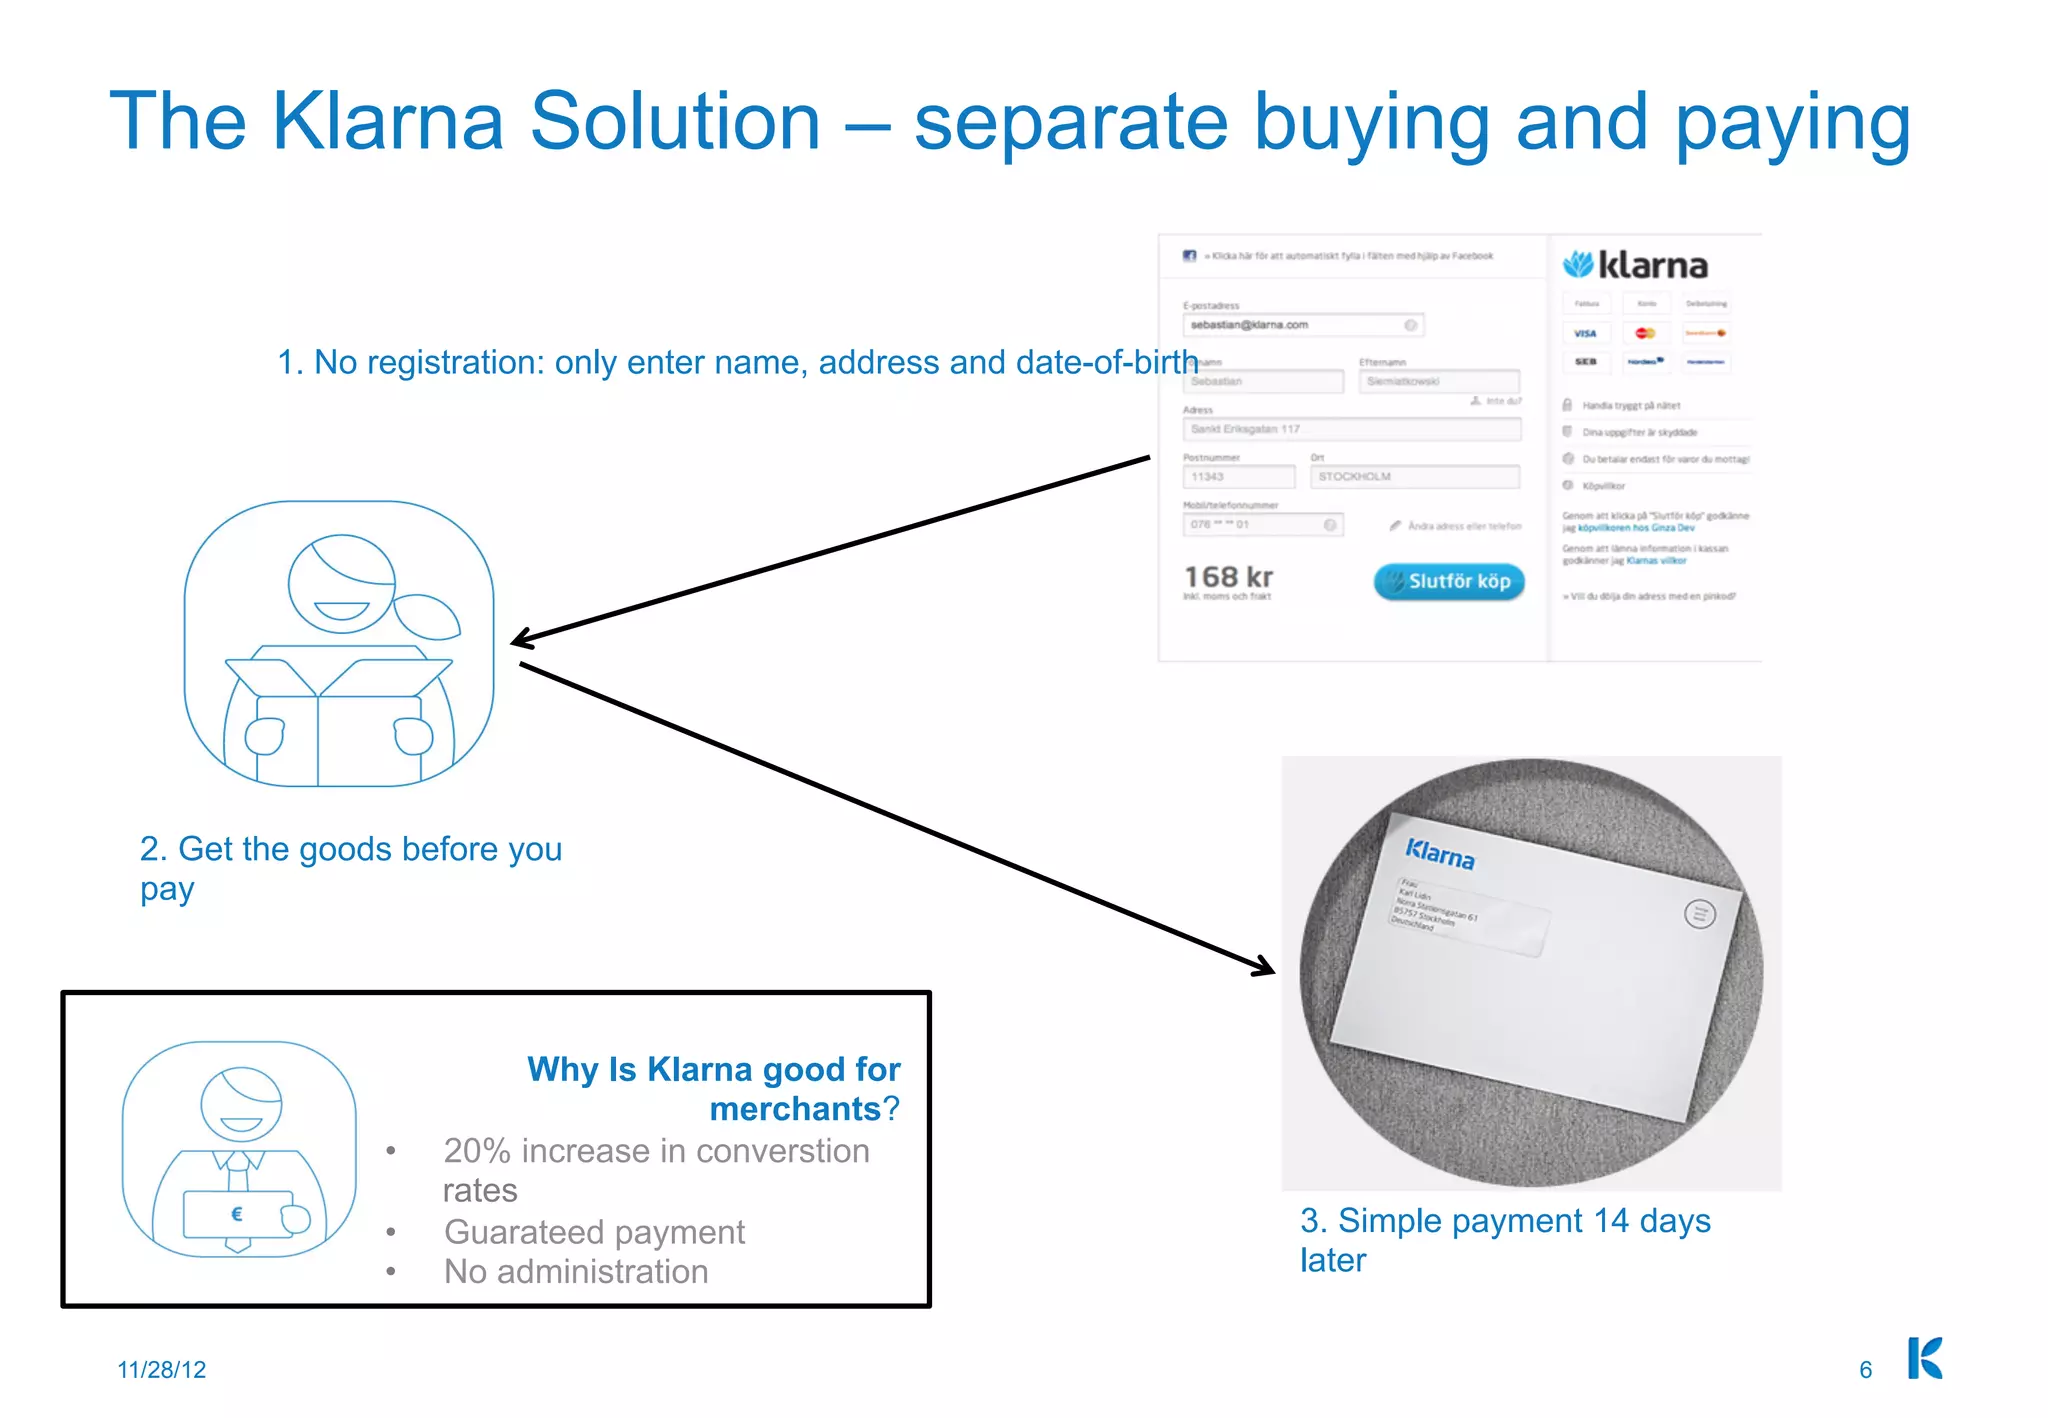
Slide 6 explains Klarna’s core product succinctly: no registration (just name/address/DOB), receive goods before paying, and a simple 14-day invoice. The slide couples a clear user flow with merchant benefits (conversion uplift, guaranteed payment, no administration), which is critical for payments businesses that must serve two customers simultaneously — consumers and merchants. The three-step visual arrows and the boxed merchant benefits help different stakeholders quickly grasp the value exchange.

This section is effective because it aligns UX simplicity for consumers with commercial incentives for merchants (reduced friction, immediate settlement). For founders, the takeaway is to frame solutions around both sides of the marketplace and quantify benefits wherever possible (e.g., conversion uplift), which materially improves the pitch to commercial partners and investors.

Key Takeaway: Explain product flows visually and link consumer simplicity to clear merchant economics and measurable KPIs.
Traction and growth: Timeline + financials

Traction and growth: Timeline + financials

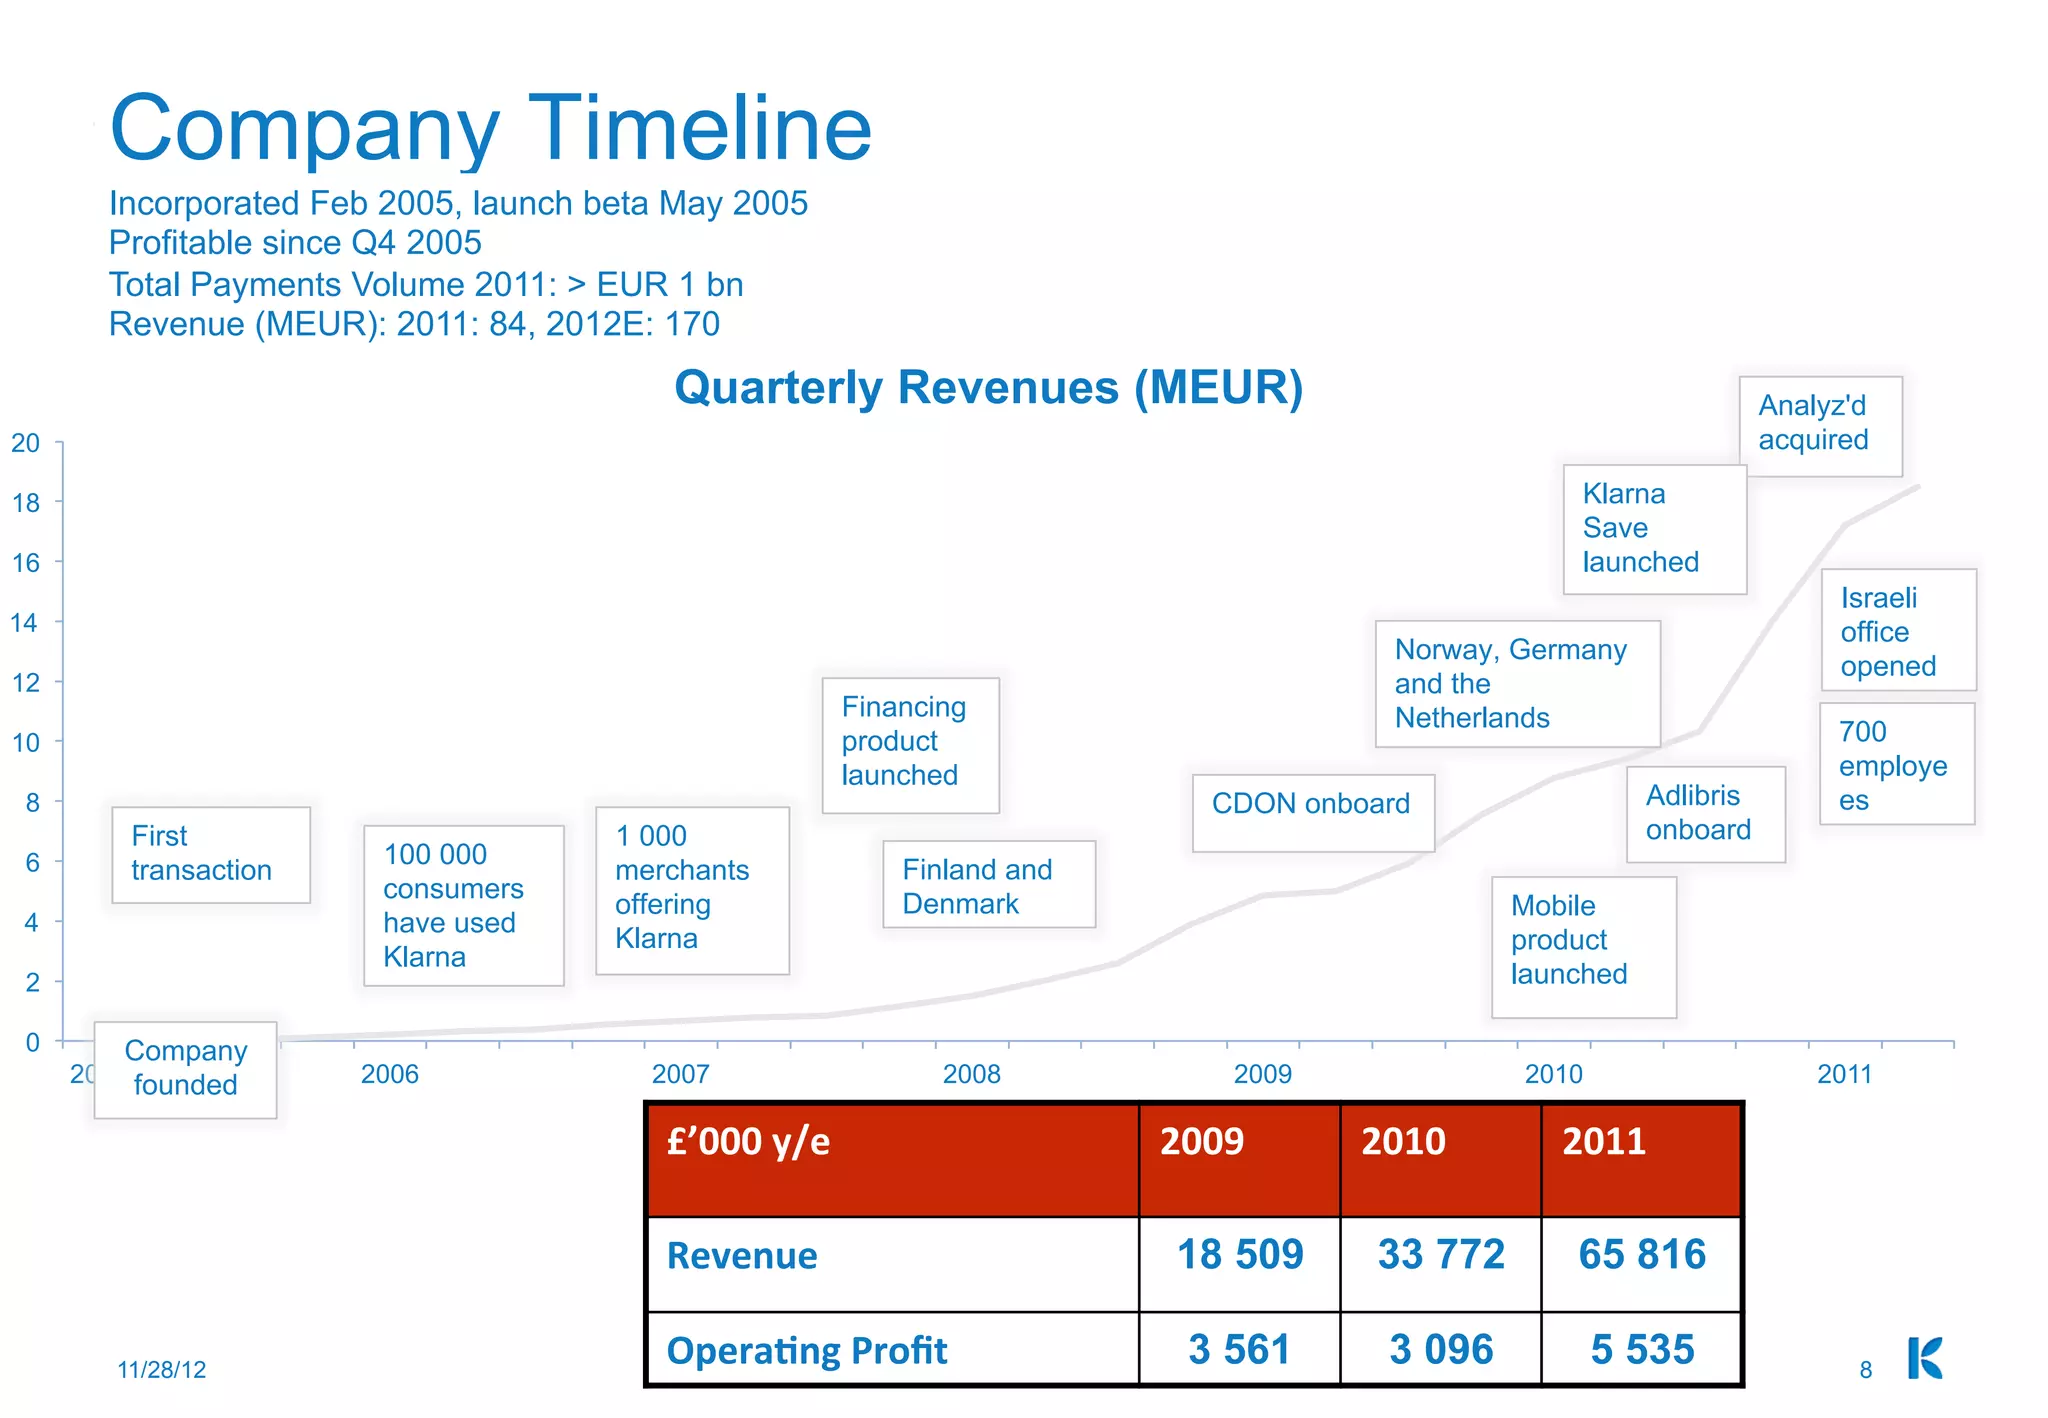
Slide 8 combines a company timeline of product launches and geographic expansion with a simple quarterly revenue chart and a three-year revenue/operating profit table. This juxtaposition of milestones and financials shows investors that product launches translated into measurable commercial growth (e.g., revenue rising from 2009 to 2011). The timeline also highlights strategic events like new market entries and product introductions that explain inflections in growth.

Presenting both narrative milestones and hard numbers is powerful; it demonstrates that strategy and execution produced results. Founders should emulate this by tying product/market expansion decisions to revenue changes and using timelines to explain growth drivers, not just list achievements.

Key Takeaway: Pair a clear milestone timeline with compact financial metrics to show how strategic moves drove revenue and scalability.
Vision / Close: Simple, shareable future vision

Vision / Close: Simple, shareable future vision

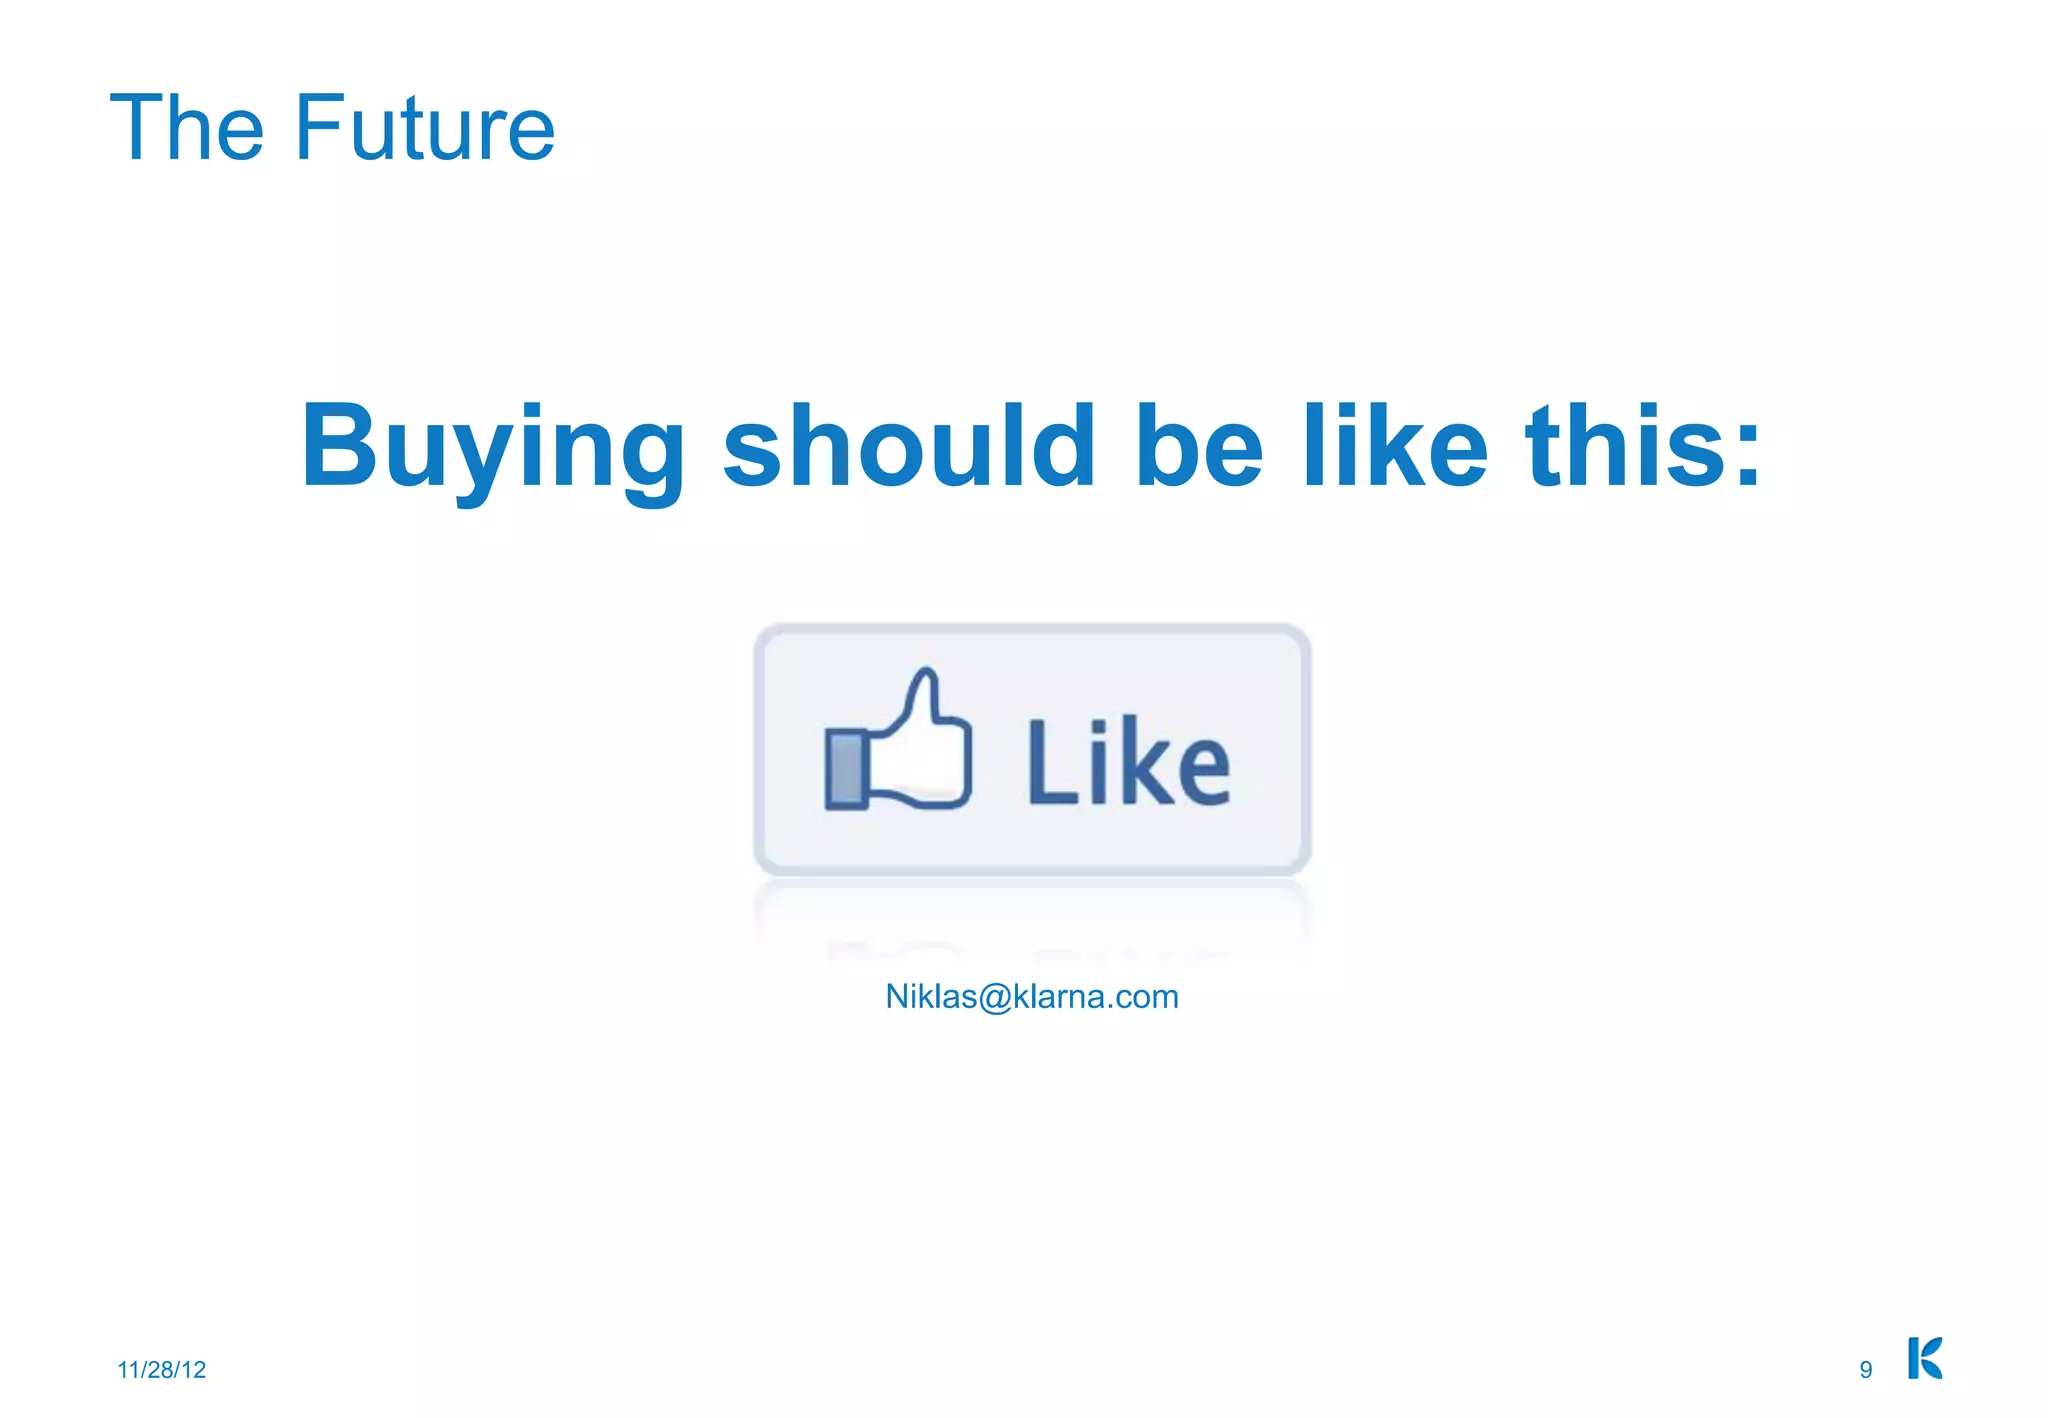
Slide 9 closes with a high-level vision — "Buying should be like this:" accompanied by a Facebook 'Like' button image and a contact email. It’s a memorable, emotionally resonant finish that reiterates simplicity and virality as goals. The slide is minimalist and leaves the investor with a crisp mental image of an ideal end-state: buying that’s as effortless and socially validated as clicking 'Like.'

The close is effective because it reframes the product as a cultural quality (likeability and simplicity), not just a payments utility. Founders should use their final slide to restate the mission in a compact, memorable way and provide a clear next step (contact) — it makes follow-up easier and leaves a lasting impression.

Key Takeaway: End with a short, emotional vision statement and a clear contact — memorable closes drive follow-up conversations.

Conclusion: Key Lessons

Klarna’s 2012 deck succeeds through clarity: a bold brand, a vivid problem demonstration, a simple product flow that ties to concrete merchant benefits, market preference data supporting product choice, and a timeline that links execution to revenue. The deck balances emotion (simplicity, trust) with evidence (metrics, third-party data) and addresses both sides of the marketplace — consumers and merchants — which is essential for fintech platforms.

Actionable advice for founders: open with a single, memorable value proposition; show the user pain visually; validate product choices with market data; present product flows that show how customer benefit converts to partner economics; and close with a succinct vision plus contact. Finally, pair milestones with compact financials to prove your strategy produced growth — investors buy traction that’s explained, not just asserted.

Full Deck Analysis

11 sections

Overview

Company: Klarna
Round: Growth (Multiple)
Year: 2012
Outcome: Valued at $6.7B (down from $45B)
Presentation Date: November 28, 2012
Presenter: Niklas Adalberth (Founder and Deputy CEO)

Executive Summary

Klarna’s 2012 growth pitch deck presents a compelling fintech solution to e-commerce checkout friction and merchant conversion challenges. The deck effectively establishes market demand (47% customer preference for invoice/BNPL in German market) and demonstrates strong early traction (€65.8M revenue in 2011, €170M projected for 2012, profitable since Q4 2005). However, the pitch is undermined by critical structural flaws: missing financial projections, weak team credentials, unexplained profitability stagnation, and—most notably—the final two slides appear to be accidentally included NOAH conference/advisor materials that obscure the actual funding ask, valuation, and use of funds. The deck tells a strong business story but fails to close the investment narrative.

Problem Statement

The deck articulates a two-sided problem across three slides:

Consumer Problem (Slide 3: “Shopping online – not the same experience”)

  • Friction point: Multi-step checkout process (4+ steps shown)
  • Specific pain: Excessive form fields, security verification friction (3D Secure/Santander), registration requirements
  • Visual proof: Screenshots showing actual checkout flows with coupon entry, shipping method selection, and password verification screens
  • Implication: High cart abandonment due to checkout complexity

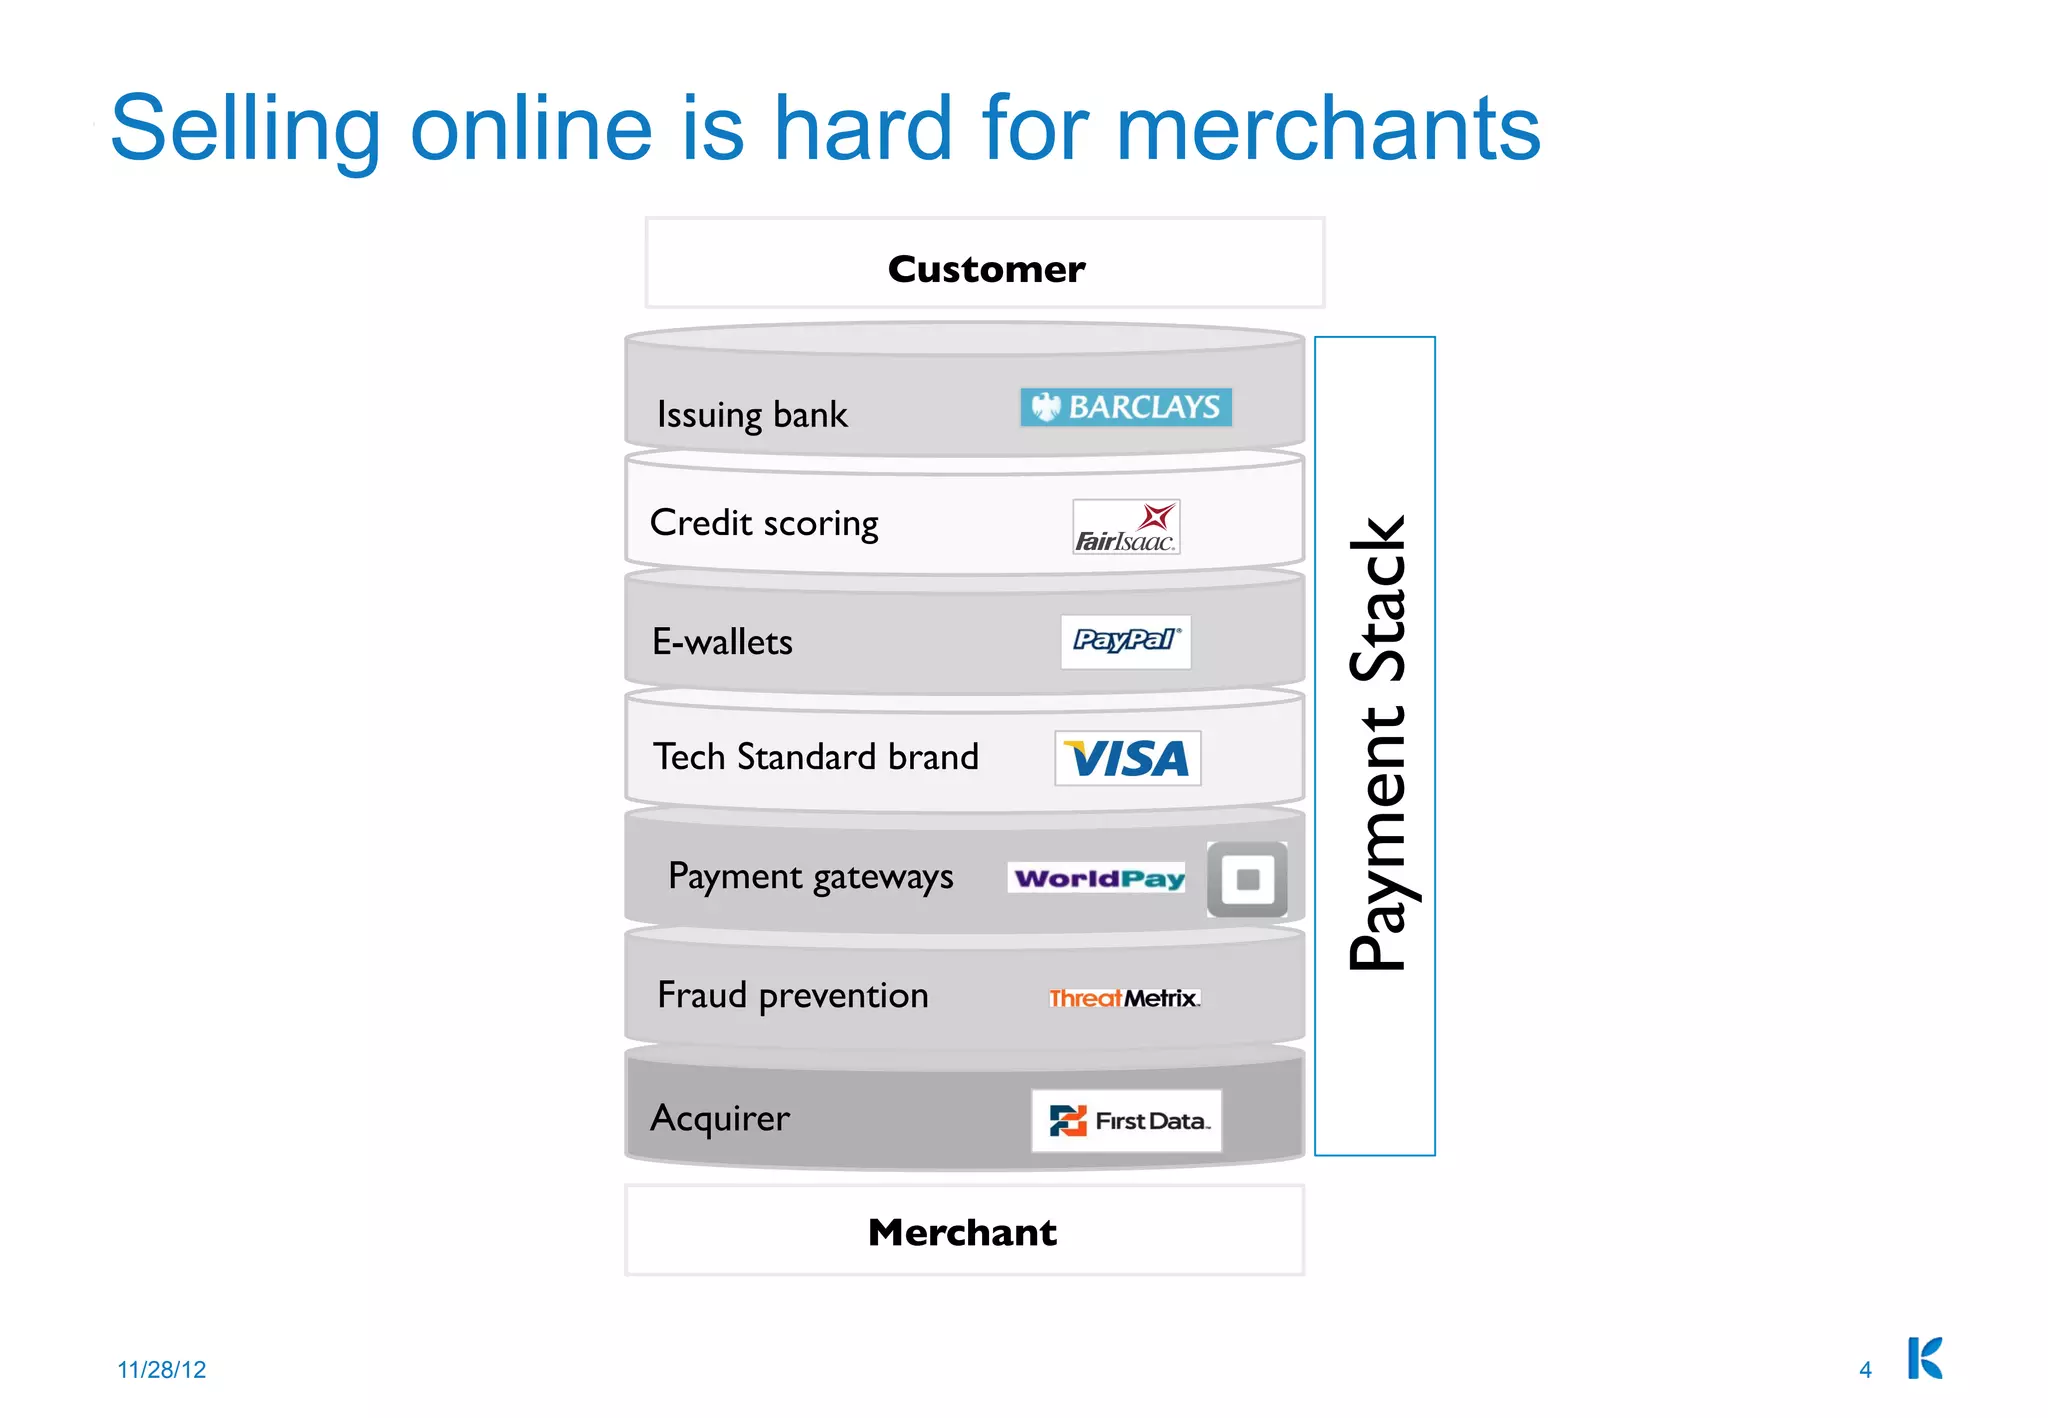
Merchant Problem (Slide 4: “Selling online is hard for merchants”)

  • Root cause: Fragmented payment stack requiring integration with 7+ vendors
  • Vendors shown: Barclays (issuing bank), Fairisaac (credit scoring), PayPal (e-wallets), VISA (tech standard), WorldPay (payment gateway), ThreatMetrix (fraud prevention), First Data (acquirer)
  • Implication: High integration costs, complexity, and operational burden for merchants

Market Validation (Slide 5: “How do customers want to pay online?”)

  • Key insight: 47% of German consumers prefer “invoice/after delivery” payment method
  • Comparison: PayPal (30%), Direct debit (9%), Credit card (8%), Other (6%)
  • Source: CINT / Opinionhub 2012
  • Implication: Massive unmet demand for BNPL/invoice-based payments

Solution

Core Value Proposition (Slide 6): “Separate buying and paying”

Klarna’s solution decouples the purchase decision from payment, addressing both consumer and merchant pain points:

For Consumers:

  1. Minimal friction: Only requires name, address, date-of-birth (no registration, no card details at checkout)
  2. Deferred payment: Receive goods immediately, pay 14 days later via simple invoice
  3. Psychological benefit: Reduces purchase anxiety by separating buying from payment commitment

For Merchants:

  1. 20% conversion rate lift — primary merchant benefit
  2. Guaranteed payment — Klarna absorbs credit/fraud risk
  3. No administration — Klarna handles payment collection and default management

Product Features:

  • Frictionless checkout (minimal data entry)
  • 14-day payment window
  • Physical invoice delivery
  • Multiple payment method support (VISA, Mastercard, SEK, etc.)

Market Opportunity

Addressable Market Indicators (Extracted from deck):

Geographic Scope (Slide 8):

  • Countries served: 7 (Sweden, Finland, Denmark, Norway, Germany, Netherlands, Israel)
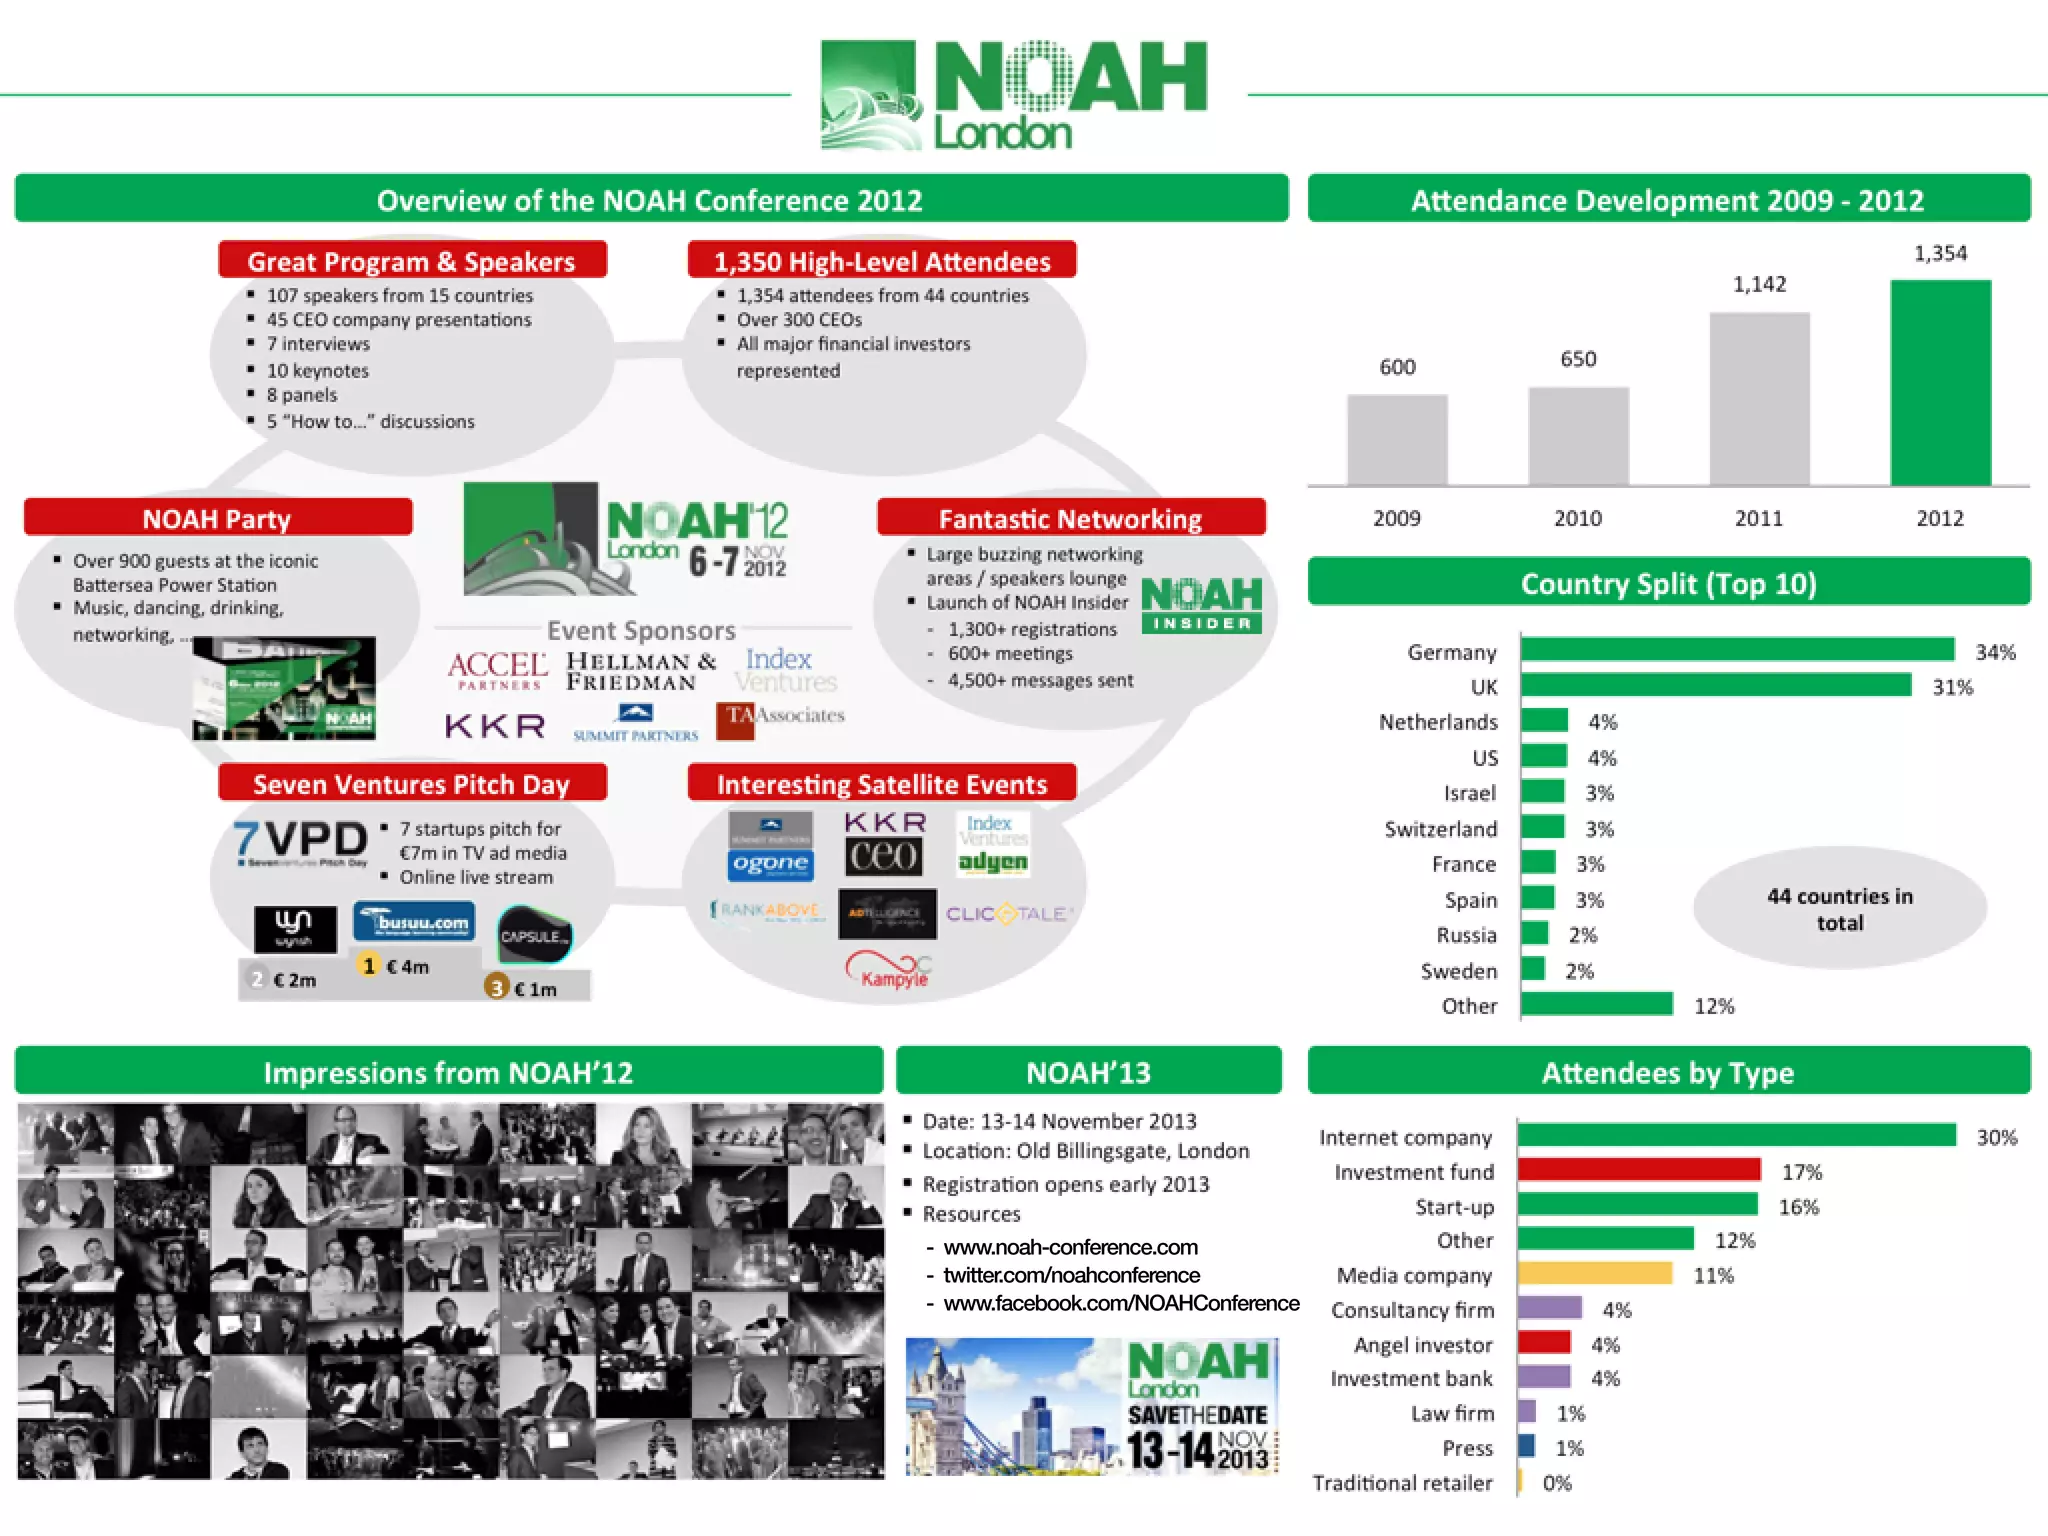
  • Geographic split of NOAH conference attendees (proxy for market focus):
    • Germany: 34%
    • UK: 31%
    • Netherlands: 4%
    • US: 4%
    • Israel: 3%
    • Other European: ~20%

Payment Volume Evidence (Slide 8):

  • 2011 Total Payments Volume: > €1 billion
  • Implies: Significant merchant adoption and transaction scale

Customer Demand (Slide 5):

  • German market preference for invoice/BNPL: 47% (largest single payment method)
  • Implies: TAM includes 47% of German e-commerce market + similar penetration in other European markets

Merchant Base (Slide 8):

  • 2007: 1,000 merchants offering Klarna
  • 2011: Significant growth (not quantified, but implied by €1B payment volume)
  • Key partners: CDON, Adlibris (major Nordic/European retailers)

TAM/SAM/SOM Not Explicitly Stated:

  • Deck does not provide total addressable market (TAM) calculation
  • Does not quantify serviceable addressable market (SAM)
  • Does not project serviceable obtainable market (SOM)
  • Gap: Growth-stage pitch should include market sizing analysis

Business Model

Revenue Model:

Not explicitly stated in deck, but implied from context:

  • Transaction-based fees: Likely percentage of transaction value (standard for payment processors)
  • Merchant acquisition: Merchants pay for conversion uplift and guaranteed payment
  • Consumer: Free to use (no direct consumer fees mentioned)

Unit Economics:

Not disclosed in deck — critical gap for growth-stage pitch

Profitability:

  • Profitable since: Q4 2005 (7 months after launch)
  • 2011 Operating Profit: €5.535M on €65.816M revenue = 8.4% operating margin
  • 2010 Operating Profit: €3.096M on €33.772M revenue = 9.2% operating margin
  • Trend: Operating margin declining despite revenue growth (8.4% vs 9.2%)
  • Implication: Margin compression as company scales — suggests increasing CAC, fraud losses, or operational costs

Profitability Concern:

  • Revenue grew 95% (2010→2011): €33.8M → €65.8M
  • Operating profit grew only 79% (2010→2011): €3.1M → €5.5M
  • Gap: Profit growth lagging revenue growth indicates deteriorating unit economics

Traction & Metrics

Growth Trajectory (Slide 8):

Metric 2009 2010 2011 2012E Growth
Revenue (€M) 18.5 33.8 65.8 170 2.6x (2011→2012E)
Operating Profit (€M) 3.6 3.1 5.5 — Stagnant 2009-2010
Operating Margin 19.4% 9.2% 8.4% — Declining

Scale Metrics (Slide 8):

Milestone Year Details
First transaction 2005 Launch milestone
100,000 consumers 2006 User adoption
1,000 merchants 2007 Merchant adoption
Financing product launch 2008 Product expansion
Geographic expansion 2008-2010 Finland, Denmark, Norway, Germany, Netherlands
Mobile product 2010 Channel expansion
Payment volume 2011 > €1 billion
Employees 2011 700
Acquisitions 2011 Analyzd acquired

Customer Validation:

  • Key merchant partners: CDON, Adlibris (major Nordic/European retailers)
  • Merchant benefit: 20% conversion rate lift (Slide 6)
  • Market demand: 47% of German consumers prefer invoice/BNPL (Slide 5)

Geographic Expansion:

  • 2005: Sweden (launch)
  • 2008: Finland, Denmark
  • 2009: Norway, Germany, Netherlands
  • 2011: Israel office opened
  • Reach: 7 countries by 2011

Competitive Positioning

Critical Gap: Deck does not include competitive analysis or differentiation strategy.

Implied Competitive Advantages (inferred from solution):

  1. Frictionless checkout — minimal data entry vs. traditional payment methods
  2. Merchant conversion lift — 20% uplift (specific metric not attributed to competitors)
  3. Guaranteed payment — Klarna absorbs credit risk (vs. merchants managing risk)
  4. Early mover in BNPL — 2005 founding predates most modern BNPL players
  5. Profitability — profitable since Q4 2005 (vs. many fintech startups burning cash)

Missing Competitive Context:

  • No mention of competitors (PayPal, traditional payment processors, other BNPL providers)
  • No market share data
  • No differentiation vs. existing payment methods
  • No barriers to entry analysis
  • Weakness: Growth-stage pitch should address competitive landscape

Team

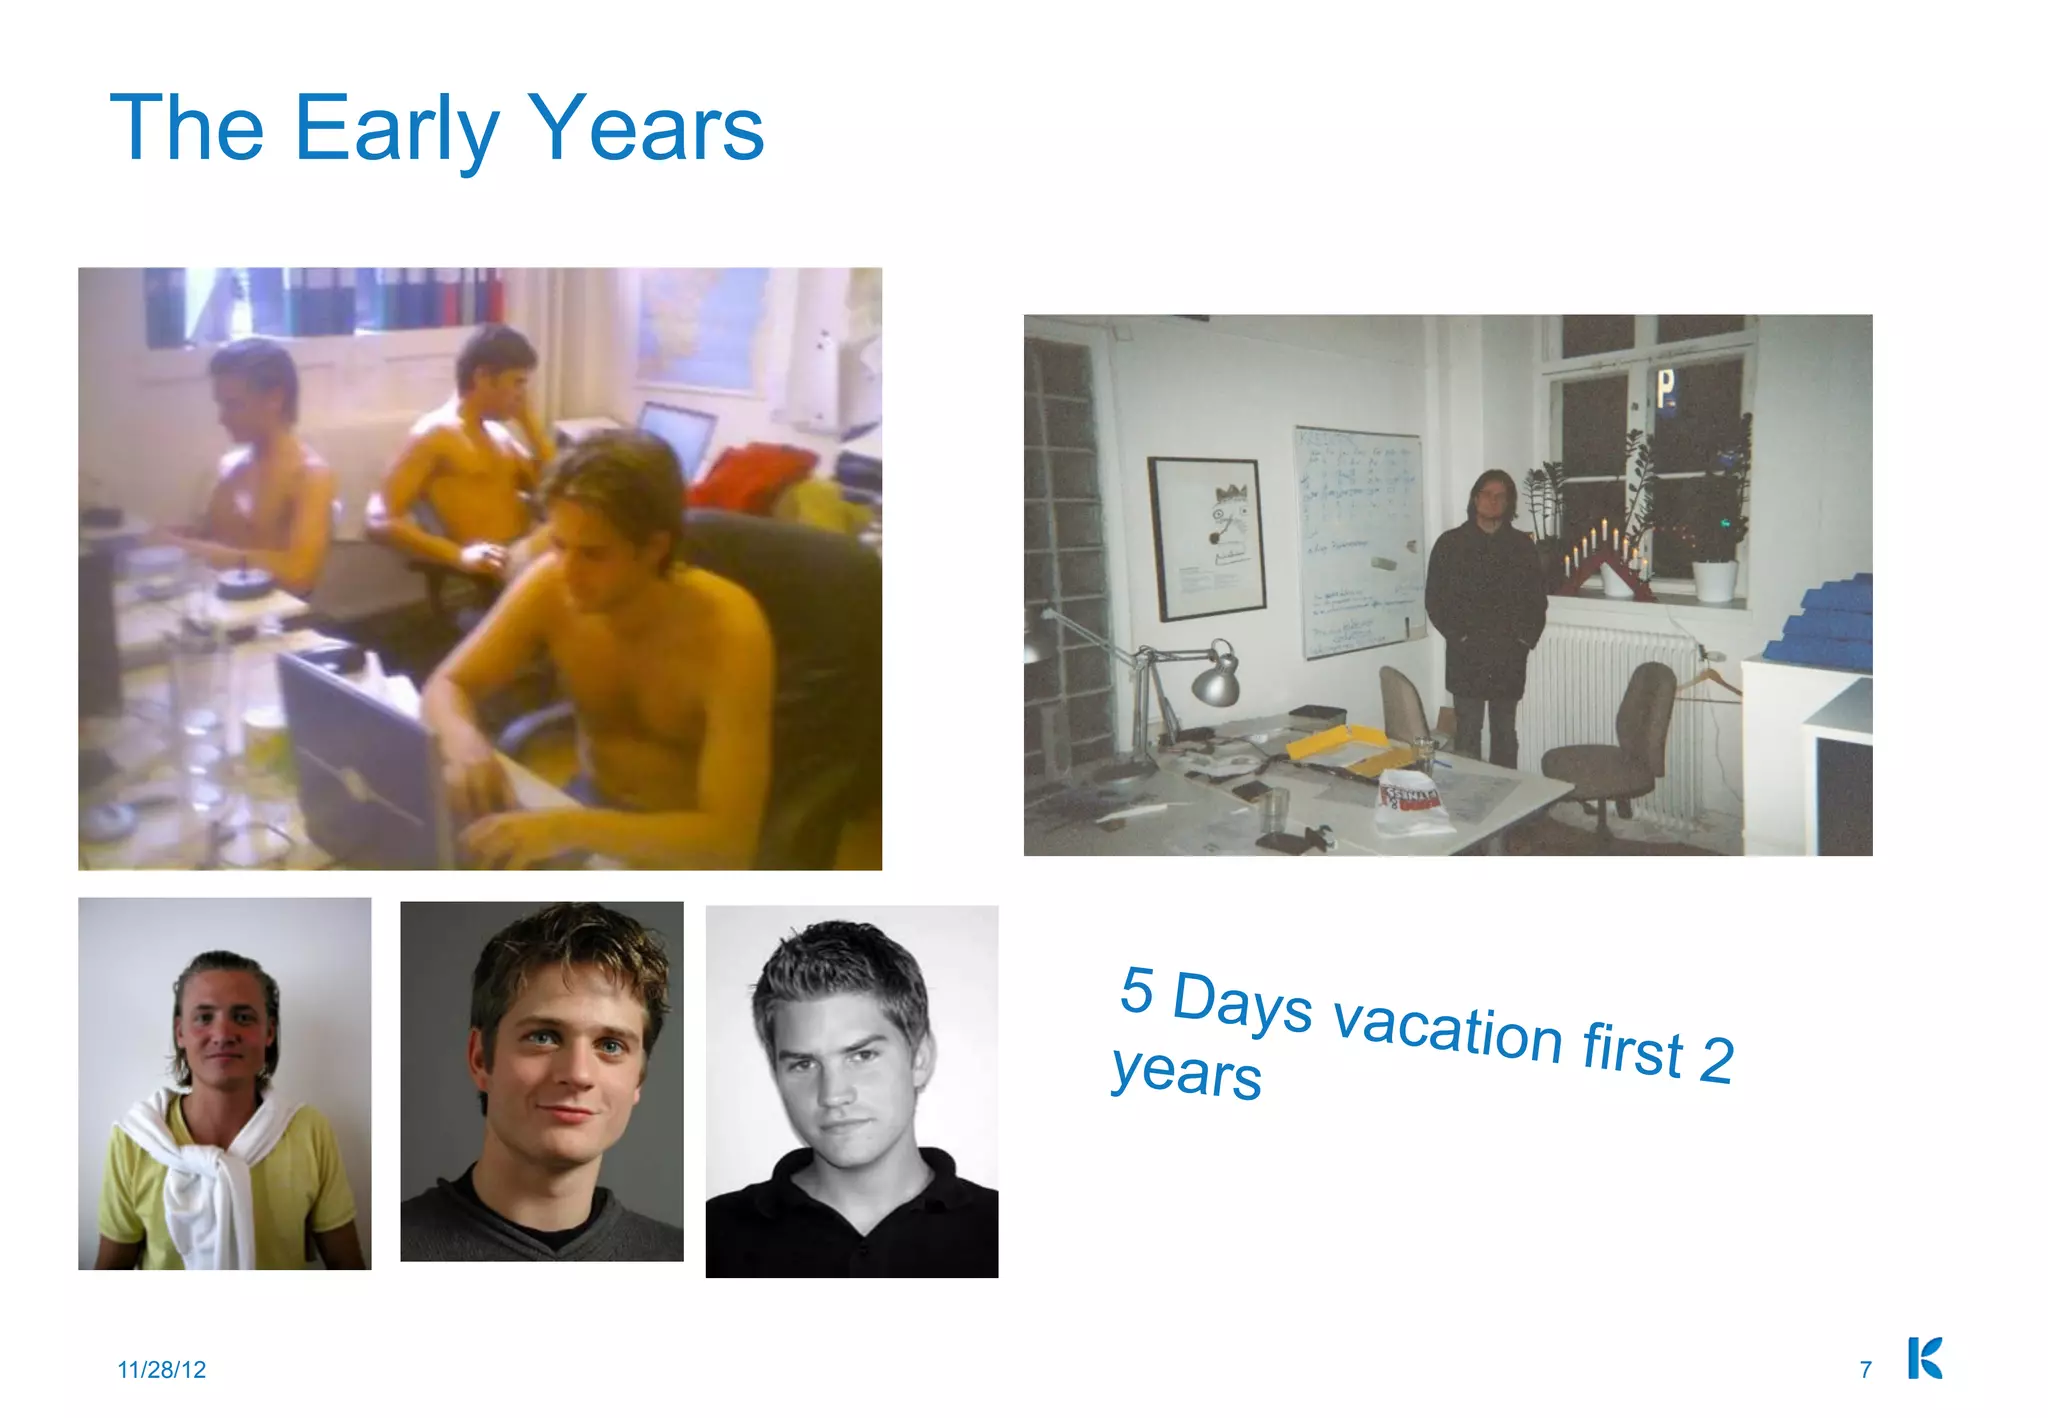
Identified Leadership (Slide 7: “The Early Years”):

Niklas Adalberth

  • Title: Founder and Deputy CEO
  • Presenter: Leads this pitch
  • Background: Not detailed in deck
  • Credentials: Not provided

Team Culture (Slide 7):

  • Early commitment: “5 days vacation first 2 years” — signals founder sacrifice and hustle
  • Team size (2011): 700 employees (Slide 8)
  • Team composition: Not detailed (no breakdown of engineering, sales, operations, etc.)
  • Office culture: Casual startup environment (yellow shirts, collaborative workspace shown in photos)

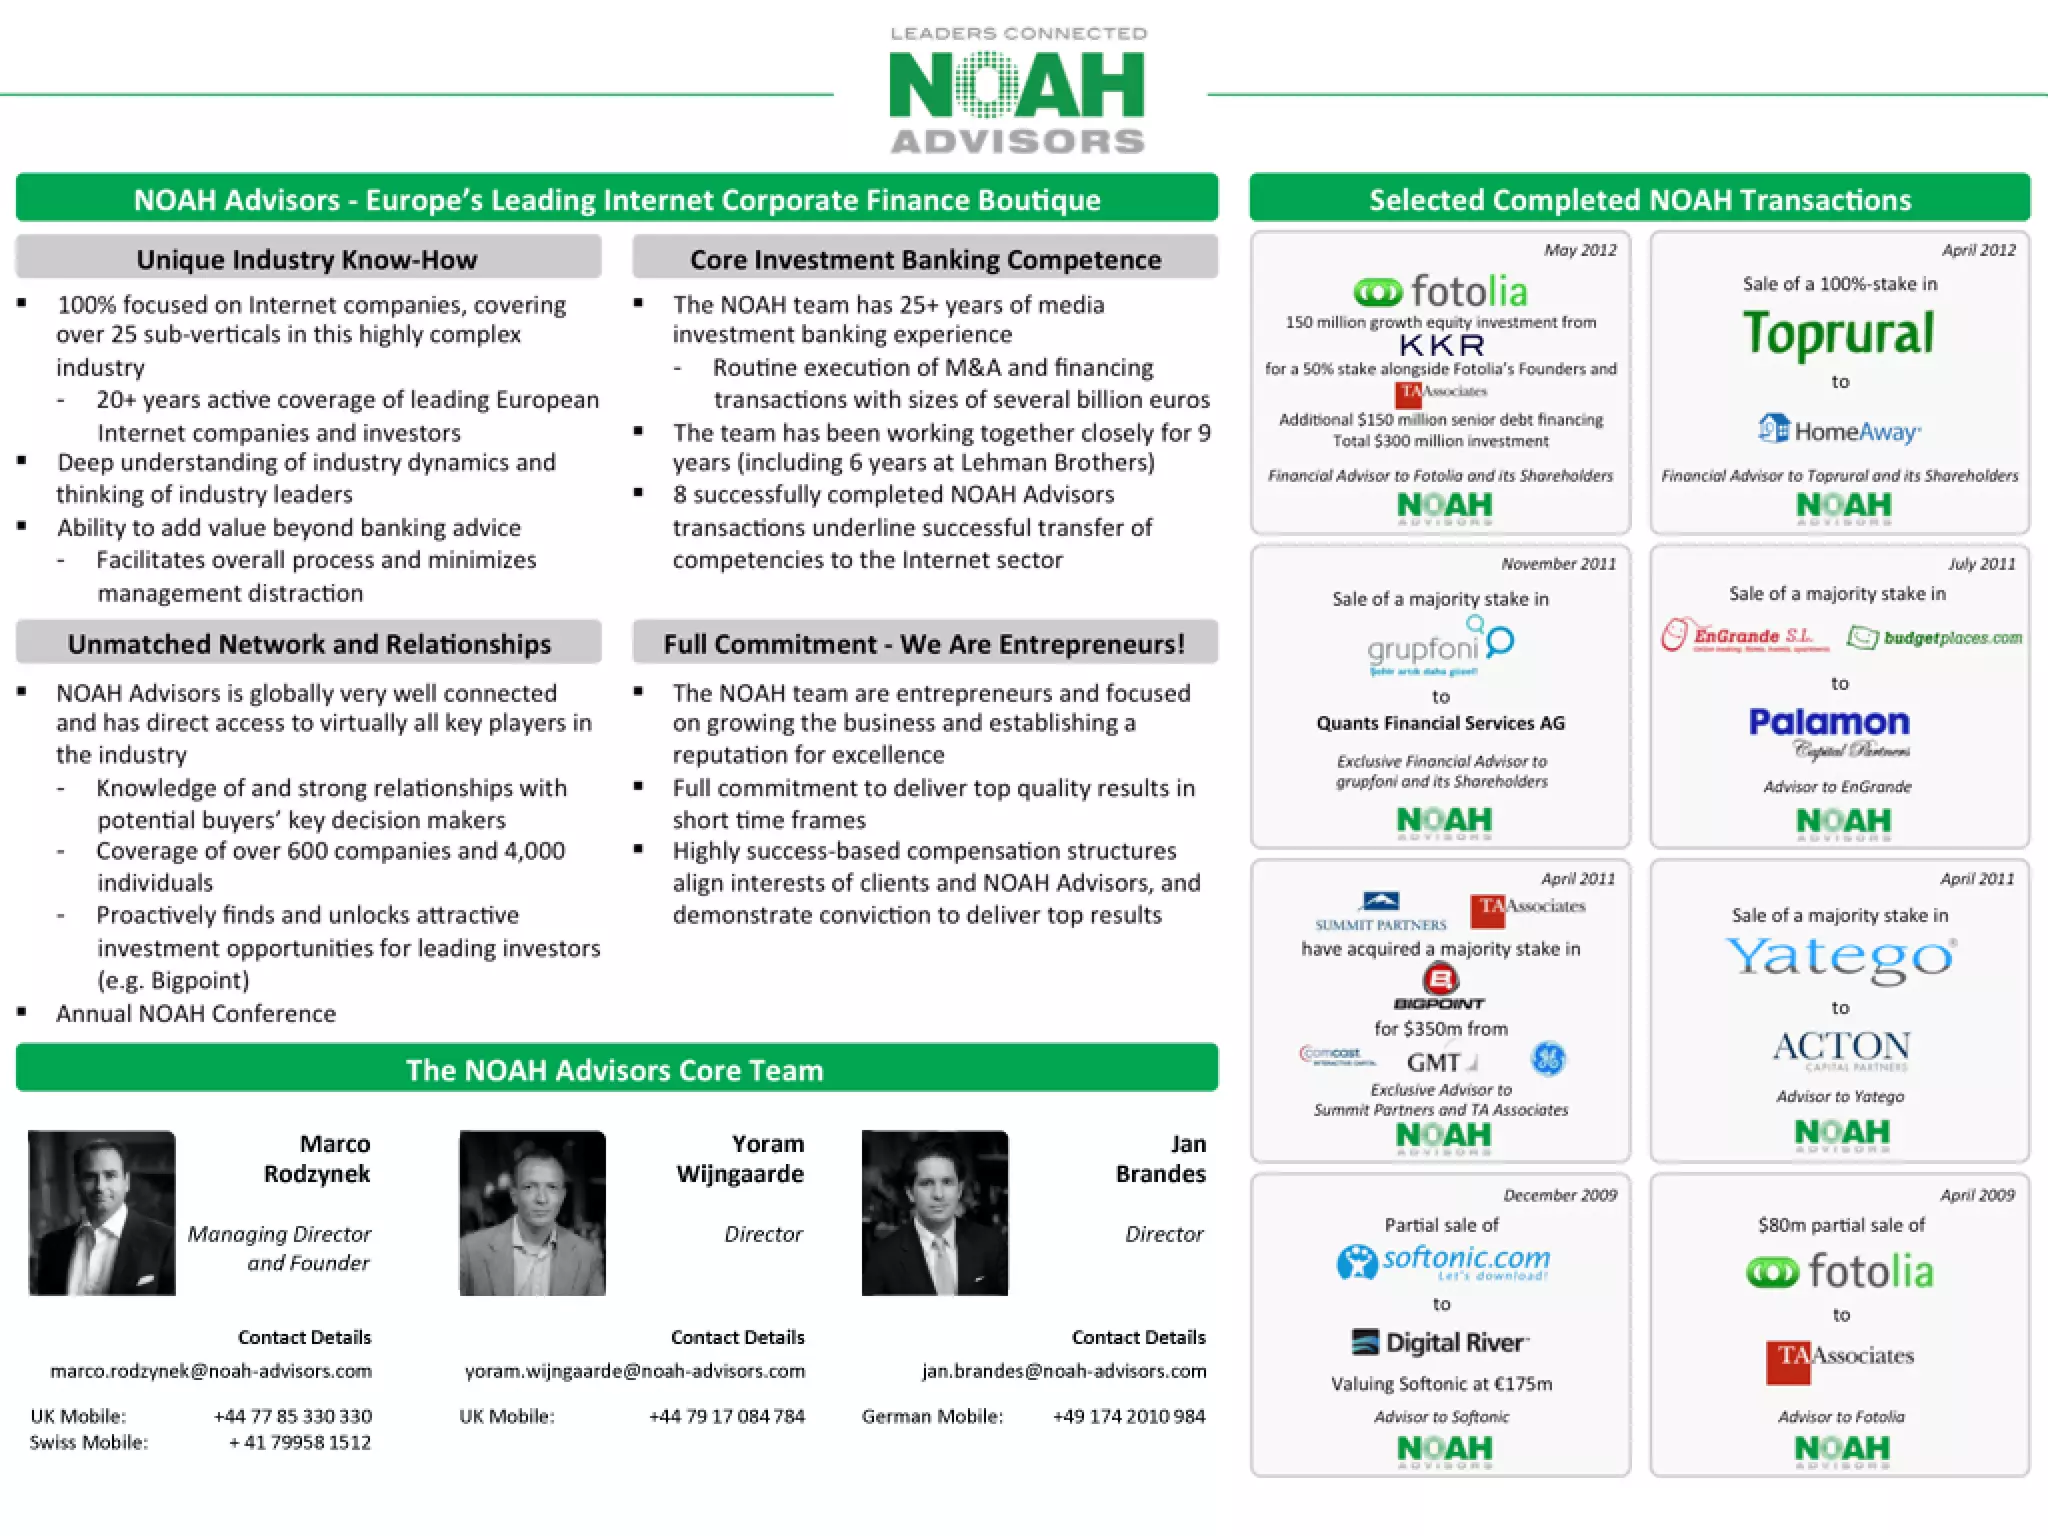
Advisors (Slide 11: NOAH Advisors):

  • Marco Rodzynek — Managing Director and Founder (NOAH Advisors)
  • Yoram Wijngaarde — Director (NOAH Advisors)
  • Jan Brandes — Director (NOAH Advisors)
  • Note: These are external advisors, not Klarna team members

Critical Gaps:

  • No founder backgrounds — no prior exits, experience, or credentials
  • No key hires — no mention of VP Product, VP Sales, VP Operations, CFO, etc.
  • No board members — no investor/advisor board composition
  • No organizational structure — unclear who leads what function
  • Weakness: Growth-stage pitch should establish experienced leadership team

Go-to-Market Strategy

Not explicitly detailed in deck — significant gap for growth-stage pitch.

Implied GTM (inferred from traction):

Merchant Acquisition:

  • Direct sales: Key merchant partnerships (CDON, Adlibris) suggest direct sales approach
  • Value prop: 20% conversion lift + guaranteed payment
  • Geographic expansion: Systematic country-by-country rollout (Sweden → Nordics → Germany → Netherlands → Israel)

Consumer Adoption:

  • Merchant-driven: Consumers discover Klarna through merchant checkout
  • Word-of-mouth: Network effects as more merchants offer Klarna
  • Product-led: Frictionless checkout drives adoption

Product Expansion:

  • Financing product (2008): Extends BNPL to larger purchases
  • Mobile product (2010): Captures mobile commerce growth
  • Klarna Save (2011): Savings/financial services expansion

Missing GTM Details:

  • No marketing budget allocation
  • No customer acquisition cost (CAC) data
  • No customer lifetime value (LTV) analysis
  • No sales team size or structure
  • No geographic expansion roadmap
  • Weakness: Should include specific GTM metrics and strategy

The Ask

CRITICAL FLAW: The deck does not clearly state the funding ask.

What’s Missing:

  • Funding amount: Not specified (e.g., “Raising $50M Series B”)
  • Valuation: No pre-money or post-money valuation
  • Terms: No equity percentage, liquidation preferences, or other terms
  • Use of funds: No breakdown of capital allocation
  • Timeline: No deployment timeline or milestones
  • Next steps: No investor contact process or timeline

Why This Matters:

  • Slides 10-11 are off-topic — appear to be NOAH conference materials and advisor bio
  • Slide 9 (“The Future”) — vague vision statement (“Buying should be like this: Like button”) without concrete ask
  • Deck ends without investment call-to-action — only founder email ([email protected])

Possible Interpretations:

  1. M&A advisory: Slide 11 (NOAH Advisors) suggests Klarna may be seeking M&A advisory, not growth capital
  2. Conference pitch: Deck may be designed for NOAH conference presentation (not investor pitch)
  3. Incomplete deck: Critical slides may be missing or accidentally omitted
  4. Accidental materials: Slides 10-11 appear to be accidentally included from other sources

Investor Deep Dive

Executive summary, strengths & red flags

Executive Summary

Klarna's 2012 growth pitch deck presents a compelling fintech solution to e-commerce checkout friction and merchant conversion challenges. The deck effectively establishes market demand (47% customer preference for invoice/BNPL in German market) and demonstrates strong early traction (€65.8M revenue in 2011, €170M projected for 2012, profitable since Q4 2005). However, the pitch is undermined by critical structural flaws: missing financial projections, weak team credentials, unexplained profitability stagnation, and—most notably—the final two slides appear to be accidentally included NOAH conference/advisor materials that obscure the actual funding ask, valuation, and use of funds. The deck tells a strong business story but fails to close the investment narrative.

Key Strengths

5 identified

1

Strong Problem-Solution Narrative (Slides 2-6)

- Deck effectively establishes market pain through concrete examples (checkout screenshots, payment stack complexity)

2

Market Validation with Specific Data (Slide 5)

- 47% customer preference for invoice/BNPL is compelling and specific

3

Impressive Growth Trajectory with Early Profitability (Slide 8)

- €65.8M revenue in 2011, €170M projected for 2012 (2.6x growth), profitable since Q4 2005

4

Dual-Sided Value Proposition

- Addresses both consumer (frictionless checkout) and merchant (20% conversion lift + guaranteed payment) benefits

5

Geographic Diversification (Slide 8)

- Presence in 7 countries reduces single-market risk

Red Flags & Weaknesses

8 identified

1

Profitability Margin Compression (Slide 8)

- Operating margin declining despite revenue growth

2

Weak Team Credentials (Slide 7)

- No founder backgrounds, no key hire details, no board composition

3

Missing Financial Projections

- No 3-5 year revenue/profit forecast

4

No Competitive Analysis

- Deck does not mention competitors or differentiation strategy

5

Unexplained Use of NOAH Advisors (Slides 10-11)

- Final two slides appear to be accidentally included conference/advisor materials

6

Missing Critical Investment Information

- No funding amount, valuation, use of funds, or timeline

7

No Risk Mitigation Strategy

- Deck does not address credit risk, fraud prevention, or regulatory challenges

8

Vague Vision Statement (Slide 9)

- "Buying should be like this: Like button" is abstract and lacks concrete roadmap

More Pitch Decks To Study

Compare structure, fundraising context, and investor-facing story across similar startup decks.